monthly weather review northern territory august 2012 · themonthly weather review - northern...
TRANSCRIPT

Monthly Weather Review
Northern Territory
August 2012

The Monthly Weather Review - Northern Territory is produced twelve times each year by the Australian Bureau of Meteorology'sNorthern Territory Climate Services Centre.
It is intended to provide a concise but informative overview of the temperatures, rainfall and significant weather events in NorthernTerritory for the month.
To keep the Monthly Weather Review as timely as possible, much of the information is based on electronic reports. Although everyeffort is made to ensure the accuracy of these reports, the results can be considered only preliminary until complete quality controlprocedures have been carried out. Major discrepancies will be noted in later issues.
We are keen to ensure that the Monthly Weather Review is appropriate to the needs of its readers. If you have any comments orsuggestions, please do not hesitate to contact us:
By mail
Northern Territory Climate Services CentreBureau of MeteorologyPO Box 40050Casuarina NT 0811AUSTRALIA
By telephone
(08) 8920 3813
By email
You may also wish to visit the Bureau's home page, http://www.bom.gov.au.
Units of measurementExcept where noted, temperature is given in degrees Celsius (°C), rainfall in millimetres (mm), and wind speed in kilometres per hour(km/h).
Observation times and periodsEach station in Northern Territory makes its main observation for the day at 9 am local time. At this time, the precipitation over thepast 24 hours is determined, and maximum and minimum thermometers are also read and reset. In this publication, the followingconventions are used for assigning dates to the observations made:
Maximum temperatures are for the 24 hours from 9 am on the date mentioned. They normally occur in the afternoon of that day.
Minimum temperatures are for the 24 hours to 9 am on the date mentioned. They normally occur in the early morning of that day.
Mean temperatures are the average of the daily maximum and daily minimum temperatures.
Daily rainfall is for the 24 hours to 9 am on the date mentioned. This means a significant fraction of the rain may have occurred onthe previous calendar day.
Monthly rainfall is for the period from 9 am on the last day of the previous month to 9 am on the last day of this month.
Maximum daily wind gusts are in the 24 hours from midnight to midnight.
Climatological valuesThe climatological averages shown in the text and tables are generally long-term means based on observations from all availableyears of record, which vary widely from site to site. They are not shown for sites with less than 10 years of record, as they cannotthen be calculated reliably. Climatological extremes are generally taken from available observations from all available years of record.The number of years can vary substantially from site to site.
Copyright© Commonwealth of Australia 2012This work is copyright. You may download, display, print and reproduce this material in unaltered form only (retaining this notice) foryour personal, non-commercial use or use within your organisation. Apart from any use as permitted under the Copyright Act 1968,all other rights are reserved. Requests and inquiries concerning reproduction and rights should be addressed to CommonwealthCopyright Administration, Attorney General’s Department, Robert Garran Offices, National Circuit, Barton ACT 2600 or posted athttp://www.ag.gov.au/cca.
Product code IDCKGC22R1. Prepared on 25 September 2012. ISSN 1836-392X
Cover photographCirrus cloud formations over Tempe Downs.Photograph by Gavin Heathertington-Tait, 3 August 2007. Used with permission.If you have a photo you think would make a good cover for the Monthly Weather Review, please contact us at the address above.
Monthly Weather Review Northern Territory August 2012

OverviewDuring the month of August, the strong sub-tropicalridge was the dominant climate influence. Cool anddry southeast wind flow prevailed across theNorthern Territory with no significant rainfallrecorded, except in the eastern parts of the Top End.Hot and dry spells continued throughout August overthe Northern Territory, especially in the Alice SpringsDistrict. Alice Springs Airport have reported no rainsince 24 April 2012. With the strong sub-tropicalridge expected to be dominant well into Septembermonth, a new record of more than 147 days (record7 March to 31 July, 1972) in a row without rain isexpected.
August also saw several significant bushfires burnedover the northwest Top End. These were fueled bygusty winds that were pushed north by the strongsub-tropical ridge.
Extremes in August 2012
Hottest day(Highest daily maximum temperature)
38.1 °C at Middle Point on the 26thWarmest days on average
(Highest mean daily maximum temperature)34.5 °C at Middle Point
Coolest days on average(Lowest mean daily maximum temperature)
23.1 °C at KulgeraColdest day
(Lowest daily maximum temperature)16.9 °C at Arltunga on the 11th
Coldest night(Lowest daily minimum temperature)
−4.7 °C at Arltunga on the 2ndCoolest nights on average
(Lowest mean daily minimum temperature)3.5 °C at Arltunga
Warmest nights on average(Highest mean daily minimum temperature)
22.7 °C at Cape WesselWarmest night
(Highest daily minimum temperature)24.4 °C at McCluer Island on the 27th
Warmest on average overall(Highest mean temperature)
26.2 °C at Cape DonCoolest on average overall(Lowest mean temperature)
13.6 °C at ArltungaWettest overall
(Highest total rainfall)5.0 mm at North East Island
Wettest day(Highest daily rainfall)
0.8 mm at Gove Airport on the 10thHighest wind gust
83 km/h at Darwin NTC on the 17th
Significant weatherFires in the NTSignificant fire activity occurred around theDarwin-Daly District during the first two weeks andin the last week of August 2012. Aerial firesuppression by helicopter and fixed wing aircraft aswell as significant on-ground resources wererequired to protect homes, infrastructure, crops andlivestock.
On the 5th, a fire near Bynoe Harbour south ofDarwin burnt 4 sq km and destroyed a truck, cars,fencing and construction equipment, while mangoorchards and homes were saved. On the 11th and12th, a fire burnt 470 sq km of native flora and faunaon Jindare Station, near Pine Creek. Also on the 12th,1 sq km of horticultural crop was destroyed by awildfire in the Douglas-Daly region.
Over several days near the end of August, 240 sq kmof pasture was burnt on Opium Creek Station, 120km east of Darwin, while a tourist park and stationbuildings were saved.
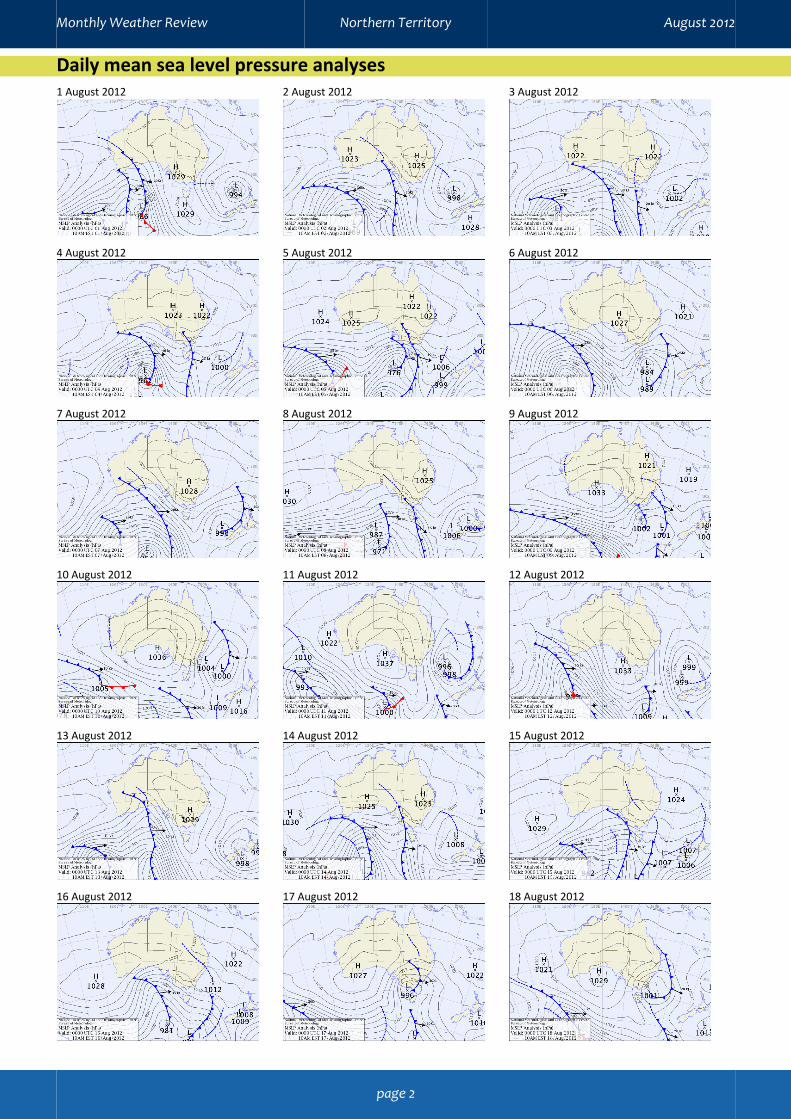
Synoptic summaryThe month of August started with a weaksub-tropical ridge which extended across theAustralian Continent. A weak trough developed overthe western boarder on the 2nd and propagatedeastwards across southern NT bringing a shift in thewinds but not producing precipitation. Light showerswere confined to the eastern parts of the Top End asthe pressure gradient eased. In the following twoweeks, persistent high pressure systems wereexperienced over central Australia. A series ofshallow, non precipitating troughs crossed the AliceSprings District on the 20th and the 21st during thetwo weeks but were pushed to the southeast by thestrong sub-tropical ridge. Cool and dry south-easterlywind flow were experienced over the Top End assouthern air was pushed northward into the tropicalregions along the eastern flank of persistent highpressure systems over southern WA and SA.
The sub-tropical ridge spanned over the entirecontinent until the 28th, ahead of another weakshallow trough which developed over the westernboarder and moved eastwards without anysignificant precipitation. Thus, Alice Springs Districtdid not measure any rainfall for the month and alsothere were no rainfall since 24th April.
Monthly Weather Review Northern Territory August 2012
page 1
Daily mean sea level pressure analyses1 August 2012 2 August 2012 3 August 2012
4 August 2012 5 August 2012 6 August 2012
7 August 2012 8 August 2012 9 August 2012
10 August 2012 11 August 2012 12 August 2012
13 August 2012 14 August 2012 15 August 2012
16 August 2012 17 August 2012 18 August 2012
Monthly Weather Review Northern Territory August 2012
page 2

19 August 2012 20 August 2012 21 August 2012
22 August 2012 23 August 2012 24 August 2012
25 August 2012 26 August 2012 27 August 2012
28 August 2012 29 August 2012 30 August 2012
31 August 2012
Monthly Weather Review Northern Territory August 2012
page 3
TemperaturesThe mean temperature for Northern Territory in August 2012 was 19.89 °C, which is 0.31 °C below the long-termaverage. This was the lowest temperature anomaly on record since August 2010.
The warmest on average was Cape Don with 26.2 °C, followed by Cape Wessel with 26.0 °C, and then JabiruAirport with 25.6 °C.
The coolest on average was Arltunga with 13.6 °C, followed by Alice Springs Airport with 14.6 °C, and then YularaAero with 14.9 °C.
New temperature records
Record highest August daily maximum temperature
New record Old recordYears
ofrecord
Pirlangimpi 35.6 on 28th = 35.6 on 26th in 1998 30
Record lowest August daily minimum temperature
New record Old recordYears
ofrecord
Darwin Airport 13.1 on 13th 13.2 on 2nd in 1990 72Yuendumu −1.4 on 6th −1.2 on 4th in 2003 44
Record lowest August mean minimum temperature
New record Old recordYears
ofrecord
Darwin Airport 17.8 = 17.8 in 2002 72Daly Waters AWS 8.6 9.4 in 2011 43Mango Farm 11.5 12.4 in 2002 33Elliott 10.0 10.4 in 2002 31
Record lowest August mean temperature
New record Old recordYears
ofrecord
Mango Farm 22.3 22.5 in 2002 33Elliott 20.3 = 20.3 in 2001 31
Monthly Weather Review Northern Territory August 2012
page 4

Maximum temperaturesThe lack of cloud cover and precipitation over theNorthern Territory, due to the strong sub-tropicalridge, resulted in the daily mean maximumtemperature for the Northern Territory was 30.24°C,which is 1.18 °C above the long-term August averageof 29.06 °C. Overall, the mean daily maximumtemperature was average to above average over theTerritory with the highest maximum temperatureanomalies along the southern border of theTerritory. There were some coastal areas thatexperienced slightly cooler than average maximumtemperatures for the month. These were probablydue to cool sea surface temperatures off the northcoast.
The hottest day was at Middle Point with 38.1 °C onthe 26th, followed by Noonamah on the 26th andMiddle Point on the 28th with both recorded 38 °C.Bradshaw and Middle Point both recorded 37.9 °C onthe 24th.
The warmest days on average were at Middle Pointwith 34.5 °C, followed by Noonamah with 34.4 °C,and then Jabiru Airport with 34.0 °C.
The coolest day were all recorded at Arltunga with16.9 °C on the 11th, 17.0 °C on the 12th, and then17.2 °C on the 18th.
The coolest days on average were at Kulgera with23.1 °C, followed by Arltunga with 23.7 °C, and thenAlice Springs Airport with 24.9 °C.
Anomalies of mean daily maximum temperature inAugust 2012
Decile rank of mean daily maximum temperaturein August 2012
There could be discrepancies between the values shown on these mapsand those at individual locations, as a result of the way the maps aregenerated.
Monthly Weather Review Northern Territory August 2012
page 5

Minimum temperaturesMinimum temperatures were generally well belowaverage across the Northern Territory in August,associated with the strong sub-tropical ridge whichaffected the continent. Cool nights associated withthe cool and dry southeasterly wind flow andradiative cooling continued across the Top End, withDarwin dipping below 20 °C on 25 occasions andAlice Springs Airport recorded six nights of belowfreezing point.
Arltunga recorded the coldest night with −4.7 °C onthe 2nd and −3.7 °C on the 3rd, followed by bothAlice Springs Airport on the 1st and Arltunga on the13th with both recorded −3.7 °C.
The coolest nights on average were at Arltunga with3.5 °C, followed by Alice Springs Airport with 4.3 °C,and then Yulara Aero with 4.7 °C.
The warmest nights on average were at Cape Wesselwith 22.7 °C, followed by McCluer Island with22.5 °C, and then Cape Don with 22.0 °C.
The warmest night was at McCluer Island with24.4 °C on the 27th. Three stations recorded 24.3 °Cincluding Cape Don on the 25th, Darwin NTC andMcCluer Island both on the 26th. McCluer Island alsorecorded 24.1 °C on the 25th.
Anomalies of mean daily minimum temperature inAugust 2012
Decile rank of mean daily minimum temperature inAugust 2012
There could be discrepancies between the values shown on these mapsand those at individual locations, as a result of the way the maps aregenerated.
Monthly Weather Review Northern Territory August 2012
page 6

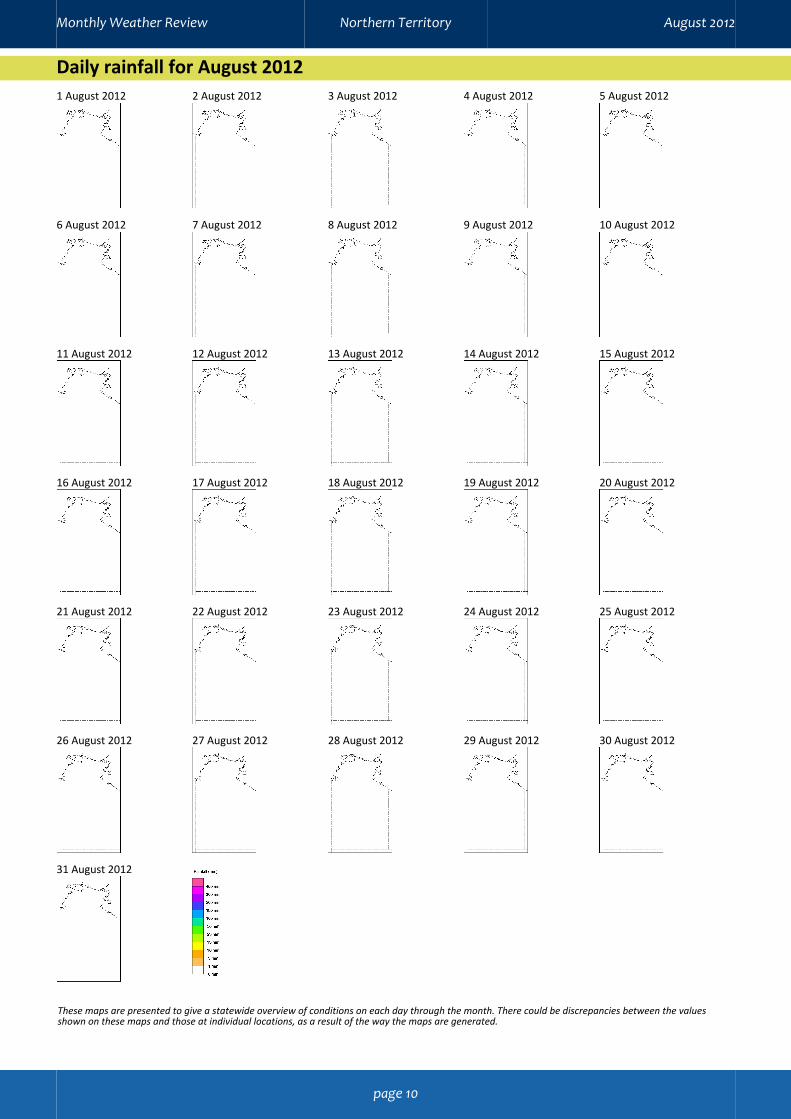
RainfallAlthough August is climatologically a dry month,August 2012 was drier than normal due to the strongsub-tropical ridge across the continent and the lackof fronts in the southern districts. However, lightbrief isolated showers were observed across theeastern parts of the Top End with the return ofmoisture as the pressure gradient eased. No rain wasrecorded across the southern districts, including inthe Alice Springs Airport since 24 April. Mostlocations across the Alice Springs District see around10 mm of rainfall in a typical August.
The wettest overall was North East Island with5.0 mm, followed by Centre Island with 1.6 mm, andthen Gove Airport with 1.4 mm.
The wettest single day was at Gove Airport with0.8 mm on the 10th, followed by North East Islandwith 0.6 mm on the 5th. The following stations allrecorded 0.4 mm including North East Island both onthe 6th and the 27th, followed by Noonamah on the29th, and then North East Island again on the 29th.
Total rainfall in August 2012
Decile rank of total rainfall in August 2012
There could be discrepancies between the values shown on these mapsand those at individual locations, as a result of the way the maps aregenerated.
New rainfall recordsNo new rainfall records appear to have been set thismonth.
Monthly Weather Review Northern Territory August 2012
page 7

Daily maximum temperature for August 20121 August 2012 2 August 2012 3 August 2012 4 August 2012 5 August 2012
6 August 2012 7 August 2012 8 August 2012 9 August 2012 10 August 2012
11 August 2012 12 August 2012 13 August 2012 14 August 2012 15 August 2012
16 August 2012 17 August 2012 18 August 2012 19 August 2012 20 August 2012
21 August 2012 22 August 2012 23 August 2012 24 August 2012 25 August 2012
26 August 2012 27 August 2012 28 August 2012 29 August 2012 30 August 2012
31 August 2012
These maps are presented to give a statewide overview of conditions on each day through the month. There could be discrepancies between the valuesshown on these maps and those at individual locations, as a result of the way the maps are generated.
Monthly Weather Review Northern Territory August 2012
page 8

Daily minimum temperature for August 20121 August 2012 2 August 2012 3 August 2012 4 August 2012 5 August 2012
6 August 2012 7 August 2012 8 August 2012 9 August 2012 10 August 2012
11 August 2012 12 August 2012 13 August 2012 14 August 2012 15 August 2012
16 August 2012 17 August 2012 18 August 2012 19 August 2012 20 August 2012
21 August 2012 22 August 2012 23 August 2012 24 August 2012 25 August 2012
26 August 2012 27 August 2012 28 August 2012 29 August 2012 30 August 2012
31 August 2012
These maps are presented to give a statewide overview of conditions on each day through the month. There could be discrepancies between the valuesshown on these maps and those at individual locations, as a result of the way the maps are generated.
Monthly Weather Review Northern Territory August 2012
page 9
Daily rainfall for August 20121 August 2012 2 August 2012 3 August 2012 4 August 2012 5 August 2012
6 August 2012 7 August 2012 8 August 2012 9 August 2012 10 August 2012
11 August 2012 12 August 2012 13 August 2012 14 August 2012 15 August 2012
16 August 2012 17 August 2012 18 August 2012 19 August 2012 20 August 2012
21 August 2012 22 August 2012 23 August 2012 24 August 2012 25 August 2012
26 August 2012 27 August 2012 28 August 2012 29 August 2012 30 August 2012
31 August 2012
These maps are presented to give a statewide overview of conditions on each day through the month. There could be discrepancies between the valuesshown on these maps and those at individual locations, as a result of the way the maps are generated.
Monthly Weather Review Northern Territory August 2012
page 10

Summary of observations for Darwin in August 2012Observations and climatology from Darwin Airport.
Observed this month Climatological valueTemperatureMean daily maximum temperature 31.4 °C 31.4 °CMean daily minimum temperature 17.8 °C 20.4 °CMean temperature 24.6 °C 25.9 °CMean temperature at 9 am 23.7 °C 24.4 °CMean temperature at 3 pm 29.8 °C 30.2 °CHighest temperature 35.6 °C on the 27th 37.0 °C on the 30th in 1971Lowest temperature 13.1 °C on the 13th 13.1 °C on the 13th in 2012Days 30 °C or warmer 24 25.5Days 35 °C or warmer 1 0.2HumidityMean relative humidity at 9 am 65 % 64 %Mean relative humidity at 3 pm 35 % 40 %PressureMean MSL pressure at 9 am 1016.1 hPa 1014.9 hPaMean MSL pressure at 3 pm 1011.9 hPa 1011.2 hPaWindStrongest wind gust E 54 km/h on the 7th ESE 67 km/h on the 17th in 1993Mean wind speed at 9 am 15 km/h 11 km/hMean wind speed at 3 pm 22 km/h 19 km/hDays with strong wind 1 0.9Days with gales 0 0.0Days with gale-force gusts 0 0.1RainfallTotal precipitation 0.0 mm 5.0 mmNumber of rain days 0 0.6Wettest day 0.0 mm 80.0 mm on the 22nd in 1947SunshineMean daily sunshine 10.8 hours 10.3 hoursEvaporationMean daily evaporation 6.6 mm 7.2 mmPhenomenaDays of thunder 0 0.2Days of hail 0 0.0Days of fog 9 2.1Days with mist or haze 31 25.0
Monthly Weather Review Northern Territory August 2012
page 11

Summary of observations for Alice Springs in August 2012Observed this month Climatological value
TemperatureMean daily maximum temperature 24.9 °C 22.6 °CMean daily minimum temperature 4.3 °C 6.0 °CMean temperature 14.6 °C 14.3 °CMean temperature at 9 am 15.1 °C 13.4 °CMean temperature at 3 pm 23.6 °C 21.8 °CHighest temperature 33.0 °C on the 22nd 35.2 °C on the 22nd in 2009Lowest temperature −3.6 °C on the 1st −4.1 °C on the 11th in 1994Days 30 °C or warmer 3 2.2Days 35 °C or warmer 0 0.0Days 40 °C or warmer 0 0.0Nights 5 °C or cooler 20 15.4Nights 2 °C or cooler 10 6.7HumidityMean relative humidity at 9 am 26 % 46 %Mean relative humidity at 3 pm 13 % 25 %PressureMean MSL pressure at 9 am 1022.6 hPa 1021.7 hPaMean MSL pressure at 3 pm 1018.4 hPa 1018.0 hPaWindStrongest wind gust WNW 65 km/h on the 22nd NW 96 km/h on the 26th in 1973Mean wind speed at 9 am 15 km/h 9 km/hMean wind speed at 3 pm 17 km/h 15 km/hDays with strong wind 1 1.1Days with gales 0 0.1Days with gale-force gusts 1 0.5RainfallTotal precipitation 0.0 mm 9.2 mmNumber of rain days 0 1.9Wettest day 63.0 mm on the 16th in 1947SunshineMean daily sunshine 10.6 hours 9.8 hoursEvaporationMean daily evaporation 6.3 mm 5.7 mmPhenomenaDays of thunder 0 0.8Days of hail 0 0.0Days of frost 7 10.3Days of fog 0 0.4Days with mist or haze 12 5.2
Monthly Weather Review Northern Territory August 2012
page 12

Daily and mean maximum temperatures for August 2012Mean is the average of the daily maximum temperature for August 2012; it is only shown if there are sufficient days available. Anom is thedifference between the mean daily maximum temperature for August 2012 and the long-term average maximum temperature for August.Decile is the decile rank of mean daily maximum temperature for August 2012 in the climate record of other August mean daily maximumtemperatures; “L” indicates this is the lowest on record, and “H” it is the highest on record. Anomalies and deciles are only shown if there aresufficient years of climate record available. The lowest and highest maximum temperatures for each site for August 2012 are highlighted.
Darwin-Daly (14GA) Mean Anom Decile 1 2 3 4 5 6 7 8 9 10 11 12 13 14 15 16 17 18 19 20 21 22 23 24 25 26 27 28 29 30 31Batchelor Aero 33.2 30.6 31.4 32.7 32.6 32.5 32.6 32.2 32.0 33.8 33.0 31.1 28.6 29.6 30.6 31.2 32.3 33.0 33.7 33.4 33.0 33.5 34.2 34.9 36.2 36.4 36.6 36.2 35.5 35.6 34.3 34.8Black Point 30.2 −0.3 3 28.2 29.1 28.8 28.7 29.5 30.6 29.2 28.8 28.8 29.6 30.8 28.2 27.1 28.9 29.3 29.0 28.1 30.3 30.2 31.8 32.1 31.4 32.1 32.2 32.6 31.2 32.5 32.1 31.4 31.1 31.5Bradshaw 33.7 30.1 31.8 32.9 33.5 34.2 32.8 32.0 32.7 33.6 33.0 30.0 28.5 28.9 30.8 31.7 33.6 34.1 34.5 34.0 33.5 35.1 34.8 36.5 37.9 37.0 37.8 36.9 36.2 36.7 35.7Cape Don 30.3 29.1 29.4 30.6 29.7 29.6 30.0 30.6 30.1 29.9 30.5 29.6 28.6 28.9 29.4 29.9 29.9 29.6 29.8 30.4 31.0 30.5 30.7 31.2 31.4 31.6 32.0 31.4 31.7 31.5 30.5 30.9Central Arnhem Plateau 30.8 28.2 29.8 30.4 30.8 30.9 29.6 29.5 28.8 29.0 30.5 28.2 25.5 26.6 27.8 29.0 30.1 31.1 32.2 31.1 30.8 31.9 33.7 33.8 34.5 33.7 34.2 33.1 32.2 32.8 32.8 33.2Channel Point 28.6 28.2 29.3 27.3 27.0 26.5 27.2 30.4 28.5 27.5 31.4 28.8 27.5 29.2 26.6 27.4 27.4 27.5 28.6 32.4 29.5 29.8 30.3 29.1 29.1 28.6 28.9 28.2Darwin Airport 31.4 0.0 5 30.3 29.8 31.2 29.9 30.4 32.3 31.0 31.4 32.2 32.8 31.6 28.9 29.6 30.5 29.2 29.3 29.5 30.8 31.0 32.9 31.3 32.1 31.9 33.4 33.2 32.4 35.6 34.4 31.3 31.1 30.9Darwin NTC AWS 27.9 28.1 28.6 29.6 29.5 30.9 30.8 30.7 33.5 31.6 29.2 29.5 29.2Delamere Weapons Range 32.1 27.7 29.4 31.3 31.8 31.6 30.6 30.8 31.7 31.4 26.8 26.2 28.0 29.4 29.6 32.0 33.1 33.0 32.3 31.8 33.4 34.2 35.4 36.0 35.4 36.6 34.9 34.1 34.3 35.5 35.0Douglas River 33.8 +0.3 8 29.6 31.9 32.8 33.4 33.2 32.7 32.9 32.4 33.0 33.1 30.4 28.6 28.9 30.9 31.7 33.2 34.5 34.9 35.6 34.6 35.2 35.9 37.8 37.7 37.6 37.2 36.2 36.3 35.6 36.9Dum In Mirrie AWS 29.8 30.3 29.3 29.8 28.2 28.5 28.6 32.0 31.6 29.9 32.6 32.0 29.5 29.4 29.6 28.9 29.1 28.3 29.1 29.4 31.2 29.5 28.8 28.4 29.7 30.1 30.8 30.5 29.8 28.8 29.6 29.8Jabiru Airport 34.0 +0.3 7 31.8 32.6 33.3 33.8 34.3 33.5 32.3 32.0 33.0 33.7 32.1 29.6 30.1 31.2 32.2 33.7 33.9 35.6 34.5 34.6 35.2 36.1 35.9 37.4 36.5 37.4 36.2 35.8 35.6 35.5 35.9Katherine Country Club 32.8 29.0 30.0 32.0 32.1 32.6 32.0 31.0 31.0 31.9 32.0 29.6 27.2 28.0 30.2 31.0 32.4 33.5 33.9 33.6 32.7 34.0 34.6 36.0 36.8 35.7 36.7 35.5 34.6 35.4 35.5 35.6Mango Farm 33.2 −0.2 4 29.4 31.2 32.0 33.1 32.9 32.1 31.8 31.5 32.3 32.5 30.4 28.0 28.5 30.3 31.5 32.7 33.0 34.0 33.6 34.0 34.0 34.3 35.5 36.5 37.5 37.2 36.4 35.0 36.3 35.3 35.1McCluer Island 27.2 25.3 26.2 26.3 26.6 26.9 27.1 27.0 26.2 26.2 26.7 26.4 25.3 24.5 26.0 26.2 26.7 26.4 27.6 27.2 28.3 28.2 28.6 29.9 28.7 29.4 27.8 28.3 27.8 28.1 27.9 29.1Middle Point AWS 34.5 31.8 32.0 33.3 33.0 34.3 33.7 33.4 32.8 33.7 34.5 32.8 30.4 30.7 31.8 32.5 33.6 34.4 34.7 34.9 34.5 34.5 36.0 36.1 37.9 37.5 38.1 37.7 38.0 37.7 35.4 36.3Noonamah AWS 34.4 31.8 32.7 33.8 33.3 33.9 33.9 33.3 33.4 33.4 34.3 32.8 30.0 30.8 31.8 32.5 33.9 34.1 34.9 34.9 34.9 34.3 35.7 36.3 37.5 37.0 38.0 37.4 36.9 36.8 35.7 36.2Oenpelli 33.7 0.0 5 32.3 32.6 33.6 33.6 32.6 31.4 31.6 32.1 33.0 31.9 29.9 29.7 33.1 33.4 34.3 34.4 34.6 35.7 35.4 36.1 35.4 35.7 35.2 35.4 35.9 35.0 35.6Pirlangimpi 32.8 +0.8 9 31.1 31.4 31.8 32.5 31.8 33.0 31.4 32.1 32.3 32.8 31.7 29.4 30.1 31.7 31.1 31.5 32.3 33.1 34.0 33.4 33.2 33.1 32.9 35.0 35.2 35.5 35.4 35.6 33.3 34.3 33.5Port Keats Aero 31.6 30.2 31.0 33.1 33.0 31.4 30.0 32.3 29.5 31.3 32.7 31.3 28.7 28.9 29.9 30.7 32.2 32.3 31.1 30.6 33.2 32.2 30.7 32.4 31.9 32.9 34.1 33.3 33.1 32.6 30.0 31.7Tindal RAAF 32.5 +0.4 7 28.6 29.8 31.5 31.9 32.3 31.8 31.0 30.6 31.5 31.8 29.6 26.7 27.7 29.8 30.5 32.0 33.2 33.6 33.3 32.8 34.2 34.4 35.5 36.5 35.7 36.6 35.4 34.3 34.9 35.4 35.4
Arnhem (14BC) Mean Anom Decile 1 2 3 4 5 6 7 8 9 10 11 12 13 14 15 16 17 18 19 20 21 22 23 24 25 26 27 28 29 30 31Cape Wessel 29.4 27.9 28.7 28.2 29.4 28.6 29.3 29.0 29.2 29.0 29.5 27.8 27.4 27.7 28.9 29.1 29.4 28.9 29.1 29.0 29.7 29.9 29.9 30.3 30.5 30.9 30.7 30.5 30.6 30.6 30.4 30.5Gove Airport 28.6 0.0 6 26.6 27.6 28.6 28.4 28.1 28.1 28.1 28.1 27.0 28.9 26.1 25.9 26.7 27.4 27.3 27.5 29.0 29.3 27.7 28.8 30.2 30.9 29.7 30.7 30.4 30.2 30.0 30.8 29.8 29.6 30.5Groote Eylandt Airport AWS 29.6 26.6 28.6 29.0 30.0 30.2 28.5 29.5 29.3 29.2 28.5 24.5 24.4 27.0 28.3 28.3 28.8 26.2 29.7 30.4 30.2 31.3 31.7 31.0 33.1 32.7 33.1 30.8 32.2 31.4 31.5 31.8Maningrida Aero 31.3 30.0 30.3 30.3 29.8 30.1 32.1 31.0 30.1 31.1 30.9 30.7 29.2 29.6 29.3 29.1 30.6 29.1 30.7 33.4 33.0 32.7 33.2 32.3 33.5 32.4 31.5 35.1 34.5 31.6 31.7 32.8Milingimbi AWS 30.7 30.2 29.5 30.6 30.0 29.3 31.4 31.2 29.5 29.4 29.4 31.0 28.8 29.5 29.4 29.3 29.7 28.7 30.7 32.1 31.6 32.4 31.7 31.9 32.3 31.3 30.7 33.7 33.2 30.8 30.9 32.8Ngayawili 30.4 28.3 29.4 30.0 29.4 29.3 30.0 29.3 29.1 28.8 30.3 28.6 27.5 28.3 28.9 29.7 30.0 29.2 30.9 31.1 30.9 31.7 32.5 32.0 33.2 32.1 32.5 32.3 33.3 32.1 31.0 31.3North East Island 26.5 24.4 25.5 26.6 26.8 26.2 25.7 26.8 27.3 26.1 25.5 24.0 23.5 24.6 25.8 26.3 25.6 26.0 25.9 26.2 26.7 26.7 27.8 28.4 28.1 28.8 26.7 26.7 28.3 27.9 28.6 27.4Warruwi 29.5 +0.2 6 27.5 28.2 28.1 28.2 28.6 29.0 28.3 28.3 28.6 29.3 30.6 28.4 27.2 27.9 27.6 29.9 28.2 30.1 29.7 30.7 30.9 31.2 30.8 31.2 30.9 30.3 29.6 31.0 31.0 31.5 32.8
Roper-Mcarthur (14DE) Mean Anom Decile 1 2 3 4 5 6 7 8 9 10 11 12 13 14 15 16 17 18 19 20 21 22 23 24 25 26 27 28 29 30 31Borroloola 35.4 35.8 36.6 35.0 33.5 34.9 34.2 35.2Bulman AWS 32.4 28.7 31.1 32.2 33.1 32.4 31.7 30.7 31.3 30.7 31.3 28.1 26.8 28.0 29.5 30.2 31.4 32.2 32.8 32.6 32.9 34.5 34.7 35.9 36.0 35.5 35.7 33.9 35.2 34.8 35.9 35.6Centre Island 27.6 −0.2 4 25.2 25.9 27.2 26.4 27.7 26.2 24.6 26.4 27.9 28.6 24.6 23.8 25.3 25.4 26.6 27.6 28.6 26.7 26.6 28.0 28.4 29.9 30.2 30.3 28.2 30.4 29.3 30.1 30.9 28.1 30.2Daly Waters AWS 32.5 +1.5 9 28.4 30.6 31.5 31.8 32.4 32.0 31.2 31.9 32.1 31.3 26.1 25.6 27.9 30.3 31.1 32.8 33.8 33.1 32.6 32.6 33.9 34.5 35.9 36.6 36.5 36.8 34.7 34.0 34.8 35.1 35.2McArthur River Mine 32.7 +0.7 8 29.2 30.7 31.4 32.2 32.3 31.7 31.7 31.9 32.6 32.4 27.4 27.1 28.6 30.6 31.0 32.4 33.4 32.9 32.8 33.2 34.4 34.4 35.5 36.9 37.0 36.4 35.1 33.9 35.1 35.1 35.7Ngukurr AWS 31.7 26.5 29.3 31.2 31.3 31.8 31.1 31.2 30.3 31.0 32.4 28.6 26.2 27.7 28.3 29.8 31.0 32.1 32.5 30.0 32.2 33.8 34.7 35.1 34.8 33.9 34.6 31.6 34.8 34.3 35.0 34.6Wollogorang 31.5 +0.4 7 27.4 30.0 31.6 30.6 31.2 30.4 29.8 30.1 31.5 30.5 25.1 27.7 29.2 30.1 32.2 33.1 30.0 29.2 31.6 32.9 34.5 34.5 34.8 34.0 34.5 32.2 33.1 33.8 34.4 34.0
Victoria (14F) Mean Anom Decile 1 2 3 4 5 6 7 8 9 10 11 12 13 14 15 16 17 18 19 20 21 22 23 24 25 26 27 28 29 30 31Kidman Springs 30.2 30.9 32.1 32.1 27.5 29.9Lajamanu 30.5 24.7 27.0 27.8 29.8 30.2 30.3 29.3 29.6 30.8 29.0 23.9 23.2 24.9 28.1 29.7 31.3 31.9 31.4 29.2 30.5 32.6 35.3 34.4 34.6 34.4 33.6 32.8 32.5 34.3 36.1 33.4Timber Creek 33.2 +0.3 7 29.2 31.0 31.8 33.1 32.8 32.2 32.1 32.6 32.4 28.7 27.6 27.8 30.6 31.4 33.1 34.1 34.8 33.5 33.0 34.6 36.1 36.1 36.8 37.7 35.8 34.8 36.2 36.6 35.7Victoria River Downs 32.5 +0.6 8 27.8 29.9 30.7 32.1 32.1 32.5 31.4 31.4 32.2 31.3 26.6 26.0 27.1 30.0 30.7 32.3 33.4 33.3 32.5 32.5 34.0 35.4 35.6 36.5 36.1 37.5 35.2 34.5 35.7 35.9 35.5Wave Hill 25.6 27.5 31.0 29.7 30.1 29.8 31.0 29.8 32.4 30.3 30.8 33.4 34.5 35.3 35.3 34.3 35.4 33.4 33.0 34.1 35.2 33.4
Barkly (15A) Mean Anom Decile 1 2 3 4 5 6 7 8 9 10 11 12 13 14 15 16 17 18 19 20 21 22 23 24 25 26 27 28 29 30 31Brunette Downs 29.8 +0.2 6 23.8 27.6 28.8 34.8 30.4 29.6 29.4 29.9 30.4 26.5 23.2 22.5 25.5 26.5 30.4 31.0 31.3 28.5 27.7 28.2 30.2 34.9 35.7 32.2 34.0 30.7 31.6 32.6 35.4 29.6Elliott 30.9 −0.4 4 25.6 28.0 29.9 30.5 34.7 30.5 29.0 30.0 31.0 29.0 24.5 26.0 25.5 28.6 29.8 31.5 32.4 29.5 29.8 32.6 34.6 35.4 35.0 34.3 33.0 32.7 33.9 35.4 32.2Tennant Creek Airport 27.9 +0.4 7 22.6 25.1 26.9 27.6 28.7 26.8 26.8 27.9 29.6 25.3 21.3 21.2 23.1 25.8 27.7 29.6 29.1 26.2 25.1 27.1 30.2 33.8 33.5 29.5 30.2 30.0 30.3 30.3 32.6 32.8 27.0
Alice Springs (15B) Mean Anom Decile 1 2 3 4 5 6 7 8 9 10 11 12 13 14 15 16 17 18 19 20 21 22 23 24 25 26 27 28 29 30 31Alice Springs Airport 24.9 +2.3 9 19.3 23.5 27.8 27.0 25.1 23.2 26.8 28.1 22.1 19.5 18.1 17.9 23.4 25.7 27.8 27.2 22.1 19.4 20.5 26.5 31.2 33.0 25.1 23.3 27.0 25.4 27.5 29.9 31.8 24.0 21.3Arltunga 23.7 18.8 22.6 24.5 25.0 25.2 22.2 25.2 26.9 21.2 18.0 16.9 17.0 21.5 24.4 26.9 27.2 21.3 17.2 19.8 26.0 29.4 31.2 25.5 21.7 25.1 23.7 26.3 28.8 31.5 22.7 20.0Curtin Springs 25.0 +2.0 9 20.8 24.2 25.7 26.5 25.0 23.8 27.5 29.5 22.3 20.8 19.0 19.5 24.3 25.5 27.6 26.0 22.5 20.0 22.1 25.9 30.0 30.6 23.4 23.5 26.9 25.5 28.5 32.5 29.9 24.0 22.0Jervois 25.5 +0.5 7 19.3 23.6 25.9 26.2 28.2 24.2 24.6 29.2 24.7 19.7 19.7 19.1 23.0 26.5 29.0 30.0 23.5 21.2 20.8 25.8 31.6 34.3 28.3 23.8 25.7 25.3 25.3 30.1 34.5 26.5 21.8Kulgera 23.1 +1.1 8 18.7 23.4 24.8 25.6 23.0 21.8 25.4 28.8 20.5 18.7 17.9 17.8 21.8 24.0 25.5 23.8 20.1 18.3 20.1 25.6 28.5 30.5 21.0 21.8 24.3 31.8 21.4Papunya 20.3 25.9 26.8 25.4 25.5 26.6 27.5 26.1 23.6 20.1 20.8 22.9 25.2 27.9 28.8 25.7 24.5 24.6 26.4 31.1 31.7 28.0 26.9 32.0Rabbit Flat 30.0 23.7 25.8 27.7 29.6 30.0 29.4 29.7 29.3 31.6 29.3 23.4 22.9 24.8 27.5 29.8 31.2 31.4 29.5 27.8 30.2 33.6 34.5 32.5 32.4 32.9 32.4 31.9 32.8 35.1 36.0 30.1Territory Grape Farm 26.2 +1.0 8 20.9 23.6 25.4 26.4 26.8 25.0 26.2 27.6 26.9 22.6 19.8 20.1 22.1 25.7 27.7 29.4 25.9 23.2 23.5 26.6 30.5 32.1 28.9 26.8 28.4 26.8 28.2 29.3 33.2 28.4 24.3Walungurru 28.3 22.7 24.9 27.6 27.8 27.9 28.1 28.9 30.1 29.1 26.8 23.0 23.2 25.1 27.1 29.4 29.3 26.2 26.4 26.5 29.3 32.5 32.2 27.3 29.2 30.9 30.6 30.9 33.4 34.3 30.6 27.4Watarrka 22.4 24.1 26.9 25.3 26.4 27.8 28.9 23.5 22.5 19.7 21.0 25.0 27.0 28.2 26.5Yuendumu 28.1 26.5 28.0 29.0 27.7 29.1 29.2 28.1 30.6 32.0 29.3 29.4Yulara Aero 25.1 +1.5 9 20.3 24.1 25.2 26.5 23.8 23.8 27.4 29.2 22.6 21.3 19.2 19.0 23.5 25.6 28.1 26.0 22.1 20.6 22.1 26.1 30.2 30.8 22.5 23.9 27.0 26.1 28.7 33.0 30.2 24.7 23.2
Monthly Weather Review Northern Territory August 2012
page 13

Daily and mean minimum temperatures for August 2012Mean is the average of the daily minimum temperature for August 2012; it is only shown if there are sufficient days available. Anom is thedifference between the mean daily minimum temperature for August 2012 and the long-term average minimum temperature for August.Decile is the decile rank of mean daily minimum temperature for August 2012 in the climate record of other August mean daily minimumtemperatures; “L” indicates this is the lowest on record, and “H” it is the highest on record. Anomalies and deciles are only shown if there aresufficient years of climate record available. The lowest and highest minimum temperatures for each site for August 2012 are highlighted.
Darwin-Daly (14GA) Mean Anom Decile 1 2 3 4 5 6 7 8 9 10 11 12 13 14 15 16 17 18 19 20 21 22 23 24 25 26 27 28 29 30 31Batchelor Aero 14.5 10.8 9.8 12.8 12.8 13.4 13.8 10.4 12.7 12.8 15.4 13.4 15.2 10.8 11.2 11.8 14.7 14.7 15.7 16.2 15.3 12.9 14.7 15.4 17.4 19.8 18.9 19.0 17.0 15.3 18.0 17.5Black Point 20.0 −1.2 1 18.9 20.4 19.8 17.9 19.8 18.9 19.6 21.7 22.1 21.7 20.1 18.3 17.0 17.7 17.7 17.0 18.5 18.8 20.6 20.3 18.9 19.6 20.3 22.9 23.5 21.8 22.9 23.2 19.4 20.7 21.0Bradshaw 13.7 8.0 9.0 10.1 11.2 13.5 12.8 12.1 14.9 14.0 14.9 15.8 8.6 11.5 6.9 9.6 11.8 13.3 15.1 15.7 12.4 12.5 13.4 17.4 20.5 19.9 20.9 17.3 14.3 15.3 19.1Cape Don 22.0 20.8 21.4 21.4 21.5 21.4 21.4 21.2 22.3 22.1 21.9 22.2 21.1 19.9 20.0 20.8 20.4 21.4 21.4 21.6 22.2 22.1 22.3 23.7 23.7 24.3 23.8 23.3 23.9 22.7 23.2 23.6Central Arnhem Plateau 13.8 12.2 11.9 11.9 14.2 11.3 12.6 9.8 13.4 12.7 12.9 14.0 9.7 8.8 11.7 14.0 12.4 12.0 13.6 16.6 15.2 11.6 14.3 18.6 18.3 19.0 18.6 16.5 15.0 12.4 16.3 16.9Channel Point 16.1 13.7 12.5 13.5 15.1 16.5 16.4 15.2 15.5 16.5 16.0 16.4 13.8 11.5 14.0 14.9 14.7 16.0 17.4 17.5 14.8 17.0 19.0 19.4 19.5 18.0 17.9 18.4 19.4Darwin Airport 17.8 −2.6 L 16.3 16.3 17.3 16.6 17.3 17.3 15.4 17.8 18.4 17.3 17.7 16.0 13.1 14.5 15.3 17.6 16.4 17.1 17.8 18.0 17.3 17.6 19.0 20.7 21.6 20.8 21.3 20.1 19.8 20.1 19.8Darwin NTC AWS 19.7 20.9 21.6 20.5 22.0 24.0 24.3 23.5 23.8 22.6 22.8 22.2Delamere Weapons Range 14.7 11.9 12.1 9.9 13.5 14.7 13.7 12.7 14.3 15.2 15.5 12.3 10.6 9.6 10.6 12.0 13.2 15.5 18.4 14.5 14.0 15.7 18.4 22.1 21.1 20.6 17.9 13.3 15.6 18.0Douglas River 11.3 −2.8 2 10.6 5.6 9.2 8.7 11.6 12.1 9.5 10.4 10.6 12.2 12.9 11.6 8.6 6.3 7.0 9.5 8.8 11.1 13.3 12.4 10.7 12.5 12.7 17.0 16.4 18.3 13.5 8.4 12.9 14.6Dum In Mirrie AWS 17.2 12.9 14.1 17.8 17.1 18.4 17.1 16.5 16.3 15.8 16.7 17.1 17.6 12.9 12.9 14.4 16.5 16.0 18.4 17.6 17.4 16.6 17.3 18.1 19.1 21.0 19.3 20.0 20.4 18.2 19.3 19.8Jabiru Airport 17.2 −1.9 1 14.4 15.3 17.7 15.2 16.0 16.0 16.9 17.6 15.9 17.2 17.4 16.5 14.0 16.8 17.3 14.5 14.0 14.7 17.4 18.7 14.3 16.3 19.6 21.7 22.8 20.8 20.4 19.6 15.9 18.6 20.1Katherine Country Club 11.8 7.9 8.0 8.8 10.9 12.0 12.2 9.5 10.2 12.2 12.8 11.5 7.2 7.0 7.1 9.9 8.9 11.6 12.2 14.5 12.2 9.9 12.5 12.8 18.0 19.9 18.3 14.6 11.4 13.8 15.6Mango Farm 11.5 −4.3 L 7.6 11.1 9.4 10.6 11.2 12.9 9.9 11.6 10.8 11.9 12.4 10.7 7.0 7.5 7.6 10.7 10.3 10.4 18.0 12.2 7.9 11.0 11.6 12.6 15.5 15.5 16.3 12.4 10.5 15.4 14.4McCluer Island 22.5 21.1 21.1 22.4 23.1 23.3 23.2 22.0 21.8 22.9 22.9 22.4 20.6 20.6 20.5 22.2 21.5 22.9 23.3 22.6 23.2 21.8 22.1 23.1 24.0 24.1 24.3 24.4 22.8 21.5 22.8 23.2Middle Point AWS 12.3 7.1 8.8 12.5 12.3 12.9 12.4 8.5 12.7 11.8 12.9 9.7 9.2 5.0 8.5 10.7 11.4 11.5 12.3 12.8 11.9 11.9 11.5 13.1 17.0 18.8 18.6 16.3 15.7 14.8 14.6 14.8Noonamah AWS 13.5 9.8 9.2 12.4 12.8 13.2 13.6 9.6 13.1 12.5 13.4 12.7 14.4 8.6 9.5 10.5 11.6 12.8 13.2 14.2 14.9 12.4 12.3 14.6 17.4 19.6 18.6 17.1 16.4 16.5 15.8 16.1Oenpelli 15.6 −2.8 1 14.9 14.7 14.1 15.3 13.6 14.9 15.0 15.5 15.5 16.8 17.2 12.5 14.5 12.6 12.9 15.5 13.0 15.0 17.5 19.6 19.4 19.2 15.9 16.6 13.9 16.5 19.1Pirlangimpi 18.0 −1.1 3 16.1 15.7 17.6 19.0 16.6 17.9 15.7 20.8 16.7 17.4 17.6 14.3 14.4 14.1 17.1 17.6 17.1 16.9 18.6 18.9 18.2 18.1 18.8 21.6 22.8 22.4 19.9 18.9 19.0 18.8 19.3Port Keats Aero 14.7 15.9 12.0 11.2 12.3 12.5 13.7 14.3 12.3 13.8 14.0 17.9 13.6 13.9 11.0 12.5 12.0 12.1 16.1 17.5 17.4 13.2 16.1 14.1 14.0 18.9 18.1 19.2 16.6 15.2 16.7 18.7Tindal RAAF 11.5 −3.7 1 7.7 8.2 9.7 10.6 11.7 11.2 9.7 10.7 12.1 12.7 9.8 4.7 6.1 7.4 9.7 9.3 10.9 11.2 14.6 12.0 9.0 11.3 11.7 17.8 19.3 17.6 16.7 11.5 12.1 13.9 15.3
Arnhem (14BC) Mean Anom Decile 1 2 3 4 5 6 7 8 9 10 11 12 13 14 15 16 17 18 19 20 21 22 23 24 25 26 27 28 29 30 31Cape Wessel 22.7 21.7 22.5 22.0 22.6 22.2 21.9 22.5 22.7 22.4 22.1 22.3 21.1 21.7 22.6 22.5 22.2 21.7 22.2 22.9 23.0 22.6 23.1 23.8 24.0 24.0 23.9 23.4 23.6 23.4 23.5 23.6Gove Airport 17.6 −1.5 1 17.1 19.3 17.3 16.0 14.6 16.4 17.1 15.9 14.9 14.5 17.5 17.7 17.4 15.1 14.5 14.3 13.7 15.8 18.9 20.2 18.0 19.3 22.0 22.5 22.3 21.4 20.1 19.0 18.2 18.1 17.3Groote Eylandt Airport AWS 13.9 11.1 12.7 11.7 13.7 10.8 10.6 11.8 12.7 12.4 13.3 19.2 8.5 8.4 10.5 11.6 10.6 13.2 13.6 15.4 15.1 12.2 13.7 17.9 19.5 19.3 18.2 14.3 19.5 15.6 15.6 17.2Maningrida Aero 16.1 14.7 16.4 15.9 14.7 16.6 13.1 16.4 17.5 15.8 16.7 13.6 12.2 12.3 14.6 15.5 14.1 14.2 14.7 18.3 14.8 14.0 16.5 19.8 21.7 21.4 19.0 16.5 14.7 15.1 18.9 19.8Milingimbi AWS 17.7 14.5 16.6 17.7 18.0 17.4 16.4 17.3 17.3 18.1 17.6 16.4 12.7 12.4 15.8 17.6 16.5 16.3 16.3 18.7 18.0 17.8 18.9 21.1 21.8 21.6 20.9 19.7 18.1 17.3 19.4 19.8Ngayawili 18.7 16.5 18.4 18.6 18.9 16.9 18.5 17.8 18.6 18.8 17.5 18.9 15.8 16.8 18.0 18.4 17.0 16.5 17.9 19.4 19.3 19.2 20.3 21.9 22.4 22.0 19.9 18.4 18.7 20.7 18.2 18.6North East Island 20.8 20.3 20.3 20.4 20.1 19.6 19.9 20.4 20.8 20.9 21.1 21.7 20.1 20.3 19.9 20.1 18.6 19.2 20.5 21.5 21.6 20.7 20.7 21.7 22.8 22.6 22.6 22.3 22.5 20.7 18.6 21.2Warruwi 20.6 −1.1 1 19.0 20.1 20.5 20.2 20.6 20.1 20.2 20.0 21.1 20.8 20.2 18.4 16.9 19.3 20.3 20.1 19.6 18.5 22.3 21.9 19.1 19.8 21.9 23.7 23.4 23.7 22.0 21.6 18.4 21.3 22.6
Roper-Mcarthur (14DE) Mean Anom Decile 1 2 3 4 5 6 7 8 9 10 11 12 13 14 15 16 17 18 19 20 21 22 23 24 25 26 27 28 29 30 31Borroloola 17.4 16.0 13.0 10.8 12.7 17.5 14.7Bulman AWS 10.9 6.9 7.9 9.2 9.1 11.2 8.3 8.7 13.3 12.3 11.0 10.1 6.0 6.0 7.5 10.8 9.2 9.6 10.8 12.2 10.3 8.7 10.5 15.1 17.3 17.8 16.8 12.8 10.7 9.2 14.3 14.4Centre Island 18.1 −1.4 1 16.5 16.4 15.2 16.5 15.7 16.6 17.9 17.4 18.2 18.1 18.4 16.4 15.5 15.3 17.1 16.8 18.0 18.5 19.1 18.0 18.1 18.1 20.3 21.0 21.8 20.8 20.4 20.1 19.7 20.5 20.1Daly Waters AWS 8.6 −4.3 L 8.6 4.4 4.6 7.1 8.0 5.4 5.7 6.5 7.4 9.5 14.1 9.8 3.3 3.4 5.8 5.6 7.7 9.3 12.1 9.5 6.0 6.9 9.9 13.3 18.4 13.9 14.7 8.4 6.2 8.7 11.8McArthur River Mine 10.6 −2.7 1 5.8 6.5 7.3 8.7 8.9 7.8 6.3 10.6 12.2 11.6 13.9 6.9 4.4 6.3 9.7 9.7 11.5 12.7 9.7 8.7 8.7 9.9 12.5 16.7 18.1 16.4 13.5 9.8 11.4 15.9 15.3Ngukurr AWS 12.6 8.2 8.5 9.7 10.3 13.9 10.4 9.5 17.2 15.4 15.0 10.6 6.8 8.3 8.4 14.2 11.1 12.3 12.9 13.2 10.4 10.4 12.0 15.7 17.9 19.2 18.8 15.0 12.1 11.7 15.5 16.7Wollogorang 9.6 −2.5 1 5.5 4.4 6.5 6.7 7.6 7.0 6.0 8.9 11.2 11.2 12.5 5.0 3.3 4.8 7.3 10.7 9.5 10.4 10.4 7.5 8.6 9.4 14.0 16.0 16.5 15.0 14.0 8.4 12.2 13.0 14.3
Victoria (14F) Mean Anom Decile 1 2 3 4 5 6 7 8 9 10 11 12 13 14 15 16 17 18 19 20 21 22 23 24 25 26 27 28 29 30 31Kidman Springs 5.9 8.7 9.8 8.8 5.9 7.5Lajamanu 8.5 3.4 3.2 4.6 6.0 6.2 5.9 5.0 5.5 7.0 7.4 7.9 7.4 4.2 2.5 4.5 8.7 8.9 7.0 7.4 5.4 8.2 10.4 14.7 17.4 15.1 17.0 14.7 11.0 12.4 10.7 13.5Timber Creek 12.5 −3.3 1 10.5 9.1 11.7 11.9 14.0 13.1 9.3 10.9 13.2 18.5 11.0 10.6 10.2 8.7 10.3 12.4 14.0 18.4 14.4 8.3 9.0 11.1 12.7 17.5 16.6 16.2 12.6 10.7 15.6Victoria River Downs 9.4 −3.8 1 3.2 4.5 6.2 7.7 8.1 7.9 6.6 6.8 8.8 10.7 16.6 4.1 3.8 4.3 5.7 7.7 8.3 10.3 11.0 8.8 7.8 8.9 11.1 13.0 17.9 17.1 18.4 11.9 10.4 10.2 14.2Wave Hill 2.7 5.6 6.9 7.5 7.2 8.7 3.8 6.0 11.4 9.2 9.7 12.0 13.1 19.7 18.7 20.0 13.6 11.5 14.6 13.4
Barkly (15A) Mean Anom Decile 1 2 3 4 5 6 7 8 9 10 11 12 13 14 15 16 17 18 19 20 21 22 23 24 25 26 27 28 29 30 31Brunette Downs 10.2 −2.3 1 6.0 7.3 6.3 9.1 8.0 7.5 11.9 7.0 10.4 11.2 7.9 7.5 6.8 4.8 9.1 9.0 11.5 12.1 11.4 8.9 8.2 10.4 14.7 17.9 14.8 14.5 11.6 12.3 13.8 14.3Elliott 10.0 −3.2 L 6.0 7.0 5.0 5.9 7.6 9.8 9.8 8.0 8.4 9.0 9.0 8.0 6.8 8.8 8.5 8.7 12.4 9.0 7.9 11.2 16.0 15.9 14.8 16.4 11.5 10.9 11.8 14.9Tennant Creek Airport 13.2 −1.2 2 9.1 8.6 11.1 11.8 13.1 13.9 13.5 12.8 14.3 14.8 9.8 8.7 9.6 10.0 12.6 11.1 13.2 13.4 12.2 11.6 13.4 16.7 15.7 17.4 16.5 17.4 15.8 13.4 15.3 16.2 16.3
Alice Springs (15B) Mean Anom Decile 1 2 3 4 5 6 7 8 9 10 11 12 13 14 15 16 17 18 19 20 21 22 23 24 25 26 27 28 29 30 31Alice Springs Airport 4.3 −1.7 2 −3.6 −2.8 0.7 2.8 4.4 2.6 2.1 6.0 5.5 2.1 −1.7 −1.6 −1.4 0.3 3.7 4.9 6.7 1.7 −0.1 1.7 11.1 18.5 12.7 5.8 3.8 4.0 4.0 5.8 16.1 8.2 7.8Arltunga 3.5 −3.5 −4.7 −3.7 −1.4 −0.8 4.0 2.9 0.0 1.4 7.6 6.4 4.7 −3.6 −2.7 −0.4 1.0 2.6 3.0 −0.6 0.5 5.8 8.7 13.1 11.6 3.5 11.6 6.0 4.2 7.3 14.3 10.7Curtin Springs 5.0 −0.7 4 −0.7 −1.9 3.0 1.0 4.0 4.5 6.1 3.6 9.5 6.5 1.2 1.1 0.1 4.1 2.8 6.2 2.0 8.2 3.1 4.0 4.9 12.8 7.1 1.0 6.4 10.5 8.4 7.5 10.4 10.2 6.5Jervois 6.0 −1.1 3 −1.1 −1.5 1.5 2.8 4.6 2.0 3.3 7.0 8.2 6.0 5.5 2.7 3.0 6.0 4.5 8.3 3.7 3.8 1.4 8.7 9.9 16.0 9.6 5.4 14.3 5.3 3.8 11.6 11.4 13.3Kulgera 5.4 −1.3 2 5.5 3.8 6.0 5.5 1.8 9.6 12.0 7.9 1.2 −2.0 −2.7 3.6 8.4 4.3 5.1 6.0 4.5 1.0 5.8 9.8 12.7 11.4 1.4 8.9 3.8Papunya 7.0 1.1 0.9 1.1 6.0 8.6 8.6 5.1 6.7 8.4 5.1 5.6 4.1 2.1 4.4 6.1 10.3 8.6 6.5 8.2 8.1 10.4 13.7 12.6 11.4 10.5Rabbit Flat 6.6 −0.7 0.1 0.8 3.0 5.2 3.1 3.4 3.5 3.9 8.9 6.8 3.4 −0.3 1.3 1.8 3.8 7.7 7.5 7.2 6.5 10.7 14.0 13.9 10.5 13.6 10.6 9.4 9.8 13.1 16.8Territory Grape Farm 5.1 −1.9 1 −1.2 −0.7 0.0 4.4 2.8 3.3 3.8 4.1 4.5 7.8 2.0 1.3 2.5 1.3 3.9 4.1 8.2 5.5 3.3 3.4 5.3 9.2 9.8 8.2 7.5 10.2 7.5 6.9 7.1 10.9 11.8Walungurru 11.3 7.2 3.9 6.2 7.0 11.7 14.2 9.7 10.5 11.6 12.2 10.3 11.3 9.0 6.5 8.3 10.7 13.1 11.0 11.9 11.6 10.9 11.6 14.2 10.8 15.3 14.8 15.5 13.4 14.5 16.6 14.7Watarrka 6.0 0.6 0.2 6.4 13.8 3.5 9.0 10.0 4.6 1.0 7.0 1.0 1.9 2.1 3.9Yuendumu 3.1 −1.4 7.7 4.9 5.4 0.7 3.2 6.1 7.3 10.7 12.4 11.9 11.8 10.5 9.8Yulara Aero 4.7 −1.2 2 −2.0 −1.9 2.6 2.7 3.6 5.8 5.3 1.4 6.3 6.4 3.4 2.6 −1.5 3.2 2.9 7.0 −0.4 8.3 5.1 4.4 3.7 11.0 8.1 −0.8 5.9 9.7 8.0 4.6 13.1 8.6 8.9
Monthly Weather Review Northern Territory August 2012
page 14

Daily and total rainfall for August 2012Total is the total precipitation for August 2012; a missing total indicates there is concern about the quality of some of the daily values. Avg isthe long-term average total precipitation for August. Decile is the decile rank of total precipitation for August 2012 in the climate record ofother August totals; “L” indicates this is the lowest on record, and “H” it is the highest on record. Long-term average and decile rank are onlyshown if there are sufficient years of climate record available. Reports of zero precipitation are shown as “· ”. When a reading wasaccumulated over more than one day, “»” is shown on the days that are part of the accumulation.
Darwin-Daly (14GA) Total Avg Decile 1 2 3 4 5 6 7 8 9 10 11 12 13 14 15 16 17 18 19 20 21 22 23 24 25 26 27 28 29 30 31Batchelor Aero 0.6 · · · · · · 0.2 · · · · · · · · · · · · · · · · · · · · · 0.2 · 0.2Black Point · 1.3 L · · · · · · · · · · · · · · · · · · · · · · · · · · · · · · ·Bradshaw · · · · · · · · · · · · · · · · · · · · · · · · · · · · · · ·Burrell's Creek · · · · · · · · · · · · · · · · · · · · · · · · · · · · · · · ·Cape Don · · · · · · · · · · · · · · · · · · · · · · · · · · · · · · · ·Central Arnhem Plateau · · · · · · · · · · · · · · · · · · · · · · · · · · · · · · · ·Channel Island · 3.3 L · · · · · · · · · · · · · · · · · · · · · · · · · · · · · · ·Channel Point · 4.8 L · · · · · · · · · · · · · · · · · · · · · · · · · · · · · · ·CSIRO Berrimah · · · · · · · · · · · · · · · · · · · · · · · · · · · · · · · ·Darwin Airport · 5.0 L · · · · · · · · · · · · · · · · · · · · · · · · · · · · · · ·Darwin River Dam · 2.6 L · · · · · · · · · · · · · · · · · · · · · · · · · · · · · · ·Darwin River Ridge 0.2 · · · · · · · · · · · · · · · · · · · · · · · · · · · · 0.2 · ·Delamere Weapons Range · · · · · · · · · · · · · · · · · · · · · · · · · · · · · ·Douglas River · 1.4 L · · · · · · · · · · · · · · · · · · · · · · · · · · · · · ·Dum In Mirrie AWS 0.4 · · 0.2 · · 0.2 · · · · · · · · · · · · · · · · · · · · · · ·Edith Falls Ridge · · · · · · · · · · · · · · · · · · · · · · · · · · · · · · · ·Fanny Creek · · · · · · · · · · · · · · · · · · · · · · · · · · · · · · · ·Foelsche Headland · · · · · · · · · · · · · · · · · · · · · · · · · · · · · · · ·Girraween · · · · · · · · · · · · · · · · · · · · · · · · · · · · · · · ·Howard Springs Nature Park · 3.6 L · · · · · · · · · · · · · · · · · · · · · · · · · · · · · · ·Humpty Doo Collard Road · 4.9 L · · · · · · · · · · · · · · · · · · · · · · · · · · · · · · ·Jabiru Airport · 2.8 L · · · · · · · · · · · · · · · · · · · · · · · · · · · · · · ·Karama · 4.3 L · · · · · · · · · · · · · · · · · ·Katherine Aviation Museum · 1.7 L · · · · · · · · · · · · · · · · · · · · · · · · · · · · · · ·Katherine Council · 0.5 L · · · · · · · · · · · · · · · · · · · · · · · · · · · · · · ·Katherine Country Club · · · · · · · · · · · · · · · · · · · · · · · · · · · · · · · ·Lake Finniss Farm · 2.4 L · · · · · · · · · · · · · · · · · · · · · · · · · · · · · · ·Leanyer · 2.8 L · · · · · · · · · · · · · · · · · · · · · · · · · · · · · · ·Litchfield · 1.7 L · · · · · · · · · · · · · · · · · · · · · · · · · · · · · · ·Majestic Orchids · · · · · · · · · · · · · · · · · · · · · · · · · · · · · · · ·Mango Farm · 2.1 L · · · · · · · · · · · · · · · · · · · · · · · · · · · · · · ·Marrara 0.2 · · · · · · · · · · · · · · · · · · · · 0.2 · · · · · · · · · ·McCluer Island · · · · · · · · · · · · · · · · · · · · · · · · · · · · · · · ·Middle Point AWS · · · · · · · · · · · · · · · · · · · · · · · · · · · · · · · ·Mount Felix · · · · · · · · · · · · · · · · · · · · · · · · · · · · · · · ·Mount Stow · · · · · · · · · · · · · · · · · · · · · · · · · · · · · · · ·Nightcliff Pool 0.4 2.9 7 · · · · · · · · · · · · · · · · · · · · · 0.2 · · · · · · · 0.2 ·Nightcliff Sports Club · 9.1 L · · · · · · · · · · · · · · · · · · · · · · · · · · · · · · ·Nitmiluk Rangers · · · · · · · · · · · · · · · · · · · · · · · · · · · · · · · ·Nitmiluk Ridge · · · · · · · · · · · · · · · · · · · · · · · · · · · · · · · ·Noonamah AWS 0.6 · · · · · · · · · · · · · · · · · · · · · · 0.2 · · · · · 0.4 · ·Northlakes · · · · · · · · · · · · · · · · · · · · · · · · · · · · · · · ·Oenpelli · 1.0 L · · · · · · · · · · · · · · · · · · · · · · · · · · · · · · ·Pinelands · · · · · · · · · · · · · · · · · · · · · · · · · · · · · · · ·Pirlangimpi · 6.6 L · · · · · · · · · · · · · · · · · · · · · · · · · · · · · · ·Point Stuart AWS ·Port Keats Aero 0.6 0.2 · · · 0.2 · · 0.2 · · · · · · · ·Shoal Bay · · · · · · · · · · · · · · · · · · · · · · · · · · · · · · · ·Southport · · · · · · · · · · · · · · · · · · · · · · · · · · · · · · · ·Stokes Hill · 3.4 L · · · · · · · · · · · · · · · · · · · · · · · · · · · · · · ·The Chase 0.2 · · · · · · · · · · · · · · · · · · · · · · 0.2 · · · · · · · ·Tindal RAAF · 1.3 L · · · · · · · · · · · · · · · · · · · · · · · · · · · · · ·Tipperary · 1.7 L · · · · · · · · · · · · · · · · · · · · · · · · · · · · · · ·Upper Adelaide River · · · · · · · · · · · · · · · · · · · · · · · · · · · · · · · ·Upper Fergusson River · · · · · · · · · · · · · · · · · · · · · · · · · · · · · · · ·Upper Seventeen Mile Creek · · · · · · · · · · · · · · · · · · · · · · · · · · · · · · · ·Walker Creek · · · · · · · · · · · · · · · · · · · · · · · · · · · · · · · ·Yeuralba Ridge · · · · · · · · · · · · · · · · · · · · · · · · · · · · · · · ·
Arnhem (14BC) Total Avg Decile 1 2 3 4 5 6 7 8 9 10 11 12 13 14 15 16 17 18 19 20 21 22 23 24 25 26 27 28 29 30 31Cape Wessel · 7.8 L · · · · · · · · · · · · · · · · · · · · · · · · · · · · · · ·Gove Airport 1.4 5.5 5 · · · · 0.2 0.2 0.2 · · 0.8 · · · · · · · · · · · · · · · · · · · · ·Groote Eylandt Airport AWS 0.8 · · · · · 0.2 · · · 0.2 · · · · · · · 0.2 · · · · · · · · · · · · 0.2Maningrida Aero · · · · · · · · · · · · · · · · · · · · · · · · · · · · · · · ·Milingimbi AWS · · · · · · · · · · · · · · · · · · · · · · · · · · · · · · · ·Ngayawili 1.0 · · · · · 0.2 0.2 0.2 · 0.2 · · · · · · · · · · · · · · · · · · · · 0.2North East Island 5.0 1.4 9 · · 0.2 0.2 0.6 0.4 0.2 · 0.2 0.2 · · · · · 0.2 0.2 0.2 · · 0.2 0.2 0.2 0.2 0.2 0.2 0.4 · 0.4 0.2 0.2Warruwi · 0.5 L · · · · · · · · · · · · · · · · · · · · · · · · · · · · · · ·
Roper-Mcarthur (14DE) Total Avg Decile 1 2 3 4 5 6 7 8 9 10 11 12 13 14 15 16 17 18 19 20 21 22 23 24 25 26 27 28 29 30 31Borroloola · · · · · · · · · · · · · · · · · · · · · · · · · · · · · · · ·Bulman AWS · · · · · · · · · · · · · · · · · · · · · · · · · · · · · · · ·Central Waterhouse · · · · · · · · · · · · · · · · · · · · · · · · · · · · · · · ·Centre Island 1.6 1.6 6 · · 0.2 0.2 · 0.2 · · · 0.2 · · · · · 0.2 0.2 · · · · · · · · · · · · 0.2 0.2Conways · · · · · · · · · · · · · · · · · · · · · · · · · ·Daly Waters AWS · 0.4 L · · · · · · · · · · · · · · · · · · · · · · · · · · · · · · ·Daly Waters · 1.7 L · · · · · · · · · · · · · · · · · · · · · · · · · · · · · · ·McArthur River Mine · 0.4 L · · · · · · · · · · · · · · · · · · · · · · · · · · · · · · ·Ngukurr AWS · · · · · · · · · · · · · · · · · · · · · · · · · · · · · · · ·Snowdrop Creek · · · · · · · · · · · · · · · · · · · · · · · · · · · · · · · ·Upper Waterhouse River · · · · · · · · · · · · · · · · · · · · · · · · · · · · · · · ·West Waterhouse · · · · · · · · · · · · · · · · · · · · · · · · · · · · · · · ·Wollogorang · 0.6 L · · · · · · · · · · · · · · · · · · · · · · · · · · · · · · ·
Victoria (14F) Total Avg Decile 1 2 3 4 5 6 7 8 9 10 11 12 13 14 15 16 17 18 19 20 21 22 23 24 25 26 27 28 29 30 31Kidman Springs · 0.1 L · · · · · · · ·Lajamanu · 0.8 L · · · · · · · · · · · · · · · · · · · · · · · · · · · · · · ·Limbunya · 1.8 L · · · · · · · · · · · · · · · · · · · · · · · · · · · · · · ·Old Delamere · 0.7 L · · · · · · · · · · · · · · · · · · · · · · · · · · · · · · ·Shoeing Tool Bore · · · · · · · · · · · · · · · · · · · · · · · · · · · · · · · ·Sunshine Bore · · · · · · · · · · · · · · · · · · · · · · · · · · · · · · · ·Timber Creek · 0.6 L · · · · · · · · · · · · · · · · · · · · · · · · · · · · · · ·Upper Wickham River · · · · · · · · · · · · · · · · · · · · · · · · · · · · · · · ·Victoria River Downs · 1.0 L · · · · · · · · · · · · · · · · · · · · · · · · · · · · · · ·Waterloo · 0.9 L · · · · · · · · · · · · · · · · · · · · · · · · · · · · · · ·Wave Hill · 0.9 L · · · · · · · · · · · · · · · · · · · · · · · · · · · · · · ·
Barkly (15A) Total Avg Decile 1 2 3 4 5 6 7 8 9 10 11 12 13 14 15 16 17 18 19 20 21 22 23 24 25 26 27 28 29 30 31Brunette Downs · 1.4 L · · · · · · · · · · · · · · · · · · · · · · · · · · · · · · ·Elliott · 1.1 L » » » » » » » » » » » » » » » · · · · · · · · · · · · · · · ·Tennant Creek Airport · 1.6 L · · · · · · · · · · · · · · · · · · · · · · · · · · · · · · ·
Monthly Weather Review Northern Territory August 2012
page 15

Daily and total rainfall for August 2012Total is the total precipitation for August 2012; a missing total indicates there is concern about the quality of some of the daily values. Avg isthe long-term average total precipitation for August. Decile is the decile rank of total precipitation for August 2012 in the climate record ofother August totals; “L” indicates this is the lowest on record, and “H” it is the highest on record. Long-term average and decile rank are onlyshown if there are sufficient years of climate record available. Reports of zero precipitation are shown as “· ”. When a reading wasaccumulated over more than one day, “»” is shown on the days that are part of the accumulation.
Alice Springs (15B) Total Avg Decile 1 2 3 4 5 6 7 8 9 10 11 12 13 14 15 16 17 18 19 20 21 22 23 24 25 26 27 28 29 30 31Alice Springs Airport · 9.2 L · · · · · · · · · · · · · · · · · · · · · · · · · · · · · · ·Alice Springs Desert Park · · · · · · · · · · · · · · · · · · · · · · · · · · · · · · · ·Ammaroo · 4.9 L · · · · · · · · · · · · · · · · · · · · · · · · · · · · · · ·Arltunga · 6.8 L · · · · · · · · · · · · · · · · · · · · · · · · · · · · · · ·Atula · 3.3 L · · · · · · · · · · · · · · · · · · · · · · · · · · · · · · ·Curtin Springs · 8.3 L · · · · · · · · · · · · · · · · · · · · · · · · · · · · · · ·East Dam · · · · · · · · · · · · · · · · · · · · · · · · · · · · · · · ·Indiana · 6.7 L · · · · · · · · · · · · · · · · · · · · · · · · · · · · · · ·Jervois · 7.6 L · · · · · · · · · · · · · · · · · · · · · · · · · · · · · · ·Jindalee - Mt Everard · · · · · · · · · · · · · · · · · · · · · · · · · · · · · · · ·Kulgera · 8.9 L · · · · · · · · · · · · · · · · · · · · · · · · · · · · · · ·Mount Riddock · 7.0 L · · · · · · · · · · · · · · · · · · · · · · · · · · · · · · ·Ormiston Gorge · 9.0 L ·Owen Springs · 7.4 L · · · · · · · · · · · · · · · · · · · · · · · · · · · · · · ·Papunya · 6.1 L · · · · · · · · · · · · · · · · · · · · · · · · · · · · · · ·Rabbit Flat · · · · · · · · · · · · · · · · · · · · · · · · · · · · · · · ·Territory Grape Farm · 5.0 L · · · · · · · · · · · · · · · · · · · · · · · · · · · · · · ·Trephina Gorge · 4.9 L · · · · · · · · · · · · · · · · · · · · · · · · · · · · · · ·Waite River · 2.9 L · · · · · · · · · · · · · · · · · · · · · · · · · · · · · · ·Wallace Rock Hole · 5.3 L · · · · · · · · · · · · · · · · · · · · · · · · · · · · · · ·Walungurru · · · · · · · · · · · · · · · · · · · · · · · · · · · · · · · ·Watarrka · 5.7 L · · · · · · · · · · · · · · · · ·Woodgreen · 5.8 L · · · · · · · · · · · · · · · · · · · · · · · · · · · · · · ·Yuendumu · 7.3 L · · · · · · · · · · · · · · · · · · · · · · · · · · · · · · ·Yulara Aero · 4.8 L · · · · · · · · · · · · · · · · · · · · · · · · · · · · · · ·
Monthly Weather Review Northern Territory August 2012
page 16