montney hydrodynamics and geothermics · montney hydrodynamics and geothermics ... regional...
TRANSCRIPT
Montney Hydrodynamics and Geothermics Impact on EUR’s
Presented by:
Kaush Rakhit, M.Sc. P.Geol
Mark Lenko, B.Sc., M.A., P.Eng.
May 28, 2015

Canadian Discovery Ltd.
Advisors to the Resource Sector. . . Leading with Ideas! Innovative, client-driven E&P solutions since 1987.
• Over 300 clients worldwide, from juniors to super-majors • 70+ interdisciplinary staff, including 50 technical professionals • A long history of research and development • Independent, third-party analysis and business-oriented solutions • Three service-oriented divisions: Data, Intelligence, Expertise
www.canadiandiscovery.com
Agenda
• The Big Hydro Picture
Where were we 7 years ago
Regional geologic framework
The Deep Basin Model
Hydrodynamics
Geothermics
• Engineering Overview – Impact on EUR’s
Subdivision of the Montney based on hydrodynamic and geologic data into typeable areas
Technology, cost and operator outcomes at Kakwa-Karr

BACK IN 2008
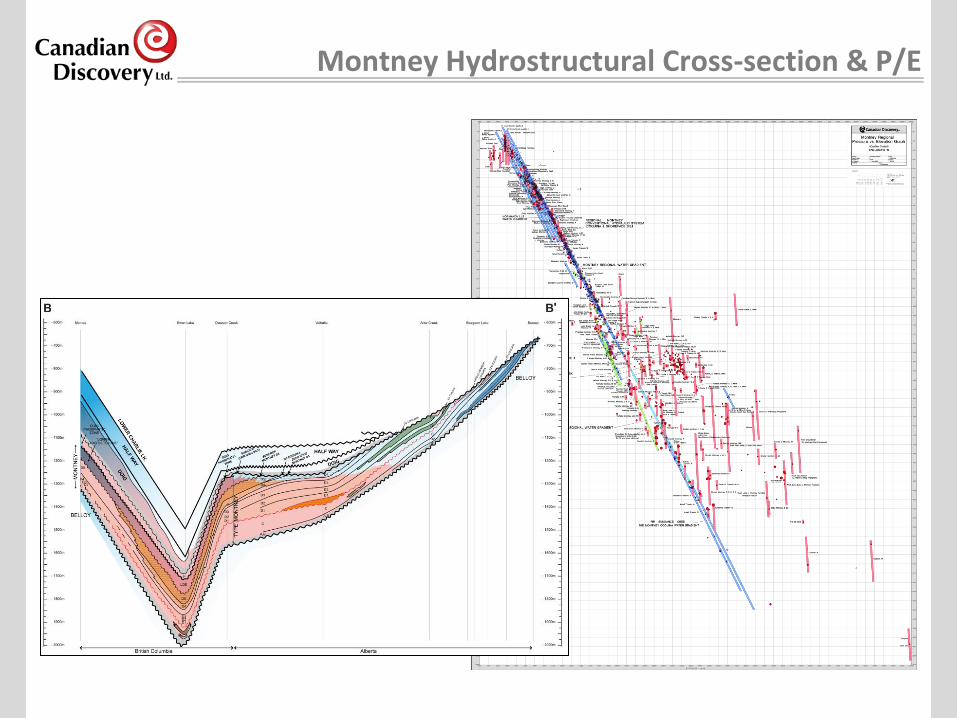
Montney Hydrostructural Cross-section & P/E
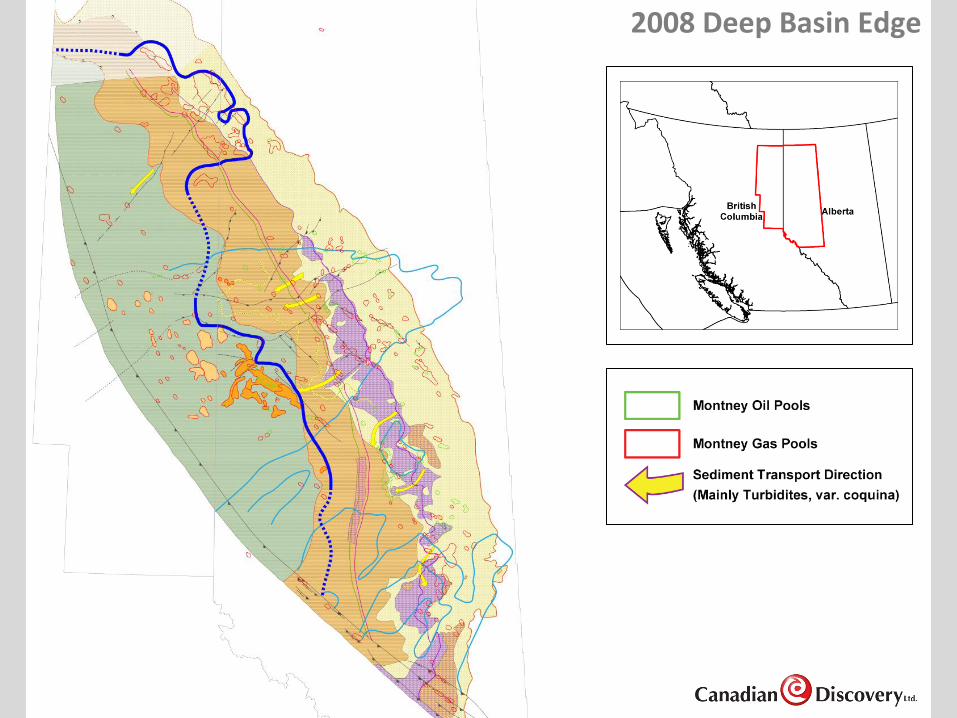
2008 Deep Basin Edge
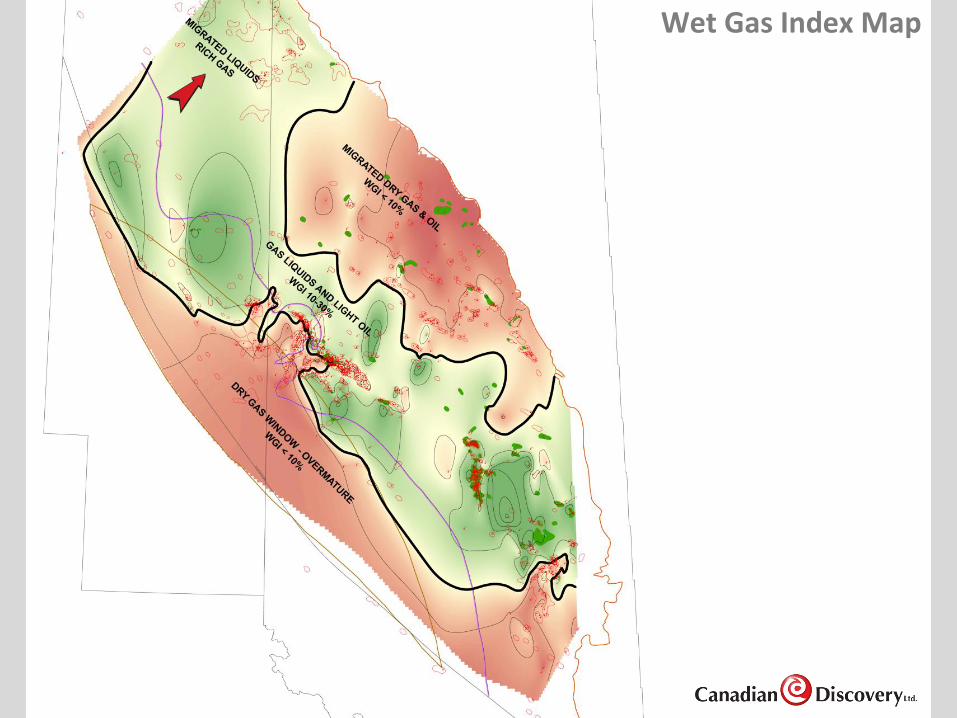
Wet Gas Index Map

SIMPLIFIED GEOLOGIC MODEL
(if you can’t beat them join them)
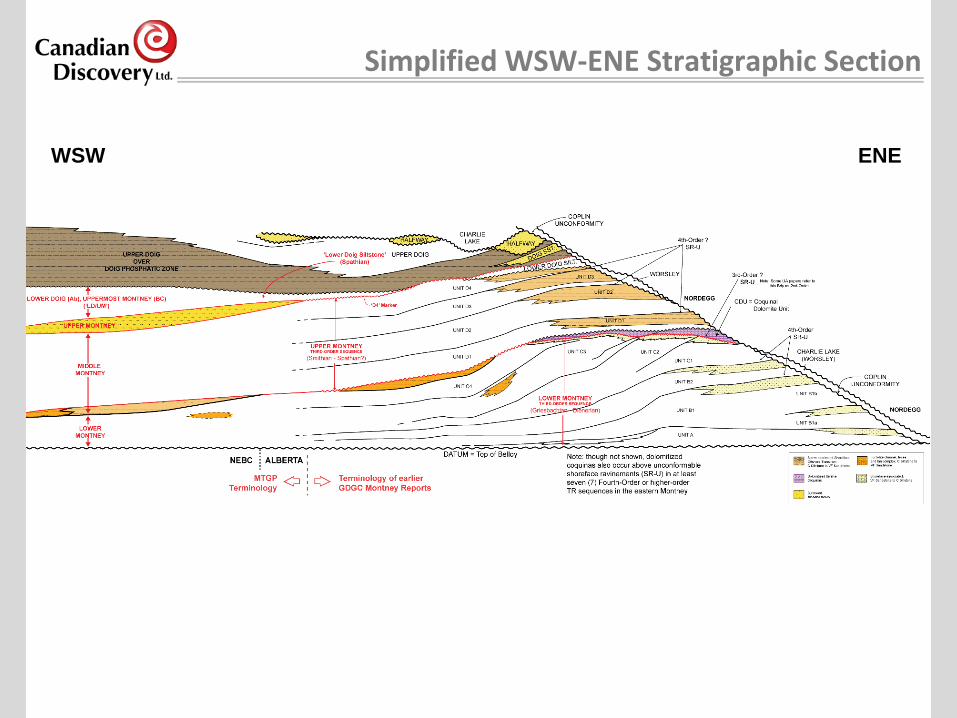
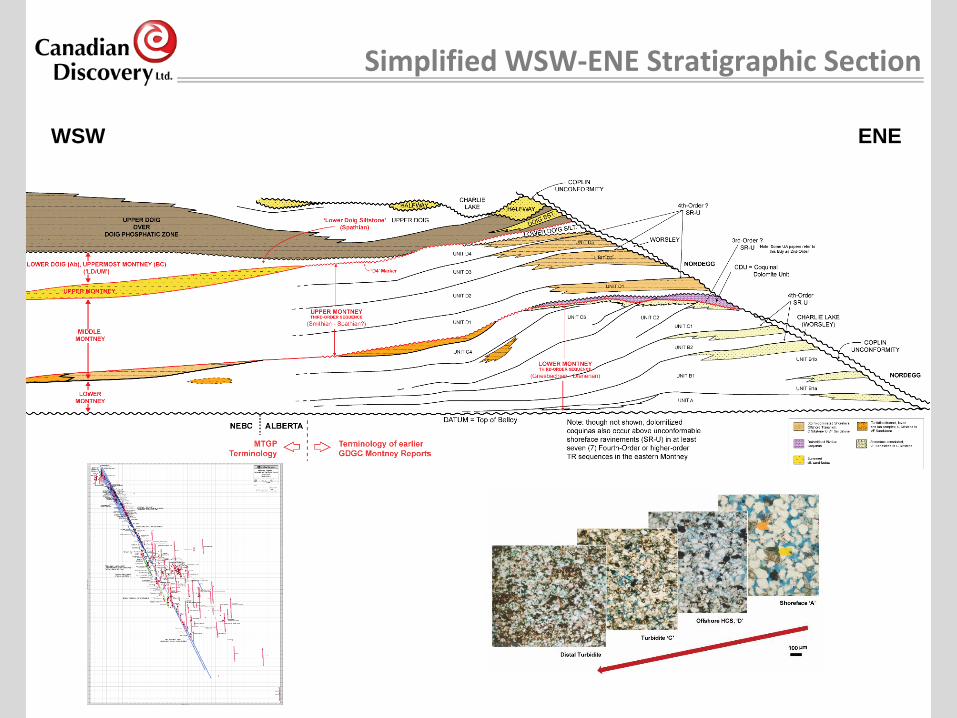
Simplified WSW-ENE Stratigraphic Section
WSW ENE
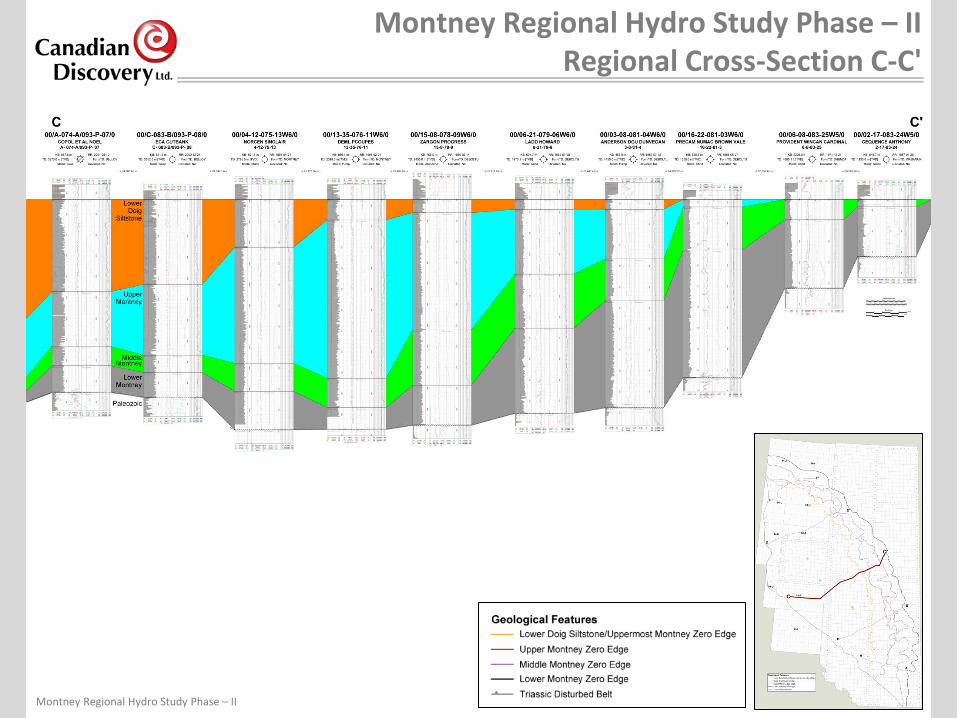
Montney Regional Hydro Study Phase – II Regional Cross-Section C-C'
Montney Regional Hydro Study Phase – II

Lower Montney Isopach
MONTNEY SPOTTER
HYDRODYNAMICS
(but first, a little theory)
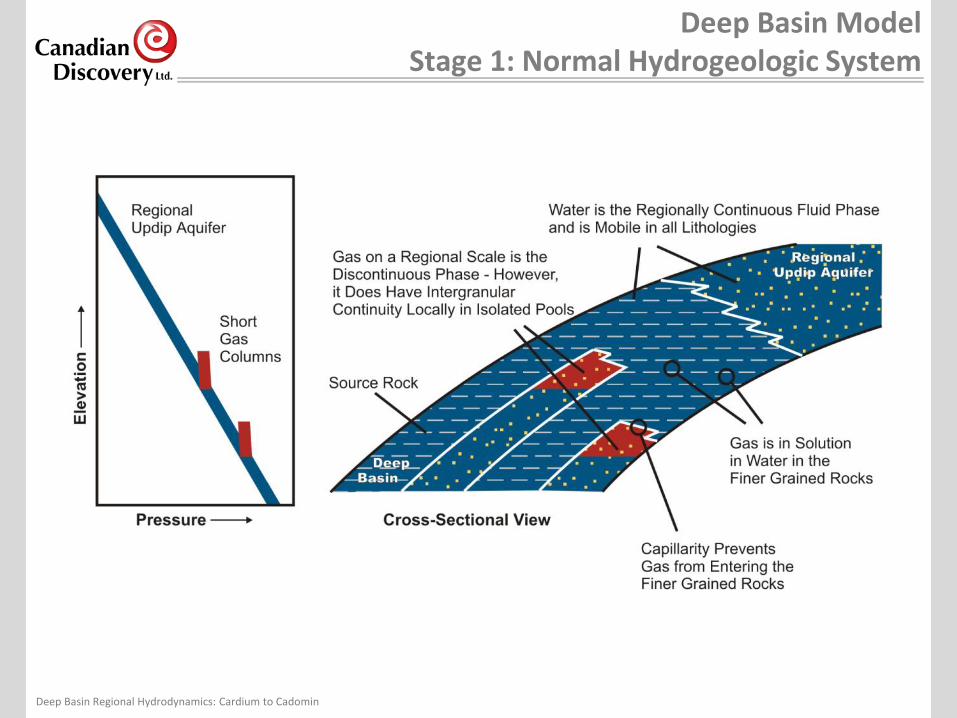
Deep Basin Model Stage 1: Normal Hydrogeologic System
Deep Basin Regional Hydrodynamics: Cardium to Cadomin
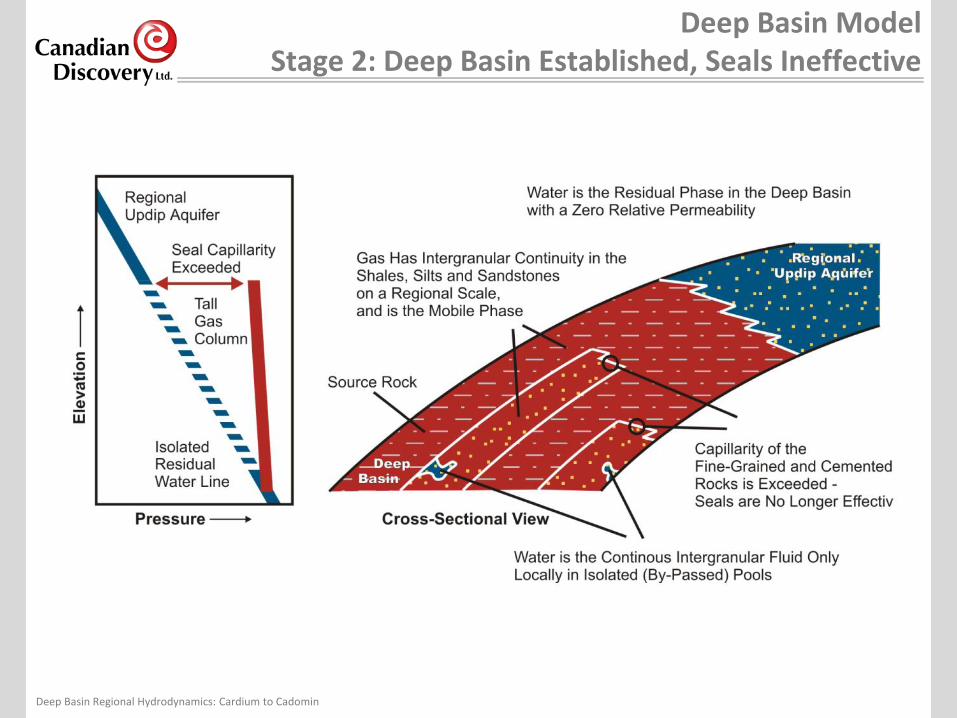
Deep Basin Model Stage 2: Deep Basin Established, Seals Ineffective
Deep Basin Regional Hydrodynamics: Cardium to Cadomin
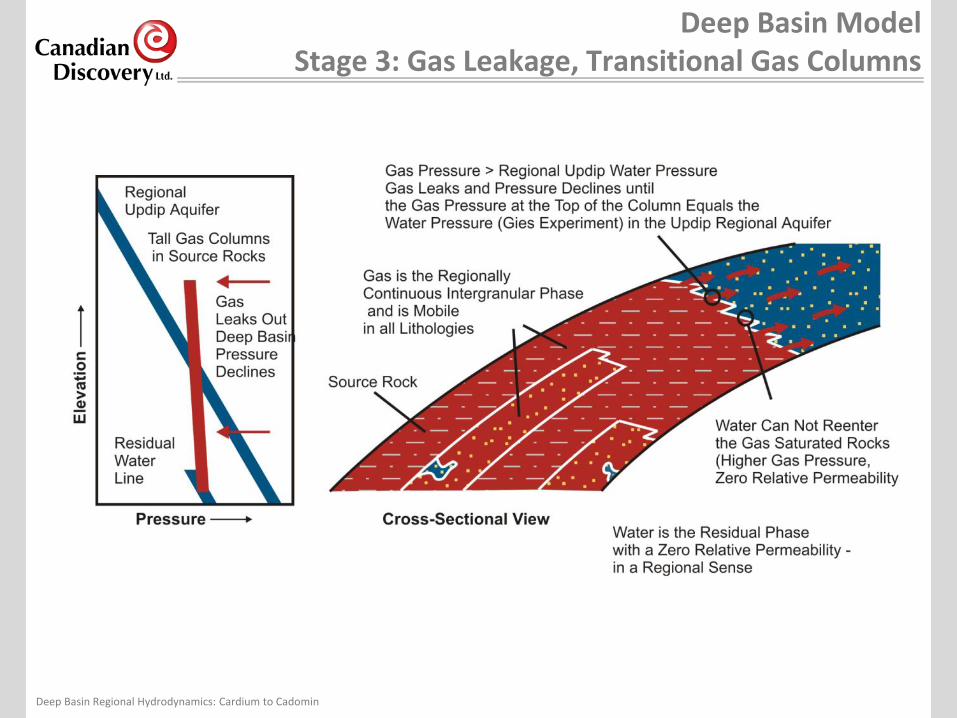
Deep Basin Model Stage 3: Gas Leakage, Transitional Gas Columns
Deep Basin Regional Hydrodynamics: Cardium to Cadomin
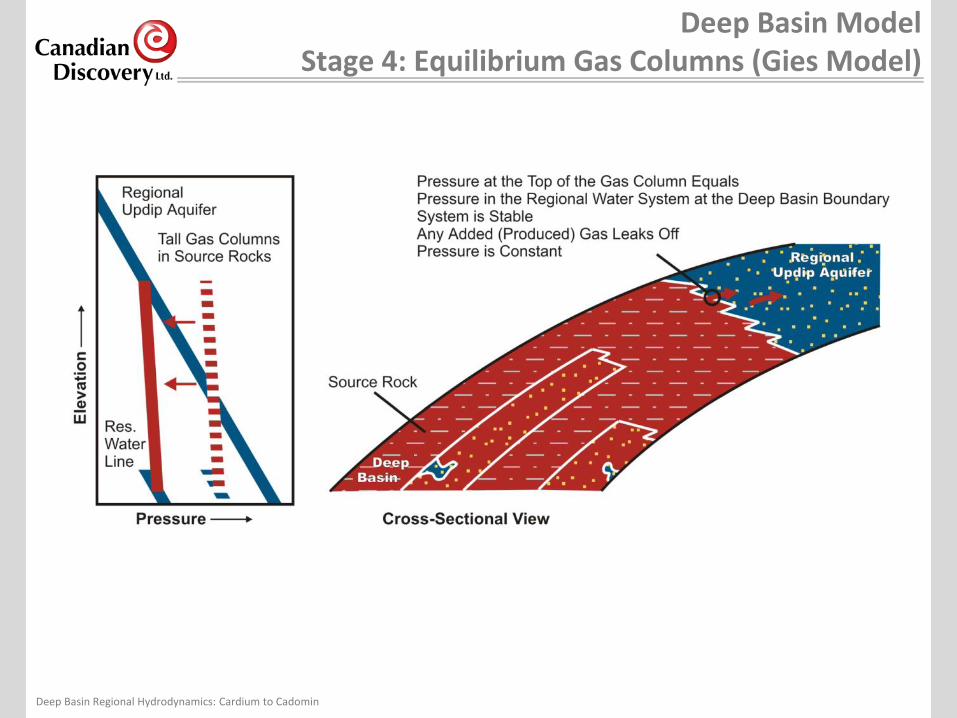
Deep Basin Model Stage 4: Equilibrium Gas Columns (Gies Model)
Deep Basin Regional Hydrodynamics: Cardium to Cadomin

Deep Basin Model High and Low Pressure Trends
Deep Basin Regional Hydrodynamics: Cardium to Cadomin
Simplified WSW-ENE Stratigraphic Section
WSW ENE
HYDRODYNAMICS
(a pictorial essay)
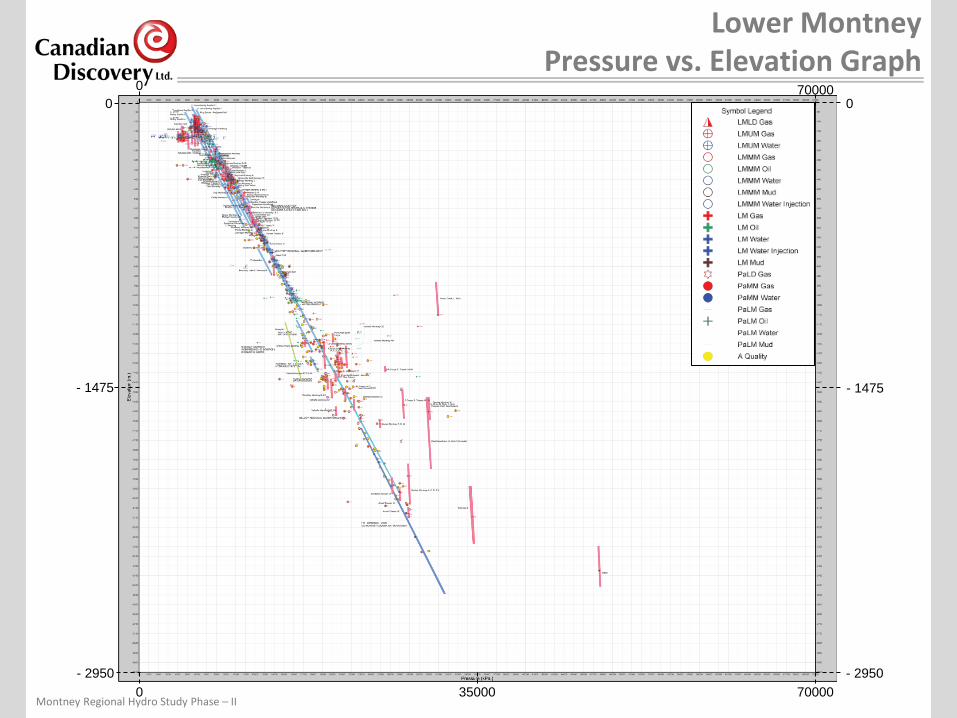
Lower Montney Pressure vs. Elevation Graph
Montney Regional Hydro Study Phase – II 70000
- 2950
0
- 2950
70000 0 0
0
35000
- 1475 - 1475
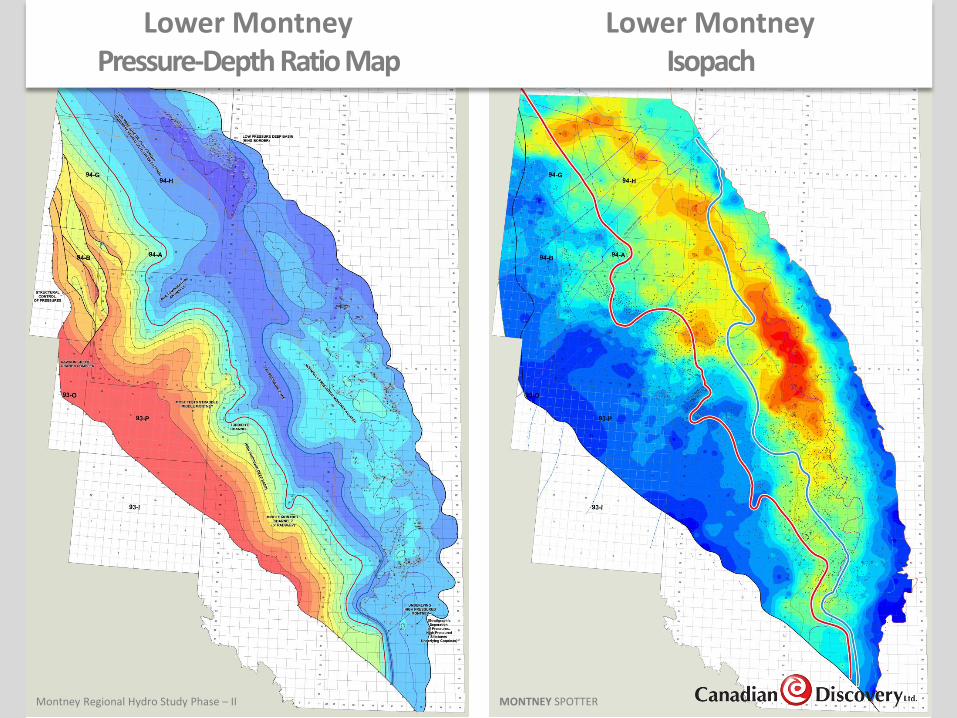
Montney Regional Hydro Study Phase – II
Lower Montney Isopach
Lower Montney Pressure-Depth Ratio Map
MONTNEY SPOTTER
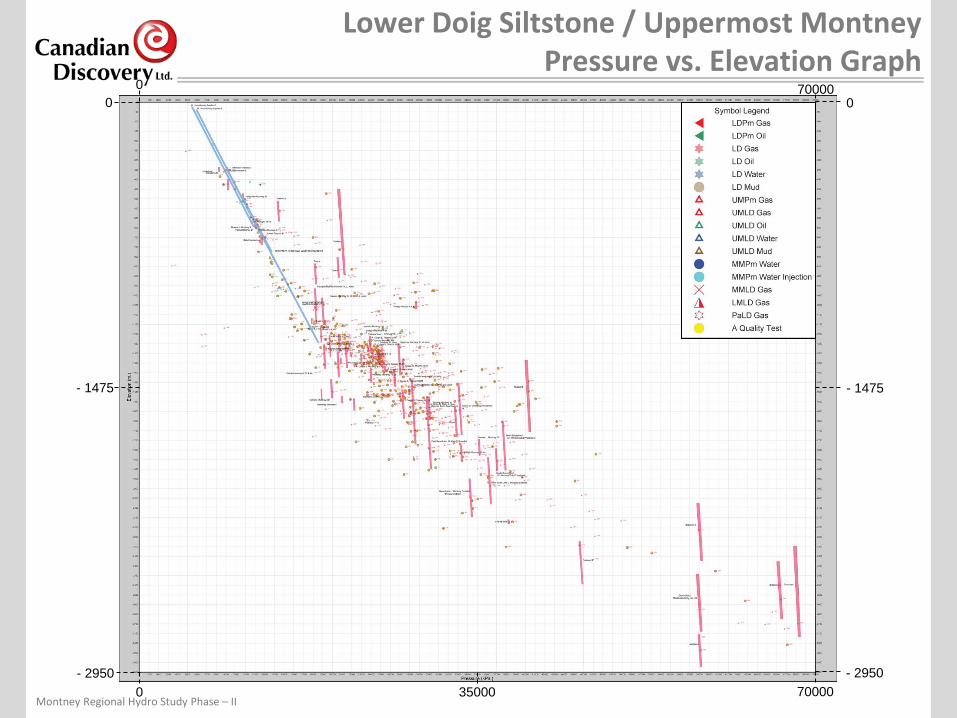
Lower Doig Siltstone / Uppermost Montney Pressure vs. Elevation Graph
Montney Regional Hydro Study Phase – II 70000
- 2950
0
- 2950
70000 0 0
0
35000
- 1475 - 1475
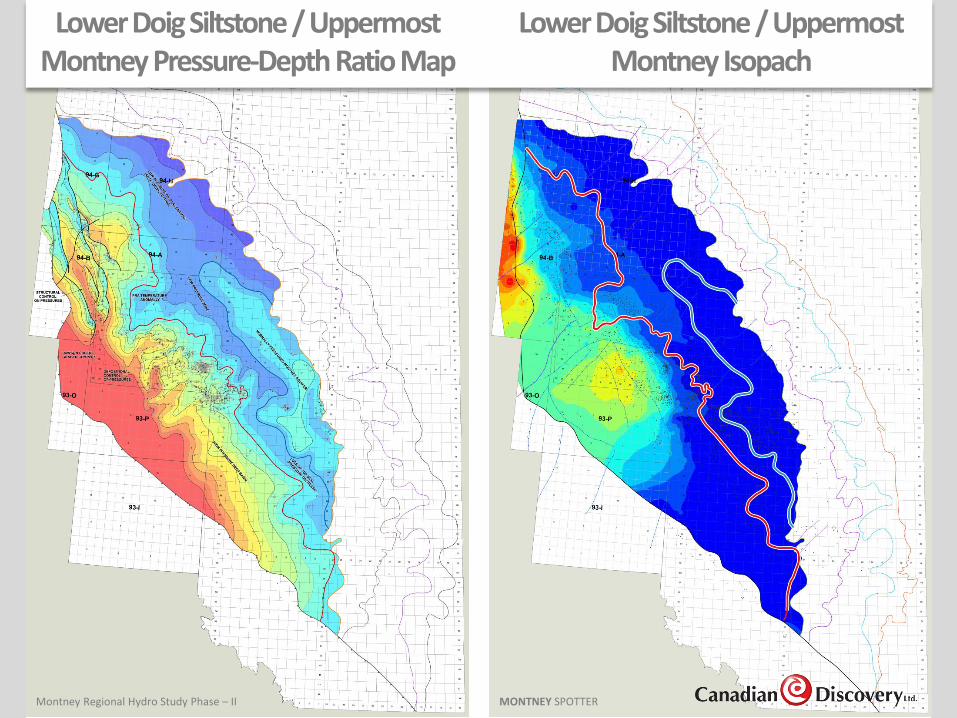
Lower Doig Siltstone / Uppermost Montney Pressure-Depth Ratio Map
Montney Regional Hydro Study Phase – II
Lower Doig Siltstone / Uppermost Montney Isopach
Lower Doig Siltstone / Uppermost Montney Pressure-Depth Ratio Map
MONTNEY SPOTTER

GEOTHERMICS
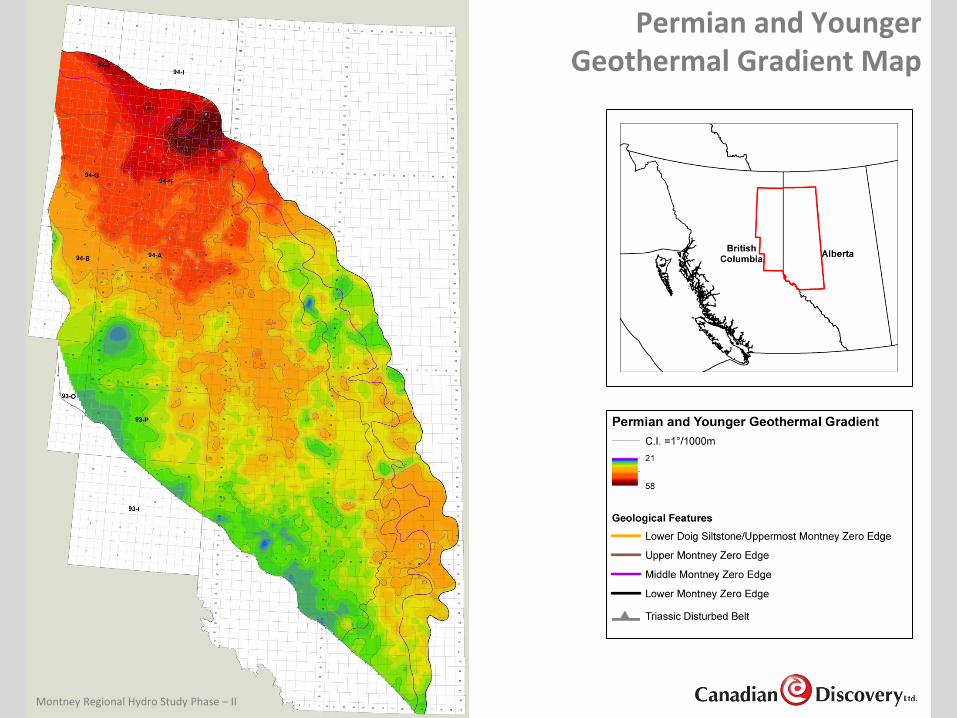
Permian and Younger Geothermal Gradient Map
Montney Regional Hydro Study Phase – II
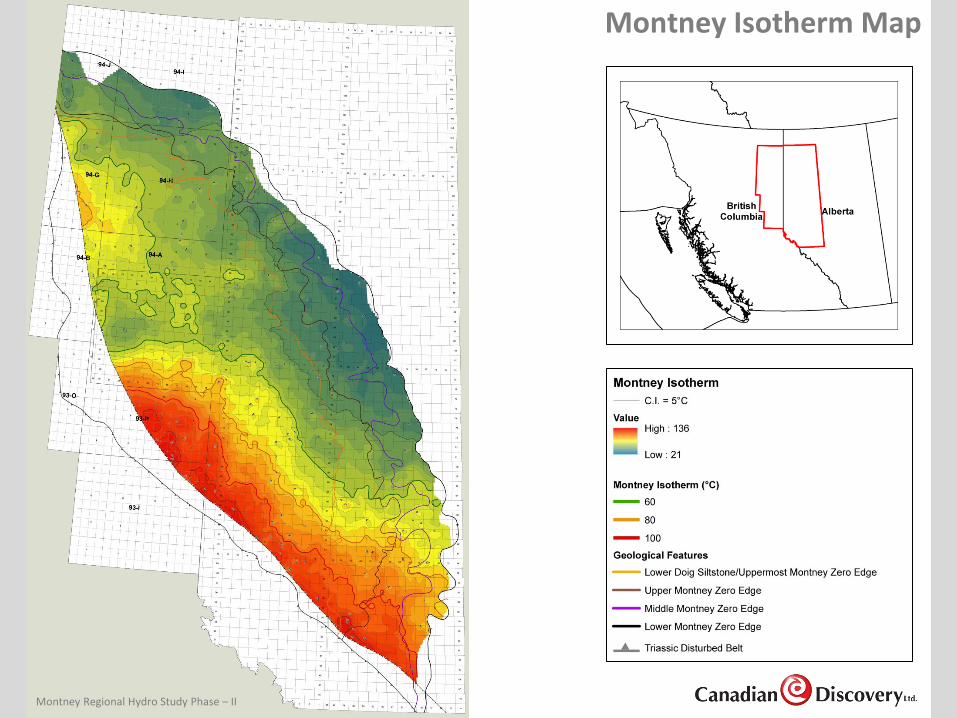
Montney Isotherm Map
Montney Regional Hydro Study Phase – II
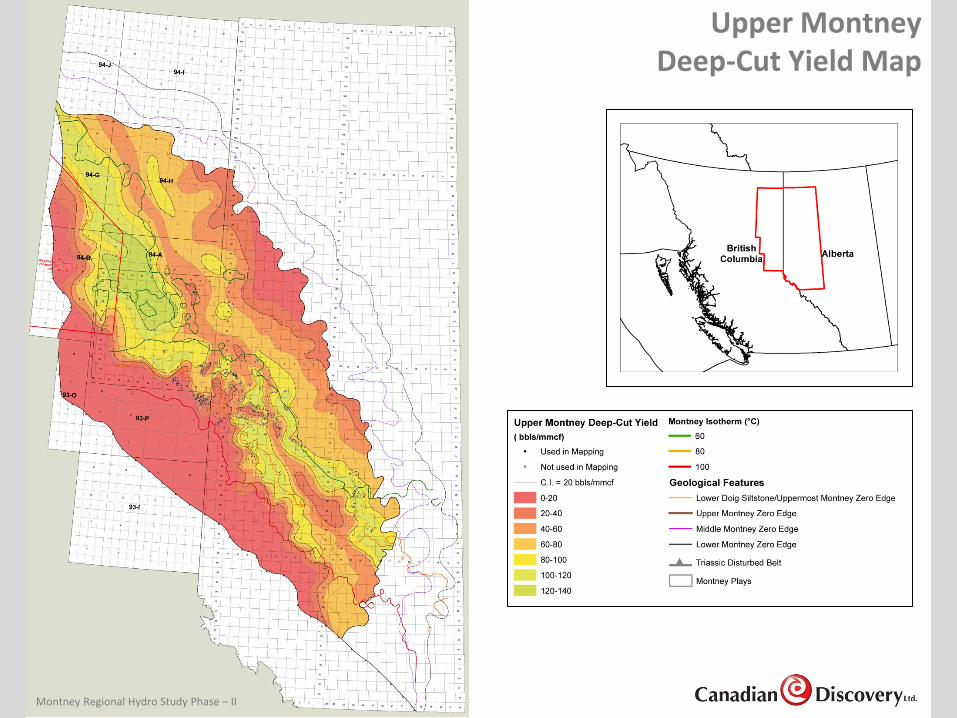
Upper Montney Deep-Cut Yield Map
Montney Regional Hydro Study Phase – II
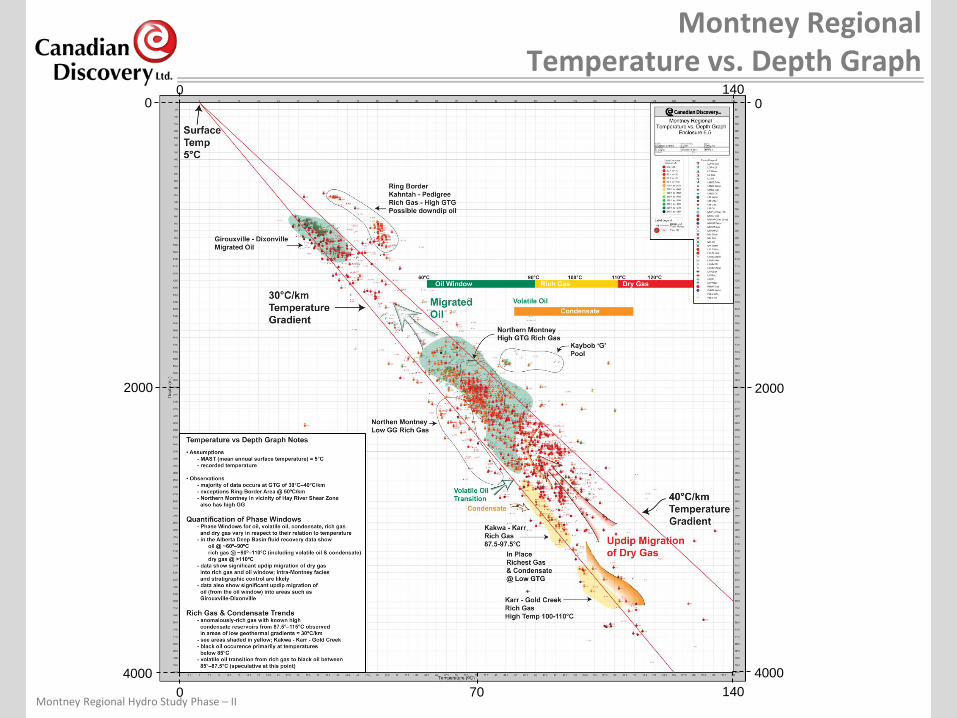
Montney Regional Temperature vs. Depth Graph
Montney Regional Hydro Study Phase – II 140
4000
0
4000
140 0 0
0
70
2000 2000

Engineering Overview Information into Actionable Outcomes
Presented by:
Mark Lenko
Agenda
1. Montney Domain Areas
Parameters
2. Type Curves
Methodology
3. Focus Areas
Kakwa-Karr
Beg
Swan-Elmworth
Stoddart
4. Spotter Analysis
Diving Deep
5. Estimated Ultimate Reserves
Overview
Montney Domain Areas
Not all Montney is Created Equally
• The Montney resource play covers approximately 130,000 km2 stretching from west central Alberta to NE British Columbia.
• There are more than 4,100 horizontal wells with multi-stage completions within the Montney.
CDL has defined three key parameters
• Geological Facies
• Reservoir Temperature
• Reservoir Pressure
Basis of Comparison
• Segregating the Montney into 26 discrete domains or pods makes an effective basis of comparison

Domain Parameters
• CDL has identified 4 distinct geological facies
Shoreface
Coquina
D5 Subcrop
Distal Facies
• Reservoir temperature has 4 regimes
< 60 ⁰C
60-80 ⁰C
80-100 ⁰C
>100 ⁰C
• Reservoir pressure has 6 regimes
Deep Basin
• < 8 kPa/m
• 8-10 kPa/m
• 10-12 kPa/m
• > 12 kPa/m
Aquifer
• < 8 kPa/m
• 8-10 kPa/m
The domain parameters determine what type of production be predominant in an area: dry gas, liquids-rich gas & condensate, liquids-rich gas or oil.
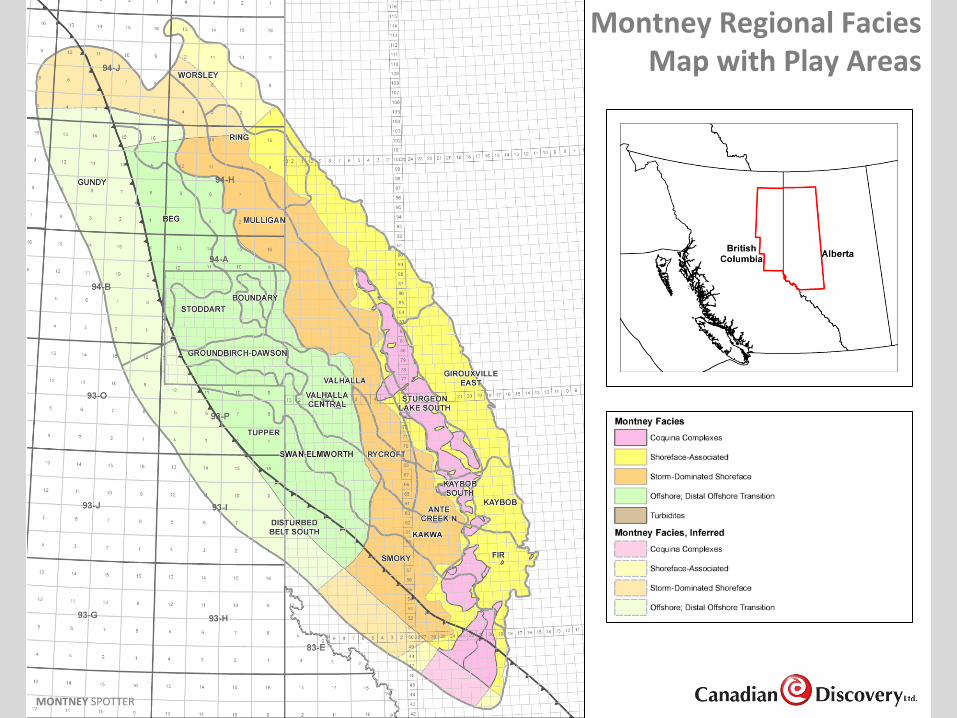
Montney Regional Facies Map with Play Areas
MONTNEY SPOTTER
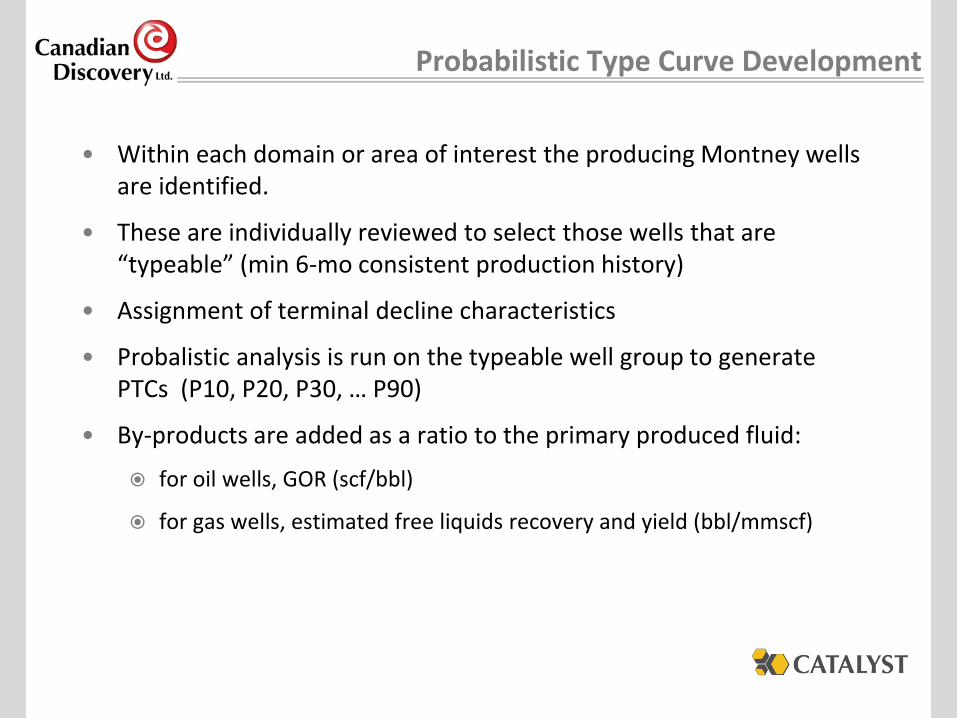
Probabilistic Type Curve Development
• Within each domain or area of interest the producing Montney wells are identified.
• These are individually reviewed to select those wells that are “typeable” (min 6-mo consistent production history)
• Assignment of terminal decline characteristics
• Probalistic analysis is run on the typeable well group to generate PTCs (P10, P20, P30, … P90)
• By-products are added as a ratio to the primary produced fluid:
for oil wells, GOR (scf/bbl)
for gas wells, estimated free liquids recovery and yield (bbl/mmscf)
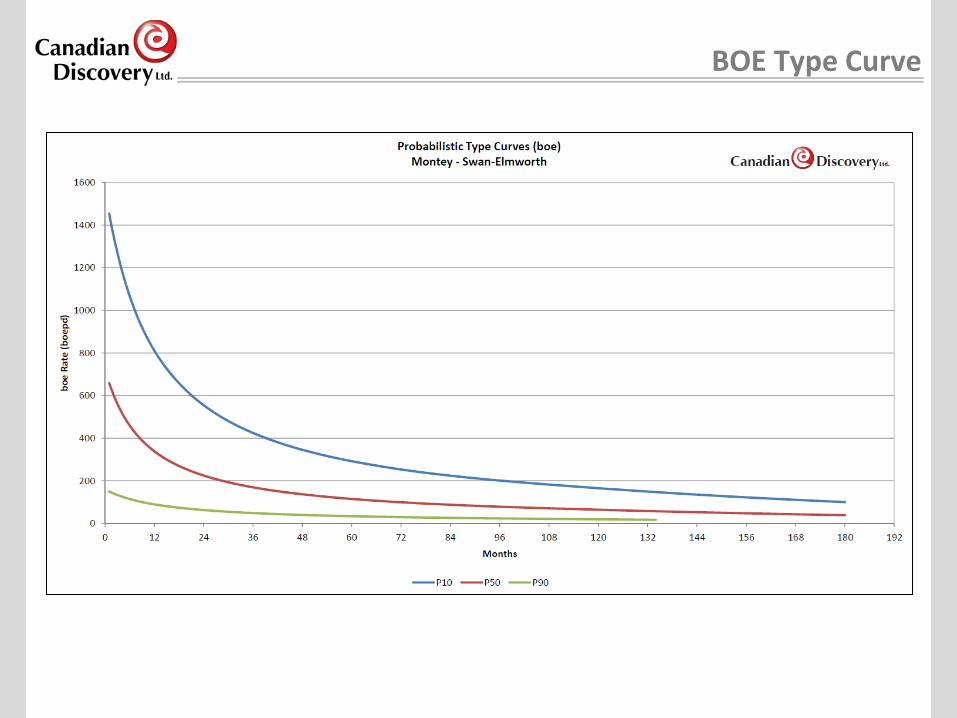
BOE Type Curve
• Boe type curve
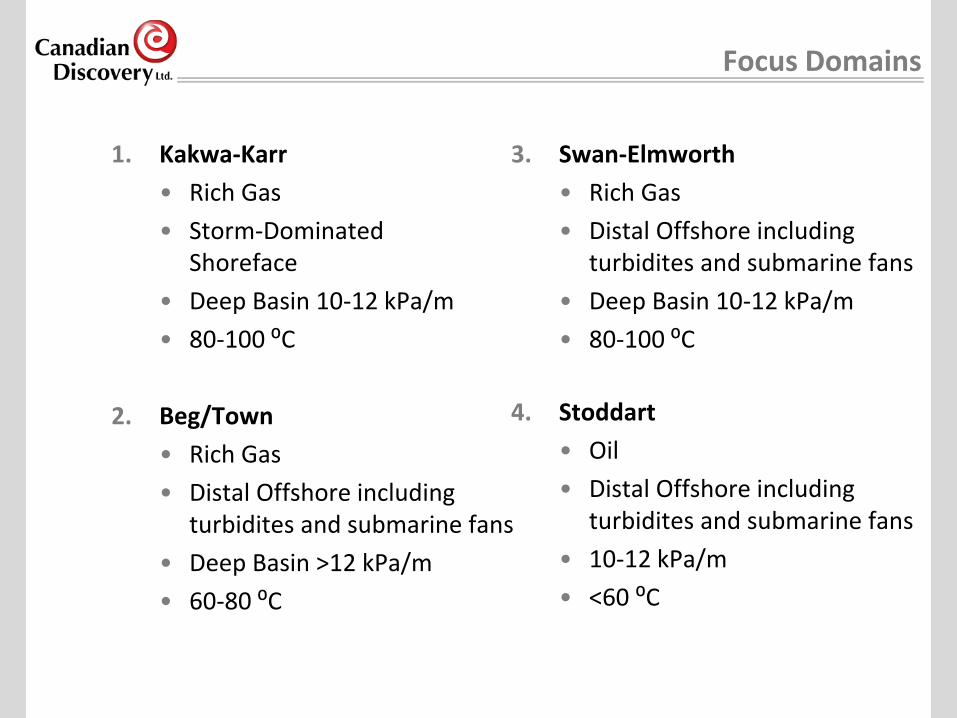
Focus Domains
1. Kakwa-Karr
• Rich Gas
• Storm-Dominated Shoreface
• Deep Basin 10-12 kPa/m
• 80-100 ⁰C
2. Beg/Town
• Rich Gas
• Distal Offshore including turbidites and submarine fans
• Deep Basin >12 kPa/m
• 60-80 ⁰C
3. Swan-Elmworth
• Rich Gas
• Distal Offshore including turbidites and submarine fans
• Deep Basin 10-12 kPa/m
• 80-100 ⁰C
4. Stoddart
• Oil
• Distal Offshore including turbidites and submarine fans
• 10-12 kPa/m
• <60 ⁰C
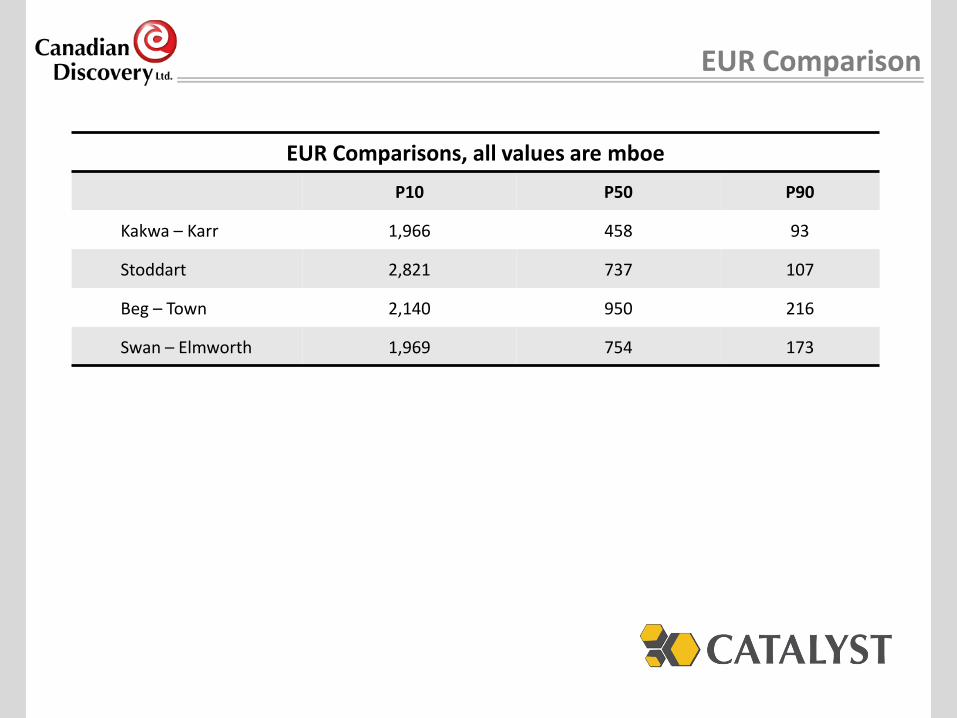
EUR Comparison
EUR Comparisons, all values are mboe
P10 P50 P90
Kakwa – Karr 1,966 458 93
Stoddart 2,821 737 107
Beg – Town 2,140 950 216
Swan – Elmworth 1,969 754 173

Montney EURs
• CDL has forecast EURs for each Montney producer
• A type curve is appended to the last stable production from each well
• Forecast is run out to terminal rate
• Highlights areas of best expected performance
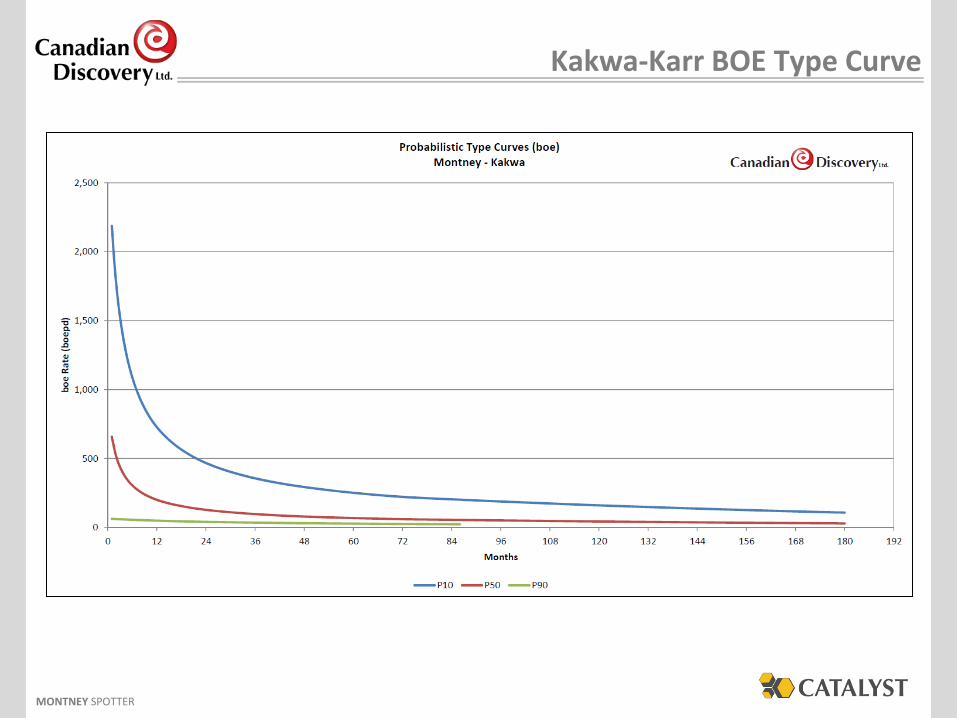
Kakwa-Karr BOE Type Curve
MONTNEY SPOTTER
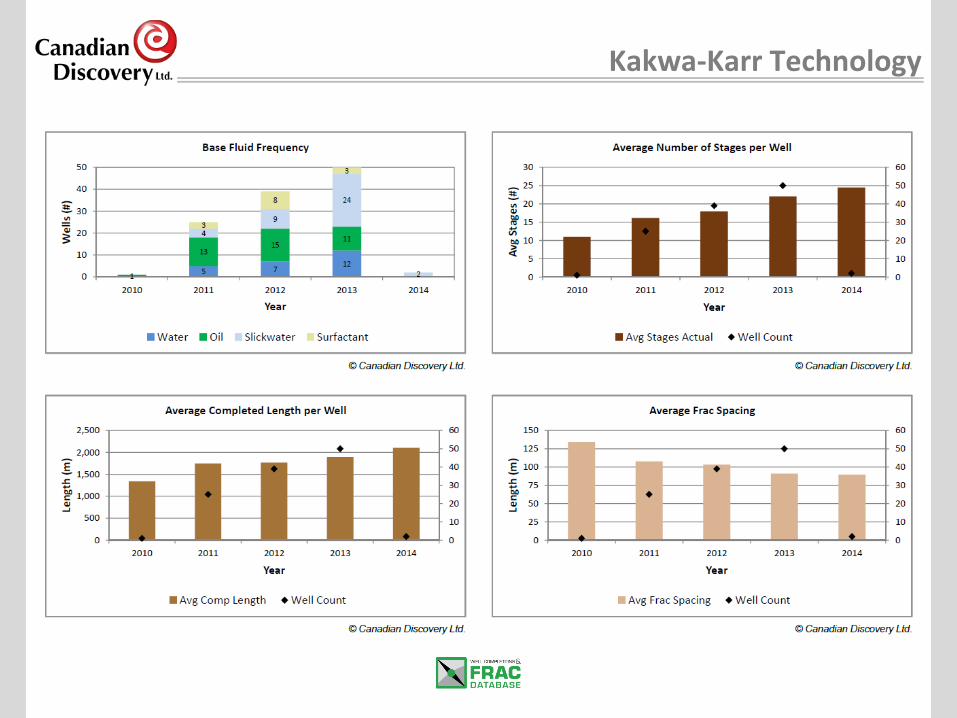
Kakwa-Karr Technology
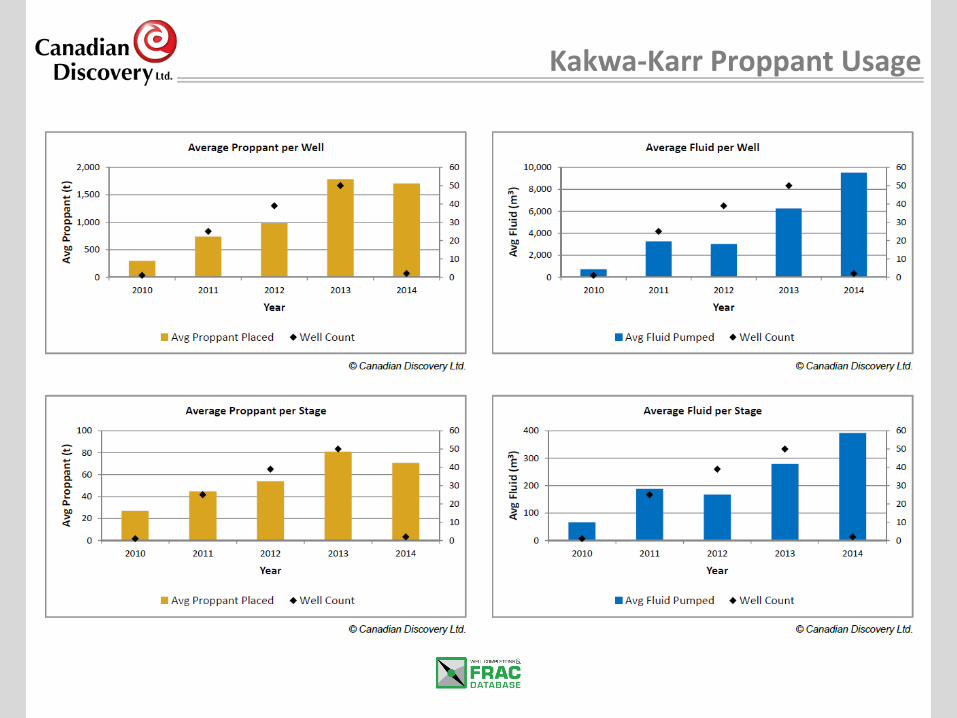
Kakwa-Karr Proppant Usage
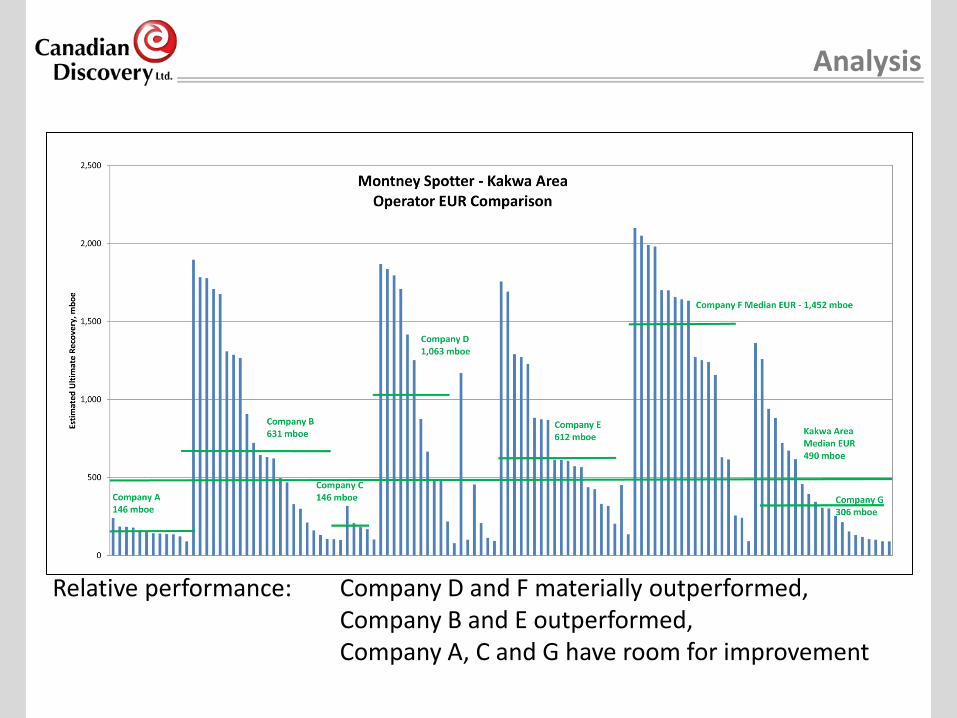
Analysis
Relative performance: Company D and F materially outperformed, Company B and E outperformed, Company A, C and G have room for improvement
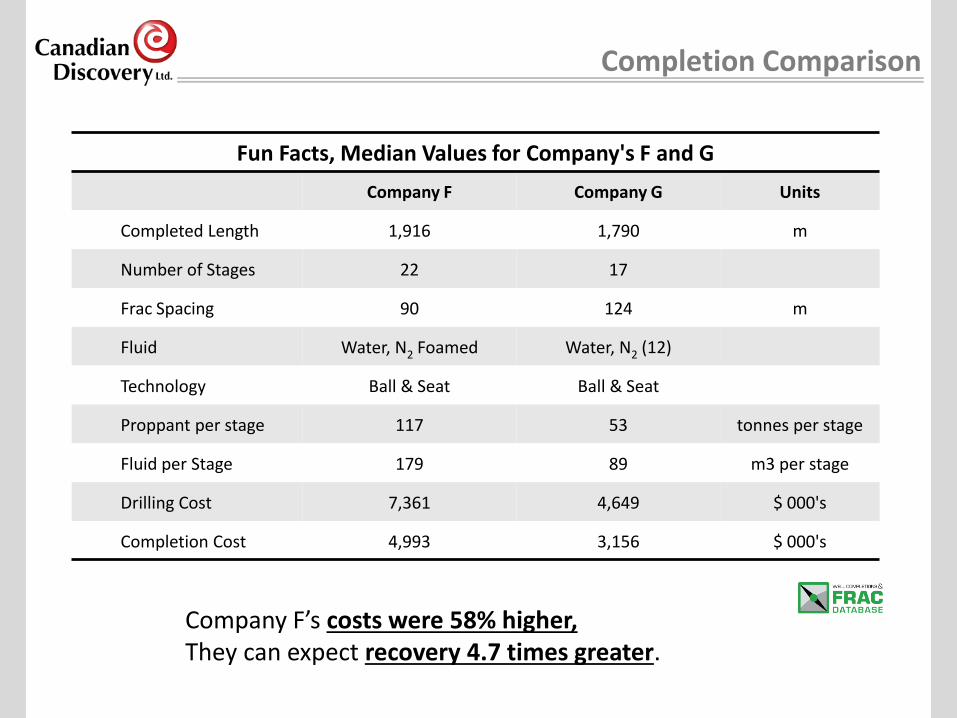
Completion Comparison
Fun Facts, Median Values for Company's F and G
Company F Company G Units
Completed Length 1,916 1,790 m
Number of Stages 22 17
Frac Spacing 90 124 m
Fluid Water, N2 Foamed Water, N2 (12)
Technology Ball & Seat Ball & Seat
Proppant per stage 117 53 tonnes per stage
Fluid per Stage 179 89 m3 per stage
Drilling Cost 7,361 4,649 $ 000's
Completion Cost 4,993 3,156 $ 000's
Company F’s costs were 58% higher, They can expect recovery 4.7 times greater.
Actionable Analysis
Rigorous type curve development and reliable EUR data combined with detailed completion information provides operators with parameters to adjust programs and materially improve results.
MONTNEY SPOTTER
Information into Actionable Outcomes

Want more on this topic?
CDL’s Montney Spotter has continuously updated play metrics and geology, including EURs.
The in-depth Montney Hydrodynamics Project offers key perspectives.
www.canadiandiscovery.com
Questions / Comments?