montreal protocol on substances that deplete...
TRANSCRIPT

MONTREAL PROTOCOL
ON SUBSTANCES THAT DEPLETE
THE OZONE LAYER
UNEP
Technology and Economic Assessment Panel
SUPPLEMENT TO THE
IPCC/ TEAP REPORT
November 2005


iii
SUPPLEMENT TO THE
IPCC/ TEAP REPORT
November 2005

iv
DISCLAIMER The United Nations Environment Programme (UNEP), the Technology and Economic Assessment Panel (TEAP) co-chairs and members, the Technical and Economic Options Committee, chairs, co-chairs and members, the TEAP Task Forces co-chairs and members, and the companies and organisations that employ them do not endorse the performance, worker safety, or environmental acceptability of any of the technical options discussed. Every industrial operation requires consideration of worker safety and proper disposal of contaminants and waste products. Moreover, as work continues - including additional toxicity evaluation - more information on health, environmental and safety effects of alternatives and replacements will become available for use in selecting among the options discussed in this document. UNEP, the TEAP co-chairs and members, the Technical and Economic Options Committee, chairs, co-chairs and members, and the Technology and Economic Assessment Panel Task Forces co-chairs and members, in furnishing or distributing the information that follows, do not make any warranty or representation, either express or implied, with respect to the accuracy, completeness, or utility; nor do they assume any liability of any kind whatsoever resulting from the use or reliance upon any information, material, or procedure contained herein. The text of this report is composed in Times New Roman. Co-ordination: TEAP and its TFSRS Task Force Composition: Lambert Kuijpers Reproduction: UNON Nairobi Date: November 2005 ISBN: 92-807-2733-8 ACKNOWLEDGEMENTS The UNEP Technology and Economic Assessment Panel and the Task Force on the Supplement to the Special Report (TFSRS) co-chairs and members wish to express thanks to all who contributed from governments, both Article 5(1) and non-Article 5(1), to IPCC members in their personal capacity, and to a number of individuals involved in Protocol issues, without whose involvement this supplementary report to the original assessment would not have been possible. The opinions expressed are those of the Panel and its Task Forces and do not necessarily reflect the reviews of any sponsoring or supporting organisation.

v
Table of Contents EXECUTIVE SUMMARY ........................................................................................................................VII
1 INTRODUCTION.....................................................................................................................................1 1.1 REMIT .................................................................................................................................................1 1.2 TASK FORCE .......................................................................................................................................2 1.3 THE STRUCTURE OF THE REPORT ........................................................................................................2
2 DESCRIPTION OF SECTORS, EMISSION SOURCES AND METHODS OF ASSESSMENT .....5 2.1 SECTORS AND SOURCES.......................................................................................................................5 2.2 BOTTOM-UP METHODS AND THE CHALLENGE OF ASSESSING ACTIVITY DATA .......................................8 2.3 ATMOSPHERIC CONCENTRATIONS AND DERIVED EMISSIONS (IPCC TEAP, 2005) .............................11
3 DEMAND, BANKS AND EMISSIONS IN A BAU SCENARIO, HISTORIC DATA AND 2015 EMISSIONS ............................................................................................................................................15 3.1 ASSUMPTIONS BAU SCENARIO .........................................................................................................15 3.2 DEMAND, BANKS AND EMISSIONS PER SUBSTANCE AND PER SECTOR .................................................15
3.2.1. General observations .................................................................................................................15 3.2.2 Specific observations related to the 2002 banks .......................................................................20 3.2.3 2015 Business-As-Usual projections for banks ..........................................................................20 3.2.4 2015 Business-As-Usual projections for emissions....................................................................21
4 DEMAND, BANKS AND EMISSIONS IN A MIT SCENARIO, COMPARISON OF 2015 BAU AND MIT.................................................................................................................................................27 4.1 ASSUMPTIONS MIT SCENARIO ..........................................................................................................27 4.2 DEMAND, BANKS AND EMISSIONS PER SUBSTANCE AND PER SECTOR .................................................27
4.2.1 Difference between 2015 Business-As-Usual and Mitigation projections for banks..................27 4.2.2 Difference between 2015 Business-As-Usual and Mitigation projections for emissions............29 4.2.3 Graphical presentation of the 2015 Business-As-Usual and Mitigation projections for banks
and emissions .............................................................................................................................30 5 MITIGATION COSTS...........................................................................................................................35
5.1 INTRODUCTION .................................................................................................................................35 5.2 DESCRIPTION OF MITIGATION COSTS FOR THE REFRIGERATION/AC SECTOR.......................................37 5.3 DESCRIPTION OF MITIGATION COSTS FOR THE FOAM SECTOR .............................................................38 5.4 DESCRIPTION OF MITIGATION COSTS FOR HALON SECTOR ..................................................................39
6 IMPACTS ON OZONE LAYER RECOVERY ...................................................................................41
7 DISCREPANCIES BETWEEN EMISSIONS DETERMINED FROM BOTTOM-UP METHODS AND FROM ATMOSPHERIC MEASUREMENTS......................................................47 7.1 SOURCES OF UNCERTAINTY REGARDING CONSUMPTION.....................................................................47 7.2 SOURCES OF UNCERTAINTY REGARDING EMISSION FACTORS..............................................................49 7.3 RECONCILING THE DISCREPANCIES....................................................................................................51
8 CONCLUDING REMARKS..................................................................................................................53
9 REFERENCES........................................................................................................................................55
10 ANNEXES ...............................................................................................................................................57 KEY TO THE TABLES DETAILED TABLES ON DEMAND, BANKS AND EMISSION DATA 2002-2015 GRAPHS ON DEMAND, BANKS AND EMISSION DATA 2002-2015


vii
Executive Summary At the twenty-fifth meeting of the Open-ended Working Group (Montreal, 27-30 June, 2005), the EC, Norway, New Zealand and UK tabled a paper containing two proposals, which were endorsed by the Open-ended Working Group: To recommend that further consideration of the IPCC/TEAP Special
Report is placed on the agenda for the Seventeenth Meeting of the Parties. To request TEAP to provide, by 31 October 2005, a supplementary report
to the Seventeenth Meeting of the Parties that elaborates clearly the ozone depletion implications of the issues raised in the Special Report. In particular, the report should estimate current and projected levels of ozone-depleting substances contained and emitted from banks, expressed as ODP tonnes; project atmospheric concentrations of ozone-depleting substances under the "Mitigation" and “Business as Usual” scenarios that appear in the Special Report, and their associated impact on the ozone layer; estimate costs of mitigation measures described in the report in cost per ODP tonne.
Chlorofluorocarbons (CFCs), halons, and hydrochlorofluorocarbons (HCFCs) being phased out under the Montreal Protocol contribute to ozone depletion and climate change, while hydrofluorocarbons (HFCs) and perfluorocarbons (PFCs) controlled under the United Nations Framework Convention on Climate Change and its Kyoto Protocol contribute only to climate change. About 20% of ODSs have been or are being replaced with hydrofluorocarbons, which generally have Global Warming Potentials (GWPs) that are significantly lower than the GWPs of the ODSs they replace and are in many cases better contained and more likely to be recovered during servicing or at end-of-life. The IPCC/TEAP Special Report describes the banks and emissions in all relevant sectors in kg CO2 equivalent, this being the typical way emissions are considered for determining global warming impacts. This Supplement to the Special Report more clearly presents the impacts on the ozone layer from the viewpoint of emissions reductions, expressed in ODP tonnes. The scope of the Special Report itself is limited to the sectors and applications that have used HFCs or PFCs as substitutes for ODSs. Since HFCs have only been used to replace approximately 20% of the previous ODS consumption, and PFC use has been limited to a minority of specialist applications, there are some former ODS-consuming sectors that have used little or no HFCs and hence are not included within the scope of the Special Report. This means that historic emissions of ODSs, assessed by using bottom-up methods per sector in the Special Report, do not represent a complete assessment of the historic ODS emissions. Accordingly, there is an inevitable systematic error

viii
arising from comparison with emissions derived from atmospheric measurements. However, the applications in which ODS banks have been generated (fire protection, rigid insulating foam, refrigeration and air conditioning) are also those, which have adopted HFCs as significant substitutes and hence are included within the Special Report. This means that bank assessments are likely to be reasonably complete. A further source of systematic error is the lack of information on use patterns of ODSs in Article 5(1) countries, resulting in it being difficult to establish whether emissions in these regions are prompt (less than 1 year) or spread over a longer period. In parallel, random errors can emerge because of, for example, uncertainties over the statistical distribution of life cycles. Most bottom-up models function by using average life-times to determine the likely timing of emissions. Accordingly, random errors can occur, particularly when the assessment period is short (e.g. one year). The results of these uncertainties are that the emissions estimates derived from the aggregation of bottom-up assessments are not always consistent with emissions estimates derived from atmospheric concentrations. However, the use of several sources of information, including bottom-up estimates, reported production and use data, plus atmospheric measurements mean that trends can be clearly established, which give confidence in the information presented in the Special Report and further reported in this Supplement. Additional work will be required to further characterise the sources of these errors in order to further improve confidence levels. The emissions of the major banked chemicals in fire protection, refrigeration and air conditioning equipment occur primarily during the use phase, reflecting the more dynamic nature of the use-phase for such equipment and the need for routine servicing. For rigid insulating foam, emissions are much more focused during initial processing and, particularly, at end-of-life. In all cases, the management of the decommissioning process at end-of-life is a key determinant in ultimate emission levels. The Supplement Report sets out the key elements of the Business-As-Usual (BAU) case used in the Special Report and highlights key differences by sector and by region. The assessment elaborates the fact that current ODS recovery rates vary significantly by sector and that, within a given sector, recovery rates tend to be significantly lower in Article 5(1) countries than in non-Article 5(1) countries. This assessment reveals that, in ODP tonnage terms, 70% (1,820 ODP ktonnes) of all banked CFC and HCFC chemicals (excluding halons) were situated in non-Article 5(1) countries in 2002. With the ongoing emission of

ix
ozone depleting substances in the period until 2015, all banks are expected to decrease. There is a huge amount of chemicals banked in foams in non-Article 5(1) countries. Because of the more rapid emissions from refrigeration and air conditioning equipment and the lack of slower emitting foams in Article 5(1) countries, the proportion of the global bank in non-Article 5(1) countries is therefore expected to increase in ODP terms by 2015 (to 75% or about 1,660 ODP ktonnes). Nevertheless, the total, global, ODS bank is expected to dcrease from 2,600 ODP ktonnes in 2002 to 2,200 ODP ktonnes in 2015. Nevertheless, the increasing use of HCFCs in Article 5(1) countries could delay the rate of recovery of the ozone layer and increase the quantity of banked HCFCs from 37 ODP ktonnes in 2002 to 126 ODP ktonnes in 2015 under the BAU scenario. The Mitigation Scenario in the Special Report estimated the additional reductions in ODSs and the use of their HFC (and PFC) substitutes that can be achieved by the year 2015 with technically feasible actions beyond those currently required by the Montreal Protocol. The Special Report focused on the climate benefits of such actions by presenting the results in terms of greenhouse gas units of measure (carbon dioxide equivalents). This Supplement Report presents the Mitigation Scenario emission reduction in terms of ozone units of measure (ODP tonnes). In the refrigeration and air conditioning sector, several potential measures will be introduced progressively in the period to 2015 and will have an impact on emission patterns, even after phasing out the use of ODSs in new equipment. This also relates to specific servicing practices, such as recharging for leakage, particularly in Article 5(1) countries, where ODS (CFC) based equipment is still abundant. If measures will be implemented in the last phase of the ODS phase-out process, their main impact will be on the level of future HFC emissions in preference to ODSs. The main mitigation strategies likely to have effect on ODS emissions in the mid-term (e.g., as of 2008) are those associated with end-of-life measures in refrigeration and (mobile and stationary) air conditioning. Recovery and possible destruction may have a significant impact on the level of emissions released from the banks. The slow emission rate from foams means that measures considered in the Mitigation Scenario will have a limited effect by 2015, although there could be incremental benefits for many years to follow. Although the Special Report dealt with these dynamics tangentially (foam emission reductions were projected to 2100), there was no systematic quantification of emission abatement over such a long period. As mitigation strategies are more widely researched, demonstrated and commercially practised, there will be increasing precision in assessing

x
specific mitigation costs. However, extreme care needs to be exercised in applying these data to other areas. Local factors such as practical accessibility and transport logistics can have substantial effects on the practicality and economics of recovery and destruction. In some instances (e.g. halons), it may also be important to leave banks available for future recycling and critical use. The best estimate in the Scientific Assessment of Ozone Depletion: 2002 (WMO, 2003) projected the return of the Equivalent Effective Stratospheric Chlorine (EESC) to 1980 values in the year 2044, assuming full compliance with the Montreal Protocol. However, bank estimates in (WMO, 2003) are generally lower than in the Special Report. The same calculation using the banks of CFCs and HCFCs as estimated in this Supplement Report shows this return to 1980 values being delayed until 2046. If the further emissions from servicing refrigeration and AC equipment, occurring in the interim, are taken into account, the return of the EESC to 1980 values levels is estimated to be delayed by up to another two years at maximum (2048). Destruction of all banks in refrigeration and AC equipment as of 2008 (at end-of- life) could result in an estimated return of the EESC to 1980 values around the year 2046. Management of foam banks would also serve to accelerate the recovery of the ozone layer, but quantification of this impact is difficult because much of the emission from foam in buildings could take place at end-of-life in the period between 2035 and 2050. This Supplement Report provides some examples of mitigation costs, points out the limitations on the use of this information, and highlights that the cost-effectiveness of mitigation measures may depend substantially on whether policy makers consider the co-benefits of ODS recovery and greenhouse gas emission abatement. It is self-evident that, if these values are combined (not always a strictly additive process), the cost-effectiveness criteria could be satisfied in local circumstances where individual analyses might have dictated otherwise. In Article 5(1) countries, the current collection and recovery costs are likely to be greater than in non-Article 5(1) countries owing to the lack of infrastructure. Indeed, end-of-life concepts are very different in Article 5(1) countries from the ones in non-Article 5(1) countries and the degree of re-use is generally much higher.

1
1 Introduction
1.1 Remit
Following a discussion on the IPCC/TEAP Special Report "Safeguarding the Ozone Layer and the Global Climate System: Issues related to Hydrofluorocarbons and Perfluorocarbons” at the Twenty-fifth meeting of the Open-ended Working Group (Montreal, 27-30 June, 2005), the EC, Norway, New Zealand, and UK tabled a CRP.8, where the first two paragraphs read as follows:
To recommend that further consideration of the IPCC/TEAP Special
Report is placed on the agenda for the Seventeenth Meeting of the Parties. To request TEAP to provide, by 31 October 2005, a supplementary report
to the Seventeenth Meeting of the Parties that elaborates clearly the ozone depletion implications of the issues raised in the Special Report. In particular, the report should estimate current and projected levels of ozone-depleting substances contained and emitted from banks, expressed as ODP tonnes; project atmospheric concentrations of ozone-depleting substances under the "Mitigation" and “Business as Usual” scenarios that appear in the Special Report, and their associated impact on the ozone layer; estimate costs of mitigation measures described in the report in cost per ODP tonne.
Following a discussion on the issue, the Open-ended Working Group agreed (1) to recommend that further consideration of the IPCC/TEAP Special Report be placed on the agenda for the Seventeenth Meeting of the Parties and (2) to request TEAP to provide, by 31 October 2005, a Supplementary Report to the Seventeenth Meeting of the Parties that elaborates clearly the ozone-depletion implications of information already in the Special Report by presenting it in terms of ozone-depleting potential and costs per ODP tonne. Chlorofluorocarbons (CFCs), halons, and hydrochlorofluorocarbons (HCFCs) being phased out under the Montreal Protocol contribute to ozone depletion and climate change, while hydrofluorocarbons (HFCs) and perfluorocarbons (PFCs) controlled under the United Nations Framework Convention on Climate Change and its Kyoto Protocol contribute only to climate change. About 20% of ODSs are replaced with hydrofluorocarbons that generally have Global Warming Potentials (GWPs) that are significantly lower than the GWPs of the ODSs they replace and are better contained and more likely recovered at service. Furthermore, climate protection benefits are achieved during the ODS phase-out because refrigeration and air conditioning engineers use the necessity of change to thoroughly redesign systems, resulting in better efficiency, better reliability and better overall value for consumers.

2
The IPCC/TEAP Report describes the banks and emissions in all relevant sectors in kg CO2-equivalent, this being the typical way emissions are considered for determining global warming impacts. This supplement to the Special Report more clearly presents the impacts on the ozone layer from emissions and emissions reductions, expressed in ODP tonnes.
1.2 Task Force
Following the meeting of the Open-ended Working Group, June 2005, TEAP established a Task Force on the Supplement to the Special Report (TFSRS), co-chaired by Lambert Kuijpers, Paul Ashford and Roberto Peixoto and consisting of: Stephen. O. Andersen (USA, co-chair TEAP, member Steering Committee
Special Report); Paul Ashford (UK, co-chair FTOC, member TEAP, CLA Special Report); Nick Campbell (UK, member MTOC, CLA Special Report); Denis Clodic (France, member RTOC, CLA Special Report) Sukumar Devotta (India, member RTOC, CLA Special Report); David de Jager (The Netherlands, former TSU for the Special Report); Suzanne Kocchi (USA, member FTOC, LA Special Report); Lambert Kuijpers (The Netherlands, co-chair TEAP, co-chair RTOC,
member Steering Committee Special Report); Roberto Peixoto (Brazil, member RTOC, CLA Special Report) Jose Pons Pons (Venezuela, co-chair TEAP, co-chair MTOC, member
Steering Committee Special Report); Guus Velders (The Netherlands, CLA Special Report); and Dan Verdonik (USA, member TEAP, co-chair HTOC, CLA Special
Report). Drafts were produced via email-circulation; a final review was carried out by the TFSRS Task Force during the week of 7-11 November 2005. After this review, this report was considered and subsequently adopted by consensus of the UNEP Technology and Economic Assessment Panel (TEAP) as established under the Montreal Protocol.
1.3 The Structure of the Report
The structure of this Supplement to the IPCC/TEAP Report is as given below. In individual chapters, particularly in chapters 3 and 4, the data that are contained in the Special Report are updated and converted to ODP ktonnes.
Chapter 1, “Introduction”, presents the remit, the setting up of the Task Force and the process followed in preparing this report.
Chapter 2, “Description of sectors”, describes sectors and emission sources, looks at the phase in the life-time of a product when emissions mainly occur. It presents an overview of the present status of bottom-up methods for

3
refrigeration and the uncertainties involved in the determination of banks and emissions. It also gives some information derived from (IPCC TEAP, 2005) on the determination of emissions from annual measurements of atmospheric concentrations.
Chapter 3, “BAU Scenario”, looks at the demand, banks and emissions in a Business as Usual scenario for the period 2002-2015. The assumptions for determining banks and emissions in this scenario are given. It also gives the relevant data on the development of the banks and related emissions (tables with all the data and bar chart graphs can be found in the Annex to this report). Demand, banks and emissions are considered for the world-total, and both for the non-Article 5(1) and the Article 5(1) countries. This yields insight on the percentage release from banks in different regions of the world, where banks (and emissions) may be completely different in composition.
Chapter 4, “MIT Scenario”, looks at the demand, banks and emissions in a Mitigation scenario. The assumptions as used in the mitigation scenario are given, which scenario is characterised by the same banks and emissions as the Business-As- Usual scenario in the year 2002 (tables with all the data and bar chart graphs can be found in the Annex to this report). A comparison is made between the size of the banks and the level of emissions in the Business-As-Usual and the Mitigation scenario in the year 2015.
Chapter 5, “Mitigation Costs”, describes the costs for the mitigation of refrigeration, foams and halon emissions. Mitigation in this context means that emissions of ODS should not have an impact on the recovery of the ozone layer.
Chapter 6, “Impacts on the Recovery of the Ozone Layer”, describes the impact of emissions on the ozone and is based on the same considerations as chapter 2 in (IPCC TEAP, 2005).
Chapter 7, “Discrepancies between Emissions Determined”, presents discrepancies between emissions determined from bottom-up methods and from atmospheric measurements. It looks at the relevance of the types and the levels of emissions, as well as at the relevance of the timing of the emissions and emission reductions.
Chapter 8 gives “ Concluding Remarks”.
In the Annex tables and bar charts are given of the demand, the banks and emissions for the years 2002 and 2015. These are expressed in ktonne product, in ktonne CO2-equivalent and in ODP ktonne.


5
2 Description of sectors, emission sources and methods of assessment
2.1 Sectors and sources
Ozone Depleting Substances (ODS) and their substitutes have been or are being used in a wide range of products and processes that are already well known to the ozone community. These include refrigeration and air conditioning equipment, medical and technical aerosols, rigid and flexible foams, fire protection equipment, solvents, intermediates and process agents. The IPCC/TEAP Special Report deals only with those products and processes, which have selected HFCs or PFCs as full or partial substitutes for ODSs. Hence the main chapters of that Report have focused on refrigeration and air conditioning (chapters 4-6), rigid foams (chapter 7), medical aerosols (chapter 8) and fire protection (chapter 9). Technical aerosols and specialist solvent uses have also been covered (chapter 10), but to a lesser degree, reflecting the lower levels of use of HFCs and PFCs as substitutes. An important consequence of this scope is that the Special Report is not a comprehensive treatise on the sources of all ODSs used historically (although the atmospheric science inevitably covers all sources). Accordingly, there is no substantive coverage of sectors such as non-technical aerosols that no longer depend on fluorocarbons despite their widespread use in the second half of the 20th century and their undeniable impact on the ozone layer. Since this Supplementary Report is to mirror the scope of the Special Report itself, it too does not cover all contributions to ODS emissions except within the atmospheric science discussion (section 2.3). Although this may seem an incomplete approach, it so happens that the sectors leading to future ODS emissions are typically the same sectors as those leading to future HFC and PFC emissions. This is particularly the case for refrigeration, air conditioning and rigid foams where much of the future ODS emission will occur from banks of refrigerant and blowing agent already accrued. As noted in the Special Report, most of these substances (or by-products released during manufacture) are greenhouse gases (GHGs), the emission of which will result in a contribution to the direct positive forcing of climate. Direct emissions of GHGs may occur during the manufacture of these substances, during the use of these substances in products and processes, and at the end of the life of the products containing these substances. Indirect GHG emissions of applications of ODS and their replacements are the GHG emissions related to the energy consumption (fuels and electricity) during the complete lifecycle of the application (this effect is in addition to the indirect negative radiative forcing of ODSs discussed previously). Dependent on the characteristics of the energy system, indirect GHG emissions may be significant as compared to direct GHG emissions, up to an order of magnitude larger than the direct GHG emissions considered in this

6
report. As most indirect GHG emissions are related to the use-phase of the applications concerned, energy efficiency improvements can often result in significantly greater reductions in total GHG emissions than those generated from a focus solely on reducing direct GHG emissions. This again depends on the specific energy system characteristics. The Special Report notes that the UNFCCC addresses anthropogenic emissions by sources, and removals by sinks of all greenhouse gases not controlled by the Montreal Protocol, i.e. carbon dioxide, methane, nitrous oxide, hydrofluorocarbons (HFCs), perfluorocarbons (PFCs) and sulphurhexafluoride (SF6). The Montreal Protocol, on the other hand, controls not the emission but rather the production and consumption of ozone depleting substances. Thus, the emissions due to releases of CFCs and HCFCs present in banks (e.g. refrigeration equipment, foams) are not covered in either the Montreal Protocol or Climate Convention. These emissions, if uncontrolled, will make a significant future contribution to global warming, and have relevance to the predicted recovery of the ozone layer. The emissions from banks thus are linked to tradeoffs and are a component of a balanced assessment of each sector included in this report. HFCs and PFCs are now seldom used in aerosol, solvent, open-celled foam and other applications where they are emitted immediately. In general, the uses are focused on those applications where additional benefit can be gained by their presence (e.g. for product safety, or thermal efficiency). This is partly driven by the cost of these materials and partly by the recognition of the environmental imperative to avoid emitting gases with high global warming potential unnecessarily. Accordingly, a study of the sectors in which they are now used not only relies on a knowledge of the production and consumption of a chemical, but also on knowing the life cycle of the application in order to determine whether emission will occur and, if so, when. This will vary significantly between sectors and even between applications within sectors. For instance, foam insulation used in buildings can have an expected lifetime of 50 years or more. Since most of the emission, if it not prevented, will occur at the end-of-life of the foam, there can be substantial delays in emission which need to be factored into the atmospheric projections for ozone recovery, as well as for climate change. Indeed, the time-related implications of emissions may have a greater effect on ozone recovery than on climate change because of the catalytic role of chlorine in the degradation of stratospheric ozone. Within the Special Report, the approach taken to time-dependence was not totally uniform. In general, projections and the impact of possible mitigation measures were assessed at 2015 and compared against the position understood for 2002. Typically, the trends for intervening years were not mapped and projections beyond 2015 were discouraged because of legitimate concerns over the reliability of consumption data beyond this date. However, for

7
applications such as foams, it was recognised that a 15 year time-frame was too short to reflect life-cycle implications of emissions arising from the use of CFCs, which may have already taken place as far back as 1965 and which continue for HCFCs and HFCs now and in the future. Accordingly, the foams chapter in the Special Report extended its purview to 2100 in order to capture the dynamics of on-going emissions. This is an equally important facet for this Supplementary Report, bearing in mind the significant ODS banks that remain in foams at this time. However, in keeping with a Business-As-Usual and a Mitigation scenario as presented in the Special Report, this report does not specifically calculate the impact of ODS emissions from foam out to 2100. An additional distinction for some applications (e.g. refrigeration and fire protection) is that equipment is serviced and replenished during its life-time. This creates a further use and emission pattern through the life of the equipment, which, in many cases, can be more significant than the initial charges when the equipment is manufactured. Table 2-1 summarises the distinctive aspects of each of the key applications covered in the Special Report. One other emission source, which would deserve some consideration in this Supplementary Report, is the inadvertent creation and release of HFC-23 as a by-product of HCFC-22 production. HFC-23 has a significant global warming potential and its emission is linked to the strategies being adopted under the Montreal Protocol to curb ultimate demand for HCFCs in Article 5(1) countries, which are again directly related to future HCFC-22 emissions. Although mitigation of HFC-23 release is technically possible and economically attractive under the UNFCCC Clean Development Mechanism (CDM), the availability of funds through the sale of CDM credits obtained from the reduction of HFC-23 emissions could provide a perverse incentive for the continuation or expansion of HCFC-22 production in Article 5(1) countries in order to generate such credits. However, the discussion on this issue under the CDM is still ongoing and will be further dealt with at the upcoming UNFCCC COP-11 in Montreal, December 2005. Once this production and emission issue has been resolved there, the whole may need further consideration under the Montreal Protocol.

8
Table 2-1 Distinctive aspects of current ODS and GHG emissions by key sectors described in the IPCC/TEAP Special Report
Life Cycle Phases of Emission* Sector Typical
Gases Production/1st Year Use Phase (incl. Servicing)
End-of-Life (incl. waste streams)
Refrigeration
CFC-12, HCFC-22, HFC-134a
HFC/HCFC blends
Factory controlled – usually low level
Higher level dependent on frequency of servicing &
practices
Maximum of one charge still to be
recovered or emitted
Stationary A/C
CFC-12 HCFC-22 HFC-134a
HFC/HCFC blends
Factory controlled – usually low level
Higher level dependent on frequency of servicing &
practices
Maximum of one charge still to be
recovered or emitted
Mobile A/C
CFC-12
HCFC-22 (buses etc.) HFC-134a
Factory controlled – usually low level
Higher level dependent on frequency of servicing &
practices
Maximum of one charge still to be
recovered or emitted
Rigid Foams
CFC-11 CFC-12
HCFC-141b HCFC-142b HFC-134a HFC-245fa
HFC-365mfc
Losses are low where factory-
controlled but can be higher for on-site application
(e.g. spray foam)
Closed cell nature of foams makes losses in this phase low despite long
life-time
Bulk of loss likely to occur at this phase
unless recovery/destruction practised. Long-lived
emissions from products disposed in
landfills
Fire Protection
Halon 1211 Halon 1301
HFC-23 HFC-227ea FK 5-1-12
Factory controlled – usually low level
Higher level dependent on frequency of servicing &
testing practices
Maximum of one charge still to be
recovered or emitted
Medical Aerosols
CFC-11 CFC-12
CFC-114 HFC-134a
HFC-227ea
Emission only delayed by length
of time held in stock
Not applicable Not applicable
Other Uses
CFC-12 CFC-113
HCFC-142b HCFC-141b HFC-365mfc
Most likely to be used in closed
loops and may be recovered
Slow loss over time and may
need replenishment
Destruction techniques required for spent materials
* Shaded cells denote most significant sources of emission.
2.2 Bottom-up methods and the challenge of assessing activity data
When seeking to assess emissions, it is generally necessary to develop an understanding of use patterns and emission profiles for each use within a

9
sector over its respective lifecycle. This can be quite a complex process depending on the sector considered. By way of example, refrigerating equipment displays a wide variety of system types, since use of refrigeration and air conditioning systems is very widespread. The quality of the bottom-up method depends on good activity (consumption or use) data. The sources of such data will depend on the nature of the equipment and a series of possible approaches are presented in turn (Ashford et al., 2004a and 2004c). (1) Stand-alone mass manufactured units For domestic refrigerators (including freezers), air-to-air AC systems, and chillers, annual statistical data are available and are issued either by manufacturer associations or by specialised companies. Those data on annual equipment sales allow the production and sale figures to be derived at the national level for nearly all the OECD countries. For a given year at the global level, the production of mass-produced equipment equals sales, if inventories do not change. Based on this equality, and taking into account economic factors such as GDP and GNP, it is possible to derive national markets of countries for which equipment statistics are not available. Once the annual production and markets are derived for all countries, the type of refrigerant is determined according to regulation and manufacturer choices. Refrigerant charges are defined depending on the refrigerating capacity. Past years are derived for the typical lifetime of that equipment, which varies between 10 to 25 years, depending on the country. Emission factors are also determined by equipment type and country specific circumstances. (2) Integral parts of other mass manufactured units No direct statistics are available for mobile air conditioning systems or refrigeration, but a large number of data are available for the annual market and production of cars, trucks, light commercial vehicles (LCVs), and buses in different reference sources. A ratio of the number of vehicles equipped with air-conditioning systems referred to the total number of vehicles is applied on a year-by-year basis taking into account possible rapid change in vehicle equipment. From the average lifetime of cars, and of AC systems, the bank of refrigerant is calculated (merging all charges in the total fleet of vehicles). Assuming likely emission rate and the bank, the annual servicing market is determined, and then the total refrigerant emissions including end-of-life emissions and fugitive emissions. The refrigerant recovery is determined from knowledge of the volumes of equipment processed and is adjusted for recovery efficiency.

10
(3) Purpose-built commercial systems The steps for assessing emissions from commercial refrigeration units can be more data intensive and usually involve:
(i) the derivation of the activity data for each type of refrigerant from a combination of refrigerant sales data and knowledge of equipment types and their population
(ii) the application of appropriate emission and recovery factors.
For retail outlets, the method chosen is typically based on food sales area surfaces, which are the only data that can be found at the global level for both non-Article 5(1) and Article 5(1) countries. Emissions in past years are estimated for the typical lifetime of the respective equipment types, which vary between 7 and 15 years depending on the country. The percentage of the refrigerant charge, which is emitted before servicing is used in order to define the refrigerant recharge frequency. The lifetimes of supermarkets and hypermarkets are typically longer than 7 years. However, the remodelling frequency averages 7 years for non-Article 5(1) countries. This has to be taken into account because it implies significant modifications to the refrigerating circuits, which can lead to large refrigerant emissions depending on the recovery efficiency. Further details on the methodology applied can be found in (Ashford et al., 2004c). A further treatment of uncertainties in the refrigeration sector is included in Chapter 7. In contrast to refrigeration where additional use of substances can occur throughout the lifecycle during servicing, the only point of CFC, HCFC, or HFC use for a foam is at the time of its manufacture. Although the manufacturers of foam can also be small and highly dispersed businesses (cf >5,000 spray foam contractors in the US alone), the bulk of blowing agent use takes place in controlled factory environments which can be surveyed relatively easily through trade associations and by direct contact. Even in the case of the fragmented spray foam market, usage can often be characterised through a series of ‘systems houses’ which act as formulators for the industry and effectively ‘consume’ at the point of formulation. This ability to determine, with some accuracy, the use of blowing agent at foam manufacturing level introduces an important cross-check to the modelling methodology in addition to the top-down sales statistics of the refrigerant and blowing agent suppliers and the bottom-up determinations from the stocks of buildings and equipment. However, these data are not usually available at national level and, even where it is, it can be of fairly limited value because the trading of insulation at regional level will often transfer future lifecycle emissions to a different country. Further details on the methodology applied can be found in (Ashford et al., 2004c).

11
Confidence levels in activity data and emission factors vary by application in the refrigeration and air conditioning sector. Table 2-2 summarises the six different parameters assessed and confidence levels associated with each. It should be noticed that the confidence levels can be particularly low in the case of Article 5(1) countries, specifically for those where national statistical data are scarce. Table 2-2 Uncertainty level (from A to E) by characteristic or data
Domestic refrigeration
Commercial refrigeration
Refrigerated transport
Industrial refrigeration
Stationary air conditioning
Mobile air conditioning
Market and production A B* C* B/C* A A
Lifetime B/D* B A B A B
Refrigerant type A/C* B A B B** A
Refrigerant charge A B B B/C* C* A
Emission rate B/D* B/C B B/C B B/C**
Recovery rate A C B C B B/C**
* In Article 5(1) countries lifetime, emission rates and refrigerants used are not well known.
*Calculations are based on the number of retailers. The main uncertainties are coming from the number of refrigerating equipment in convenience stores, and food specialists in Article 5(1) countries.
* Data are based on trucks market and production.
*Data are well known in food industry. Other ones (such as the chemical industry) do not communicate; then uncertainty regarding charge and equipment base is larger in this sector.
*Uncertainties about the average cooling capacity of chillers, depending on the country ** new refrigerant markets are well known but past distribution, especially between CFC-11 and CFC-12 is uncertain.
*Refrigerants used in market or production are well known but retrofit process (USA for instance) in servicing is not well estimated ** In countries where “do it yourself” servicing occurs, emission rates are difficult to estimate
0 < |A| < 5% 5 < |B| < 10% 10 < |C| < 15% 15 < |D| < 20% 20 < |E| < 25%
2.3 Atmospheric concentrations and derived emissions (IPCC TEAP, 2005)
The average residence time of a fluorocarbon in equipment or other products varies from less than a year to many decades, depending on the application. In 1974, at the time of the publication of the ozone-depletion hypothesis by Molina and Rowland, fluorocarbons were mainly used in applications such as aerosol propellants, solvents, and open-cell foams, resulting in rapid emissions of these gases to the atmosphere within a year of sale. Since use as propellants, and other applications with rapid emissions, have largely disappeared in non-Article 5(1) countries and are gradually being minimised

12
in Article 5(1) countries, the current use of fluorocarbons is dominated by their continuing use in applications with relatively slow emissions to the atmosphere such as refrigerant and in closed-cell foam applications. The slow emission of refrigerants and blowing agents establish banks, which can emit fluorocarbons for prolonged periods and long after the use of the chemical has ceased. As noted earlier, when calculating banks of fluorocarbon and other chemicals in refrigeration and in foams, it is necessary to study sales of equipment and/or products, lifetime aspects, leakage during use, and end-of-life issues. This bottom-up approach is based on data from surveys, which must be well designed to ensure complete coverage. However, there are usually cross-checks to ensure completeness. Emission factors for refrigeration equipment and foams have been assessed over several years. These vary significantly according to the application and good market analysis is required to ensure the use of appropriately weighted emission factors. The differences between the use and the forecast emissions applying these functions are assigned to banks, which accrue and diminish with time. Verification of the physical existence of these banks has largely served to confirm the appropriateness of the emission functions adopted, although year-to-year emission projections can have significant error bars for banks that release slowly (e.g. foams), particularly where emission projections are largely based on end-of-life practices. These year-to-year errors (explained in greater detail in Chapter 7) tend to be offset with time, making the level of confidence greater over a multiyear period. Observations of concentrations of long-lived chemicals in the atmosphere can be used to estimate past emissions. If the lifetime of the chemical is long enough and the rate of mixing is sufficient to ensure a more or less homogeneous concentration in the whole lower troposphere, then past emissions can be derived by simple inverse modelling using the change in observed concentration and the lifetime of the chemicals (see Table TS-2 in the Technical Summary of IPCC TEAP, 2005). Measurements of long-lived chemicals are performed frequently and with high accuracy in several measurement networks. The uncertainty in derived emissions depends on the uncertainty in the trend in observed concentration and on the uncertainty in the lifetime. Both are relatively small for most chemicals, although deriving emission estimates from small annual changes in relatively large numbers does carry some additional risk. Using different measurement networks may also yield different emissions and therefore information about the uncertainty. On this basis, the uncertainty in derived emissions is about 10% for CFC-11 and between 1% and 6% for other long-lived halocarbons.

13
As developed further in Chapter 7, the variances observed in the Special Report between derived emissions from atmospheric observations and those derived from bottom-up assessments arise from systematic errors (e.g. lack of SROC completeness for ODS uses and a lack of knowledge on contemporary use patterns for ODS in developing countries) as well as from random errors associated with the uncertainties in the activity data and emissions factors at sectoral level. Evidence suggests that the combination of both forms of error is sufficient to reconcile the variances, although further work would be valuable in characterising both systematic and random errors more fully.


15
3 Demand, banks and emissions in a BAU scenario, historic data and 2015 emissions
3.1 Assumptions BAU scenario
In the Special Report (IPCC TEAP, 2005) a Business-As-Usual (BAU) scenario was developed for the projections of the demand, banks and emissions of CFCs, HCFCs, HFCs and some PFCs (where these are used as replacements for ozone-depleting substances). In the BAU scenario different annual market growth percentages are assumed for different regions in the world. These projections assume that all existing measures will remain in place, including the Montreal Protocol (phase-out) and relevant national regulations. The Business-As-Usual case assumes the continuing application of all existing measures and the alternative scenario(s) embody improvements that could be implemented assuming global application of current best-practice emission reduction techniques. As a consequence, the usual practices and emission rates will remain unchanged up to 2015 and the recovery efficiency will not increase. This may imply that certain alternative chemicals penetrate to a certain (different) degree in certain markets. The large scale destruction of banks is not included in this BAU scenario. In order to facilitate the calculations of emissions, estimates have been made of the size of the bank of ozone-depleting substances and fluorinated gases in equipment and applications in 2002. Table 3.1 summarises the key assumptions of the Business-As-Usual (BAU) projections. The activities underlying emissions of fluorocarbons are expected to expand significantly between now and 2015. These activities (such as the requirements for refrigeration, air conditioning and insulation) will involve a number of technologies, including CFCs and HCFCs. In non-Article 5(1) countries, the use and emissions of CFCs and HCFCs will decline as obsolete equipment is retired. In Article 5(1) countries, ozone-depleting substances (particularly HCFCs) may be used for most of the first half of this century and significant growth is expected.
3.2 Demand, banks and emissions per substance and per sector
3.2.1. General observations
Current emission profiles are largely determined by historic use patterns, resulting in a relatively high contribution (now and in the coming decades) from CFCs and HCFCs banked in equipment and foams. Tables 3-2 and 3-3 show the banks per substance and per sector. Figure 3-1 presents the banks for the year 2002 and for the year 2015, for both the BAU and the MIT scenario. It also gives the shares of the non-Article 5(1) and the Article 5(1) countries in the total.

16
Table 3-1 Key assumptions in the Business-as-Usual (BAU) Scenario Sector Annual market growth
2002−2015 (both in BAU and MIT) (% yr-1)
Best practice assumptions
EU USA Japan A5(1) Refrigeration, SAC and MAC
EU % yr-1
USA % yr-1
Japan % yr-1
A5(1) % yr-1
Type of Reduction BAU BAU BAU BAU
1 2.2 1.6 2−4.8 Substance HFC-134a / HC-600a HFC-134a HFC-134a CFC-12 / HFC-134a Domestic refrigeration Recovery 0% 0% 0% 0%
1.8 2.7 1.8 2.6−5.2 Substance R-404A HCFC-22 / R-404A HCFC / R-404A CFC / HCFC Commercial refrigeration Recovery 50% 50% 50% 25%
1 1 1 3.6−4.0 Substance HFC-NH3 (35%) HCFC / HFC-NH3 (60%)
HCFC / HFC-NH3 (35%)
CFC / HCFC-22 Industrial refrigeration
Recovery 50% 50% 50% 15−25% 2 3 1 3.3−5.2 Substance HFCs HCFCs / HFCs HCFCs / HFCs CFC / HCFC-22 Transport
refrigeration Recovery 50% 50% 50% 0% 3.8 3 1 5.4−6.0 Substance HFCs HCFCs / HFCs HCFCs / HFCs CFC / HCFC-22 SAC
Recovery 50% 30% 30% 0% 4 4 1 6.0−8.0 Substance HFC-134a / CO2 (10%)
as of 2008 HFC-134a HFC-134a CFC / HCFC-134a
Recovery 50% 0% 0% 0%
MAC
Charge 700 g 900 g 750 g 750−900 g Foams About 2% yr-1 Assumptions on substance use (see Technical Summary section 4.4 (IPCC TEAP, 2005) Medical aerosols 1.5–3% yr-1 Partial phase-out of CFCs Fire protection −4.5% yr-1 (all substances) Phase-out of halons Non-medical aerosols and solvents
16% increase period in total CO2-weighted emissions over the
period 2002−2015 See (IPCC TEAP, 2005)

17
The largest bank of ODS (CFCs) is in foam products, which are located in the non-Article 5(1) countries. This will remain the case between 2002 and 2015. Banks of halons are also important, and are roughly split equally between non-Article 5(1) and Article 5(1) countries. This will remain the case until 2015, although the size of the bank is expected to decrease. Banks of ODS substances in refrigeration and air conditioning are relatively small (compared to the others mentioned above) and will be much smaller in the year 2015, mainly due to a decrease in the CFC banks, which can then only be found in the Article 5(1) countries. Further, more detailed data are presented below. It should be noted, that recovery efforts and the associated costs may vary widely, to the extent that certain, large amounts of ODS in banks are virtually unrecoverable, although still existing. However, the option for destruction still remains open. For example, refrigerants are generally considered to be easily recoverable but recovery of foam blowing agents can be more complicated (see further chapter 5 in this report). Most halon-1211 is widely dispersed in building and residential portable fire extinguishers averaging only a few kg each. Other halon-1211 has been centralised in military, aviation and large fire brigades. Collection of the widely dispersed portable extinguishers may prove to be unproductive or uneconomic in some countries. National programs that require halon owners to donate substances and to pay for destruction have resulted in recovery of only a small portion of estimated banks, with unreported quantities likely emitted or lost to avoid the expense. On the other hand, national programs offering a bounty for recovered halon and financing of destruction have demonstrated higher recovery rates. In general, emissions, i.e., bank-turnover varies significantly from application to application: from months (e.g. solvents), several years (refrigeration applications) to over half a century (foam insulation). The banks stored in equipment and foams may leak during the use phase of the products they are part of, and at the end of the product lifecycle (in case they are not recovered or destroyed.

18
Table 3-2 2002 Banks of halocarbons per group of substances
Product (kt product) ODP (kt ODP) GWP (MtCO2-eq) Banks 2002 World Non-
Article 5(1) countries
Article 5(1) countries
World Non-Article 5(1) countries
Article 5(1) countries
World Non-Article 5(1) countries
Article 5(1) countries
Halons 168 80 88 1,173 659 514 531 330 201CFCs 2,430 1,669 760 2,412 1,665 747 15,749 10,235 5,514HCFCs 2,651 1,997 643 194 156 37 3,841 2,773 1,062HFCs 544 494 49 0 0 0 1,103 992 86PFCs 1 0 0 0 0 0 5 4 0Total 5,793 4,241 1,540 3,779 2,480 1,299 21,229 14,334 6,864
Table 3-3 2002 Banks of halocarbons per application sector
Product (kt product) ODP (kt ODP) GWP (MtCO2-eq) Banks 2002 World Non-
Article 5(1) countries
Article 5(1) countries
World Non-Article 5(1) countries
Article 5(1) countries
World Non-Article 5(1) countries
Article 5(1) countries
Refrigeration 971 406 565 336 66 270 4,751 1,423 3,328Stationary AC 1,193 868 325 134 86 48 2,509 1,721 787Mobile AC 419 352 67 150 108 42 1,987 1,500 487Foams 2,996 2,507 490 1,978 1,555 423 11,270 9,241 2,029Medical Aerosols 12 9 2 8 6 2 75 58 17Fire Protection 191 99 92 1,174 659 514 606 390 216HFC-23 by-product - - - - - - - - -N-M Aer./Solvents 12 0 0 1 0 0 32 0 0Total 5,793 4,241 1,540 3,779 2,480 1,299 21,229 14,334 6,864
Note: Not all banks data could be allocated to regions. For HFC-23 by-product, non-medical aerosols and solvents no regional breakdown in demand, banks and emissions is available.

19
Halons
Halons Halons
CFCs
CFCs CFCs
HCFCs
HCFCsHCFCs
RefrigerationRefrigeration
Refrigeration SACSAC
SACMACMAC
MAC
FoamsFoams
Foams
FireFire
Fire
DevelopedDeveloped
Developed
Developing
Developing
Developing
0
500
1000
1500
2000
2500
3000
3500
4000
2002 2015 Busines-as-Usual Scenario 2015 Mitigation Scenario
Banks (ktonnes ODP)
Figure 3-1 Banks of halocarbons expressed in ktonnes ODP. Breakdown per group of substances, per emission sector en per region (non-Article 5(1)/Article 5(1) countries), for 2002, 2015 Business-as-Usual Scenario, and 2015 Mitigation Scenario.

20
3.2.2 Specific observations related to the 2002 banks
In ktonnes, the largest bank is in foams, being almost 3,000 ktonnes, of which 1,860 ktonnes are CFCs (roughly the same in ODP-ktonnes) and 1,130 ktonnes (119 ODP-ktonnes) are HCFCs. 1,445 ktonnes of CFCs, as well as 1,050 ktonnes of HCFCs (equal to 110 ODP-ktonnes) can be found in the non-Article 5(1) countries. In the Article 5(1) countries, the CFC foams bank amounts to 414 ktonnes (414 ODP-ktonnes), the HCFC foam bank to 76 ktonnes, or 9 ODP-ktonnes. Less than 7% of the global HCFC foam bank is in the Article 5(1) countries. In 2002, the second largest bank in ODP-ktonnes is in refrigeration, with 335 ODP-ktonnes (971 ktonnes). This amounts to 313 ODP-ktonnes of CFCs and 23 ODP-ktonnes of HCFCs. In this case, 256 ODP-ktonnes (82%) of CFCs are banked in the Article 5(1) countries, as well as 14 ODP-ktonnes of HCFCs (61%). This implies that the largest bank for refrigeration in 2002 is in the Article 5(1) countries. A large portion (186 ODP-ktonnes) is in commercial refrigeration in the Article 5(1) countries, next to 69 ODP-ktonnes in domestic refrigeration. The halon bank amounts to a total of 168 ktonnes, of which 80 ktonnes are in the non-Article 5(1) and 88 ktonnes in the Article 5(1) countries. In ODP-ktonnes, however, the world total amounts to 1,173 ODP-ktonnes, of which 659 ODP-ktonnes (56%) in the non-Article 5(1), and 514 ODP-ktonnes (44%) in the Article 5(1) countries
3.2.3 2015 Business-As-Usual projections for banks
Between 2002 and 2015, global banks of CFCs decrease from 2,430 to 1,411 ktonnes (more or less the same in ODP-ktonnes), HCFC banks increase from 2,651 to 3,317 ktonnes (194 to 247 ODP-ktonnes). HFC banks take over for a large part since they are assumed to grow from 544 to 2950 ktonnes from 2002 to 2015. In the non-Article 5(1) countries, CFC banks decrease from 1,669 to 1,132 ktonnes, in the Article 5(1) countries from 760 to 280 ktonnes. HCFC banks in the non-Article 5(1) countries decrease from 1,997 to 1,479 ktonnes, or 156 to 119 ODP-ktonnes. In the Article 5(1) countries they grow from 643 to 1,822 ktonnes, or from 37 to 126 ODP-ktonnes. In the non-Article 5(1) countries, the foams bank of CFCs decreases from 1,445 to 1,108 ktonnes, the HCFC bank from 1,050 to 986 ktonnes, which for the latter implies that it decreases from 110 to 95 ODP-ktonnes. In the Article 5(1) countries, the foams CFC bank decreases from 414 to 198 ktonnes, the HCFC bank increases from 76 to 516 ktonnes, or from 9 to 61 ODP-ktonnes.

21
In 2015, the bank in refrigeration is still larger than the bank in stationary air conditioning (103 compared to 70 ODP-ktonnes), but the difference has become much smaller. Globally, the CFC bank decreases between 2002 and 2015 from 313 to 59 ODP-ktonnes in refrigeration, the HCFC bank, however, increases from 23 to 44 ODP-ktonnes. In the non-Article 5(1) countries, the HCFC bank decreases from 9 to 4 ODP-ktonnes, in the Article 5(1) countries, however, the HCFC bank increases from 14 to 41 ODP-ktonnes.
3.2.4 2015 Business-As-Usual projections for emissions
The activities underlying emissions of fluorocarbons are expected to grow significantly between now and 2015. These activities and services (such as refrigeration, air conditioning and insulation) will be provided by a number of technologies and substances, including CFCs and HCFCs. In non-Article 5(1) countries, use and emissions of CFCs and HCFCs will decline following the Montreal Protocol phase-out requirement (and national and regional legislation) as obsolete equipment is retired. In Article 5(1) countries, HCFCs can still be produced until 2040 and significant growth is expected. These changes, and their impacts, are reflected in the data (see data in the Annex). The fall in CFC emissions is not accompanied by a similar increase in emissions of HFCs because of continuing trends towards non-HFC technology and substitutes with lower GWPs. In addition, but not included in the BAU scenario, capture and safe disposal of materials, that in the past were emitted, is likely to increase for HFCs since the emissions of these substances are controlled under the Kyoto Protocol. The Business-As-Usual case assumes continuing application of all existing measures and the mitigation scenario embodies improvements that could be implemented assuming global application of current best practice emission reduction techniques. Tables 3-4 and 3-5 show the emissions per substance and per sector for the year 2002. Figure 3-2 presents the emissions for the year 2002 and for the year 2015, for both the BAU and the MIT scenario. It also gives the shares of the non-Article 5(1) and the Article 5(1) countries in the total. Where it concerns emissions, the share of the Article 5(1) countries in the total is relatively large, taking into account the relative distribution of the banks between the Article 5(1) and the non-Article 5(1) countries. Significant amounts of emissions in the Article 5(1) countries originate from refrigeration and air conditioning and from halon equipment. The emissions will have decreased substantially by 2015 due to smaller banks. In both the BAU and the MIT scenario the banks are more or less the same, however, there is a large difference in emissions due to the application of improved techniques and the further improvement of all kind of practices.

22
Table 3-4 2002 Emissions of halocarbons per group of substances
Product (kt yr-1 product) ODP (kt yr-1 ODP) GWP (MtCO2-eq yr-1) Emissions 2002 World Non-
Article 5(1) countries
Article 5(1) countries
World Non-Article 5(1) countries
Article 5(1) countries
World Non-Article 5(1) countries
Article 5(1) countries
Halons 11 5 6 69 35 34 30 16 13CFCs 174 88 86 168 87 81 1,652 814 838HCFCs 271 133 128 15 7 7 448 218 223HFCs 124 103 6 0 0 0 434 204 11PFCs 0 0 0 0 0 0 1 0 0Total 580 329 226 252 129 122 2,565 1,253 1,086
Table 3-5 2002 Emissions of halocarbons per application sector
Product (kt yr-1 product) ODP (kt yr-1 ODP) GWP (MtCO2-eq yr-1) Emissions 2002 World Non-
Article 5(1) countries
Article 5(1) countries
World Non-Article 5(1) countries
Article 5(1) countries
World Non-Article 5(1) countries
Article 5(1) countries
Refrigeration 232 85 148 72 13 59 1,061 293 768Stationary AC 115 75 40 18 10 7 271 165 107Mobile AC 134 113 21 60 48 13 749 603 146Foams 51 42 10 24 18 7 152 116 35Medical Aerosols 12 9 2 8 6 2 75 58 17Fire Protection 11 5 6 68 35 34 31 17 14HFC-23 by-product 14 0 0 0 0 0 195 0 0N-M Aer./Solvents 12 0 0 1 0 0 32 0 0Total 580 329 226 252 129 122 2,565 1,253 1,086
Note: Not all emission data could be allocated to regions. For HFC-23 by-product, non-medical aerosols and solvents no regional breakdown in demand, banks and emissions is available.

23
HalonsHalonsHalons
CFCsCFCs
CFCs
HCFCs
HCFCs
HCFCs
Refrigeration
Refrigeration Refrigeration
SAC
SACSAC
MAC
MAC
MAC
Foams
Foams
Foams
MDI
MDI
MDI
Fire
Fire
FireDeveloped
Developed Developed
Developing
Developing
Developing
0
50
100
150
200
250
2002 2015 Busines-as-Usual Scenario 2015 Mitigation Scenario
Emissions (ktonnes ODP yr-1)
Figure 3-2 Emissions of halocarbons expressed in ktonnes yr-1 ODP. Breakdown per group of substances, per emission sector en per region (non-Article 5(1)/Article 5(1) countries), for 2002, 2015 Business-as-Usual Scenario, and 2015 Mitigation Scenario.
24
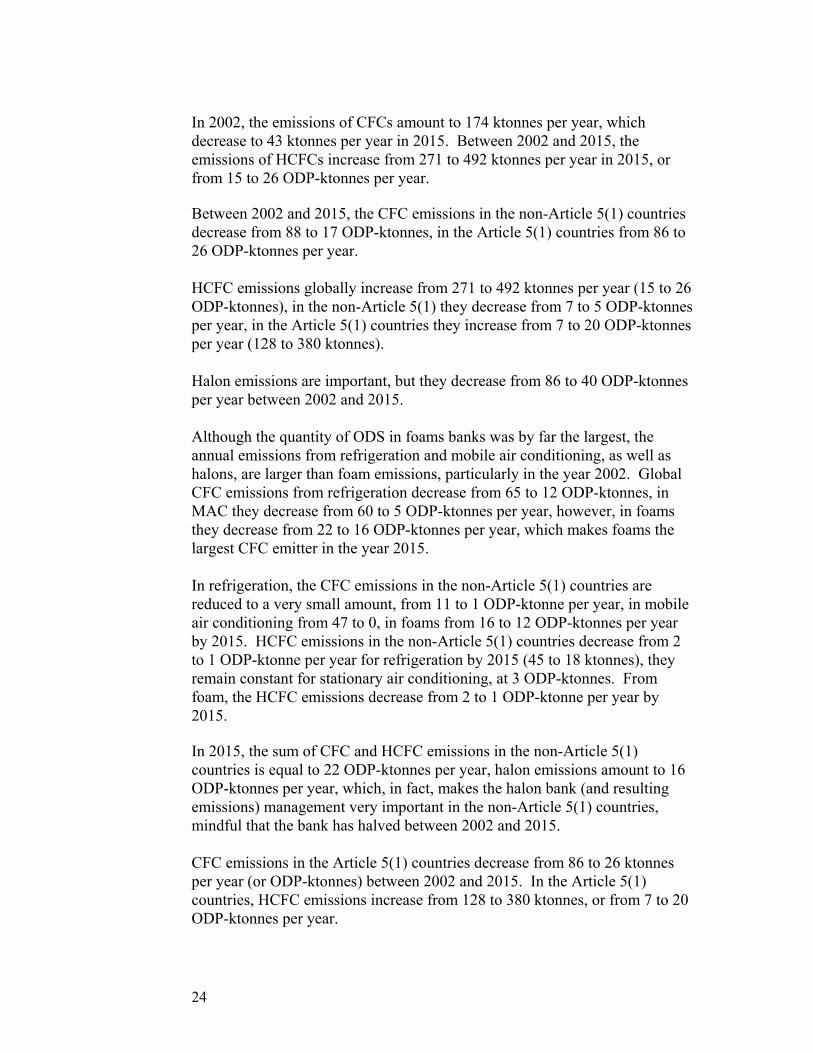
In 2002, the emissions of CFCs amount to 174 ktonnes per year, which decrease to 43 ktonnes per year in 2015. Between 2002 and 2015, the emissions of HCFCs increase from 271 to 492 ktonnes per year in 2015, or from 15 to 26 ODP-ktonnes per year. Between 2002 and 2015, the CFC emissions in the non-Article 5(1) countries decrease from 88 to 17 ODP-ktonnes, in the Article 5(1) countries from 86 to 26 ODP-ktonnes per year. HCFC emissions globally increase from 271 to 492 ktonnes per year (15 to 26 ODP-ktonnes), in the non-Article 5(1) they decrease from 7 to 5 ODP-ktonnes per year, in the Article 5(1) countries they increase from 7 to 20 ODP-ktonnes per year (128 to 380 ktonnes). Halon emissions are important, but they decrease from 86 to 40 ODP-ktonnes per year between 2002 and 2015. Although the quantity of ODS in foams banks was by far the largest, the annual emissions from refrigeration and mobile air conditioning, as well as halons, are larger than foam emissions, particularly in the year 2002. Global CFC emissions from refrigeration decrease from 65 to 12 ODP-ktonnes, in MAC they decrease from 60 to 5 ODP-ktonnes per year, however, in foams they decrease from 22 to 16 ODP-ktonnes per year, which makes foams the largest CFC emitter in the year 2015. In refrigeration, the CFC emissions in the non-Article 5(1) countries are reduced to a very small amount, from 11 to 1 ODP-ktonne per year, in mobile air conditioning from 47 to 0, in foams from 16 to 12 ODP-ktonnes per year by 2015. HCFC emissions in the non-Article 5(1) countries decrease from 2 to 1 ODP-ktonne per year for refrigeration by 2015 (45 to 18 ktonnes), they remain constant for stationary air conditioning, at 3 ODP-ktonnes. From foam, the HCFC emissions decrease from 2 to 1 ODP-ktonne per year by 2015. In 2015, the sum of CFC and HCFC emissions in the non-Article 5(1) countries is equal to 22 ODP-ktonnes per year, halon emissions amount to 16 ODP-ktonnes per year, which, in fact, makes the halon bank (and resulting emissions) management very important in the non-Article 5(1) countries, mindful that the bank has halved between 2002 and 2015. CFC emissions in the Article 5(1) countries decrease from 86 to 26 ktonnes per year (or ODP-ktonnes) between 2002 and 2015. In the Article 5(1) countries, HCFC emissions increase from 128 to 380 ktonnes, or from 7 to 20 ODP-ktonnes per year.

25
With more or less similar bank sizes, annual emissions of halons are estimated at 35 ODP-ktonnes per year in the non-Article 5(1) countries, and 34 ODP-ktonnes per year in the Article 5(1) countries in the year 2002. The emissions are reduced to 16 ODP-ktonnes in the non-Article 5(1) and to 24 ODP-ktonnes in the Article 5(1) countries in 2015. In the Article 5(1) countries, CFC emissions from refrigeration decrease from 55 to 11 ODP-ktonnes per year between 2002 and 2015 and are the most important emissions in 2015, followed by halon emissions. CFC emissions from stationary and mobile air conditioning and from foams are all 3-5 ODP-ktonnes per year. HCFC emissions in the Article 5(1) countries increase for refrigeration (from 87 to 302 ktonnes, or 4 to 15 ODP-ktonnes per year between 2002 and 2015), for stationary air conditioning (33 to 60 ktonnes, or 2 to 3 ODP-ktonnes per year) as well as from 3 to 8 ktonnes per year for foam, which implies that the HCFC emissions from foam are about 1 ODP-ktonne per year in the year 2015.


27
4 Demand, banks and emissions in a MIT scenario, comparison of 2015 BAU and MIT
4.1 Assumptions MIT scenario
In (IPCC TEAP, 2005) a Mitigation (MIT) scenario was developed for the projections of the demand, banks and emissions of CFCs, HCFCs, HFCs and some PFCs (where these are used as replacements for ozone-depleting substances). In the MIT scenario different annual market growth percentages are assumed for different regions in the world, equal to the ones used in the BAU scenario. These projections assume that all existing measures will remain in place, including the Montreal Protocol (phase-out) and relevant national regulations. The Mitigation case assumes improved application of all existing measures and improvement in best-practice emission reduction techniques. As a consequence, the usual practices and emission rates will change during the period 2002-2015. In the case of refrigeration, the recovery efficiency is assumed to increase in all sub-sectors; charge reductions are assumed in different applications in certain regions of the world. In this scenario certain alternative chemicals penetrate to a larger degree in certain markets than assumed in the BAU scenario. However, large scale destruction of banks is again not included in this MIT scenario. In the case of foams, the dependency on HFCs is less than in the BAU scenario, there are improvements in production and installation and end-of life management is increasingly applied. In the case of medical aerosols it is assumed that there will not be CFC inhalers on the market anymore. Where it relates to halons, there is no difference between the MIT and the BAU scenario here. Table 4-1 summarises the key assumptions of the MIT projections
4.2 Demand, banks and emissions per substance and per sector
4.2.1 Difference between 2015 Business-As-Usual and Mitigation projections for banks
The difference in the size of the banks is minimal between the BAU and MIT scenario in 2015. This conclusion is related to the fact that the difference in the banks in the two scenarios is caused by the application of non-CFC, non-HCFC, low GWP refrigerants and chemicals and by charge reduction. Given the lifetime of some of the products these measures will only proliferate slowly, and more importantly, are not of any influence in CFC based products where manufacturing can be assumed to have stopped either before (in the non-Article 5(1) countries) or in the period 2002-2015.

28
Table 4-1 Key assumptions in the Mitigation Scenario
Sector Annual market growth 2002−2015 (both in BAU and MIT) (% yr-1)
Best practice assumptions
EU USA Japan A5(1) Refrigeration, SAC and MAC
EU % yr-1
USA % yr-1
Japan % yr-1
A5(1)
% yr-1 Type of Reduction MIT MIT MIT MIT
1 2.2 1.6 2−4.8 Substance HC-600a HFC-134a / HC-600a (50%)
HC-600a Plus HC-600a (50% in 2010)
Domestic refrigeration
Recovery 80% 80% 80% 50% 1.8 2.7 1.8 2.6−5.2 Substance R-404A / R-410A (50%) R-404A / R-410A (50%) R-404A / R-410A (50%) R-404A / R-410A (50%)
Recovery 90% 90% 90% 30% Commercial refrigeration
Charge −30% −30% −30% −10% 1 1 1 3.6−4.0 Substance HFC-NH3 (70%) HCFC / HFC-NH3 (80%) HCFC / HFC-NH3 (70%) NH3 (40−70%) Recovery 90% 90% 90% 50%
Industrial refrigeration
Charge −40% −40% −40% −10% 2 3 1 3.3−5.2 Substance HFCs HCFCs / HFCs HCFCs / HFCs Plus HFCs, up to 30% Transport
refrigeration Recovery 80% 70% 70% 20−30% 3.8 3 1 5.4−6.0 Substance HFCs HCFCs / HFCs HCFCs / HFCs CFC / HCFC-22 (HFCs
30% in some A5(1)) SAC
Recovery 80% 80% 80% 50% Charge −20% −20% MAC 4 4 1 6.0−8.0 Substance HFC-134a / CO2 (50%) as
of 2008 HFC-134a / CO2 (30%) as of 2008
HFC-134a / CO2 (30%) as of 2008
CFC / HFC-134a
Recovery 80% 70% 70% 50% Charge 500 g 700 g 500 g 750−900 g Foams About 2% yr-1 MIT HFC consumption reduction: A linear decrease in use of HFCs between 2010 and 2015 leading to 50%
reduction by 2015. Production/installation improvements: The adoption of production emission reduction strategies from 2005 for
all block foams and from 2008 in other foam sub-sectors. End-of-life management options: The extension of existing end-of-life measures to all appliances and steel-
faced panels by 2010 together with a 20% recovery rate from other building-based foams from 2010. Medical aerosols 1.5–3% yr-1 MIT Complete phase-out of CFCs
−4.5% yr-1 (all substances) MIT Not quantifiable Fire protection +0.4% yr-1 (HCFCs/HFCs/PFCs) MIT 100% implementation of reduction options (90% emission reduction)
Non-medical aerosols and solvents
16% increase period in total CO2-weighted emissions over the
period 2002−2015 MIT Not quantifiable

29
Hence, world-wide the banks for CFCs and HCFCs are roughly the same in both scenarios; there are small differences in the domestic and commercial refrigeration sub-sectors. HCFC banks in stationary air conditioning are smaller in the MIT scenario (878 versus 644 ktonnes, or 43 versus 32 ODP-ktonnes). There is no difference in the banked chemicals in foams, as long as it concerns ODS (on the other hand, there are small differences in HFCs banked in foams between the two scenarios). No major differences in the trends for bank size development during 2002-2015 can be observed between the non-Article 5(1) and the Article 5(1) countries (banks in several sub-sectors are 0 to 10% smaller in the MIT scenario). As mentioned, the exception is in the stationary air conditioning sector where banks are 25% smaller in the non-Article 5(1) and 10% smaller in the Article 5(1) countries, and this applies to 2015 in the MIT scenario.
4.2.2 Difference between 2015 Business-As-Usual and Mitigation projections for emissions
World-wide, CFC emissions are 30% lower in the MIT scenario (29 versus 42 ODP-ktonnes per year); HCFC emissions are almost 40% lower (16 versus 26 ODP-ktonnes per year). Halon emissions are assumed to be the same in both scenarios. This results in 25% lower ODP-tonnes emissions per year (the savings expressed in ktonnes per year are larger, due to the fact that halons do not contribute). Relatively, the largest reduction is in the stationary air conditioning sector with more than 50% reduction in the MIT versus the BAU scenario (6 versus 13 ODP-ktonnes per year in the BAU scenario), followed by refrigeration with a reduction of about 40%. Reductions in the foam sector are marginal, emissions are 6% lower in the MIT compared to the BAU scenario (17 compared to 18 ODP-ktonnes per year). If one takes the reductions in HCFC emissions in the MIT scenario, then largest reductions are observed in the stationary air conditioning sector, by 67% (2 versus 6 ODP-ktonnes per year). Virtually no reductions occur in the HCFC foam sector, only some in the CFC foam sector (1 ODP-ktonne per year). In the non-Article 5(1) countries, the reduction in CFC emissions is minimal (15 versus 16 ODP-ktonnes per year), much larger reductions, about 40%, are possible in the Article 5(1) countries. This depends of course, on the assumptions for these countries in the MIT scenario. The largest reduction can be observed in the stationary air conditioning sector (reduction by 67% in CFCs and HCFCs, both from 3 to 1 ODP-ktonne per year).

30
In the Article 5(1) countries, the reductions in emissions are larger for both CFCs (14 versus 25 ODP-ktonnes per year) and for HCFCs (12 versus 20 ODP-ktonnes per year). Reductions in the specific refrigeration and AC sub-sectors are all in the order of 35%, except for foam (3 compared to 4 ODP-ktonnes of CFCs per year).
4.2.3 Graphical presentation of the 2015 Business-As-Usual and Mitigation projections for banks and emissions
Figures 4-1 and 4-2 present the banks and emissions for 2002, and for the BAU and MIT projections for the year 2015. The graphs have on the horizontal axis the amounts in Mt CO2-eq, on the vertical axis the amounts in ODP ktonnes. In both figures data are given for the world, and separately for the non-Article 5(1) and the Article 5(1) countries. In figure 4-1 it is clearly shown that the size of the foam bank is by far the largest, both for the world and for the non-Article 5(1) countries. The difference between the foam bank in the BAU and the MIT scenario is minimal (due to the long life of rigid foam products). Figure 4-1 shows that the halon banks decrease significantly on ODP tonnes, the difference in Mt CO2-eq is minimal (due to the low GWP of halons). World-wide, the banks of refrigeration, stationary and mobile air conditioning decrease in ODP terms but there are only small decreases between the BAU and MIT scenarios. The largest decrease takes place in mobile air conditioning. In refrigeration and stationary air conditioning the bank increase in GWP terms in the BAU scenario due to market growth and the application of HFC mixtures with relatively high GWP. This is offset for a large part in the MIT scenario for stationary air conditioning, and there is decrease for refrigeration and mobile air conditioning. The same dynamics between the BAU and MIT banks of refrigeration, stationary and mobile air conditioning described for the world can be observed in the case of the non-Article 5(1) countries. In the Article 5(1) countries, the bank of halons decreases dramatically between 2002 and 2015, and this also holds for the bank in refrigeration equipment (mainly due to the large content of CFCs in the year 2002). The importance of the banks in mobile and stationary air conditioning seem to be relatively low in the Article 5(1) countries. In GWP terms the bank in stationary air conditioning increases due to market growth (and to a small degree due to application of HFC mixtures instead of HCFC-22). The foam bank is much smaller here than in the non-Article 5(1) countries and decreases to two third the amount in ODP ktonnes by the year 2015.

31
Figure 4-2 shows the emissions for the world as well as for the non-Article 5(1) and the Article 5(1) countries. Mobile air conditioning is now the top-emitter in the non-Article 5(1) countries in 2002 (both in ODP and in GWP terms), with a enormous decrease in 2015 for the BAU scenario and even more for the MIT scenario. Refrigeration is the top emitter in the Article 5(1) countries, with a large decrease in ODP tonnes (not so much in Mt CO2-eq) by 2015 in the BAU scenario, and a further decrease in the MIT scenario (where the decrease in Mt CO2-eq is quite outspoken). In ODP tonnes, the emissions from halon systems are still very significant, in both the non-Article 5(1) and the Article 5(1) countries. The emissions from foams are relatively small in 2002 but certainly not negligible. In the non-Article 5(1) countries, the contribution of these emissions forms the largest of all in the year 2015, not much different from the contribution of halons in ODP terms. Refrigeration equipment remains an important source of ODP related emissions in the Article 5(1) countries by 2015 (where only the halon contribution is supposed to be larger).

32
MIT 2015BAU 2015
2002
BAU-2015/MIT-2015
2002
0
500
1,000
1,500
2,000
2,500
0 2000 4000 6000 8000 10000 12000GWP (MtCO2-eq)
OD
P (k
t OD
P)
Refrigeration
Fire protection
Mobile AC SAC
Foams
Banks - WORLD
BAU-2015/MIT-2015
2002
0
100
200
300
400
500
600
700
800
0 500 1000 1500 2000 2500 3000 3500GWP (MtCO2-eq)
OD
P (k
t OD
P)
Refrig.
Fire protection
MACSAC
Banks - DEVELOPED COUNTRIES
MIT 2015
BAU 2015
2002
1,000
1,200
1,400
1,600
8000 9000 10000
Foams
MIT 2015BAU 2015
2002
BAU-2015/MIT-2015
2002
0
100
200
300
400
500
600
700
800
0 500 1000 1500 2000 2500 3000 3500GWP (MtCO2-eq)
OD
P (k
t OD
P)
Refrigeration
Fire protection
MACSAC
Foams
Banks - DEVELOPING COUNTRIES
Figure 4-1 Scatter diagram for the sectoral banks of halocarbons expressed in GWP (MtCO2-eq) and ODP (kt ODP) for 2002, and for 2015 in both the Business-As-Usual and the Mitigation Scenario.

33
2002
BAU-2015
MIT-2015
BAU-2015/MIT-2015
2002
0
10
20
30
40
50
60
70
80
90
100
0 200 400 600 800 1000 1200GWP (MtCO2-eq yr-1)
OD
P (k
t OD
P yr
-1)
Refrigeration
Fire protection
Mobile AC
SAC
Foams
Emissions - WORLD
Medicalaerosols
MIT-2015 BAU-2015
2002
2002
BAU-2015/MIT-2015
0
10
20
30
40
50
60
70
0 100 200 300 400 500 600 700 800GWP (MtCO2-eq yr-1)
OD
P (k
t OD
P yr
-1)
Refrigeration
Fire protection
Mobile AC
SAC
Foams
Emissions - DEVELOPED COUNTRIES
Medicalaerosols
MIT-2015
BAU-2015
2002
2002
BAU-2015/MIT-2015
0
10
20
30
40
50
60
70
0 100 200 300 400 500 600 700 800GWP (MtCO2-eq yr-1)
OD
P (k
t OD
P yr
-1)
Refrigeration
Mobile AC
Stationary ACFoams
Emissions - DEVELOPING COUNTRIES
Medicalaerosols
Fire protection
Figure 4-2 Scatter diagram for the sectoral emissions of halocarbons expressed in GWP (MtCO2-eq) and ODP (kt ODP) for 2002, and for 2015 in both the Business-As-Usual and the Mitigation Scenario.


35
5 Mitigation Costs
5.1 Introduction
The options to reduce ODS (and GHG) emissions explored in the Special Report (IPCC TEAP, 2005) include: improved containment of substances; reduced charge of substances in equipment; end-of-life recovery and recycling or destruction of substances; increased use of alternative substances with a lower or zero global warming potential; not-in-kind technologies; acceleration of the remaining phase-outs (and less dependence on ODSs for exempted feedstock uses, process agent applications, quarantine uses, as well as essential CFC and critical MB uses, where the latter five applications are not considered in this report). In the Special Report mitigation was considered in the context of lowering global warming impact. This implied considerations on the conversion of equipment manufacturing to certain non-ODS and also to very low GWP alternatives. Mitigation costs were derived for several sectors for avoiding certain amounts of direct global warming emissions. Mitigation of global warming contributions from substances in equipment or products was considered via a mitigation (MIT) scenario, found in chapter 4 of this report. The mitigation scenario assumed a high degree of recover and recycle, good containment, charge reduction in new equipment etc. Costs of recovery and destruction were considered in general terms in a separate chapter in the Special Report (see chapter 11 in IPCC TEAP, 2005); the MIT scenario had no real overall cost component attached to it. Mitigation where it concerns mitigating the impact of (ODS) emissions on the ozone layer (depletion or recovery) is of a different kind. Where it concerns CFC based equipment and products, the CFC production phase-out by 1996 in the non-Article 5(1) and by 2010 in the Article 5(1) countries is important. It can reasonably be assumed that, as of 2005, no new CFC equipment will be put on the market world-wide (this specifically applies to Article 5(1) countries). CFC based equipment and products still on the market in 2002 (the starting point for the BAU and MIT scenario) will be replaced by non CFC products in the course of a number of years. For a very significant part this has already occurred in the non-Article 5(1) countries, it is occurring in the Article 5(1) countries with the assistance of the Multilateral Fund. The mitigation of the impact on the ozone layer will mainly consist of the avoiding of emissions. Where emissions during operation (which are offset by charging during servicing, which therefore does not add to the bank) are difficult to avoid, mitigation actually applies here to avoiding the release of the substances in the banks. Clear societal value can be ascribed to preventing further emissions of ODS and GHGs. However, quantifying this value and comparing it against the cost

36
of recovery and destruction is more difficult and there are obvious uncertainties on both sides. It is not simple matter adding current mitigation valuations from more general abatement strategies. Nevertheless, it would seem inappropriate to ignore the potential environmental benefit of potentially cost-effective measures. Accordingly, there may be a place for flexible fiscal mechanisms, which provide incentives without prescription. Mitigation costs for emissions from banks are significantly greater than those costs traditionally supported for ODS phase-out. This is due to the fact that the cost calculation for ODS phase-out takes into consideration the annual ODS use and related phase-out in a manufacturing operation (at a cost effectiveness of about US $5-15); this is the usual procedure followed in projects submitted to the Executive Committee of the Multilateral Fund. However, the cost of avoiding the release of emissions from banks is related to the quantity of the substances itself, produced during a number of years and is therefore significantly greater. Mitigation costs for the emissions from banks may be economically justified when the additional value of greenhouse gas reduction is accounted. In the case of concentrated sources mitigation can be practised by: (a) the recovery of chemicals at end of life and subsequent storage (with
possible emission at a much later stage, when the impact on the ozone layer recovery will be negligible). However, this option is not to be preferred because it would still mean an impact on climate at a future stage.
(b) the recovery and collection as under (a) and subsequent destruction.
The decomposition or destruction of ozone-depleting substances, including CFCs, HCFCs and halons (and actually also HFCs) can be achieved using various commercially available and successfully demonstrated technologies. A more detailed overview of destruction technologies and capabilities can be found in (IPCC TEAP, 2005). At the present time, the quantities of fluorinated gases destroyed by the techniques described above are extremely low; potentially, they do not exceed a few thousand tonnes (IPCC TEAP, 2005). In the European Union, the EU Regulation mandates the destruction of CFCs following their recovery; this also applies to foam insulation when recovered from dismantled equipment (EC 2037/2000). Similarly, CFCs recovered from refrigeration and air-conditioning equipment must also be destroyed. The different technologies involve varying costs, effluents and emissions, energy usage, and destruction efficiencies. Further work is required to estimate whether the current number of destruction facilities globally could cope with the quantities of fluorinated gases recovered and destroyed. Another concern would apply to regions and countries where destruction facilities do not exist and where transport

37
regulations for hazardous wastes prevent their transfer to such facilities in other countries (IPCC TEAP, 2005). The costs for recovery and recovery/recycling by units for this purpose start at approximately US $500 per tonne. Costs for collection and storage of the recovered ODS refrigerant, including the logistics involved, can roughly be estimated between US $1,000 and 2,000 per tonne of chemical. Dependent on the degree of contamination and on the quantity delivered for destruction, contaminated and unwanted refrigerant can be destroyed for US $2,500-4,500 per tonne of chemical. As typical costs for the entire operation, US $5 per kg of product (or US $5,000 per tonne of product) can be assumed. In the case of HCFCs, mitigation implies the transition from ODS to non-ODS chemicals and the conversion of manufacturing equipment (which would imply an early phase-out compared to the existing regulations). Additionally it implies the collection and destruction of the banks of HCFCs. Where the costs for collection and destruction will be the same as for CFCs per kg of substance, the costs for collection and destruction are more or less 20 times as expensive per ODP-kg (US $100 per ODP-kg or US $100,000 per ODP-tonne). Here the focus is on refrigerants rather than on the blowing agent HCFC-141b.
5.2 Description of mitigation costs for the refrigeration/AC sector
Refrigeration and mobile air conditioning had an estimated bank of 460 ktonnes of CFCs in 2002, and for 2015 a bank of 70 ktonnes is predicted (world-wide). More than two thirds of this CFC bank can be found in the Article 5(1) countries. It may be assumed that destruction of all available CFCs would start in the year 2008; it would then concern an amount of about 280 ktonnes of CFCs world-wide. Costs for collection and destruction would be in the order of US $1,400 million. If only 10% would be collected and destroyed, the costs would still be in the order of US $140 million, where the impact on ozone layer recovery may not be significant. If one would take into account the emissions that originate during servicing operations, these will add to the emissions from the banks (where the servicing amount over the entire period considered may be even larger than the amount present in the 2002 banks). It needs to be mentioned that there is no practical method to mitigate these emissions. For the investigations of the impacts on the ozone layer, these emissions should actually be considered next to the banks. This will give an adequate impression of the importance of destruction for an earlier recovery of the ozone layer compared to the delay caused by the emissions from servicing.

38
The amount of HCFCs banked in refrigeration and stationary air conditioning was 1,490 ktonnes of product (70 ODP ktonnes) and is predicted to be about 1,600 ktonnes of product in 2015 (this is dependent on whether the BAU or MIT scenario is selected). Up to 2015 (the amount of HCFCs contained in products up to 2015) collection and destruction would apply to at least 1,000 ktonnes of product, if one assumes that destruction would start in 2008. The number is high, because in the period 2008-2015 a number of HCFC products will be replaced by HFC products and products withdrawn from the market would have to be treated at end of life (recovery of the chemical contained). Destruction would imply costs in the order of US $100 billion. Taking into account that it concerns only a percentage of the CFCs assumed to be destroyed as of 2008, costs are enormously high. One should also take into account that, after 2015, equipment based on HCFCs will still be marketed. This can only be avoided if all HCFC equipment manufacturing would be converted (which will introduce a very high cost component). Otherwise it would add to the destruction costs in future (after the period 2008-2015).
5.3 Description of mitigation costs for the foam sector
Mitigation costs for foams need to be assessed in terms of the sub-sector of application (i.e. appliances or buildings) and the stage in the life-cycle within which the mitigation is proposed. An example of such an assessment is that being conducted by the Japanese Technical Center on Construction Materials (JTCCM) to evaluate the cost effectiveness of recovery of blowing agents from foams in buildings. The cost-effectiveness is the subject of the fourth and final year of the project which will conclude and report in March 2006. Preliminary indications from previous work carried out in the field (Swedish EPA, 1995) show that recovery from traditional buildings may be uneconomical. However, the fact that steel-faced panels could be processed through recapture/recycle mechanical refrigerator plants may have an impact on future achievements. These approaches have been stimulated under the Montreal Protocol framework, even though recovery is not mandated. Under the Multilateral Fund, the finance made available for phase-out is typically capped at US $15/kg for CFC-11 (Jeffs, Ashford, Albach and Kotaji, 2004). At previous levels of activity, the mechanical recapture/recycling processes were handling domestic refrigerators at a net cost of US $15-20/unit (UNEP TEAP, 2002), although more recent information from the market suggests that this may have even fallen as low as US $10/unit. With typical recovery levels of 250-325g per unit, the cost of recapture and destruction is US $30-60 per kg of blowing agent or US $30,000-60,000 per ODP tonne. This figure would necessarily increase for HCFC-141b because of its lower ODP with costs increasing to US $250,000- US $500,000 per ODP tonne.

39
As noted earlier, these figures are based on mechanical recovery through refrigerator plants. In these instances, investment decisions will be based primarily on CFCs, which offer the lowest recovery cost. It could therefore be argued that later recovery of HCFCs (and indeed HFCs) should only be treated in incremental cost terms. However, such discrimination is unlikely to take place commercially.
5.4 Description of mitigation costs for halon sector
In 2008, the bank of halons would amount to 780 ODP ktonnes, or about 120 ktonnes of product (both halon-1301 and -1211). Available halon-1301 should be banked and managed for critical uses, but halon-1211 may be available for destruction. The costs for destruction of halon-1211 would be about US $500 million, which is less costly per ODP tonne than destruction of CFCs. At the sectoral level, collection and destruction of the halon-1301 bank is counterproductive because available supply is necessary for critical uses. Beyond the need to support long-term requirements for halon-1211 such as in commercial aircraft, military applications, etc., destruction of some halon-1211 might be made cost-effective relative to other ODS depending upon economic offsets to the extreme collection difficulties. Destruction of halon offers no benefit to climate protection due to the fact that halons are contributing to a net global cooling effect.


41
6 Impacts on ozone layer recovery In the previous chapters the global banks of ozone depleting substances are given. In this chapter their potential effects on the future ozone layer are discussed using the existing and well-documented methods used in the UNEP/WMO Scientific Assessment of Ozone Depletion (WMO, 1999, 2003). Observations of concentrations in the atmosphere constrain the past emissions, but the banks are the difference between cumulative emissions and production and have much larger uncertainties. The banks in (IPCC TEAP, 2005), which are further discussed in chapters 3 and 4 in this report are a result of the calculations of equipment and products manufactured and charged with certain amounts of ODSs; their uncertainties do not originate from emission and production figures. The reported banks of CFCs and HCFCs of Chapter 3 are considerably larger than those given in (WMO, 2003), especially for CFC-11 and CFC-12. The CFC-11 bank in 2002 is 590 ktonnes according to (WMO, 2003) compared with 1690 ktonnes according to Chapter 3 (see also Ashford et al., 2004c, IPCC TEAP, 2005). The CFC-12 bank in 2003 is virtually zero according to WMO (2003) compared with 710 ktonnes as follows from information given in Chapter 3. The larger banks in Chapter 3 are characterised by significantly lower emissions of CFC-11 and CFC-12 over the past 10 years, if compared with the emissions reported in (WMO, 2003). The lower emissions cannot support the observations in the atmosphere – that is, they lead to global atmospheric concentrations about 40 ppt lower than those observed in 2002 for both CFC-11 and CFC-12. However, it should be mentioned that the banks discussed here are the banks for refrigeration, AC, foams and halons and the releases from these banks do not represent all ODS emissions. Emissions are also likely to result from direct-emissive applications, applications not considered in this Supplement Report. The uncertainty in the accumulated top-down emissions is estimated at about 3%, based on an estimated 2–3% uncertainty in observed concentrations by different measurement networks (IPCC TEAP, 2005, Table 2-1). Based on an inverse calculation, the accumulated emissions for 1990-2001, which are needed to support the observations of CFC-11 and CFC-12, have an uncertainty of about 4%, assuming an uncertainty in the observed concentration trends of 1%. The uncertainty in cumulative production is harder to estimate. The total 1990-2001 production of CFC-11 and CFC-12 in (Ashford et al., 2004b and 2004c) is about 30–35% lower than in (WMO, 2003). This difference can be largely attributed to the fact that production data not reported to AFEAS (2004) have not been taken into account, however, they are included in UNEP production data. Because the additional UNEP production is most likely used in rapid-release applications (IPCC TEAP, 2005, chapter 11), it does not change the size of the bank.

42
Uncertainties in accumulated emission and production add up to the uncertainty in the change in the bank from 1990 to 2002, which applies to both the bank in (WMO, 2003) and the banks given in this Supplement Report. The virtually zero bank of CFC-12 reported in (WMO 2003) is not in agreement with the data in Chapter 3 (see also chapter 6 of IPCC TEAP, 2005), because CFC-12 is still contained in refrigeration and mobile air conditioning equipment currently operated. The concept of Equivalent Effective Stratospheric Chlorine (EESC)1, as defined in the 2002 Report of the Science Assessment Panel (WMO, 2003), can be used to estimate the effects of the ODSs on the ozone layer. The year of ozone layer ‘recovery’ is defined by a return to pre-1980 EESC values.
1940 1980 2020 2060 21000
500
1000
1500
2000
2500
3000
3500
EE
SC
(ppt
)
Ab BaselineE0 Zero emissionsAm MaximumP0 Zero productionPc Continued production
1980 level
E0
Am
Pc
Figure 6-1 Estimates of future EESC based on the baseline scenario (Ab; solid line), the maximum scenario (Am; long-dashed line), and the hypothetical cases of zero emissions in 2003 and thereafter (E0), and zero production in 2003 and thereafter of all anthropogenic ODSs (P0). Also shown are results from the scenario with continued ODS production in the future at 1999 rates (Pc), production that is substantially larger than allowed in the fully revised and amended Montreal Protocol (Figure 1-23 from WMO, 2003).
Figure 6-1 shows the EESC for different scenarios discussed in (WMO, 2003). The maximum (Am) and zero emissions (E0) scenarios show the range of possible future
1 EESC is the effective halogen abundance that characterises the impact of (all types) of ODS emissions on stratospheric ozone

43
EESC values. The hypothetical zero emissions scenario gives the lower limit of chlorine/bromine loading governed by the destruction of ODSs in the atmosphere. The zero emissions scenario could be considered as the mitigation scenario with maximum impact.
Banks 2002 (ktonnes)
E0(E1)
Ab scenario(WMO, 2003)
SROC/ Supplement
CFC-11 - 594 1687 CFC-12 - 0 711 HCFC-141b - 753 836 HCFC-142b - 210 224 HCFC-22 - 1317 1531 Year of return of
the EESC to 1980 levels
2034(2039)
2044 2046
Table 6-1 Estimates of bank sizes in different scenarios and of the year of the return of the EESC to 1980 values (E0 denotes the hypothetical case that all emissions would stop in 2003, E1 the case when no emissions would occur from banks) The maximum (Am) scenario gives the maximum EESC values based on an estimate of the maximum allowed production under the Montreal Protocol. The assumptions made for the maximum scenario of HCFCs in (WMO 2003) yield significantly lower emissions and banks than given in Chapter 3. The EESC for the maximum scenario (Am) shown in Figure 6-1 would increase slightly taking the larger banks of Chapter 3 into account. Table 6-1 gives the typical sizes of the 2002 banks for a number of fluorocarbon chemicals for the baseline in (WMO, 2003) and of the banks in the Special Report (and in this Supplement Report). If no emissions occurred from the ODS banks as estimated in (WMO, 2003), the date when the EESC is estimated to return to its 1980 value is 2039, or an acceleration of about five years. Finally, if emissions of all ODSs were stopped in 2003, the date when the EESC is estimated to return to its 1980 value was given as 2034 in (WMO, 2003), an acceleration of about ten years. Both values have been given in Table 6-1. The best estimate of the year when the EESC is projected to return to 1980 values for the baseline scenario of (WMO, 2003) is 2044, if the banks of all ODSs are as estimated in (WMO, 2003). It needs to be mentioned that the hypothetical bank of CFC-12 in the Ab (WMO, 2003) scenario is equal to zero, which does not reflect the real situation (see also Chapter 3). If the sizes of the banks of CFCs and HCFCs are as estimated in Chapter 3, this return to the 1980 values would be estimated to occur in the year 2046. In this case, no emissions out of the foam

44
bank were considered to be of significant impact. The return of the EESC to its 1980 value based on an estimated maximum allowed production under the Montreal Protocol is 2048 (not mentioned in Table 6-1). If one would take into account the emissions from servicing, which will add to the emissions from the banks (where the servicing amount over the entire period considered may be even larger than the amount present in the 2002 banks in certain sub-sectors), the return of the EESC to 1980 values levels might be delayed by another two years at maximum compared to the year 2046, for the banks in the Special Report (and in this Supplement). Destruction of all banks in refrigeration and AC equipment as of 2008 (destruction during the period after 2008 at end-of-life, the option considered in chapter 5), may have the consequence that the return of the EESC to 1980 values will again be around the year 2046. Some emissions of banked CFCs (such as the slow emissions of CFC-11 from foams) could occur after ozone recovery. Such emissions would reduce the effect of the banks on ozone recovery but would still contribute to the positive direct radiative forcing as greenhouse gases. Thus the larger banks of some ODSs estimated in Chapter 3 could lead to a maximum delay in ozone recovery of the order of two to three years compared with the baseline scenario. These calculations of the effects of the banks of Chapter 3 on the EESC is based on the emission functions of (WMO, 2003), resulting in somewhat different emissions and banks for CFC-12 and HCFCs in 2015 than given in Chapter 3. The effect of this on the year of recovery will be limited since most emissions will take place anyway (and affect the ozone layer) before the approximate year of recovery. Thus, the changes in future ODS emissions as discussed here, within ranges compatible with the present uncertainties in the banks, have relatively small effects on the time at which the EESC recovers to 1980 levels and therefore on stratospheric ozone and the indirect radiative forcing of these gases. The absolute value for the EESC to return to its 1980 levels depends on uncertainties in the physical and chemical processes involved resulting in somewhat later or earlier recovery than given here (IPCC TEAP, 2005, chapter 1). The uncertainty associated with the differences between the scenarios discussed here is much smaller. In this chapter the effects of the size of the banks of ODS on the year the EESC drops below its 1980 level has been discussed. Clearly an ODS scenario affects the stratospheric chlorine and bromine levels and thereby the ozone layer also in the period up to the year of recovery. Integrating the change in the EESC from a specific year to the year the EESC drops below its

45
1980 level gives another measure to compare the effects of scenarios (see WMO, 2003). An update of scenarios of ODS and corresponding EESC calculations will be presented in the upcoming "UNEP/WMO Scientific Assessment of Ozone Depletion: 2006".


47
7 Discrepancies between emissions determined from bottom-up methods and from atmospheric measurements
7.1 Sources of uncertainty regarding consumption
Efforts to model the use (consumption) and emission of ODSs and their replacements by sector have been on-going since the mid-1990s. One of the advantages of working with ODSs controlled under the Montreal Protocol is that actions to quantify the historic use patterns had already been established under both the Alternative Fluorocarbon Environmental Assessment Study (AFEAS) and UNEP itself. The AFEAS data originate from the major producers of ODSs and their alternatives and have the advantage of being split by substance and sales pattern by sector. However, one drawback is that they are only declared by ‘hemisphere’ to avoid disclosure of confidential business information. Since AFEAS is effectively a consortium of producers, there is also the problem that the sales from producers that are not members of AFEAS are not included. Since all of the major historic manufacturers are members of AFEAS, this is not a particular problem for historic data but has become more of an issue as production of ODSs and their substitutes has extended to newer manufacturers in Article 5(1) countries. The final point to observe on the AFEAS dataset is that the process for the allocation of sales to sectors has never been made fully transparent. For example, it is not clear as to what percentage of sales were to distributors and may have ended up in applications other than those anticipated. Additionally, there may not have been a total understanding among sales staff as to whether sales to the foam sector were destined for open-celled or close-celled applications. UNEP’s data collection efforts on the other hand are reported directly by Parties and this has provided production, consumption, import and export data at country level. However, there has been no effort during the collection of these data series to assess sales patterns by sector. In earlier years, where discrepancies between AFEAS and UNEP data were relatively minor, this was of less importance to modellers. However, as the coverage of the AFEAS dataset has become less comprehensive, and the discrepancies between UNEP and AFEAS datasets have become larger, the knowledge of sectoral end-use pattern has become less complete. To compensate for this, modellers have moved to other sources for information, including the database of multilaterally funded projects, which provides details of original consumption and transition strategies on a project-by-project basis. Although fairly painstaking to conduct, such analysis can provide important clarification of use patterns in the Article 5(1) countries.

48
However, there can be some difficulties in the precise timing of transition where, for instance, projects might be completed operationally but not finalised contractually or vice versa. Additionally, not all the use of ODS or ODS substitutes will be covered by funded projects. Not surprisingly, therefore, the MLF Project database rarely provides a total explanation for the gap between UNEP data and AFEAS assessments bearing in mind that this gap cannot be assessed in any event at country-level because of the lack of geographic definition in the AFEAS dataset. Other sources such as Country Programmes, independent studies and local contacts all come into play as sources of further corroborative data.
In the end, the sectoral modeller builds a model based only on the use, which can be positively assigned to the sector in question. This then has to be combined with outputs from modellers addressing other sectors to assemble a bottom-up, globally complete picture of consumption, which can be compared with the global UNEP dataset. It is still usual that the bottom-up approach falls short of the UNEP total, possibly because not all actual use-sectors are covered in any bottom-up approach. However, it is typical to see greater than 80% of historic and current annual consumption covered by these methods. For some sectors, where there are large numbers of broadly replicated equipment and market data are prevalent, it is possible to carry out an even more elaborate assessment based on the equipment data themselves. Such is the case for several types of refrigeration equipment where units are often standardised and sold globally. A primary example would be domestic refrigerators. Unitary air conditioners would be another. Accordingly, bottom-up work in the refrigeration sector tends also to have a significant component of equipment data as an additional cross-referencing factor based on assumptions about charge levels. However, it is important that such data are not relied upon in isolation because small errors in assumption at unitary level can lead to substantial errors when extrapolated to a global dataset. Similar options exist for fire fighting equipment which is a well documented equipment market, but the same is not true for most foams (with the possible exception of that used in domestic refrigerators) because building designs are not uniform either regionally (both climates and building methods vary) or by type.
In conclusion, the usage or consumption patterns, put together within bottom-up models, probably represent the most complete sectoral analysis available. This baseline is essential for adequate emissions assessment since the lifecycle emission profiles vary so substantially. However, the lack of full sectoral coverage continues to make the assessments incomplete. In the HFC/PFC Special Report, the coverage was further limited by the scope of focusing on those sectors which have selected substitutes containing HFCs and/or PFCs. These factors are important when considering the overall

49
evaluation of consumption and emissions from a bottom-up perspective in that report.
7.2 Sources of uncertainty regarding emission factors
It can be seen that the use of ODS, which has taken place in sectors likely to develop banks, has been well studied but continues to be an area where global data can be improved. However, before these data can be translated into a meaningful assessment of emissions, there is a need to apply appropriate emission factors to the data. Since emissions vary through the lifecycle of an application, there is also a need to keep a disciplined record of the time series of use rather than just the cumulative value of historic use at any given time. In other words, it is not just sufficient to know ‘how much is in the bank’. It is also necessary to know ‘when it entered the bank and when it is likely to leave’. An additional complicating factor is that specific applications within a sector can have very different emissions profiles. This means that the use needs to be known at sub-sectoral level in order for the appropriate emission factors to be applied. This fact brings with it two potential sources of further uncertainty. The first relates to the access to historical time-series of usage at sub-sectoral (application) level. This further highlights the importance of genuinely designed bottom-up methods, which are generally better at characterising sub-sectoral definition. The second potential source is the statistical variation, which will always occur in practice around an average lifecycle characterisation. Most bottom-up models have point assumptions for matters such as the lifetime of a product or piece of equipment. Therefore, the retirement date of a piece of equipment is fixed by its year of manufacture. In reality, of course, some equipment will be retired earlier and some later. Taking the domestic refrigerator example, it is not likely that everyone who purchased a domestic refrigerator in 1990 will have chosen to throw it away in 2005. Some will have been disposed of earlier and others will remain in operation for much longer than the assumed 15 year average. Therefore, to predict the end-of-life emissions for domestic refrigerators in 2005 is fraught with the potential of substantial over-estimation or under-estimation. This is particularly important when the bulk of emissions are assigned to end-of-life activities, as is the case with foams. Accordingly, foam emissions can carry with them substantial error bars when data are quoted on an annualised basis. However, it is usually expected to be much more accurate when longer time periods are reviewed, reflecting the fact that it is easier to predict that a given refrigerator will be retired in a ten-year time period than it is to make the same prediction for a one year time period. By way of example, the Table 7-1 illustrates the expected errors in emission for different foam blowing agents.

50
Table 7-1 Expected errors in emission estimates for different foam blowing agents
Blowing Agent Annual Emission Uncertainty
(2002) (tonnes / % of bank)
Key Sources in 2002 Uncertainty Level
Upper bound Lower bound CFC-11
+10,000/ 0.6%
-10,000/ -0.6%
Domestic Appliance (EoL) PU Boardstock (in-use) PU Spray (in-use)
High (for specific year) Low Low
HCFC-141b
+10,000/ 1.2%
-5,000/ -0.6%
PU Boardstock (prod/use) PU Spray (prod/use) Dom. Appliance (prod/use)
Medium (transition yr.) High (transition plus prod. losses) Low
HCFC-142b +5,000/ 2.2% -0/ 0.0% XPS (prod/use) PE rigid (prod/use)
Medium (Prod. losses) High (activity)
HFCs +2,500/ 21% -2,500/ -21% XPS (prod/use) High (HFC-152a emission rate)
It can be seen from the table that uncertainties need to be specified for specific years. There may be some periods in which there is little uncertainty year-on-year about what is happening, but others in which much may be going on. Then there are potential sources of uncertainty from the emission factors themselves. These are usually assumptions based on estimates produced from small-scale studies within a given sector. Good examples would be the determination of blowing agent levels in refrigerators and steel faced panels after 25 years. From measurements made on retained blowing agent and comparisons with the original formulations, believed to have been used in their manufacture, it is evident that losses are very low in the use phase of these respective products (typically 0.25% per annum or less). This should come as little surprise for foams encapsulated with sheet steel. Of course, this assessment makes no judgement on the blowing agent that may have been lost during the formulation of the foam system or the manufacture of the product, which are steps that have to be assessed separately. In the case of refrigeration equipment, the servicing (top-up) demand can be another way of identifying the emissions from a sub-sector and back-calculating the relevant emission factors. Based on the uncertainty levels indicated in Table 2-2, the uncertainties in banks and emissions for each refrigeration sub-sector are summarised in Table 7-2 below:

51
Table 7-2 Uncertainties by sub-sector and overall
Bank Emissions * Domestic +/- 17.5% +/- 8% Commercial +/- 22.5% +/- 28% Industrial +/- 27.5% +/- 33% Transport +/- 22.5% +/- 28.5% Stationary AC +/- 17.5% +/- 22.5% Mobile AC +/- 12.5% +/- 18.5% Overall +/- 19% +/- 24.5%
Note: uncertainties in emissions are on an annual basis
7.3 Reconciling the discrepancies
The determination of emissions via the bottom-up method has previously revealed substantial discrepancies with the emissions calculated from atmospheric measurements of the same chemicals. However, closer analysis of these apparent discrepancies has found that even relatively small use of fluorocarbons in rapidly emitting uses in Article 5(1) countries (see Section 7.1) can dominate emissions for specific chemicals (e.g. CFC-11) in specific years (IPCC TEAP, 2005). This implies that there is a need to investigate production data, both from producers as reported to AFEAS and from countries as submitted to UNEP under the Montreal Protocol (Article 7 on data reporting), in order to determine where such emissions might appear. However, as noted previously, the key weakness in the UNEP dataset is that it makes no provision for the recording of use patterns. Nonetheless, the quantification of the gap between UNEP production and consumption data and AFEAS data is essential. The emission factors used in the AFEAS reports themselves are derived from a consideration of the respective emission patterns and release delays for each sector but are not always as sophisticated as those used in the bottom-up assessments. By way of an example, the allocation of all HCFC-141b foam sales to “closed-cell foams” may be inappropriate in view of uses in integral skin and other more rapid-release foam applications. This said, estimates of atmospheric concentrations based on production statistics provided by manufacturers and national governments coupled with historical emission factors were, until recently, a good match with the observations, largely because of the dominance of rapid-release applications in non-Article 5(1) countries. However, as the detailed assessment of delayed-release applications has become more important in non-Article 5(1) countries and the gap between UNEP data and AFEAS data has increased, reflecting higher levels of activity in Article 5(1) countries, the lack of use pattern data via the UNEP reporting structure is now a key impediment, particularly where usage might be occurring in rapid-release applications.

52
The improvement of knowledge about the use of the individual chemicals, both in the non-Article 5(1) and in the Article 5(1) countries, as well as uncertainties in emissions factors from banks following the bottom-up method remains a key objective. This has implications for the calculation of emission scenarios for the period 2002-2015, in particular the contributions from Article 5(1) countries. It may therefore be the case that the emissions are significantly larger than calculated via the bottom-up method for refrigeration and foams only because of additional contributions from rapid-release applications. In addition, the emission factors applied to HCFCs and HFCs were derived from those developed earlier for CFCs and HCFC-22. However, there have been considerable changes in use practices in the wake of the Montreal Protocol and emission factors are subject to continual review. The view is (IPCC TEAP, 2005) that variation and uncertainties in emission factors per se are less significant overall than uncertainties in overall use pattern distributions between rapid-release applications and the delayed-release applications represented by refrigeration and foams. This implies that, in the near future, further study is needed of the use patterns for the total production forecast for the period 2002-2015 in both the non-Article 5(1) and the Article 5(1) countries. Further study will also be needed to make more precise estimates of future emissions from banks in refrigeration and foams, given the accuracy of calculations of the size of the banks and the emissions derived from them, as well as servicing practices, and issues relating to recovery and recycling and end-of-life.

53
8 Concluding remarks
The Special Report concludes that the remaining banked ODSs, together with possible future ODS use in Article 5(1) countries, are significant sources of ozone depletion emissions with a related climate change impact over the next 50-100 years. There continues to be some debate about the size of these banks and on whether mitigation scenarios can be practically effective in reducing emissions, from a technical and cost point of view. However, there are already demonstrable savings being achieved in relevant sub-sectors (e.g. domestic refrigeration) in various regions of the world. In this Supplement Report, demand, banks and emissions are considered for the world-total, as well as for the non-Article 5(1) and the Article 5(1) countries separately. This will yield insight on the percentage release from banks in different regions of the world, where banks (and emissions) may be completely different in composition.
The time-scale for action varies by sector and, for instance, foams in buildings containing ODS are unlikely to be reaching the waste stream in any significant measure prior to 2015. In contrast, most CFCs will have already been emitted from the refrigerant bank by 2015 unless action is taken to prevent this. The best estimate of the year when the EESC (see further chapter 6) is projected to return to the 1980 values for the baseline scenario of (WMO, 2003) is 2044, if the banks of all ODSs are as estimated in (WMO, 2003). If the banks of CFCs and HCFCs are as estimated in Chapter 3, this return to the 1980 values would be estimated to occur in the year 2046. Taking into account the emissions from servicing refrigeration and AC equipment, which will add to the emissions from the banks, the return of the EESC to 1980 values levels might be delayed by another two years, at maximum (2048). Destruction of all banks in refrigeration and AC equipment as of 2008 (at end of life) may lead to a return of the EESC to 1980 values around the year 2046. Mitigation costs for emissions from banks are significantly greater than those costs traditionally supported for ODS phase-out but may be economically justified when the additional value of greenhouse gas reduction is accounted. It therefore seems unlikely that it will be possible to extend mandates for recovery unless the cost-effectiveness calculation includes greenhouse gas benefits. At sectoral level, the halon bank would fail on both accounts due to the high expenses involved in trying to collect small quantities widely dispersed, as well as the fact that halons are contributing to a net global cooling effect. For CFCs, refrigerant recovery and collection is estimated at US $2 per ODP kg (and an additional US $3 per ODP kg for destruction) with foam blowing agent recovery an order of magnitude greater. It should be

54
noted that these values increase further in the case of HCFC recovery (and destruction). There is therefore clearly need for further research on more cost-effective destruction techniques (e.g. direct foam incineration). Where relevant, the cost of avoiding additional banks of ODSs and GHGs, by an accelerated ODS phase-out using appropriate alternative technologies, may be less than for collection and destruction. An alternative technology that increases the overall climate change impact of the application cannot be described as appropriate. The relationship between halon, refrigerant and blowing agent options changes considerably if any credit is given for the greenhouse gas component of any recovery measure. This would need to be reflected in some fiscal incentive for destruction, possibly linked with existing emission trading options for greenhouse gases. Finally, in Article 5(1) countries, the implication of collection and recovery costs are likely to be greater than in non-Article 5(1) countries owing to the lack of infra-structure. Indeed, end-of-life concepts are very different in Article 5(1) countries from the ones in non-Article 5(1) countries and the degree of re-use is generally much higher.

55
9 References
Ashford, P., D. Clodic, A. McCulloch, L. Kuijpers, 2004a: Emission profiles from the foam and refrigeration sectors compared with atmospheric concentrations, part 1 - Methodology and data. International Journal of Refrigeration, 27(7), 687–700
Ashford, P., D. Clodic, A. McCulloch, L. Kuijpers, 2004b: Emission profiles from the foam and refrigeration sectors compared with atmospheric concentrations, part 2 - Results and discussion. International Journal of Refrigeration, 27(7), 701–716
Ashford, P., D. Clodic, A. McCulloch, L. Kuijpers, 2004c: Determination of Comparative HCFC and HFC Emission Profiles for the Foam and Refrigeration Sectors until 2015. Part 1: Refrigerant Emission Profiles (L. Palandre and D. Clodic, Armines, Paris, France, 132 pp.), Part 2: Foam Sector (P. Ashford, Caleb Management Services, Bristol, UK, 238 pp.), Part 3: Total Emissions and Global Atmospheric Concentrations (A. McCulloch, Marbury Technical Consulting, Comberbach, UK, 77 pp.). Reports prepared for the French ADEME and the US EPA.
IPCC TEAP, 2005: IPCC/TEAP Special Report on Safeguarding the ozone Layer and the Global Climate System: Issues related to Hydrofluorocarbons and Perfluorocarbons. Prepared by Working Group I and III of the Intergovernmental Panel on Climate Change and the Technology and Economic Assessment Panel under the Montreal Protocol (Metz, B., L. Kuijpers, S. Solomon, S.O. Andersen, O. Davidson, J. Pons, D. de Jager, T. Kestin, M. Manning, and L.A. Meyer (editors). Cambridge University Press, Cambridge, UK, and New York, NY, USA, 488 pp
Jeffs, M., Ashford, P., Albach and Kotaji, 2004: Emerging Usage Patterns for HFCs in the Foams Sector in the light of Responsible Use Patterns. Proceedings of the Earth Technologies Forum, Washington, April 2004.
Swedish EPA, 1996, Stena freonatervinning Projekt SNVIII (in Swedish only)
UNEP TEAP, 2002: Report of the Task Force on Collection, Recovery and Storage and Report of the Task Force on Destruction Technologies. Report of the Technology and Economic Assessment Panel April 2002, Volume 3 (consisting of Volume 3A and 3B). (W. Brunner, J. Pons and S.O. Andersen, editors of Volume 3A, and S. Devotta, A. Finkelstein and L. Kuijpers, editors of Volume 3B). UNEP, UNON Nairobi, ISBN 92-807-2229-8
Verdonik, D., 2005: Personal Communication on the corrected HTOC model calculations for halon-1211, 31 October 2005
WMO, 2003: Scientific Assessment of Ozone Depletion: 2002. Global Ozone Research and Monitoring Project – Report No. 47, World Meteorological Organization, Geneva, 498 pp


57
10 Annexes Detailed tables on demand, banks and emission data 2002-2015
The following tables show the data that were presented in the IPCC/TEAP Special Report on Ozone and Climate (SROC) (IPCC TEAP, 2005) and the assessed literature supporting this report (e.g. Ashford et al., 2004). Please note that the tables include corrected data on banks and emissions for halon-1211 in the fire protection sector and hence data for halons and fire protection differ from the data reported in the IPCC/TEAP Special Report. The 2002 halon-1211 emission data are changed from 17 to 8 product ktonnes per year, whereas 2015 Business-As-Usual projections are changed from 1.6 to 4.6 product ktonnes per year (Verdonik, 2005). The data on demand, banks and emissions expressed in global warming potential (GWP in MtCO2-eq) and ozone depletion potential (ODP in ODP ktonnes) are calculated using the GWPs for direct radiative forcing for a 100-year time horizon and ODPs as reported in (IPCC TEAP, 2005). For HFC-23 by-product emissions, non-medical aerosols and solvents no regional breakdown in demand, banks and emissions is available. Key to the tables ‘Demand’ refers to the net use of fluorocarbons and their alternatives. Due to reuse, demand data may exceed annual production data. ‘Banks’ are the total amount of substances contained in existing equipment, chemical stockpiles, foams and other products not yet released to the atmosphere or destroyed in destruction facilities. ‘Emissions’ refer to direct emissions only. Indirect energy-related greenhouse gas emissions are not included in the tables. BAU-2015: Projections for 2015 in the Business-As-Usual Scenario MIT-2015: Projections for 2015 in the Mitigation Scenario Red-2015: Reduction potential in 2015: difference between the
projections for the Business-As-Usual and the Mitigation Scenario.

Demand WORLDPer group Product GWPSROC ODPSROC
ktonne yr-1
MtCO2-eq yr-1 ktonne ODP yr
-1
2002 BAU-2015 MIT-2015 Red-2015 2002 BAU-2015 MIT-2015 Red-2015 2002 BAU-2015 MIT-2015 Red-2015
Halons 4 10 23
CFCs 169 14 8 5 1,649 125 77 48 162 13 7 5
HCFCs 496 551 391 160 761 905 623 282 32 31 24 8
HFCs 207 663 466 197 449 1,323 889 434
PFCs 0.11 0.02 0.02 1.0 0.2 0.2
Total incl halons 876 1,228 866 363 2,869 2,353 1,589 763 217 44 31 13
Total excl halons 872 1,228 866 363 2,859 2,353 1,589 763 194 44 31 13
Per sector Product GWPSROC ODPSROC
ktonne yr-1
MtCO2-eq yr-1 ktonne ODP yr
-1
2002 BAU-2015 MIT-2015 Red-2015 2002 BAU-2015 MIT-2015 Red-2015 2002 BAU-2015 MIT-2015 Red-2015
Refrigeration 337 578 396 182 1,390 1,335 867 467 85 23 17 7
Stationary Air Conditioning 202 300 212 88 407 512 354 158 19 9 5 4
Mobile Air Conditioning 155 192 142 50 740 296 222 74 56 3 2 0
Foams 150 123 80 43 204 119 69 50 25 6 6
Medical Aerosols 12 15 15 75 40 26 14 8 2 2
Fire Protection 8 4 4 23 14 14 23 0 0
HFC-23 by-product
Non-Medical Aerosols and Solvents 12 17 17 32 37 37 1 1 1
Total incl halons 876 1,228 866 363 2,869 2,353 1,589 763 217 44 31 13
Per subsector Product GWPSROC ODPSROC
ktonne yr-1
MtCO2-eq yr-1 ktonne ODP yr
-1
2002 BAU-2015 MIT-2015 Red-2015 2002 BAU-2015 MIT-2015 Red-2015 2002 BAU-2015 MIT-2015 Red-2015
Domestic Refrigeration 15 22 8 14 83 38 17 21 7 1 1 0
Commercial Refrigeration 277 502 354 148 1,160 1,144 753 391 71 19 13 5
Transport Refrigeration 6 8 6 2 20 23 17 6 1 0 0 0
Industrial Refrigeration 39 46 28 17 127 129 79 50 6 4 3 1
Stationary Air Conditioning 202 300 212 88 407 512 354 158 19 9 5 4
Mobile Air Conditioning 155 192 142 50 740 296 222 74 56 3 2 0
Foams 150 123 80 43 204 119 69 50 25 6 6
Medical Aerosols 12 15 15 75 40 26 14 8 2 2
Fire Protection 8 4 4 23 14 14 23 0 0
HFC-23 by-product
Non-Medical Aerosols and Solvents 12 17 17 32 37 37 1 1 1
Total incl halons 876 1,228 866 363 2,869 2,353 1,589 763 217 44 31 13

Demand WORLDHalons Product GWPSROC ODPSROC
ktonne yr-1
MtCO2-eq yr-1 ktonne ODP yr
-1
per sector 2002 BAU-2015 MIT-2015 Red-2015 2002 BAU-2015 MIT-2015 Red-2015 2002 BAU-2015 MIT-2015 Red-2015
Refrigeration
Stationary Air Conditioning
Mobile Air Conditioning
Foams
Medical Aerosols
Fire Protection 4 10 23
HFC-23 by-product
Non-Medical Aerosols and Solvents
Total 4 10 23
CFCs Product GWPSROC ODPSROC
ktonne yr-1
MtCO2-eq yr-1 ktonne ODP yr
-1
per sector 2002 BAU-2015 MIT-2015 Red-2015 2002 BAU-2015 MIT-2015 Red-2015 2002 BAU-2015 MIT-2015 Red-2015
Refrigeration 82 6 4 2 840 53 38 15 76 5 3 1
Stationary Air Conditioning 11 3 2 2 86 26 14 12 11 3 2 2
Mobile Air Conditioning 56 3 2 0 598 28 25 4 56 3 2 0
Foams 11 56 11
Medical Aerosols 8 2 2 69 17 17 8 2 2
Fire Protection
HFC-23 by-product
Non-Medical Aerosols and Solvents
Total 169 14 8 5 1,649 125 77 48 162 13 7 5
HCFCs Product GWPSROC ODPSROC
ktonne yr-1
MtCO2-eq yr-1 ktonne ODP yr
-1
per sector 2002 BAU-2015 MIT-2015 Red-2015 2002 BAU-2015 MIT-2015 Red-2015 2002 BAU-2015 MIT-2015 Red-2015
Refrigeration 188 378 269 109 332 671 478 194 9 19 13 5
Stationary Air Conditioning 165 106 55 51 281 185 97 88 8 5 3 3
Mobile Air Conditioning 3 1 1 0 5 2 2 0 0 0 0 0
Foams 128 50 50 136 37 37 14 6 6
Medical Aerosols
Fire Protection 0.5 0.3 0.3 0.6 0.1 0.1 0.02 0.01 0.01
HFC-23 by-product
Non-Medical Aerosols and Solvents 11 16 16 6 9 9 1 1 1
Total 496 551 391 160 761 905 623 282 32 31 24 8

Demand WORLDHFCs Product GWPSROC ODPSROC
ktonne yr-1
MtCO2-eq yr-1 ktonne ODP yr
-1
per sector 2002 BAU-2015 MIT-2015 Red-2015 2002 BAU-2015 MIT-2015 Red-2015 2002 BAU-2015 MIT-2015 Red-2015
Refrigeration 66 194 123 71 218 611 351 259
Stationary Air Conditioning 25 190 155 35 40 301 243 58
Mobile Air Conditioning 97 188 138 50 136 265 195 70
Foams 11 73 30 43 11 82 32 50
Medical Aerosols 4 13 15 -2 6 23 26 -4
Fire Protection 3 4 4 12 14 14
HFC-23 by-product
Non-Medical Aerosols and Solvents 1 1 1 25 27 27
Total 207 663 466 197 449 1,323 889 434
PFCs Product GWPSROC ODPSROC
ktonne yr-1
MtCO2-eq yr-1 ktonne ODP yr
-1
per sector 2002 BAU-2015 MIT-2015 Red-2015 2002 BAU-2015 MIT-2015 Red-2015 2002 BAU-2015 MIT-2015 Red-2015
Refrigeration
Stationary Air Conditioning
Mobile Air Conditioning
Foams
Medical Aerosols
Fire Protection 0.01 0.01 0.01 0.1 0.1 0.1
HFC-23 by-product
Non-Medical Aerosols and Solvents 0.10 0.01 0.01 0.9 0.1 0.1
Total 0.11 0.02 0.02 1.0 0.2 0.2

DemandPer group
Halons
CFCs
HCFCs
HFCs
PFCs
Total incl halons
Total excl halons
Per sector
Refrigeration
Stationary Air Conditioning
Mobile Air Conditioning
Foams
Medical Aerosols
Fire Protection
HFC-23 by-product
Non-Medical Aerosols and Solvents
Total incl halons
Per subsector
Domestic Refrigeration
Commercial Refrigeration
Transport Refrigeration
Industrial Refrigeration
Stationary Air Conditioning
Mobile Air Conditioning
Foams
Medical Aerosols
Fire Protection
HFC-23 by-product
Non-Medical Aerosols and Solvents
Total incl halons
A. DEVELOPED COUNTRIESProduct GWPSROC ODPSROC
ktonne yr-1
MtCO2-eq yr-1 ktonne ODP yr
-1
2002 BAU-2015 MIT-2015 Red-2015 2002 BAU-2015 MIT-2015 Red-2015 2002 BAU-2015 MIT-2015 Red-2015
52 3 2 1 515 28 17 11 51 3 2 1
268 47 18 29 391 79 30 49 19 2 1 1
188 505 326 179 392 1,002 607 395
0.01 0.01 0.01 0.1 0.1 0.1
508 555 346 209 1,298 1,109 654 455 70 5 3 3
508 555 346 209 1,298 1,109 654 455 70 5 3 3
Product GWPSROC ODPSROC
ktonne yr-1
MtCO2-eq yr-1 ktonne ODP yr
-1
2002 BAU-2015 MIT-2015 Red-2015 2002 BAU-2015 MIT-2015 Red-2015 2002 BAU-2015 MIT-2015 Red-2015
113 146 85 61 329 497 260 237 6 2 2 1
138 185 124 61 261 307 203 105 11 3 1 2
126 137 92 45 507 193 130 63 35 0 0 0
118 73 30 43 132 82 32 50 11
9 11 11 58 19 19 6
3 3 3 10 9 9 0 0 0
508 555 346 209 1,298 1,109 654 455 70 5 3 3
Product GWPSROC ODPSROC
ktonne yr-1
MtCO2-eq yr-1 ktonne ODP yr
-1
2002 BAU-2015 MIT-2015 Red-2015 2002 BAU-2015 MIT-2015 Red-2015 2002 BAU-2015 MIT-2015 Red-2015
6 7 1 6 9 10 2 8 0 0 0 0
81 110 67 43 234 396 204 192 2 1 0 0
4 6 4 2 13 19 14 5 0 0 0 0
23 23 13 10 73 73 41 32 3 2 1 1
138 185 124 61 261 307 203 105 11 3 1 2
126 137 92 45 507 193 130 63 35 0 0 0
118 73 30 43 132 82 32 50 11
9 11 11 58 19 19 6
3 3 3 10 9 9 0 0 0
508 555 346 209 1,298 1,109 654 455 70 5 3 3
No regional breakdown available No regional breakdown available No regional breakdown available
No regional breakdown available No regional breakdown available No regional breakdown available

DemandHalons
per sector
Refrigeration
Stationary Air Conditioning
Mobile Air Conditioning
Foams
Medical Aerosols
Fire Protection
HFC-23 by-product
Non-Medical Aerosols and Solvents
Total
CFCs
per sector
Refrigeration
Stationary Air Conditioning
Mobile Air Conditioning
Foams
Medical Aerosols
Fire Protection
HFC-23 by-product
Non-Medical Aerosols and Solvents
Total
HCFCs
per sector
Refrigeration
Stationary Air Conditioning
Mobile Air Conditioning
Foams
Medical Aerosols
Fire Protection
HFC-23 by-product
Non-Medical Aerosols and Solvents
Total
A. DEVELOPED COUNTRIESProduct GWPSROC ODPSROC
ktonne yr-1
MtCO2-eq yr-1 ktonne ODP yr
-1
2002 BAU-2015 MIT-2015 Red-2015 2002 BAU-2015 MIT-2015 Red-2015 2002 BAU-2015 MIT-2015 Red-2015
Product GWPSROC ODPSROC
ktonne yr-1
MtCO2-eq yr-1 ktonne ODP yr
-1
2002 BAU-2015 MIT-2015 Red-2015 2002 BAU-2015 MIT-2015 Red-2015 2002 BAU-2015 MIT-2015 Red-2015
4 2 1 1 41 16 11 5 4 1 1 0
6 2 1 1 43 12 6 6 6 2 1 1
35 0 0 0 379 0 0 0 35 0 0 0
6 52 6
52 3 2 1 515 28 17 11 51 3 2 1
Product GWPSROC ODPSROC
ktonne yr-1
MtCO2-eq yr-1 ktonne ODP yr
-1
2002 BAU-2015 MIT-2015 Red-2015 2002 BAU-2015 MIT-2015 Red-2015 2002 BAU-2015 MIT-2015 Red-2015
49 19 12 7 84 32 20 12 2 1 1 0
111 28 6 22 185 46 9 37 5 1 0 1
1 0 0 0 1 0 0 0 0 0 0 0
107 121 11
0.5 0.2 0.2 0.5 0.1 0.1 0.02 0.01 0.01
268 47 18 29 391 79 30 49 19 2 1 1
No regional breakdown available No regional breakdown available No regional breakdown available
No regional breakdown available No regional breakdown available No regional breakdown available

DemandHFCs
per sector
Refrigeration
Stationary Air Conditioning
Mobile Air Conditioning
Foams
Medical Aerosols
Fire Protection
HFC-23 by-product
Non-Medical Aerosols and Solvents
Total
PFCs
per sector
Refrigeration
Stationary Air Conditioning
Mobile Air Conditioning
Foams
Medical Aerosols
Fire Protection
HFC-23 by-product
Non-Medical Aerosols and Solvents
Total
A. DEVELOPED COUNTRIESProduct GWPSROC ODPSROC
ktonne yr-1
MtCO2-eq yr-1 ktonne ODP yr
-1
2002 BAU-2015 MIT-2015 Red-2015 2002 BAU-2015 MIT-2015 Red-2015 2002 BAU-2015 MIT-2015 Red-2015
60 126 72 53 205 449 229 221
21 156 118 38 33 249 187 62
90 137 92 45 127 193 130 63
11 73 30 43 11 82 32 50
3 11 11 6 19 19
3 3 3 10 9 9
188 505 326 179 392 1,002 607 395
Product GWPSROC ODPSROC
ktonne yr-1
MtCO2-eq yr-1 ktonne ODP yr
-1
2002 BAU-2015 MIT-2015 Red-2015 2002 BAU-2015 MIT-2015 Red-2015 2002 BAU-2015 MIT-2015 Red-2015
0.01 0.01 0.01 0.1 0.1 0.1
0.01 0.01 0.01 0.1 0.1 0.1
No regional breakdown available No regional breakdown available No regional breakdown available
No regional breakdown available No regional breakdown available No regional breakdown available

DemandPer group
Halons
CFCs
HCFCs
HFCs
PFCs
Total incl halons
Total excl halons
Per sector
Refrigeration
Stationary Air Conditioning
Mobile Air Conditioning
Foams
Medical Aerosols
Fire Protection
HFC-23 by-product
Non-Medical Aerosols and Solvents
Total incl halons
Per subsector
Domestic Refrigeration
Commercial Refrigeration
Transport Refrigeration
Industrial Refrigeration
Stationary Air Conditioning
Mobile Air Conditioning
Foams
Medical Aerosols
Fire Protection
HFC-23 by-product
Non-Medical Aerosols and Solvents
Total incl halons
B. DEVELOPING COUNTRIESProduct GWPSROC ODPSROC
ktonne yr-1
MtCO2-eq yr-1 ktonne ODP yr
-1
2002 BAU-2015 MIT-2015 Red-2015 2002 BAU-2015 MIT-2015 Red-2015 2002 BAU-2015 MIT-2015 Red-2015
4 10 23
117 10 6 4 1,134 97 60 37 111 10 6 4
217 489 358 131 364 817 584 233 12 28 21 7
18 157 139 18 32 294 255 39
0.001 0.002 0.002 0.01 0.01 0.01
356 656 503 153 1,539 1,207 899 308 147 37 27 10
352 656 503 153 1,529 1,207 899 308 123 37 27 10
Product GWPSROC ODPSROC
ktonne yr-1
MtCO2-eq yr-1 ktonne ODP yr
-1
2002 BAU-2015 MIT-2015 Red-2015 2002 BAU-2015 MIT-2015 Red-2015 2002 BAU-2015 MIT-2015 Red-2015
224 431 310 121 1,060 837 608 230 79 21 15 6
64 114 88 26 146 205 151 54 8 6 3 2
29 55 49 6 232 102 91 11 21 3 2 0
32 50 50 0 72 37 37 0 14 6 6
2 4 4 17 21 7 14 2 2 2
4 1 1 13 5 5 23 0 0
356 656 503 153 1,539 1,207 899 308 147 37 27 10
Product GWPSROC ODPSROC
ktonne yr-1
MtCO2-eq yr-1 ktonne ODP yr
-1
2002 BAU-2015 MIT-2015 Red-2015 2002 BAU-2015 MIT-2015 Red-2015 2002 BAU-2015 MIT-2015 Red-2015
9 16 7 9 74 28 16 13 7 1 1 0
197 391 287 105 926 748 549 199 69 18 13 5
1 2 1 0 7 4 3 1 0 0 0 0
17 23 16 7 53 56 39 17 3 2 1 1
64 114 88 26 146 205 151 54 8 6 3 2
29 55 49 6 232 102 91 11 21 3 2 0
32 50 50 0 72 37 37 0 14 6 6
2 4 4 17 21 7 14 2 2 2
4 1 1 13 5 5 23 0 0
356 656 503 153 1,539 1,207 899 308 147 37 27 10
No regional breakdown available No regional breakdown available No regional breakdown available
No regional breakdown available No regional breakdown available No regional breakdown available

DemandHalons
per sector
Refrigeration
Stationary Air Conditioning
Mobile Air Conditioning
Foams
Medical Aerosols
Fire Protection
HFC-23 by-product
Non-Medical Aerosols and Solvents
Total
CFCs
per sector
Refrigeration
Stationary Air Conditioning
Mobile Air Conditioning
Foams
Medical Aerosols
Fire Protection
HFC-23 by-product
Non-Medical Aerosols and Solvents
Total
HCFCs
per sector
Refrigeration
Stationary Air Conditioning
Mobile Air Conditioning
Foams
Medical Aerosols
Fire Protection
HFC-23 by-product
Non-Medical Aerosols and Solvents
Total
B. DEVELOPING COUNTRIESProduct GWPSROC ODPSROC
ktonne yr-1
MtCO2-eq yr-1 ktonne ODP yr
-1
2002 BAU-2015 MIT-2015 Red-2015 2002 BAU-2015 MIT-2015 Red-2015 2002 BAU-2015 MIT-2015 Red-2015
4 10 23
4 10 23
Product GWPSROC ODPSROC
ktonne yr-1
MtCO2-eq yr-1 ktonne ODP yr
-1
2002 BAU-2015 MIT-2015 Red-2015 2002 BAU-2015 MIT-2015 Red-2015 2002 BAU-2015 MIT-2015 Red-2015
78 4 3 1 799 37 27 10 72 3 2 1
5 2 1 1 43 14 8 6 5 2 1 1
20 3 2 0 219 28 25 4 20 3 2 0
11 56 11
2 2 2 16 17 17 2 2 2
117 10 6 4 1,134 97 60 37 111 10 6 4
Product GWPSROC ODPSROC
ktonne yr-1
MtCO2-eq yr-1 ktonne ODP yr
-1
2002 BAU-2015 MIT-2015 Red-2015 2002 BAU-2015 MIT-2015 Red-2015 2002 BAU-2015 MIT-2015 Red-2015
139 359 257 102 248 639 457 182 7 18 13 5
55 78 50 29 97 139 88 51 3 4 2 1
2 1 1 0 4 2 2 0 0 0 0 0
21 50 50 16 37 37 2 6 6
0.1 0.1 0.1 0.07 0.03 0.03 0.003 0.002 0.002
217 489 358 131 364 817 584 233 12 28 21 7
No regional breakdown available No regional breakdown available No regional breakdown available
No regional breakdown available No regional breakdown available No regional breakdown available

DemandHFCs
per sector
Refrigeration
Stationary Air Conditioning
Mobile Air Conditioning
Foams
Medical Aerosols
Fire Protection
HFC-23 by-product
Non-Medical Aerosols and Solvents
Total
PFCs
per sector
Refrigeration
Stationary Air Conditioning
Mobile Air Conditioning
Foams
Medical Aerosols
Fire Protection
HFC-23 by-product
Non-Medical Aerosols and Solvents
Total
B. DEVELOPING COUNTRIESProduct GWPSROC ODPSROC
ktonne yr-1
MtCO2-eq yr-1 ktonne ODP yr
-1
2002 BAU-2015 MIT-2015 Red-2015 2002 BAU-2015 MIT-2015 Red-2015 2002 BAU-2015 MIT-2015 Red-2015
7 69 51 18 13 161 123 38
4 34 37 -3 6 52 56 -4
6 51 46 5 9 72 65 8
0 0 0 0 0 0 0 0
0 2 4 -2 0 4 7 -4
1 1 1 3 5 5
18 157 139 18 32 294 255 39
Product GWPSROC ODPSROC
ktonne yr-1
MtCO2-eq yr-1 ktonne ODP yr
-1
2002 BAU-2015 MIT-2015 Red-2015 2002 BAU-2015 MIT-2015 Red-2015 2002 BAU-2015 MIT-2015 Red-2015
0.001 0.002 0.002 0.01 0.01 0.01
0.001 0.002 0.002 0.01 0.01 0.01
No regional breakdown available No regional breakdown available No regional breakdown available
No regional breakdown available No regional breakdown available No regional breakdown available

DemandPer group
Halons
CFCs
HCFCs
HFCs
PFCs
Total incl halons
Total excl halons
Per sector
Refrigeration
Stationary Air Conditioning
Mobile Air Conditioning
Foams
Medical Aerosols
Fire Protection
HFC-23 by-product
Non-Medical Aerosols and Solvents
Total incl halons
Per subsector
Domestic Refrigeration
Commercial Refrigeration
Transport Refrigeration
Industrial Refrigeration
Stationary Air Conditioning
Mobile Air Conditioning
Foams
Medical Aerosols
Fire Protection
HFC-23 by-product
Non-Medical Aerosols and Solvents
Total incl halons
O. NO REGIONAL BREAKDOWN SPECIFIED (World Total)Product GWPSROC ODPSROC
ktonne yr-1
MtCO2-eq yr-1 ktonne ODP yr
-1
2002 BAU-2015 MIT-2015 Red-2015 2002 BAU-2015 MIT-2015 Red-2015 2002 BAU-2015 MIT-2015 Red-2015
11 16 16 6 9 9 1 1 1
1 1 1 25 27 27
0.10 0.01 0.01 0.9 0.1 0.1
12 17 17 32 37 37 1 1 1
12 17 17 32 37 37 1 1 1
Product GWPSROC ODPSROC
ktonne yr-1
MtCO2-eq yr-1 ktonne ODP yr
-1
2002 BAU-2015 MIT-2015 Red-2015 2002 BAU-2015 MIT-2015 Red-2015 2002 BAU-2015 MIT-2015 Red-2015
12 17 17 32 37 37 1 1 1
12 17 17 32 37 37 1 1 1
Product GWPSROC ODPSROC
ktonne yr-1
MtCO2-eq yr-1 ktonne ODP yr
-1
2002 BAU-2015 MIT-2015 Red-2015 2002 BAU-2015 MIT-2015 Red-2015 2002 BAU-2015 MIT-2015 Red-2015
12 17 17 32 37 37 1 1 1
12 17 17 32 37 37 1 1 1

DemandHalons
per sector
Refrigeration
Stationary Air Conditioning
Mobile Air Conditioning
Foams
Medical Aerosols
Fire Protection
HFC-23 by-product
Non-Medical Aerosols and Solvents
Total
CFCs
per sector
Refrigeration
Stationary Air Conditioning
Mobile Air Conditioning
Foams
Medical Aerosols
Fire Protection
HFC-23 by-product
Non-Medical Aerosols and Solvents
Total
HCFCs
per sector
Refrigeration
Stationary Air Conditioning
Mobile Air Conditioning
Foams
Medical Aerosols
Fire Protection
HFC-23 by-product
Non-Medical Aerosols and Solvents
Total
O. NO REGIONAL BREAKDOWN SPECIFIED (World Total)Product GWPSROC ODPSROC
ktonne yr-1
MtCO2-eq yr-1 ktonne ODP yr
-1
2002 BAU-2015 MIT-2015 Red-2015 2002 BAU-2015 MIT-2015 Red-2015 2002 BAU-2015 MIT-2015 Red-2015
Product GWPSROC ODPSROC
ktonne yr-1
MtCO2-eq yr-1 ktonne ODP yr
-1
2002 BAU-2015 MIT-2015 Red-2015 2002 BAU-2015 MIT-2015 Red-2015 2002 BAU-2015 MIT-2015 Red-2015
Product GWPSROC ODPSROC
ktonne yr-1
MtCO2-eq yr-1 ktonne ODP yr
-1
2002 BAU-2015 MIT-2015 Red-2015 2002 BAU-2015 MIT-2015 Red-2015 2002 BAU-2015 MIT-2015 Red-2015
11 16 16 6 9 9 1 1 1
11 16 16 6 9 9 1 1 1

DemandHFCs
per sector
Refrigeration
Stationary Air Conditioning
Mobile Air Conditioning
Foams
Medical Aerosols
Fire Protection
HFC-23 by-product
Non-Medical Aerosols and Solvents
Total
PFCs
per sector
Refrigeration
Stationary Air Conditioning
Mobile Air Conditioning
Foams
Medical Aerosols
Fire Protection
HFC-23 by-product
Non-Medical Aerosols and Solvents
Total
O. NO REGIONAL BREAKDOWN SPECIFIED (World Total)Product GWPSROC ODPSROC
ktonne yr-1
MtCO2-eq yr-1 ktonne ODP yr
-1
2002 BAU-2015 MIT-2015 Red-2015 2002 BAU-2015 MIT-2015 Red-2015 2002 BAU-2015 MIT-2015 Red-2015
1 1 1 25 27 27
1 1 1 25 27 27
Product GWPSROC ODPSROC
ktonne yr-1
MtCO2-eq yr-1 ktonne ODP yr
-1
2002 BAU-2015 MIT-2015 Red-2015 2002 BAU-2015 MIT-2015 Red-2015 2002 BAU-2015 MIT-2015 Red-2015
0.10 0.01 0.01 0.9 0.1 0.1
0.10 0.01 0.01 0.9 0.1 0.1

Banks WORLDPer group Product GWPSROC ODPSROC
ktonne MtCO2-eq ktonne ODP
2002 BAU-2015 MIT-2015 Red-2015 2002 BAU-2015 MIT-2015 Red-2015 2002 BAU-2015 MIT-2015 Red-2015
Halons 168 55 55 531 229 229 1,173 457 457
CFCs 2,430 1,411 1,407 4 15,749 8,302 8,258 43 2,412 1,406 1,402 4
HCFCs 2,651 3,317 3,017 300 3,841 4,871 4,352 520 194 247 232 15
HFCs 544 2,950 2,613 337 1,103 5,227 4,527 700
PFCs 1 1 1 5 4 4
Total incl halons 5,793 7,735 7,093 641 21,229 18,633 17,370 1,263 3,779 2,110 2,091 19
Total excl halons 5,625 7,679 7,038 641 20,698 18,404 17,141 1,263 2,606 1,653 1,634 19
Per sector Product GWPSROC ODPSROC
ktonne MtCO2-eq ktonne ODP
2002 BAU-2015 MIT-2015 Red-2015 2002 BAU-2015 MIT-2015 Red-2015 2002 BAU-2015 MIT-2015 Red-2015
Refrigeration 971 1,675 1,455 221 4,751 4,157 3,548 609 335 103 98 6
Stationary Air Conditioning 1,192 1,856 1,689 166 2,509 3,232 2,928 304 134 70 59 11
Mobile Air Conditioning 418 671 541 131 1,987 1,076 891 185 150 14 14 0
Foams 2,996 3,374 3,250 123 11,270 9,626 9,475 151 1,977 1,462 1,462
Medical Aerosols 12 15 15 75 40 26 14 8 2 2
Fire Protection 191 126 126 606 465 465 1,174 457 457
HFC-23 by-product
Non-Medical Aerosols and Solvents 12 17 17 32 37 37 1 1 1
Total incl halons 5,793 7,735 7,093 641 21,229 18,633 17,370 1,263 3,779 2,110 2,091 19
Per subsector Product GWPSROC ODPSROC
ktonne MtCO2-eq ktonne ODP
2002 BAU-2015 MIT-2015 Red-2015 2002 BAU-2015 MIT-2015 Red-2015 2002 BAU-2015 MIT-2015 Red-2015
Domestic Refrigeration 157 226 140 87 1,218 664 523 141 107 37 35 2
Commercial Refrigeration 606 1,193 1,087 107 2,863 2,746 2,355 391 194 44 41 3
Transport Refrigeration 16 23 23 57 72 72 2 0 0
Industrial Refrigeration 192 233 205 28 613 676 598 77 33 22 22 0
Stationary Air Conditioning 1,192 1,856 1,689 166 2,509 3,232 2,928 304 134 70 59 11
Mobile Air Conditioning 418 671 541 131 1,987 1,076 891 185 150 14 14 0
Foams 2,996 3,374 3,250 123 11,270 9,626 9,475 151 1,977 1,462 1,462
Medical Aerosols 12 15 15 75 40 26 14 8 2 2
Fire Protection 191 126 126 606 465 465 1,174 457 457
HFC-23 by-product
Non-Medical Aerosols and Solvents 12 17 17 32 37 37 1 1 1
Total incl halons 5,793 7,735 7,093 641 21,229 18,633 17,370 1,263 3,779 2,110 2,091 19

Banks WORLDHalons Product GWPSROC ODPSROC
ktonne MtCO2-eq ktonne ODP
per sector 2002 BAU-2015 MIT-2015 Red-2015 2002 BAU-2015 MIT-2015 Red-2015 2002 BAU-2015 MIT-2015 Red-2015
Refrigeration
Stationary Air Conditioning
Mobile Air Conditioning
Foams
Medical Aerosols
Fire Protection 168 55 55 531 229 229 1,173 457 457
HFC-23 by-product
Non-Medical Aerosols and Solvents
Total 168 55 55 531 229 229 1,173 457 457
CFCs Product GWPSROC ODPSROC
ktonne MtCO2-eq ktonne ODP
per sector 2002 BAU-2015 MIT-2015 Red-2015 2002 BAU-2015 MIT-2015 Red-2015 2002 BAU-2015 MIT-2015 Red-2015
Refrigeration 330 64 62 2 3,423 653 627 26 313 59 57 2
Stationary Air Conditioning 84 27 27 0 631 208 208 0 84 27 27 0
Mobile Air Conditioning 149 13 13 0 1,600 138 138 0 149 13 13 0
Foams 1,858 1,305 1,305 10,026 7,286 7,286 1,858 1,305 1,305
Medical Aerosols 8 2 2 69 17 17 8 2 2
Fire Protection
HFC-23 by-product
Non-Medical Aerosols and Solvents
Total 2,430 1,411 1,407 4 15,749 8,302 8,258 43 2,412 1,406 1,402 4
HCFCs Product GWPSROC ODPSROC
ktonne MtCO2-eq ktonne ODP
per sector 2002 BAU-2015 MIT-2015 Red-2015 2002 BAU-2015 MIT-2015 Red-2015 2002 BAU-2015 MIT-2015 Red-2015
Refrigeration 461 891 825 66 810 1,582 1,466 117 23 44 41 3
Stationary Air Conditioning 1,028 878 644 233 1,755 1,536 1,134 402 50 43 32 11
Mobile Air Conditioning 20 23 23 0 36 42 41 1 1 1 1 0
Foams 1,126 1,502 1,502 1,229 1,696 1,696 119 157 157
Medical Aerosols
Fire Protection 4 6 6 5 6 6 0 0 0
HFC-23 by-product
Non-Medical Aerosols and Solvents 11 16 16 6 9 9 1 1 1
Total 2,651 3,317 3,017 300 3,841 4,871 4,352 520 194 247 232 15

Banks WORLDHFCs Product GWPSROC ODPSROC
ktonne MtCO2-eq ktonne ODP
per sector 2002 BAU-2015 MIT-2015 Red-2015 2002 BAU-2015 MIT-2015 Red-2015 2002 BAU-2015 MIT-2015 Red-2015
Refrigeration 180 720 568 153 518 1,922 1,455 467
Stationary Air Conditioning 81 951 1,018 -67 123 1,488 1,586 -99
Mobile Air Conditioning 249 635 505 131 350 896 712 184
Foams 12 566 443 123 16 644 494 151
Medical Aerosols 4 13 15 -2 6 23 26 -4
Fire Protection 19 64 64 65 226 226
HFC-23 by-product
Non-Medical Aerosols and Solvents 1 1 1 25 27 27
Total 544 2,950 2,613 337 1,103 5,227 4,527 700
PFCs Product GWPSROC ODPSROC
ktonne MtCO2-eq ktonne ODP
per sector 2002 BAU-2015 MIT-2015 Red-2015 2002 BAU-2015 MIT-2015 Red-2015 2002 BAU-2015 MIT-2015 Red-2015
Refrigeration
Stationary Air Conditioning
Mobile Air Conditioning
Foams
Medical Aerosols
Fire Protection 0.5 0.5 0.5 4.1 4.3 4.3
HFC-23 by-product
Non-Medical Aerosols and Solvents 0.1 0.01 0.01 0.9 0.1 0.1
Total 0.6 0.5 0.5 5 4 4

BanksPer group
Halons
CFCs
HCFCs
HFCs
PFCs
Total incl halons
Total excl halons
Per sector
Refrigeration
Stationary Air Conditioning
Mobile Air Conditioning
Foams
Medical Aerosols
Fire Protection
HFC-23 by-product
Non-Medical Aerosols and Solvents
Total incl halons
Per subsector
Domestic Refrigeration
Commercial Refrigeration
Transport Refrigeration
Industrial Refrigeration
Stationary Air Conditioning
Mobile Air Conditioning
Foams
Medical Aerosols
Fire Protection
HFC-23 by-product
Non-Medical Aerosols and Solvents
Total incl halons
A. DEVELOPED COUNTRIESProduct GWPSROC ODPSROC
ktonne MtCO2-eq ktonne ODP
2002 BAU-2015 MIT-2015 Red-2015 2002 BAU-2015 MIT-2015 Red-2015 2002 BAU-2015 MIT-2015 Red-2015
80 40 40 330 181 181 659 349 349
1,669 1,132 1,132 0 10,235 6,535 6,535 0 1,665 1,130 1,130 0
1,997 1,479 1,299 180 2,773 2,161 1,852 308 156 119 111 9
494 2,327 2,015 312 992 4,089 3,435 655
0.4 0.5 0.5 4 4 4
4,241 4,978 4,486 493 14,334 12,970 12,007 963 2,480 1,598 1,589 9
4,161 4,939 4,446 493 14,004 12,789 11,826 963 1,821 1,249 1,240 9
Product GWPSROC ODPSROC
ktonne MtCO2-eq ktonne ODP
2002 BAU-2015 MIT-2015 Red-2015 2002 BAU-2015 MIT-2015 Red-2015 2002 BAU-2015 MIT-2015 Red-2015
406 508 415 94 1,423 1,559 1,185 374 66 12 12 0
868 1,220 1,075 146 1,721 2,060 1,805 254 86 34 25 9
352 492 361 130 1,500 695 511 184 108 0 0 0
2,507 2,660 2,536 123 9,241 8,298 8,147 151 1,555 1,203 1,203
9 11 11 58 19 19 6
99 87 87 390 339 339 659 349 349
4,241 4,978 4,486 493 14,334 12,970 12,007 963 2,480 1,598 1,589 9
Product GWPSROC ODPSROC
ktonne MtCO2-eq ktonne ODP
2002 BAU-2015 MIT-2015 Red-2015 2002 BAU-2015 MIT-2015 Red-2015 2002 BAU-2015 MIT-2015 Red-2015
80 79 42 37 467 114 62 52 38 0 0 0
200 285 249 36 548 990 731 258 8 2 1 0
12 18 18 38 58 58 0 0 0
115 127 106 20 370 398 334 64 20 10 10 0
868 1,220 1,075 146 1,721 2,060 1,805 254 86 34 25 9
352 492 361 130 1,500 695 511 184 108 0 0 0
2,507 2,660 2,536 123 9,241 8,298 8,147 151 1,555 1,203 1,203
9 11 11 58 19 19 6
99 87 87 390 339 339 659 349 349
4,241 4,978 4,486 493 14,334 12,970 12,007 963 2,480 1,598 1,589 9
No regional breakdown available No regional breakdown available No regional breakdown available
No regional breakdown available No regional breakdown available No regional breakdown available

BanksHalons
per sector
Refrigeration
Stationary Air Conditioning
Mobile Air Conditioning
Foams
Medical Aerosols
Fire Protection
HFC-23 by-product
Non-Medical Aerosols and Solvents
Total
CFCs
per sector
Refrigeration
Stationary Air Conditioning
Mobile Air Conditioning
Foams
Medical Aerosols
Fire Protection
HFC-23 by-product
Non-Medical Aerosols and Solvents
Total
HCFCs
per sector
Refrigeration
Stationary Air Conditioning
Mobile Air Conditioning
Foams
Medical Aerosols
Fire Protection
HFC-23 by-product
Non-Medical Aerosols and Solvents
Total
A. DEVELOPED COUNTRIESProduct GWPSROC ODPSROC
ktonne MtCO2-eq ktonne ODP
2002 BAU-2015 MIT-2015 Red-2015 2002 BAU-2015 MIT-2015 Red-2015 2002 BAU-2015 MIT-2015 Red-2015
80 40 40 330 181 181 659 349 349
80 40 40 330 181 181 659 349 349
Product GWPSROC ODPSROC
ktonne MtCO2-eq ktonne ODP
2002 BAU-2015 MIT-2015 Red-2015 2002 BAU-2015 MIT-2015 Red-2015 2002 BAU-2015 MIT-2015 Red-2015
61 10 10 0 622 95 95 0 57 8 8 0
50 14 14 0 354 98 98 0 50 14 14 0
108 0 0 0 1,153 1 0 0 108 0 0 0
1,445 1,108 1,108 8,054 6,341 6,341 1,445 1,108 1,108
6 52 6
1,669 1,132 1,132 0 10,235 6,535 6,535 0 1,665 1,130 1,130 0
Product GWPSROC ODPSROC
ktonne MtCO2-eq ktonne ODP
2002 BAU-2015 MIT-2015 Red-2015 2002 BAU-2015 MIT-2015 Red-2015 2002 BAU-2015 MIT-2015 Red-2015
183 79 76 3 315 138 132 6 9 4 4 0
751 405 228 177 1,265 699 397 302 36 20 11 9
9 4 3 0 16 6 6 1 0 0 0 0
1,050 986 986 1,172 1,313 1,313 110 95 95
4 5 5 5 5 5 0 0 0
1,997 1,479 1,299 180 2,773 2,161 1,852 308 156 119 111 9
No regional breakdown available No regional breakdown available No regional breakdown available
No regional breakdown available No regional breakdown available No regional breakdown available

BanksHFCs
per sector
Refrigeration
Stationary Air Conditioning
Mobile Air Conditioning
Foams
Medical Aerosols
Fire Protection
HFC-23 by-product
Non-Medical Aerosols and Solvents
Total
PFCs
per sector
Refrigeration
Stationary Air Conditioning
Mobile Air Conditioning
Foams
Medical Aerosols
Fire Protection
HFC-23 by-product
Non-Medical Aerosols and Solvents
Total
A. DEVELOPED COUNTRIESProduct GWPSROC ODPSROC
ktonne MtCO2-eq ktonne ODP
2002 BAU-2015 MIT-2015 Red-2015 2002 BAU-2015 MIT-2015 Red-2015 2002 BAU-2015 MIT-2015 Red-2015
163 418 328 90 486 1,326 958 369
67 801 833 -31 102 1,262 1,310 -48
235 488 358 130 331 689 505 183
12 566 443 123 16 644 494 151
3 11 11 6 19 19
15 42 42 51 149 149
494 2,327 2,015 312 992 4,089 3,435 655
Product GWPSROC ODPSROC
ktonne MtCO2-eq ktonne ODP
2002 BAU-2015 MIT-2015 Red-2015 2002 BAU-2015 MIT-2015 Red-2015 2002 BAU-2015 MIT-2015 Red-2015
0.4 0.5 0.5 4 4 4
0.4 0.5 0.5 4 4 4
No regional breakdown available No regional breakdown available No regional breakdown available
No regional breakdown available No regional breakdown available No regional breakdown available

BanksPer group
Halons
CFCs
HCFCs
HFCs
PFCs
Total incl halons
Total excl halons
Per sector
Refrigeration
Stationary Air Conditioning
Mobile Air Conditioning
Foams
Medical Aerosols
Fire Protection
HFC-23 by-product
Non-Medical Aerosols and Solvents
Total incl halons
Per subsector
Domestic Refrigeration
Commercial Refrigeration
Transport Refrigeration
Industrial Refrigeration
Stationary Air Conditioning
Mobile Air Conditioning
Foams
Medical Aerosols
Fire Protection
HFC-23 by-product
Non-Medical Aerosols and Solvents
Total incl halons
B. DEVELOPING COUNTRIESProduct GWPSROC ODPSROC
ktonne MtCO2-eq ktonne ODP
2002 BAU-2015 MIT-2015 Red-2015 2002 BAU-2015 MIT-2015 Red-2015 2002 BAU-2015 MIT-2015 Red-2015
88 16 16 201 48 48 514 108 108
760 280 275 4 5,514 1,767 1,724 43 747 276 272 4
643 1,822 1,703 119 1,062 2,701 2,490 211 37 126 121 6
49 622 597 25 86 1,110 1,065 45
0 0 0 0 0 0
1,540 2,740 2,591 149 6,864 5,626 5,326 300 1,299 510 500 10
1,452 2,724 2,575 149 6,663 5,578 5,279 300 784 403 392 10
Product GWPSROC ODPSROC
ktonne MtCO2-eq ktonne ODP
2002 BAU-2015 MIT-2015 Red-2015 2002 BAU-2015 MIT-2015 Red-2015 2002 BAU-2015 MIT-2015 Red-2015
565 1,167 1,040 127 3,328 2,598 2,363 235 270 91 86 6
325 635 615 21 787 1,172 1,123 50 48 37 34 3
67 180 179 1 487 380 379 1 42 14 14 0
490 714 714 0 2,029 1,328 1,328 0 423 259 259
2 4 4 17 21 7 14 2 2 2
92 39 39 216 126 126 514 108 108
1,540 2,740 2,591 149 6,864 5,626 5,326 300 1,299 510 500 10
Product GWPSROC ODPSROC
ktonne MtCO2-eq ktonne ODP
2002 BAU-2015 MIT-2015 Red-2015 2002 BAU-2015 MIT-2015 Red-2015 2002 BAU-2015 MIT-2015 Red-2015
77 148 98 50 751 550 461 89 69 37 35 2
406 908 838 70 2,316 1,757 1,624 133 186 42 39 3
4 6 6 19 14 14 1 0 0
78 106 99 7 243 278 264 14 14 12 12 0
325 635 615 21 787 1,172 1,123 50 48 37 34 3
67 180 179 1 487 380 379 1 42 14 14 0
490 714 714 0 2,029 1,328 1,328 0 423 259 259
2 4 4 17 21 7 14 2 2 2
92 39 39 216 126 126 514 108 108
1,540 2,740 2,591 149 6,864 5,626 5,326 300 1,299 510 500 10
No regional breakdown available No regional breakdown available No regional breakdown available
No regional breakdown available No regional breakdown available No regional breakdown available

BanksHalons
per sector
Refrigeration
Stationary Air Conditioning
Mobile Air Conditioning
Foams
Medical Aerosols
Fire Protection
HFC-23 by-product
Non-Medical Aerosols and Solvents
Total
CFCs
per sector
Refrigeration
Stationary Air Conditioning
Mobile Air Conditioning
Foams
Medical Aerosols
Fire Protection
HFC-23 by-product
Non-Medical Aerosols and Solvents
Total
HCFCs
per sector
Refrigeration
Stationary Air Conditioning
Mobile Air Conditioning
Foams
Medical Aerosols
Fire Protection
HFC-23 by-product
Non-Medical Aerosols and Solvents
Total
B. DEVELOPING COUNTRIESProduct GWPSROC ODPSROC
ktonne MtCO2-eq ktonne ODP
2002 BAU-2015 MIT-2015 Red-2015 2002 BAU-2015 MIT-2015 Red-2015 2002 BAU-2015 MIT-2015 Red-2015
88 16 16 201 48 48 514 108 108
88 16 16 201 48 48 514 108 108
Product GWPSROC ODPSROC
ktonne MtCO2-eq ktonne ODP
2002 BAU-2015 MIT-2015 Red-2015 2002 BAU-2015 MIT-2015 Red-2015 2002 BAU-2015 MIT-2015 Red-2015
269 54 52 2 2,801 558 532 26 256 51 48 2
34 13 13 0 277 109 109 0 34 13 13 0
42 13 13 0 448 137 137 0 42 13 13 0
414 198 198 1,972 945 945 414 198 198
2 2 2 16 17 17 2 2 2
760 280 275 4 5,514 1,767 1,724 43 747 276 272 4
Product GWPSROC ODPSROC
ktonne MtCO2-eq ktonne ODP
2002 BAU-2015 MIT-2015 Red-2015 2002 BAU-2015 MIT-2015 Red-2015 2002 BAU-2015 MIT-2015 Red-2015
278 812 749 62 495 1,444 1,333 111 14 41 37 3
276 473 416 57 489 837 737 100 14 24 21 3
11 20 20 0 20 35 35 0 1 1 1 0
76 516 516 57 383 383 9 61 61
1 1 1 1 1 1 0 0 0
643 1,822 1,703 119 1,062 2,701 2,490 211 37 126 121 6
No regional breakdown available No regional breakdown available No regional breakdown available
No regional breakdown available No regional breakdown available No regional breakdown available

BanksHFCs
per sector
Refrigeration
Stationary Air Conditioning
Mobile Air Conditioning
Foams
Medical Aerosols
Fire Protection
HFC-23 by-product
Non-Medical Aerosols and Solvents
Total
PFCs
per sector
Refrigeration
Stationary Air Conditioning
Mobile Air Conditioning
Foams
Medical Aerosols
Fire Protection
HFC-23 by-product
Non-Medical Aerosols and Solvents
Total
B. DEVELOPING COUNTRIESProduct GWPSROC ODPSROC
ktonne MtCO2-eq ktonne ODP
2002 BAU-2015 MIT-2015 Red-2015 2002 BAU-2015 MIT-2015 Red-2015 2002 BAU-2015 MIT-2015 Red-2015
17 302 239 62 32 596 498 98
14 149 185 -36 21 226 276 -51
14 147 147 1 19 208 207 1
0 0 0 0 0 0
0 2 4 -2 0 4 7 -4
4 22 22 14 77 77
49 622 597 25 86 1,110 1,065 45
Product GWPSROC ODPSROC
ktonne MtCO2-eq ktonne ODP
2002 BAU-2015 MIT-2015 Red-2015 2002 BAU-2015 MIT-2015 Red-2015 2002 BAU-2015 MIT-2015 Red-2015
0.04 0.05 0.05 0.3 0.4 0.4
0.04 0.05 0.05 0.3 0.4 0.4
No regional breakdown available No regional breakdown available No regional breakdown available
No regional breakdown available No regional breakdown available No regional breakdown available

BanksPer group
Halons
CFCs
HCFCs
HFCs
PFCs
Total incl halons
Total excl halons
Per sector
Refrigeration
Stationary Air Conditioning
Mobile Air Conditioning
Foams
Medical Aerosols
Fire Protection
HFC-23 by-product
Non-Medical Aerosols and Solvents
Total incl halons
Per subsector
Domestic Refrigeration
Commercial Refrigeration
Transport Refrigeration
Industrial Refrigeration
Stationary Air Conditioning
Mobile Air Conditioning
Foams
Medical Aerosols
Fire Protection
HFC-23 by-product
Non-Medical Aerosols and Solvents
Total incl halons
O. NO REGIONAL BREAKDOWN SPECIFIED (World Total)Product GWPSROC ODPSROC
ktonne MtCO2-eq ktonne ODP
2002 BAU-2015 MIT-2015 Red-2015 2002 BAU-2015 MIT-2015 Red-2015 2002 BAU-2015 MIT-2015 Red-2015
11 16 16 6 9 9 1 1 1
1 1 1 25 27 27
0.10 0.01 0.01 0.9 0.1 0.1
12 17 17 32 37 37 1 1 1
12 17 17 32 37 37 1 1 1
Product GWPSROC ODPSROC
ktonne MtCO2-eq ktonne ODP
2002 BAU-2015 MIT-2015 Red-2015 2002 BAU-2015 MIT-2015 Red-2015 2002 BAU-2015 MIT-2015 Red-2015
12 17 17 32 37 37 1 1 1
12 17 17 32 37 37 1 1 1
Product GWPSROC ODPSROC
ktonne MtCO2-eq ktonne ODP
2002 BAU-2015 MIT-2015 Red-2015 2002 BAU-2015 MIT-2015 Red-2015 2002 BAU-2015 MIT-2015 Red-2015
12 17 17 32 37 37 1 1 1
12 17 17 32 37 37 1 1 1

BanksHalons
per sector
Refrigeration
Stationary Air Conditioning
Mobile Air Conditioning
Foams
Medical Aerosols
Fire Protection
HFC-23 by-product
Non-Medical Aerosols and Solvents
Total
CFCs
per sector
Refrigeration
Stationary Air Conditioning
Mobile Air Conditioning
Foams
Medical Aerosols
Fire Protection
HFC-23 by-product
Non-Medical Aerosols and Solvents
Total
HCFCs
per sector
Refrigeration
Stationary Air Conditioning
Mobile Air Conditioning
Foams
Medical Aerosols
Fire Protection
HFC-23 by-product
Non-Medical Aerosols and Solvents
Total
O. NO REGIONAL BREAKDOWN SPECIFIED (World Total)Product GWPSROC ODPSROC
ktonne MtCO2-eq ktonne ODP
2002 BAU-2015 MIT-2015 Red-2015 2002 BAU-2015 MIT-2015 Red-2015 2002 BAU-2015 MIT-2015 Red-2015
Product GWPSROC ODPSROC
ktonne MtCO2-eq ktonne ODP
2002 BAU-2015 MIT-2015 Red-2015 2002 BAU-2015 MIT-2015 Red-2015 2002 BAU-2015 MIT-2015 Red-2015
Product GWPSROC ODPSROC
ktonne MtCO2-eq ktonne ODP
2002 BAU-2015 MIT-2015 Red-2015 2002 BAU-2015 MIT-2015 Red-2015 2002 BAU-2015 MIT-2015 Red-2015
11 16 16 6 9 9 1 1 1
11 16 16 6 9 9 1 1 1

BanksHFCs
per sector
Refrigeration
Stationary Air Conditioning
Mobile Air Conditioning
Foams
Medical Aerosols
Fire Protection
HFC-23 by-product
Non-Medical Aerosols and Solvents
Total
PFCs
per sector
Refrigeration
Stationary Air Conditioning
Mobile Air Conditioning
Foams
Medical Aerosols
Fire Protection
HFC-23 by-product
Non-Medical Aerosols and Solvents
Total
O. NO REGIONAL BREAKDOWN SPECIFIED (World Total)Product GWPSROC ODPSROC
ktonne MtCO2-eq ktonne ODP
2002 BAU-2015 MIT-2015 Red-2015 2002 BAU-2015 MIT-2015 Red-2015 2002 BAU-2015 MIT-2015 Red-2015
1 1 1 25 27 27
1 1 1 25 27 27
Product GWPSROC ODPSROC
ktonne MtCO2-eq ktonne ODP
2002 BAU-2015 MIT-2015 Red-2015 2002 BAU-2015 MIT-2015 Red-2015 2002 BAU-2015 MIT-2015 Red-2015
0.1 0.01 0.01 0.9 0.1 0.1
0.1 0.01 0.01 0.9 0.1 0.1

Emissions WORLDPer group Product GWPSROC ODPSROC
ktonne yr-1
MtCO2-eq yr-1 ktonne ODP yr
-1
2002 BAU-2015 MIT-2015 Red-2015 2002 BAU-2015 MIT-2015 Red-2015 2002 BAU-2015 MIT-2015 Red-2015
Halons 10 6 6 30 18 18 68 40 40
CFCs 174 43 30 13 1,652 338 221 117 168 42 29 13
HCFCs 271 492 292 200 448 828 484 344 15 26 16 10
HFCs 124 415 184 231 434 1,153 416 737
PFCs 0.11 0.02 0.02 1.0 0.2 0.2
Total incl halons 580 956 512 444 2,565 2,337 1,139 1,198 252 107 85 23
Total excl halons 570 950 506 444 2,535 2,319 1,121 1,198 183 68 45 23
Per sector Product GWPSROC ODPSROC
ktonne yr-1
MtCO2-eq yr-1 ktonne ODP yr
-1
2002 BAU-2015 MIT-2015 Red-2015 2002 BAU-2015 MIT-2015 Red-2015 2002 BAU-2015 MIT-2015 Red-2015
Refrigeration 232 450 263 187 1,061 1,097 607 490 72 28 18 11
Stationary Air Conditioning 115 198 91 108 271 370 170 200 18 13 6 7
Mobile Air Conditioning 134 190 75 115 749 315 136 179 60 5 3 2
Foams 51 55 42 13 152 124 107 17 24 18 17 1
Medical Aerosols 12 15 15 75 40 26 14 8 2 2
Fire Protection 11 7 7 31 22 22 68 40 40
HFC-23 by-product 14 23 2 21 195 332 33 299
Non-Medical Aerosols and Solvents 12 17 17 32 37 37 1 1 1
Total incl halons 580 956 512 444 2,565 2,337 1,139 1,198 252 107 85 23
Per subsector Product GWPSROC ODPSROC
ktonne yr-1
MtCO2-eq yr-1 ktonne ODP yr
-1
2002 BAU-2015 MIT-2015 Red-2015 2002 BAU-2015 MIT-2015 Red-2015 2002 BAU-2015 MIT-2015 Red-2015
Domestic Refrigeration 9 13 6 7 91 65 35 30 8 5 3 2
Commercial Refrigeration 185 393 230 162 837 902 494 409 56 19 12 7
Transport Refrigeration 6 9 5 3 23 26 15 10 1 0 0 0
Industrial Refrigeration 32 35 21 14 110 104 63 41 6 4 3 1
Stationary Air Conditioning 115 198 91 108 271 370 170 200 18 13 6 7
Mobile Air Conditioning 134 190 75 115 749 315 136 179 60 5 3 2
Foams 51 55 42 13 152 124 107 17 24 18 17 1
Medical Aerosols 12 15 15 75 40 26 14 8 2 2
Fire Protection 11 7 7 31 22 22 68 40 40
HFC-23 by-product 14 23 2 21 195 332 33 299
Non-Medical Aerosols and Solvents 12 17 17 32 37 37 1 1 1
Total incl halons 580 956 512 444 2,565 2,337 1,139 1,198 252 107 85 23

Emissions WORLDHalons Product GWPSROC ODPSROC
ktonne yr-1
MtCO2-eq yr-1 ktonne ODP yr
-1
per sector 2002 BAU-2015 MIT-2015 Red-2015 2002 BAU-2015 MIT-2015 Red-2015 2002 BAU-2015 MIT-2015 Red-2015
Refrigeration
Stationary Air Conditioning
Mobile Air Conditioning
Foams
Medical Aerosols
Fire Protection 10 6 6 30 18 18 68 40 40
HFC-23 by-product
Non-Medical Aerosols and Solvents
Total 10 6 6 30 18 18 68 40 40
CFCs Product GWPSROC ODPSROC
ktonne yr-1
MtCO2-eq yr-1 ktonne ODP yr
-1
per sector 2002 BAU-2015 MIT-2015 Red-2015 2002 BAU-2015 MIT-2015 Red-2015 2002 BAU-2015 MIT-2015 Red-2015
Refrigeration 71 13 8 5 727 136 84 53 65 12 8 5
Stationary Air Conditioning 13 7 3 3 99 50 24 26 13 7 3 3
Mobile Air Conditioning 60 5 3 2 641 49 32 17 60 5 3 2
Foams 22 16 15 1 117 85 81 4 22 16 15 1
Medical Aerosols 8 2 2 69 17 17 8 2 2
Fire Protection
HFC-23 by-product
Non-Medical Aerosols and Solvents
Total 174 43 30 13 1,652 338 221 117 168 42 29 13
HCFCs Product GWPSROC ODPSROC
ktonne yr-1
MtCO2-eq yr-1 ktonne ODP yr
-1
per sector 2002 BAU-2015 MIT-2015 Red-2015 2002 BAU-2015 MIT-2015 Red-2015 2002 BAU-2015 MIT-2015 Red-2015
Refrigeration 132 321 202 119 232 570 359 210 7 16 10 6
Stationary Air Conditioning 96 124 50 74 164 210 86 124 5 6 2 4
Mobile Air Conditioning 8 11 7 4 15 19 12 7 0 1 0 0
Foams 24 21 17 4 32 20 17 3 2 2 2 0
Medical Aerosols
Fire Protection 0.1 0.2 0.2 0.1 0.1 0.1 0.00 0.01 0.01
HFC-23 by-product
Non-Medical Aerosols and Solvents 11 16 16 6 9 9 1 1 1
Total 271 492 292 200 448 828 484 344 15 26 16 10

Emissions WORLDHFCs Product GWPSROC ODPSROC
ktonne yr-1
MtCO2-eq yr-1 ktonne ODP yr
-1
per sector 2002 BAU-2015 MIT-2015 Red-2015 2002 BAU-2015 MIT-2015 Red-2015 2002 BAU-2015 MIT-2015 Red-2015
Refrigeration 29 115 52 63 102 391 164 227
Stationary Air Conditioning 6 68 38 30 9 109 60 49
Mobile Air Conditioning 66 175 65 110 93 247 92 155
Foams 5 18 9 9 3 18 9 10
Medical Aerosols 4 13 15 -2 6 23 26 -4
Fire Protection 0.3 1 1 1 4 4
HFC-23 by-product 14 23 2 21 195 332 33 299
Non-Medical Aerosols and Solvents 1 1 1 25 27 27
Total 124 415 184 231 434 1,153 416 737
PFCs Product GWPSROC ODPSROC
ktonne yr-1
MtCO2-eq yr-1 ktonne ODP yr
-1
per sector 2002 BAU-2015 MIT-2015 Red-2015 2002 BAU-2015 MIT-2015 Red-2015 2002 BAU-2015 MIT-2015 Red-2015
Refrigeration
Stationary Air Conditioning
Mobile Air Conditioning
Foams
Medical Aerosols
Fire Protection 0.01 0.01 0.01 0.1 0.1 0.1
HFC-23 by-product
Non-Medical Aerosols and Solvents 0.10 0.01 0.01 0.9 0.1 0.1
Total 0.11 0.02 0.02 1.0 0.2 0.2

EmissionsPer group
Halons
CFCs
HCFCs
HFCs
PFCs
Total incl halons
Total excl halons
Per sector
Refrigeration
Stationary Air Conditioning
Mobile Air Conditioning
Foams
Medical Aerosols
Fire Protection
HFC-23 by-product
Non-Medical Aerosols and Solvents
Total incl halons
Per subsector
Domestic Refrigeration
Commercial Refrigeration
Transport Refrigeration
Industrial Refrigeration
Stationary Air Conditioning
Mobile Air Conditioning
Foams
Medical Aerosols
Fire Protection
HFC-23 by-product
Non-Medical Aerosols and Solvents
Total incl halons
A. DEVELOPED COUNTRIESProduct GWPSROC ODPSROC
ktonne yr-1
MtCO2-eq yr-1 ktonne ODP yr
-1
2002 BAU-2015 MIT-2015 Red-2015 2002 BAU-2015 MIT-2015 Red-2015 2002 BAU-2015 MIT-2015 Red-2015
5 2 2 16 8 8 35 16 16
88 17 15 2 814 103 88 16 87 16 15 2
133 96 38 58 218 152 59 93 7 5 2 3
103 305 126 179 204 627 250 376
0.01 0.01 0.01 0.1 0.1 0.1
329 419 181 238 1,253 890 405 485 129 38 33 5
324 417 179 238 1,236 882 397 485 94 22 17 5
Product GWPSROC ODPSROC
ktonne yr-1
MtCO2-eq yr-1 ktonne ODP yr
-1
2002 BAU-2015 MIT-2015 Red-2015 2002 BAU-2015 MIT-2015 Red-2015 2002 BAU-2015 MIT-2015 Red-2015
85 106 45 61 293 355 141 214 13 2 1 1
75 123 49 74 165 219 87 132 10 6 2 4
113 134 41 93 603 191 59 132 48 0 0 0
42 42 32 10 116 96 88 8 18 13 13 -1
9 11 11 58 19 19 6
5 3 3 17 11 11 35 16 16
329 419 181 238 1,253 890 405 485 129 38 33 5
Product GWPSROC ODPSROC
ktonne yr-1
MtCO2-eq yr-1 ktonne ODP yr
-1
2002 BAU-2015 MIT-2015 Red-2015 2002 BAU-2015 MIT-2015 Red-2015 2002 BAU-2015 MIT-2015 Red-2015
5 5 1 4 52 7 2 5 5 0 0 0
56 77 30 47 162 272 96 176 4 1 0 0
4 6 3 3 13 20 11 9 0 0 0 0
19 18 10 8 66 56 32 24 4 2 1 1
75 123 49 74 165 219 87 132 10 6 2 4
113 134 41 93 603 191 59 132 48 0 0 0
42 42 32 10 116 96 88 8 18 13 13 -1
9 11 11 58 19 19 6
5 3 3 17 11 11 35 16 16
329 419 181 238 1,253 890 405 485 129 38 33 5
No regional breakdown available No regional breakdown available No regional breakdown available
No regional breakdown available No regional breakdown available No regional breakdown available

EmissionsHalons
per sector
Refrigeration
Stationary Air Conditioning
Mobile Air Conditioning
Foams
Medical Aerosols
Fire Protection
HFC-23 by-product
Non-Medical Aerosols and Solvents
Total
CFCs
per sector
Refrigeration
Stationary Air Conditioning
Mobile Air Conditioning
Foams
Medical Aerosols
Fire Protection
HFC-23 by-product
Non-Medical Aerosols and Solvents
Total
HCFCs
per sector
Refrigeration
Stationary Air Conditioning
Mobile Air Conditioning
Foams
Medical Aerosols
Fire Protection
HFC-23 by-product
Non-Medical Aerosols and Solvents
Total
A. DEVELOPED COUNTRIESProduct GWPSROC ODPSROC
ktonne yr-1
MtCO2-eq yr-1 ktonne ODP yr
-1
2002 BAU-2015 MIT-2015 Red-2015 2002 BAU-2015 MIT-2015 Red-2015 2002 BAU-2015 MIT-2015 Red-2015
5 2 2 16 8 8 35 16 16
5 2 2 16 8 8 35 16 16
Product GWPSROC ODPSROC
ktonne yr-1
MtCO2-eq yr-1 ktonne ODP yr
-1
2002 BAU-2015 MIT-2015 Red-2015 2002 BAU-2015 MIT-2015 Red-2015 2002 BAU-2015 MIT-2015 Red-2015
12 2 1 1 117 15 11 5 11 1 1 0
7 3 1 2 53 24 10 15 7 3 1 2
47 0 0 0 508 0 0 0 47 0 0 0
16 12 12 -1 84 64 67 -4 16 12 12 -1
6 52 6
88 17 15 2 814 103 88 16 87 16 15 2
Product GWPSROC ODPSROC
ktonne yr-1
MtCO2-eq yr-1 ktonne ODP yr
-1
2002 BAU-2015 MIT-2015 Red-2015 2002 BAU-2015 MIT-2015 Red-2015 2002 BAU-2015 MIT-2015 Red-2015
45 18 9 9 78 31 16 15 2 1 0 0
63 63 18 45 105 104 30 74 3 3 1 2
4 2 1 1 7 3 1 2 0 0 0 0
21 12 10 3 29 14 12 2 2 1 1 0
0.1 0.1 0.1 0.1 0.1 0.1 0.003 0.004 0.004
133 96 38 58 218 152 59 93 7 5 2 3
No regional breakdown available No regional breakdown available No regional breakdown available
No regional breakdown available No regional breakdown available No regional breakdown available

EmissionsHFCs
per sector
Refrigeration
Stationary Air Conditioning
Mobile Air Conditioning
Foams
Medical Aerosols
Fire Protection
HFC-23 by-product
Non-Medical Aerosols and Solvents
Total
PFCs
per sector
Refrigeration
Stationary Air Conditioning
Mobile Air Conditioning
Foams
Medical Aerosols
Fire Protection
HFC-23 by-product
Non-Medical Aerosols and Solvents
Total
A. DEVELOPED COUNTRIESProduct GWPSROC ODPSROC
ktonne yr-1
MtCO2-eq yr-1 ktonne ODP yr
-1
2002 BAU-2015 MIT-2015 Red-2015 2002 BAU-2015 MIT-2015 Red-2015 2002 BAU-2015 MIT-2015 Red-2015
28 86 35 52 99 308 114 194
5 56 30 26 7 91 48 43
62 133 41 92 88 187 57 130
5 18 9 9 3 18 9 10
3 11 11 6 19 19
0.3 1 1 1 3 3
103 305 126 179 204 627 250 376
Product GWPSROC ODPSROC
ktonne yr-1
MtCO2-eq yr-1 ktonne ODP yr
-1
2002 BAU-2015 MIT-2015 Red-2015 2002 BAU-2015 MIT-2015 Red-2015 2002 BAU-2015 MIT-2015 Red-2015
0.01 0.01 0.01 0.1 0.1 0.1
0.01 0.01 0.01 0.1 0.1 0.1
No regional breakdown available No regional breakdown available No regional breakdown available
No regional breakdown available No regional breakdown available No regional breakdown available

EmissionsPer group
Halons
CFCs
HCFCs
HFCs
PFCs
Total incl halons
Total excl halons
Per sector
Refrigeration
Stationary Air Conditioning
Mobile Air Conditioning
Foams
Medical Aerosols
Fire Protection
HFC-23 by-product
Non-Medical Aerosols and Solvents
Total incl halons
Per subsector
Domestic Refrigeration
Commercial Refrigeration
Transport Refrigeration
Industrial Refrigeration
Stationary Air Conditioning
Mobile Air Conditioning
Foams
Medical Aerosols
Fire Protection
HFC-23 by-product
Non-Medical Aerosols and Solvents
Total incl halons
B. DEVELOPING COUNTRIESProduct GWPSROC ODPSROC
ktonne yr-1
MtCO2-eq yr-1 ktonne ODP yr
-1
2002 BAU-2015 MIT-2015 Red-2015 2002 BAU-2015 MIT-2015 Red-2015 2002 BAU-2015 MIT-2015 Red-2015
6 4 4 13 9 9 34 24 24
86 26 15 11 838 234 133 101 81 25 14 11
128 380 238 142 223 667 416 251 7 20 12 7
6 86 55 32 11 167 105 61
0.001 0.001 0.001 0.01 0.01 0.01
226 496 311 185 1,086 1,078 664 414 122 69 50 18
220 492 307 185 1,072 1,068 654 414 88 45 26 18
Product GWPSROC ODPSROC
ktonne yr-1
MtCO2-eq yr-1 ktonne ODP yr
-1
2002 BAU-2015 MIT-2015 Red-2015 2002 BAU-2015 MIT-2015 Red-2015 2002 BAU-2015 MIT-2015 Red-2015
148 343 218 126 768 743 467 276 59 26 16 10
40 76 42 34 107 151 83 68 7 6 3 3
21 56 34 22 146 124 77 47 13 5 3 2
10 13 10 3 35 28 19 9 7 5 4 2
2 4 4 17 21 7 14 2 2 2
6 4 4 14 11 11 34 24 24
226 496 311 185 1,086 1,078 664 414 122 69 50 18
Product GWPSROC ODPSROC
ktonne yr-1
MtCO2-eq yr-1 ktonne ODP yr
-1
2002 BAU-2015 MIT-2015 Red-2015 2002 BAU-2015 MIT-2015 Red-2015 2002 BAU-2015 MIT-2015 Red-2015
4 8 4 4 39 58 33 25 4 5 3 2
129 316 200 115 675 631 398 233 52 19 12 7
2 3 2 1 10 6 5 2 1 0 0 0
13 17 11 6 44 47 31 16 3 2 1 1
40 76 42 34 107 151 83 68 7 6 3 3
21 56 34 22 146 124 77 47 13 5 3 2
10 13 10 3 35 28 19 9 7 5 4 2
2 4 4 17 21 7 14 2 2 2
6 4 4 14 11 11 34 24 24
226 496 311 185 1,086 1,078 664 414 122 69 50 18
No regional breakdown available No regional breakdown available No regional breakdown available
No regional breakdown available No regional breakdown available No regional breakdown available

EmissionsHalons
per sector
Refrigeration
Stationary Air Conditioning
Mobile Air Conditioning
Foams
Medical Aerosols
Fire Protection
HFC-23 by-product
Non-Medical Aerosols and Solvents
Total
CFCs
per sector
Refrigeration
Stationary Air Conditioning
Mobile Air Conditioning
Foams
Medical Aerosols
Fire Protection
HFC-23 by-product
Non-Medical Aerosols and Solvents
Total
HCFCs
per sector
Refrigeration
Stationary Air Conditioning
Mobile Air Conditioning
Foams
Medical Aerosols
Fire Protection
HFC-23 by-product
Non-Medical Aerosols and Solvents
Total
B. DEVELOPING COUNTRIESProduct GWPSROC ODPSROC
ktonne yr-1
MtCO2-eq yr-1 ktonne ODP yr
-1
2002 BAU-2015 MIT-2015 Red-2015 2002 BAU-2015 MIT-2015 Red-2015 2002 BAU-2015 MIT-2015 Red-2015
6 4 4 13 9 9 34 24 24
6 4 4 13 9 9 34 24 24
Product GWPSROC ODPSROC
ktonne yr-1
MtCO2-eq yr-1 ktonne ODP yr
-1
2002 BAU-2015 MIT-2015 Red-2015 2002 BAU-2015 MIT-2015 Red-2015 2002 BAU-2015 MIT-2015 Red-2015
60 12 7 5 610 121 73 48 55 11 7 4
6 3 2 1 46 26 14 12 6 3 2 1
12 5 3 2 133 49 32 17 12 5 3 2
6 4 3 2 33 22 14 8 6 4 3 2
2 2 2 16 17 17 2 2 2
86 26 15 11 838 234 133 101 81 25 14 11
Product GWPSROC ODPSROC
ktonne yr-1
MtCO2-eq yr-1 ktonne ODP yr
-1
2002 BAU-2015 MIT-2015 Red-2015 2002 BAU-2015 MIT-2015 Red-2015 2002 BAU-2015 MIT-2015 Red-2015
87 302 193 109 154 538 343 195 4 15 10 5
33 60 32 29 59 107 56 50 2 3 2 1
4 9 6 3 8 16 11 5 0 0 0 0
3 8 7 1 2 6 5 1 0 1 1 0
0.01 0.04 0.04 0.01 0.03 0.03 0.001 0.001 0.001
128 380 238 142 223 667 416 251 7 20 12 7
No regional breakdown available No regional breakdown available No regional breakdown available
No regional breakdown available No regional breakdown available No regional breakdown available

EmissionsHFCs
per sector
Refrigeration
Stationary Air Conditioning
Mobile Air Conditioning
Foams
Medical Aerosols
Fire Protection
HFC-23 by-product
Non-Medical Aerosols and Solvents
Total
PFCs
per sector
Refrigeration
Stationary Air Conditioning
Mobile Air Conditioning
Foams
Medical Aerosols
Fire Protection
HFC-23 by-product
Non-Medical Aerosols and Solvents
Total
B. DEVELOPING COUNTRIESProduct GWPSROC ODPSROC
ktonne yr-1
MtCO2-eq yr-1 ktonne ODP yr
-1
2002 BAU-2015 MIT-2015 Red-2015 2002 BAU-2015 MIT-2015 Red-2015 2002 BAU-2015 MIT-2015 Red-2015
1 29 17 12 3 84 50 33
1 12 8 4 2 18 12 6
4 42 25 18 5 60 35 25
0 0 0 0 0 0 0 0
0 2 4 -2 0 4 7 -4
0.1 0.4 0.4 0.3 1 1
6 86 55 32 11 167 105 61
Product GWPSROC ODPSROC
ktonne yr-1
MtCO2-eq yr-1 ktonne ODP yr
-1
2002 BAU-2015 MIT-2015 Red-2015 2002 BAU-2015 MIT-2015 Red-2015 2002 BAU-2015 MIT-2015 Red-2015
0.001 0.001 0.001 0.01 0.01 0.01
0.001 0.001 0.001 0.01 0.01 0.01
No regional breakdown available No regional breakdown available No regional breakdown available
No regional breakdown available No regional breakdown available No regional breakdown available

EmissionsPer group
Halons
CFCs
HCFCs
HFCs
PFCs
Total incl halons
Total excl halons
Per sector
Refrigeration
Stationary Air Conditioning
Mobile Air Conditioning
Foams
Medical Aerosols
Fire Protection
HFC-23 by-product
Non-Medical Aerosols and Solvents
Total incl halons
Per subsector
Domestic Refrigeration
Commercial Refrigeration
Transport Refrigeration
Industrial Refrigeration
Stationary Air Conditioning
Mobile Air Conditioning
Foams
Medical Aerosols
Fire Protection
HFC-23 by-product
Non-Medical Aerosols and Solvents
Total incl halons
O. NO REGIONAL BREAKDOWN SPECIFIED (World Total)Product GWPSROC ODPSROC
ktonne yr-1
MtCO2-eq yr-1 ktonne ODP yr
-1
2002 BAU-2015 MIT-2015 Red-2015 2002 BAU-2015 MIT-2015 Red-2015 2002 BAU-2015 MIT-2015 Red-2015
11 16 16 6 9 9 1 1 1
15 24 3 21 220 359 60 299
0.10 0.01 0.01 0.9 0.1 0.1
26 40 19 21 226 369 70 299 1 1 1
26 40 19 21 226 369 70 299 1 1 1
Product GWPSROC ODPSROC
ktonne yr-1
MtCO2-eq yr-1 ktonne ODP yr
-1
2002 BAU-2015 MIT-2015 Red-2015 2002 BAU-2015 MIT-2015 Red-2015 2002 BAU-2015 MIT-2015 Red-2015
14 23 2 21 195 332 33 299
12 17 17 32 37 37 1 1 1
26 40 19 21 226 369 70 299 1 1 1
Product GWPSROC ODPSROC
ktonne yr-1
MtCO2-eq yr-1 ktonne ODP yr
-1
2002 BAU-2015 MIT-2015 Red-2015 2002 BAU-2015 MIT-2015 Red-2015 2002 BAU-2015 MIT-2015 Red-2015
14 23 2 21 195 332 33 299
12 17 17 32 37 37 1 1 1
26 40 19 21 226 369 70 299 1 1 1

EmissionsHalons
per sector
Refrigeration
Stationary Air Conditioning
Mobile Air Conditioning
Foams
Medical Aerosols
Fire Protection
HFC-23 by-product
Non-Medical Aerosols and Solvents
Total
CFCs
per sector
Refrigeration
Stationary Air Conditioning
Mobile Air Conditioning
Foams
Medical Aerosols
Fire Protection
HFC-23 by-product
Non-Medical Aerosols and Solvents
Total
HCFCs
per sector
Refrigeration
Stationary Air Conditioning
Mobile Air Conditioning
Foams
Medical Aerosols
Fire Protection
HFC-23 by-product
Non-Medical Aerosols and Solvents
Total
O. NO REGIONAL BREAKDOWN SPECIFIED (World Total)Product GWPSROC ODPSROC
ktonne yr-1
MtCO2-eq yr-1 ktonne ODP yr
-1
2002 BAU-2015 MIT-2015 Red-2015 2002 BAU-2015 MIT-2015 Red-2015 2002 BAU-2015 MIT-2015 Red-2015
Product GWPSROC ODPSROC
ktonne yr-1
MtCO2-eq yr-1 ktonne ODP yr
-1
2002 BAU-2015 MIT-2015 Red-2015 2002 BAU-2015 MIT-2015 Red-2015 2002 BAU-2015 MIT-2015 Red-2015
Product GWPSROC ODPSROC
ktonne yr-1
MtCO2-eq yr-1 ktonne ODP yr
-1
2002 BAU-2015 MIT-2015 Red-2015 2002 BAU-2015 MIT-2015 Red-2015 2002 BAU-2015 MIT-2015 Red-2015
11 16 16 6 9 9 1 1 1
11 16 16 6 9 9 1 1 1

EmissionsHFCs
per sector
Refrigeration
Stationary Air Conditioning
Mobile Air Conditioning
Foams
Medical Aerosols
Fire Protection
HFC-23 by-product
Non-Medical Aerosols and Solvents
Total
PFCs
per sector
Refrigeration
Stationary Air Conditioning
Mobile Air Conditioning
Foams
Medical Aerosols
Fire Protection
HFC-23 by-product
Non-Medical Aerosols and Solvents
Total
O. NO REGIONAL BREAKDOWN SPECIFIED (World Total)Product GWPSROC ODPSROC
ktonne yr-1
MtCO2-eq yr-1 ktonne ODP yr
-1
2002 BAU-2015 MIT-2015 Red-2015 2002 BAU-2015 MIT-2015 Red-2015 2002 BAU-2015 MIT-2015 Red-2015
14 23 2 21 195 332 33 299
1 1 1 25 27 27
15 24 3 21 220 359 60 299
Product GWPSROC ODPSROC
ktonne yr-1
MtCO2-eq yr-1 ktonne ODP yr
-1
2002 BAU-2015 MIT-2015 Red-2015 2002 BAU-2015 MIT-2015 Red-2015 2002 BAU-2015 MIT-2015 Red-2015
0.10 0.01 0.01 0.9 0.1 0.1
0.10 0.01 0.01 0.9 0.1 0.1

Graphs on demand, banks and emission data 2002-2015
The following graphs are based on the tables presented in the previous section. See the introduction of section 10.1 for some general remarks regarding the underlying data.
Legend
0 20 00
2 Non-Medical Aerosols and Solvents
HFC-23 by-product
Fire Protection
Medical Aerosols
Foams Mobile Air Conditioning
Stationary Air Conditioning
Refrigeration
0 200 400 600 800 1000 1200 1400 2002 BAU- 2015
PFCs
HFCs
HCFCs
CFCs
Halons

DEMAND - 2002 and 2015 Business As Usual
Product (in kt product) GWP (in Mt CO2-eq.) ODP (in kt ODP)
Wo
rld
To
tal
Halons
CFCs
CFCs
HCFCs
HCFCs
HFCs
HFCs
Refrigeration
Refrigeration
SAC
SAC
MAC
MAC
Foams
Foams
0
200
400
600
800
1000
1200
1400
2002 BAU-2015 2002 BAU-2015
Halons
CFCs
CFCs
HCFCs
HCFCs
HFCs
HFCs
Refrigeration Refrigeration
SACSAC
MAC
MAC
Foams
Foams
0
500
1000
1500
2000
2500
3000
2002 BAU-2015 2002 BAU-2015
HalonsCFCs
CFCs
HCFCs
HCFCs
Refrigeration
Refrigeration
SAC
SACMAC
MAC
Foams
Foams
Fire
0
50
100
150
200
250
2002 BAU-2015 2002 BAU-2015
De
ve
lop
ed
Co
un
trie
s
CFCsCFCs
HCFCs
HCFCs
HFCs
HFCs
Refrigeration Refrigeration
SAC
SAC
MAC
MAC
Foams
Foams
0
200
400
600
800
1000
1200
1400
2002 BAU-2015 2002 BAU-2015
CFCs
CFCs
HCFCs
HCFCsHFCs
HFCs
RefrigerationRefrigeration
SAC
SAC
MACMAC
Foams
Foams
0
500
1000
1500
2000
2500
3000
2002 BAU-2015 2002 BAU-2015
CFCs
HCFCs
Refrigeration
SAC
MAC
Foams
0
50
100
150
200
250
2002 BAU-2015 2002 BAU-2015
De
ve
lop
ing
Co
un
trie
s
CFCs
CFCs
HCFCsHCFCs
HFCs
HFCs
Refrigeration
Refrigeration
SAC
SACMAC
MACFoams
Foams
0
200
400
600
800
1000
1200
1400
2002 BAU-2015 2002 BAU-2015
CFCs
CFCs
HCFCs
HCFCs
HFCs
HFCs
RefrigerationRefrigeration
SAC
SAC
MAC
MACFoams
Foams
0
500
1000
1500
2000
2500
3000
2002 BAU-2015 2002 BAU-2015
Halons
CFCs
CFCs
HCFCs
HCFCs
Refrigeration
Refrigeration
SAC
MAC
Foams
Fire
0
50
100
150
200
250
2002 BAU-2015 2002 BAU-2015

BANKS - 2002 and 2015 Business As Usual
Product (in kt product) GWP (in Mt CO2-eq.) ODP (in kt ODP)
Wo
rld
To
tal
HalonsHalons
CFCs
CFCs
HCFCs
HCFCs
HFCs
HFCs
Refrigeration
Refrigeration
SAC
SAC
MAC
MAC
Foams
Foams
0
1000
2000
3000
4000
5000
6000
7000
8000
2002 BAU-2015 2002 BAU-2015
HalonsHalons
CFCs
CFCs
HCFCs
HCFCs
HFCs
HFCs
RefrigerationRefrigeration
SAC SAC
MACMAC
Foams
Foams
0
5000
10000
15000
20000
25000
2002 BAU-2015 2002 BAU-2015
Halons
Halons
CFCs
CFCs
HCFCs
HCFCs
Refrigeration
Refrigeration
SAC
SAC MAC
MAC
Foams
Foams
Fire protection
Fire protection
0
500
1000
1500
2000
2500
3000
3500
4000
2002 BAU-2015 2002 BAU-2015
De
ve
lop
ed
Co
un
trie
s
CFCsCFCs
HCFCs
HCFCs
HFCsHFCs
RefrigerationRefrigeration
SACSAC
MAC
MAC
Foams
Foams
0
1000
2000
3000
4000
5000
6000
7000
8000
2002 BAU-2015 2002 BAU-2015
CFCs
CFCs
HCFCs
HCFCs
HFCs
HFCs
RefrigerationRefrigeration
SAC SAC
MACMAC
FoamsFoams
0
5000
10000
15000
20000
25000
2002 BAU-2015 2002 BAU-2015
CFCs
CFCs HCFCs
HCFCs
RefrigerationSAC
MAC
Foams
Foams
Fire protection
Fire protection
0
500
1000
1500
2000
2500
3000
3500
4000
2002 BAU-2015 2002 BAU-2015
De
ve
lop
ing
Co
un
trie
s
CFCsCFCs
HCFCsHCFCs
HFCs
HFCs
RefrigerationRefrigeration
SAC
SAC
MAC
MACFoams
Foams
0
1000
2000
3000
4000
5000
6000
7000
8000
2002 BAU-2015 2002 BAU-2015
CFCs
CFCs HCFCs
HCFCs
HFCs
HFCs
RefrigerationRefrigeration
SACSACMAC
MAC
FoamsFoams
0
5000
10000
15000
20000
25000
2002 BAU-2015 2002 BAU-2015
CFCs
CFCs
HCFCs
HCFCs
RefrigerationSAC MAC
Foams
Foams
Fire protection
Fire protection
0
500
1000
1500
2000
2500
3000
3500
4000
2002 BAU-2015 2002 BAU-2015
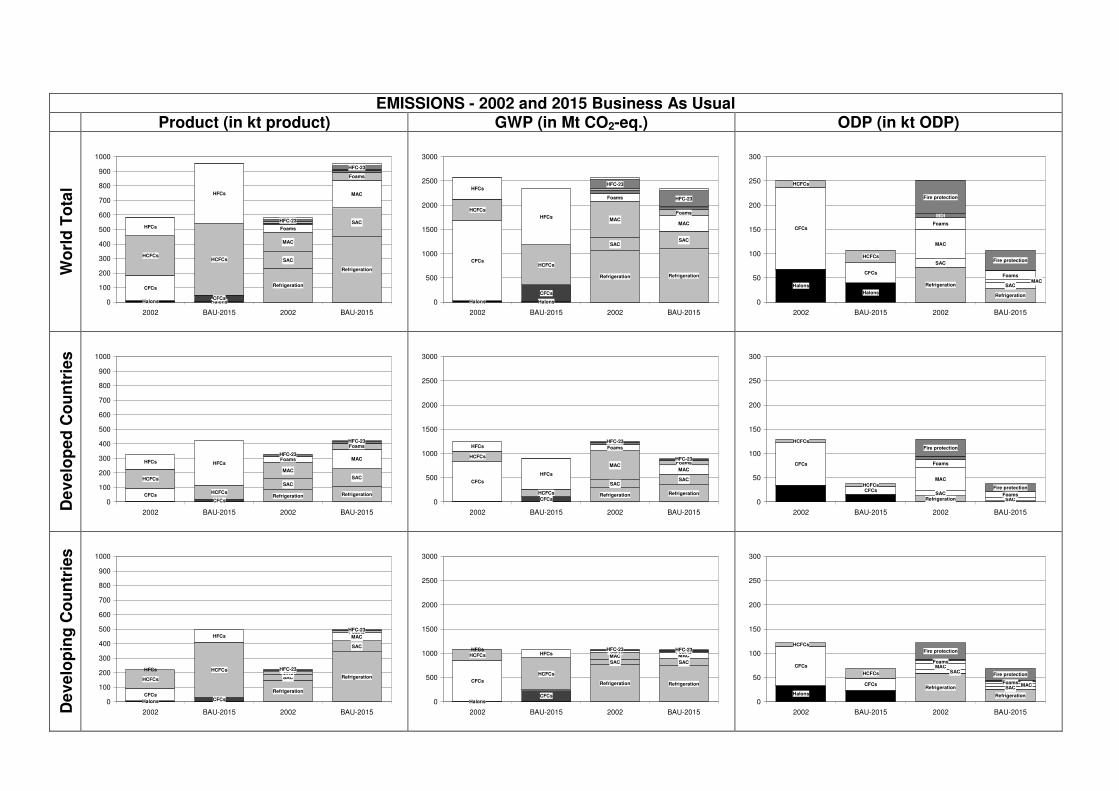
EMISSIONS - 2002 and 2015 Business As Usual Product (in kt product) GWP (in Mt CO2-eq.) ODP (in kt ODP)
Wo
rld
To
tal
HalonsHalonsCFCs
CFCs
HCFCsHCFCs
HFCs
HFCs
Refrigeration
Refrigeration
SAC
SAC
MAC
MAC
Foams
Foams
HFC-23
HFC-23
0
100
200
300
400
500
600
700
800
900
1000
2002 BAU-2015 2002 BAU-2015
HalonsHalons
CFCs
CFCsHCFCs
HCFCs
HFCs
HFCs
RefrigerationRefrigeration
SACSAC
MACMAC
Foams
Foams
HFC-23
HFC-23
0
500
1000
1500
2000
2500
3000
2002 BAU-2015 2002 BAU-2015
Halons
Halons
CFCs
CFCs
HCFCs
HCFCs
Refrigeration
Refrigeration
SAC
SACMAC
MAC
Foams
Foams
MDI
Fire protection
Fire protection
0
50
100
150
200
250
300
2002 BAU-2015 2002 BAU-2015
De
ve
lop
ed
Co
un
trie
s
CFCsCFCs
HCFCs
HCFCs
HFCsHFCs
RefrigerationRefrigeration
SAC
SAC
MAC
MAC
Foams
Foams
HFC-23
HFC-23
0
100
200
300
400
500
600
700
800
900
1000
2002 BAU-2015 2002 BAU-2015
CFCs
CFCs
HCFCs
HCFCs
HFCs
HFCs
RefrigerationRefrigeration
SACSAC
MACMAC
Foams
Foams
HFC-23
HFC-23
0
500
1000
1500
2000
2500
3000
2002 BAU-2015 2002 BAU-2015
CFCs
CFCs
HCFCs
HCFCs
Refrigeration SAC
SAC
MAC
Foams
Foams
Fire protection
Fire protection
0
50
100
150
200
250
300
2002 BAU-2015 2002 BAU-2015
De
ve
lop
ing
Co
un
trie
s
Halons CFCsCFCs
HCFCs
HCFCs
HFCs
HFCs
Refrigeration
Refrigeration
SAC
SAC
MAC
MACFoams
Foams
HFC-23
HFC-23
0
100
200
300
400
500
600
700
800
900
1000
2002 BAU-2015 2002 BAU-2015
HalonsCFCs
CFCs
HCFCs
HCFCs HFCsHFCs
RefrigerationRefrigeration
SAC SAC
MACMACFoams FoamsHFC-23 HFC-23
0
500
1000
1500
2000
2500
3000
2002 BAU-2015 2002 BAU-2015
Halons
CFCs
CFCs
HCFCs
HCFCs
Refrigeration
Refrigeration
SAC
SACMAC
MACFoams
Foams
Fire protection
Fire protection
0
50
100
150
200
250
300
2002 BAU-2015 2002 BAU-2015

DEMAND - 2015 Business As Usual (BAU) and Mitigation (MIT) Scenario
Product (in kt product) GWP (in Mt CO2-eq.) ODP (in kt ODP)
Wo
rld
To
tal
CFCs CFCs
HCFCs
HCFCs
HFCs
HFCs
Refrigeration
Refrigeration
SAC
SAC
MAC
MAC
Foams
Foams
0
200
400
600
800
1000
1200
1400
BAU-2015 MIT-2015 BAU-2015 MIT-2015
CFCs CFCs
HCFCs
HCFCs
HFCs
HFCs
Refrigeration
Refrigeration
SAC
SAC
MAC
MAC
Foams
Foams
0
500
1000
1500
2000
2500
3000
BAU-2015 MIT-2015 BAU-2015 MIT-2015
CFCs
CFCs
HCFCs
HCFCs
Refrigeration
Refrigeration
SAC
SAC
MAC
MAC
Foams
Foams
MDIs
Fire
Fire
0
10
20
30
40
50
BAU-2015 MIT-2015 BAU-2015 MIT-2015
De
ve
lop
ed
Co
un
trie
s
CFCs CFCsHCFCs HCFCs
HFCs
HFCs
RefrigerationRefrigeration
SAC
SAC
MAC
MAC
Foams
Foams
0
200
400
600
800
1000
1200
1400
BAU-2015 MIT-2015 BAU-2015 MIT-2015
CFCsCFCs HCFCsHCFCs
HFCs
HFCs
RefrigerationRefrigeration
SAC
SAC
MAC
MAC
Foams
Foams
0
500
1000
1500
2000
2500
3000
BAU-2015 MIT-2015 BAU-2015 MIT-2015
CFCs
HCFCs
Refrigeration Refrigeration
SACSAC
0
10
20
30
40
50
BAU-2015 MIT-2015 BAU-2015 MIT-2015
De
ve
lop
ing
Co
un
trie
s
CFCsCFCs
HCFCs
HCFCs
HFCs
HFCs
Refrigeration
Refrigeration
SAC
SAC
MAC
MACFoams
Foams
0
200
400
600
800
1000
1200
1400
BAU-2015 MIT-2015 BAU-2015 MIT-2015
CFCsCFCs
HCFCs
HCFCs
HFCs
HFCs
RefrigerationRefrigeration
SAC
SAC
MAC
MACFoams
Foams
0
500
1000
1500
2000
2500
3000
BAU-2015 MIT-2015 BAU-2015 MIT-2015
CFCsCFCs
HCFCs
HCFCs
Refrigeration
Refrigeration
SAC
SAC
MAC
MAC
Foams
Foams
MDIs
0
10
20
30
40
50
BAU-2015 MIT-2015 BAU-2015 MIT-2015

BANKS - 2015 Business As Usual (BAU) and Mitigation (MIT) Scenario
Product (in kt product) GWP (in Mt CO2-eq.) ODP (in kt ODP)
Wo
rld
To
tal
HalonsHalons
CFCsCFCs
HCFCsHCFCs
HFCs
HFCs
RefrigerationRefrigeration
SACSAC
MAC
MAC
Foams
Foams
0
1000
2000
3000
4000
5000
6000
7000
8000
BAU-2015 MIT-2015 BAU-2015 MIT-2015
HalonsHalons
CFCsCFCs
HCFCsHCFCs
HFCsHFCs
RefrigerationRefrigeration
SACSAC
MAC
MAC
Foams
Foams
0
5000
10000
15000
20000
25000
BAU-2015 MIT-2015 BAU-2015 MIT-2015
HalonsHalons
CFCsCFCs
HCFCsHCFCs
RefrigerationRefrigeration
SAC SACMACMAC
Foams Foams
Fire protectionFire protection
0
500
1000
1500
2000
2500
BAU-2015 MIT-2015 BAU-2015 MIT-2015
De
ve
lop
ed
Co
un
trie
s
CFCsCFCs
HCFCsHCFCs
HFCs
HFCs
RefrigerationRefrigeration
SACSAC
MACMAC
Foams
Foams
0
1000
2000
3000
4000
5000
6000
7000
8000
BAU-2015 MIT-2015 BAU-2015 MIT-2015
CFCsCFCs
HCFCsHCFCs
HFCsHFCs
RefrigerationRefrigeration
SACSAC
MACMAC
FoamsFoams
0
5000
10000
15000
20000
25000
BAU-2015 MIT-2015 BAU-2015 MIT-2015
CFCsCFCs
HCFCsHCFCs
RefrigerationRefrigerationSAC SAC
Foams Foams
Fire protectionFire protection
0
500
1000
1500
2000
2500
BAU-2015 MIT-2015 BAU-2015 MIT-2015
De
ve
lop
ing
Co
un
trie
s
CFCsCFCs
HCFCsHCFCs
HFCsHFCs
RefrigerationRefrigeration
SACSAC
MACMAC
FoamsFoams
0
1000
2000
3000
4000
5000
6000
7000
8000
BAU-2015 MIT-2015 BAU-2015 MIT-2015
CFCsCFCs
HCFCsHCFCs
HFCsHFCs
RefrigerationRefrigeration
SAC SACMACMAC
Foams Foams
0
5000
10000
15000
20000
25000
BAU-2015 MIT-2015 BAU-2015 MIT-2015
CFCsCFCs
HCFCsHCFCs
RefrigerationRefrigeration
SAC SACMAC
Foams Foams
Fire protectionFire protection
0
500
1000
1500
2000
2500
BAU-2015 MIT-2015 BAU-2015 MIT-2015
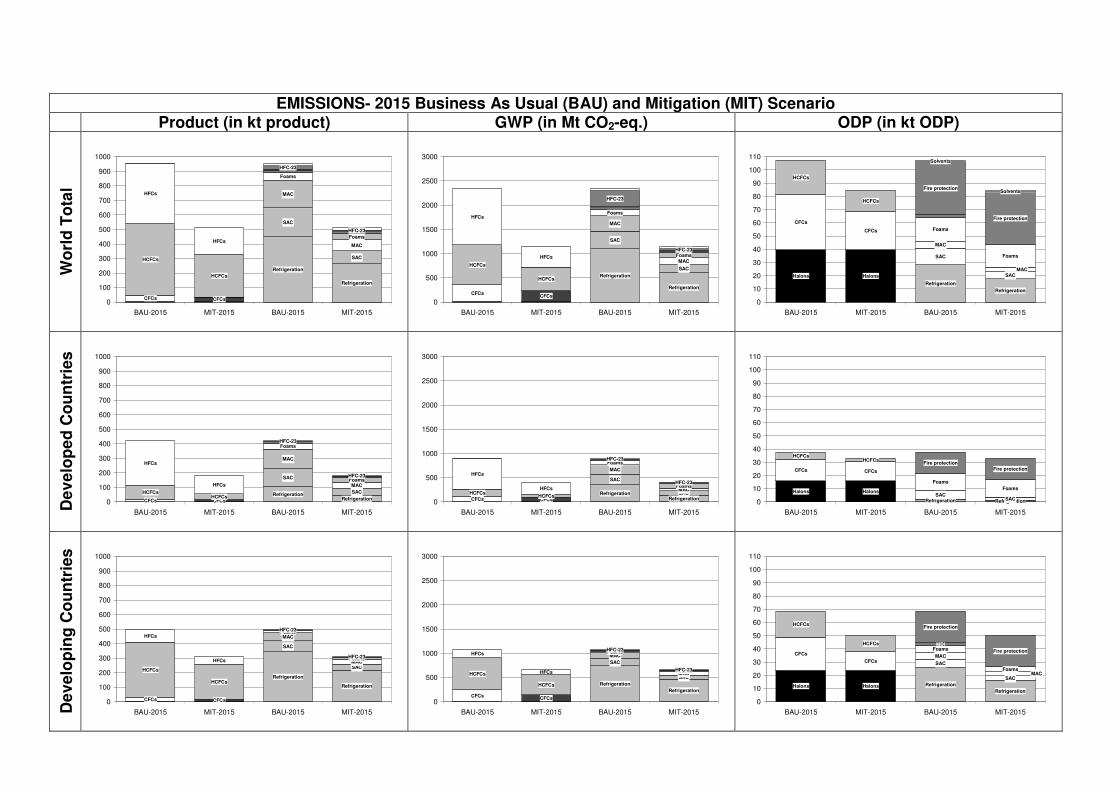
EMISSIONS- 2015 Business As Usual (BAU) and Mitigation (MIT) Scenario
Product (in kt product) GWP (in Mt CO2-eq.) ODP (in kt ODP)
Wo
rld
To
tal
CFCsCFCs
HCFCs
HCFCs
HFCs
HFCs
Refrigeration
Refrigeration
SAC
SAC
MAC
MAC
Foams
Foams
HFC-23
HFC-23
0
100
200
300
400
500
600
700
800
900
1000
BAU-2015 MIT-2015 BAU-2015 MIT-2015
CFCsCFCs
HCFCs
HCFCs
HFCs
HFCs
Refrigeration
Refrigeration
SAC
SAC
MAC
MAC
Foams
Foams
HFC-23
HFC-23
0
500
1000
1500
2000
2500
3000
BAU-2015 MIT-2015 BAU-2015 MIT-2015
HalonsHalons
CFCs
CFCs
HCFCs
HCFCs
Refrigeration
Refrigeration
SAC
SAC
MAC
MAC
Foams
Foams
Fire protection
Fire protection
Solvents
Solvents
0
10
20
30
40
50
60
70
80
90
100
110
BAU-2015 MIT-2015 BAU-2015 MIT-2015
De
ve
lop
ed
Co
un
trie
s
CFCs CFCs
HCFCsHCFCs
HFCs
HFCs
RefrigerationRefrigeration
SAC
SAC
MAC
MACFoams
Foams
HFC-23
HFC-23
0
100
200
300
400
500
600
700
800
900
1000
BAU-2015 MIT-2015 BAU-2015 MIT-2015
CFCs CFCs
HCFCsHCFCs
HFCs
HFCsRefrigeration
RefrigerationSAC
SAC
MAC
MACFoams
Foams
HFC-23
HFC-23
0
500
1000
1500
2000
2500
3000
BAU-2015 MIT-2015 BAU-2015 MIT-2015
HalonsHalons
CFCs CFCs
HCFCsHCFCs
Refrigeration RefrigerationSACSAC
Foams
Foams
Fire protection
Fire protection
0
10
20
30
40
50
60
70
80
90
100
110
BAU-2015 MIT-2015 BAU-2015 MIT-2015
De
ve
lop
ing
Co
un
trie
s
CFCs CFCs
HCFCs
HCFCs
HFCs
HFCs
Refrigeration
Refrigeration
SAC
SAC
MAC
MACFoams
Foams
HFC-23
HFC-23
0
100
200
300
400
500
600
700
800
900
1000
BAU-2015 MIT-2015 BAU-2015 MIT-2015
CFCsCFCs
HCFCs
HCFCs
HFCs
HFCs
Refrigeration
Refrigeration
SAC
SAC
MAC
MACFoams
Foams
HFC-23
HFC-23
0
500
1000
1500
2000
2500
3000
BAU-2015 MIT-2015 BAU-2015 MIT-2015
HalonsHalons
CFCs
CFCs
HCFCs
HCFCs
Refrigeration
Refrigeration
SAC
SACMAC
MAC
Foams
Foams
MDI
Fire protection
Fire protection
0
10
20
30
40
50
60
70
80
90
100
110
BAU-2015 MIT-2015 BAU-2015 MIT-2015

2015 Emission Reduction Potential as compared to Business As Usual
Product (in kt product) GWP (in Mt CO2-eq.) ODP (in kt ODP)
Em
issio
n R
ed
uc
tio
n
HFCs
Refrigeration
Refrigeration
SAC
SAC
SACMAC
MAC
MAC
Foams Foams
HFC-23
0
50
100
150
200
250
CFCs HCFCs HFCs
HFCsRefrigeration
Refrigeration
SACSAC
SACMAC
MACMACFoams
Foams
HFC-23
0
100
200
300
400
500
600
700
800
CFCs HCFCs HFCs
Refrigeration
Refrigeration
SAC
SAC
MACMAC
Foams Foams
MDI
0
2
4
6
8
10
12
14
CFCs HCFCs HFCs
Legend
No regional breakdown
Developing
Developed
0 20
00 2
Non-Medical Aerosols and Solvents
HFC-23 by-product
Fire Protection
Medical Aerosols
Foams
Mobile Air Conditioning
Stationary Air Conditioning
Refrigeration