mooc learner behaviors by country and culture; an ...rsb2162/paper121.pdf · mooc learner behaviors...
TRANSCRIPT

MOOC Learner Behaviors by Country and Culture;an Exploratory Analysis
Zhongxiu LiuNorth Carolina State
UniversityRaleigh, NC
Rebecca BrownNorth Carolina State
UniversityRaleigh, NC
Collin F. LynchNorth Carolina State
UniversityRaleigh, NC
[email protected] Barnes
North Carolina StateUniversity
Raleigh, [email protected]
Ryan BakerTeachers College, Columbia
UniversityNew York, NY
Yoav BergnerEducational Testing Service
Princeton, [email protected]
Danielle McNamaraArizona State University
Phoenix, [email protected]
ABSTRACTThe advent of Massive Online Open Courses (MOOCs) hasled to the availability of large educational datasets collectedfrom diverse international audiences. Little work has beendone on the impact of cultural and geographic factors onstudent performance in MOOCs. In this paper, we analyzenational and cultural differences in students’ performance ina large-scale MOOC. We situate our analysis in the contextof existing theoretical frameworks for cultural analysis. Wefocus on three dimensions of learner behavior: course activ-ity profiles; quiz activity profiles; and most connected forumpeer or best friends. We conclude that countries or associ-ated cultural clusters are associated with differences in allthree dimensions. These findings stress the need for moreresearch on the internationalization in online education andgreater intercultural awareness among MOOC designers.
1. INTRODUCTIONOver the past decade there has been a substantial increase inthe study of cross-cultural behaviors in e-learning systems.Prior researchers have shown that learners from differentcultures behave differently when using educational systems,particularly in terms of their off-task behaviors [25, 21], help-seeking [21], and collaboration [22, 16]. The cultural differ-ences uncovered in these studies suggest that designers offuture e-learning platforms would benefit from a better un-derstanding of their distinct target populations and distinctcultures.
Large-scale MOOCs typically attract diverse internationalaudiences. The course we discuss here, for example, at-tracted students from 172 countries on 5 continents. Despitethis acknowledged diversity, most MOOCs take a one-size-fits-all approach to designing and structuring the course.The materials are typically offered in a single format andlanguage, or via direct translations that preserve the struc-ture, pacing, and content.
Prior researchers have shown that country of origin affectsstudents’ performance in MOOCs. Nesterko et al. [19] foundthat non-American students were more prone to completeMOOCs and to seek certification than their U.S. counter-parts. Guo and Reinecke [12] found that a student’s countryof origin significantly predicted the amount of content thatthey would cover and the amount of time that they spent re-viewing prior course content. Kizilcec [17] found that therewas a significant correlation between a country’s level onthe Human Development Index and the number of studentsfrom that country who completed a majority of the assign-ments. In each of these studies, however, nationality wastreated as a single independent factor. No substantive com-parisons were made between countries or cultures, nor didthe authors frame their conclusions in the context of priortheoretical work on cultural differences in learning.
A deeper understanding of how students differ both withinand across cultures will help us to design and deploy moreeffective, and truly international MOOCs. And this under-standing will be enriched by relating these differences tothe rich existing literature on cross-cultural education suchas Hofstede’s cultural dimensions theory [13] and the Cul-tural Dimensions of Learning Framework (CDLF). In thispaper we will address this need through our analysis of cross-cultural student behaviors in an existing MOOC. This wasan open course with a total enrollment of 29,149 studentsdrawn from 172 countries and 5 continents. We found clearinter-country and inter-cultural differences in the observed
student behaviors and in the distribution of user categories.We also found that these differences can be evaluated in thecontext of existing theoretical frameworks and that they areconsistent with prior educational literature.
2. LITERATURE REVIEW2.1 Culture & Educational TechnologyAdvances in educational technology have enabled educatorsto incorporate technologies at larger scale and to collectricher and more diverse educational data than ever before.This has, in turn, substantially increased interest in study-ing variations in the use of e-learning tools across cultures.
One approach to understanding the impact of culture onlearning is through field observation. Rodrigo et al. [25]coded U.S. and Filipino students’ on- and off-task behaviorswhen using three ITSs. They found that Filipino studentsspent more time on task than their U.S. counterparts on allthree systems. They also found that the Filipino studentsgamed some systems more than others. Similarly, Ogan etal.[22] coded the on-task behaviors and interaction of similarstudents in Chile. They found that the Chilean students hada higher proportion of on-task interactions than the U.S.students studied previously.
Another approach is through educational data mining. Oganet al. [21] generated student models from ITS logs collectedin three countries: Costa Rica, The Philippines, and theU.S. Their goal in this work was to predict effective help-seeking behaviors. They found that it was possible to gener-alize the U.S. model to Filipino students but not to studentsfrom Costa Rica. Saarela and Karkkainen [27] applied a hi-erarchical clustering algorithm to data collected from thePISA, a worldwide assessment of 15-year old students cov-ering reading, mathematics, and science. They found thatstudents’ performance on the test clustered by country, sug-gesting cultural influences.
While these studies found interesting cross-cultural differ-ences, we have little understanding of why these differencesoccur, or of how they relate to more general cross-culturalvariation. Learning behaviors are influenced by a complexset of factors and cross-cultural comparisons may help usdeepen our understanding of this phenomenon and highlightways to remediate or accommodate it. In this paper, we ex-plore the logs of student activity in a MOOC, with an eyetoward how culture may relate to differences in behavior.
2.2 MOOC ResearchMOOCs represent both opportunities and challenges for ed-ucators. On the one hand they involve large numbers ofusers working in highly instrumented systems which can, inturn, provide deep insights. On the other hand, however,MOOCs have high dropout rates, wide variation in levels ofengagement, and MOOC users have extremely diverse mo-tivations and demographic backgrounds. Thus any insightsare qualified by the noisy nature of the data. Researchershave therefore focused their efforts on better understandingMOOC users and their differing behavior patterns.
One approach to understanding MOOC students is to buildpredictive behavior models based upon their clickstream data,such as mining sequences of actions for analysis [29, 5].These induced models are highly accurate but are not alwaysreadily interpretable. Other work has focused on improvingour understanding of engagement and dropouts by detectingkey subgroups. In this work, researchers have used hierar-chical clustering to identify groups of students with similarpatterns of engagement, such as those who viewed many lec-tures but rarely attempted quizzes, and those who balancedtheir activities equally [17, 10, 4, 1]. Kizilcec et al. [17]and Ferguson et al. [10], for example, clustered students byengagement factors such as the number of lectures viewedand quizzes attempted. Anderson et al. [1] likewise usedlecture views and considered the ratio of lectures to assign-ments while Bergner et al. [4] focuses solely on assignmentsattempted. These studies served to highlight the distinctbehavioral patterns of different subgroups.
Researchers have also begun to study students’ diverse back-grounds through voluntary surveys with the goal of under-standing how their incoming motivation [28, 2] and demo-graphic features [19, 17, 12] affect their observed behaviors.Both Nesterko [19] and Deboer [9] found that participation(as indicated by survey responses) and certificate attainmentrates differed across countries, continents, and genders; theydid not, however, delve deeper into students’ in-system be-haviors as logged by the learning environment. Wang andBaker [28], by contrast, found that learners receiving coursecertificates tended to be more interested in course content,while students not receiving certificates often stated thatthey were seeking a new type of learning experience.
Few of these researchers however, have focused on the rela-tionship between geographic information and observed be-haviors. Guo and Reinecke [12] applied linear regression tocorrelate some demographic features such as years of ed-ucation to geographic data. They found that a students’country of origin was significantly related to their coverageof the course content overall and the extent to which they re-viewed prior content, called backjumps. They attributed thisdiversity to varying student-to-teacher ratios. They foundthat countries with a higher ratio had a higher frequency ofbackjumps suggesting more time on review. In related workKizilcec focused on partitioning countries into tiers basedupon the Human Development Index (HDI). They foundthat as the HDI tier increased, so to did the proportion ofstudents who completed the course. While these results areinstructive, however, the authors made no attempt to situ-ate these results in the context of existing theoretical modelsof cross-cultural learning.
Thus the results from prior MOOC research show that un-derstanding students’ diverse backgrounds can be essentialto the development of effective educational interventions,and to providing useful support for student engagement andparticipation. Geographical location, considered as a set ofeconomic, cultural, and educational differences, may play acrucial role in understanding, supporting, and appealing tothe increasing population of MOOC users.
2.3 Theoretical FrameworksMOOCs and educational technologies allow us to collect ro-bust information about cross-cultural differences in user be-haviors. Yet we face challenges in interpreting and explain-ing these results in a consistent theoretical framework.
Prior educational researchers have worked to identify relatedcultural dimensions and values, and to examine how theyvary across cultures. One common framework is Hofstede’sCultural Dimensions Theory [13, 14]. Hofstede analyzed aset of 117,000 attitude surveys collected by IBM from theirinternational workforce and synthesized a set of 7 generalcultural dimensions: a) power distance; b) collectivism vs.individualism; c) femininity vs. masculinity; d) uncertaintyavoidance; e) long/short term orientation; and f) indulgencevs. restraint. Hofstede then calculated scores for each cul-ture within these dimensions.
Hofstede’s dimensions have been used to analyze and ex-plain differences in collaboration across cultures [16], as wellas differences in help-seeking and off-task behavior in ed-ucational technology [21, 25]. However these studies havesuggested that the cultural dimensions framework has somelimitations in explaining these findings. Many of the keydifferences in the observed behaviors do not correspond tothe differences that Hofstede’s theory suggests. In particu-lar, variations in collectivism and collaboration/help-seekingstrategies do not seem to relate well to Hofstede’s underly-ing dimensions. Therefore we will combine this with theCultural Dimensions Learning Framework (CDLF).
The CDLF framework, designed by Parrish et al. in 2010[24], defines eight cultural parameters regarding social rela-tionships, epistemological beliefs, and temporal perceptions,and how they manifest in learning situations. The CDLFhas been used to guide the design and analysis of e-learningacross cultures [23, 15]. For the purposes of our analysis wewill focus on the intersection of the CDLF and the Hofst-ede dimensions. We will use this hybrid framework to groupcountries into cultural clusters, and to interpret the observedbehavioral differences between them. Table 3 provides anoverview of the shared dimensions.
While these frameworks may help to explain observed be-haviors, it is worth noting that learner behaviors in MOOCscan be affected by many other factors such as personal mo-tivation. Wang and Baker [28], for example, surveyed themotivations of incoming students on a later version of thecourse we study here and found that learners who obtainedcourse certificates tended to be more interested in coursecontent than those who took the MOOC in order to test thelearning experience. While this highlights the importanceof individual differences, our analysis below we will focus oninter-country differences and cultural factors.
3. DATAThe data used in this study was collected from Big Datain Education (BDE), an 8-week long MOOC offered by theTeacher’s College at Columbia University on the Courseraplatform [28]. The BDE curriculum included video lectures,discussion forums, and 8 weekly assignments or quizzes. Thelectures covered key methods for educational data analysis.The assignments required students to analyze existing data
Table 1: Intersection of Hofstede Dimensions andthe Cultural Dimensions of Learning Framework.
Hofstede Dimension[13]
Selected Interpretationsin CDLF [24]
Power Distance: the ex-tent to which the lesspowerful members ex-pect and accept un-equal/unfair situations
Countries with high powerdistance view teacher as anunchallenged authority andthe primary communicator,not as a fallible peer.
Individualism: the de-gree of interdependencea society maintainsamong its members
Highly individualist stu-dents are more prone tospeak up in class, to valuediverse opinions in learning,and to be motivated bypersonal gain.
Masculinity: the degreeto which a culture is mo-tivated by competition(instead of life quality)
More masculine cultures areassociated with increasedlevels of competition and aheavier pursuit of recogni-tion.
Uncertainty Avoidance:The extent to whicha culture feels threat-ened by ambiguous orunknown situations andtries to avoid these
Students who avoid uncer-tainty tend to focus moreon getting the right answerfrom authoritative sourcesand from the structuredlearning activities.
(typically real data collected from educational settings) andto answer questions about their results. All of the assign-ments were automatically graded via numeric or multiple-choice questions. Students were given between 3 and 5 at-tempts to complete each assignment with the best score be-ing counted. Students were required to complete their as-signments within 2 weeks of it being released. In order toobtain a certificate students were required to obtain an aver-age grade of ≥ 70% over all 8 assignments. High performingstudents could receive a certificate with distinction. 638 stu-dents completed the course and obtained a certificate.
Data from this course has been previously used to studymotivation [28], negativity [7], student communities [6], therelationship between linguistic quality of forum posts andcompletion[8], as well as longitudinal behavior patterns[31].
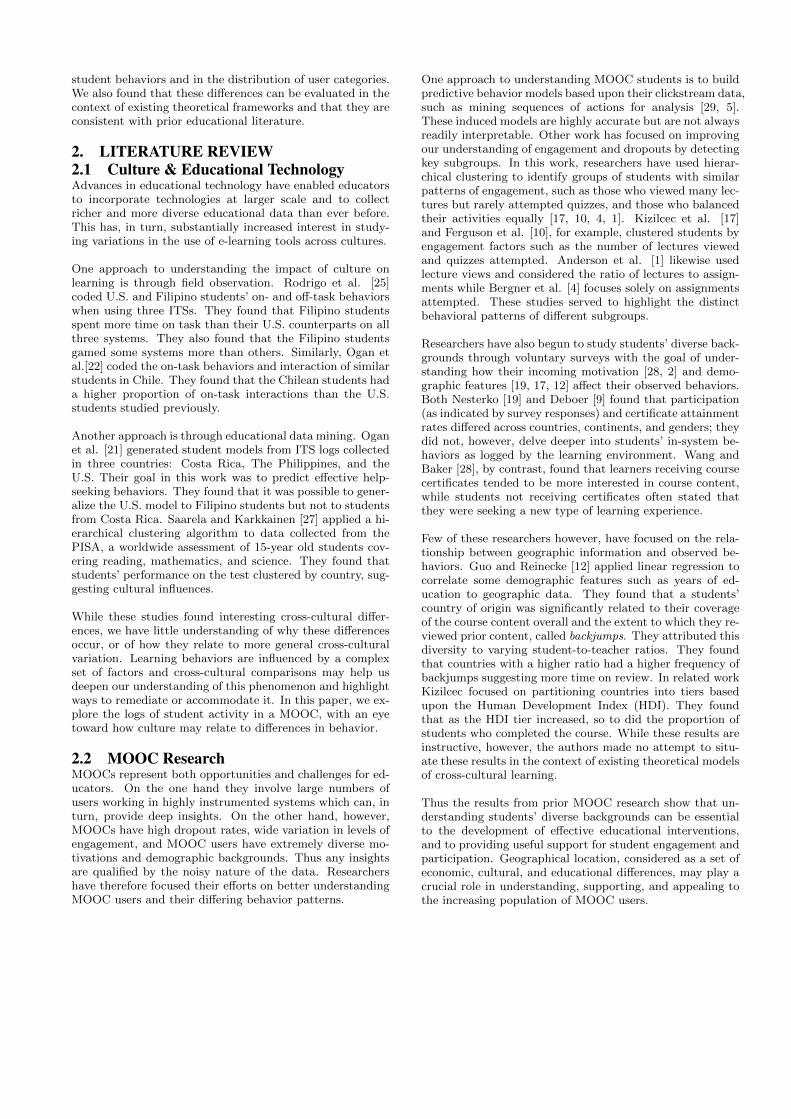
For the purposes of our analysis we analyzed clickstreamdata containing user IDs, IP addresses, URLs and times-tamps for 29,149 students. This data included all 638 stu-dents who received a certificate as well as 750 who posted onthe forum. After classifying students by behavior type wefound that a total of 1,591 students were actively engagedwith the course while the remaining 27,588 were ‘bystanders’who enrolled but did not do any significant work. We as-signed users to regions based upon their most frequent IPaddress as has been done in prior work [17, 9, 12]. The top15 countries by registration are shown in Figure 1.
We then analyzed the URLs located in the clickstream datato identify the following major activities: view lecture (VL),attempt or submit quiz (AQ, SQ), and read or make a postin forum (RP, MP). We then generated activity sequencesfrom this data using an n-gram approach consistent with
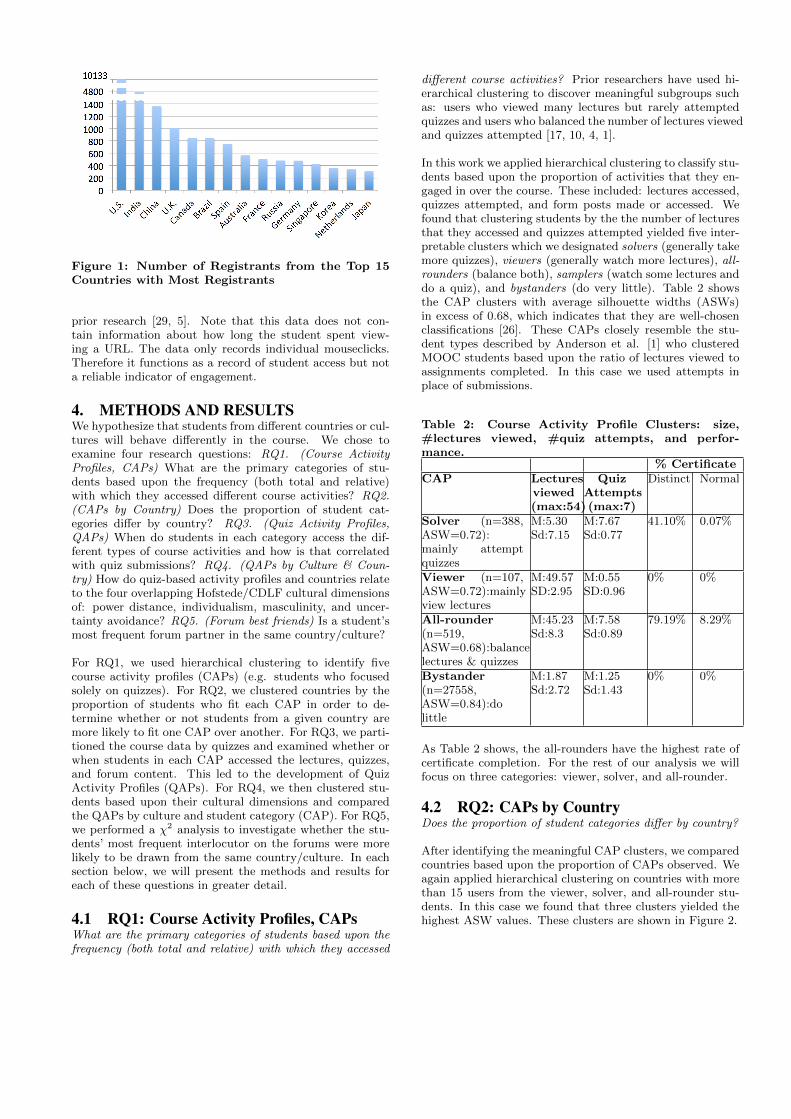
Figure 1: Number of Registrants from the Top 15Countries with Most Registrants
prior research [29, 5]. Note that this data does not con-tain information about how long the student spent view-ing a URL. The data only records individual mouseclicks.Therefore it functions as a record of student access but nota reliable indicator of engagement.
4. METHODS AND RESULTSWe hypothesize that students from different countries or cul-tures will behave differently in the course. We chose toexamine four research questions: RQ1. (Course ActivityProfiles, CAPs) What are the primary categories of stu-dents based upon the frequency (both total and relative)with which they accessed different course activities? RQ2.(CAPs by Country) Does the proportion of student cat-egories differ by country? RQ3. (Quiz Activity Profiles,QAPs) When do students in each category access the dif-ferent types of course activities and how is that correlatedwith quiz submissions? RQ4. (QAPs by Culture & Coun-try) How do quiz-based activity profiles and countries relateto the four overlapping Hofstede/CDLF cultural dimensionsof: power distance, individualism, masculinity, and uncer-tainty avoidance? RQ5. (Forum best friends) Is a student’smost frequent forum partner in the same country/culture?
For RQ1, we used hierarchical clustering to identify fivecourse activity profiles (CAPs) (e.g. students who focusedsolely on quizzes). For RQ2, we clustered countries by theproportion of students who fit each CAP in order to de-termine whether or not students from a given country aremore likely to fit one CAP over another. For RQ3, we parti-tioned the course data by quizzes and examined whether orwhen students in each CAP accessed the lectures, quizzes,and forum content. This led to the development of QuizActivity Profiles (QAPs). For RQ4, we then clustered stu-dents based upon their cultural dimensions and comparedthe QAPs by culture and student category (CAP). For RQ5,we performed a χ2 analysis to investigate whether the stu-dents’ most frequent interlocutor on the forums were morelikely to be drawn from the same country/culture. In eachsection below, we will present the methods and results foreach of these questions in greater detail.
4.1 RQ1: Course Activity Profiles, CAPsWhat are the primary categories of students based upon thefrequency (both total and relative) with which they accessed
different course activities? Prior researchers have used hi-erarchical clustering to discover meaningful subgroups suchas: users who viewed many lectures but rarely attemptedquizzes and users who balanced the number of lectures viewedand quizzes attempted [17, 10, 4, 1].
In this work we applied hierarchical clustering to classify stu-dents based upon the proportion of activities that they en-gaged in over the course. These included: lectures accessed,quizzes attempted, and form posts made or accessed. Wefound that clustering students by the the number of lecturesthat they accessed and quizzes attempted yielded five inter-pretable clusters which we designated solvers (generally takemore quizzes), viewers (generally watch more lectures), all-rounders (balance both), samplers (watch some lectures anddo a quiz), and bystanders (do very little). Table 2 showsthe CAP clusters with average silhouette widths (ASWs)in excess of 0.68, which indicates that they are well-chosenclassifications [26]. These CAPs closely resemble the stu-dent types described by Anderson et al. [1] who clusteredMOOC students based upon the ratio of lectures viewed toassignments completed. In this case we used attempts inplace of submissions.
Table 2: Course Activity Profile Clusters: size,#lectures viewed, #quiz attempts, and perfor-mance.
% CertificateCAP Lectures
viewed(max:54)
QuizAttempts(max:7)
Distinct Normal
Solver (n=388,ASW=0.72):mainly attemptquizzes
M:5.30Sd:7.15
M:7.67Sd:0.77
41.10% 0.07%
Viewer (n=107,ASW=0.72):mainlyview lectures
M:49.57SD:2.95
M:0.55SD:0.96
0% 0%
All-rounder(n=519,ASW=0.68):balancelectures & quizzes
M:45.23Sd:8.3
M:7.58Sd:0.89
79.19% 8.29%
Bystander(n=27558,ASW=0.84):dolittle
M:1.87Sd:2.72
M:1.25Sd:1.43
0% 0%
As Table 2 shows, the all-rounders have the highest rate ofcertificate completion. For the rest of our analysis we willfocus on three categories: viewer, solver, and all-rounder.
4.2 RQ2: CAPs by CountryDoes the proportion of student categories differ by country?
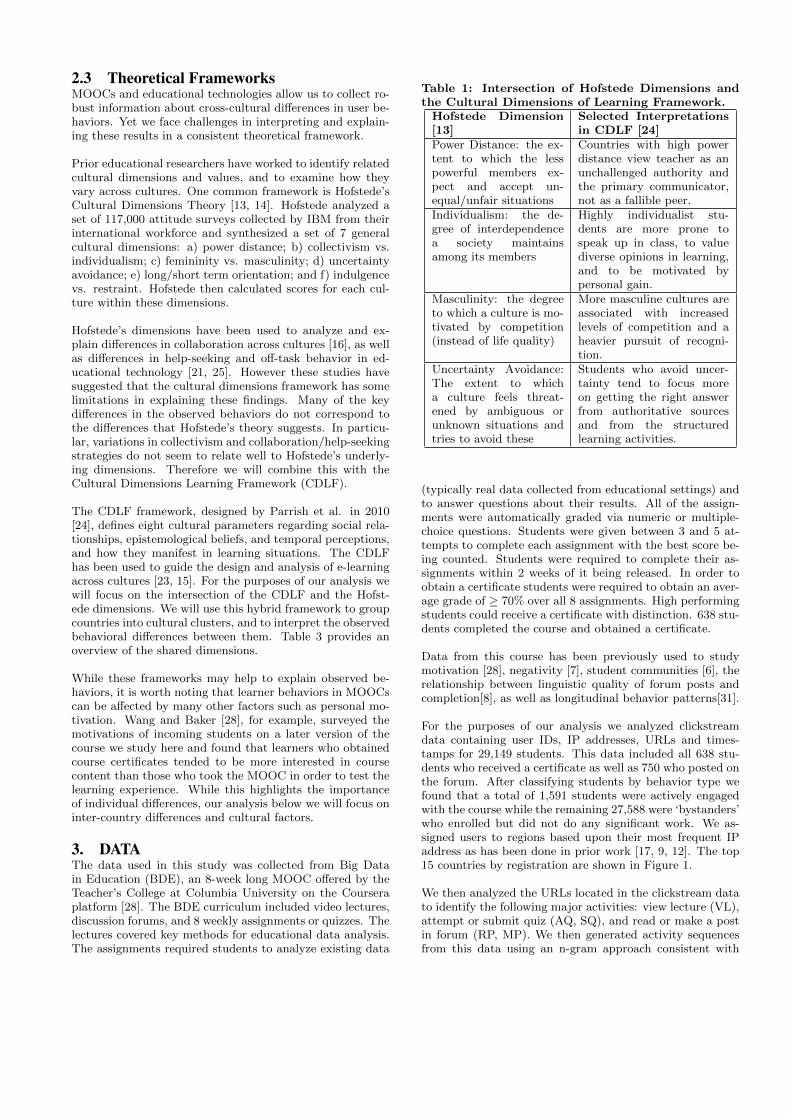
After identifying the meaningful CAP clusters, we comparedcountries based upon the proportion of CAPs observed. Weagain applied hierarchical clustering on countries with morethan 15 users from the viewer, solver, and all-rounder stu-dents. In this case we found that three clusters yielded thehighest ASW values. These clusters are shown in Figure 2.
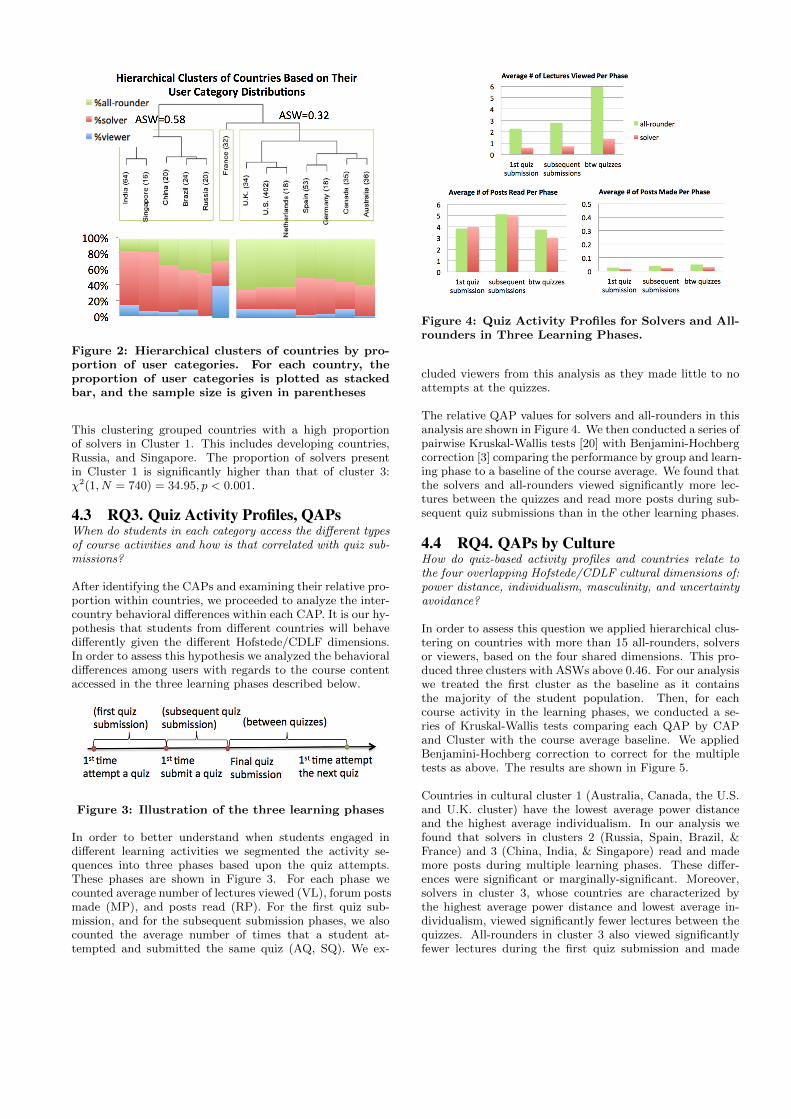
Figure 2: Hierarchical clusters of countries by pro-portion of user categories. For each country, theproportion of user categories is plotted as stackedbar, and the sample size is given in parentheses
This clustering grouped countries with a high proportionof solvers in Cluster 1. This includes developing countries,Russia, and Singapore. The proportion of solvers presentin Cluster 1 is significantly higher than that of cluster 3:χ2(1, N = 740) = 34.95, p < 0.001.
4.3 RQ3. Quiz Activity Profiles, QAPsWhen do students in each category access the different typesof course activities and how is that correlated with quiz sub-missions?
After identifying the CAPs and examining their relative pro-portion within countries, we proceeded to analyze the inter-country behavioral differences within each CAP. It is our hy-pothesis that students from different countries will behavedifferently given the different Hofstede/CDLF dimensions.In order to assess this hypothesis we analyzed the behavioraldifferences among users with regards to the course contentaccessed in the three learning phases described below.
Figure 3: Illustration of the three learning phases
In order to better understand when students engaged indifferent learning activities we segmented the activity se-quences into three phases based upon the quiz attempts.These phases are shown in Figure 3. For each phase wecounted average number of lectures viewed (VL), forum postsmade (MP), and posts read (RP). For the first quiz sub-mission, and for the subsequent submission phases, we alsocounted the average number of times that a student at-tempted and submitted the same quiz (AQ, SQ). We ex-
Figure 4: Quiz Activity Profiles for Solvers and All-rounders in Three Learning Phases.
cluded viewers from this analysis as they made little to noattempts at the quizzes.
The relative QAP values for solvers and all-rounders in thisanalysis are shown in Figure 4. We then conducted a series ofpairwise Kruskal-Wallis tests [20] with Benjamini-Hochbergcorrection [3] comparing the performance by group and learn-ing phase to a baseline of the course average. We found thatthe solvers and all-rounders viewed significantly more lec-tures between the quizzes and read more posts during sub-sequent quiz submissions than in the other learning phases.
4.4 RQ4. QAPs by CultureHow do quiz-based activity profiles and countries relate tothe four overlapping Hofstede/CDLF cultural dimensions of:power distance, individualism, masculinity, and uncertaintyavoidance?
In order to assess this question we applied hierarchical clus-tering on countries with more than 15 all-rounders, solversor viewers, based on the four shared dimensions. This pro-duced three clusters with ASWs above 0.46. For our analysiswe treated the first cluster as the baseline as it containsthe majority of the student population. Then, for eachcourse activity in the learning phases, we conducted a se-ries of Kruskal-Wallis tests comparing each QAP by CAPand Cluster with the course average baseline. We appliedBenjamini-Hochberg correction to correct for the multipletests as above. The results are shown in Figure 5.
Countries in cultural cluster 1 (Australia, Canada, the U.S.and U.K. cluster) have the lowest average power distanceand the highest average individualism. In our analysis wefound that solvers in clusters 2 (Russia, Spain, Brazil, &France) and 3 (China, India, & Singapore) read and mademore posts during multiple learning phases. These differ-ences were significant or marginally-significant. Moreover,solvers in cluster 3, whose countries are characterized bythe highest average power distance and lowest average in-dividualism, viewed significantly fewer lectures between thequizzes. All-rounders in cluster 3 also viewed significantlyfewer lectures during the first quiz submission and made
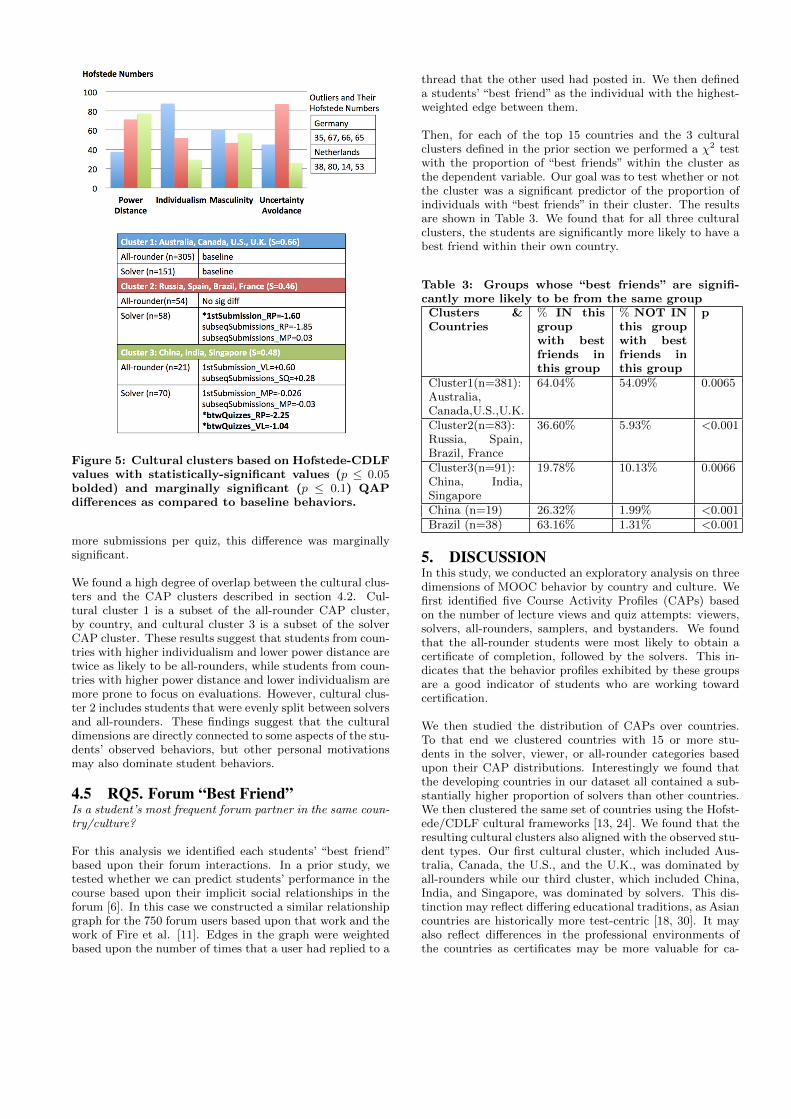
Figure 5: Cultural clusters based on Hofstede-CDLFvalues with statistically-significant values (p ≤ 0.05bolded) and marginally significant (p ≤ 0.1) QAPdifferences as compared to baseline behaviors.
more submissions per quiz, this difference was marginallysignificant.
We found a high degree of overlap between the cultural clus-ters and the CAP clusters described in section 4.2. Cul-tural cluster 1 is a subset of the all-rounder CAP cluster,by country, and cultural cluster 3 is a subset of the solverCAP cluster. These results suggest that students from coun-tries with higher individualism and lower power distance aretwice as likely to be all-rounders, while students from coun-tries with higher power distance and lower individualism aremore prone to focus on evaluations. However, cultural clus-ter 2 includes students that were evenly split between solversand all-rounders. These findings suggest that the culturaldimensions are directly connected to some aspects of the stu-dents’ observed behaviors, but other personal motivationsmay also dominate student behaviors.
4.5 RQ5. Forum “Best Friend”Is a student’s most frequent forum partner in the same coun-try/culture?
For this analysis we identified each students’ “best friend”based upon their forum interactions. In a prior study, wetested whether we can predict students’ performance in thecourse based upon their implicit social relationships in theforum [6]. In this case we constructed a similar relationshipgraph for the 750 forum users based upon that work and thework of Fire et al. [11]. Edges in the graph were weightedbased upon the number of times that a user had replied to a
thread that the other used had posted in. We then defineda students’ “best friend” as the individual with the highest-weighted edge between them.
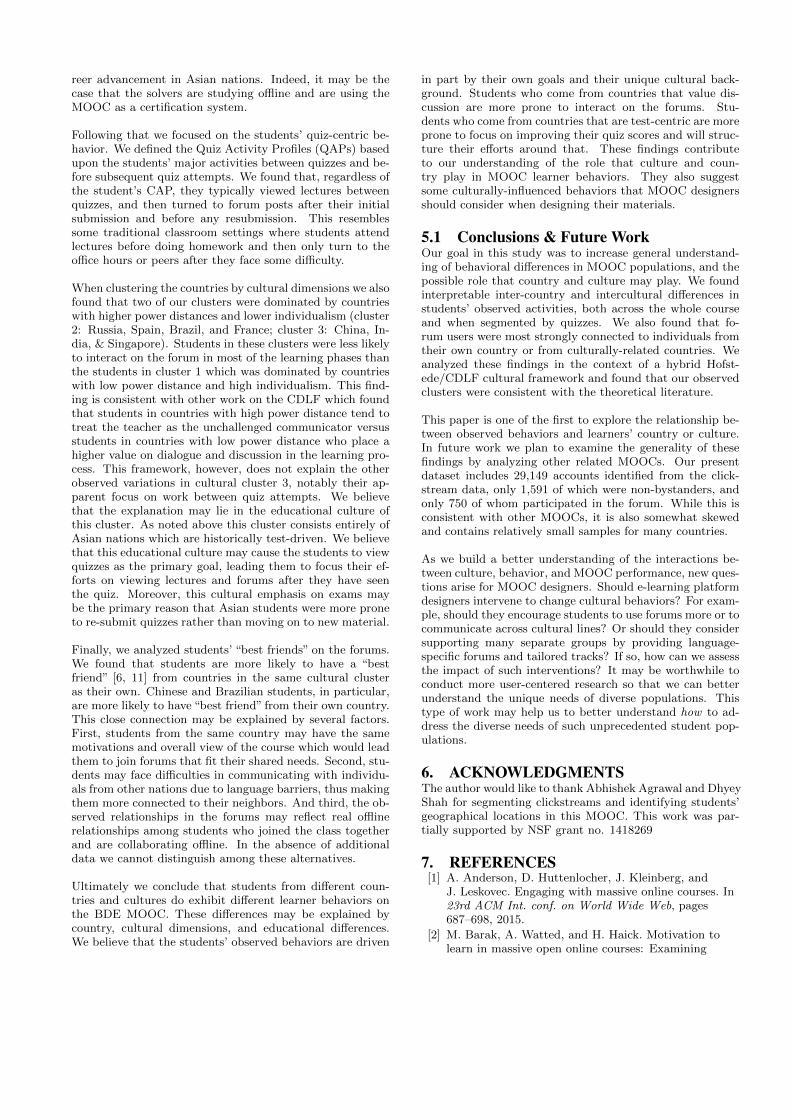
Then, for each of the top 15 countries and the 3 culturalclusters defined in the prior section we performed a χ2 testwith the proportion of “best friends” within the cluster asthe dependent variable. Our goal was to test whether or notthe cluster was a significant predictor of the proportion ofindividuals with “best friends” in their cluster. The resultsare shown in Table 3. We found that for all three culturalclusters, the students are significantly more likely to have abest friend within their own country.
Table 3: Groups whose “best friends” are signifi-cantly more likely to be from the same groupClusters &Countries
% IN thisgroupwith bestfriends inthis group
% NOT INthis groupwith bestfriends inthis group
p
Cluster1(n=381):Australia,Canada,U.S.,U.K.
64.04% 54.09% 0.0065
Cluster2(n=83):Russia, Spain,Brazil, France
36.60% 5.93% <0.001
Cluster3(n=91):China, India,Singapore
19.78% 10.13% 0.0066
China (n=19) 26.32% 1.99% <0.001Brazil (n=38) 63.16% 1.31% <0.001
5. DISCUSSIONIn this study, we conducted an exploratory analysis on threedimensions of MOOC behavior by country and culture. Wefirst identified five Course Activity Profiles (CAPs) basedon the number of lecture views and quiz attempts: viewers,solvers, all-rounders, samplers, and bystanders. We foundthat the all-rounder students were most likely to obtain acertificate of completion, followed by the solvers. This in-dicates that the behavior profiles exhibited by these groupsare a good indicator of students who are working towardcertification.
We then studied the distribution of CAPs over countries.To that end we clustered countries with 15 or more stu-dents in the solver, viewer, or all-rounder categories basedupon their CAP distributions. Interestingly we found thatthe developing countries in our dataset all contained a sub-stantially higher proportion of solvers than other countries.We then clustered the same set of countries using the Hofst-ede/CDLF cultural frameworks [13, 24]. We found that theresulting cultural clusters also aligned with the observed stu-dent types. Our first cultural cluster, which included Aus-tralia, Canada, the U.S., and the U.K., was dominated byall-rounders while our third cluster, which included China,India, and Singapore, was dominated by solvers. This dis-tinction may reflect differing educational traditions, as Asiancountries are historically more test-centric [18, 30]. It mayalso reflect differences in the professional environments ofthe countries as certificates may be more valuable for ca-
reer advancement in Asian nations. Indeed, it may be thecase that the solvers are studying offline and are using theMOOC as a certification system.
Following that we focused on the students’ quiz-centric be-havior. We defined the Quiz Activity Profiles (QAPs) basedupon the students’ major activities between quizzes and be-fore subsequent quiz attempts. We found that, regardless ofthe student’s CAP, they typically viewed lectures betweenquizzes, and then turned to forum posts after their initialsubmission and before any resubmission. This resemblessome traditional classroom settings where students attendlectures before doing homework and then only turn to theoffice hours or peers after they face some difficulty.
When clustering the countries by cultural dimensions we alsofound that two of our clusters were dominated by countrieswith higher power distances and lower individualism (cluster2: Russia, Spain, Brazil, and France; cluster 3: China, In-dia, & Singapore). Students in these clusters were less likelyto interact on the forum in most of the learning phases thanthe students in cluster 1 which was dominated by countrieswith low power distance and high individualism. This find-ing is consistent with other work on the CDLF which foundthat students in countries with high power distance tend totreat the teacher as the unchallenged communicator versusstudents in countries with low power distance who place ahigher value on dialogue and discussion in the learning pro-cess. This framework, however, does not explain the otherobserved variations in cultural cluster 3, notably their ap-parent focus on work between quiz attempts. We believethat the explanation may lie in the educational culture ofthis cluster. As noted above this cluster consists entirely ofAsian nations which are historically test-driven. We believethat this educational culture may cause the students to viewquizzes as the primary goal, leading them to focus their ef-forts on viewing lectures and forums after they have seenthe quiz. Moreover, this cultural emphasis on exams maybe the primary reason that Asian students were more proneto re-submit quizzes rather than moving on to new material.
Finally, we analyzed students’ “best friends” on the forums.We found that students are more likely to have a “bestfriend” [6, 11] from countries in the same cultural clusteras their own. Chinese and Brazilian students, in particular,are more likely to have “best friend” from their own country.This close connection may be explained by several factors.First, students from the same country may have the samemotivations and overall view of the course which would leadthem to join forums that fit their shared needs. Second, stu-dents may face difficulties in communicating with individu-als from other nations due to language barriers, thus makingthem more connected to their neighbors. And third, the ob-served relationships in the forums may reflect real offlinerelationships among students who joined the class togetherand are collaborating offline. In the absence of additionaldata we cannot distinguish among these alternatives.
Ultimately we conclude that students from different coun-tries and cultures do exhibit different learner behaviors onthe BDE MOOC. These differences may be explained bycountry, cultural dimensions, and educational differences.We believe that the students’ observed behaviors are driven
in part by their own goals and their unique cultural back-ground. Students who come from countries that value dis-cussion are more prone to interact on the forums. Stu-dents who come from countries that are test-centric are moreprone to focus on improving their quiz scores and will struc-ture their efforts around that. These findings contributeto our understanding of the role that culture and coun-try play in MOOC learner behaviors. They also suggestsome culturally-influenced behaviors that MOOC designersshould consider when designing their materials.
5.1 Conclusions & Future WorkOur goal in this study was to increase general understand-ing of behavioral differences in MOOC populations, and thepossible role that country and culture may play. We foundinterpretable inter-country and intercultural differences instudents’ observed activities, both across the whole courseand when segmented by quizzes. We also found that fo-rum users were most strongly connected to individuals fromtheir own country or from culturally-related countries. Weanalyzed these findings in the context of a hybrid Hofst-ede/CDLF cultural framework and found that our observedclusters were consistent with the theoretical literature.
This paper is one of the first to explore the relationship be-tween observed behaviors and learners’ country or culture.In future work we plan to examine the generality of thesefindings by analyzing other related MOOCs. Our presentdataset includes 29,149 accounts identified from the click-stream data, only 1,591 of which were non-bystanders, andonly 750 of whom participated in the forum. While this isconsistent with other MOOCs, it is also somewhat skewedand contains relatively small samples for many countries.
As we build a better understanding of the interactions be-tween culture, behavior, and MOOC performance, new ques-tions arise for MOOC designers. Should e-learning platformdesigners intervene to change cultural behaviors? For exam-ple, should they encourage students to use forums more or tocommunicate across cultural lines? Or should they considersupporting many separate groups by providing language-specific forums and tailored tracks? If so, how can we assessthe impact of such interventions? It may be worthwhile toconduct more user-centered research so that we can betterunderstand the unique needs of diverse populations. Thistype of work may help us to better understand how to ad-dress the diverse needs of such unprecedented student pop-ulations.
6. ACKNOWLEDGMENTSThe author would like to thank Abhishek Agrawal and DhyeyShah for segmenting clickstreams and identifying students’geographical locations in this MOOC. This work was par-tially supported by NSF grant no. 1418269
7. REFERENCES[1] A. Anderson, D. Huttenlocher, J. Kleinberg, and
J. Leskovec. Engaging with massive online courses. In23rd ACM Int. conf. on World Wide Web, pages687–698, 2015.
[2] M. Barak, A. Watted, and H. Haick. Motivation tolearn in massive open online courses: Examining
aspects of language and social engagement. Computers& Education, 94(49-60), 2016.
[3] Y. Benjamini and Y. Hochberg. Controlling the falsediscovery rate: a practical and powerful approach tomultiple testing. Journal of the Royal StatisticalSociety. Series B (Methodological), 289-300, 1995.
[4] Y. Bergner, D. Kerr, and D. E. Pritchard.Methodological challenges in the analysis of MOOCdata for exploring the relationship between discussionforum views and learning outcomes. In The 8th Int.conf. on Educational Data Mining, 2015.
[5] C. Brooks, C. Thompson, and S. Teasley. A timeseries interaction analysis method for buildingpredictive models of learners using log data. In In theFifth Int. conf. on Learning Analytics And Knowledge,pages 126–135, 2015.
[6] R. Brown, C. Lynch, Y. Wang, M. Eagle, J. Albert,T. Barnes, R. Baker, Y. Bergner, and D. McNamara.Communities of performance & communities ofpreference. In the 2nd Int. Workshop on Graph-BasedEducational Data Mining., 2015.
[7] D. Comer, R. Baker, and Y. Wang. Negativity inmassive online open courses: Impacts on learning andteaching and how instructional teams may be able toaddress it. Journal of the Center for Excellence inTeaching and Learning, 10:92–106, 2015.
[8] S. Crossley, D. McNamara, R. Baker, Y. Wang,L. Paquette, T. Barnes, and Y. Bergner. Language tocompletion: Success in an educational data miningmassive open online class. In The 8th Int. conf. onEducational Data Mining, 2015.
[9] J. DeBoer, G. S. Stump, D. Seaton, and L. Breslow.Diversity in mooc students’ backgrounds andbehaviors in relationship to performance in 6.002 x. InIn the Sixth Learning Int. Networks Consortiumconf.., 2013.
[10] R. Ferguson and D. Clow. Examining engagement:analysing learner subpopulations in massive openonline courses (MOOCs). In the Fifth Int. conf. onLearning Analytics And Knowledge ACM, pages51–58, 2015.
[11] M. Fire, G. Katz, Y. Elovici, B. Shapira, andL. Rokach. Predicting student exam’s scores byanalyzing social network data. In the 7th Int.Workshop on Active Media Technology, 2012.
[12] P. J. Guo and K. Reinecke. Demographic differences inhow students navigate through MOOCs. pages 21–30,2014.
[13] G. Hofstede and G. J. Hofstede. Cultures andorganizations: Software of the mind (3rd ed.).McGraw-Hill, New York, USA, 2010.
[14] G. Hofstede, G. J. Hofstede, M. Minkov, andH. Vinken. Values survey module 2008. URL:http://www. geerthofstede.nl/media/253/VSM08English. doc, 2008.
[15] A. N. Hunt and S. Tickner. Cultural dimensions oflearning in online teacher education courses. Journalof Open, Flexible and Distance Learning, 19(2):25–47,2015.
[16] K. J. Kim and C. J. Bonk. Cross-cultural comparisonsof online collaboration. Journal of Computer-Mediated
Communication, 8(1), 2002.[17] R. F. Kizilcec, C. Piech, and E. Schneider.
Deconstructing disengagement: Analyzing learnersubpopulations in massive open online courses. In the3rd Int. conf. on learning analytics and knowledge,pages 170–179, 2013.
[18] F. K. Leung. In search of an East Asian identity inmathematics education. Educational Studies inMathematics, 17(1), 35-51, 2001.
[19] S. O. Nesterko, S. Dotsenko, Q. Han, D. Seaton,J. Reich, I. Chuang, and A. D. Ho. Evaluating thegeographic data in MOOCs. In the 2013 conf. onNeural Information Processing Systems, 2013.
[20] C. G. Northcutt, A. D. Ho, and I. L. Chuang. Use ofranks in one-criterion variance analysis. Journal of theAmerican statistical Assoc., 47(260):583–621, 1952.
[21] A. Ogan, E. Walker, R. Baker, M. M. T. Rodrigo,J. C. Soriano, and M. J. Castro. Towardsunderstanding how to assess help-seeking behavioracross cultures. Int. Journal of Artificial Intelligencein Education, 25(2):229–248, 2015.
[22] A. Ogan, E. Yarzebinski, P. Fernandez, and I. Casas.Cognitive tutor use in Chile: Understanding classroomand lab culture. In the 17th Int. conf. on ArtificialIntelligence in Education, pages 318–327, 2015.
[23] A. C. Ordonez. Predicting Int. Critical Success Factorsin e-learning: A comparison of four universities fromChina, Mexico, Spain and USA. PhD thesis,Universitat Oberta de Catalunya, August 2014.
[24] P. Parrish and J. Linder-VanBerschot. Culturaldimensions of learning: Addressing the challenges ofmulticultural instruction. The Int. Review of Researchin Open and Distributed Learning, 11(2), 2010.
[25] M. M. T. Rodrigo, R. S. J. D. Baker, and L. Rossi.Student off-task behavior in computer-based learningin the Philippines: comparison to prior research in theusa. Teachers College Record, 115(10):1–27, 2013.
[26] P. J. Rousseeuw. Silhouettes: a graphical aid to theinterpretation and validation of cluster analysis.Journal of computational and applied mathematics,20:53–65, 1987.
[27] M. Saarela and T. Karkkainen. Do countrystereotypes exist in PISA? a clustering approach forlarge, sparse, and weighted data. In The 8th Int. conf.on Educational Data Mining, 2015.
[28] Y. Wang and R. Baker. Content or platform: Why dostudents complete MOOCs? MERLOT Journal ofOnline Learning and Teaching, 11(1), 17-30, 2015.
[29] M. Wen and C. P. Rose. Identifying latent studyhabits by mining learner behavior patterns in massiveopen online courses. In the 23rd ACM Int. conf. onconf. on Information and Knowledge Management,pages 1983–1986, 2014.
[30] J. K. K. Wong. Are the learning styles of Asian int.students culturally or contextually based? Int.Education Journal, 4(4), 154-166, 2004.
[31] M. Zhu, Y. Bergner, Y. Zhang, R. Baker, E. Wang,and L. Paquette. Longitudinal engagement,performance, and social connectivity: a MOOC casestudy using exponential random graph models. In The6th Int. conf. on Learning Analytics and Knowledge,2016.