mood and the menstrual cycle
TRANSCRIPT

Fax +41 61 306 12 34E-Mail [email protected]
Regular Article
Psychother Psychosom 2013;82:53–60 DOI: 10.1159/000339370
Mood and the Menstrual Cycle
Sarah E. Romans a David Kreindler b, f Eriola Asllani g Gillian Einstein c
Sheila Laredo d Anthony Levitt b, f Kathryn Morgan e Michele Petrovic h
Brenda Toner b Donna E. Stewart b
a Department of Psychological Medicine, University of Otago, Wellington , New Zealand; Departments of b Psychiatry, c Psychology, d Medicine and e Philosophy and Women’s and Gender Studies, University of Toronto, f Centre for Mobile Computing in Mental Health, Sunnybrook Health Sciences Centre, g Institute for Clinical Evaluative Sciences, and h Hospital for Sick Children, Toronto, Ont. , Canada
ses-follicular-luteal MC division gave similar results. Less than 0.5% of the women’s individual periodogram records for each mood item showed MC entrainment. Physical health, perceived stress and social support were much stron-ger predictors of mood (p ! 0.0001 in each case) than MC phase. Conclusions: The results of this study do not support the widespread idea of specific premenstrual dysphoria in women. Daily physical health status, perceived stress and so-cial support explain daily mood better than MC phase.
Copyright © 2012 S. Karger AG, Basel
Introduction
In women, the menstrual cycle (MC) is often viewed as a source of mood variability [1, 2] . For many women, depressed irritable moods are commonly held to be more common during the premenstrual days than dur-ing the rest of the MC. Premenstrual tension syndrome is coded in the International Classification of Diseases code N94.3 as a broader syndrome than the tightly de-fined premenstrual dysphoric disorder in the DSM-IV [3] . There is, in addition, a wider undefined lay concept in common usage, usually called premenstrual syn-drome, recalling the terminology many years ago of
Key Words
Mood � Menstrual cycle � Premenstrual phase � Perimenstrual phase � Health � Social support � Perceived stress � Social attribution � Handheld computers � Mental health telemetry
Abstract
Background: Premenstrual mood symptoms are considered common in women, but such prevailing attitudes are shaped by social expectations about gender, emotionality and hor-monal influences. There are few prospective, community studies of women reporting mood data from all phases of the menstrual cycle (MC). We aimed (i) to analyze daily mood data over 6 months for MC phase cyclicity and (ii) to compare MC phase influences on a woman’s daily mood with that at-tributable to key alternate explanatory variables (physical health, perceived stress and social support). Method: A ran-dom sample of Canadian women aged 18–40 years collect-ed mood and health data daily over 6 months, using telem-etry, producing 395 complete MCs for analysis. Results: Only half the individual mood items showed any MC phase asso-ciation; these links were either with the menses phase alone or the menses plus the premenstrual phase. With one excep-tion, the association was not solely premenstrual. The men-
Received: November 28, 2011 Accepted after revision: June 22, 2012 Published online: November 6, 2012
Prof. Sarah Romans Department of Psychological Medicine, University of OtagoWellington Clinical School of Medicine and Health Sciences PO Box 7343 , Wellington 6242 (New Zealand) Tel. +64 4 385 5541, ext. 5653, E-Mail sarah.romans @ otago.ac.nz
© 2012 S. Karger AG, Basel0033–3190/13/0821–0053$38.00/0
Accessible online at:www.karger.com/pps

Romans et al. Psychother Psychosom 2013;82:53–60 54
Dalton [4] . However, many regard such categories as to-day’s version of an age-old preconception that women are victims of their reproductive biology which drives a gender-specific emotionality [5–9] . Although there are over forty published papers reporting prospective daily mood ratings in adult women, most use convenience samples, often with a limited age range such as univer-sity undergraduate students. Many gather data for only 1 MC, which does not capture cycle-to-cycle variation [10] . Culturally generated expectations can bias report-ing; women socialized to expect premenstrual distress are primed to report increased problems during that phase [6, 11, 12] . Methodologies designed to minimize this bias are: (i) to collect information prospectively, (ii) to obscure the menstrual focus of the research, (iii) to offer a range of mood items for study such as increased energy or positive (happy) mood as well as depression/irritability and (iv) to include all MC phases for com-parison with the premenstruum; if only some phases are studied, it is not possible to conclude that the premen-struum has the worst moods.
Time series data, generated by prospective designs, present a challenge for analysis [13] . Traditional statistical approaches use the whole sample, with each participant contributing many data points over time to the analyses; the resulting ‘noise’ may camouflage key time-sequence patterns specific to any particular individual. For some questions about putative cyclical patterns, it is more in-formative to analyze each participant’s results separately. In this report, we use both approaches.
The Mood in Daily Life (MiDL) project aimed to dis-cover how important the MC phase is in determining women’s daily mood or, more precisely, how much daily mood variability in a nonclinic sample of women of re-productive age could be attributed to the MC phase. As it is not possible to eliminate culturally based expectations completely, we also investigated the relationship between mood and the MC using a different approach. We com-pared the relative importance of the MC phase with three other independent variables which are known to have a causal relationship with depressed mood and depressive disorder: (i) social support, (ii) physical health and (iii) perceived stress. Substantial evidence links each of these areas to poor mental health in general and to depressive illness in particular [14–20] .
It is important to understand how much the MC de-termines variation in women’s mood for at least two rea-sons. Firstly, such knowledge shapes women’s own expec-tations about their health [21–24] , and secondly, it can guide the development of theoretical models of mood and
mood variability. The MiDL project used a novel data col-lection strategy, mental health telemetry [25] , which uses real-time wireless networking to transmit self-report rat-ings from participants’ cell phones.
Methods
Participants A professional telephone random digit dialing service recruit-
ed a sample of women aged 18–40 years living within the urban Greater Toronto Area, in Ontario, Canada. Each woman was asked if she was willing to participate in a research project involv-ing an initial face-to-face interview and then daily information collection over 24 weeks about her mood and activity levels using a hand-held computer (HHC). We endeavored to keep the MC focus of the study hidden from the participants; the project was described as an investigation into mood in daily life. Approval for the MiDL study was obtained from the Sunnybrook and Women’s College Research Ethics Board. Exclusion criteria were: (i) the in-ability to understand English adequately to complete the assess-ment procedures and (ii) being currently pregnant or within 12 months of childbirth.
Data Collection Each woman had an assessment interview, at a place of her
choice, to collect relevant demographic details and psychological and physical health information. Psychiatric status was assessed with the Mini-International Neuropsychiatric Interview [26] . We lent each participant a Palm Inc. Treo 650 HHC loaded with men-tal health telemetry software [25] . Telemetry ensured that data were both truly prospective and temporally precise, eliminating bias from recall [27–29] . Participants nominated their most con-venient time each day to answer the daily questionnaire and the device was set for that time.
Assessment of Daily Mood and Health Each day, the participants completed the Daily Life Question-
naire (DLQ) which was developed for this study. Online supple-mentary table 1 (online suppl. table 1; for all online suppl. mate-rial, see wwww.karger.com/doi/10.1159/000339370) lists the DLQ items and their anchor points used in this report. The order of the items and which anchor point was at each end were varied ran-domly each day. The DLQ includes 4 positive visual analog scale (VAS) mood items adapted from the questionnaires developed by Woods [30] and Metcalf and Livesey [31] , and 4 negative VAS mood items from Allen et al. [32] . We added 9 health and daily activity items which included measures of daily physical health and perceived stress: 8 VAS items, and 1 yes/no item asking ‘did you have your menstrual period today?’ There was also a neutral VAS ‘control’ item about daylight hours, DLQ 22, with an objec-tively correct response, designed to assess the participants’ atten-tion to the randomly changing left and right hand anchors. In addition, once a week the participants completed 3 social support items, DLQ 19–21.
Once a day, at each woman’s preferred time, the HHC sounded an alarm and the DLQ appeared on the screen. The Treo 650 has a tablet screen-and-stylus interface and the participants scored
Mood and the Menstrual Cycle Psychother Psychosom 2013;82:53–60 55
their responses directly on the screen. After 60 min the Treo 650 turned off. This ensured that the questionnaires were completed within the same hour each day. Upon completion of each DLQ, the HHC encrypted the results as an email and wirelessly trans-mitted the results to the study’s central computer. The research staff checked the incoming data daily and contacted the partici-pants as soon as possible when problems with transmission arose.
There was a final debriefing interview at the end of the 24 weeks for equipment return. At this interview, the participants were asked what they thought the main purpose of the study had been.
Data Management and Statistical Analysis To ensure full MC sets of data for description, we interpolated
missing menstrual information from completed records for the preceding and succeeding days, using the participant’s usual cycle length where possible. If not possible due to missing data, the en-tire record was dropped; this occurred when there was less than 70% completion. The MC phase was determined using the ‘back-ward counting method’ which allows for individual differences in cycle length [33] . A change in the response to the DLQ menstrual period item, DLQ item 18, from ‘no’ to ‘yes’ designated day 1 of each MC. A ‘yes’ response signified menses or bleeding days in each cycle. Each cycle was then divided into 3 phases in two ways, to facilitate comparison with earlier work using each of these ap-proaches: (i) menses, mid-cycle and premenstrual: a premenstru-al phase of 5 days was constructed by counting back from day 1. The remaining days (neither menses nor premenstrual) were des-ignated as the midcycle phase; (ii) menses, follicular and luteal: each cycle was also split by categorizing the 14 days prior to day 1 as the luteal phase and all other nonmenses days as follicular days. This method relies on the knowledge that variations in cycle length are generally found in the follicular rather than the luteal phase which is usually 14 days [34] .
Additional Variables. A composite social support variable was calculated by averaging the amount of support received over the previous 7 days from 3 domains: work, home and female friends/relatives. For the longitudinal analyses, the weekly average social support was used.
Composite Positive and Negative Mood. All positive mood items (DLQ items 1, 3, 7, 10, 13 and 15) were averaged to create an overall positive mood variable; similarly, a summary negative mood variable was created using DLQ items 4, 5, 8 and 16. The DLQ performance was evaluated using Cronbach’s alpha statistic separately for positive and negative mood items.
Statistical Analyses The interview data were summarized for frequency by number
and percentage, or means with standard deviations (SD), as indi-cated by the data type. The 24-week longitudinal data were inves-tigated in two different ways: (i) using multivariate, longitudinal approaches, aggregating data from the whole sample and (ii) us-ing periodicity analyses for each participant separately.
Multivariate Approaches for MC Means. For each DLQ item, a repeated measures ANOVA was performed to compare mean val-ues for each MC phase, divided in two ways (menses-midcycle-premenstrual and menses-follicular-luteal) as mentioned above. For those DLQ items where repeated measures ANOVA showed a difference between means for the 3 phases, two post hoc t tests were run. Their significance level was Bonferroni-corrected to
p ! 0.025 (two tests per DLQ item, p ! 0.05 divided by 2 = p ! 0.025).
Multivariate Approaches for MC Phase Comparison, with Physical Health, Social Support and Perceived Stress as Predictors of Mood. These four independent variables were added to a mixed linear model for each DLQ mood item. This approach was chosen as it can handle an unstructured dataset (one with different num-bers of observations per participant, and with randomly missing data) [13] . Furthermore, it is robust when data are nonnormally distributed. The data set had repeated daily mood measures from 76 women for 395 complete MCs, giving autocorrelated measures across time. Models with competing covariance structures for the repeated measures were fitted and compared with the Akaike In-formation Criteria for good fit. The autoregressive moving aver-age (1, 1) covariance structure gave a better fit (i.e. resulted in a statistically significant smaller value of the Akaike Information Criteria criteria) among the autoregressive (1) and compound symmetry. The models were created in SAS 9.2 and SPSS 15 and 18.
Periodicity Analysis. Time series data can be characterized ei-ther in terms of amplitude or period, i.e. ‘how big’ versus ‘how often’; the latter is essential for understanding recurrent condi-tions such as premenstrual cyclical mood disorders which are de-fined by their characteristic periods. Cyclical data sets can be ap-proximated mathematically by their best-fitting sine waves. The most common method for calculating the best fitting sinusoids for a given time series is the Fourier transform method; however, this approach assumes regular sampling. When sampling is ir-regular, or if temporal gaps exist in the record (as is typically the case with human studies), the error term is increased [35] . The Lomb method is an alternative to Fourier transforms as it was de-veloped explicitly for irregularly sampled data [35–38] . The Lomb method can also calculate the statistical significance of ‘spectral peaks’, i.e. fixed-period components of a given time series which may dominate in the time series, compared to the null hypothesis that the peaks result from independent random Gaussian data [37] . Here, with women’s moods, Lomb analysis identifies which temporal cycles (weekly, monthly, menstrual, etc.) contribute most significantly to the cyclicity of mood.
A time series periodogram was created for each DLQ item for each participant (17 ! 78 = 1,326 individual time series). We used the Lomb method to quantify the relative contributions of cycles with period lengths varying in duration from 12 h to 3 months; parameters were set to 4 ! over-sampling with frequencies up to 1 ! the Nyquist frequency [37] . We then explored the proportion of significant cycles within our region of interest, periods between 24 and 32 days (i.e. 28 8 4 days) and compared these proportions to those of adjacent regions, counting the number of per-peak p values from the Lomb algorithm within each region, using a cut-off of p ̂ 0.05 for significance.
If menstrual mood cyclicity did exist, the periodograms would reveal a predominance of significant spectral peaks in the 24- to 32-day period region, greater than in adjacent regions with longer or shorter periods. This likelihood was tested statistically by com-paring peaks in 3 adjacent time regions: region 1 (32–43 days); region 2, the region of interest encompassing an MC period (24–32 days), and region 3 (18–24 days), using a Poisson regression model adjusted for correlation among observations taken on the same participant.

Romans et al. Psychother Psychosom 2013;82:53–60 56
Results
The Sample
The random digit dialing service recruited a total of 507 women. This sample came from calls to 9,974 house-holds of which 5,121 were answered (51.3%). The nonan-swer categories were: no response (45.6%), always busy number (31.1%) or answering machine (18.5%). Of the 5,121 answering households, 1,548 (30.2%) refused, giv-ing a response rate of 69.8% of answering households. Of the 3,573 households who proceeded with the call, on-ly 507 (14.2%) included a woman within our age spec-ifications. Households were ineligible either becausethere was no woman (134/3,066, 4.4%) or the womenin the household were outside the required age range (2,932/3,066, 95.6%). The final sample (n = 507) com-prised 9.9% of all answered calls.
All 507 women were invited to participate in the assessment interview; of these, 107 completed it and agreed to enter the prospective daily data collection. Twenty-nine dropped out during the 6-month data col-lection, failed to provide enough completed data days or became pregnant. From those recruited into the daily study, 78 women completed 70% of the eligible days. Two participants produced records which showed no MC activity and were dropped from the group analysis mixed models but kept for the periodogram analyses. The mean time series length was 182 8 18 days, with a reporting rate of 84 8 11%. There were 395 complete MCs available for analysis from these 76 women. The most common problem associated with nonreceipt of the DLQ data was the participants not taking their HHC on holiday with them.
The sociodemographic and health characteristics of the final sample are summarized in online supplemen-tary table 2. The mean age was 30.8, SD 7.7, range 18–43 years. The effort to obscure the MC focus was success-ful. Of the 100 women who were debriefed, only 5 used ‘menstrual cycle’ or ‘hormones’ or similar phraseology when describing the purpose of the study.
Mean Values for Each DLQ Mood Item
Menses-Midcycle-Premenstrual Phases Means and SD for the DLQ items for each of the 3 MC
phases (menses, 5-day premenstrual and midcycle) for the final sample are shown in online supplementary ta-ble 3. Eight of 14 mood items (57%) had some association
with the menstrual phase. For 5 of these 8 items (36% of the 14 total), the link was with both the menses and the premenstrual phase (statistically lower scores for posi-tive mood items and higher scores for negative mood items compared to the midcycle means); these were DLQ items 8, 11, 12, 14 and 16 (sadness, reduced sexual interest, current overall mood, getting on with people and irritability). For 2 items (14%) the link was with the menses phase only, DLQ items 1 and 3 (enjoyment, con-fidence). In addition, only 1 DLQ item, item 7 (happi-ness), showed a statistical association with the premen-strual phase. The p value given by the post hoc t test comparing menses happiness and midcycle happiness was 0.029, which just failed to reach significance be-cause of the Bonferroni adjustment. There was no men-strual phase association for 6 (43%) DLQ items, num-bers 4, 5, 9, 10, 13 and 15.
Approximately 20% of the women were taking a hor-monal oral contraceptive pill (OCP) at the beginning of the daily data collection period. We ran a mixed model to check the influence of OCP use on the 2 composite mood items each for positive and negative items; these were the only analyses for OCP undertaken. A significant effect between OCP use and negative composite mood emerged, but there was no effect for OCP use and positive mood.
These results show that mood changes are almost al-ways linked to the menses phase alone or the menses and premenstrual phases combined, not the premenstruum alone.
Menses-Follicular-Luteal Phases Means and SD for the DLQ items for each of the 3 MC
phases (menses-follicular-luteal) are shown in online supplementary table 4. Only 4 of the 14 mood items (29%) had some statistical association with an MC phase. For 3 items (DLQ items 12, 14 and 16) the link was with both the menses and luteal phase. The menses phase mean for DLQ 11 differed statistically from the follicular mean alone. No items showed a statistical difference between the luteal and follicular phases in the absence of a differ-ence between the menses and follicular phases. There was no menstrual phase association for DLQ items 1, 3–5, 7, 8–10, 13 and 15. These analyses showed that most mood items were not associated with an MC phase. In the mi-nority which did show an association, this was with both the menses and luteal phases.

Mood and the Menstrual Cycle Psychother Psychosom 2013;82:53–60 57
Performance of the Instruments
Cronbach’s alpha for positive mood items was 0.86 and for negative mood items 0.85, suggesting good internal consistencies.
Mixed Models Comparing the Influence of MC Phase on Mood Items with Physical Health, Stress and Social Support
The results for the mixed models, one for each mood DLQ item are summarized in table 1 . None of the positive DLQ mood items, including the composite positive fac-tor, was statistically linked to any MC phase, whereas they were all strongly associated to the independent vari-ables, DLQ items 2, 6 and 19–21 (physical health, stress and social support; significance level p ! 0.001 in all cas-
es). Only 2 negative mood items, 8 and 16 (sadness, irri-tability), showed an association over time with an MC phase. DLQ 8 was greater in the premenstrual phase than the comparison midcycle and menses phases, although this influence was less statistically significant than that between mood and stress, physical health or social sup-port, respectively. DLQ 16 was greater in both menses and premenstrual phases compared to the midcycle phase; again, the statistical association between the mood and MC phase was statistically less significant than as-sociations for stress, physical health and social support.
Periodograms
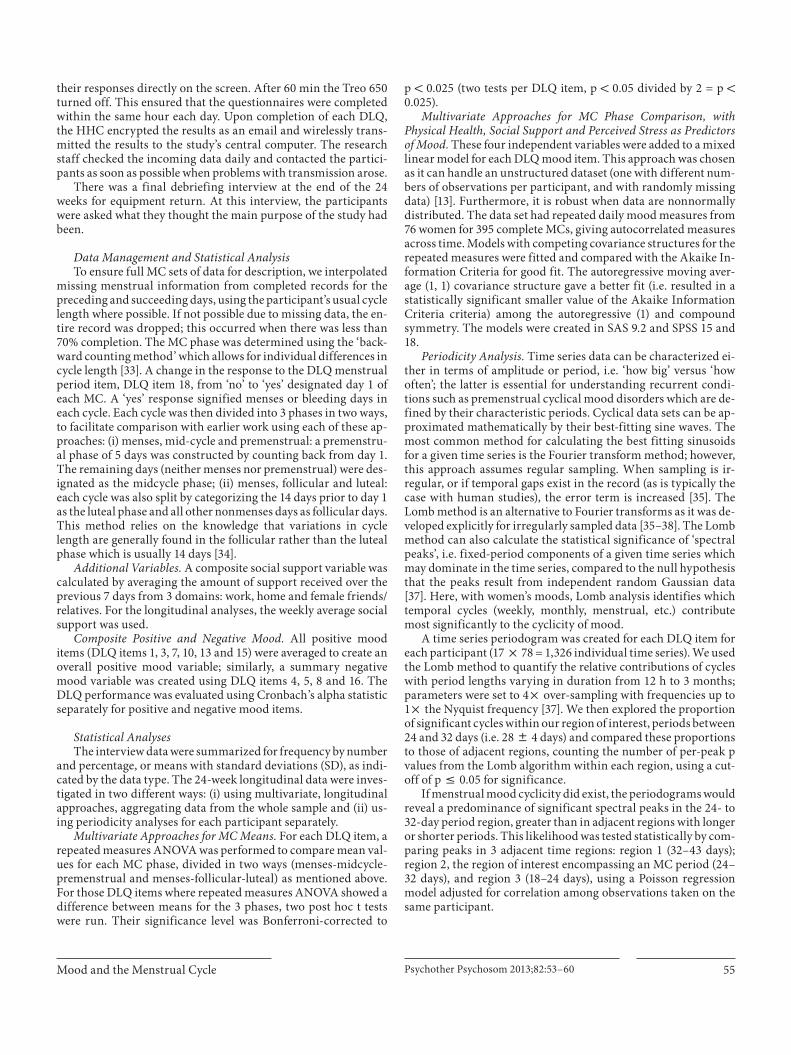
Figure 1 illustrates time series data from 1 participant for 3 DLQ items (1, 11 and 22), showing the power spectra over 3 months, calculated using the Lomb method and
Table 1. S ummary of mixed models (showing parameter estimates of effects), comparing MC phase to daily physical health, social support and perceived stress (76 women, 395 MCs)
Mood itemeffects
Intercept Stress Physical health
Socialsupport
Menses Premenstrualphase
Mid-cyclephase
Positive mood factor
estimate 42.9123 –0.2264 0.2885 0.09352 0.2671 0.08636 0p value <0.0001 <0.0001 <0.0001 <0.0001 0.3968 0.7876
Enjoyment estimate 48.0146 –0.3116 0.2998 0.1035 –0.05467 –0.3067 0p value <0.0001 <0.0001 <0.0001 <0.0001 0.8997 0.4909
Confidence estimate 49.3004 –0.2154 0.2191 0.08188 0.3232 0.14 0p value <0.0001 <0.0001 <0.0001 <0.0001 0.4066 0.7254
Happiness estimate 49.8834 –0.3229 0.2682 0.1082 –0.0134 –0.7438 0p value <0.0001 <0.0001 <0.0001 <0.0001 0.9757 0.0971
Motivation estimate 35.8599 –0.1225 0.2973 0.09717 0.4195 0.4218 0p value <0.0001 <0.0001 <0.0001 <0.0001 0.3791 0.3879
Feeling ontop of things
estimate 42.7503 –0.2369 0.2494 0.1222 0.5548 0.4777 0p value <0.0001 <0.0001 <0.0001 <0.0001 0.2035 0.2851
Energy estimate 30.9524 –0.1703 0.4163 0.06094 0.7083 0.6661 0p value <0.0001 <0.0001 <0.0001 0.0002 0.1353 0.1713
Negative mood factor
estimate 34.2912 0.363 –0.1477 –0.0887 0.6091 0.5946 0p value <0.0001 <0.0001 <0.0001 <0.0001 0.0460 0.0568
Coping estimate 28.9998 0.327 –0.1082 –0.0685 0.241 –0.1078 0p value <0.0001 <0.0001 <0.0001 <0.0001 0.5547 0.796
Anxiety estimate 31.4921 0.4629 –0.1297 –0.0582 0.002059 –0.3699 0p value <0.0001 <0.0001 <0.0001 0.0003 0.9964 0.4308
Sadness estimate 37.7146 0.3098 –0.18 –0.1244 0.787 1.2025 0p value <0.0001 <0.0001 <0.0001 <0.0001 0.1152 0.0186
Irritability estimate 38.7492 0.3652 –0.1712 –0.114 1.4828 1.7167 0p value <0.0001 <0.0001 <0.0001 <0.0001 0.0035 0.001
Positive mood factor is the average of enjoyment, confidence, happiness, motivation, feeling on top of things and energy, and neg-ative mood factor is the average of coping, anxiety, sadness and irritability.
Romans et al. Psychother Psychosom 2013;82:53–60 58
plotted using logarithmic scales on the x- and y-axes. Sta-tistically significant spectral peaks have been circled (p ! 0.05) and the region of interest, the portion of the spec-trum with all cycles with periods between 24 and 32 days in length, has been shaded. For this participant, there were few significant peaks in the region of interest rela-tive to the number of significant peaks elsewhere, dem-onstrating that cycles of period between 24 and 32 days do not play a predominant role in these time series.
Statistical analysis of these counts revealed that our region of interest had statistically fewer significant peaks than the next highest region and is not dominant (online supplementary table 5). Only 11% (144/1,326) of the peri-odograms had any significant peaks in region 2; only 5/1,326 (0.38%) had more significant peaks within region 2 than in the rest of the periodogram. These results pro-vided no evidence of entrainment of mood with the MC.
Conclusions
The first MiDL finding is that the premenstrual phase by itself had no influence on mood in a random commu-nity sample of adult Canadian women studied carefully over 6 months. With one marginally significant excep-tion, DLQ mood items either showed an association with menses phase (actual days of bleeding) or, less frequently, the premenstrual phase together with the menses phase. Very few of the participants’ periodograms showed any
evidence of cyclicity with the 24–32 day periodicity that would implicate the MC. These results provide further evidence for the contention by Woods et al. [24, 39] and Angst et al. [40] of a perimenstrual rather than a premen-strual only mood exacerbation; they also challenge the ongoing usage of the term ‘premenstrual syndrome’. These results as a whole do not support commonly held beliefs about mood and the premenstruum. The second finding is that a MC phase is less important as a predictor of daily mood than physical health, perceived stress or social support. This suggests that a nuanced approach to the causes of a woman’s mood variability should consider the quality of her social relationships and her physical health before considering her reproductive function. This biopsychosocial frame is a familiar concept to read-ers of this journal [41] .
The methodology used deserves comment. Pencil-and-paper health records ostensibly completed prospec-tively, the preferred collection method until recently, may be completed at the last minute before meeting the re-searchers, and so may be partially retrospective [42] . In contrast, using ‘smart phones’ for mental health teleme-try ensured that our participants were providing real-time mood data. The number of cycles studied here (4–6) is rare in this kind of study. The reporting rate, 84% of daily reports over 6 months, is less than 100%, and so jus-tifies the use of the Lomb method; however, this rate is as good as the reporting rates cited for other electronic di-ary symptom-monitoring studies of only half this study’s
10 days
Log d
Log
P(d)
1 day
EnjoyMoodDaylight
100 days
10–2
102
32 days 24 days
Fig. 1. Time series data from 1 participant for 3 DLQ items (1, 11 and 22), showing the power spectra over 3 months, calculated using the Lomb method and plotted using logarithmic scales on the x- and y-ax-es. Statistically significant spectral peaks have been circled (p ! 0.05) and the region of interest, the portion of the spectrum with all cycles with periods between 24 and 32 days in length, has been shaded.d = Period length; P(d) = power.

Mood and the Menstrual Cycle Psychother Psychosom 2013;82:53–60 59
duration [43] . The MiDL study also attended to other rec-ommended design features for MC research, keeping the menstrual focus obscured and collecting information in all phases of the cycle on a range of positive and negative mood items.
Only three MC mood studies with daily ratings have used a random community sampling [44–46] , studying 3, 2–3 and 2 cycles only, respectively. Only one obscured the MC focus [46] . None used a mixed linear modeling or in-dividual periodogram analysis as we have done; these sta-tistical approaches maximize information available in time series data and deal with the correlated nature of re-peated measures. We had considerable attrition, raising concerns about the truly random nature of the sample. Our sampling frame is preferable to recruitment by adver-tisement or use of a clinic sample, with their serious un-known selection biases. The final result is similar to com-pletion rates with random digit dialing studies in general; it reflects the challenge to participants of committing to such a long data collection phase. We reduced participant burden with a short HHC questionnaire and choice of time of data recording. A significant commitment to the research project was necessary for each participant to complete the MiDL record. It is not practical to calculate the power of studies with time series data. Repeated sam-pling of health variables in the field, sometimes several times a day and with the participant continuing their reg-ular life, is becoming known as ecological momentary analysis. The performance of the DLQ was not tested against a gold standard for MC mood research; none re-ally stands out as a candidate. However, Cronbach’s alpha split test suggested reasonable internal consistency.
Daily fluctuations in mood should not be extrapolated to mood disorders. The results raise the question of why a notion of a specific premenstrual dysphoria for the gen-eral female population persists so strongly. There still seems to be a tendency to explain female characteristics by reference to reproductive function, ignoring other bio-logical and sociocultural alternative explanations. These results show that some key explanations for mood vari-ability are physical health, perceived stress and/or social support. The MC is a prime target for misattributions. As with Carnivalesque in Bakhtin [47] , the Feast of Fools, the Bacchanalia, and other ‘World Turned Upside Down’ rituals, in which a reversal or inversion of the social norms is permitted and even encouraged, the social sanc-tioning of premenstrual anger and irritability reverses the strong cultural prescription for women being pleas-ant and calm. Like Carnival behaviors, the social con-struction of premenstrual syndrome can be viewed as contesting yet paradoxically reinforcing social con-straints on a woman’s behavior for the rest of the time. The MiDL has shown the greater statistical power of these alternative considerations.
Acknowledgements
The MiDL research team acknowledges funding from theCanadian Institutes of Health Research (grant reference MOP 74678), biostatistical advice from Dr. Alex Kiss, University of To-ronto and Dr. James Stanley, University of Otago, Wellington, and the women participants who gave generously of their time and energy.
References
1 Yonkers KA, O’Brien PM, Eriksson E: Pre-menstrual syndrome. Lancet 2008; 371: 1200–1210.
2 Gonda X, Telek T, Juhasz G, Lazary J, Vargha A, Bagdy G: Patterns of mood changes throughout the reproductive cycle in healthy women without premenstrual dysphoric dis-orders. Prog Neuropsychopharmacol Biol Psychiatry 2008; 32: 1782–1788.
3 American Psychiatric Association: Diagnos-tic and statistical manual – text revision (DSM-IV-TR), ed 4. Washington, American Psychiatric Association, 2000.
4 Dalton K: The influence of menstruation on health and disease. Proc R Soc Med 1964; 57: 262–264.
5 Johnson TM: Premenstrual syndrome as a western culture-specific disorder. Cult Med Psychiatry 1987; 11: 337–356.
6 Rodin M: The social construction of pre-menstrual syndrome. Soc Sci Med 1992; 35: 49–56.
7 Ussher JM: Research and theory related to female reproduction: implications for clini-cal psychology. Br J Clin Psychol 1992; 31: 129–151.
8 Walker A: Theory and methodology in pre-menstrual syndrome research. Soc Sci Med 1995; 41: 793–800.
9 Stolberg M: The monthly malady: a history of premenstrual suffering. Med Hist 2000; 44: 301–322.
10 Bancroft J: The menstrual cycle and the well-being of women. Soc Sci Med 1995; 41: 785–791.
11 McFarlane JM, Williams TM: Placing pre-menstrual syndrome in perspective. Psychol Women Q 1994; 18: 339–373.
12 Marvan ML, Escobedo C: Premenstrual symptomatology: role of prior knowledge about premenstrual syndrome. Psychosom Med 1999; 61: 163–167.
13 Singer JD, Willett JB: Applied Longitudinal Analysis: Modeling Change and Event Oc-currence. Oxford, Oxford University Press, 2003.
14 McEwen BS: From molecules to mind. Stress, individual differences, and the social envi-ronment. Ann NY Acad Sci 2001; 935: 42–49.

Romans et al. Psychother Psychosom 2013;82:53–60 60
15 Kawachi I, Berkman LF: Social ties and men-tal health. J Urban Health 2001; 78: 458–467.
16 House JS: Understanding social factors and inequalities in health: 20th century progress and 21st century prospects. J Health Soc Be-hav 2002; 43: 125–142.
17 Kendler KS, Gardner CO, Prescott CA: To-ward a comprehensive developmental model for major depression in women. Am J Psy-chiatry 2002; 159: 1133–1145.
18 McEwen BS: Mood disorders and allostatic load. Biol Psychiatry 2003; 54: 200–207.
19 Kopp MS, Stauder A, Purebl G, Janszky I,Skrabski A: Work stress and mental healthin a changing society. Eur J Public Health 2008; 18: 238–244.
20 Pressman SD, Cohen S: Does positive affect influence health? Psychol Bull 2005; 131: 925–971.
21 Anson O: Exploring the bio-psycho-social approach to premenstrual experiences. Soc Sci Med 1999; 49: 67–80.
22 Sigmon ST, Dorhofer DM, Rohan KJ, Bou-lard NE: The impact of anxiety sensitivity, bodily expectations, and cultural beliefs on menstrual symptom reporting: a test of the menstrual reactivity hypothesis. J Anxiety Disord 2000; 14: 615–633.
23 Koff E, Rierdan J: Premenarcheal expecta-tions and postmenarcheal experiences of positive and negative menstrual-related changes. J Adolesc Health 1996; 18: 286–291.
24 Woods NF, Mitchell ES, Lentz MJ: Social pathways to premenstrual symptoms. Res Nurs Health 1995; 18: 225–237.
25 Kreindler D, Levitt A, Woolridge N, Lums-den CJ: Portable mood mapping: the validity and reliability of analog scale displays for mood assessment via hand-held computer. Psychiatry Res 2003; 120: 165–177.
26 Sheehan DV, Lecrubier Y, Sheehan KH, Amorim P, Janavs J, Weiller E, Hergueta T, Baker R, Dunbar GC: The Mini-Internation-al Neuropsychiatric Interview (MINI): the development and validation of a structured diagnostic psychiatric interview for DSM-IV and ICD-10. J Clin Psychiatry 1998; 59(suppl 20):22–33, quiz 34–57.
27 Parkinson B, Briner RB, Reynolds S, Totter-dell P: Time frames for mood: relations be-tween momentary and generalized ratings of affect. Pers Soc Psychol Rev 1995; 21: 331–339.
28 Stone AA, Shiffman S, Schwartz JE, Bro-derick JE, Hufford MR: Patient compliance with paper and electronic diaries. Control Clin Trials 2003; 24: 182–199.
29 Piasecki TM, Hufford MR, Solhan M, Trull TJ: Assessing clients in their natural envi-ronments with electronic diaries: rationale, benefits, limitations, and barriers. Psychol Assess 2007; 19: 25–43.
30 Woods NF: Premenstrual symptoms: anoth-er look. Public Health Rep 1987; 102(suppl 4):106–112.
31 Metcalf MG, Livesey JH: Distribution of pos-itive moods in women with the premenstru-al syndrome and in normal women. J Psy-chosom Res 1995; 39: 609–618.
32 Allen SS, McBride CM, Pirie PL: The short-ened premenstrual assessment form. J Re-prod Med 1991; 36: 769–772.
33 Society for Menstrual Cycle Research: Task force report on guidelines for menstrual cy-cle research. Newsletter Soc Menstrual Cycle Res 1986; 2: 1–2.
34 Waller K, Swan SH, Windham GC, Fenster L, Elkin EP, Lasley BL: Use of urine biomark-ers to evaluate menstrual function in healthy premenopausal women. Am J Epidemiol 1998; 147: 1071–1080.
35 Kreindler D, Lumsden C: The effects of ir-regular sampling and missing data in time series analysis. Nonlinear Dynamics Psychol Life Sci 2006; 10: 187–214.
36 Lomb N: Least-squares analysis of unequally spaced data. Astrophys Space Sci 1976; 39: 4474–4462.
37 Press WH, Teukolsky SA, Vetterling WT, Flannery BP: Numerical Recipes in C: The Art of Scientific Computing, ed 2. New York, Cambridge University Press, 1993.
38 Van Dongen H, Olofsen E, Van Hartevelt J, Kruy E (eds): Periodogram Analysis of Un-equally Spaced Data: The Lomb Method. Leiden, Leiden University, 1997.
39 Woods NF, Most A, Dery GK: Prevalenceof perimenstrual symptoms. Am J Public Health 1982; 72: 1257–1264.
40 Angst J, Sellaro R, Merikangas KR, Endicott J: The epidemiology of perimenstrual psy-chological symptoms. Acta Psychiatr Scand 2001; 104: 110–116.
41 Fava GA, Ruini C, Tomba E, Wise TN: The biopsychosocial factor. Psychother Psycho-som 2012; 81: 1–4.
42 Bolger N, Davis A, Rafaeli E: Diary methods: capturing life as it is lived. Annu Rev Psychol 2003; 54: 579–616.
43 Burton C, Weller D, Sharpe M: Are electron-ic diaries useful for symptoms research? A systematic review. J Psychosom Res 2007; 62: 553–561.
44 Woods NF, Most A, Dery GK: Toward a con-struct of perimenstrual distress. Res Nurs Health 1982; 5: 123–136.
45 Sveinsdottir H: Prospective assessment of menstrual and premenstrual experiences of Icelandic women. Health Care Women Int 1998; 19: 71–82.
46 Meaden PM, Hartlage SA, Cook-Karr J: Tim-ing and severity of symptoms associated with the menstrual cycle in a community-based sample in the Midwestern United States. Psychiatry Res 2005; 134: 27–36.
47 Bakhtin M: Rabelais and his world. Bloom-ington, Indiana University Press, 1941.