moody's market implied ratings - efinance.org.cnefinance.org.cn/cn/feshuo/moody's market...
TRANSCRIPT
Moody's Market Implied RatingsDescription, Methodology, andAnalytical ApplicationsMarket Implied Ratings provides credit risk and relative value signals from five sources; Moody's
ratings, the corporate bond, credit default swap (CDS) and equity markets, and company financial
ratios. This guide provides users with information on Market Implied Ratings and related
research, and explains how risk managers, analysts, and investors can use MIR to improve the
quality and efficiency of their decision-making processes.
Contents
I. Introduction p.3
II. Overview and Background p.4
III. The Implied Ratings Datasets and Models p.9
a. Bond-Implied Ratings p.10
b. CDS-Implied Ratings p.15
c. Equity-Implied Ratings p.16
d. Moody's Default Predictor-Implied Ratings p.20
IV. Applied Research p.21
V. Appendix I: Currency Swap Calculation p.29
VI. Appendix II: Deriving Senior Unsecured Ratings p.30
VII. Appendix III: Calculation of Median Credit Spreads and Curve Construction p.33
VIII. References p.36
IX. Frequently Asked Questions Inside Back Cover
www.moodys.com December 2007
Credit Strategy Group
David W. Munves, CFA
tel: 1 212 553-2844
David T. Hamilton, Ph.D.
tel: 1 212 553-1695
Credit Policy Group
Christopher Mann, PhD
tel: 1 212 553-7102
Matthew Woolley
tel: 1 212 553-4508
Moody’s KMV
Doug Dwyer
tel: 1 212 822-2821
John Gibbon
tel: 1 415 874-6641
Shisheng Qu
tel: 1 415 874-6243
Research Support
Eugenia Fingerman
tel: 1 212 553-4181
Product Strategy
Jonathan King
tel: 1 212 553-1623
0%
5%
10%
15%
20%
25%
30%
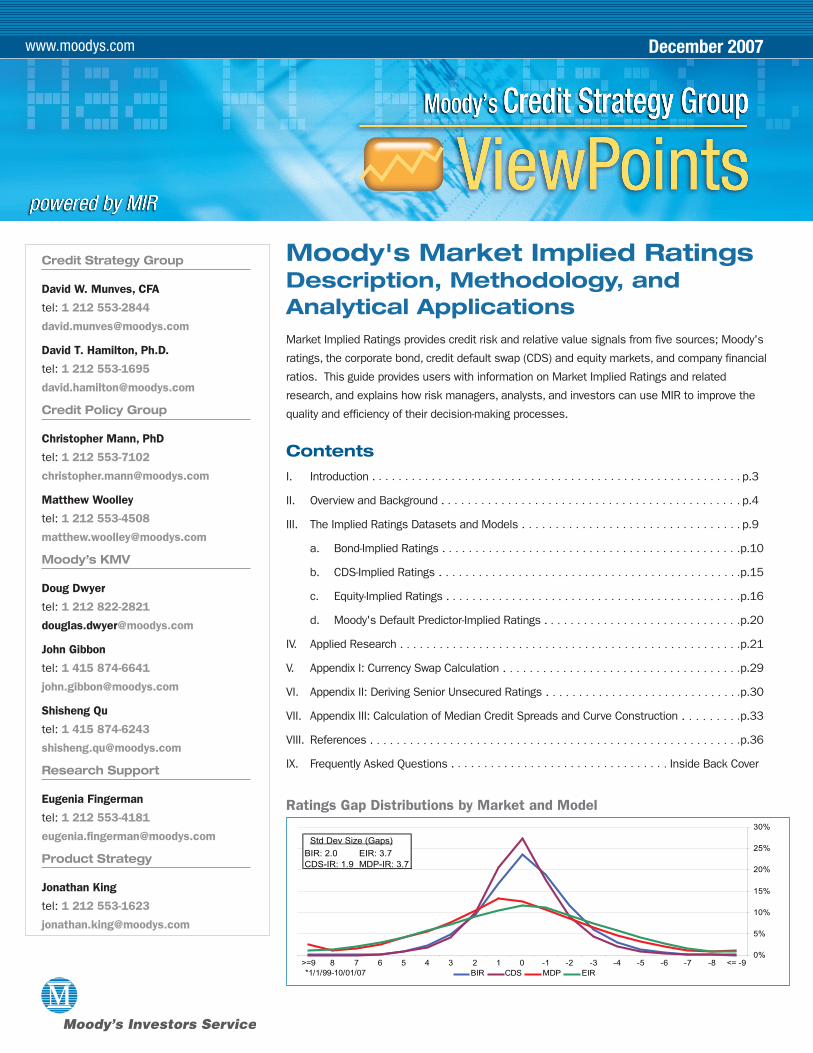
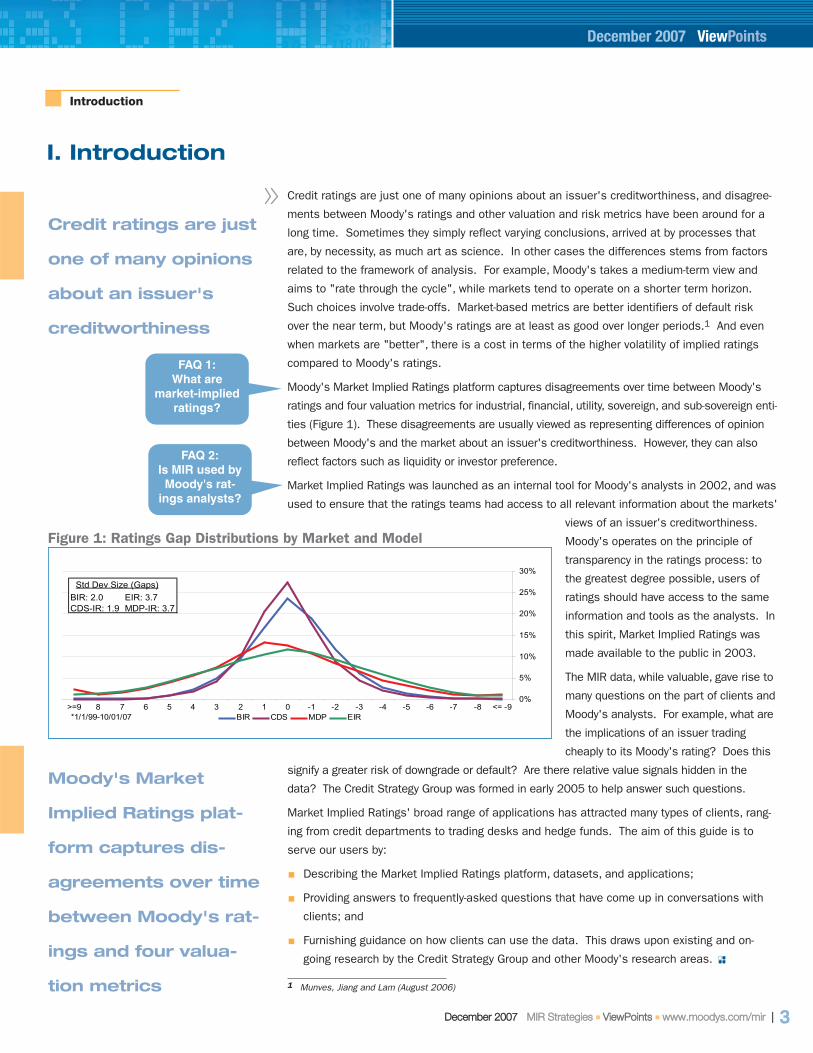
<= -9-8-7-6-5-4-3-2-1012345678>=9BIR CDS MDP EIR*1/1/99-10/01/07
Std Dev Size (Gaps)BIR: 2.0 EIR: 3.7CDS-IR: 1.9 MDP-IR: 3.7
Ratings Gap Distributions by Market and Model

December 2007 ViewPoints
2 || DDeecceemmbbeerr 22000077 MMIIRR SSttrraatteeggiieess ■■ VViieewwPPooiinnttss ■■ wwwwww..mmooooddyyss..ccoomm//mmiirr
Note from the Editor:
This guide to Market Implied Ratings and their applications was a collaborative effort among several Moody's groups,namely Credit Strategy, Credit Policy, and Moody's KMV. Together we aimed to produce a document that is readable forgeneral user, while providing a greater level of detail for those seeking a deeper understanding of MIR. As part of this, theguide also addresses the most frequently asked questions that have come up in our discussions with external and internalusers of the product.
The authors would like to acknowledge the helpful comments from many colleagues, including Richard Cantor, JonathanKing, Michael Love, Robert Eckerstrom, Njundu Sanneh, Dana Gordon, and Anne Tracy.
We hope you will find the guide useful and informative. Please do not hesitate to contact us with any questions, com-ments, and suggestions for improvement.
David W. Munves, CFAManaging Director
Credit Strategy Group
Credit ratings are just one of many opinions about an issuer's creditworthiness, and disagree-
ments between Moody's ratings and other valuation and risk metrics have been around for a
long time. Sometimes they simply reflect varying conclusions, arrived at by processes that
are, by necessity, as much art as science. In other cases the differences stems from factors
related to the framework of analysis. For example, Moody's takes a medium-term view and
aims to "rate through the cycle", while markets tend to operate on a shorter term horizon.
Such choices involve trade-offs. Market-based metrics are better identifiers of default risk
over the near term, but Moody's ratings are at least as good over longer periods.1 And even
when markets are "better", there is a cost in terms of the higher volatility of implied ratings
compared to Moody's ratings.
Moody's Market Implied Ratings platform captures disagreements over time between Moody's
ratings and four valuation metrics for industrial, financial, utility, sovereign, and sub-sovereign enti-
ties (Figure 1). These disagreements are usually viewed as representing differences of opinion
between Moody's and the market about an issuer's creditworthiness. However, they can also
reflect factors such as liquidity or investor preference.
Market Implied Ratings was launched as an internal tool for Moody's analysts in 2002, and was
used to ensure that the ratings teams had access to all relevant information about the markets'
views of an issuer's creditworthiness.
Moody's operates on the principle of
transparency in the ratings process: to
the greatest degree possible, users of
ratings should have access to the same
information and tools as the analysts. In
this spirit, Market Implied Ratings was
made available to the public in 2003.
The MIR data, while valuable, gave rise to
many questions on the part of clients and
Moody's analysts. For example, what are
the implications of an issuer trading
cheaply to its Moody's rating? Does this
signify a greater risk of downgrade or default? Are there relative value signals hidden in the
data? The Credit Strategy Group was formed in early 2005 to help answer such questions.
Market Implied Ratings' broad range of applications has attracted many types of clients, rang-
ing from credit departments to trading desks and hedge funds. The aim of this guide is to
serve our users by:
Describing the Market Implied Ratings platform, datasets, and applications;
Providing answers to frequently-asked questions that have come up in conversations with
clients; and
Furnishing guidance on how clients can use the data. This draws upon existing and on-
going research by the Credit Strategy Group and other Moody's research areas.
I. Introduction
Introduction
December 2007 ViewPoints
DDeecceemmbbeerr 22000077 MMIIRR SSttrraatteeggiieess ■■ VViieewwPPooiinnttss ■■ wwwwww..mmooooddyyss..ccoomm//mmiirr || 3
Credit ratings are just
one of many opinions
about an issuer's
creditworthiness
1 Munves, Jiang and Lam (August 2006)
Moody's Market
Implied Ratings plat-
form captures dis-
agreements over time
between Moody's rat-
ings and four valua-
tion metrics
0%
5%
10%
15%
20%
25%
30%
<= -9-8-7-6-5-4-3-2-1012345678>=9BIR CDS MDP EIR*1/1/99-10/01/07
Std Dev Size (Gaps)BIR: 2.0 EIR: 3.7CDS-IR: 1.9 MDP-IR: 3.7
Figure 1: Ratings Gap Distributions by Market and Model
FAQ 1:What are
market-impliedratings?
FAQ 2:Is MIR used byMoody's rat-
ings analysts?
4 || DDeecceemmbbeerr 22000077 MMIIRR SSttrraatteeggiieess ■■ VViieewwPPooiinnttss ■■ wwwwww..mmooooddyyss..ccoomm//mmiirr
Market Implied Ratings is a straightforward product. For over 3,000 entities it collects sig-
nals from five different sources (Moody's ratings, the bond, credit default swap, and equity
markets, and an accounting ratio-based model) and displays them on the Moody's rating
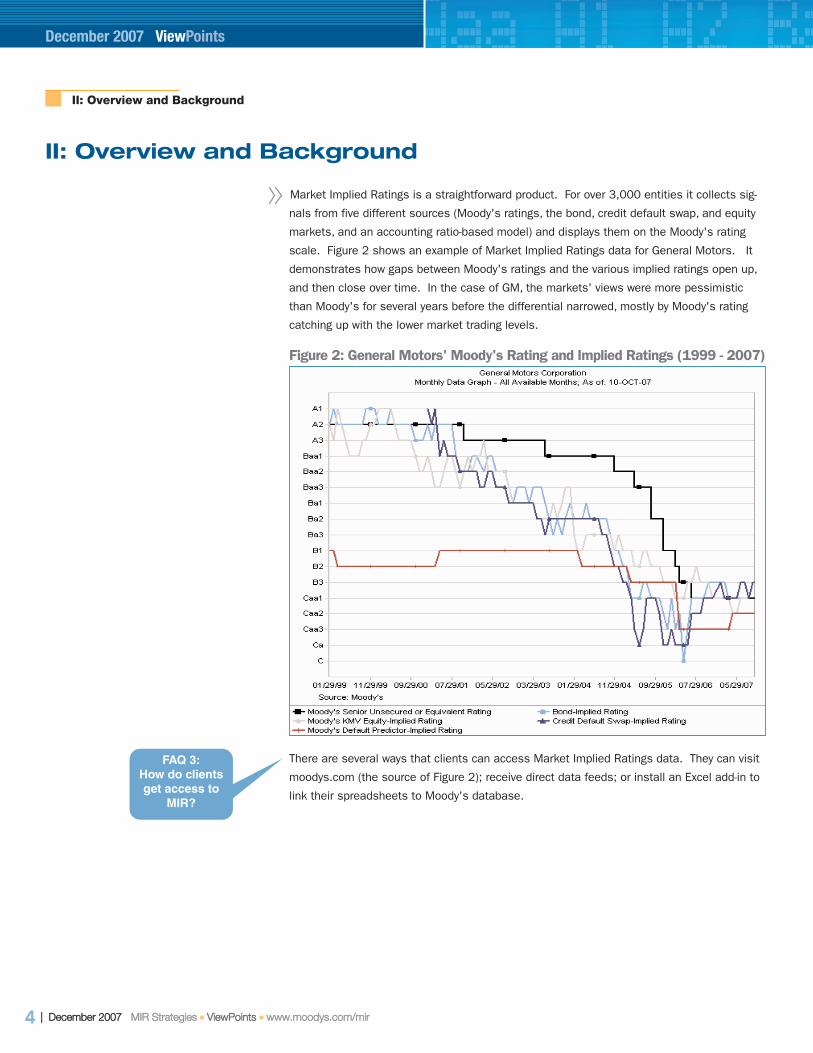
scale. Figure 2 shows an example of Market Implied Ratings data for General Motors. It
demonstrates how gaps between Moody's ratings and the various implied ratings open up,
and then close over time. In the case of GM, the markets' views were more pessimistic
than Moody's for several years before the differential narrowed, mostly by Moody's rating
catching up with the lower market trading levels.
There are several ways that clients can access Market Implied Ratings data. They can visit
moodys.com (the source of Figure 2); receive direct data feeds; or install an Excel add-in to
link their spreadsheets to Moody's database.
II: Overview and Background
II: Overview and Background
December 2007 ViewPoints
Figure 2: General Motors' Moody's Rating and Implied Ratings (1999 - 2007)
FAQ 3:How do clientsget access to
MIR?
A key aspect of the
platform is that the
four non-Moody's
metrics are
displayed relative
to the issuer's
senior unsecured
Moody's rating
DDeecceemmbbeerr 22000077 MMIIRR SSttrraatteeggiieess ■■ VViieewwPPooiinnttss ■■ wwwwww..mmooooddyyss..ccoomm//mmiirr || 5
The comparative analysis at the heart of MIR
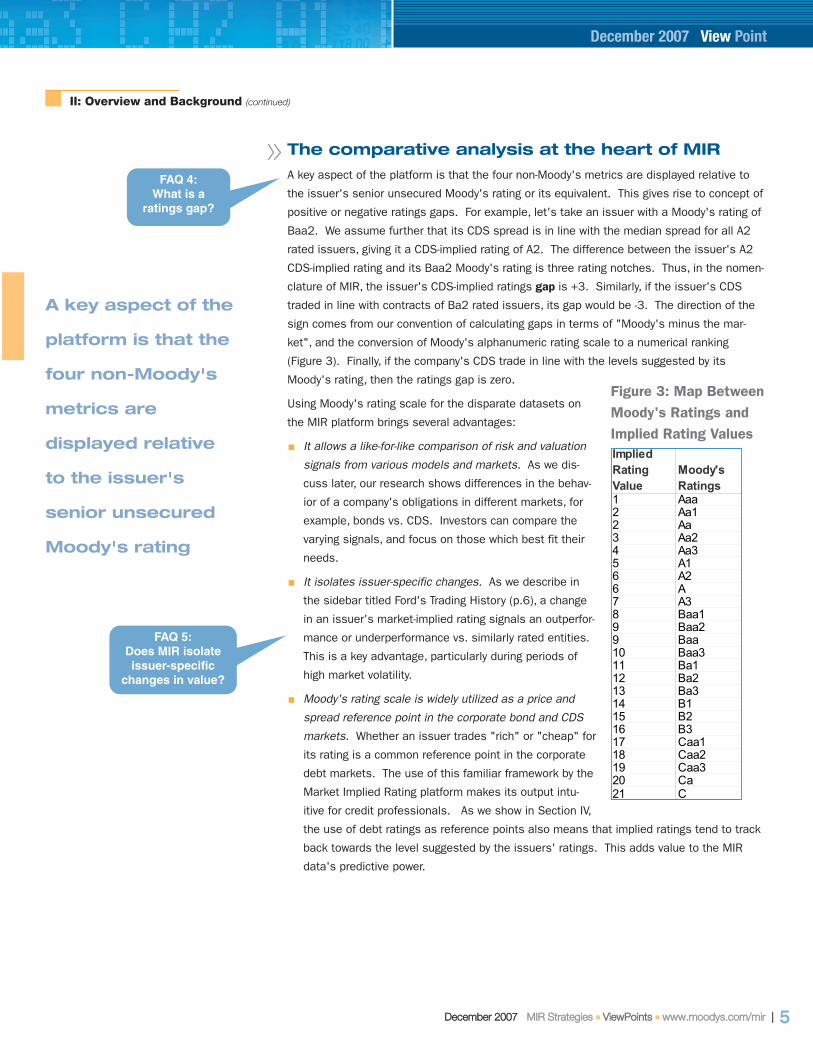
A key aspect of the platform is that the four non-Moody's metrics are displayed relative to
the issuer's senior unsecured Moody's rating or its equivalent. This gives rise to concept of
positive or negative ratings gaps. For example, let's take an issuer with a Moody's rating of
Baa2. We assume further that its CDS spread is in line with the median spread for all A2
rated issuers, giving it a CDS-implied rating of A2. The difference between the issuer's A2
CDS-implied rating and its Baa2 Moody's rating is three rating notches. Thus, in the nomen-
clature of MIR, the issuer's CDS-implied ratings gap is +3. Similarly, if the issuer's CDS
traded in line with contracts of Ba2 rated issuers, its gap would be -3. The direction of the
sign comes from our convention of calculating gaps in terms of "Moody's minus the mar-
ket", and the conversion of Moody's alphanumeric rating scale to a numerical ranking
(Figure 3). Finally, if the company's CDS trade in line with the levels suggested by its
Moody's rating, then the ratings gap is zero.
Using Moody's rating scale for the disparate datasets on
the MIR platform brings several advantages:
It allows a like-for-like comparison of risk and valuation
signals from various models and markets. As we dis-
cuss later, our research shows differences in the behav-
ior of a company's obligations in different markets, for
example, bonds vs. CDS. Investors can compare the
varying signals, and focus on those which best fit their
needs.
It isolates issuer-specific changes. As we describe in
the sidebar titled Ford's Trading History (p.6), a change
in an issuer's market-implied rating signals an outperfor-
mance or underperformance vs. similarly rated entities.
This is a key advantage, particularly during periods of
high market volatility.
Moody's rating scale is widely utilized as a price and
spread reference point in the corporate bond and CDS
markets. Whether an issuer trades "rich" or "cheap" for
its rating is a common reference point in the corporate
debt markets. The use of this familiar framework by the
Market Implied Rating platform makes its output intu-
itive for credit professionals. As we show in Section IV,
the use of debt ratings as reference points also means that implied ratings tend to track
back towards the level suggested by the issuers' ratings. This adds value to the MIR
data's predictive power.
II: Overview and Background (continued)
December 2007 View Point
Implied Rating Value
Moody's Ratings
1 Aaa2 Aa12 Aa3 Aa24 Aa35 A16 A26 A7 A38 Baa19 Baa29 Baa10 Baa311 Ba112 Ba213 Ba314 B115 B216 B317 Caa118 Caa219 Caa320 Ca21 C
Figure 3: Map BetweenMoody's Ratings andImplied Rating Values
FAQ 4:What is a
ratings gap?
FAQ 5:Does MIR isolateissuer-specific
changes in value?

6 || DDeecceemmbbeerr 22000077 MMIIRR SSttrraatteeggiieess ■■ VViieewwPPooiinnttss ■■ wwwwww..mmooooddyyss..ccoomm//mmiirr
Providing a global comparison
Market Implied Ratings is a global product. It encompasses entities from 122 different
countries, and the distribution of implied ratings is broadly in line with the relative size of
the world's capital markets (Figure 4). An entity's inclusion in the platform is essentially
determined by two factors; it needs to have a Moody's rating, and it must have publicly trad-
ed bonds, shares, or CDS with reliable prices.2
Clients often ask us why we don't provide regional versions of Market Implied Ratings - for
example, one that compares Australian issuers only to other Australian issuers, or that
encompasses only euro-denominated debt. This comes up most often for the bond-implied
ratings dataset. There are two reasons for calculating implied ratings only on a global scale.
II: Overview and Background (continued)
An entity's inclusion
in the platform is
essentially
determined by two
factors
December 2007 View Point
2 To be included in the Moody's Default Predictor (MDP) implied ratings dataset, an issuer must have a Moody's rat-ing and regularly published financial statements. Also, only industrial and utility entities get MDP-implied ratings.
Bond-Implied Equity-Implied CDS-Implied MDP-ImpliedNumber of Issuers 2,900 1,800 2,000 1,600Investment Grade 66% 79% 75% 51%Speculative Grade 34% 21% 25% 49%
Americas 68% 66% 55% 72%Asia 5% 5% 9% 4%EMEA 22% 18% 27% 15%Japan 5% 10% 9% 9%Data from 1/1/1999 1/1/1999 1/1/2001 1/1/1999
Geographic Breakdown
Figure 4: Market Implied Ratings Coverage
Ford's Trading History:
Market Implied Ratings and Relative Performance
The Market Implied Rating platform calcu-
lates median credits for the CDS and
bond datasets on a daily basis. For
example, all eligible Baa2-rated bonds are
used to calculate the Baa2 bond spread
curve, all Baa3-rated issues are used to
calculate Baa3 curve, and so on. For an
issuer's implied rating to change, its
spread must outperform or underperform
the movements of its peer group with the
same implied rating.
Figure A clearly illustrates this dynamic
using a Ford bond as an example. The
colored areas outline the value range of the spreads to which implied ratings are assigned. From August 2004 to March 2005, the
bond-implied rating for the Ford issue fell three notches from Ba2 to B2. This represents an underperformance compared to the broad
market. In other words, Ford's bond spread had widened relative to the broad market during the period.
Figure A: Re lations hip Be tw een Ford Bond Spread and Its Bond-Im plied Rating
120
170
220
270
320
370
420
470
520
570
620
Jun-04
Jul-04
Aug -04
Sep -04
Oct-04
Oct-04
Nov-04
Dec-04
Jan-05
Jan-05
Feb-05
Mar-05
Apr-05
May-05
Jun-05Jul-0
5Jul-0
5
Aug -05
Sep -05
Sep -05
Oct-05
Nov-05
Bon
d S
prea
d (b
Caa2
Caa1
B3B2
B1
Ba3
Ba2= Ba1
FORD
FAQ 6:Is MIR a global
product?
FAQ 7:Why don't wehave regional
versions of MIR?
Bo
nd
Sp
read
(b
p)
DDeecceemmbbeerr 22000077 MMIIRR SSttrraatteeggiieess ■■ VViieewwPPooiinnttss ■■ wwwwww..mmooooddyyss..ccoomm//mmiirr || 7
The first is that we take bond issues domiciled in seven different currencies and translate the
non-US dollar ones to a dollar basis using a standard currency swap calculation. Please see
Appendix I for details. Thus, all credit spreads are on a dollar basis (option-adjusted spread
over the Treasury curve, to be precise). All issues are therefore treated the same, obviating
the need to compare issues in one currency to credit curves in that currency. Users wishing
to see relative rankings of implied ratings from issuers in one country can easily obtain the
data via the Ratings Interactive tool on moodys.com.
The second reason is that we need a lot of data to produce robust common benchmarks for
each of the four datasets. Specifically, we calculate benchmark implied ratings for each of
the 21 Moody's rating categories shown in Figure 3. And for the bond dataset, for each rat-
ing category we must calculate full credit term structures of 1 to 12 years in duration. If we
split the data sets into different subgroups, we would have insufficient data to estimate accu-
rate median spread reference points. The same considerations prevent us from building sep-
arate curves and calculating implied ratings for industries or sub-sectors.
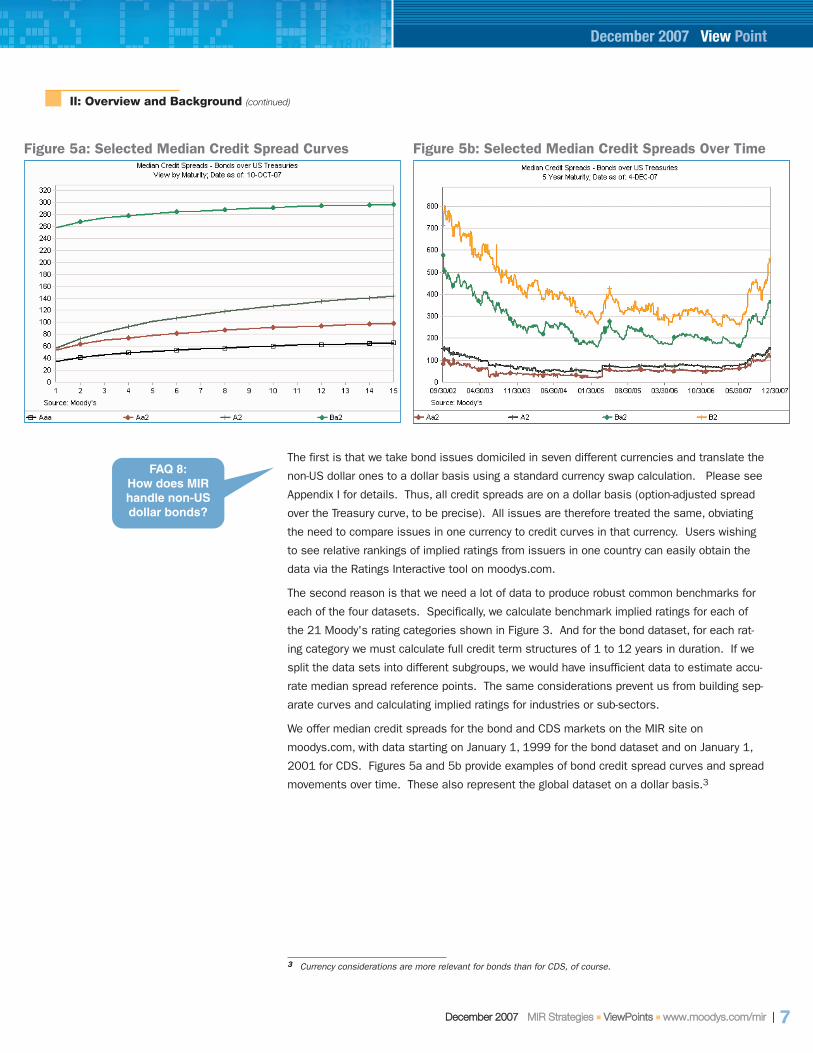
We offer median credit spreads for the bond and CDS markets on the MIR site on
moodys.com, with data starting on January 1, 1999 for the bond dataset and on January 1,
2001 for CDS. Figures 5a and 5b provide examples of bond credit spread curves and spread
movements over time. These also represent the global dataset on a dollar basis.3
II: Overview and Background (continued)
December 2007 View Point
3 Currency considerations are more relevant for bonds than for CDS, of course.
Figure 5a: Selected Median Credit Spread Curves Figure 5b: Selected Median Credit Spreads Over Time
FAQ 8:How does MIRhandle non-USdollar bonds?

8 || DDeecceemmbbeerr 22000077 MMIIRR SSttrraatteeggiieess ■■ VViieewwPPooiinnttss ■■ wwwwww..mmooooddyyss..ccoomm//mmiirr
What you see is generally what you get
The explicit assumption underlying Market Implied Ratings is that the market prices of securi-
ties have high information content. Thus, beyond quality assurance routines and the limited
exceptions described below, there is no data scrubbing.4 For example, we do not remove
bonds or CDS that we deem to be "outliers", or smooth time series that appear to be "too
noisy". These are hard judgments to make systematically, and different users have different
ideas of what constitutes an "outlier" or "noise". Standards can change, too, depending on
levels of market volatility and credit risk.
Moreover, we do not manipulate the data to achieve an idealized result. This is despite
the very well-ordered structure of many of our research results - for example, see Figure 18
on p.24.
We have found that the product's straightforwardness, particularly for bond- and CDS-implied
ratings, is a big plus for users. They don't have to understand and agree or disagree with a
lot of assumptions and calculations. The methodologies for equity- and MDP-implied ratings
are, by necessity, more complicated. For equity-implied ratings we are extracting a credit risk
signal from equity market data, combined with information on entities' liabilities and the
volatility of their assets. And for MDP-implied ratings we derive default risk signals from a
range of company financial ratios.
II: Overview and Background (continued)
December 2007 View Point
The explicit
assumption
underlying Market
Implied Ratings is that
the market prices of
securities have high
information content
4 While we avoid filtering market data, the inputs to our models are carefully checked.
FAQ 9:How much datascrubbing do
we do?

DDeecceemmbbeerr 22000077 MMIIRR SSttrraatteeggiieess ■■ VViieewwPPooiinnttss ■■ wwwwww..mmooooddyyss..ccoomm//mmiirr || 9
In this section we first describe how we determine the issuer-level Moody's rating used in
Market Implied Ratings. We then cover the four datasets contained in the Market Implied
Ratings product; bond-implied ratings, CDS-implied ratings, equity-implied ratings, and
Moody's Default Predictor (MDP)-implied ratings.
Determining the Moody's rating for an issuer
The valuation of an issuer's debt, equity, or default risk in relation to its Moody's rating lies
at the heart of Market Implied Ratings. Many issuers have a variety of Moody's ratings
associated with them, reflecting the complexities of their corporate structures and balance
sheets, as well as bond issue-specific factors. Yet there is an obvious need to utilize com-
parable ratings among issuers, and we do this by using each entity's "senior unsecured or
equivalent" rating. We explain the process of determining the senior unsecured or equiva-
lent rating in Appendix II.
III: The Implied Ratings Datasets and Models
III: The Implied Ratings Datasets and Models
The valuation of an
issuer's debt,
equity, or default
risk in relation to
its Moody's rating
lies at the heart of
Market Implied
Ratings
December 2007 ViewPoints
Bond Inclusion Criteria
In order to be included in the bond-implied rating dataset, an issue must meet the fol-
lowing criteria.
Rated by Moody's
Denominated in US dollars, euros (including euro legacy currencies), sterling, yen,
Swiss francs, Canadian dollars, or Australian dollars
Have a modified duration of at least one year
Have a fixed coupon
Have a minimum face value of US$100 million or the equivalent
Have a price of at least $40
Have a maximum of four coupon payments p.a.
Not have a sinking fund feature
Not convertible to equities
Have a coupon greater than 0% but less than 30%
Be direct obligations of industrial, financial, utility, sovereign, or sub-sovereign
entities. That is, not be structured in nature
FAQ 10:What are our
bond inclusioncriteria?

Bond-Implied Ratings
The central role of ratings
While issuers in the bond and CDS markets tend to trade in relation to their ratings, we do
not, of course, suggest that market participants think the ratings are always correct.
Indeed, Figure 1 suggests that the market's view of an issuer's creditworthiness usually
varies from Moody's. But this use of ratings as value reference points helps make the MIR
data especially useful.
Why bonds?
Working with bonds is much more labor-intensive than CDS, and CDS are generally consid-
ered to provide more accurate signals of credit risk. So what do we gain by including the
bond dataset in the Market Implied Ratings platform? The bond dataset's longer price his-
tory provides one major advantage. Having data back to 1999, a period which includes a
full cycle of credit busts and booms, significantly strengthens our research results. By con-
trast, the CDS data is only available from 2001, and in the early years contained almost
only investment grade issuers.
A second point is that the inclusion of the bond dataset allows MIR subscribers to use the
data to analyze arbitrage opportunities between an issuer's bonds and CDS.
Finally, the bond dataset includes issue and issuer-level implied ratings and other informa-
tion, all of which is available to subscribers. Figure 6 shows a screen grab of issue-level
information for a sample entity. Such data allows subscribers to use MIR to analyze issuer-
specific curve trades.
III: The Implied Ratings Datasets and Models (continued)
This use of ratings
as value reference
points helps make
the MIR data
especially useful
December 2007 View Point
Figure 6: Sample Issue-level Data
10 || DDeecceemmbbeerr 22000077 MMIIRR SSttrraatteeggiieess ■■ VViieewwPPooiinnttss ■■ wwwwww..mmooooddyyss..ccoomm//mmiirr

DDeecceemmbbeerr 22000077 MMIIRR SSttrraatteeggiieess ■■ VViieewwPPooiinnttss ■■ wwwwww..mmooooddyyss..ccoomm//mmiirr || 11
Building the bond-implied ratings dataset and calculating bond spreads
We start with daily feeds from our vendors of bond prices, spreads, and indicative informa-
tion such as issuer name, issue identifier, and coupon. The incoming prices are matched
against the Moody's ratings database, which holds the bond issues rated by Moody's. All
the issues that meet a list of criteria (see the sidebar titled Bond Inclusion Criteria on p.9)
then go in the product. As many readers will recognize, this is much like the process of con-
structing a bond index. We begin with information on over 100,000 rated bonds. Of these,
pricing information is available for around 30,000 issues. Ultimately, around 12,500 issues
pass through the inclusion criteria to make up the bond-implied ratings dataset.
We calculate our daily prices and option-adjusted spreads from a blend of Reuters, Markit,
and TRACE data, and use other sources to provide additional quality checks. The general
rule is that the more recent the traded price and the larger the transaction, the more we rely
on it. The algorithm was developed by determining the balance among the three sources
that best "predicted" the next price movement - with the benefit of hindsight, of course. We
also subject our vendor prices to a quality assurance process. This includes the elimination
of bonds that are subject to tender offers, since their trading levels do not reflect the mar-
ket's view of the issuers' creditworthiness.
Determining the credit spread for bonds with options (only around 5% of the dataset) is a
more complex exercise. We discuss these and other credit curve-building issues in
Appendix III.
Calculating median credit spreads for bond-implied ratings
Once we have fixed the list of eligible bonds and their spreads, the next step is to calculate
the median credit spreads.5 The group of bonds used to calculate the median credit
spreads is a subset of the bond-implied ratings dataset. Specifically, it does not include two
types of issues, which make up a maximum of 10% of the total:
Bonds sold by issuers on Moody's Watchlist for upgrade or downgrade. Such issues
could well see their Moody's ratings change in the near future, and thus usually trade in
line with entities rated lower or higher than their current ratings.
Bonds denominated in yen and Australian dollars. Peculiarities of these markets mean
that for a given rating category the issues trade quite tight for their ratings on a spread
basis, even when accounting for currency effects. Thus, their inclusion would compro-
mise the global standard attributes of the median credit spreads.
We are now ready to build the credit curves. For each rating category we group the bonds
into duration buckets of up to 12 years, pick the median spread point, and use a non-linear
regression to fit a curve through the medians.
III: The Implied Ratings Datasets and Models (continued)
December 2007 View Point
5 Credit market spreads are usually calculated as market-weighted means. This approach has the advantage of pro-viding a measure of the spread "available" to investors in the asset class. But it suffers from two disadvantages.Firstly, spreads for a given rating category can be highly influenced by the behavior of a limited number of large issues.And secondly, the distribution of credit spreads for a given rating category is typically skewed to the downside. That is,there is a long and fat tail of wider spreads, and the distribution of this tail often has a disproportionate impact on themean spread level. We therefore believe that the median spread represents a truer assessment of the spread levelimplied by the market for a given rating category.
FAQ 11:What are the bond price
information sources?
12 || DDeecceemmbbeerr 22000077 MMIIRR SSttrraatteeggiieess ■■ VViieewwPPooiinnttss ■■ wwwwww..mmooooddyyss..ccoomm//mmiirr
Each curve represents the typical spread for a bond with a given duration or maturity in a
given rating category. As we showed in Figure 5a, the curves are usually upward sloping and
approximately parallel, as would be expected. Both the credit curves and the implied rat-
ings are updated daily. We make them available to MIR subscribers on moodys.com in the
interests of transparency (so investors can see the median levels used to determine the
implied ratings) and to enhance the value of the product to clients. The curves are pub-
lished on both a maturity and a duration basis.
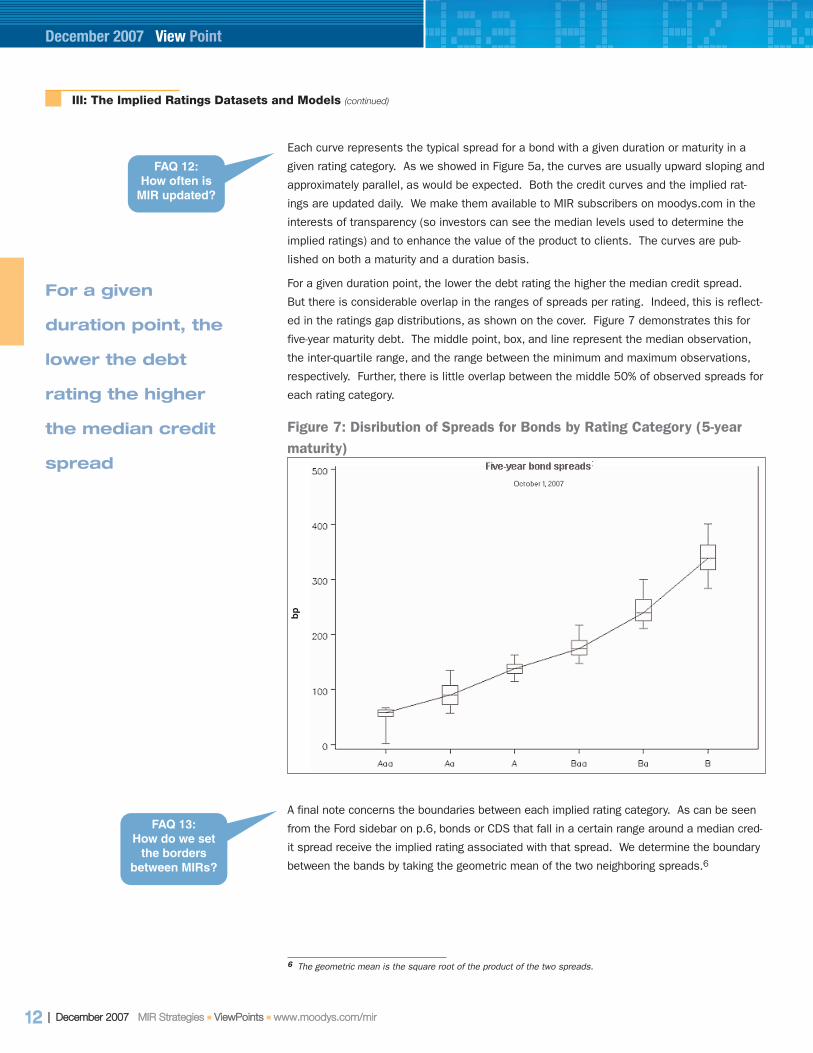
For a given duration point, the lower the debt rating the higher the median credit spread.
But there is considerable overlap in the ranges of spreads per rating. Indeed, this is reflect-
ed in the ratings gap distributions, as shown on the cover. Figure 7 demonstrates this for
five-year maturity debt. The middle point, box, and line represent the median observation,
the inter-quartile range, and the range between the minimum and maximum observations,
respectively. Further, there is little overlap between the middle 50% of observed spreads for
each rating category.
A final note concerns the boundaries between each implied rating category. As can be seen
from the Ford sidebar on p.6, bonds or CDS that fall in a certain range around a median cred-
it spread receive the implied rating associated with that spread. We determine the boundary
between the bands by taking the geometric mean of the two neighboring spreads.6
III: The Implied Ratings Datasets and Models (continued)
For a given
duration point, the
lower the debt
rating the higher
the median credit
spread
December 2007 View Point
Figure 7: Disribution of Spreads for Bonds by Rating Category (5-yearmaturity)
6 The geometric mean is the square root of the product of the two spreads.
FAQ 12:How often is
MIR updated?
FAQ 13:How do we set
the bordersbetween MIRs?
bp

DDeecceemmbbeerr 22000077 MMIIRR SSttrraatteeggiieess ■■ VViieewwPPooiinnttss ■■ wwwwww..mmooooddyyss..ccoomm//mmiirr || 13
Calculating issue-level bond-implied ratings
Once we have established the credit curves we can calculate the issue-level bond-implied
ratings. We do this for all eligible issues in all currencies, including those on the Watchlist.
Each median spread curve is assigned a numerical value that corresponds to its Moody's
rating, per the mapping scheme in Figure 2. Then for a given issue, we look at its spread
and duration, and place it in the correct position in respect to the curves. This means that
the implied rating for each issue is adjusted for its duration (or maturity). Most issues do
not sit exactly on a curve. Rather, they end up somewhere between the curves, and thus
receive corresponding fractional values.
Calculating issuer-level bond-implied ratings
We determine the issuer-level bond-implied ratings by averaging each entity's issue-level
implied rating. Larger issues are given greater weight in the calculation, reflecting their bet-
ter pricing characteristics. We underweight long- and short-duration issues due to the lower
information content of the prices of such issues.
A related question is how we account for issues from the same entity but which have differ-
ent Moody's ratings, e.g., because some are senior and others are subordinated. We
address this by calculating each issue's gap vs. its assigned Moody's rating, and then aver-
aging the gaps. The average gap is then set relative to the senior unsecured or equivalent
rating assigned to the issuer7. This last step provides the bond-implied ratings gap.
An example might help explain the process. Let's take an issuer that with a senior unse-
cured or equivalent rating of Baa1. It has two bonds outstanding, one senior and one subor-
dinated. The senior bond has a rating of Baa1 and a bond-implied ratings gap of 0, while
the subordinated issue is rated Baa2 and has a gap of -2. Both issues are of the same size
and approximately the same duration, so they are weighted equally in calculating the issuer-
level bond-implied rating gap. This would be -1, i.e., the simple average of the issue gaps of
0 and -2. The issuer-level gap of -1 would be set in relation to the senior unsecured or
equivalent rating of Baa1 to give an issuer-level bond-implied rating of Baa2.
High volatility of implied ratings compared to Moody's ratings
Before leaving the subject of bond-implied ratings, we would like to address a topic on which
we often receive questions from users; how volatile are implied ratings, especially compared
to Moody's ratings?
As might be expected (and as we note in the Introduction), implied ratings are a lot more
volatile than Moody's ratings. Amongst other considerations, this can be seen as a trade-off
for implied ratings' better default risk identification powers, at least over relatively short time
horizons.8 Figure 8 shows the percentage of Moody's issuer ratings and bond-implied rat-
ings which change each year.
III: The Implied Ratings Datasets and Models (continued)
How volatile are
implied ratings,
especially
compared to
Moody's ratings?
December 2007 View Point
7 Please see Appendix II for a description of how we determine an issuer's senior unsecured or equivalent rating.8 See Section III and Munves, Jiang and Lam (August 2006)
FAQ 14:How do we
adjust for bondmaturities?
FAQ 15:How do we cal-
culate bondissuer-level
implied ratings?
FAQ 16:How volatile aremarket-implied
ratings?
14 || DDeecceemmbbeerr 22000077 MMIIRR SSttrraatteeggiieess ■■ VViieewwPPooiinnttss ■■ wwwwww..mmooooddyyss..ccoomm//mmiirr
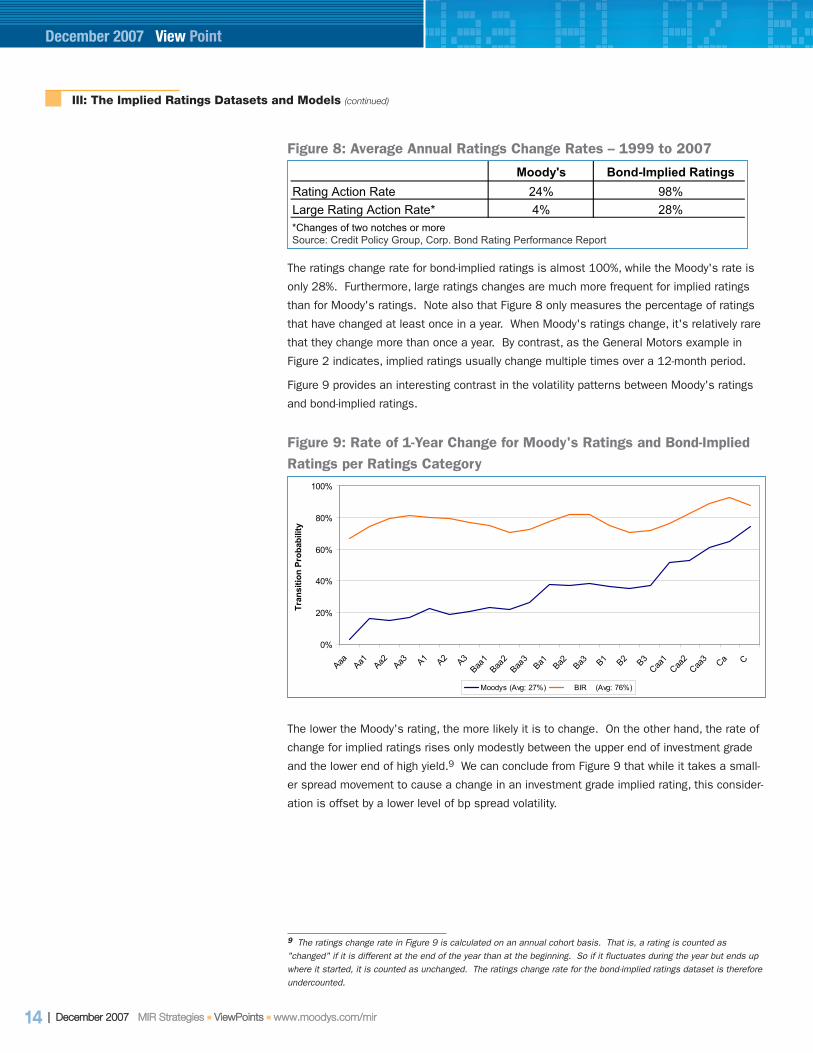
The ratings change rate for bond-implied ratings is almost 100%, while the Moody's rate is
only 28%. Furthermore, large ratings changes are much more frequent for implied ratings
than for Moody's ratings. Note also that Figure 8 only measures the percentage of ratings
that have changed at least once in a year. When Moody's ratings change, it's relatively rare
that they change more than once a year. By contrast, as the General Motors example in
Figure 2 indicates, implied ratings usually change multiple times over a 12-month period.
Figure 9 provides an interesting contrast in the volatility patterns between Moody's ratings
and bond-implied ratings.
III: The Implied Ratings Datasets and Models (continued)
December 2007 View Point
Moody's Bond-Implied RatingsRating Action Rate 24% 98%Large Rating Action Rate* 4% 28%
Source: Credit Policy Group, Corp. Bond Rating Performance Report*Changes of two notches or more
Figure 8: Average Annual Ratings Change Rates -- 1999 to 2007
0%
20%
40%
60%
80%
100%
Aaa Aa1 Aa2 Aa3 A1 A2 A3Baa
1Baa
2Baa
3Ba1 Ba2 Ba3 B1 B2 B3
Caa1
Caa2
Caa3 Ca C
Tran
sitio
n Pr
obab
ility
Moodys (Avg: 27%) BIR (Avg: 76%)
Figure 9: Rate of 1-Year Change for Moody's Ratings and Bond-ImpliedRatings per Ratings Category
The lower the Moody's rating, the more likely it is to change. On the other hand, the rate of
change for implied ratings rises only modestly between the upper end of investment grade
and the lower end of high yield.9 We can conclude from Figure 9 that while it takes a small-
er spread movement to cause a change in an investment grade implied rating, this consider-
ation is offset by a lower level of bp spread volatility.
9 The ratings change rate in Figure 9 is calculated on an annual cohort basis. That is, a rating is counted as"changed" if it is different at the end of the year than at the beginning. So if it fluctuates during the year but ends upwhere it started, it is counted as unchanged. The ratings change rate for the bond-implied ratings dataset is thereforeundercounted.
DDeecceemmbbeerr 22000077 MMIIRR SSttrraatteeggiieess ■■ VViieewwPPooiinnttss ■■ wwwwww..mmooooddyyss..ccoomm//mmiirr || 15
CDS-Implied Ratings
Credit default swaps are a relatively recent financial innovation, but they have transformed
the credit markets. Their original use was to provide a form of insurance against default.
They now often serve as bond substitutes, and bring several advantages to this role.
CDS also have many advantages over bonds from a modeling point of view. Instead of multi-
ple bonds with different characteristics, there is usually just one contract for each reference
entity,10 and 85% or more of trading takes place in 5-year maturity contracts. This means
that we can rely on the 5-year point in the curve to determine the CDS-implied ratings, and
have no need to build credit term structures for each rating category, as we do for the bond
dataset.
Our CDS price source is Markit Group. While CDS denominated in different currencies trade
in line with each other, our policy is to use spreads of US dollar-denominated contracts,
unless these are not available. In that case, we take spreads on contracts denominated in
other currencies.11
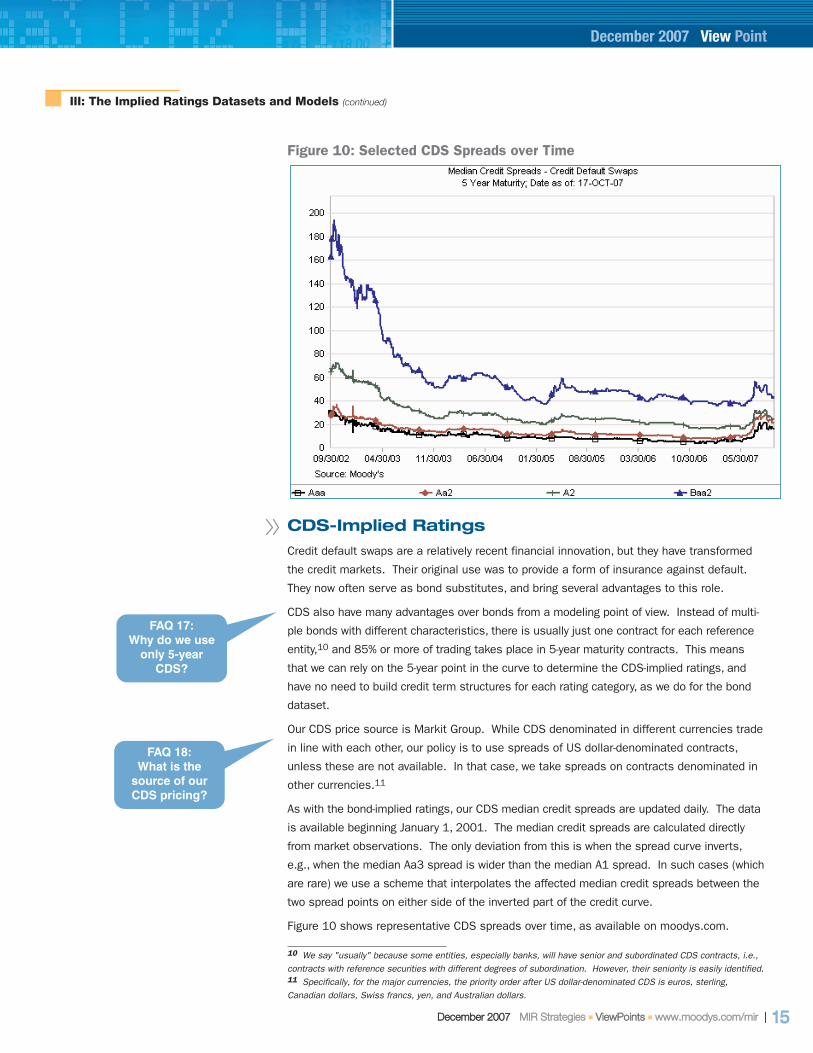
As with the bond-implied ratings, our CDS median credit spreads are updated daily. The data
is available beginning January 1, 2001. The median credit spreads are calculated directly
from market observations. The only deviation from this is when the spread curve inverts,
e.g., when the median Aa3 spread is wider than the median A1 spread. In such cases (which
are rare) we use a scheme that interpolates the affected median credit spreads between the
two spread points on either side of the inverted part of the credit curve.
Figure 10 shows representative CDS spreads over time, as available on moodys.com.
III: The Implied Ratings Datasets and Models (continued)
December 2007 View Point
Figure 10: Selected CDS Spreads over Time
10 We say "usually" because some entities, especially banks, will have senior and subordinated CDS contracts, i.e.,contracts with reference securities with different degrees of subordination. However, their seniority is easily identified.11 Specifically, for the major currencies, the priority order after US dollar-denominated CDS is euros, sterling,Canadian dollars, Swiss francs, yen, and Australian dollars.
FAQ 17:Why do we use
only 5-yearCDS?
FAQ 18:What is the
source of ourCDS pricing?
16 || DDeecceemmbbeerr 22000077 MMIIRR SSttrraatteeggiieess ■■ VViieewwPPooiinnttss ■■ wwwwww..mmooooddyyss..ccoomm//mmiirr
Equity-Implied Ratings
For bond- and CDS-implied ratings the levels of an issuer's credit spread serves as a good
proxy for the market's view of its credit risk on a forward-looking basis. Similarly, the value
of the firm's equity as measured by market capitalization provides a great deal of insight
regarding the default risk of the firm, when combined with the liabilities structure and a
measure of asset volatility. But market capitalization is not a direct measure of default risk.
Thus, another approach must be taken to extract credit risk signals from equity market data.
One response to this problem is based on an extension of the so-called Merton contingent
claims approach to modeling default risk from share prices. This has been substantially
refined by Moody's KMV to produce their widely used expected default frequency (EDF) met-
rics over a twenty-year period12. At Moody’s KMV, we find that the equity based signal of
default probability, as indicated by the Moody’s KMV public EDF credit measure, provides a
strong and timely signal regarding the likelihood of a firm defaulting across the entire popu-
lation of firms with publicly traded equity.
How are EDF values mapped to implied ratings?
The mapping from EDF measures to implied ratings is determined by median EDF measures
of firms in ratings classes using Moody's KMV's "spot median" methodology. The spot
median for a major rating class captures the median of the most recent month's EDF values
for all North American non-financial firms that fall into this rating class.
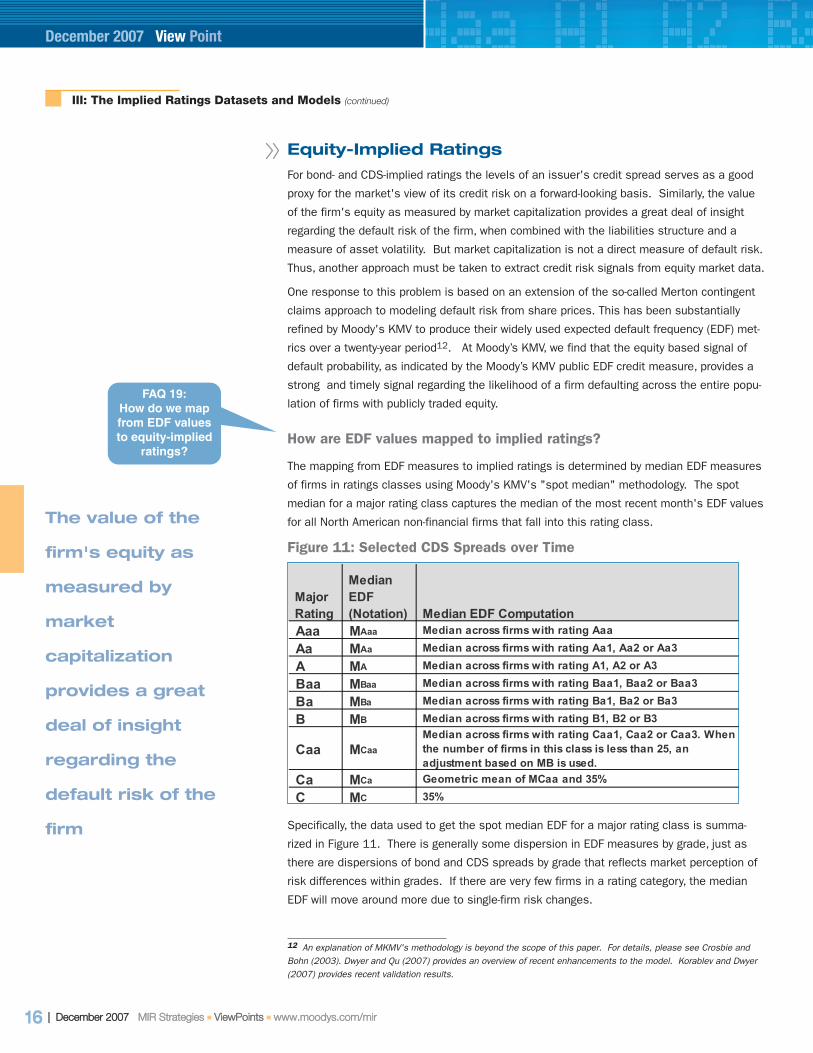
Specifically, the data used to get the spot median EDF for a major rating class is summa-
rized in Figure 11. There is generally some dispersion in EDF measures by grade, just as
there are dispersions of bond and CDS spreads by grade that reflects market perception of
risk differences within grades. If there are very few firms in a rating category, the median
EDF will move around more due to single-firm risk changes.
III: The Implied Ratings Datasets and Models (continued)
The value of the
firm's equity as
measured by
market
capitalization
provides a great
deal of insight
regarding the
default risk of the
firm
December 2007 View Point
12 An explanation of MKMV's methodology is beyond the scope of this paper. For details, please see Crosbie andBohn (2003). Dwyer and Qu (2007) provides an overview of recent enhancements to the model. Korablev and Dwyer(2007) provides recent validation results.
Major Rating
Median EDF (Notation) Median EDF Computation
Aaa MAaa Median across firms with rating Aaa
Aa MAa Median across firms with rating Aa1, Aa2 or Aa3
A MA Median across firms with rating A1, A2 or A3
Baa MBaa Median across firms with rating Baa1, Baa2 or Baa3
Ba MBa Median across firms with rating Ba1, Ba2 or Ba3
B MB Median across firms with rating B1, B2 or B3
Caa MCaaMedian across firms with rating Caa1, Caa2 or Caa3. When the number of firms in this class is less than 25, an adjustment based on MB is used.
Ca MCa Geometric mean of MCaa and 35%
C MC 35%
Figure 11: Selected CDS Spreads over Time
FAQ 19:How do we mapfrom EDF valuesto equity-implied
ratings?
DDeecceemmbbeerr 22000077 MMIIRR SSttrraatteeggiieess ■■ VViieewwPPooiinnttss ■■ wwwwww..mmooooddyyss..ccoomm//mmiirr || 17
Due to small samples, the median EDF level of a rating is not always better than the median
EDF of the rating that is one notch below it. For example, the median EDF level of an A2
credit may not always be better (ie, lower) than the median EDF of an A3 credit. This is par-
ticularly true for high-quality firms that have the most agency rating bands; differences
between fine grades are measured within a few basis points of each other. Due to these
issues, Moody's KMV uses the broader data on major letter rating categories to set the
bands and then maps fine grades between these by a geometric
means approach, as explained below. This exercise is repeated at the
end of each month. It should be noted that Moody's KMV sets the
mapping to very low-quality grades as constant. Specifically, we map
Ca credits to the geometric mean of the Caa EDF and an EDF of 35%,
and we map C to 35%. Setting constants to low-grade categories is
due to the limited number of firms in such categories, and calibrating
the medians month by month will yield volatile mappings. The con-
stants used are calibrated from a long-term pooled sample.
Before deriving fine grades mapping, the category medians are checked
and adjusted when necessary to ensure a monotonic relationship to rat-
ing grades, i.e., a riskier rating grade should always correspond to a high-
er EDF value. For example, the mapping to Aa2 is required to be at least
one basis point below that of A2. This adjustment is rarely triggered.
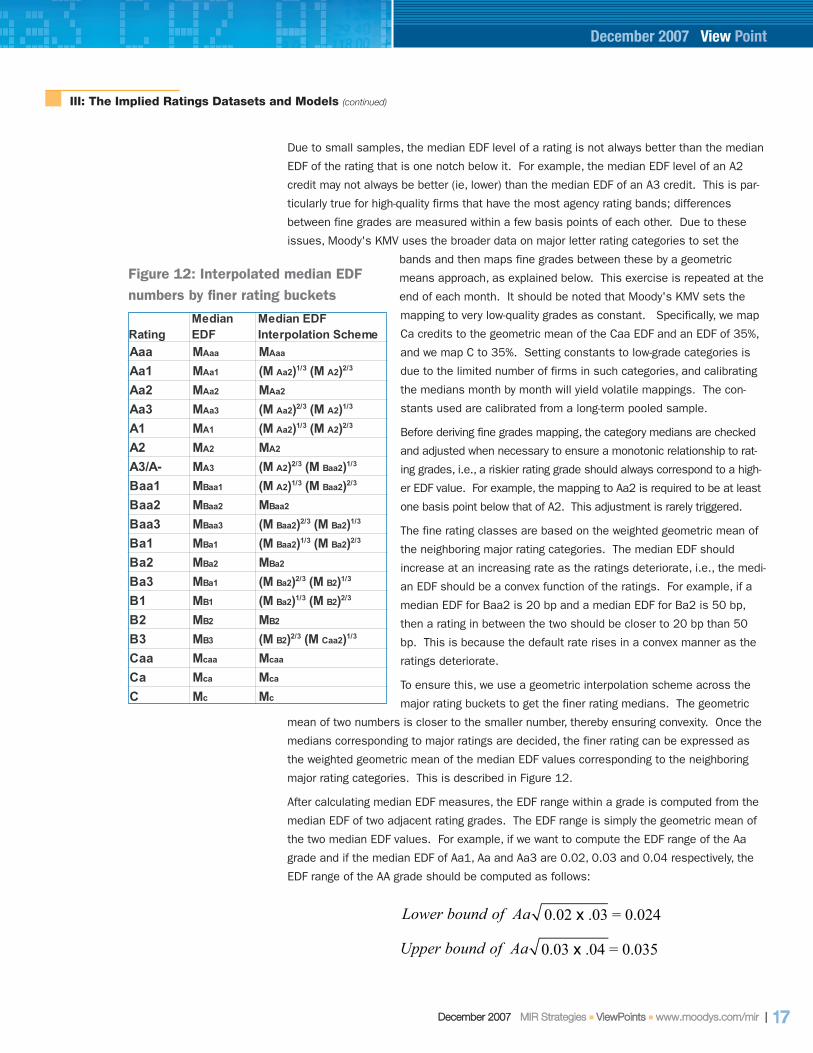
The fine rating classes are based on the weighted geometric mean of
the neighboring major rating categories. The median EDF should
increase at an increasing rate as the ratings deteriorate, i.e., the medi-
an EDF should be a convex function of the ratings. For example, if a
median EDF for Baa2 is 20 bp and a median EDF for Ba2 is 50 bp,
then a rating in between the two should be closer to 20 bp than 50
bp. This is because the default rate rises in a convex manner as the
ratings deteriorate.
To ensure this, we use a geometric interpolation scheme across the
major rating buckets to get the finer rating medians. The geometric
mean of two numbers is closer to the smaller number, thereby ensuring convexity. Once the
medians corresponding to major ratings are decided, the finer rating can be expressed as
the weighted geometric mean of the median EDF values corresponding to the neighboring
major rating categories. This is described in Figure 12.
After calculating median EDF measures, the EDF range within a grade is computed from the
median EDF of two adjacent rating grades. The EDF range is simply the geometric mean of
the two median EDF values. For example, if we want to compute the EDF range of the Aa
grade and if the median EDF of Aa1, Aa and Aa3 are 0.02, 0.03 and 0.04 respectively, the
EDF range of the AA grade should be computed as follows:
III: The Implied Ratings Datasets and Models (continued)
December 2007 View Point
RatingMedian EDF
Median EDF Interpolation Scheme
Aaa MAaa MAaa
Aa1 MAa1 (M Aa2)1/3 (M A2)2/3
Aa2 MAa2 MAa2
Aa3 MAa3 (M Aa2)2/3 (M A2)1/3
A1 MA1 (M Aa2)1/3 (M A2)2/3
A2 MA2 MA2
A3/A- MA3 (M A2)2/3 (M Baa2)1/3
Baa1 MBaa1 (M A2)1/3 (M Baa2)2/3
Baa2 MBaa2 MBaa2
Baa3 MBaa3 (M Baa2)2/3 (M Ba2)1/3
Ba1 MBa1 (M Baa2)1/3 (M Ba2)2/3
Ba2 MBa2 MBa2
Ba3 MBa1 (M Ba2)2/3 (M B2)1/3
B1 MB1 (M Ba2)1/3 (M B2)2/3
B2 MB2 MB2
B3 MB3 (M B2)2/3 (M Caa2)1/3
Caa Mcaa Mcaa
Ca Mca Mca
C Mc Mc
Figure 12: Interpolated median EDFnumbers by finer rating buckets
Lower bound of Aa
Upper bound of Aa
0.02 x .03 = 0.024
0.03 x .04 = 0.035
18 || DDeecceemmbbeerr 22000077 MMIIRR SSttrraatteeggiieess ■■ VViieewwPPooiinnttss ■■ wwwwww..mmooooddyyss..ccoomm//mmiirr
So, the EDF range for the Aa grade would be 0.024 ~ 0.035 in this example. This method-
ology is consistent with our earlier approach of interpolating between major categories,
using geometric means for finer categories.
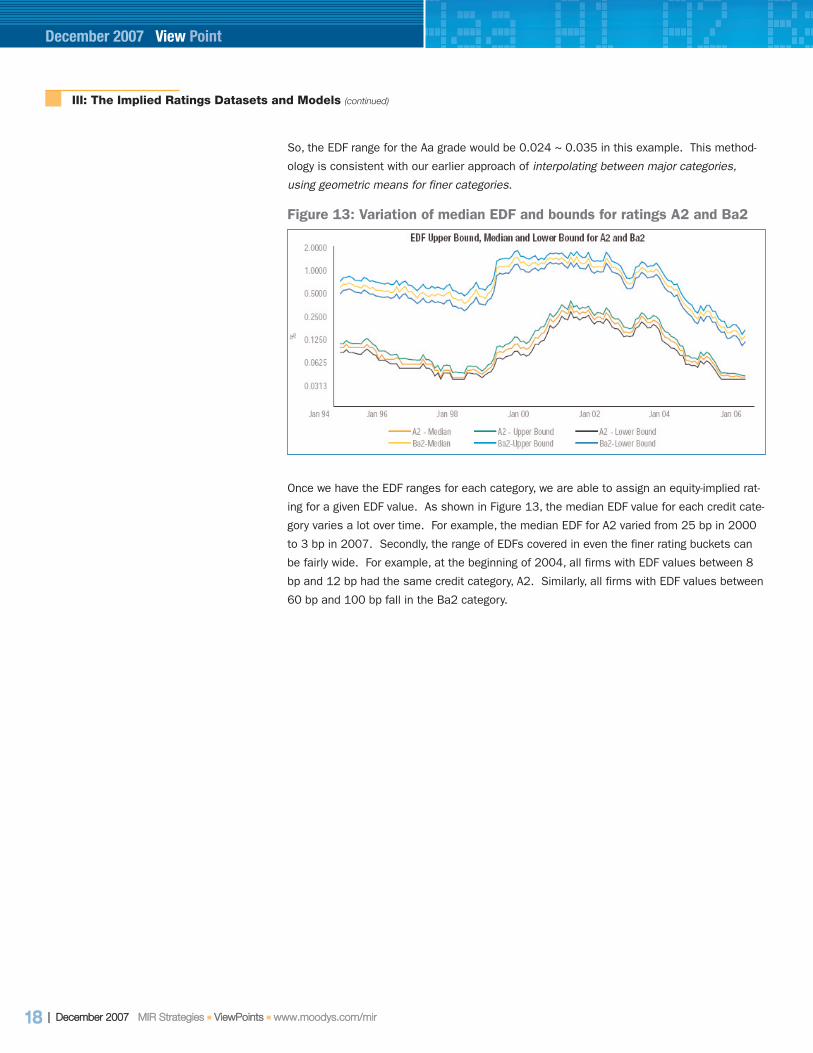
Once we have the EDF ranges for each category, we are able to assign an equity-implied rat-
ing for a given EDF value. As shown in Figure 13, the median EDF value for each credit cate-
gory varies a lot over time. For example, the median EDF for A2 varied from 25 bp in 2000
to 3 bp in 2007. Secondly, the range of EDFs covered in even the finer rating buckets can
be fairly wide. For example, at the beginning of 2004, all firms with EDF values between 8
bp and 12 bp had the same credit category, A2. Similarly, all firms with EDF values between
60 bp and 100 bp fall in the Ba2 category.
III: The Implied Ratings Datasets and Models (continued)
December 2007 View Point
Figure 13: Variation of median EDF and bounds for ratings A2 and Ba2
DDeecceemmbbeerr 22000077 MMIIRR SSttrraatteeggiieess ■■ VViieewwPPooiinnttss ■■ wwwwww..mmooooddyyss..ccoomm//mmiirr || 19
III: The Implied Ratings Datasets and Models (continued)
December 2007 View Point
Comparing EIR Measures between EDF 8.0 and 7.1 Models
In June 2007, Moody's KMV released the EDF 8.0 model.13 The EIR measures from the EDF 8.0 and EDF 7.1 models differ in the fol-
lowing ways:
The EDF 7.1 model has an EDF ranges from 2 bps to 20%, while the EDF 8.0 model expanded the range from 1 bps to 35%. This
allows the new EIR measure to better distinguish high quality companies, especially in a benign environment of a credit cycle, when
fewer companies have EDF values that reach the floor.
The EDF 7.1 model's lookup table for worst categories (Caa2 and worse) is static and does not vary with credit cycle. In the EDF 8.0
model, this has become dynamic.
In the EDF 7.1 model, the EIR measure is based on EDF credit measures that is rounded to basis points, while in the EDF 8.0
model, we derive the EIR before any rounding in the EDF credit measure.
In the middle of the credit spectrum, the EIR measures under EDF 7.1 and 8.0 models should be largely the same.
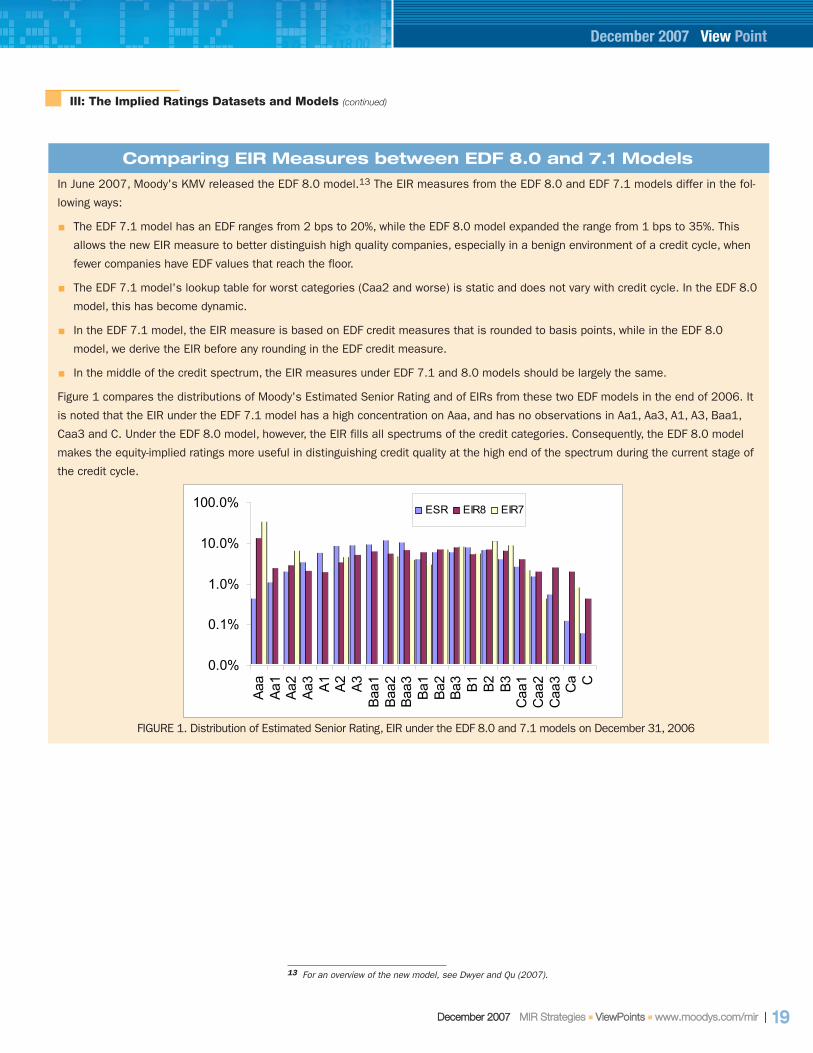
Figure 1 compares the distributions of Moody's Estimated Senior Rating and of EIRs from these two EDF models in the end of 2006. It
is noted that the EIR under the EDF 7.1 model has a high concentration on Aaa, and has no observations in Aa1, Aa3, A1, A3, Baa1,
Caa3 and C. Under the EDF 8.0 model, however, the EIR fills all spectrums of the credit categories. Consequently, the EDF 8.0 model
makes the equity-implied ratings more useful in distinguishing credit quality at the high end of the spectrum during the current stage of
the credit cycle.
0.0%
0.1%
1.0%
10.0%
100.0%
Aaa
Aa1
Aa2
Aa3 A1 A2 A3
Baa1
Baa2
Baa3 Ba
1Ba
2Ba
3 B1 B2 B3C
aa1
Caa
2C
aa3
Ca C
ESR EIR8 EIR7
FIGURE 1. Distribution of Estimated Senior Rating, EIR under the EDF 8.0 and 7.1 models on December 31, 2006
13 For an overview of the new model, see Dwyer and Qu (2007).

20 || DDeecceemmbbeerr 22000077 MMIIRR SSttrraatteeggiieess ■■ VViieewwPPooiinnttss ■■ wwwwww..mmooooddyyss..ccoomm//mmiirr
Default Predictor-Implied Ratings
Default Predictor-implied ratings14 are derived from a statistical credit scoring model developed by
Moody's. The model is designed to rank-order corporate, non-financial obligors by default risk over a
one-year horizon. The model uses six accounting-based financial ratios, lagged three months from
the time of the report date (quarterly statements are used if available, otherwise annual statements
are used), to compute a model "score." The score is similar to a probability of default (PD) in the
sense that a higher score indicates a higher (one-year) default probability. The scores are then
mapped to Moody's long-term debt rating scale with the interpretation that higher-rated issuers have
lower one-year PDs. Moody's Default Predictor (MDP) does not rely on market-based data, and as a
result, generally gives more stable estimates of credit risk than do those based on market indicators
such as stock prices, bond prices or CDS premia.
The six accounting ratios were selected from a list of 43 ratios commonly associated with funda-
mental analysis, including measures of coverage, leverage, liquidity, size, growth, and volatility.
Each ratio was constructed in accordance with the methodologies used by Moody's analysts and
detailed in published materials. After a thorough selection process, the following combination of
ratios was found to have the greatest predictive power on an in-sample basis. The ratios were
also validated through the use of a hold-out sample:
(EBIT + 1/3 Rent Expense) / (Interest Expense + 1/3 Rent Expense + Preferred Dividends / 0.65)
Adjusted Debt / Adjusted Capital
Cash and Equivalents / Total Assets
5-yr Average of Sales / 5-yr Standard Deviation of Sales
Retained Cash Flow / Adjusted Debt
One-year Growth Rate of Total Assets
The six accounting ratios are each mapped into "one-year default rate equivalents" using non-paramet-
ric transformations. This intermediate mapping is done to account for the non-linear relationships
between the various ratios and default probability. The transformed ratios are then used as inputs into
a probit model that computes the model score, which is then mapped to a rating. We also produce uni-
variate-implied ratings for each of the six inputs using the transformed ratios; i.e. an issuer with an
MDP-implied rating of A1 might have: Aa2 coverage, Baa1 leverage, etc. It should be noted that the final
MDP-implied rating is not a weighted average of the univariate-implied ratings. To the contrary, it may be
the case that an obligor has a higher MDP-implied rating than any of the six univariate-implied ratings.
Recently, the method by which model scores and the six accounting ratios are mapped to ratings
was revised. To account for changes over time in the distributions of the six accounting ratios
that drive MDP-based ratings, the previous static mappings were replaced by mappings that are
updated monthly. The mappings are calculated such that the overall distributions of MDP- and
univariate-implied ratings match the distribution of Moody's senior unsecured (or equivalent) rat-
ings as of the date the mappings are constructed. For example, if, at the time a new monthly
mapping is calculated, 5% of corporate non-financial issuers hold Aaa ratings, then the Aaa/Aa1
MDP-implied rating cutoff is calculated so that 5% of MDP-implied ratings are Aaa. If 6% of the
corporate non-financial universe holds Aa1 ratings, then the Aa1/Aa2 cutoff is calculated such
that 6% of MDP-implied ratings are Aa1, and so forth. The same algorithm is applied to each of
the six accounting ratios in turn.
Feature (continued)
Default Predictor-
implied ratings are
derived from a
statistical credit
scoring model
December 2007 View Point
14 See Fons and Viswanathan (December 2004) and Fons and Woolley (June 2007).
The six accounting
ratios were selected
from a list of 43
ratios commonly
associated with
fundamental analysis
The final MDP-implied
rating is not a
weighted average of
the univariate-implied
ratings
FAQ 20:Which financialratios underlie
the MDP model?
FAQ 21:MDP-IRs and the
underlyingratios.
DDeecceemmbbeerr 22000077 MMIIRR SSttrraatteeggiieess ■■ VViieewwPPooiinnttss ■■ wwwwww..mmooooddyyss..ccoomm//mmiirr || 21
In this section we turn our attention to the practical applications of Market Implied Ratings.
To a large degree this is a review of published research from the Credit Strategy Group,
which addresses questions from clients and Moody's analysts about the significance and
interpretations of ratings gaps and implied ratings levels for the various datasets.
Underneath it all; ratings gap-conditioned transition matrices
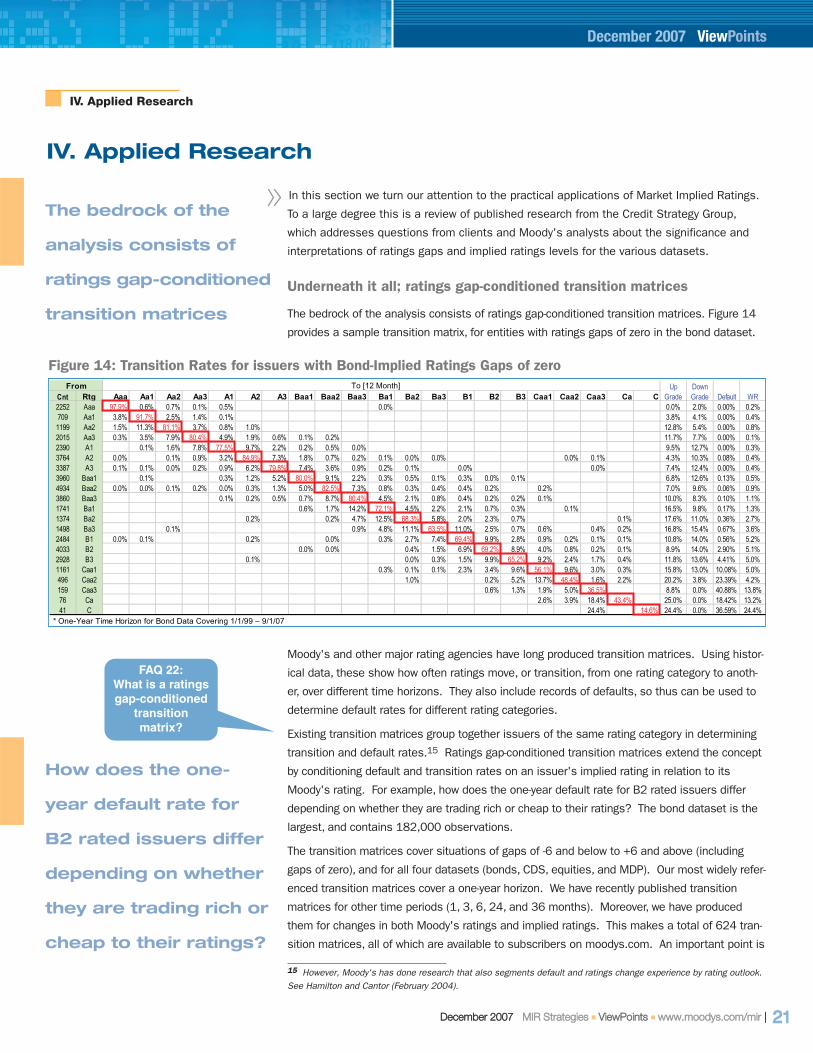
The bedrock of the analysis consists of ratings gap-conditioned transition matrices. Figure 14
provides a sample transition matrix, for entities with ratings gaps of zero in the bond dataset.
Moody's and other major rating agencies have long produced transition matrices. Using histor-
ical data, these show how often ratings move, or transition, from one rating category to anoth-
er, over different time horizons. They also include records of defaults, so thus can be used to
determine default rates for different rating categories.
Existing transition matrices group together issuers of the same rating category in determining
transition and default rates.15 Ratings gap-conditioned transition matrices extend the concept
by conditioning default and transition rates on an issuer's implied rating in relation to its
Moody's rating. For example, how does the one-year default rate for B2 rated issuers differ
depending on whether they are trading rich or cheap to their ratings? The bond dataset is the
largest, and contains 182,000 observations.
The transition matrices cover situations of gaps of -6 and below to +6 and above (including
gaps of zero), and for all four datasets (bonds, CDS, equities, and MDP). Our most widely refer-
enced transition matrices cover a one-year horizon. We have recently published transition
matrices for other time periods (1, 3, 6, 24, and 36 months). Moreover, we have produced
them for changes in both Moody's ratings and implied ratings. This makes a total of 624 tran-
sition matrices, all of which are available to subscribers on moodys.com. An important point is
IV. Applied Research
IV. Applied Research
December 2007 ViewPoints
Cnt Rtg Aaa Aa1 Aa2 Aa3 A1 A2 A3 Baa1 Baa2 Baa3 Ba1 Ba2 Ba3 B1 B2 B3 Caa1 Caa2 Caa3 Ca C2252 Aaa 97.9% 0.6% 0.7% 0.1% 0.5% 0.0% 0.0% 2.0% 0.00% 0.2%709 Aa1 3.8% 91.7% 2.5% 1.4% 0.1% 3.8% 4.1% 0.00% 0.4%1199 Aa2 1.5% 11.3% 81.1% 3.7% 0.8% 1.0% 12.8% 5.4% 0.00% 0.8%2015 Aa3 0.3% 3.5% 7.9% 80.4% 4.9% 1.9% 0.6% 0.1% 0.2% 11.7% 7.7% 0.00% 0.1%2390 A1 0.1% 1.6% 7.8% 77.5% 9.7% 2.2% 0.2% 0.5% 0.0% 9.5% 12.7% 0.00% 0.3%3764 A2 0.0% 0.1% 0.9% 3.2% 84.9% 7.3% 1.8% 0.7% 0.2% 0.1% 0.0% 0.0% 0.0% 0.1% 4.3% 10.3% 0.08% 0.4%3387 A3 0.1% 0.1% 0.0% 0.2% 0.9% 6.2% 79.8% 7.4% 3.6% 0.9% 0.2% 0.1% 0.0% 0.0% 7.4% 12.4% 0.00% 0.4%3960 Baa1 0.1% 0.3% 1.2% 5.2% 80.0% 9.1% 2.2% 0.3% 0.5% 0.1% 0.3% 0.0% 0.1% 6.8% 12.6% 0.13% 0.5%4934 Baa2 0.0% 0.0% 0.1% 0.2% 0.0% 0.3% 1.3% 5.0% 82.5% 7.3% 0.8% 0.3% 0.4% 0.4% 0.2% 0.2% 7.0% 9.6% 0.06% 0.9%3860 Baa3 0.1% 0.2% 0.5% 0.7% 8.7% 80.4% 4.5% 2.1% 0.8% 0.4% 0.2% 0.2% 0.1% 10.0% 8.3% 0.10% 1.1%1741 Ba1 0.6% 1.7% 14.2% 72.1% 4.5% 2.2% 2.1% 0.7% 0.3% 0.1% 16.5% 9.8% 0.17% 1.3%1374 Ba2 0.2% 0.2% 4.7% 12.5% 68.3% 5.8% 2.0% 2.3% 0.7% 0.1% 17.6% 11.0% 0.36% 2.7%1498 Ba3 0.1% 0.9% 4.8% 11.1% 63.5% 11.0% 2.5% 0.7% 0.6% 0.4% 0.2% 16.8% 15.4% 0.67% 3.6%2484 B1 0.0% 0.1% 0.2% 0.0% 0.3% 2.7% 7.4% 69.4% 9.9% 2.8% 0.9% 0.2% 0.1% 0.1% 10.8% 14.0% 0.56% 5.2%4033 B2 0.0% 0.0% 0.4% 1.5% 6.9% 69.2% 8.9% 4.0% 0.8% 0.2% 0.1% 8.9% 14.0% 2.90% 5.1%2928 B3 0.1% 0.0% 0.3% 1.5% 9.9% 65.2% 9.2% 2.4% 1.7% 0.4% 11.8% 13.6% 4.41% 5.0%1161 Caa1 0.3% 0.1% 0.1% 2.3% 3.4% 9.6% 56.1% 9.6% 3.0% 0.3% 15.8% 13.0% 10.08% 5.0%496 Caa2 1.0% 0.2% 5.2% 13.7% 48.4% 1.6% 2.2% 20.2% 3.8% 23.39% 4.2%159 Caa3 0.6% 1.3% 1.9% 5.0% 36.5% 8.8% 0.0% 40.88% 13.8%76 Ca 2.6% 3.9% 18.4% 43.4% 25.0% 0.0% 18.42% 13.2%41 C 24.4% 14.6% 24.4% 0.0% 36.59% 24.4%
* One-Year Time Horizon for Bond Data Covering 1/1/99 – 9/1/07
Default WRFrom To [12 Month] Up
GradeDown Grade
How does the one-
year default rate for
B2 rated issuers differ
depending on whether
they are trading rich or
cheap to their ratings?
15 However, Moody's has done research that also segments default and ratings change experience by rating outlook.See Hamilton and Cantor (February 2004).
The bedrock of the
analysis consists of
ratings gap-conditioned
transition matrices
FAQ 22:What is a ratingsgap-conditioned
transitionmatrix?
Figure 14: Transition Rates for issuers with Bond-Implied Ratings Gaps of zero
22 || DDeecceemmbbeerr 22000077 MMIIRR SSttrraatteeggiieess ■■ VViieewwPPooiinnttss ■■ wwwwww..mmooooddyyss..ccoomm//mmiirr
that the data gets quite thin for large ratings gaps. This would be expected from the distribu-
tion of ratings gaps shown in Figure 1. Thus, each row of each transition matrix shows the
number of observations (The “Cnt” column in Figure 14), so users can decide for themselves
when the data is insufficient to rely on the precise figures in the matrices. Regardless of this,
we see consistent patterns of behavior for rich and cheap names. We discuss these in the fol-
lowing sections.
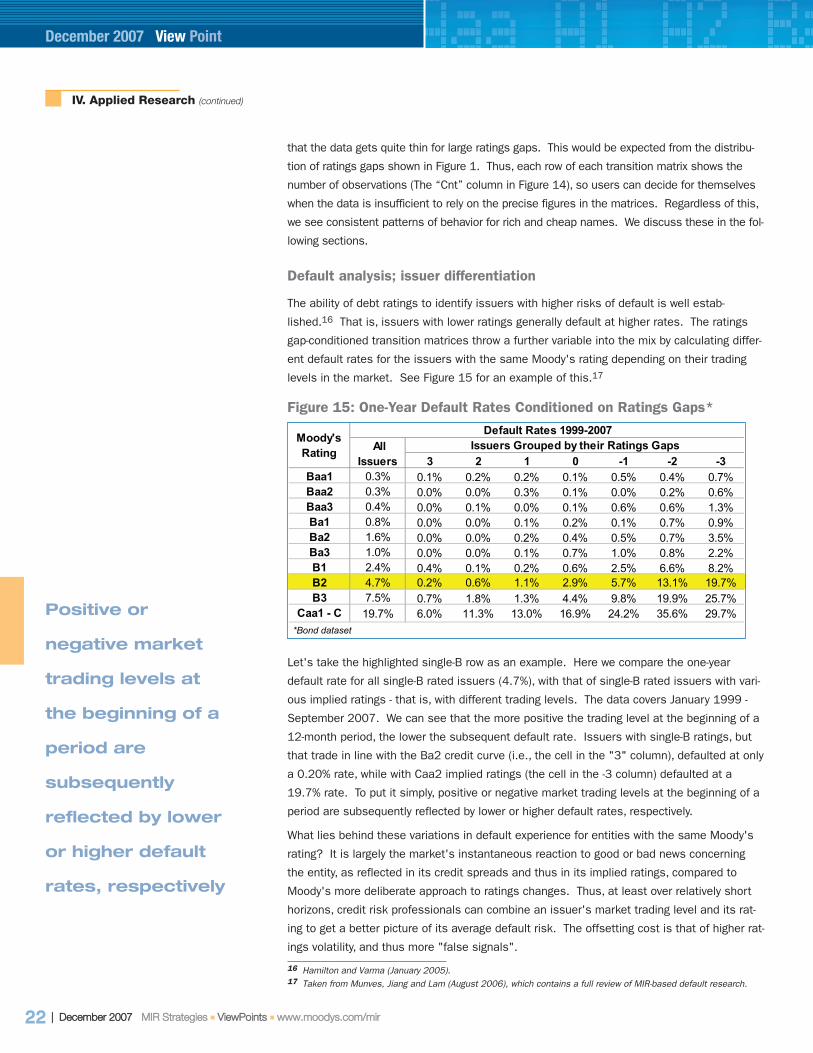
Default analysis; issuer differentiation
The ability of debt ratings to identify issuers with higher risks of default is well estab-
lished.16 That is, issuers with lower ratings generally default at higher rates. The ratings
gap-conditioned transition matrices throw a further variable into the mix by calculating differ-
ent default rates for the issuers with the same Moody's rating depending on their trading
levels in the market. See Figure 15 for an example of this.17
Let's take the highlighted single-B row as an example. Here we compare the one-year
default rate for all single-B rated issuers (4.7%), with that of single-B rated issuers with vari-
ous implied ratings - that is, with different trading levels. The data covers January 1999 -
September 2007. We can see that the more positive the trading level at the beginning of a
12-month period, the lower the subsequent default rate. Issuers with single-B ratings, but
that trade in line with the Ba2 credit curve (i.e., the cell in the "3" column), defaulted at only
a 0.20% rate, while with Caa2 implied ratings (the cell in the -3 column) defaulted at a
19.7% rate. To put it simply, positive or negative market trading levels at the beginning of a
period are subsequently reflected by lower or higher default rates, respectively.
What lies behind these variations in default experience for entities with the same Moody's
rating? It is largely the market's instantaneous reaction to good or bad news concerning
the entity, as reflected in its credit spreads and thus in its implied ratings, compared to
Moody's more deliberate approach to ratings changes. Thus, at least over relatively short
horizons, credit risk professionals can combine an issuer's market trading level and its rat-
ing to get a better picture of its average default risk. The offsetting cost is that of higher rat-
ings volatility, and thus more "false signals".
IV. Applied Research (continued)
Positive or
negative market
trading levels at
the beginning of a
period are
subsequently
reflected by lower
or higher default
rates, respectively
December 2007 View Point
16 Hamilton and Varma (January 2005).17 Taken from Munves, Jiang and Lam (August 2006), which contains a full review of MIR-based default research.
3 2 1 0 -1 -2 -3Baa1 0.3% 0.1% 0.2% 0.2% 0.1% 0.5% 0.4% 0.7%Baa2 0.3% 0.0% 0.0% 0.3% 0.1% 0.0% 0.2% 0.6%Baa3 0.4% 0.0% 0.1% 0.0% 0.1% 0.6% 0.6% 1.3%Ba1 0.8% 0.0% 0.0% 0.1% 0.2% 0.1% 0.7% 0.9%Ba2 1.6% 0.0% 0.0% 0.2% 0.4% 0.5% 0.7% 3.5%Ba3 1.0% 0.0% 0.0% 0.1% 0.7% 1.0% 0.8% 2.2%B1 2.4% 0.4% 0.1% 0.2% 0.6% 2.5% 6.6% 8.2%B2 4.7% 0.2% 0.6% 1.1% 2.9% 5.7% 13.1% 19.7%B3 7.5% 0.7% 1.8% 1.3% 4.4% 9.8% 19.9% 25.7%
Caa1 - C 19.7% 6.0% 11.3% 13.0% 16.9% 24.2% 35.6% 29.7%
Moody's Rating
Default Rates 1999-2007 All
IssuersIssuers Grouped by their Ratings Gaps
*Bond dataset
Figure 15: One-Year Default Rates Conditioned on Ratings Gaps*
DDeecceemmbbeerr 22000077 MMIIRR SSttrraatteeggiieess ■■ VViieewwPPooiinnttss ■■ wwwwww..mmooooddyyss..ccoomm//mmiirr || 23
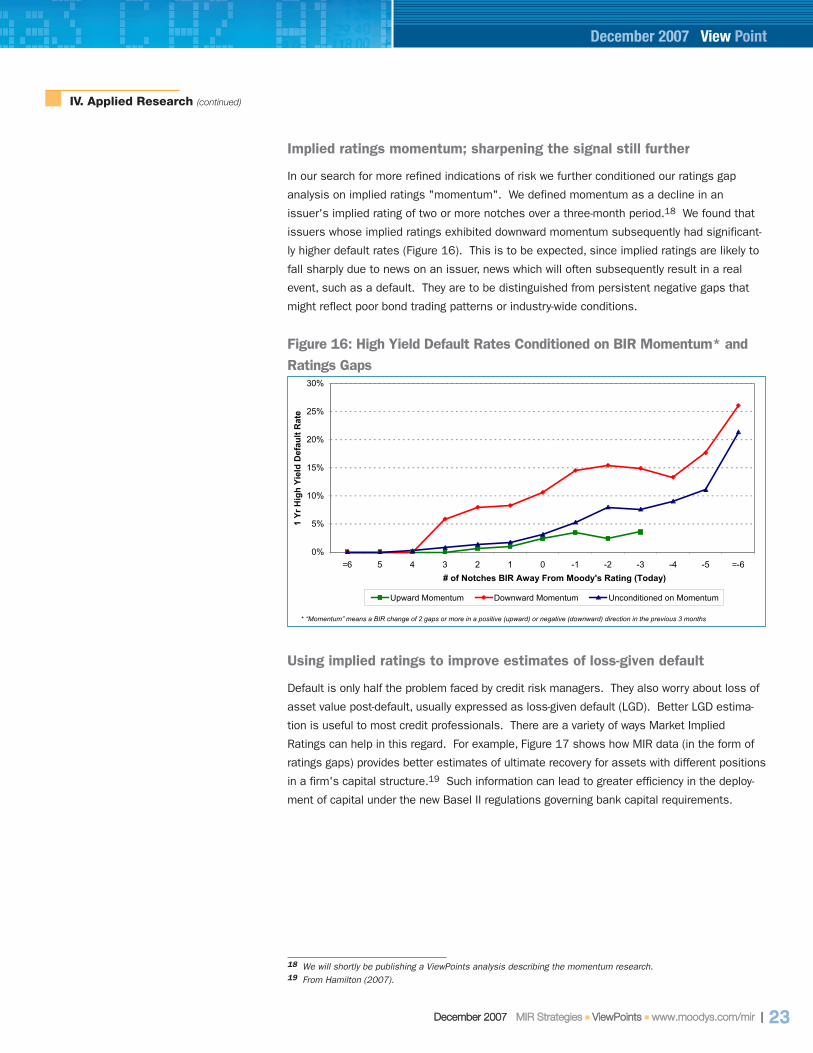
Implied ratings momentum; sharpening the signal still further
In our search for more refined indications of risk we further conditioned our ratings gap
analysis on implied ratings "momentum". We defined momentum as a decline in an
issuer's implied rating of two or more notches over a three-month period.18 We found that
issuers whose implied ratings exhibited downward momentum subsequently had significant-
ly higher default rates (Figure 16). This is to be expected, since implied ratings are likely to
fall sharply due to news on an issuer, news which will often subsequently result in a real
event, such as a default. They are to be distinguished from persistent negative gaps that
might reflect poor bond trading patterns or industry-wide conditions.
Using implied ratings to improve estimates of loss-given default
Default is only half the problem faced by credit risk managers. They also worry about loss of
asset value post-default, usually expressed as loss-given default (LGD). Better LGD estima-
tion is useful to most credit professionals. There are a variety of ways Market Implied
Ratings can help in this regard. For example, Figure 17 shows how MIR data (in the form of
ratings gaps) provides better estimates of ultimate recovery for assets with different positions
in a firm's capital structure.19 Such information can lead to greater efficiency in the deploy-
ment of capital under the new Basel II regulations governing bank capital requirements.
IV. Applied Research (continued)
December 2007 View Point
0%
5%
10%
15%
20%
25%
30%
=6 5 4 3 2 1 0 -1 -2 -3 -4 -5 =-6# of Notches BIR Away From Moody's Rating (Today)
1 Yr
Hig
h Yi
eld
Def
ault
Rat
e
Upward Momentum Downward Momentum Unconditioned on Momentum
* “Momentum” means a BIR change of 2 gaps or more in a positive (upward) or negative (downward) direction in the previous 3 months
Figure 16: High Yield Default Rates Conditioned on BIR Momentum* andRatings Gaps
18 We will shortly be publishing a ViewPoints analysis describing the momentum research.19 From Hamilton (2007).

24 || DDeecceemmbbeerr 22000077 MMIIRR SSttrraatteeggiieess ■■ VViieewwPPooiinnttss ■■ wwwwww..mmooooddyyss..ccoomm//mmiirr
Ratings change analysis
Figure 18 provides a summary of the ratings gap-conditioned transition matrices discussed
above, for the bond dataset. Each bar in the chart summarizes the ratings change experience
for all issuers with a given ratings gap state at the beginning of a 12-month cohort period.
That is, the bar labeled "0" contains all the issuers where the issuers' implied ratings were in
line with their Moody's ratings at the start of a cohort period; the bar labeled "-1" contains all
the issuers whose bond-implied rating was one notch below their Moody's ratings. And so on.
From Figure 18 it is evident that the larger the negative ratings gap at the beginning of a 12-
month period, the greater is the frequency of future downgrades.20 The opposite holds for
IV. Applied Research (continued)
December 2007 View Point
Median Excess Recovery = (Discounted Ultimate Recovery) - 1(Price at Default)
-70%
-60%
-50%
-40%
-30%
-20%
-10%
0%
10%
20%
30%
40%
Revolvers Term Loans Senior SecuredBonds
Senior UnsecuredBonds
SubordinatedBonds
Negative Gap
Non-Negative Gap
Median Excess Recovery
Figure 17: Median Excess Recovery Rates
0%
25%
50%
75%
100%
>6 5 4 3 2 1 0 -1 -2 -3 -4 -5 <-6# of Notches BIR-Implied Above Moody's Rating
Upgraded Unchanged Downgraded1 Yr Horizon
*Bond Data Set for 1/1/99 – 9/1/07
Figure 18: Moody’s Rating Change Frequency as a Function of the RatingsGap, One Year Horizon*
20 Munves and Jiang (June 2006)
DDeecceemmbbeerr 22000077 MMIIRR SSttrraatteeggiieess ■■ VViieewwPPooiinnttss ■■ wwwwww..mmooooddyyss..ccoomm//mmiirr || 25
positive ratings gaps. This reflects a simple dynamic. News that significantly affects
investors' perceptions of an issuer's future performance is instantaneously reflected in the
market trading levels of its securities. This causes a gap to open between the trading level
suggested by the issuer's Moody's rating, and the actual trading level. If the news is per-
ceived as bad, then the gap will be negative. In most cases the Moody's analyst responsi-
ble for the issuer will also be aware of the news. And if subsequent analysis confirms that it
indeed signals a weakening of the issuer's credit standing, then the rating will be lowered.
But there is naturally a time lag, and that is what causes the perception, borne out by the
data, that Moody's is often "catching up" with the market. Moody's goal of ratings stability,
something that has been endorsed over the years by investors, adds to this.
A final note is that we can expect that the worse the news for a company's outlook, the larg-
er the negative gap should be, since the trading levels of its bonds and CDS will be more
negatively impacted. This gradation of severity shows up in the greater downgrade rate for
issuers with larger negative gaps. From this we can conclude that the Moody's analysts are
drawing the same conclusions from the market-implied ratings information.
Relative value analysis
The Market Implied Ratings data also has relative value applications. That is, it can help
investors select assets with superior chances of outperforming the broad market (often rep-
resented by a bond or CDS index), while identifying those with a greater risk of underperfor-
mance. As noted earlier, the key point here is that bond- and CDS-implied ratings are deter-
mined with reference to market-wide credit curves, which are updated daily. A general
spread widening pushes the curves out, of course. So if an issuer's implied rating falls, it
means that its spread has risen by an amount in excess of the general market movement.
A rise in an implied rating signals the opposite.
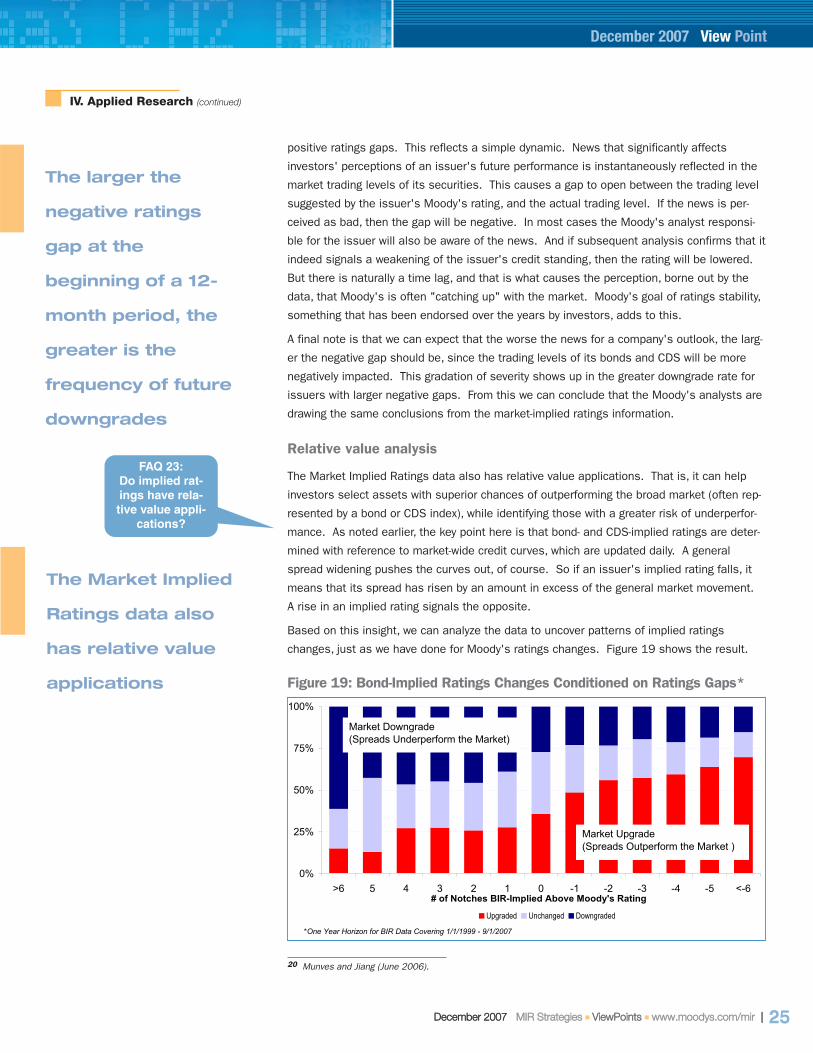
Based on this insight, we can analyze the data to uncover patterns of implied ratings
changes, just as we have done for Moody's ratings changes. Figure 19 shows the result.
IV. Applied Research (continued)
The larger the
negative ratings
gap at the
beginning of a 12-
month period, the
greater is the
frequency of future
downgrades
December 2007 View Point
20 Munves and Jiang (June 2006).
The Market Implied
Ratings data also
has relative value
applications
0%
25%
50%
75%
100%
>6 5 4 3 2 1 0 -1 -2 -3 -4 -5 <-6# of Notches BIR-Implied Above Moody's Rating
Upgraded Unchanged Downgraded
Market Downgrade(Spreads Underperform the Market)
Market Upgrade(Spreads Outperform the Market )
*One Year Horizon for BIR Data Covering 1/1/1999 - 9/1/2007
Figure 19: Bond-Implied Ratings Changes Conditioned on Ratings Gaps*
FAQ 23:Do implied rat-ings have rela-tive value appli-
cations?
26 || DDeecceemmbbeerr 22000077 MMIIRR SSttrraatteeggiieess ■■ VViieewwPPooiinnttss ■■ wwwwww..mmooooddyyss..ccoomm//mmiirr
As in Figure 18, each bar summarizes the transition matrix for that ratings gap state - the
difference is that the changes are for implied ratings (i.e., market trading levels), rather than
for Moody's ratings. We can see that the implied ratings increase with greater frequency as
the ratings gaps become more negative. The opposite holds for positive ratings gaps.
What lies behind these patterns? Let's take the example of the trading pattern of issuers
with implied ratings that are below their Moody's ratings. These are viewed as "cheap" by
the market, usually because of perceived negative news about the issuers. Often, the mar-
ket's fears are not borne out. In such cases, investors will buy the cheap assets, causing
their prices to increase. This happens at a rate above and beyond the movements of the
broad market, and is captured in a rise in the issuers' implied ratings. The opposite hap-
pens when the assets become too expensive. Repeating the now-familiar pattern, the
greater the gap, the more significant the subsequent move, in this case the change in the
relative trading level of the bond or credit default swap. Investors can therefore use Market
Implied Ratings to identify overbought and oversold situations for further analysis and
action, as appropriate.
Portfolio construction and analysis
How to maximize portfolio returns per unit of risk (i.e., portfolio return volatility) is the main
goal of fund managers. This is well-plowed ground -- each fund management group has its
own investment process, buttressed by a broad array of quantitative models - but the
Market Implied Ratings dataset is new to most investors. Thus, together with the conclu-
sions from relevant analytical studies, the MIR platform provides a fresh way to analyze risk
and opportunity.
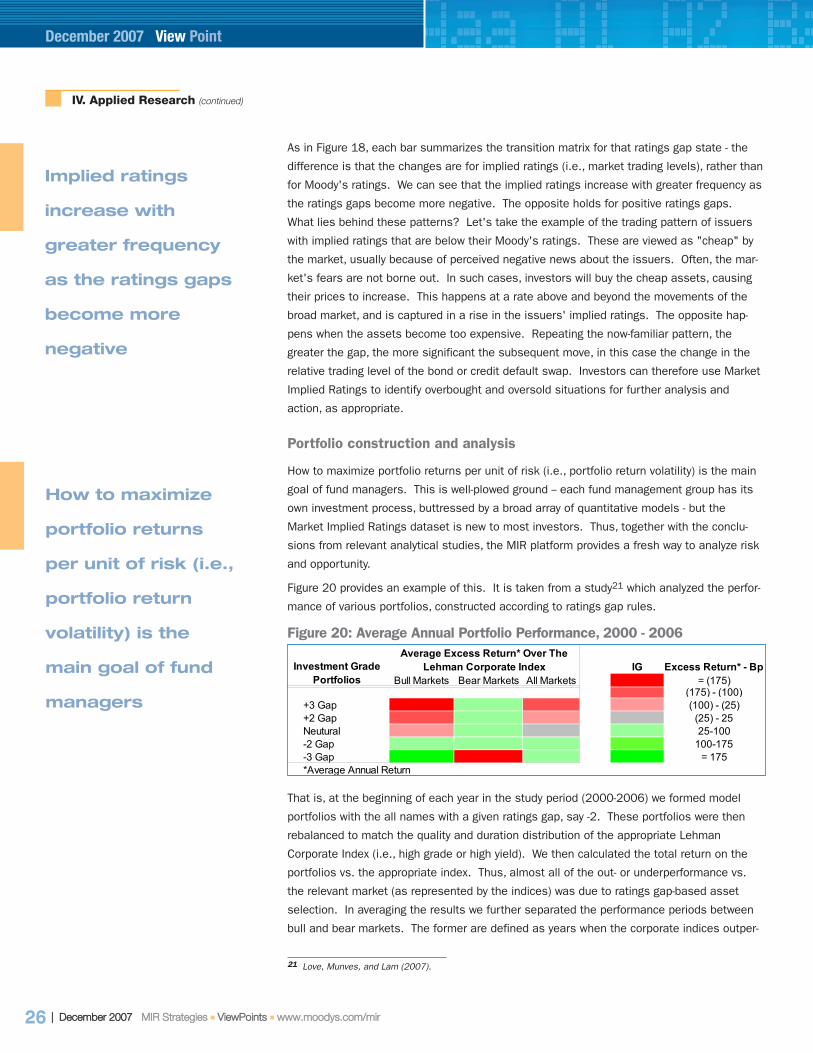
Figure 20 provides an example of this. It is taken from a study21 which analyzed the perfor-
mance of various portfolios, constructed according to ratings gap rules.
That is, at the beginning of each year in the study period (2000-2006) we formed model
portfolios with the all names with a given ratings gap, say -2. These portfolios were then
rebalanced to match the quality and duration distribution of the appropriate Lehman
Corporate Index (i.e., high grade or high yield). We then calculated the total return on the
portfolios vs. the appropriate index. Thus, almost all of the out- or underperformance vs.
the relevant market (as represented by the indices) was due to ratings gap-based asset
selection. In averaging the results we further separated the performance periods between
bull and bear markets. The former are defined as years when the corporate indices outper-
IV. Applied Research (continued)
Implied ratings
increase with
greater frequency
as the ratings gaps
become more
negative
December 2007 View Point
How to maximize
portfolio returns
per unit of risk (i.e.,
portfolio return
volatility) is the
main goal of fund
managers
21 Love, Munves, and Lam (2007).
IG Excess Return* - BpBull Markets Bear Markets All Markets = (175)
(175) - (100)+3 Gap (100) - (25)+2 Gap (25) - 25Neutural 25-100-2 Gap 100-175-3 Gap = 175*Average Annual Return
Investment Grade Portfolios
Average Excess Return* Over The Lehman Corporate Index
Figure 20: Average Annual Portfolio Performance, 2000 - 2006
DDeecceemmbbeerr 22000077 MMIIRR SSttrraatteeggiieess ■■ VViieewwPPooiinnttss ■■ wwwwww..mmooooddyyss..ccoomm//mmiirr || 27
formed the government markets on a total return basis, while the latter are the years of
underperformance. Figure 20 shows that portfolios made up of investment grade entities
with bond-implied ratings gaps of -2 outperformed the Lehman Investment Grade Corporate
Index on a consistent basis, regardless of market direction. The picture is more mixed for
the other ratings gap-based portfolios, with market direction playing strong role in determin-
ing which strategies were successful. This is less daunting than it sounds; most portfolio
managers have well-formed market views, and construct their portfolios accordingly.
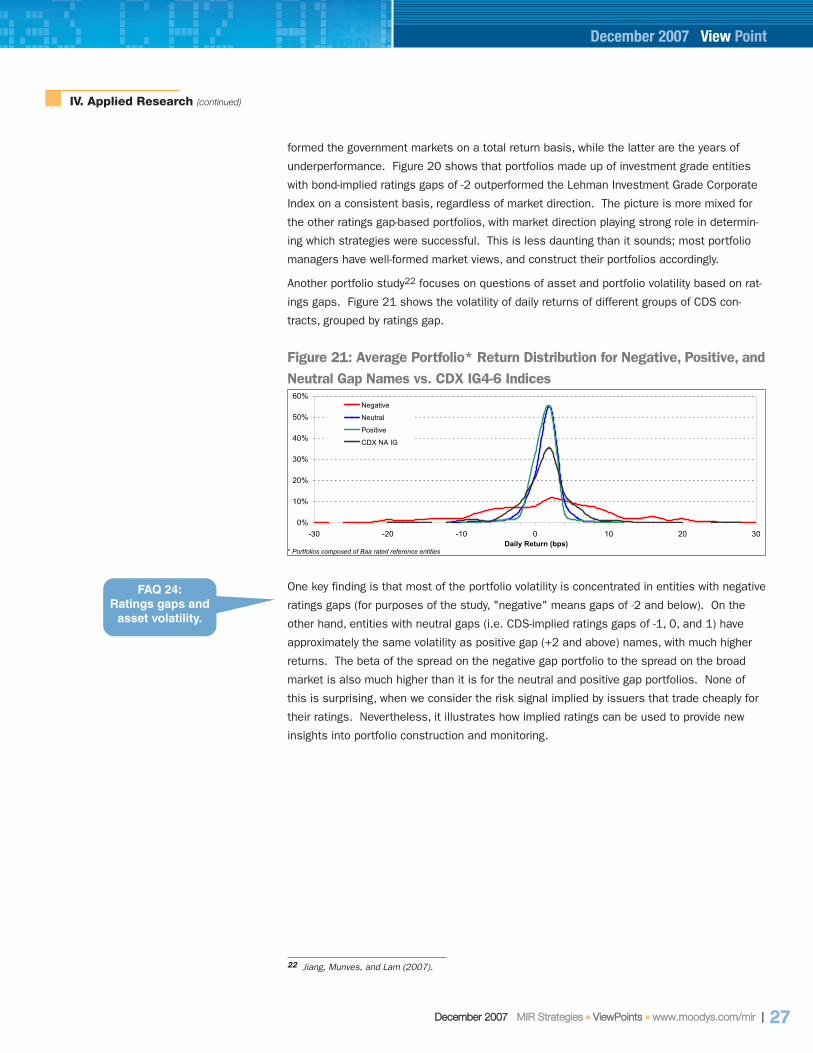
Another portfolio study22 focuses on questions of asset and portfolio volatility based on rat-
ings gaps. Figure 21 shows the volatility of daily returns of different groups of CDS con-
tracts, grouped by ratings gap.
One key finding is that most of the portfolio volatility is concentrated in entities with negative
ratings gaps (for purposes of the study, "negative" means gaps of -2 and below). On the
other hand, entities with neutral gaps (i.e. CDS-implied ratings gaps of -1, 0, and 1) have
approximately the same volatility as positive gap (+2 and above) names, with much higher
returns. The beta of the spread on the negative gap portfolio to the spread on the broad
market is also much higher than it is for the neutral and positive gap portfolios. None of
this is surprising, when we consider the risk signal implied by issuers that trade cheaply for
their ratings. Nevertheless, it illustrates how implied ratings can be used to provide new
insights into portfolio construction and monitoring.
IV. Applied Research (continued)
December 2007 View Point
22 Jiang, Munves, and Lam (2007).
0%
10%
20%
30%
40%
50%
60%
3020100-10-20-30Daily Return (bps)
Negative
Neutral
Positive
CDX NA IG
* Portfolios composed of Baa rated reference entities
Figure 21: Average Portfolio* Return Distribution for Negative, Positive, andNeutral Gap Names vs. CDX IG4-6 Indices
FAQ 24:Ratings gaps and
asset volatility.
28 || DDeecceemmbbeerr 22000077 MMIIRR SSttrraatteeggiieess ■■ VViieewwPPooiinnttss ■■ wwwwww..mmooooddyyss..ccoomm//mmiirr
Using Market Implied Ratings for asset selection
Last but not least, we consider how investors can use MIR data to aid in their asset selec-
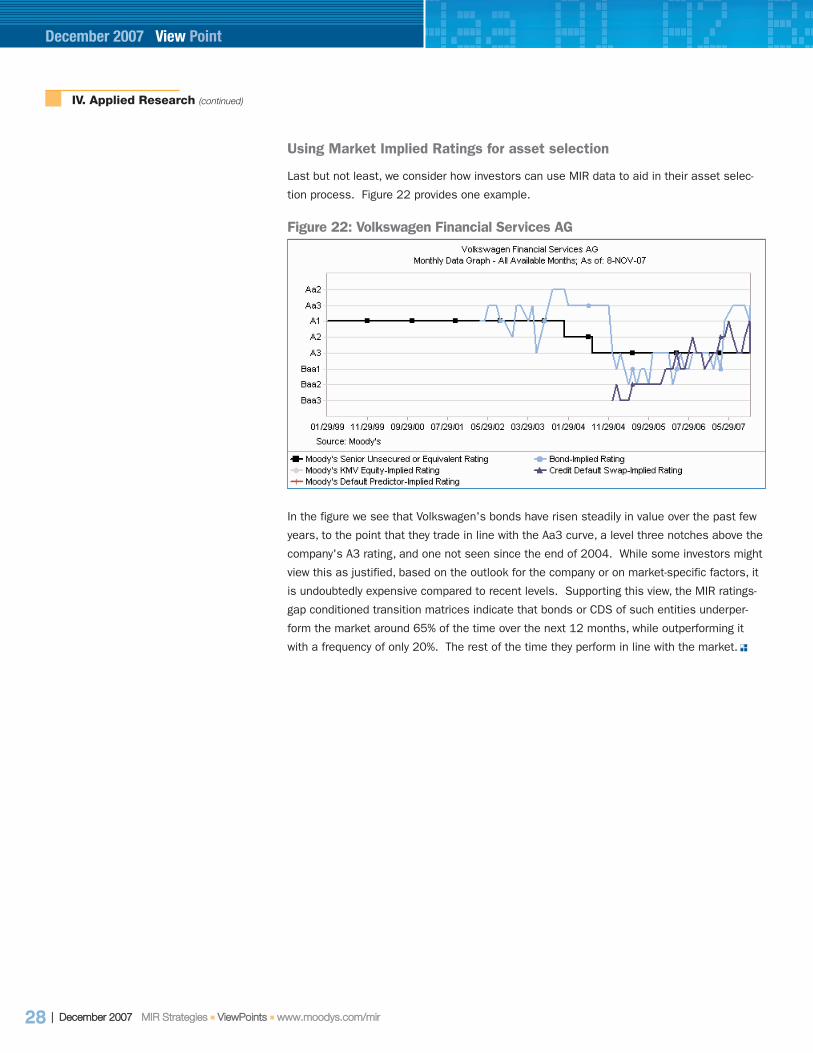
tion process. Figure 22 provides one example.
In the figure we see that Volkswagen's bonds have risen steadily in value over the past few
years, to the point that they trade in line with the Aa3 curve, a level three notches above the
company's A3 rating, and one not seen since the end of 2004. While some investors might
view this as justified, based on the outlook for the company or on market-specific factors, it
is undoubtedly expensive compared to recent levels. Supporting this view, the MIR ratings-
gap conditioned transition matrices indicate that bonds or CDS of such entities underper-
form the market around 65% of the time over the next 12 months, while outperforming it
with a frequency of only 20%. The rest of the time they perform in line with the market.
IV. Applied Research (continued)
December 2007 View Point
Figure 22: Volkswagen Financial Services AG

Appendix I: Currency Swap Calculation
DDeecceemmbbeerr 22000077 MMIIRR SSttrraatteeggiieess ■■ VViieewwPPooiinnttss ■■ wwwwww..mmooooddyyss..ccoomm//mmiirr || 29
The conversion to U.S. dollars for bonds and credit default swaps
If exchange rates were fixed, the yield for a corporate bond seen by investors around the
world should be the same. The spread over the benchmarks would differ but only because
the yield on the benchmarks would vary. Unfortunately, exchange rates change continuous-
ly over time. A US-based investor has to convert each of the bond's cash flows differently
using both the current exchange rate and exchange rate futures. Investors from different
countries will therefore see and receive different yields from investments in the same bond
issue. To calculate the yield in the non-U.S. currency, one uses the standard equation:
(A1)
To calculate the yield in US dollars, one must adjust each cash flow with the appropriate for-
ward exchange rate:
(A2)
where S0 is the current exchange rate and Ft is appropriate forward exchange rate. To cal-
culate the forward exchange rates, we can use interest parity with the underlying govern-
ment bonds to create a synthetic currency swap.
(A3)
Combining the previous terms, if interest rate curves are flat, the yield in non-U.S. curren-
cies is related to that in the U.S. currency by
(A4)
With this equation in hand, we use a common but imperfect shortcut in the bond-implied
ratings dataset to convert the spread on non-US dollar bonds to a dollar basis. Instead of
using the Treasure interest rate curves, we use the swap rate curves as an approximation
of the average interest rate over the maturity of the bond and assume that the interest rate
curves are flat. This allows us to use Equation (A4) directly. The swap rates assume an
exchange of fixed cash payments and so it is only the existence of the principle payment at
maturity that requires an assumption of flat interest rate term structures.
The two main advantages to this method are (1) it allows us to use the relatively more reli-
able swap rate quotes instead of interest rate quotes and (2) the approximation works as
well for callable and other non-standard bonds as it does for bullet bonds. The main draw-
back is that there is a small bias incurred due to differences in the interest rate term struc-
tures. Specifically, if the U.S. interest curve is rising faster (slower) with maturity than the
foreign curve, our estimate will be slightly low (high). This bias has typically been a few
basis points at most.
rr
yy SUSU +
++=+
11
*)1(1
t
t
tSUt
rr
SF
⎟⎟⎠
⎞⎜⎜⎝
⎛+
+=
1
1 ,
0
++
+=
couponst
SU
tT
SU
TSU y
FcyF
)1(
)1( 100Price S ..0
++
+=
couponstT y
cy )1()1(
100Price
Appendix I: Currency Swap Calculation
December 2007 ViewPoints
30 || DDeecceemmbbeerr 22000077 MMIIRR SSttrraatteeggiieess ■■ VViieewwPPooiinnttss ■■ wwwwww..mmooooddyyss..ccoomm//mmiirr
An issuer's senior unsecured rating or its equivalent is a key component of the Market
Implied Ratings product. Determining the rating would seem to be a straightforward
process. Unfortunately, it is not. Mainly, it is complicated by the complexities of many
issuers' capital structures and the varying characteristics of bond issues.
The Senior Ratings Algorithm
The Senior Ratings Algorithm (SRA) lies at the heart of the process of determining an
issuer's MIR senior unsecured rating or equivalent.23 The SRA operates as a two-step
process for a given issuer. The steps are (1) the selection of the reference rating; and (2)
the transformation of the reference rating into the issuer's unsecured or equivalent rating.
This transformation is achieved through the process of notching.24
Reference rating selection
We first tackle the identification of the reference rating. The reference rating can be a debt
obligation rating or an enterprise level rating (such as a corporate family rating). For each
issuer, we consult a priority table to determine its highest ranked rated debt issue or enter-
prise level rating. Please see Figure 1 for the current table. As its name suggests, the
table prioritizes obligation and enterprise level ratings by their class and seniority.
Observant readers will note that the priority ranking in Figure 1 does not follow the order of
priority in a typical issuer's capital structure. Readers will also note that the priority options
the table include different types of ratings -- issuer ratings, corporate family ratings (CFRs),
and bond level ratings.
For example, let's take a high yield issuer with a senior unsecured bond rating and a corpo-
rate family rating. According to Figure 1, the senior unsecured rating (Priority 2) would
become the reference rating, rather than the Corporate Family Rating (Priority 7). This high-
lights a common area of confusion regarding "reference ratings", as the term is used in the
Senior Rating Algorithm; the reference rating for the SRA is not necessarily the benchmark
Moody's rating associated with an issuer. Since our example involves a high yield issuer,
the benchmark rating would be the corporate family rating, which is distinct from the senior
unsecured rating providing the reference rating.
The foregoing paragraphs cover the main points around the determination of the reference
rating, and suffice for most issuers. But for the sake of completeness, there are two other
aspects of determining reference ratings that deserve mention.
Appendix II: Deriving Moody's Issuer Level SeniorUnsecured Ratings or their Equivalent
Appendix II: Deriving Moody's Issuer Level Senior Unsecured Ratings or their Equivalent
December 2007 ViewPoints
The Senior Ratings
Algorithm (SRA)
lies at the heart of
the process of
determining an
issuer's MIR senior
unsecured rating
or equivalent
23 For details on the SRA methodology, see Hamilton (July 2005).24 The term "notching" is used by rating agencies to refer to the practice of adjusting ratings to account for factorssuch as the seniority and security of the obligations. (For the uninitiated, a "notch" is a rating level - so the differencebetween A2 and A3 is one notch.) A common use of notching is to make expected loss distinctions across the hierar-chical debt classes within an issuer's capital structure

DDeecceemmbbeerr 22000077 MMIIRR SSttrraatteeggiieess ■■ VViieewwPPooiinnttss ■■ wwwwww..mmooooddyyss..ccoomm//mmiirr || 31
The first concerns situations where the highest ranking debt class is issue-based, and there
is more than one security in it. In that case we need to determine which single issue will
become the reference bond. We do so by applying the following rules:
Bonds without backing by other entities receive higher priority
Bonds with only one issuer (i.e. without joint responsibility for the obligation from two or
more entities) receive higher priority
The lowest rated issue in the asset class receives higher priority
Finally, if the selection cannot be made on the foregoing three criteria, then an issue with-
in the highest ranked debt class is selected at random
A second issue concerns domestic vs. foreign currency ratings. In some cases, the SRA
calls for the calculation of two rating histories for each issuer, one using foreign currency rat-
ings and one using domestic currency ratings. Foreign currency ratings receive the highest
priority and are most often used. However, in order to derive as long a rating history as pos-
sible, domestic currency ratings are used for emerging market issuers when necessary.25
Step 2; determining the senior unsecured rating by notching from thereference rating
Once the reference bond or asset class is determined (its Moody's rating is already known, of
course), the second step is to calculate the issuer's senior unsecured equivalent rating from the
Senior Unsecured Ratings Lookup Matrix, shown in Figure 2. The matrix reflects the process
of notching from the reference rating in order to arrive at the issuer's senior unsecured rating.26
To start with the obvious, senior unsecured bond ratings require no notching, since we are
seeking to determine an issuer's senior unsecured rating. Similarly, as they represent a
firm's senior unsecured credit risk, issuer ratings are not adjusted either. Other reference
ratings, which reflect expected differences in loss given default due to their position in a
firm's capital structure or collateral, must be notched either up or down. Let's take one
example of each situation.
Appendix II (continued)
December 2007 View Point
25 Differences between foreign and domestic currency ratings have diminished since 2001 when Moody's began toloosen its sovereign ceiling ratings policy. See Levey and Truglia (June 2001).26 Before 2000, the Moody's notching table was built based on judgmental experience. Since 2000, Moody's hasrevised the methodology to determine the notching magnitude in terms of the relative expected loss of individual debt withrespect to the benchmark debt. For detailed notching guidelines, readers are referred to the following Special Comments:
Notching for Differences in Priority of Claims and Integration of the Preferred Stock Rating Scale, November 2000.Summary Guidance for Notching Secured Bonds, Subordinated Bonds, and Preferred Stock of Corporate Issuers,
September 2001.Updated Summary Guidance for Notching Bonds, Preferred Stocks and Hybrid Securities of Corporate Issuers,
February 2007.
Priority Debt Class Priority Debt Class
1 Issuer Ratings 9 Subordinated Bond Ratings
2 Senior Unsecured Bond Ratings 10 Junior Subordinated Bond Ratings
3 Senior Unsecured MTN and Shelf Ratings 11 Senior Secured Bond Ratings
4 OSO Ratings 12 Senior Secured Loan Ratings
5 Insurance Financial Strength Ratings 13 Security Deposit Ratings
6 Senior Unsecured Loan Ratings 14 Bank Note Ratings
7 Corporate Family Ratings 15 Preferred Stock Ratings
8 Senior Subordinated Bond Ratings
Figure 1: Priority Rankings for Reference Obligations or Enterprise Levels
FAQ 27:Do we use
domestic or for-eign currency
ratings?
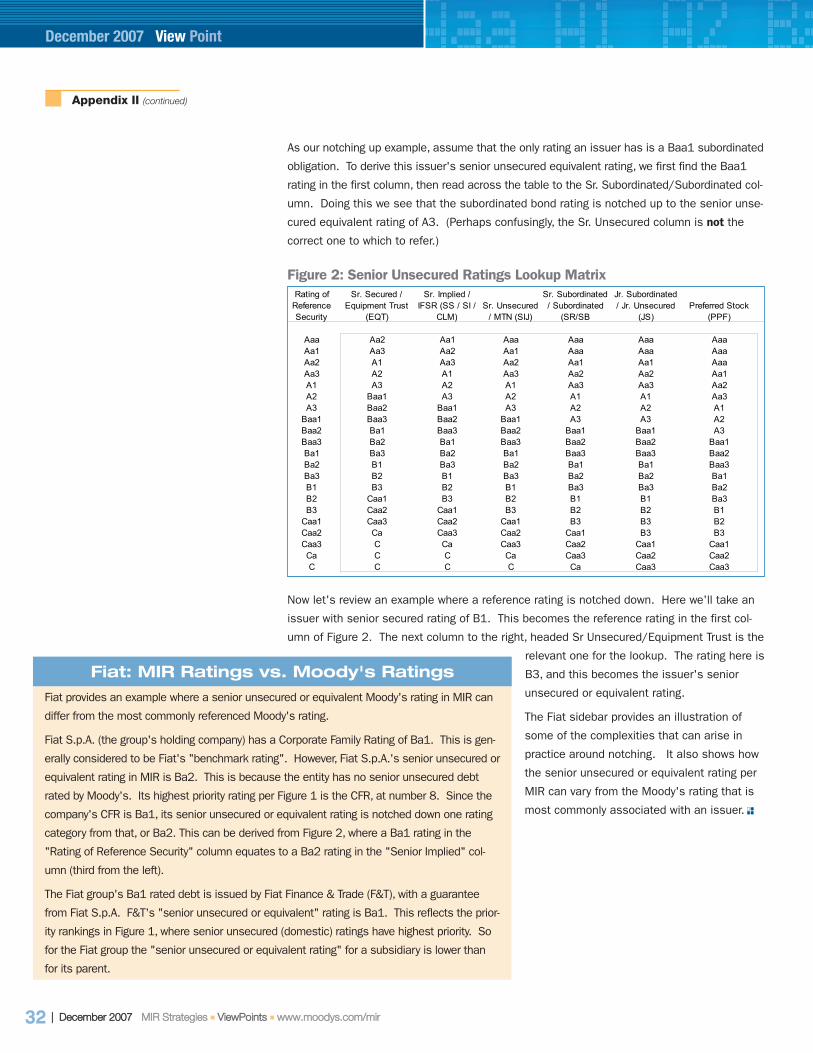
32 || DDeecceemmbbeerr 22000077 MMIIRR SSttrraatteeggiieess ■■ VViieewwPPooiinnttss ■■ wwwwww..mmooooddyyss..ccoomm//mmiirr
As our notching up example, assume that the only rating an issuer has is a Baa1 subordinated
obligation. To derive this issuer's senior unsecured equivalent rating, we first find the Baa1
rating in the first column, then read across the table to the Sr. Subordinated/Subordinated col-
umn. Doing this we see that the subordinated bond rating is notched up to the senior unse-
cured equivalent rating of A3. (Perhaps confusingly, the Sr. Unsecured column is not the
correct one to which to refer.)
Now let's review an example where a reference rating is notched down. Here we'll take an
issuer with senior secured rating of B1. This becomes the reference rating in the first col-
umn of Figure 2. The next column to the right, headed Sr Unsecured/Equipment Trust is the
relevant one for the lookup. The rating here is
B3, and this becomes the issuer's senior
unsecured or equivalent rating.
The Fiat sidebar provides an illustration of
some of the complexities that can arise in
practice around notching. It also shows how
the senior unsecured or equivalent rating per
MIR can vary from the Moody's rating that is
most commonly associated with an issuer.
Appendix II (continued)
December 2007 View Point
Rating of Reference Security
Sr. Secured / Equipment Trust
(EQT)
Sr. Implied / IFSR (SS / SI /
CLM)Sr. Unsecured
/ MTN (SIJ)
Sr. Subordinated / Subordinated
(SR/SB
Jr. Subordinated / Jr. Unsecured
(JS)Preferred Stock
(PPF)
Aaa Aa2 Aa1 Aaa Aaa Aaa AaaAa1 Aa3 Aa2 Aa1 Aaa Aaa AaaAa2 A1 Aa3 Aa2 Aa1 Aa1 AaaAa3 A2 A1 Aa3 Aa2 Aa2 Aa1A1 A3 A2 A1 Aa3 Aa3 Aa2A2 Baa1 A3 A2 A1 A1 Aa3A3 Baa2 Baa1 A3 A2 A2 A1
Baa1 Baa3 Baa2 Baa1 A3 A3 A2Baa2 Ba1 Baa3 Baa2 Baa1 Baa1 A3Baa3 Ba2 Ba1 Baa3 Baa2 Baa2 Baa1Ba1 Ba3 Ba2 Ba1 Baa3 Baa3 Baa2Ba2 B1 Ba3 Ba2 Ba1 Ba1 Baa3Ba3 B2 B1 Ba3 Ba2 Ba2 Ba1B1 B3 B2 B1 Ba3 Ba3 Ba2B2 Caa1 B3 B2 B1 B1 Ba3B3 Caa2 Caa1 B3 B2 B2 B1
Caa1 Caa3 Caa2 Caa1 B3 B3 B2Caa2 Ca Caa3 Caa2 Caa1 B3 B3Caa3 C Ca Caa3 Caa2 Caa1 Caa1Ca C C Ca Caa3 Caa2 Caa2C C C C Ca Caa3 Caa3
Figure 2: Senior Unsecured Ratings Lookup Matrix
Fiat: MIR Ratings vs. Moody's Ratings
Fiat provides an example where a senior unsecured or equivalent Moody's rating in MIR can
differ from the most commonly referenced Moody's rating.
Fiat S.p.A. (the group's holding company) has a Corporate Family Rating of Ba1. This is gen-
erally considered to be Fiat's "benchmark rating". However, Fiat S.p.A.'s senior unsecured or
equivalent rating in MIR is Ba2. This is because the entity has no senior unsecured debt
rated by Moody's. Its highest priority rating per Figure 1 is the CFR, at number 8. Since the
company's CFR is Ba1, its senior unsecured or equivalent rating is notched down one rating
category from that, or Ba2. This can be derived from Figure 2, where a Ba1 rating in the
"Rating of Reference Security" column equates to a Ba2 rating in the "Senior Implied" col-
umn (third from the left).
The Fiat group's Ba1 rated debt is issued by Fiat Finance & Trade (F&T), with a guarantee
from Fiat S.p.A. F&T's "senior unsecured or equivalent" rating is Ba1. This reflects the prior-
ity rankings in Figure 1, where senior unsecured (domestic) ratings have highest priority. So
for the Fiat group the "senior unsecured or equivalent rating" for a subsidiary is lower than
for its parent.

Appendix III: Calculation of Bond-implied Rating Median Credit Spreads and Credit Curve Construction
DDeecceemmbbeerr 22000077 MMIIRR SSttrraatteeggiieess ■■ VViieewwPPooiinnttss ■■ wwwwww..mmooooddyyss..ccoomm//mmiirr || 33
Appendix III: Calculation of Bond-implied Rating MedianCredit Spreads and Credit Curve Construction
December 2007 ViewPoints
Calculating option-adjusted spreads
Approximately five percent of the bonds used for MIR have embedded options (such as
calls). The market uses two methods for estimating the credit risk of these bonds that
removes the influence of the embedded options on the bonds yield. One is to use a spread
for a hypothetical bond where the option has been removed - the option-adjusted spread
(OAS). It is measured by the current spread over the benchmark minus that component of
the spread that is attributable to the cost of the embedded options.
The other is to assume the bond will be called at the worst possible time for the debt
investor in terms of total return - the spread to worst. We use a weighted average of the two
methods in an effort to follow market standards. Several sources state that bonds are likely
to be called if their yield to maturity is less than available market yields. We formalize this
with the following rules: If the dirty price of the bond is $102 or greater, spread-to-worst is
used. If it is $98 or less, the option-adjusted spread is used. A smooth, linear transition is
used for values in between. The smooth transition is intended to avoid jumps in the market
implied ratings not due to truly discrete changes in the bonds' risk profiles.
Calculating median credit spreads
The median MIR credit spreads are intended to represent the spread on a typical bond at a
company not experiencing a current credit-related event. The first step, then, is to limit the
data set to bonds of issuers who are not on Moody's Watchlist. Because bonds in the
Asian-Pacific rim countries appear to be priced much higher than expected given their credit
risk and comprise a small portion of the data set overall, bonds from these countries and
bonds denominated in yen and Australian dollars are also removed during the calculation of
median spreads.
After filtering, each issue is sorted into ratings-based groups, or buckets. The groups are
Aaa, Aa, A, Baa, Ba, B1, B2, B3, Caa1, and Caa2 and below. Prior to June 2004, B1, B2,
and B3 are collapsed into the broad B category and Caa1 is absorbed by the Caa2 and
below category (Aaa, Aa, A, Baa, Ba, B, Caa and below}.
For each group we calculate the median credit spread curves in two steps: first by calculat-
ing medians by rating and duration, and second by the fitting of power curves.27 The medi-
ans focus the results on representative (median) observations, while the curve-fitting
process smoothes the output.28
For each bucket we begin the curve-building process by taking the 51 securities with the
shortest durations. From this we obtain a single datapoint, or observation, which represents
the median spread (on the Y axis of the curve graph) and the median duration (plotted on
27 We use duration instead of maturity because we have noted an empirical relationship between coupon rate andspread. Bonds with larger coupon rates are found to have larger spreads, even in cases where everything else is thesame including issuer and maturity. We inferred that the extra spread was due to the higher exposure to interest raterisk, not higher exposure to credit risk.28 The smoothing is similar to spline methods and the Nelson-Siegal methods.

34 || DDeecceemmbbeerr 22000077 MMIIRR SSttrraatteeggiieess ■■ VViieewwPPooiinnttss ■■ wwwwww..mmooooddyyss..ccoomm//mmiirr
the X axis). We then drop the shortest duration bond and add the next longest duration
bond, and calculate a second observation. The process is repeated, moving out the duration
curve, until we have included all the bonds in the group, except the 25 with the shortest
durations and the 25 with the longest durations.
In some instances we have found that the ratings-based buckets are thinly populated, and
the small number of bonds means that we end up with fewer than 100 total observations.
In such cases the small number of observations means that the credit curve for the bucket
is not well estimated. So we take an alternative approach to plot the curve, one using a
non-linear regression.
A final note is that we have experimented with different observation group sizes (i.e., bigger
and smaller than 51 bonds), and the results were unaffected. We have also experimented
with requiring issuers to only appear once in each 51-security group, but the results were
also unaffected.
We have to make a further adjustment for the buckets that represent broad rating cate-
gories. For them, we need to take into account the breakdown of a bucket's population by
alphanumeric rating category. Let's take the Aa bucket as an example, and assume that
one 51-bond duration-based group has 10 Aa1s, 11 Aa2s, and 30 Aa3s. In other words,
it's overweight Aa3 rated entities. In this case we would use the 16th observation, which
corresponds to the mid-point of the three fine rating category samples, rather than the 26th
observation, which would be the standard median.
Finally, we must address how we derive curves for alphanumeric rating categories (e.g., A1,
A2, A3) when we have only calculated curves for a broad rating category (e.g., single-A). In
such cases, we interpolate the alphanumeric curves using an exponential formula. For
example, to determine the A3 curve, we would use the formula
Ln(A3) = 2/3 Ln(A2) + 1/3Ln(Baa2)We use natural logs because the distance between credit curves grows exponentially as you
move down the credit spectrum.
Curve transformations and refinements
The power curve has two degrees of freedom and provides for upward or downward sloping
curves. It does not allow for humps in the spread term structure, but we have not found
humped behavior in our spread series, probably because we focus on durations greater than
one year. The equation for a power curve is:
This equation can be linearized and estimated using ordinary least squares in the following form:
The process starts with the Aa rating category because the Aaa category typically has very
few observations. The Aaa category is then calculated and restricted to fall below the Aa
++= )( )()( DurationLnLnSpreadLn
DurationSpread =
Appendix III (continued)
December 2007 View Point

DDeecceemmbbeerr 22000077 MMIIRR SSttrraatteeggiieess ■■ VViieewwPPooiinnttss ■■ wwwwww..mmooooddyyss..ccoomm//mmiirr || 35
rating category. After that, the other rating categories are estimated in sequence moving
down the rating scale. If the curve does not overlap with the preceding curve, no adjust-
ments are made. If the curve crosses the preceding curve moving downwards prior to a 15-
year duration, the curve is constrained to cross at 15 years while still minimizing the sum of
squared errors. If the curve crosses the preceding curve moving upwards, Ln( ) is con-
strained to be a certain distance higher than that of the previous curve and is adjusted to
minimize the sum of squared errors. These constraints to prevent curves crossing are nec-
essary for the proper function of the product.
Median credit spreads by maturity are calculated by assuming that the median spreads by
duration were created using bonds priced at par. Combining the equations for par coupon
bonds and that for calculating yields leads to a numerically calculable solution.
Appendix III (continued)
December 2007 View Point

VIII. References
VIII. References
36 || DDeecceemmbbeerr 22000077 MMIIRR SSttrraatteeggiieess ■■ VViieewwPPooiinnttss ■■ wwwwww..mmooooddyyss..ccoomm//mmiirr
December 2007 ViewPoints
Crosbie and Bohn (2003), "Modeling Default Risk" (Moody's KMV publication)
Fons, J.S., Viswanathan, J., (December 2004), "A User's Guide to Moody's Default Predictor
Model: An Accounting Ratio Approach", (Moody's Special Comments, Global Credit
Research, Moody's Investors Service)
Fons, J., Woolley, M., (June 2007), "Moody's Default Predictor: An Update", Moody's Special
Comments, (Global Credit Research, Moody's Investors Service)
Dwyer, D., and Qu, S. (2007), "EDF 8.0 Model Enhancements" (Moody's KMV publication)
Hamilton, D. T., (July 2005) ,"Moody's Senior Ratings Algorithm & Estimated Senior
Ratings", (Global Credit Research, Moody's Investors Service)
Hamilton, D. T., (2007) ,"Using Market Implied Ratings to Enhance Recovery in Default",
(ViewPoints publication, Moody's Credit Strategy Group)
Hamilton, D. T., Cantor, R. , (February 2004), "Rating Transitions and Defaults Conditional on
Watchlist, Outlook and Rating History," (Global Credit Research, Moody's Investors Service).
Republished in Hamilton, D. T., Cantor R.,( September 2004), "Rating Transition and Default
Rates Conditioned on Outlooks," (Journal of Fixed Income)
Hamilton, D. T., Varma, P., (January 2005), "Default and Recovery Rates of Corporate Bond
Issuers," (Global Credit Research, Moody's Investors Service)
Korablev, I., and Dwyer, D. (2007), "Power and Level Validation of Moody's KMV EDF Credit
Measures in North America, Europe, and Asia" (Moody's KMV publication)
Levey, D., V. Truglia, (June 2001) "Revised Country Ceiling Policy", (Global Credit Research,
Moody's Investors Service)
Love, M., Munves, D., and Lam, C. (July, 2007),"Bond-Implied Ratings: A New Framework for
Portfolio Optimization", (ViewPoints publication, Moody's Credit Strategy Group)
Munves, D., and Jiang, S. (June, 2006), "Ratings Gaps Across Models and Their
Significance in Ratings Change Analysis", (Moody's Credit Strategy Group).
Munves, D., Jiang, S., and Lam, C. (August, 2006), "Ratings Default Rates Conditioned on
Market Implied Ratings; A Cross-Model Analysis" (Moody's Credit Strategy Group publication)

DDeecceemmbbeerr 22000077 MMIIRR SSttrraatteeggiieess ■■ VViieewwPPooiinnttss ■■ wwwwww..mmooooddyyss..ccoomm//mmiirr || 37
1. What are market-implied ratings? p.3
2. Are market-implied ratings used by Moody's ratings analysts? p.3
3. How do clients get access to MIR? p.4
4. What's a ratings gap? p.5
5. Does MIR isolate issuer-specific changes in value? p.5
6. Is MIR a global product? p.6
7. Why don't you have regional versions of MIR? p.6
8. How does MIR handle non-US dollar assets? p.7 and Appendix I
9. How much data scrubbing do you do? p.8
10. What criteria determine the bonds included in MIR? p.9
11. What is the source of your bond price information? p.11
12. How often are the implied ratings and credit curves updated? p.12
13. How do we determine the border between median credit spread bands? p.12
14. How do we adjust for bond maturities when calculating implied ratings? p.13
15. How do we calculate bond issuer-level implied ratings? p.13
16. How volatile are market-implied ratings? p.13
17. Why do we only use 5-year CDS? p.15
18. What is the source of our CDS pricing? p.15
19. How do we map from EDFs to equity-implied ratings? p.16
20. Which financial ratios underlie the MDP model? p.20
21. How can an issuer's MDP-IR be higher than the underlying ratios? p.20
22. What's a ratings gap-conditioned transition matrix? p.21
23. Do implied ratings have relative value applications? p.25
24. What's the relationship between ratings gaps and asset volatility? p.27
25. How do we calculate the OAS for non-US dollar bonds? Appendix I
26. How do we determine the Moody's ratings used in MIR? Appendix II
27. Do we use domestic or foreign currency ratings for EM bonds? p.31
28. How do we calculate the median credit spreads? Appendix III
IX. Frequently Asked Questions
IX. Frequently Asked Questions
December 2007 ViewPoints

December 2007 ViewPoints
© Copyright 2007, Moody’s Investors Service, Inc. and/or its licensors including Moody’s Assurance Company, Inc. (together, “MOODY’S”). All rights reserved. ALL
INFORMATION CONTAINED HEREIN IS PROTECTED BY COPYRIGHT LAW AND NONE OF SUCH INFORMATION MAY BE COPIED OR OTHERWISE REPRODUCED, REPACK-
AGED, FURTHER TRANSMITTED, TRANSFERRED, DISSEMINATED, REDISTRIBUTED OR RESOLD, OR STORED FOR SUBSEQUENT USE FOR ANY SUCH PURPOSE, IN
WHOLE OR IN PART, IN ANY FORM OR MANNER OR BY ANY MEANS WHATSOEVER, BY ANY PERSON WITHOUT MOODY’S PRIOR WRITTEN CONSENT. All information
contained herein is obtained by MOODY’S from sources believed by it to be accurate and reliable. Because of the possibility of human or mechanical error as well as
other factors, however, such information is provided “as is” without warranty of any kind and MOODY’S, in particular, makes no representation or warranty, express or
implied, as to the accuracy, timeliness, completeness, merchantability or fitness for any particular purpose of any such information. Under no circumstances shall
MOODY’S have any liability to any person or entity for (a) any loss or damage in whole or in part caused by, resulting from, or relating to, any error (negligent or other-
wise) or other circumstance or contingency within or outside the control of MOODY’S or any of its directors, officers, employees or agents in connection with the pro-
curement, collection, compilation, analysis, interpretation, communication, publication or delivery of any such information, or (b) any direct, indirect, special, conse-
quential, compensatory or incidental damages whatsoever (including without limitation, lost profits), even if MOODY’S is advised in advance of the possibility of such
damages, resulting from the use of or inability to use, any such information. The credit ratings and financial reporting analysis observations, if any, constituting part of
the information contained herein are, and must be construed solely as, statements of opinion and not statements of fact or recommendations to purchase, sell or
hold any securities. NO WARRANTY, EXPRESS OR IMPLIED, AS TO THE ACCURACY, TIMELINESS, COMPLETENESS, MERCHANTABILITY OR FITNESS FOR ANY PARTICU-
LAR PURPOSE OF ANY SUCH RATING OR OTHER OPINION OR INFORMATION IS GIVEN OR MADE BY MOODY’S IN ANY FORM OR MANNER WHATSOEVER. Each rating or
other opinion must be weighed solely as one factor in any investment decision made by or on behalf of any user of the information contained herein, and each such
user must accordingly make its own study and evaluation of each security and of each issuer and guarantor of, and each provider of credit support for, each security
that it may consider purchasing, holding or selling.
MOODY’S hereby discloses that most issuers of debt securities (including corporate and municipal bonds, debentures, notes and commercial paper) and pre-
ferred stock rated by MOODY’S have, prior to assignment of any rating, agreed to pay to MOODY’S for appraisal and rating services rendered by it fees ranging from
$1,500 to $2,400,000. Moody’s Corporation (MCO) and its wholly-owned credit rating agency subsidiary, Moody’s Investors Service (MIS), also maintain policies and
procedures to address the independence of MIS’s ratings and rating processes. Information regarding certain affiliations that may exist between directors of MCO
and rated entities, and between entities who hold ratings from MIS and have also publicly reported to the SEC an ownership interest in MCO of more than 5%, is post-
ed annually on Moody’s website at www.moodys.com under the heading “Shareholder Relations — Corporate Governance — Director and Shareholder Affiliation
Policy.”
Moody’s Investors Service Pty Limited does not hold an Australian financial services licence under the Corporations Act. This credit rating opinion has been pre-
pared without taking into account any of your objectives, financial situation or needs. You should, before acting on the opinion, consider the appropriateness of the
opinion having regard to your own objectives, financial situation and needs.
Report Number: 106083
Authors
David W. Munves, CFADavid T. Hamilton, Ph.D.
Production Specialist
Yelena Ponirovskaya