more bankers, more growth? evidence from oecd countries · 2014-03-18 · cepii, wp no 2011 – 22...
TRANSCRIPT
C E N T R ED ’ É T U D E S P R O S P E C T I V E SE T D ’ I N F O R M A T I O N SI N T E R N A T I O N A L E S
No 2011 – 22November
DO
CU
ME
NT
DE
TR
AV
AI
L
More Bankers, More Growth?Evidence from OECD Countries
Gunther Capelle-Blancard and Claire Labonne

CEPII, WP No 2011 – 22 More Bankers, More Growth? Evidence from OECD Countries
TABLE OF CONTENTS
Non-technical summary . . . . . . . . . . . . . . . . . . . . . . . . . . . 3Abstract . . . . . . . . . . . . . . . . . . . . . . . . . . . . . . . . . 3Résumé non technique . . . . . . . . . . . . . . . . . . . . . . . . . . . 5Résumé court . . . . . . . . . . . . . . . . . . . . . . . . . . . . . . . 61. Introduction . . . . . . . . . . . . . . . . . . . . . . . . . . . . . . 72. Measuring financial deepening . . . . . . . . . . . . . . . . . . . . . . 83. Methodology . . . . . . . . . . . . . . . . . . . . . . . . . . . . . 104. Results . . . . . . . . . . . . . . . . . . . . . . . . . . . . . . . . 115. Conclusion . . . . . . . . . . . . . . . . . . . . . . . . . . . . . . 13List of working papers released by CEPII . . . . . . . . . . . . . . . . . . . . 21
2

CEPII, WP No 2011 – 22 More Bankers, More Growth? Evidence from OECD Countries
MORE BANKERS, MORE GROWTH?EVIDENCE FROM OECD COUNTRIES
NON-TECHNICAL SUMMARY
Does finance spur economic growth? At the end of the 1990s, the debate seemed over. An abundantempirical literature supported a positive causal effect of finance on GDP. However, since the early 2000s,skepticism has been growing and several authors have pointed out some serious methodological prob-lems.
The recent crisis has also altered the mindset on the supposed positive impact of finance on growth. Fi-nancial deepening theoretically spurs economic growth by facilitating capital allocation, pooling savings,sharing risk, monitoring firms and producing information. However, these effects might be offset by twofactors previously neglected in the literature.
• Excessive growth of credit. An increase of credit volume − the most common proxy for financialdeepening − does not mean that the financial sector fulfills its functions better (the same is truealso for market capitalization). Sometimes, this is even just the opposite: an excessive growth ofcredit may undermine the financial system and hurt economic growth. Undoubtedly, the subprimemortgage crisis is a good example of such unproductive financial deepening.
• Misallocation of talents. The allocation of talent is understood as an important determinant ofgrowth. During the last two decades, it is likely that the financial industry has attracted too manytalents, to the detriment of others industries. During the crisis, such concern was vividly expressed,in particular by Lord Turner, the chairman of the UK’s Financial Services Authority, who declaredin 2009 that the financial industry had grown “beyond a socially reasonable size”.
In this paper, we propose to gauge the size of the financial sector based on its inputs, rather than itsoutputs: more specifically, we consider two original variables: i) the number of employees in the financialsector divided by the total workforce and ii) the ratio private credit divided by the number of employeesin the financial sector. Using the number of employees to assess the size of an industry is quite usualin the economic literature, but strangely not in financial economics. Our two variables alleviate boththe problems of excessive growth of credit and misallocation of talents. Moreover, our data have theadvantage of being available over a long period (1970-2008) for a large sample (24 OECD countries).Hence, our results are directly comparable with the bulk of evidence on the finance-growth nexus. Ourmethodology relies on difference and system estimators in the context of growth equation estimation. Itenables us to handle endogeneity with macroeconomic data. Our results confirm that there is no clearand positive relationship between finance and growth.
3

CEPII, WP No 2011 – 22 More Bankers, More Growth? Evidence from OECD Countries
ABSTRACT
In this paper, we reexamine empirically the finance/growth nexus. We argue that financial deepeningshould not only be assessed with familiar measures of financial activities outputs (e.g. credit volume), butalso through its inputs (e.g. the relative number of employees in the financial industry) or the efficiencyof the financial intermediation process (measured in this paper by the ratio credit volume to numberof employees). Overall, our study confirms the absence of a positive relationship between financialdeepening and economic growth for OECD countries over the last forty years.
JEL Classification: G20.
Keywords: Finance-growth nexus, optimal size of the financial sector, financial intermedia-tion, bank efficiency, system and difference GMM.
4
CEPII, WP No 2011 – 22 More Bankers, More Growth? Evidence from OECD Countries
PLUS DE BANQUIERS, PLUS DE CROISSANCE ?UNE ÉTUDE EMPIRIQUE SUR LES PAYS DE L’OCDE
RÉSUME NON TECHNIQUE
La finance stimule-t-elle la croissance économique ? A la fin des années 1990, le débat semblait défini-tivement clos. Une littérature empirique abondante soutenait en effet l’idée d’une causalité positive dela finance vers le PIB. A partir des années 2000, ce consensus a commencé à se fissurer, plusieurs au-teurs soulignant quelques graves problèmes méthodologiques dans l’estimation empirique des relationsde causalité entre finance et croissance.
La crise récente a également modifié l’opinion générale sur ce sujet. Théoriquement, le développementdu secteur financier doit avoir un impact positif sur la croissance économique en facilitant l’allocationdu capital, la mise en commun de l’épargne, le partage des risques, le contrôle et la surveillance desentreprises, ainsi qu’en favorisant la production et la diffusion d’informations. Il est toutefois possibleque ces effets soient compensés par deux facteurs généralement négligés dans la littérature.
• Une croissance potentiellement excessive du crédit. Une augmentation du volume de crédits -l’indicateur le plus communément utilisé pour apprécier le développement des activités financières- ne signifie pas nécessairement que le secteur financier accomplisse ses fonctions de manièreplus efficace (l’argument est similaire pour la capitalisation boursière). C’est même parfois toutle contraire : une croissance excessive du crédit peut nuire au système financier et à la croissanceéconomique. La crise des subprimes en est sans aucun doute une bonne illustration.
• La mauvaise allocation des talents. L’allocation des talents est considérée comme un déterminantimportant de la croissance. Au cours des deux dernières décennies, le secteur financier a attiréde très nombreux jeunes diplômés, peut être au détriment des autres industries. Pendant la crise,plusieurs voix ont d’ailleurs exprimé des préoccupations à ce sujet, notamment Lord Turner, leprésident de la FSA (l’autorité de régulation britannique), qui n’a pas hésité en 2009 à déclarer quela taille du secteur financier au Royaume-Uni était “au-delà d’une taille socialement raisonnable”.
Dans ce papier, nous proposons d’évaluer la taille du secteur financier en utilisant non pas les outputsdu processus d’intermédiation financière, mais ses inputs. Précisément, nous considérons deux variablesoriginales : i) le nombre de salariés dans le secteur de la finance rapporté au nombre total de salariésdans l’économie, tous secteurs confondus ; ii) le ratio volume de crédits accordés aux agents privés surle nombre de salariés dans le secteur de la finance. Utiliser le nombre de salariés pour apprécier la tailled’un secteur est assez usuel dans la littérature économique, mais étrangement pas en économie financière.Nos deux variables permettent de limiter les problèmes liés à la croissance potentiellement excessive descrédits et à la mauvaise allocation des talents. Nos données ont, en outre, l’avantage d’être disponibles surune longue période (1970-2008) pour un large échantillon de pays (24 pays de l’OCDE). Nos résultatssont ainsi directement comparables avec la littérature académique standard sur les liens de causalité entre
5

CEPII, WP No 2011 – 22 More Bankers, More Growth? Evidence from OECD Countries
finance et croissance. Notre méthodologie repose sur la technique des panels dynamiques (estimateursdifférence et système) appliquée aux modèles de croissance. Elle nous permet de traiter l’endogénéitédes données macroéconomiques. Nos résultats confirment qu’il n’y a pas de relation claire et positiveentre la finance et la croissance pour les pays développés sur les quarante dernières années.
RÉSUMÉ COURT
Dans ce papier, nous réexaminons empiriquement le lien entre finance et croissance. Nous soutenonsque le développement de la sphère financière ne doit pas seulement s’apprécier par le montant des fi-nancements accordés (volume de crédits ou capitalisation boursière), mais aussi par le poids des activ-ités financières relativement aux autres secteurs (approché ici par le nombre de salariés dans le secteurbanque-finance rapporté au nombre total de salariés) ou par l’efficacité du processus d’intermédiationfinancière (mesurée dans cette étude par le ratio volume de crédit sur nombre de salariés). Globalement,notre étude confirme l’absence de relation positive entre la croissance du secteur financier et la croissanceéconomique pour les pays de l’OCDE au cours des quarante dernières années.
Classification JEL : G20.
Mots clés : Causalité finance/croissance, taille optimale du système financier, intermédiationfinancière, estimateur GMM système et différence.
6

CEPII, WP No 2011 – 22 More Bankers, More Growth? Evidence from OECD Countries
MORE BANKERS, MORE GROWTH?EVIDENCE FROM OECD COUNTRIES1
Gunther Capelle-Blancard*
Claire Labonne†
1. INTRODUCTION
Does finance spur economic growth? At the end of the 1990s, the debate seemed over. Anabundant empirical literature supported a positive causal effect of finance on GDP (see Levine(2005) for a survey). However, since the early 2000s, skepticism has been growing (Wachtel(2003); Manning (2003)): Rousseau & Wachtel (2002) show that finance only causes growthconditionally on inflation; Rioja & Valev (2004) underline the sensitivity of the relationshipto the level of development; Roodman (2009) considers that previous results were driven byundetected endogeneity; Rousseau & Wachtel (2011) and Bordo & Rousseau (2011) highlightthe decline of the causal link through time.
The recent crisis has also altered the mindset on the supposed positive impact of finance ongrowth. Financial deepening theoretically spurs economic growth by facilitating capital al-location, pooling savings, sharing risk, monitoring firms and producing information (Levine(2005)). However, these effects might be offset by two factors previously neglected in the aca-demic literature.
• Excessive growth of credit. An increase of credit volume − the most common proxy forfinancial deepening − does not mean that the financial sector fulfills its functions better (thesame is true also for market capitalization). Sometimes, this is even just the opposite. Asstated by Rousseau & Wachtel (2011), an excessive growth of credit may undermine thefinancial system and hurt economic growth. Further, Arcand et al. (2011) have recently sug-gested that finance has a negative impact on growth when private credit is above a thresholdestimated as 110% of GDP. Undoubtedly, the subprime mortgage crisis is a good exampleof such unproductive financial deepening.
• Misallocation of talents. Since Baumol (1990) and Murphy et al. (1991), the allocation oftalent is understood as an important determinant of growth. Recently, Philippon (2009) and
1The authors thank Agnès Bénassy-Quéré, Jézabel Couppey-Soubeyran, Olena Havrylchyk and Valérie Mignon,as well as participants at the GdRE workshop on financial intermediation (Paris, April 2010) for helpful comments.The usual disclaimer applies.
*CES, Université Paris 1 Panthéon-Sorbonne & CEPII. Email: [email protected]. Corre-sponding author: 106-112 Bd de l’hopital 75647 Paris Cedex 13 France. Phone:+33 (0)1 44 07 82 70.
†ENSAE ParisTech & CEPII.
7

CEPII, WP No 2011 – 22 More Bankers, More Growth? Evidence from OECD Countries
Bolton et al. (2011) have examined theoretically the equilibrium size of the financial sector,while Goldin & Katz (2008) or Philippon & Reshef (2008) provide empirical evidence thatthe growth of the financial industry has attracted too many talents, to the detriment of othersindustries.2 During the crisis, such concern was vividly expressed, in particular by LordTurner, the chairman of the UK’s Financial Services Authority, who declared in 2009 thatthe financial industry had grown “beyond a socially reasonable size”.
In this paper, we reexamine empirically the finance/growth nexus. Compared to previous stud-ies, we propose to gauge the size of the financial sector based on its inputs, rather than itsoutputs. More specifically, we consider two original variables: i) the number of employeesin the financial sector divided by the total workforce and ii) the ratio private credit divided bythe number of employees in the financial sector. Using the number of employees to assessthe size of an industry is quite usual in the economic literature3, but strangely not in financialeconomics. Our two variables alleviate both the problems of excessive growth of credit andmisallocation of talents. Moreover, our data have the advantage of being available over a longperiod (1970-2008) for a large sample (24 OECD countries). Hence, our results are directlycomparable with the bulk of evidence on the finance-growth nexus. Our methodology relieson difference and system estimators defined by Arellano & Bond (1991) and Blundell & Bond(1998) as edited by Roodman (2009) in the context of growth equation estimation. It enablesus to handle endogeneity with macroeconomic data. Our results confirms that there is no clearand positive relationship between finance and growth.
The remainder of this paper is organized as follows. Section 2 reviews financial sector measuresand describes the data. Section 3 develops econometrics issues raised by growth equations anddetails our methodology to face them. Section 4 presents the results and section 5 concludes.
2. MEASURING FINANCIAL DEEPENING
In the finance-growth literature, the size of the financial sector is proxied by its outputs. Sincethe seminal paper by King & Levine (1993), preferred measures have been: the ratio of thecredits to the private sector to GDP, the ratio of liquid liabilities to GDP and the ratio of com-mercial banks credits to the sum of commercial and central banks credits. All these proxiesimplicitly assume quality is increasing with quantity.
Several attempts have been made recently to consider better proxies of financial deepening.Beck et al. (2009) distinguish bank lending to firms and to households, and show that only theformer spurs economic growth. Hasan et al. (2009) focus on the quality of financial servicesthanks to a sophisticated measure of bank efficiency and show that it has a positive impact onregional growth, while credit volume has not. These results are very appealing but deservefurther examination. In both papers, the “quality” of the data comes at the expense of the
2See also Tobin (1984) for a prophetic warning.3For instance, it is common to use the number of engineers to gauge the pace of innovation.
8

CEPII, WP No 2011 – 22 More Bankers, More Growth? Evidence from OECD Countries
“quantity”. The authors have no other choice but to rely on a very short period (1994-2005 forBeck et al. (2009) and 1996-2004 for Hasan et al. (2009)). This is a serious limitation: first, thisperiod is not subject to a major banking crisis; second, the authors have to use annual growthrate with the risk of having a very noisy variable, or to compute growth rate on the wholeperiod, but this strongly constrains the methodology (the number of observations is between27 and 45 in Beck et al. (2009); Hasan et al. (2009) consider simple - but potentially flawed -OLS estimations). To tackle this problem, Hasan et al. (2009) consider regional growth. Thisis a valuable contribution - provided that banking data can be properly distributed betweenregions.4 However, this does not facilitate the interpretation of the results since all previouspapers consider countries.
In this paper, we propose two original variables to characterize financial deepening:
• The number of employees in the financial sector divided by the total workforce;• The ratio private credit divided by the number of employees in the financial sector
The former accounts for the size of the financial workforce relative to the rest of the economy,while the latter is an output/input ratio, indicating performance. The logic of the last variableis similar to Hasan et al. (2009) as we consider that an increase in credit volume does notnecessarily indicate financial deepening. Our measure of bank efficiency is quite basic, but iseasily comparable with previous evidence on the finance-growth nexus.
We restrict our sample to OECD countries to limit heterogeneity issues (Favara (2009).5 We useLevine et al. (2000)’s database which offers the whole set of controls and the three traditionalfinancial sector measures. We expand this database until 2008 thanks to Beck & Demirguc-Kunt (2009), World Bank World Development Indicators and Barro & Lee (2010). The numberof employees is extracted from the OECD Structural Analysis for 24 countries between 1970and 2008.
We use alternatively two sets of controls as in Levine et al. (2000). The simple conditioninginformation set consists of a constant, initial GDP per capita (log), and initial level of humancapital. This set is complemented with three other variables in the policy conditioning infor-mation set: inflation rate (plus one, log), government size (government expenses, log), andinternational trade openness (ratio of the sum of importations and exportations to GDP, log).
4In the main part of the article, banks are allocated to regions on the basis of headquarters location. Then, theauthors consider different robustness checks.
5Rioja & Valev (2004) and Aghion et al. (2005) show that the effects of financial development on growth inhigh-income countries are smaller than in developing countries.
9

CEPII, WP No 2011 – 22 More Bankers, More Growth? Evidence from OECD Countries
3. METHODOLOGY
We estimate the following equation:
yit = αyit−1 + γFit + β′xit + ηi + λt + εit
where yit is the growth rate of GDP per capita, Fit is a measure of the financial sector (inlogarithm) and xit is a set of controls for country i in period t. Country fixed effects ηi capturedifferences in the initial level of efficiency. Time dummies λt account for productivity changescommon to all countries and time specific measurement errors. To avoid modeling cyclicaldynamics, t represents a five-year period (except 2005-2008).
Estimating γ, i.e. the impact of financial deepening on growth raises endogeneity issues: Is acountry developed thanks to its state-of-the-art financial system or is the financial system at thestate-of-the-art because the country is developed ? Since Levine et al. (2000), the finance/growthliterature has backed its results on difference and system estimators defined by Arellano &Bond (1991) and Blundell & Bond (1998). Although these estimators manage endogeneity,Roodman (2009) warns against their systematical use. Because of vitiated tests, Levine et al.(2000) dynamic panel results might be spurious and cannot be considered as evidence to rejectthe hypothesis that finance does not cause growth. Accordingly, we follow Roodman (2009)’sapproach (see in Appendix for technical details).
To check the validity of instruments and subsets of instruments, we test over-identifying restric-tions thanks to the Hansen and Difference-in-Hansen tests. Because instrument proliferationvitiates the Hansen test (Roodman (2009)), we exclude estimation results whose p-values areabnormally high. Practically, we compute two estimators for two sets of controls (simple andpolicy). The simple set of controls certainly suffers from omitted variable bias. However thepolicy set risks instrument proliferation. Our beam of results aims at accounting for the trade-off.
Loayza & Ranciere (2005) warn about the importance of time horizon when studying the fi-nance/growth nexus. Thanks to a pooled mean group estimation, they account for contrastingeffects of finance on growth distinguishing short- and long-run effects. Using traditional vari-ables, they conclude the long-run relationship between financial intermediation and economicactivity is positive whereas its short-term counterpart is negative. Significantly negative short-term effects are to be found in countries suffering from banking crises or high financial volatilitywhile the effect is not significant for stable countries. System and difference estimators do nottackle this issue. They are intended to catch a long term effect since run on data averaged over5-year periods, but nothing absolutely guarantees cycle effects are removed by this transforma-tion. Do long term effects compensate short-term effects in our estimation, leading to irrelevantestimates ? To avoid blurred estimates, we follow Rousseau & Wachtel (2011) methodology andadd an interact variable (financial sector measure × crisis dummy) in our regression equation.To some extent, this allows to address time horizon problems since Loayza & Ranciere (2005)
10

CEPII, WP No 2011 – 22 More Bankers, More Growth? Evidence from OECD Countries
found short-term effects appear only in unstable countries. We create a dummy that equals 1if during any year of the five-year period the country suffers from a systemic banking crisis, acurrency crisis or a debt crisis (Laeven & Valencia (2010)).
4. RESULTS
We estimate the model for 24 OECD countries between 1970 and 2008 using two-step systemGMM. Table 1 summarizes the results of 20 different specifications: 5 measures of financialdeepening (3 usual measures + 2 original measures) × 2 sets of control (policy + simple) ×2 states (with or without a crisis interaction). We present the estimated coefficients associatedwith the variables of interest (Private credit/GDP, Liquid Liabilities/GDP, Bank credit/Totalcredit), Number of employees in the financial sector/Total workforce, Private credit/Number ofemployees in the financial sector), along with the p-value of the Hansen test, Diff-in-Hansentest and Arellano-Bond test.6
Neither classical nor labour measures denote a robust effect of financial deepening on growth.7
The coefficients on Private credit/GDP and its interaction with a crisis dummy are never sta-tistically significant. Results are identical for Liquid liability/GDP. The coefficient on Bankcredit/Total credit is significant at 10% only with the policy set of controls and without acrisis interaction. However, results of the diff-in-Hansen and Arellano-Bond tests (abnor-mally high p-value) indicate significance to be unreliable. Employees/Workforce and Privatecredit/Employees are significant when interacted with a crisis dummy at 10%, but only with thesimple controls set. These estimations fail to pass the Hansen test.
Maybe these results suffer from a structural break in the 1980s due to the deregulation of thefinancial sector (Philippon & Reshef (2008)). We drop the first ten years8 of the dataset toestimate the nexus for the period 1980-2008). Results are qualitatively unchanged. We fail toreject the null hypothesis that the size of the financial sector, as measured by labour input, doesnot cause growth.
Recently, Arcand et al. (2011) provide evidence of a threshold above which financial develop-ment no longer has a positive effect on economic growth. Thus, we test for such a non-lineareffect. Our results are not significant or the models do not pass the usual specification tests (seeTable 4 in appendix). This may be due to our more homogeneous sample of countries.
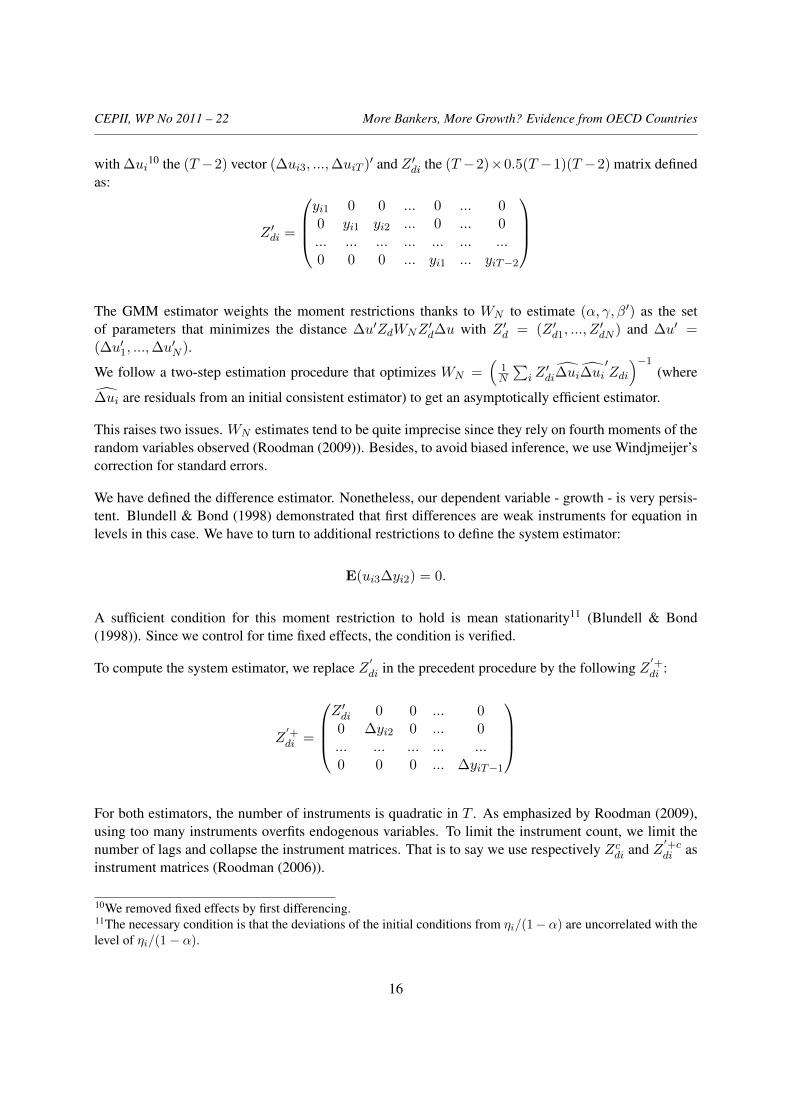
6Except government expenses, the control variables are not significant (see in appendix). This result may seemstrange prima facie, but it is quite usual in this kind of approach, especially with a panel of developed countries.Similar results are obtained by Levine et al. (2000) or Arcand et al. (2011) for instance.
7To be sure our results are not driven by 2007 and 2008 observations, we run the estimators over periods endingin 2005. Results are qualitatively unchanged.
8Ideally, we should drop the first twenty years of the dataset to allow for structural change to have completelydeveloped. We cannot because of the time length required by our estimator.
11

CEPII, WP No 2011 – 22 More Bankers, More Growth? Evidence from OECD Countries
Table 1 – Financial sector and growth: 1970-2008, 24 OECD countries
Controls set Policy Simple Policy SimpleInstruments 17 11 22 16
Private credit/GDP -0.06 0.9 -0.9 -0.8× crisis -0.12 -0.24
Hansen test 0.178 0.139 0.719 0.482Diff-in-Hansen test: lagged growth 0.094 0.742 0.127 0.870
Arellano-Bond test 0.867 0.892 0.692 0.528Liquid Liabilities/GDP 0.08 0.9 -1.2 0.64
× crisis -0.2 -0.37Hansen test 0.426 0.320 0.709 0.281
Diff-in-Hansen test: lagged growth 0.021 0.302 0.111 0.844Arellano-Bond test 0.582 0.552 0.469 0.390
Bank credit/Total credit 6.7* 13.6 6.4 14.8× crisis -0.20 0.14
Hansen test 0.945 0.181 0.753 0.179Diff-in-Hansen test: lagged growth 0.949 0.048 0.181 0.092
Arellano-Bond test 0.978 0.985 0.839 0.998Employees/Workforce 0.3 4.5 -0.9 -1.4
× crisis 0.08 0.13*Hansen test 0.560 0.260 0.692 0.022
Diff-in-Hansen test: lagged growth 0.339 0.108 0.410 0.376Arellano-Bond test 0.746 0.729 0.789 0.856
Private credit/Employees -0.437 -0.236 0.54 0.38× crisis 0.36 0.74**
Hansen test 0.388 0.023 0.646 0.007Diff-in-Hansen test: lagged growth 0.386 0.871 0.370 0.967
Arellano-Bond test 0.753 0.441 0.563 0.581
Notes: All regressions are two-step collapsed System GMM. All variables are in logarithm. P-values arereported for tests. ***, **, * significant at the 1%, 5%, and 10% level respectively.
12

CEPII, WP No 2011 – 22 More Bankers, More Growth? Evidence from OECD Countries
5. CONCLUSION
The crisis called into question the commonly accepted measures to assess the growth of thefinancial sector. In this paper, we reexamine empirically the finance/growth nexus by using twooriginal measures of financial deepening related to the number of employees in the financialsector. Our study confirms the absence of a positive relationship between financial deepeningand GDP for OECD countries over the last forty years.
The share of employees working in banking and finance is a direct measure of the potentialmisallocation of talents. The ratio private credit to number of employees in the financial sectorcan alleviate the problem raised by an excessive growth of credit and unproductive financialdeepening, although it cannot fully solve it. Usually, an increase of an output/input ratio isinterpreted as an improvement of the economic process. But it is unclear wether an increaseof private credit relative to the number of employees captures a higher ability of the financialsector to convert efficiently inputs into outputs.9 More research is needed to assess how thefinancial sector accomplishes its tasks.
REFERENCES
Aghion, P., Howitt, P., & Mayer-Foulkes, D. (2005). The effect of financial development on convergence:Theory and evidence. Quarterly Journal of Economic, 120, 173–222.
Arcand, J.-L., Berkes, E., & Panizza, U. (2011). Too much finance? Working Paper.Arellano, M. & Bond, S. (1991). Some tests of specification for panel data: Monte carlo evidence and
an application to employment equations. The Review of Economic Studies, 58, 277–297.Barro, R. & Lee, J. (2010). A new data set of educational attainment in the world: 1950-2010. NBER
Working Paper, 15902.Baumol, W. J. (1990). Entrepreneurship: Productive, unproductive and destructive. Journal of Political
Economy, 98, 893–921.Beck, T., Beyekkarabacak, B., Rioja, F., & Valev, N. (2009). Who gets the credit? and does it matter?
household vs. firm lending across countries. CEPR Working Paper 7400.Beck, T. & Demirguc-Kunt, A. (2009). Financial institutions and markets across countries and over time
- data and analysis. World Bank Policy Research Working Paper, 4943.Blundell, R. & Bond, S. (1998). Initial conditions and moment restrictions in dynamic panel data models.
Journal of Econometrics, 87, 115–143.Bolton, P., Santos, T., & Scheinkman, J. A. (2011). Cream skimming in financial markets. NBER
Working Paper, 16804.Bordo, M. D. & Rousseau, P. L. (2011). Historical evidence on the finance-trade-growth nexus. NBER
Working Paper, 17024.
9The literature on medicine is also interested in the impact of the number of doctors. Interestingly, empiricalevidence suggest that during episodes of doctors’ strikes, mortality decreases (Cunningham et al. (2008)).
13

CEPII, WP No 2011 – 22 More Bankers, More Growth? Evidence from OECD Countries
Cunningham, S. A., Mitchell, K., Narayan, K. V., & Yusuf, S. (2008). Doctors’ strikes and mortality : Areview. Social Science & Medicine, 67(11), 1784–1788.
Favara, G. (2009). An empirical reassessment of the relationship between finance and growth. WorkingPaper, HEC University of Lausanne.
Goldin, C. & Katz, L. (2008). Transitions: Career and family life cycles of the educational elite. Ameri-can Economic Review, 98(2), 263–269.
Hasan, I., Koetter, M., & Wedow, M. (2009). Regional growth and finance in europe: is there a qualityeffect of bank efficiency? Journal of Banking and Finance, 33(8), 1446–1453.
King, R. & Levine, R. (1993). Finance and growth: Schumpeter might be right. Quaterly Journal ofEconomics, 108-3, 717–37.
Laeven, L. & Valencia, F. (2010). Resolution of banking crises: The good, the bad, and the ugly. IMFWorking Paper, 10/146.
Levine, R. (2005). Finance and growth: Theory and evidence. Handbook of Economic Growth, 1.Levine, R., Loayza, N., & Beck, T. (2000). Financial intermediation and growth: Causality and causes.
Journal of Monetary Economics, 46, 31–77.Loayza, N. & Ranciere, R. (2005). Financial development, financial fragility and growth. IMF Working
Papers, 05/170.Manning, M. J. (2003). Finance causes growth: Can we be so sure? The B.E. Journal of Macroeco-
nomics, 3.Murphy, K. M., Shleifer, A., & Vishny, R. W. (1991). The allocation of talent: Implications for growth.
Quarterly Journal of Economics, 16(2).Philippon, T. (2009). The evolution of the us financial industry from 1860 to 2007. NYU Working Paper.Philippon, T. & Reshef, A. (2008). Wages and human capital in the u.s. financial industry:1909-2006.
NBER Working Paper, 14644.Rioja, F. & Valev, N. (2004). Does one size fit all? a reexamination of the finance and growth relationship.
Journal of Development Economics, 74(2), 429–447.Roodman, D. (2006). How to do xtabond2: An introduction to "difference" and "system" gmm in stata.
Center for Global Development Working Paper, 103.Roodman, D. (2009). A note on the theme of too many instruments. Oxford Bulletin of Economics and
Statistics, 71, 135–158.Rousseau, P. L. & Wachtel, P. (2002). Inflation thresholds and the finance-growth nexus. Journal of
International Money and Finance, 21, 777–793.Rousseau, P. L. & Wachtel, P. (2011). What is happening to the impact of financial deepening on eco-
nomic growth? Economic Inquiry, 49(1), 276–288.Tobin, J. (1984). On the efficiency of the financial system. Lloyds Bank Review, 153, 1–15.Wachtel, P. (2003). How much do we really know about growth and finance? Economic Inquiry, 88,
33–47.
14

CEPII, WP No 2011 – 22 More Bankers, More Growth? Evidence from OECD Countries
APPENDIX.
A. Methodology
To estimate γ, we consider a linear autoregressive dynamic panel data model:
yit = αyit−1 + γFit + β′xit + uit
uit = ηi + νit
for i = 1, ..., N and t = 2, ....T . We assume N large, T fixed and |α| < 1. We apply the estimationprocedure proposed by Arellano & Bond (1991).
We make the following assumptions:
• E(ηi) = 0
• E(νit) = 0
• E(νitηi) = 0 for i = 1, ..., N and t = 2, ....T
• E(νitνis) = 0 for i = 1, ..., N and ∀t 6= s
• E(yi1νit) = 0 for i = 1, ..., N and t = 2, ..., T .
We test these assumptions thanks to Arellano-Bond tests. Arellano & Bond (1991) device tests of errorsautocorrelation. For T ≥ 5, Arellano & Bond (1991) define a statistic for the test whose null hypothesisis:
H20 : E(vDit v
Dit−2) = 0.
where vDit is the first-order difference of vit. The model is valid if this hypothesis cannot be rejected.Such an assumption is valid in two cases:
• if errors in level are not serially correlated: E(vitvit−1) = 0 (1);
• if νit is a randow walk (2).
To distinguish between these two situations, one can test for first-order correlation since:
H10 : E(vDit v
Dit−1) = 0⇒ (1).
Such test is interesting since defined for T ≥ 4. In this case, if the model passes the H10 test, it would
pass the H20 test, which is not defined here. Nonetheless, failing the H1
0 test does not mean failing theH2
0 test.
These conditions imply the moment restrictions:
E(Z ′di∆ui) = 0
15
CEPII, WP No 2011 – 22 More Bankers, More Growth? Evidence from OECD Countries
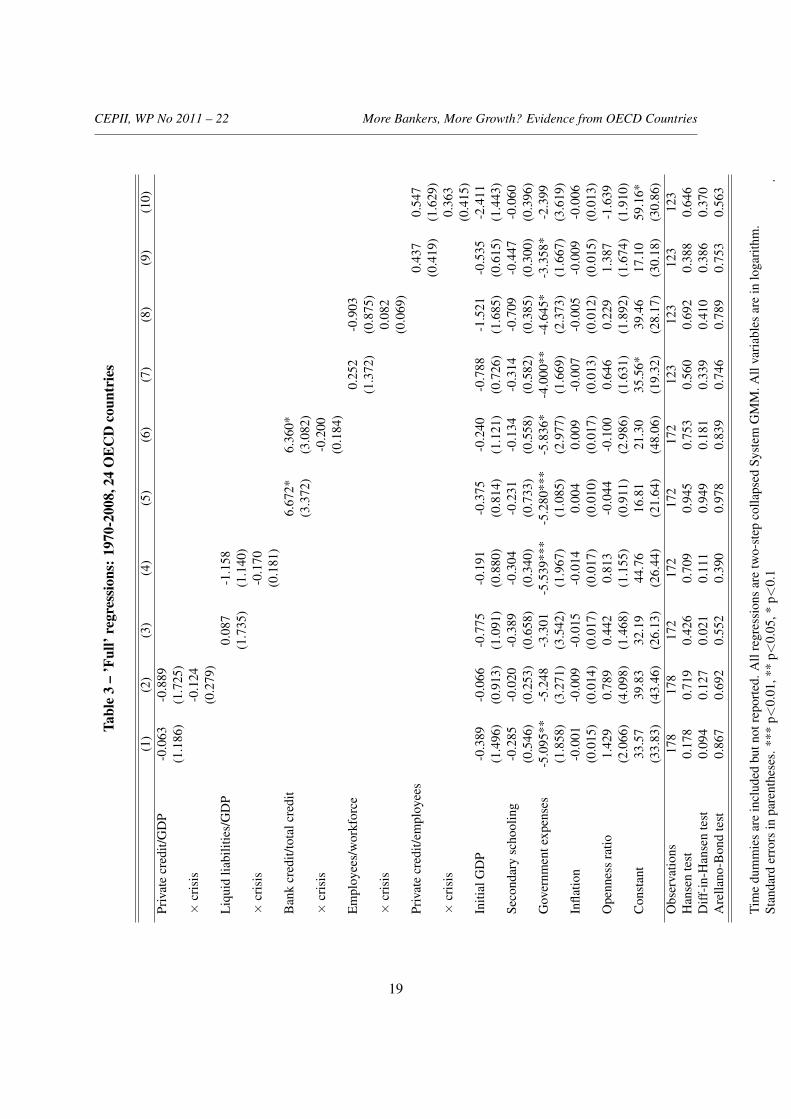
with ∆ui10 the (T −2) vector (∆ui3, ...,∆uiT )′ and Z ′di the (T −2)×0.5(T −1)(T −2) matrix defined
as:
Z ′di =
yi1 0 0 ... 0 ... 00 yi1 yi2 ... 0 ... 0... ... ... ... ... ... ...0 0 0 ... yi1 ... yiT−2
The GMM estimator weights the moment restrictions thanks to WN to estimate (α, γ, β′) as the setof parameters that minimizes the distance ∆u′ZdWNZ
′d∆u with Z ′d = (Z ′d1, ..., Z
′dN ) and ∆u′ =
(∆u′1, ...,∆u′N ).
We follow a two-step estimation procedure that optimizes WN =(
1N
∑i Z′di∆̂ui∆̂ui
′Zdi
)−1(where
∆̂ui are residuals from an initial consistent estimator) to get an asymptotically efficient estimator.
This raises two issues. WN estimates tend to be quite imprecise since they rely on fourth moments of therandom variables observed (Roodman (2009)). Besides, to avoid biased inference, we use Windjmeijer’scorrection for standard errors.
We have defined the difference estimator. Nonetheless, our dependent variable - growth - is very persis-tent. Blundell & Bond (1998) demonstrated that first differences are weak instruments for equation inlevels in this case. We have to turn to additional restrictions to define the system estimator:
E(ui3∆yi2) = 0.
A sufficient condition for this moment restriction to hold is mean stationarity11 (Blundell & Bond(1998)). Since we control for time fixed effects, the condition is verified.
To compute the system estimator, we replace Z′di in the precedent procedure by the following Z
′+di :
Z′+di =
Z ′di 0 0 ... 00 ∆yi2 0 ... 0... ... ... ... ...0 0 0 ... ∆yiT−1
For both estimators, the number of instruments is quadratic in T . As emphasized by Roodman (2009),using too many instruments overfits endogenous variables. To limit the instrument count, we limit thenumber of lags and collapse the instrument matrices. That is to say we use respectively Zc
di and Z′+cdi as
instrument matrices (Roodman (2006)).
10We removed fixed effects by first differencing.11The necessary condition is that the deviations of the initial conditions from ηi/(1− α) are uncorrelated with thelevel of ηi/(1− α).
16

CEPII, WP No 2011 – 22 More Bankers, More Growth? Evidence from OECD Countries
Zcdi =
yi1 0 0 ... 0yi2 yi1 0 ... 0yi3 yi2 yi1 ... 0... ... ... ... ...... ... ... ... ...... ... ... ... ...
Z′+cdi =
Z
′cdi 00 ∆yi20 ∆yi3... ...0 ∆yiT−1
See table 2 for reproduction of Levine et al. (2000) results taking into account Roodman (2009) method-ology.
Since Rousseau & Wachtel (2002) detected the finance-growth nexus was sensitive to inflation, researchhas focused on the variability of this relationship. Rousseau & Wachtel (2011) stressed a decline ofthe impact of financial deepening on economic growth since the 1990s. Indeed, when we estimate withRoodman (2009) methodology the finance-growth nexus on Levine et al. (2000)’s database but restrictedto 1960-1980, private credit - Levine et al. (2000) preferred measure - is significant both statistically andeconomically (see table 2). Thus, studying a more recent period means looking for a declining financeimpact on growth.
Table 2 – Reproduction of Levine et al. (2000) resultsPeriod 1960-1995 1960-1980
Estimator System Difference System DifferenceControls set Policy Simple Policy Policy Simple Policy
N 74 69Instruments 19 11 40 16 8 16
Private credit 2.3* 1.3 0.8 3.4 1.8 4.13*Hansen test 0.013 0.609 0.131 0.242 0.750 0.509
Diff-in-Hansen test: lagged growth 0.000 0.576 . 0.037 0.610 .Arellano-Bond test 0.899 0.561 0.839 0.028 0.019 0.340Liquid Liability 4.5* 2.0 -0.1 8.7* 2.7 4.9
Hansen test 0.200 0.468 0.108 0.813 0.960 0.572Diff-in-Hansen test: lagged growth 0.033 0.998 . 0.897 0.785 .
Arellano-Bond test 0.931 0.562 0.534 0.044 0.014 0.514Bank credit / Total credit 3.0 0.7 2.7 3.6 5.3 3.1
Hansen test 0.062 0.406 0.330 0.045 0.543 0.488Diff-in-Hansen test: lagged growth 0.001 0.183 . 0.012 0.383 .
Arellano-Bond test 0.480 0.526 0.461 0.052 0.011 0.928Notes: * significant at 5%. P-values are reported for tests. Private credit fails to pass the Fisher test forthe system estimator with the simple controls set (p-value: 0.05). Since T = 4 for 1960-1980, we reportArellano-Bond test for first-differenced errors correlation at the first order, as explained in the previoussection.
17

CEPII, WP No 2011 – 22 More Bankers, More Growth? Evidence from OECD Countries
B. Additional tables
• Table 3: ’Full’ regressions: 1970-2008, 24 OECD countries• Table 4: Nonlinear regressions: 1970-2008, 24 OECD countries
18
CEPII, WP No 2011 – 22 More Bankers, More Growth? Evidence from OECD CountriesTa
ble
3–
’Ful
l’re
gres
sion
s:19
70-2
008,
24O
EC
Dco
untr
ies
(1)
(2)
(3)
(4)
(5)
(6)
(7)
(8)
(9)
(10)
Priv
ate
cred
it/G
DP
-0.0
63-0
.889
(1.1
86)
(1.7
25)
×cr
isis
-0.1
24(0
.279
)L
iqui
dlia
bilit
ies/
GD
P0.
087
-1.1
58(1
.735
)(1
.140
)×
cris
is-0
.170
(0.1
81)
Ban
kcr
edit/
tota
lcre
dit
6.67
2*6.
360*
(3.3
72)
(3.0
82)
×cr
isis
-0.2
00(0
.184
)E
mpl
oyee
s/w
orkf
orce
0.25
2-0
.903
(1.3
72)
(0.8
75)
×cr
isis
0.08
2(0
.069
)Pr
ivat
ecr
edit/
empl
oyee
s0.
437
0.54
7(0
.419
)(1
.629
)×
cris
is0.
363
(0.4
15)
Initi
alG
DP
-0.3
89-0
.066
-0.7
75-0
.191
-0.3
75-0
.240
-0.7
88-1
.521
-0.5
35-2
.411
(1.4
96)
(0.9
13)
(1.0
91)
(0.8
80)
(0.8
14)
(1.1
21)
(0.7
26)
(1.6
85)
(0.6
15)
(1.4
43)
Seco
ndar
ysc
hool
ing
-0.2
85-0
.020
-0.3
89-0
.304
-0.2
31-0
.134
-0.3
14-0
.709
-0.4
47-0
.060
(0.5
46)
(0.2
53)
(0.6
58)
(0.3
40)
(0.7
33)
(0.5
58)
(0.5
82)
(0.3
85)
(0.3
00)
(0.3
96)
Gov
ernm
ente
xpen
ses
-5.0
95**
-5.2
48-3
.301
-5.5
39**
*-5
.280
***
-5.8
36*
-4.0
00**
-4.6
45*
-3.3
58*
-2.3
99(1
.858
)(3
.271
)(3
.542
)(1
.967
)(1
.085
)(2
.977
)(1
.669
)(2
.373
)(1
.667
)(3
.619
)In
flatio
n-0
.001
-0.0
09-0
.015
-0.0
140.
004
0.00
9-0
.007
-0.0
05-0
.009
-0.0
06(0
.015
)(0
.014
)(0
.017
)(0
.017
)(0
.010
)(0
.017
)(0
.013
)(0
.012
)(0
.015
)(0
.013
)O
penn
ess
ratio
1.42
90.
789
0.44
20.
813
-0.0
44-0
.100
0.64
60.
229
1.38
7-1
.639
(2.0
66)
(4.0
98)
(1.4
68)
(1.1
55)
(0.9
11)
(2.9
86)
(1.6
31)
(1.8
92)
(1.6
74)
(1.9
10)
Con
stan
t33
.57
39.8
332
.19
44.7
616
.81
21.3
035
.56*
39.4
617
.10
59.1
6*(3
3.83
)(4
3.46
)(2
6.13
)(2
6.44
)(2
1.64
)(4
8.06
)(1
9.32
)(2
8.17
)(3
0.18
)(3
0.86
)O
bser
vatio
ns17
817
817
217
217
217
212
312
312
312
3H
anse
nte
st0.
178
0.71
90.
426
0.70
90.
945
0.75
30.
560
0.69
20.
388
0.64
6D
iff-i
n-H
anse
nte
st0.
094
0.12
70.
021
0.11
10.
949
0.18
10.
339
0.41
00.
386
0.37
0A
rella
no-B
ond
test
0.86
70.
692
0.55
20.
390
0.97
80.
839
0.74
60.
789
0.75
30.
563
Tim
edu
mm
ies
are
incl
uded
butn
otre
port
ed.A
llre
gres
sion
sar
etw
o-st
epco
llaps
edSy
stem
GM
M.A
llva
riab
les
are
inlo
gari
thm
.St
anda
rder
rors
inpa
rent
hese
s.**
*p<
0.01
,**
p<0.
05,*
p<0.
1.
19

CEPII, WP No 2011 – 22 More Bankers, More Growth? Evidence from OECD Countries
Table 4 – Nonlinear regressions: 1970-2008, 24 OECD countries(1) (2) (3) (4)
Policy Simple Policy SimplePrivate credit/GDP 18.50* -17.41
(10.71) (26.24)(Private credit/GDP)2 -2.489* 2.231
(1.238) (3.208)Employees/Workforce -8.387 -30.52
(8.684) (30.59)(Employees/Workforce)2 3.611 13.09
(3.687) (13.10)Initial GDP 3.126* -3.741** -0.232 0.0530
(1.605) (1.382) (0.845) (2.025)Secondary schooling -0.471 0.0932 -0.121 0.0466
(0.373) (0.680) (0.331) (0.701)Government expenses -5.846* -4.005**
(3.052) (1.601)Inflation 0.0336 -0.0119
(0.0208) (0.0167)Openness 2.079** -0.738
(0.952) (1.548)Constant -33.17 71.19 45.86** 16.17
(24.84) (60.53) (20.16) (13.28)Observations 178 178 123 123AB test 0.859 0.883 0.760 0.472Hansen test 0.713 0.314 0.489 0.981Diff-in-Hansen test 0.809 0.883 0.589 0.969
Time dummies are included but not reported. All regressions aretwo-step collapsed System GMM. All variables are in logarithm.Standard errors in parentheses. *** p<0.01, ** p<0.05, * p<0.1
20
CEPII, WP No 2011-22 More Bankers, More Growth? Evidence from OECD Countries
21
LIST OF WORKING PAPERS RELEASED BY CEPII
An exhaustive list is available on the website: \\www.cepii.fr.
No Title Authors
2011-21 EMU, EU, Market Integration and Consumption Smoothing
A. Christev & J. Mélitz
2011-20 Real Time Data and Fiscal Policy Analysis J. Cimadomo
2011-19 On the inclusion of the Chinese renminbi in the SDR basket
A. Bénassy-Quéré & D. Capelle
2011-18 Unilateral trade reform, Market Access and Foreign Competition: the Patterns of Multi-Product Exporters
M. Bas & P. Bombarda
2011-17 The “ Forward Premium Puzzle” and the Sovereign Default Risk
V. Coudert & V. Mignon
2011-16 Occupation-Eduction Mismatch of Immigrant Workers in Europe: Context and Policies
M. Aleksynska & A. Tritah
2011-15 Does Importing More Inputs Raise Exports? Firm Level Evidence from France
M. Bas & V. Strauss-Kahn
2011-14 Joint Estimates of Automatic and Discretionary Fiscal Policy: the OECD 1981-2003
J. Darby & J. Mélitz
2011-13 Immigration, vieillissement démographique et financement de la protection sociale : une évaluation par l’équilibre général calculable appliqué à la France
X. Chojnicki & L. Ragot
2011-12 The Performance of Socially Responsible Funds: Does the Screening Process Matter?
G. Capelle-Blancard & S. Monjon
2011-11 Market Size, Competition, and the Product Mix of Exporters
T. Mayer, M. Melitz & G. Ottaviano
2011-10 The Trade Unit Values Database A. Berthou & C. Emlinger

CEPII, WP No 2011-22 More Bankers, More Growth? Evidence from OECD Countries
22
No Title Authors
2011-09 Carbon Price Drivers: Phase I versus Phase II Equilibrium
A. Creti, P.-A. Jouvet & V. Mignon
2011-08 Rebalancing Growth in China: An International Perspective
A. Bénassy-Quéré, B. Carton & L. Gauvin
2011-07 Economic Integration in the EuroMed: Current Status and Review of Studies
J. Jarreau
2011-06 The Decision to Import Capital Goods in India: Firms' Financial Factors Matter
A. Berthou & M. Bas
2011-05 FDI from the South: the Role of Institutional Distance and Natural Resources
M. Aleksynska & O. Havrylchyk
2011-04b What International Monetary System for a fast-changing World Economy?
A. Bénassy-Quéré & J. Pisani-Ferry
2011-04a Quel système monétaire international pour une économie mondiale en mutation rapide ?
A. Bénassy-Quéré & J. Pisani-Ferry
2011-03 China’s Foreign Trade in the Perspective of a more Balanced Economic Growth
G. Gaulier, F. Lemoine & D. Ünal
2011-02 The Interactions between the Credit Default Swap and the Bond Markets in Financial Turmoil
V. Coudert & M. Gex
2011-01 Comparative Advantage and Within-Industry Firms Performance
M. Crozet & F. Trionfetti
2010-33 Export Performance and Credit Constraints in China J. Jarreau & S. Poncet
2010-32 Export Performance of China’s domestic Firms: The Role of Foreign Export Spillovers
F. Mayneris & S. Poncet
2010-31 Wholesalers in International Trade M. Crozet, G. Lalanne & S. Poncet
2010-30 TVA et taux de marge : une analyse empirique sur données d’entreprises
P. Andra, M. Carré & A. Bénassy-Quéré
2010-29 Economic and Cultural Assimilation and Integration of Immigrants in Europe
M. Aleksynska & Y. Algan

CEPII, WP No 2011-22 More Bankers, More Growth? Evidence from OECD Countries
23
No Title Authors
2010-28 Les firmes françaises dans le commerce de service G. Gaulier, E. Milet & D. Mirza
2010-27 The world Economy in 2050: a Tentative Picture J. Fouré, A. Bénassy-Quéré
& L. Fontagné
2010-26 Determinants and Pervasiveness of the Evasion of Customs Duties
S. Jean & C. Mitaritonna
2010-25 On the Link between Credit Procyclicality and Bank Competition
V. Bouvatier, A. Lopez-Villavicencio
& V. Mignon
2010-24 Are Derivatives Dangerous? A Literature Survey G. Capelle-Blancard
2010-23 BACI: International Trade Database at the Product-Level – The 1994-2007 Version
G. Gaulier & Soledad Zignago
2010-22 Indirect Exporters F. McCann
2010-21 Réformes des retraites en France : évaluation de la mise en place d’un système par comptes notionnels
X. Chojnicki & R. Magnani
2010-20 The Art of Exceptions: Sensitive Products in the Doha Negotiations
C. Gouel, C. Mitaritonna & M.P. Ramos
2010-19 Measuring Intangible Capital Investment: an Application to the “French Data”
V. Delbecque & L. Nayman
2010-18 Clustering the Winners: The French Policy of Competitiveness Clusters
L. Fontagné, P. Koenig, F. Mayneris &S. Poncet
2010-17 The Credit Default Swap Market and the Settlement of Large Defauts
V. Coudert & M. Gex
2010-16 The Impact of the 2007-10 Crisis on the Geography of Finance
G. Capelle-Blancard & Y. Tadjeddine
2010-15 Socially Responsible Investing : It Takes more than Words
G. Capelle-Blancard & S. Monjon
CEPII, WP No 2011-22 More Bankers, More Growth? Evidence from OECD Countries
24
No Title Authors
2010-14 A Case for Intermediate Exchange-Rate Regimes V. Salins & A. Bénassy-Quéré
2010-13 Gold and Financial Assets: Are they any Safe Havens in Bear Markets?
V. Coudert & H. Raymond
2010-12 European Export Performance A. Cheptea, L. Fontagné & S. Zignago
2010-11 The Effects of the Subprime Crisis on the Latin American Financial Markets: An Empirical Assessment
G. Dufrénot, V. Mignon & A. Péguin-Feissolle
2010-10 Foreign Bank Presence and its Effect on Firm Entry and Exit in Transition Economies
O. Havrylchyk
2010-09 The Disorted Effect of Financial Development on International Trade Flows
A. Berthou
2010-08 Exchange Rate Flexibility across Financial Crises V. Coudert, C. Couharde & V. Mignon
2010-07 Crises and the Collapse of World Trade: The Shift to Lower Quality
A. Berthou & C. Emlinger
2010-06 The heterogeneous effect of international outsourcing on firm productivity
Fergal McCann
2010-05 Fiscal Expectations on the Stability and Growth Pact: Evidence from Survey Data
M. Poplawski-Ribeiro & J.C. Rüle
2010-04 Terrorism Networks and Trade: Does the Neighbor Hurt J. de Sousa, D. Mirza & T. Verdier
2010-03 Wage Bargaining and the Boundaries of the Multinational Firm
M. Bas & J. Carluccio
2010-02 Estimation of Consistent Multi-Country FEERs B. Carton & K. Hervé
2010-01 The Elusive Impact of Investing Abroad for Japanese Parent Firms: Can Disaggregation According to FDI Motives Help
L. Hering, T. Inui & S. Poncet

Organisme public d’étude et de recherche en économie internationale, le CEPII est placé auprès du Centre d’Analyse Stratégique. Son programme de travail est fixé par un conseil composé de responsables de l’administration et de personnalités issues des entreprises, des organisations syndicales et de l’Université.
Les documents de travail du CEPII mettent à disposition du public professionnel des travaux effectués au CEPII, dans leur phase d’élaboration et de discussion avant publication définitive. Les documents de travail sont publiés sous la responsabilité de la direction du CEPII et n’engagent ni le conseil du Centre, ni le Centre d’Analyse Stratégique. Les opinions qui y sont exprimées sont celles des auteurs.
Les documents de travail du CEPII sont disponibles sur le site : http//www.cepii.fr.