more ideas. better solutions. - beaufort county, sc
TRANSCRIPT

2310 Parklake Drive, Suite 390, Atlanta, GA 30345 (678) 335‐6084
WEB ADDRESS: www.msa‐ps.com; www.roundaboutresources.org
Page 1 of 26
To: Colin Kinton, PE – Beaufort County, SC
From: Mark Lenters – Ourston, and Joe M. Garcia, PE – Ourston
Subject: Bluffton Parkway at Bluffton Road (SC 46)
Roundabout In‐Service Review
Date: February 15, 2018
BACKGROUND
Ourston was tasked by the Beaufort County to provide an in‐service review of a roundabout at Bluffton Parkway and Bluffton Road in Bluffton, SC. There is concern that the roundabout is experiencing higher than normal number of crashes, albeit, mainly property damage only (PDO) type crashes. The intersection has experienced significant control changes since Bluffton Parkway was connected to SC 46 in 2004 where Bluffton Parkway was under stop control. In 2009, a temporary roundabout was installed by SCDOT as a temporary fix until the permanent roundabout could be installed. In 2011, SC 46 was widened and the permanent multi‐lane roundabout was construction. However, crash incidents have been increasing over time since it was installed. South Carolina Department of Transportation (SCDOT) has tracked the crash incidents since the installation of multilane roundabout. In 2011 there were 6 collisions and in 2016 there was more than 36 collisions. Despite the increase in traffic flow masking some of the increase in collisions, the road authorities wish to reduce the frequency and rate of collisions through application of countermeasures ranging from physical geometry to enforcement, encouragement and education. The intersection is currently exhibiting a total crash frequency of 31 crashes per year, well above a predicted average of approximately 10 to 15 crashes per year. A 50% reduction of crashes per year would need to be achieved for this roundabout to perform within the range of national expected average number of crashes.
The results from this investigation should give informed recommendations to decision makers to combat the probable causes of overrepresented crash patterns with their corresponding countermeasures. Through the implementation of geometric, traffic control, and education countermeasures, it is anticipated that crashes will decrease based on success of similar treatment of other roundabouts. The goal of this effort is to reduce the number of crashes to those typical of other roundabouts with similar traffic flows.
More ideas. Better solutions. ®

MEMO February 15, 2018
Page 2 of 26
STUDY METHODOLOGY
Similar to traditional in‐service reviews (FHWA methods), this study consisted of office and field reviews to document collision patterns and site deficiencies, which in‐turn led to the development and evaluation of collision reduction countermeasures.
A traditional in‐service review normally consists of twelve tasks, including a multi‐disciplinary stakeholder meeting, usually completed on‐site. Ourston eliminated some of the traditional in‐service review tasks, including a start‐up meeting with various key stakeholders, a detailed field conflict analysis, and an economic evaluation for a more streamlined scope of work. The following in‐service tasks were completed:
1. Collision Analysis 2. Geometric Conformance Review (cursory) 3. Operational Analysis (cursory) 4. List of Identified Deficiencies (Office Review) 5. Site Visit – verification of deficiencies 6. Development of Countermeasures 7. Documentation/Reporting
First, a collision analysis was performed to identify target crash patterns. Then, the relative crash frequency in each quadrant of the intersection was compared to the potential conflicts present in each quadrant. Operational analysis was also performed to identify capacity deficiencies that may influence crash patterns.
Field observations were undertaken to identify geometric anomalies, physical deficiencies and driver performance (human factors) issues at the roundabout. Subsequently, countermeasures are proposed based on findings from the previous tasks.
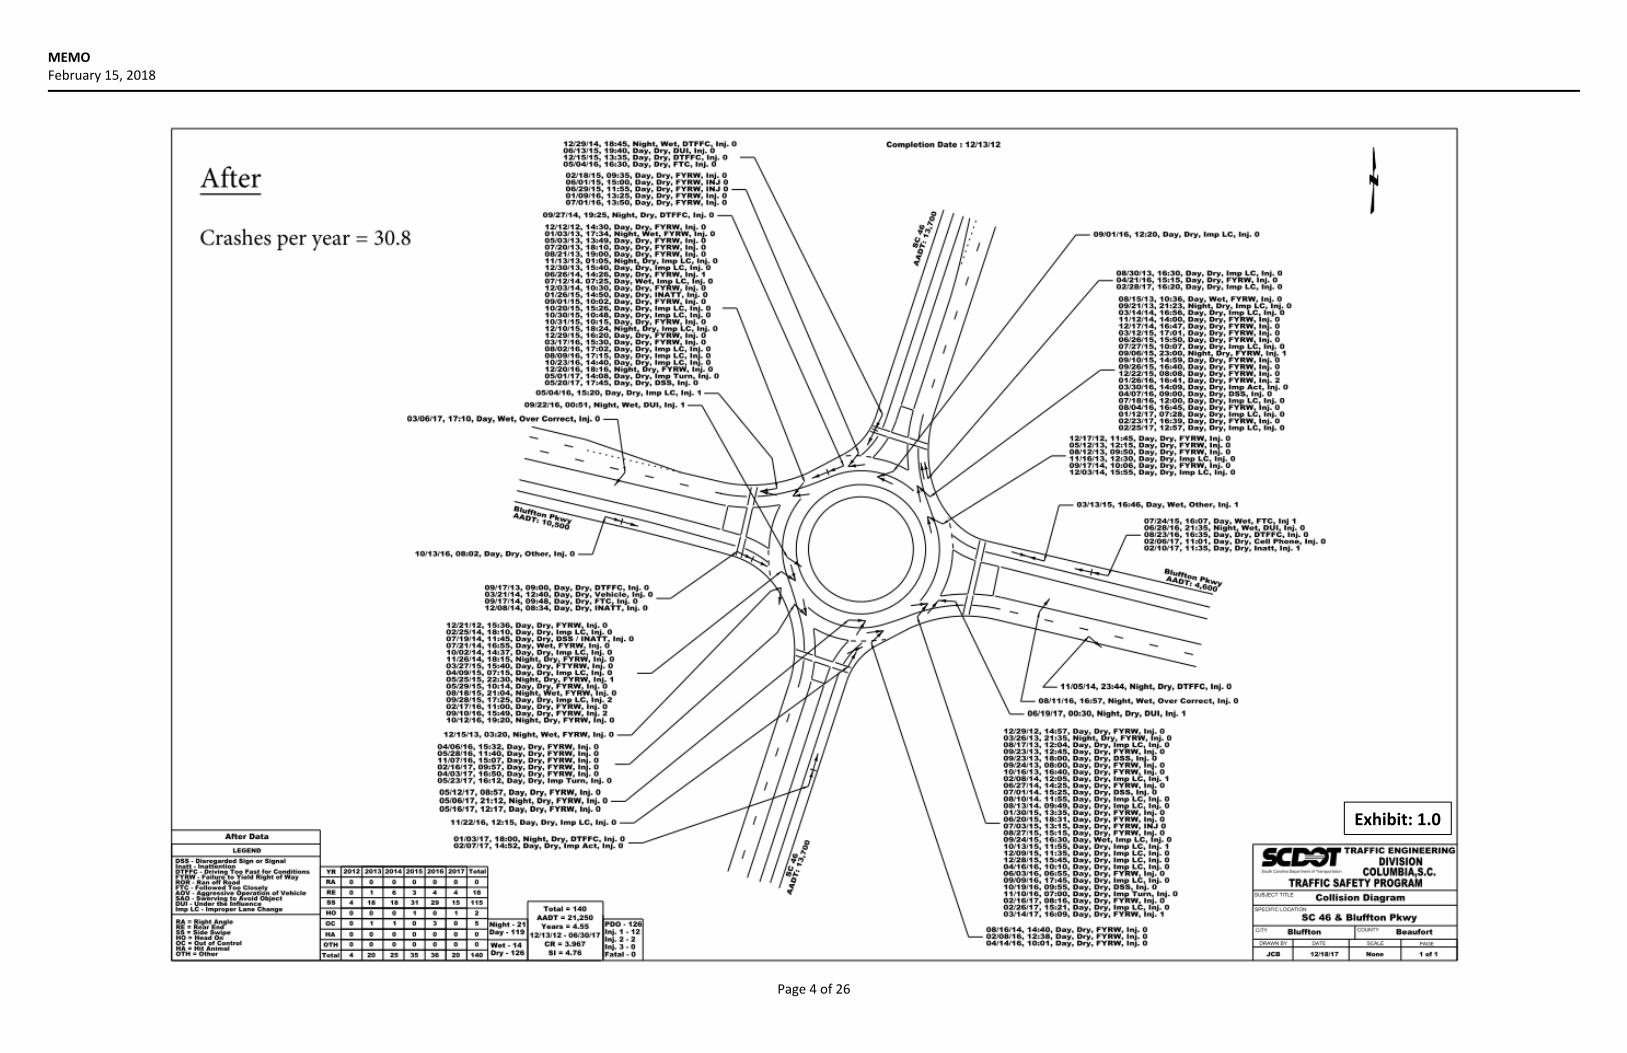
BEFORE AND AFTER STRIPING CHANGE CRASH ANALYSIS
The roundabout opened in early 2011 and after a year and half of operations SCDOT decided to restripe the roundabout to help improve the safety of the intersection. Before the striping change the roundabout was experiencing 35.8 crashes per year. Based on the entering plus circulating volumes a crash rate per quadrant was calculated. A summary of the before and after crash statistics are shown in Table 1.
During the before and after conditions, the AADTs of the intersection have increased from 14,500 to over 22,000. In 2016, the Bluffton Parkway flyover was opened to the east of this intersection and has contributed to the increase in this traffic. Considering the after crash rates have “stabilized” around 1.35 per quadrant, much lower than the before conditions, it is likely the striping change had a decreasing effect total crashes. There is also a likelihood that drivers became more familiar with driving the roundabout, decreasing the number of total crashes per year even with the increase in traffic volumes. It is significant that the crash rate decreased on two of the higher frequency quadrants from the before conditions since those approaches have seen the increase in volumes presently. However, crash patterns are still consistent, indicating drivers are still failing to yield to circulating vehicles and choosing and/or staying in their correct lane. With the current crash rate still at 4.0 MEV the roundabout is still an ideal candidate for safety improvements.

MEMO February 15, 2018
Page 3 of 26
Table 1. Before and After Crash Analysis
AADT Total
crashes per year
Crash Rate
Quadrant Crash Rate FYRW/IMP LC %
NE SE SW NW
Before 14,500 35.8 6.9 2.9 2.8 0.9 1.6 38/62 %
After 22,000 30.8 4.0 1.4 1.5 1.1 1.5 42/58 %
CRASH ANALYSIS
SCDOT retrieved crash data for this intersection from December 13, 2012 through June 30, 2017. Within
this period, 140 crashes were analyzed. Of the crashes on record, there were 0 angle collisions, 115 side‐
swipes, 5 single vehicles, 2 head‐on, and 18 rear‐end collisions. 15 crashes involved injuries, and no
crashes involved a fatality. The crash rate for the intersection is 4.0 MEV. A complete collision diagram
can be found in Exhibit 1.0. A quadrant analysis was also completed to determine which quadrant is
experiencing the highest number of crashes, see Exhibit 2.0. This analysis helps to focus improvement
locations as a means to increase the benefit‐cost per improvement.
Table 2. Collision History
Total 2012 2013 2014 2015 2016 2017
Total crashes 140 4 20 25 35 36 20
Injury 15 0 0 2 6 4 3
Fatal 0 0 0 0 0 0 0
Rear-end 18 0 1 6 3 4 4
Angle* 0 0 0 0 0 0 0
Sideswipes** 115 4 18 18 31 29 15
Head-On 2 0 0 0 1 0 1
Single Vehicle 5 0 1 1 0 3 0
*Angle collisions include Left-turn opposing, Left-turn, Right-angle, Angle opposing, Angle similar direction, Turn opposing and Right-turn side
**Sideswipes collisions include Sideswipe same direction, Sideswipe opposite directions and Overtake
MEMO February 15, 2018
Page 4 of 26
Exhibit: 1.0

MEMO February 15, 2018
Page 5 of 26

MEMO February 15, 2018
Page 6 of 26
Table 3 shows the distribution of contributing factors for crashes at the intersection of Bluffton Parkway at SC 46. As indicated in the table, the majority of contributing factors are failure to yield and improper lane change or using the wrong lane. Both of these contributing factors correlate to the major crash type, sideswipe (Table 2).
Table 3. Totals by Contributing Factor
Contributing Factor #
Failure To Control 7
Failure To Yield 75
Followed Too Close 6
Improper Lane Change/Passing/Turn 42
Other 10
Total 140
Table 4 shows the distribution of crash severities at the intersection, along with a comparison of average injury and property damage only crashes at roundabouts across the US, and in WI and MN. As indicated in the table, the majority of crashes are property damage type crashes; however, injury crashes are slightly higher than national averages.
Table 4. Totals by Crash Severity
Crash Severity Site # % of Total
US %1 WI %2 MN %3 Avg.
Injury/fatality Crash 15 11% 6.5% 23.6% 8.8% 13.0%
Property Damage Crash 125 89% 93.5% 76.4% 91.2% 87.0%
Two studies documented in the US Roundabout Design Guide (NCHRP 672) list percentages of crash types at roundabouts in the US and offer a comparison to international data. The first study categorizes crashes by location within the roundabout while the second study categorizes crashes by type. A comparison of the recorded crash locations/types at the Bluffton Parkway at SC 46 roundabout to US and international averages is provided in Table 5 and Table 6. Compared to US national averages, there is an overrepresentation of entering‐circulating crashes (Table 5). Entering‐circulating crashes are most likely attributed to failure to yield or inability of drivers to competently judge gaps in circulating traffic.
1 Using the crash Prediction Methodology in Chapter 5.4, NCHRP Report 672 2 Applied Calibration based on Persaud and Lyon Inc. study of 56 roundabouts in Wisconsin, May 2017 3 Evaluating the Performance and Safety Effectiveness of Roundabouts, The Michigan Department of Transportation, 2011

MEMO February 15, 2018
Page 7 of 26
Table 5. Comparison of Crash Type to US averages (NCHRP 672, Exhibit 5‐11)
Crash Type/Location Percent (US National Averages)
Recorded Totals
Recorded Percentages
Entering‐Circulating (FTY) 23% 75 53.6%
Exiting‐Circulating 31% 42 30.0%*
Rear‐End on Leg 31% 16 11.4%
Loss of Control on Leg 13% 7 5.0%
Pedestrian and Bicycle 2% 0 0.0%
Other N/A 0 0%
*Exit-Circulating crashes includes right-turn entering from left lane
Table 6. Comparison of the Top Five Crash Types to National Averages (NCHRP 672, Exhibit 5‐12)
Crash Type France Australia United Kingdom
US Double‐Lane
International Averages
Recorded Percentages
Failure to Yield (Angle4) 36.6% 50.8% 71.1% 17% 43.9% 53.6%
Single Vehicle (Fixed Object/Loss of Control)
30.2% 18.2% 8.2% 28% 21.2% 3.6%
Rear End 8.9% 18.3% 7% 19% 13.3% 12.9%
Sideswipe 8.4% 10.1% ‐ 28% 15.5% 30.0%
Ped/Bike 12.4% ‐ 3.5% 4% 6.6% 0.0%
Based on crash prediction models, shown in Table 7, the roundabout is experiencing, more crashes, of all severities, than expected. This demonstrates the need for improvements at the intersection to reduce annual crashes to nationally predicted levels. A reduction 22 crashes per year, a 71% reduction, would achieve safety operations comparable to model predictions.
4 These types of crashes are coded as sideswipes.

MEMO February 15, 2018
Page 8 of 26
Table 7. Comparison of Actual Collision Frequency to Predicted Frequency (crashes per year)
Collision Class
Expected Annual Crashes
(NCHRP Model) 5
95th Percentile Expected Crash
Frequency
(NCHRP Model)
Expected Annual Crashes
(WI Calibrated NCHRP Model
2017) 6
95th Percentile Expected Crash
Frequency
(WI Calibrated NCHRP Model
2017)
Expected Annual Crashes
(MDOT Safety Performance Functions 2011) 7
95th Percentile Expected Crash
Frequency
(MDOT Safety Performance
Functions 2011)
Recorded Annual Freq. of Crashes
(2012 to 2017)
Total Crashes
6.6 17.7 5.1 15.2 1.9 5.4 30.8
Injury Crashes
0.5 1.2 1.2 3.2 0.2 0.5 3.3
Bluffton Parkway at SC 46 is experiencing a crash rate of 4.0 crashes per million entering vehicles (MEV). This is well above the expected crash rate ranging from 0.8 to 0.2 MEV, shown in Table 8.
Table 8. Comparison of Actual Crash Rate to Predicated Crash Rates
Collision Class Site Crash Rate (2012 to 2017)
NCHRP Expected Crash Rate5
WI Expected Crash Rate6
MN Expected Crash Rate7
Total Crashes 4.0 MEV 0.9 MEV 0.7 MEV 0.2 MEV
Injury Crashes 0.43 MEV 0.06 MEV 0.15 MEV 0.03 MEV
Based on the distribution of crashes and the potential exposure to conflicts (based on entering and circulating ADT counts), the southeast (SE) and northwest (NW) quadrants are experiencing higher than expected crashes, see Table 9. This would indicate that the SE and NW quadrants have significance and are the prime candidates for improvement. Refer to Exhibit 2.0 for illustration of the crashes by quadrant.
5 Using the crash Prediction Methodology in Chapter 5.4, NCHRP Report 672 6 Applied Calibration based on Persaud and Lyon Inc. study of 56 roundabouts in Wisconsin, May 2017 7 Evaluating the Performance and Safety Effectiveness of Roundabouts, The Michigan Department of Transportation, 2011

MEMO February 15, 2018
Page 9 of 26
Table 9. Distribution of Crashes and Conflict Exposure on the Circulating Roadway
Quadrant
Avg. Annual Crashes By Quadrant
2017 Potential Conflicts Crash Rate by
Quadrant No. Percentage No. Percentage
NW 8.1 26% 3,189 15% 1.5
NE 7.7 25% 6,375 30% 1.4
SW 6.2 20% 7,650 36% 1.1
SE 8.8 29% 4,038 19% 1.5
Total 30.8 21250 ‐
GEOMETRIC CONFORMANCE REVIEW
The roundabout is a radial design that is defined by approaches coming directly into the roundabout 90 degrees apart from each other. This type of design puts all of the speed control of the roundabout at the central island. This results in high entry (R1) speeds exceeding the recommend 28 MPH for multi‐lane roundabouts. The circulating speed (R2) is relatively low compared to the entry speed resulting in excess braking transitioning from entering to circulating. Radial design tends to concentrate speed change on the final few feet prior to entering the roundabout, which is inadequate for drivers and contributes to excessive braking. This has been shown to contribute to failure to yield crashes. The central island controls speeds on a radial design the inscribed circle diameter (ICD) needs to be larger, in this case, the roundabout’s ICD is 200 feet. Furthermore, vehicles entering the roundabout have a long conflict area and poor phi angle entering the roundabout, especially for the outside lanes. The entry angle is called the Phi angle. It is a measure of sight to the left and ease of entry to the right. These long conflict areas and fast entry speeds are likely the main reason for failure to yield crashes. Multi‐lane roundabout entry and exits need to include a path overlap tangent, typically a minimum of 50 feet in length, to aid vehicles in proper lane choice. This roundabout’s path overlap tangent is shorter than the 50 feet minimum, contributing to the roundabout’s improper lane crash pattern. Additional geometric deficiencies are shown in Exhibit 3.0.
Preferred multi‐lane roundabout designs incorporates an offset‐left design which incorporates the entry radii and central island to control fast path speeds within the recommended range. Typical two by two roundabout ICD’s range from 150 to 190 feet, smaller than this radial design.

MEMO February 15, 2018
Page 10 of 26

MEMO February 15, 2018
Page 11 of 26
OPERATIONAL ANALYSIS
The existing roundabout was analyzed in Junctions 9 (ARCADY) roundabout design and capacity analysis software. ARCADY (Assessment of Roundabout Capacity and Delay) is a program based on U.K. empirical research into geometry‐capacity relationships. Two features that ARCADY provides are: its ability take into account horizontal geometric design sensitivity and its ability to be calibrated. These two features are critical to accurately modeling the in‐service roundabout to determine expected operations for any proposed roundabout geometric modifications. It was determined that a 10% capacity reduction factor was required to calibrate the software to match field observations of queues for the AM and PM peak hours. Turning movement counts conducted by Quality Counts in August 31, 2017 are shown in Figure 1.
The results of the analysis represent capacity measures of level of service (LOS), delay and queuing, consistent with typical unsignalized capacity analysis methodologies (Highway Capacity Manual, 2010). The results of the ARCADY analyses are summarized in Table 10, detailed reports are in Appendix A. In general, the roundabout is exhibiting acceptable operations during the peak periods.
Figure 1. 2017 Peak Hour Turning Movement Volumes

MEMO February 15, 2018
Page 12 of 26
Table 10. Roundabout Operational Analysis
SB SC 46
EB Bluffton Pkwy
NB SC 46 WB Bluffton
Pkwy
ARCADY 9.0
AM
Peak
LOS A B A A
Queue (ft) 25 225 50 25
v/c 0.31 0.81 0.56 0.50
Delay (s) 4.0 10.5 7.8 4.1
PM
Peak
LOS A A A B
Queue (ft) 50 25 25 200
v/c 0.67 0.61 0.62 0.79
Delay (s) 9.7 5.0 7.0 10.6 LOS Source: 2010 Highway Capacity Manual - Unsignalized Intersections Delay in Seconds Queue represents 95th percentile queue per lane, 25 feet per vehicle
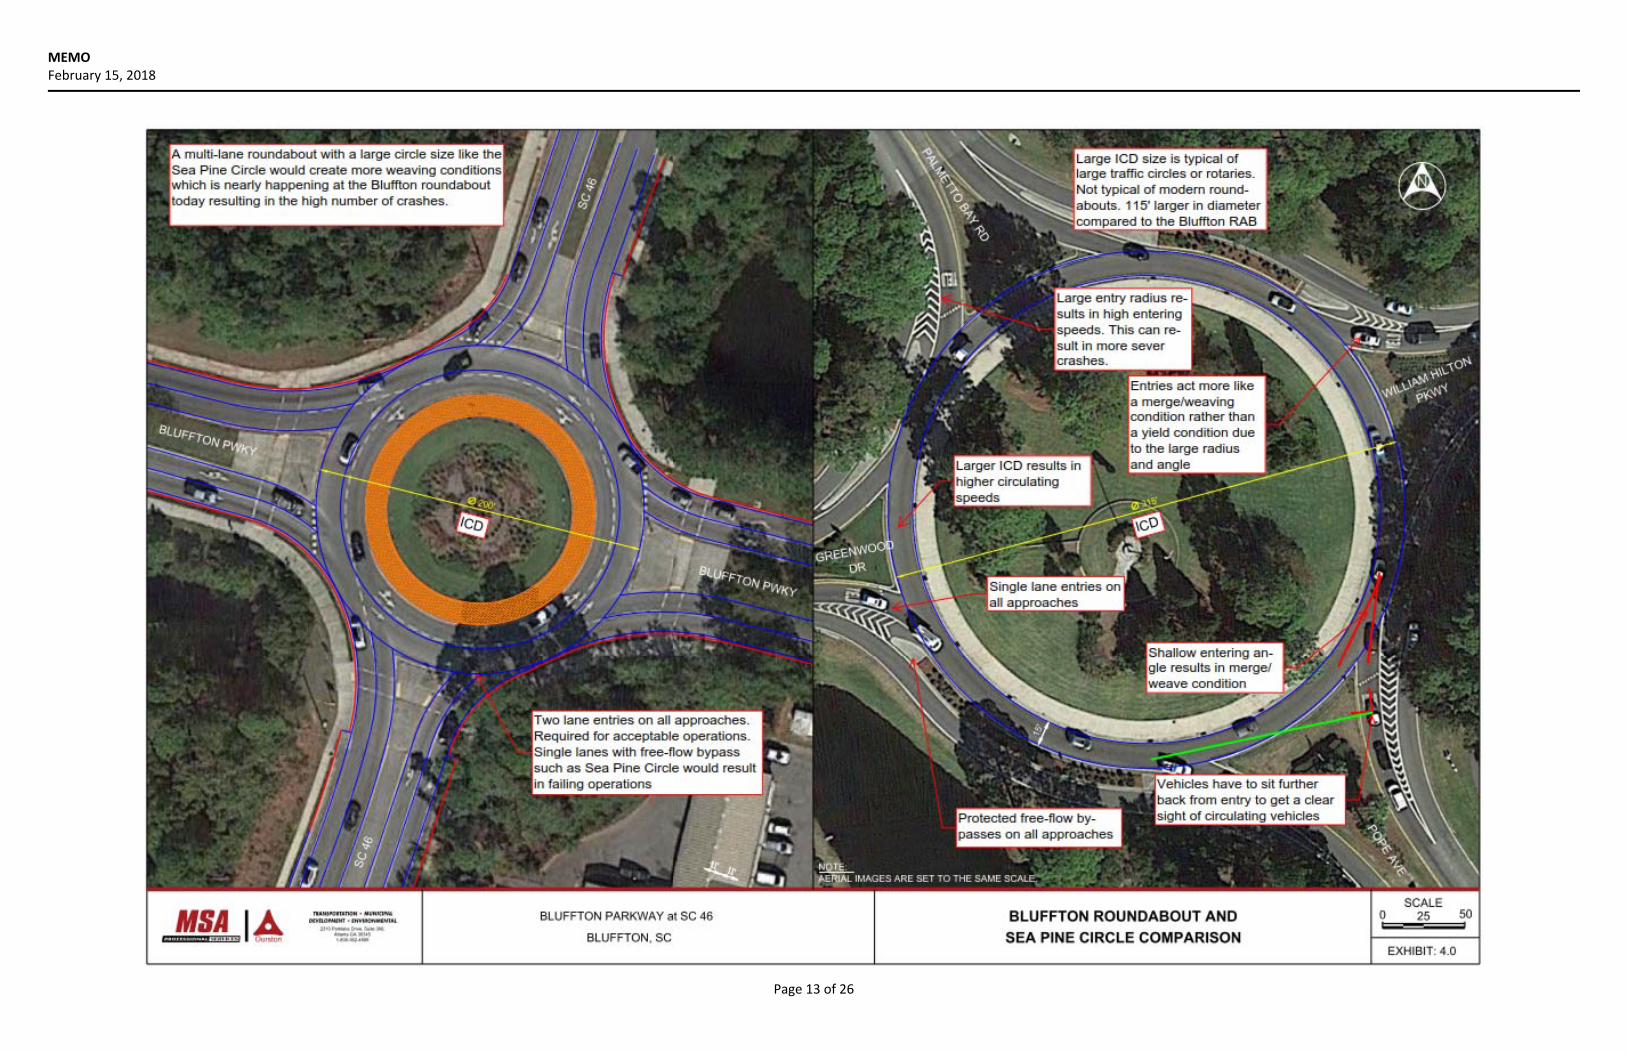
SITE VISIT
Ourston conducted a site visit on Tuesday, January 16th, 2018. During the site visit roundabout operations, driver behavior, geometric deficiencies, signing and marking were reviewed to supplement the office review and develop suitable countermeasures. The Sea Pine circle was also visited to compare geometry, driver behavior and operations. The following section summarizes observations made during the site visit to help determine the roundabout’s safety deficiencies.
Drivers had trouble navigating the large conflict area – Drivers had trouble anticipating acceptable gaps to enter
Poor night time lighting
No exit guide signs for identification and navigation to downstream destinations
No overhead lane designation signage for added conspicuity and improved lane choice
Reduce height of roundabout chevrons on the central island (less that 5ft. is not unreasonable, especially with modern vehicle headlamps
Shorten exit stripes, so that the lane line does not need to be crossed by a vehicle on the inside (left) lane and exiting.
The Sea Pine circle is single‐lane with free‐flow bypasses on all approaches, much larger o Queues stretch more than a quarter mile during peak periods o The circle would be crash prone if multi‐lane o It is not possible to reduce the Bluffton roundabout to single lane due to the higher traffic
demands there Further comparison of the Sea Pine circle to the Bluffton roundabout this shown in Exhibit 4.0
MEMO February 15, 2018
Page 13 of 26
MEMO February 15, 2018
Page 14 of 26
COUNTERMEASURE ALTERNATIVES
Several countermeasures to improve the safety of the Bluffton Parkway at SC 46 roundabout are presented in this section for consideration by Beaufort County. Countermeasures are organized into low, medium, and high categories. Low countermeasures include improvements that are low‐cost or can be implemented immediately. Medium countermeasures are expected to cost more than the low countermeasures, but can likely be implemented at a lower cost than the high counter measures. High countermeasures are expected to incur the most cost, and usually require the most reconstruction of the intersection to implement.
LOW/IMMEDIATE COUNTERMEASURES
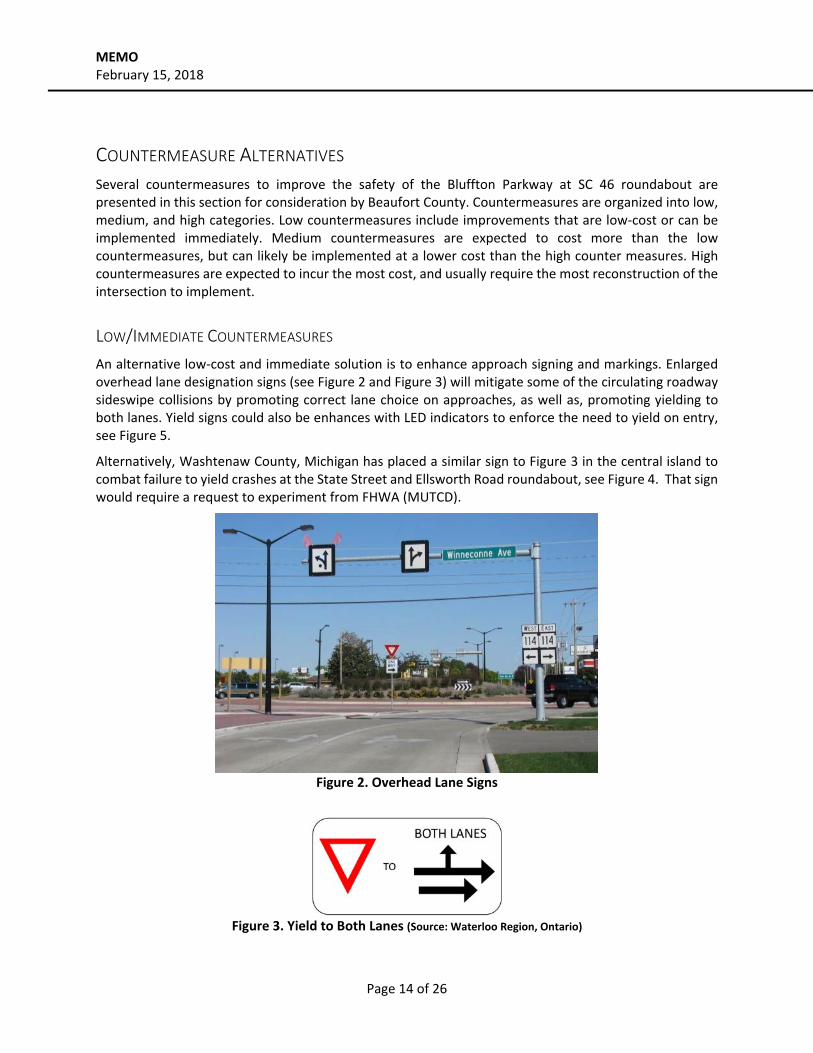
An alternative low‐cost and immediate solution is to enhance approach signing and markings. Enlarged overhead lane designation signs (see Figure 2 and Figure 3) will mitigate some of the circulating roadway sideswipe collisions by promoting correct lane choice on approaches, as well as, promoting yielding to both lanes. Yield signs could also be enhances with LED indicators to enforce the need to yield on entry, see Figure 5.
Alternatively, Washtenaw County, Michigan has placed a similar sign to Figure 3 in the central island to combat failure to yield crashes at the State Street and Ellsworth Road roundabout, see Figure 4. That sign would require a request to experiment from FHWA (MUTCD).
Figure 2. Overhead Lane Signs
Figure 3. Yield to Both Lanes (Source: Waterloo Region, Ontario)
MEMO February 15, 2018
Page 15 of 26
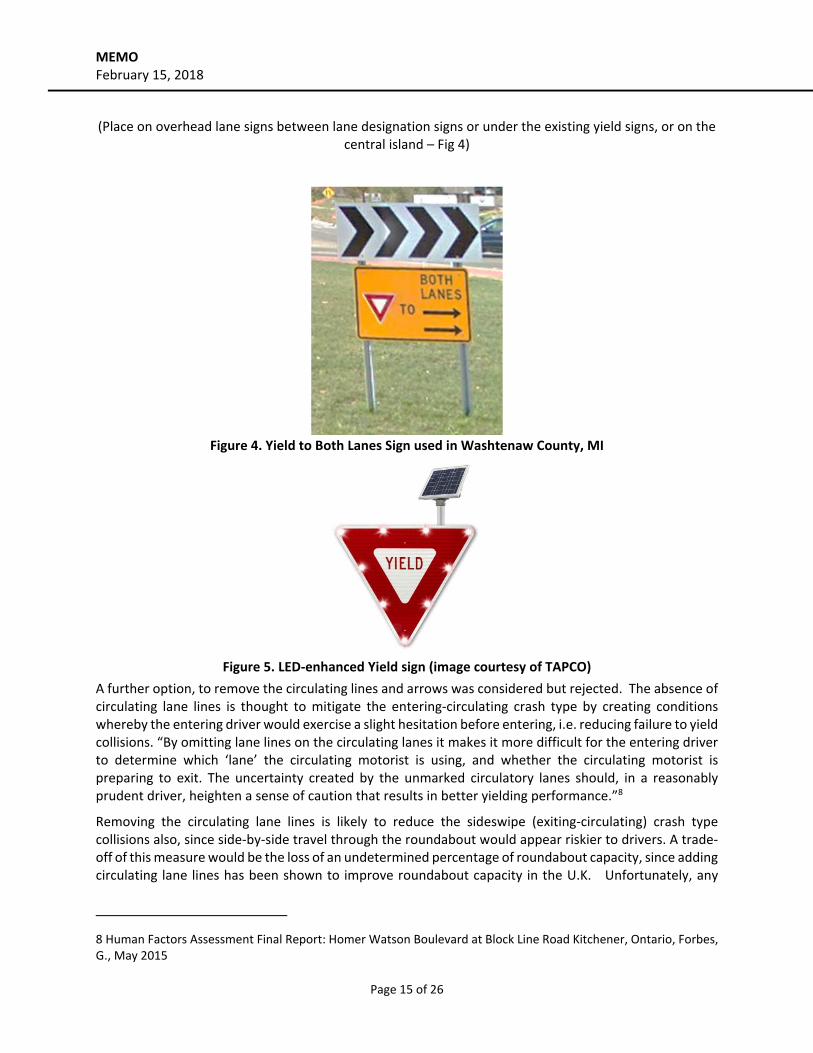
(Place on overhead lane signs between lane designation signs or under the existing yield signs, or on the central island – Fig 4)
Figure 4. Yield to Both Lanes Sign used in Washtenaw County, MI
Figure 5. LED‐enhanced Yield sign (image courtesy of TAPCO)
A further option, to remove the circulating lines and arrows was considered but rejected. The absence of circulating lane lines is thought to mitigate the entering‐circulating crash type by creating conditions whereby the entering driver would exercise a slight hesitation before entering, i.e. reducing failure to yield collisions. “By omitting lane lines on the circulating lanes it makes it more difficult for the entering driver to determine which ‘lane’ the circulating motorist is using, and whether the circulating motorist is preparing to exit. The uncertainty created by the unmarked circulatory lanes should, in a reasonably prudent driver, heighten a sense of caution that results in better yielding performance.”8
Removing the circulating lane lines is likely to reduce the sideswipe (exiting‐circulating) crash type collisions also, since side‐by‐side travel through the roundabout would appear riskier to drivers. A trade‐off of this measure would be the loss of an undetermined percentage of roundabout capacity, since adding circulating lane lines has been shown to improve roundabout capacity in the U.K. Unfortunately, any
8 Human Factors Assessment Final Report: Homer Watson Boulevard at Block Line Road Kitchener, Ontario, Forbes, G., May 2015
MEMO February 15, 2018
Page 16 of 26
solution that creates undue congestion is untenable at this location; therefore, removal of the circulatory lane lines is not recommended.
Overhead lane designation signs on each approach is still recommended as an immediate improvement, regardless of what geometric design or marking alterations are contemplated now or later. The fish‐hook arrow markings should also be replaced with standard arrow markings. These standard arrows are more legible and more widely recognized by drivers.
An additional low cost countermeasure would be to apply an epoxy surface coloration to outline the conflict area between entering and circulating vehicles (see Exhibit 5.0) This countermeasure hasn’t been applied on any roundabouts to date. Highlighting the conflict area to entering drivers would encourage improved yielding and provide a clear indication of how far the driver has to cross to clear circulating traffic. This countermeasure would involve applying an epoxy surface color to the pavement. A “rusty red” color would then mark the conflict area. It would include re‐striping circulatory lane lines, and adding in entering lane dots to reinforce lane separation on entry. Two companies, Ennis and TransSafe, provide this color pavement marking treatment that uses a slurry type epoxy that is skid resistance, last for 7 plus years, and allows for custom colors. This product is widely used for coloring bike paths across the country and is approved for use on roadways. Product sheets from both companies are attached in Appendix B. Exhibit 5.0 illustrates these modifications on the existing geometry. Based on the following a request to experiment would need to be submitted to FHWA to test this countermeasure since the coloring of the conflict area is a guide/warning to drivers.
A memorandum from FHWA on the MUTCD Official Ruling on the Application of Colored Pavement, dated August 15, 2013 states: Paragraph 3 of Section 3G.01 in the MUTCD limits the use of colored pavement used as a traffic control device to the colors yellow and white. Interim Approval IA‐14 permits the use of green colored pavement for marked bicycle lanes. All other colors for use on highway pavement in the right‐of‐way are either disallowed or are experimental as described above, unless the colored pavement is a purely aesthetic treatment and makes no discernible attempt to communicate with a roadway user.”

MEMO February 15, 2018
Page 17 of 26

MEMO February 15, 2018
Page 18 of 26
Campaigning for driver education about lane choices and yielding behavior is a low‐cost measure that will also serve to relieve the failure to yield and improper lane change issue. Education should also focus on different type of roundabouts particularly concerning the Sea Pine circle. The Sea Pine circle is more like a rotary rather than a modern roundabout, which may be confusing drivers proper driving techniques, i.e. yielding at entry. Rotaries entries act more like a merge condition, similar to on‐ramps to major highways; however, modern roundabout entries are yield conditions requiring the driver to yield at the entry and enter the roundabout only when an appropriate gap is available. Appendix C provides examples of hand‐outs and flyers that could be used at the time the immediate countermeasures are installed, we recommend the brochures to prepared in Spanish also. We also recommend selective enforcement whereby police officers will give warnings and hand out one of the education brochures.
MEDIUM COUNTERMEASURES
2X1 HYBRID ROUNDABOUT DESIGN
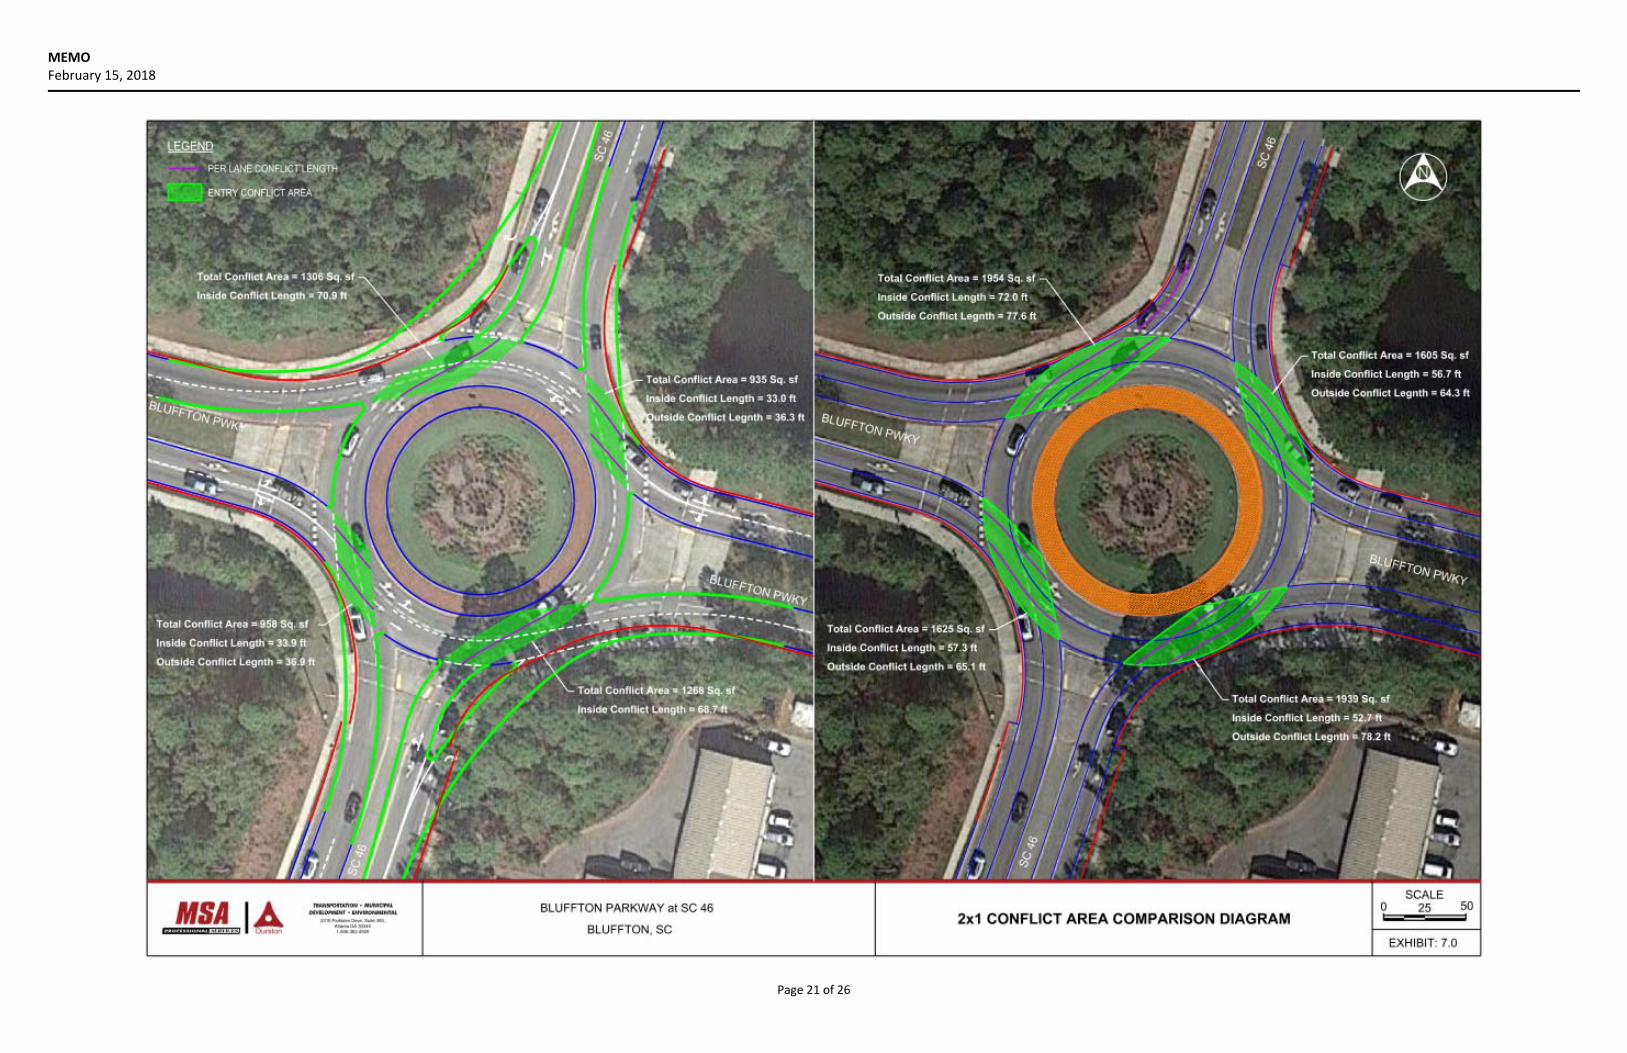
A reduction in lanes was investigated to reduce the number of conflict points. A 2x1 with northbound and southbound yielding bypasses reduces the number of conflict points in the NW and SE quadrants to half, see Exhibit 6.0. Those quadrants exhibit the highest rate of crashes. The design also incorporates improved exit tangents and gradual exit radii. The reduction in conflict area and conflict points, increased speed control on entry, and improved exit path tangents and radii is expected to reduce the complexity of gap‐seeking, the failure‐to‐yield crashes and improper lane change crashes. A comparison of the current and 2x1 roundabout design conflict areas are shown in Exhibit 7.0.
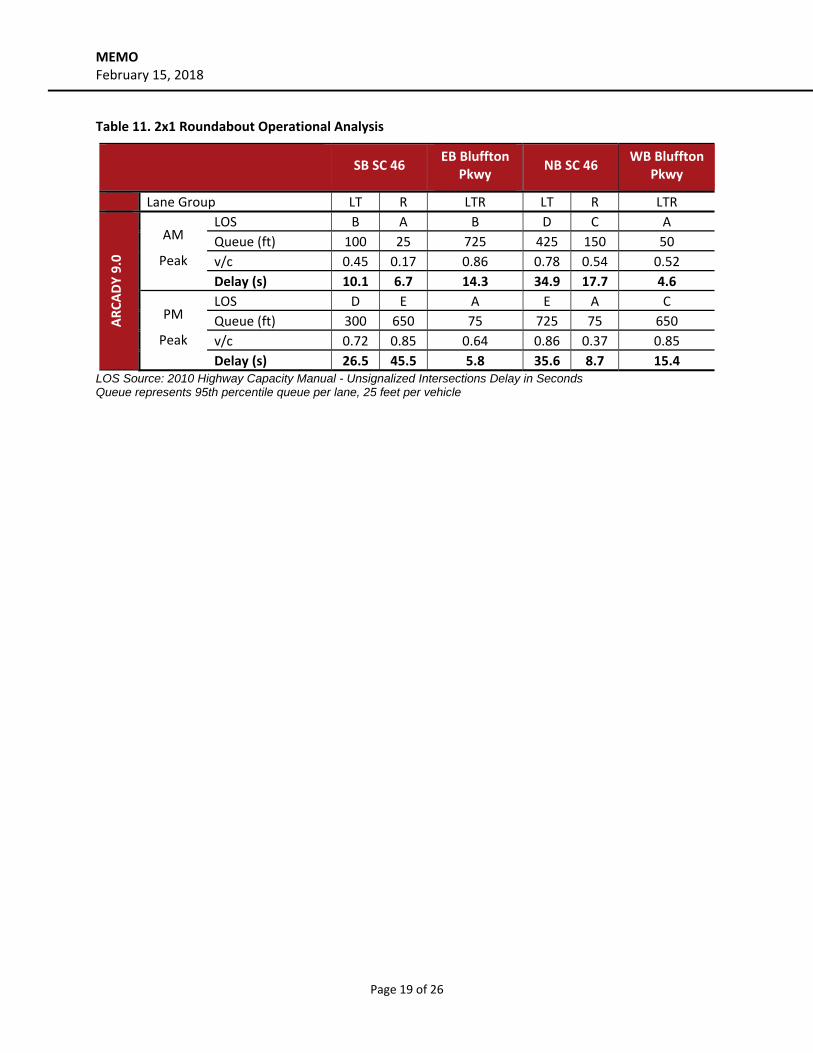
An updated operational analysis was completed to ensure that these modifications would not produce unacceptable operations. The operational analysis was completed in ARCADY 9.0 with a 10% capacity reduction, results are shown in Table 11, detailed reports are in Appendix A. As shown in the table, these modifications will incur oversaturation on some of the approaches during short periods in the PM peak hour. The roundabout then has no residual capacity for any expected future growth. Sensitivity analysis was completed in ARCADY using a 5% capacity reduction instead of a 10% reduction resulting in a residual capacity of 6% and acceptable operations. A 5% capacity reduction would assume drivers are able to navigate the roundabout more efficiently because of the decrease in complexity of the conflict area. It is likely the 2x1 roundabout will operate somewhere in between the 10% and 5% capacity reduction results. At a compounding growth rate of 2% per year the roundabout is expected to operate acceptable for 3 years with a 5% capacity reduction.
MEMO February 15, 2018
Page 19 of 26
Table 11. 2x1 Roundabout Operational Analysis
SB SC 46
EB Bluffton Pkwy
NB SC 46 WB Bluffton
Pkwy
Lane Group LT R LTR LT R LTR
ARCADY 9.0
AM
Peak
LOS B A B D C A
Queue (ft) 100 25 725 425 150 50
v/c 0.45 0.17 0.86 0.78 0.54 0.52
Delay (s) 10.1 6.7 14.3 34.9 17.7 4.6
PM
Peak
LOS D E A E A C
Queue (ft) 300 650 75 725 75 650
v/c 0.72 0.85 0.64 0.86 0.37 0.85
Delay (s) 26.5 45.5 5.8 35.6 8.7 15.4 LOS Source: 2010 Highway Capacity Manual - Unsignalized Intersections Delay in Seconds Queue represents 95th percentile queue per lane, 25 feet per vehicle

MEMO February 15, 2018
Page 20 of 26
MEMO February 15, 2018
Page 21 of 26

MEMO February 15, 2018
Page 22 of 26
HIGH COUNTERMEASURE ‐ FULL REBUILD
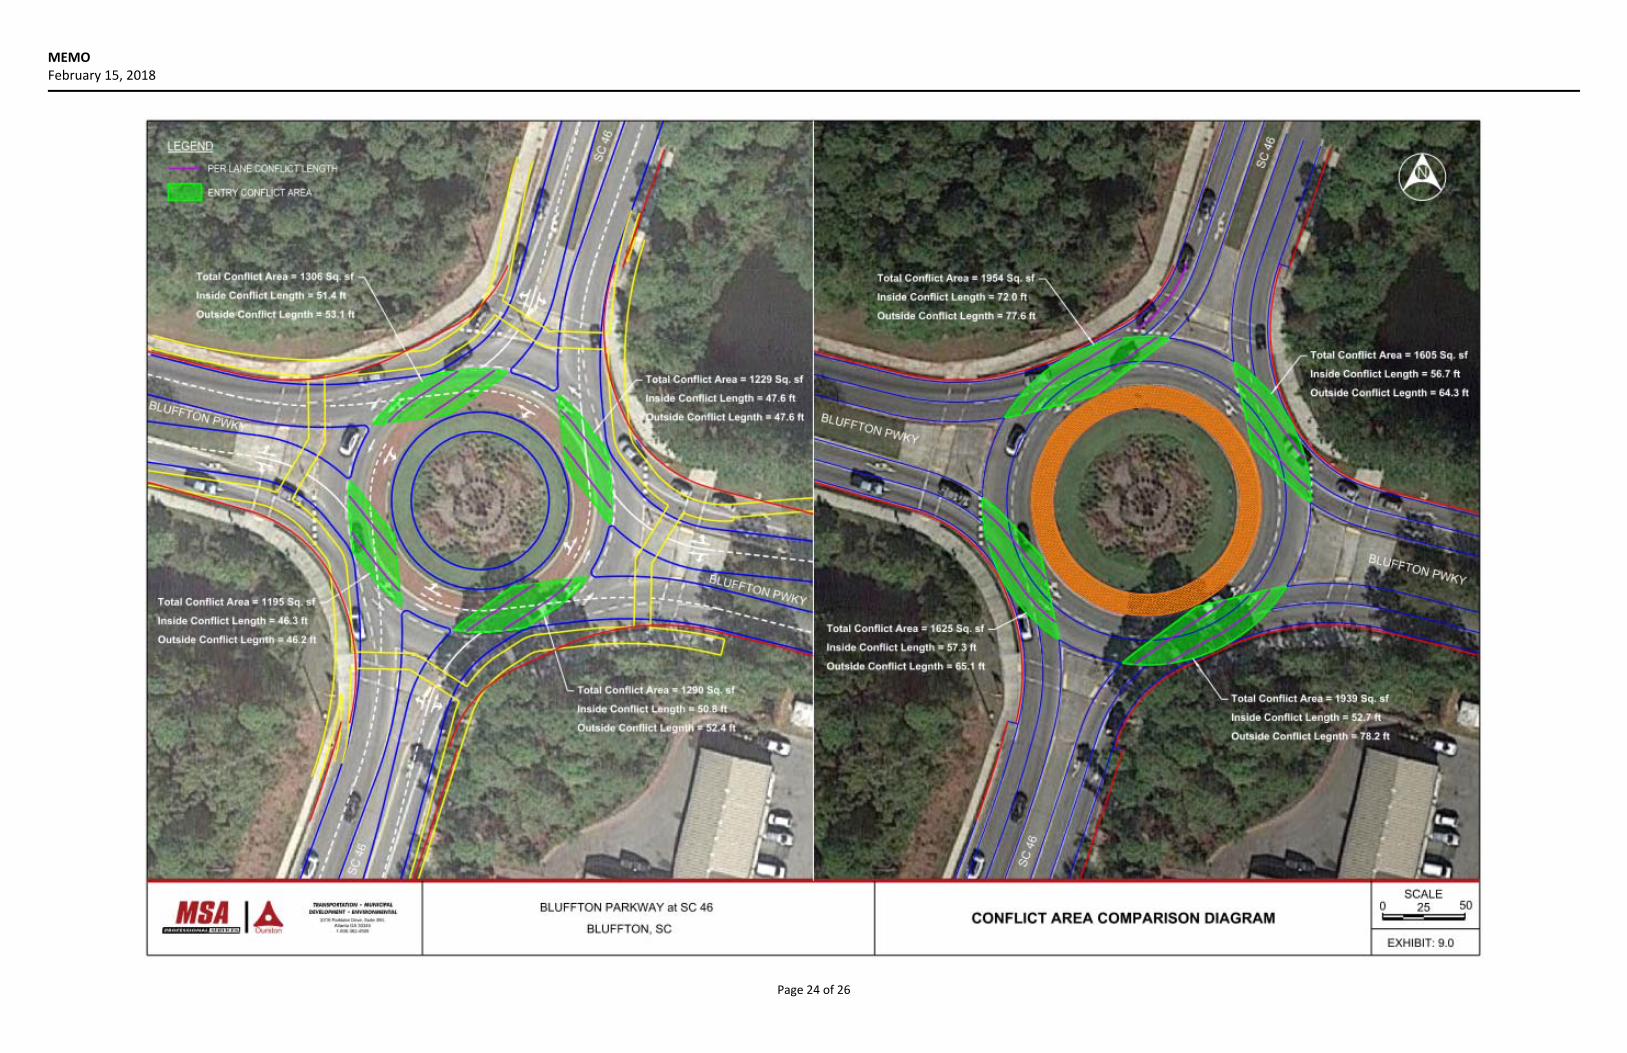
The rebuild alternative is the highest cost option, but provides the ideal geometric design based on current design standards. The redesigned roundabout is able to fit within the existing curb lines and would not require ROW acquisition for its rebuild, see Exhibit 8.0. The roundabout conforms to present day design practices including an offset‐left design, 160’ ICD, longer path tangents on entry and exit, entry speeds of 28 MPH or less, and reducing vehicle conflict areas. A comparison of the current and full rebuild roundabout design conflict areas are shown in Exhibit 9.0. As seen in this exhibit, conflict areas and conflict path lengths are reduced, especially the outside lane. Vehicles also travel on a tangent through the conflict area rather than curves currently experience in the existing design. By reducing this conflict area, reduced entry speeds, and longer entry and exit path tangents failure to yield and improper lane change crashes are expected to decrease to within national averages. Further driver education is still strongly encouraged with this countermeasure.
An updated operational analysis was completed to ensure that these modifications would not produce unacceptable operations. The operational analysis was completed in ARCADY 9.0 with a 10% capacity reduction results are shown in Table 12, detailed reports are in Appendix A. As shown in the table, the roundabout is expected to operate with acceptable operations. Residual capacity analysis indicates that with an increase of traffic of 16% on all approaches, westbound Bluffton Parkway will begin to experience poor level of service in the PM Peak. At a compounding growth rate of 2% per year the roundabout is expected to operate well for 8 to 10 years, but begin to experience peak hour delays after 8 years.
Table 12. Full Rebuild Roundabout Operational Analysis
SB SC 46
EB Bluffton Pkwy
NB SC 46 WB Bluffton
Pkwy
ARCADY 9.0
AM
Peak
LOS A A A A
Queue (ft) 25 150 50 25
v/c 0.30 0.78 0.56 0.48
Delay (s) 3.8 8.7 7.8 3.8
PM
Peak
LOS A A A A
Queue (ft) 50 25 25 150
v/c 0.67 0.58 0.60 0.77
Delay (s) 9.6 4.6 6.6 9.4 LOS Source: 2010 Highway Capacity Manual - Unsignalized Intersections Delay in Seconds Queue represents 95th percentile queue per lane, 25 feet per vehicle
Additional residual capacity can be achieved by adding right‐turn yielding bypasses to the eastbound, westbound, and southbound approaches. By adding bypasses to these approaches an additional 8% residual capacity is gained, resulting in a critical residual capacity of 24% in the AM Peak. At a compounding growth rate of 2% per year the roundabout is expected to operate well for 11 to 13 years, but will begin to experience peak hour delays after 11 years. Detail reports of this analysis are seen in Appendix A. The bypass lanes can be constructed when they are necessary or installed concurrently with the overall reconstruction . A concept layout of the full rebuild with the additional right‐turn yielding bypasses are show in Exhibit 9.0.

MEMO February 15, 2018
Page 23 of 26
MEMO February 15, 2018
Page 24 of 26

MEMO February 15, 2018
Page 25 of 26

MEMO February 15, 2018
Page 26 of 26
CONCLUSIONS, RECOMMENDATIONS AND APPROXIMATE COSTS
Based on the crash analysis, there is an overrepresentation of sideswipe crashes caused by failure to yield and improper lane changes at the intersection. The higher‐than‐expected frequency of crashes, of all severities types, indicates a high potential for safety improvement. The NW and SE quadrants of roundabout have the highest percentage of crashes. Findings from this report suggest that deficiencies in the three areas of signing and marking, operations, and geometry are contributors to driver error and the high percentages of crashes.
A 50% reduction of crashes per year would need to be achieved for this roundabout to perform within the range of national expected average number of crashes. This is an ambitious goal for an existing roundabout. Current research into the collision modification benefits of various roundabout safety countermeasures is not well‐established in the U.S. Generally, a geometry that conforms to the current guidelines is considered a safer design when accompanied by an aggressive public education/enforcement campaign. Case precedents of crash reduction have been observed for the kinds of improvements that are proposed in this report.
Due to the current geometry of the roundabout and the equal spread of crashes across each approach there is no approved low to medium cost solution that will likely decrease the number of crashes to national averages. It was determined, through discussions with Beaufort County, that SCDOT would likely not pursue testing approval from FHWA for the red colored conflict area pavement marking eliminating this countermeasure. The medium cost, 2x1 roundabout, countermeasure is not considered for implementation because it would suffer from poor operations less than 3 years from construction.
The high cost, full rebuild, countermeasure should be implemented to combat the high number of crashes at this intersection. It is expected that a roundabout that provides ideal geometric design elements based on current design standards will decrease crashes, but as to how much is uncertain. This countermeasure should also include improved signing and markings as described in the low cost countermeasure section. Additionally, selective enforcement by the local Sheriff’s office and more widespread driver education will improve awareness and reinforce proper driver behavior at this roundabout. Warnings can be handed out as one of the educational measures. This countermeasure will likely cost between $1,500,000 to $2,000,000.