more scottish than british ||
TRANSCRIPT

More Scottish than BritishThe 2011 Scottish Parliament ElectionRobert Johns; Christopher Carman; James MitchellISBN: 9781137023704DOI: 10.1057/9781137023704Palgrave Macmillan
Please respect intellectual property rights
This material is copyright and its use is restricted by our standard site license terms and conditions (see palgraveconnect.com/pc/connect/info/terms_conditions.html). If you plan to copy, distribute or share in any format, including, for the avoidanceof doubt, posting on websites, you need the express prior permission of PalgraveMacmillan. To request permission please contact [email protected].

10.1057/9781137023704 - More Scottish than British, Christopher Carman, Robert Johns and James Mitchell
Co
pyr
igh
t m
ater
ial f
rom
ww
w.p
alg
rave
con
nec
t.co
m -
lice
nse
d t
o U
niv
ersi
ty o
f S
ydn
ey -
Pal
gra
veC
on
nec
t -
2014
-08-
27

More Scottish than British
10.1057/9781137023704 - More Scottish than British, Christopher Carman, Robert Johns and James Mitchell
Co
pyr
igh
t m
ater
ial f
rom
ww
w.p
alg
rave
con
nec
t.co
m -
lice
nse
d t
o U
niv
ersi
ty o
f S
ydn
ey -
Pal
gra
veC
on
nec
t -
2014
-08-
27

The Comparative Territorial Politics Series
Series editors: Charlie Jeffery, Professor of Politics, School of Social and Political Science,University of Edinburgh, UK, and Michael Keating, Professor of Politics, University ofAberdeen, UK.
Territorial politics is one of the most dynamic areas in contemporary political science.Devolution, regional government and federal reform have reshaped the architecture ofgovernment at sub-state and transnational levels, with profound implications for pub-lic policy, political competition, democracy and the nature of political community.Important policy fields such as health, education, agriculture, environment and eco-nomic development are managed at new spatial levels. Regions, stateless nations andmetropolitan areas have become political arenas, contested by old and new political par-ties and interest groups. All of this is shaped by transnational integration and the riseof supranational and international bodies like the European Union, the North AmericanFree Trade Area and the World Trade Organization.
The Comparative Territorial Politics series brings together monographs, edited collectionsand area studies that further scholarship in the field of territorial politics and pol-icy, decentralization, federalism and regionalism. The series aims to be an outlet forinnovative research in this area, grounded in political science, political geography, law,international relations and sociology.
Titles include:
Christopher Carman, Robert Johns and James MitchellMORE SCOTTISH THAN BRITISHThe 2011 Scottish Parliament Election
Alain-G Gagnon and Michael Keating (editors)POLITICAL AUTONOMY AND DIVIDED SOCIETIESImagining Democratic Alternatives in Complex Settings
Michel Seymour and Alain-G Gagnon (editors)MULTINATIONAL FEDERALISMProblems and Prospects
Irina StefuriucGOVERNMENT FORMATION IN MULTI-LEVEL SETTINGSParty Strategy and Institutional Constraints
The Comparative Territorial Politics seriesSeries Standing Order ISBN 978–0230–29293–2(outside North America only)
You can receive future titles in this series as they are published by placing a standingorder. Please contact your bookseller or, in case of difficulty, write to us at the addressbelow with your name and address, the title of the series and the ISBN quoted above.
Customer Services Department, Macmillan Distribution Ltd, Houndmills, Basingstoke,Hampshire RG21 6XS, England
10.1057/9781137023704 - More Scottish than British, Christopher Carman, Robert Johns and James Mitchell
Co
pyr
igh
t m
ater
ial f
rom
ww
w.p
alg
rave
con
nec
t.co
m -
lice
nse
d t
o U
niv
ersi
ty o
f S
ydn
ey -
Pal
gra
veC
on
nec
t -
2014
-08-
27

More Scottish than BritishThe 2011 Scottish Parliament Election
Christopher CarmanProfessor of Politics, University of Glasgow, UK
Robert JohnsSenior Lecturer in Politics, University of Essex, UK
James MitchellProfessor of Public Policy, University of Edinburgh, UK
10.1057/9781137023704 - More Scottish than British, Christopher Carman, Robert Johns and James Mitchell
Co
pyr
igh
t m
ater
ial f
rom
ww
w.p
alg
rave
con
nec
t.co
m -
lice
nse
d t
o U
niv
ersi
ty o
f S
ydn
ey -
Pal
gra
veC
on
nec
t -
2014
-08-
27

© Christopher Carman, Robert Johns and James Mitchell 2014
All rights reserved. No reproduction, copy or transmission of thispublication may be made without written permission.
No portion of this publication may be reproduced, copied or transmittedsave with written permission or in accordance with the provisions of theCopyright, Designs and Patents Act 1988, or under the terms of any licencepermitting limited copying issued by the Copyright Licensing Agency,Saffron House, 6–10 Kirby Street, London EC1N 8TS.
Any person who does any unauthorized act in relation to this publicationmay be liable to criminal prosecution and civil claims for damages.
The authors have asserted their rights to be identified as the authors of thiswork in accordance with the Copyright, Designs and Patents Act 1988.
First published 2014 byPALGRAVE MACMILLAN
Palgrave Macmillan in the UK is an imprint of Macmillan Publishers Limited,registered in England, company number 785998, of Houndmills, Basingstoke,Hampshire RG21 6XS.
Palgrave Macmillan in the US is a division of St Martin’s Press LLC,175 Fifth Avenue, New York, NY 10010.
Palgrave Macmillan is the global academic imprint of the above companiesand has companies and representatives throughout the world.
Palgrave® and Macmillan® are registered trademarks in the United States,the United Kingdom, Europe and other countries.
ISBN 978–1–137–02369–8
This book is printed on paper suitable for recycling and made from fullymanaged and sustained forest sources. Logging, pulping and manufacturingprocesses are expected to conform to the environmental regulations of thecountry of origin.
A catalogue record for this book is available from the British Library.
Library of Congress Cataloging-in-Publication DataCarman, Christopher J.More Scottish than British : the 2011 Scottish Parliament election /Christopher Carman, Robert Johns, James Mitchell.
pages cmSummary: “With the aid of the most extensive and comprehensive survey dataextracted from voters during the 2011 Scottish General, this book analyses thereasons behind why the SNP not only retained their mandate from the people togovern Scotland but further succeeded in winning a resounding majority in theScottish Parliament. In tackling this overarching question other complex issuesare also explored such as whether a pre-occupation with events at Westminsterconfined the Scottish Elections to the realm of ‘second-order’ elections? Whatimpact the financial crisis had on elected a parliament that in reality has littleeconomic power? The volume also has a broader appeal to devolvedparliamentary elections more broadly by exploring what matters to voters whenthey cast their ballots for their national parliament in a complex, multi-levelPolitical system. Examining performance evaluations, party loyalties andconstitutional preferences, the authors show that Scottish elections areincreasingly Scottish affairs, where voters are concerned with governmentcompetence – in domestic matters and in managing relations withWestminster.” — Provided by publisher.ISBN 978–1–137–02369–8 (hardback)1. Scotland. Parliament—Elections, 2011. 2. Elections—Scotland. 3. Politicalparties—Scotland. 4. Scotland—Politics and government—21st century.I. Title.JN1341.C37 2013324.9411′08612—dc23 2013021790
10.1057/9781137023704 - More Scottish than British, Christopher Carman, Robert Johns and James Mitchell
Co
pyr
igh
t m
ater
ial f
rom
ww
w.p
alg
rave
con
nec
t.co
m -
lice
nse
d t
o U
niv
ersi
ty o
f S
ydn
ey -
Pal
gra
veC
on
nec
t -
2014
-08-
27

Contents
List of Tables and Figures vi
1 The 2011 Scottish Election in Context 1
2 Results and the Sources of Party Support 25
3 Parties and Leaders 48
4 Performance Politics at Holyrood 78
5 How ‘Scottish’ Was this Election? 106
6 Party Choice in 2011 130
Appendix 1: The 2011 Scottish Election Study 158
Appendix 2: Full Results of Statistical (Regression) Analyses 160
Notes 169
References 172
Index 180
v
10.1057/9781137023704 - More Scottish than British, Christopher Carman, Robert Johns and James Mitchell
Co
pyr
igh
t m
ater
ial f
rom
ww
w.p
alg
rave
con
nec
t.co
m -
lice
nse
d t
o U
niv
ersi
ty o
f S
ydn
ey -
Pal
gra
veC
on
nec
t -
2014
-08-
27

Tables and Figures
Tables
1.1 Results of Scottish Parliament elections, 1999, 2003,2007 and 2011 6
1.2 Majority building 1999–2003; 2003–2007;2007–2011 8
1.3 2011 Campaign spending in Scottish electionscompared to Westminster (general) elections, inGBP 19
1.4 2011 Party spending by expenditure category 201.5 2011 Party spending by expenditure category as a
percentage of 2007 spending 212.1 List vote by demographic group, 2011 and change
2007–2011 312.2 List vote by religion and religiosity 312.3 Party vote by objective and subjective social class,
column percentages 322.4 List vote by national identity, 2011 (changes since
2007) 362.5 Constituency list share of the vote by party 422.6 Vote in 2011 (constituency and region) by 2007
vote for the panel respondents 452.7 Constituency vote in 2011 by recalled 2010 general
election vote 463.1 Partisanship (identification, leaning and combined)
in 2007 and 2011 543.2 Pre-election party identification and regional vote 553.3 Mean party ratings on 0–10 scale: (i) all respondents
(ii) by party identification 583.4 Party ratings on five facets of party image: (i) all
respondents (ii) undecided voters 613.5 Perceptions of campaign tone by party, 2011 and
2007 64
vi
10.1057/9781137023704 - More Scottish than British, Christopher Carman, Robert Johns and James Mitchell
Co
pyr
igh
t m
ater
ial f
rom
ww
w.p
alg
rave
con
nec
t.co
m -
lice
nse
d t
o U
niv
ersi
ty o
f S
ydn
ey -
Pal
gra
veC
on
nec
t -
2014
-08-
27

List of Tables and Figures vii
3.6 Perceived best and worst debate performers: (i) allwatchers (ii) by party identification 68
3.7 Ratings of party leaders on like-dislike scale by allrespondents and non-identifiers 70
4.1 Evaluations of governing party performance:Scottish and Westminster governments 82
4.2 Evaluations of outcomes in four key issue areas 844.3 Attributions of responsibility for outcomes in four
issue areas by evaluations 854.4 Open-ended ‘most important issue’ responses, 2007
and 2011 874.5 Party best able to handle each ‘most important
issue’, row percentages 894.6 Distribution of voters’ opinions on six policy issues 924.7 Perception of parties’ commitment to defending
(i) Scotland against the cuts; (ii) Scottish interests ingeneral 96
4.8 Two measures of constitutional preference atScottish elections since 1999 99
4.9 Perceived constitutional stances and correlationswith perceived commitment to Scottish interests,2007 and 2011 103
5.1 Percentage deeming each level ‘mainly responsible’for key policy areas, 2007–2011 109
5.2 Percentage deeming each level ‘mainly responsible’for outcomes since 2007 111
5.3 Most important issue facing: (i) Britain (ii) Scotland 1125.4 Party best able to handle economic issues facing
Britain and Scotland (row percentages) 1135.5 Basis for voting decision, 1999–2011, and by
selected ‘most important issue’ in 2011 1165.6 Regional list vote by reported main focus, 2011 and
2007 1175.7 Responses to multi-level party identification
questions, column percentages 1225.8 Scottish party identification conditional on UK
party identification, column percentages 1235.9 UK party identification conditional on Scottish
party identification, column percentages 123
10.1057/9781137023704 - More Scottish than British, Christopher Carman, Robert Johns and James Mitchell
Co
pyr
igh
t m
ater
ial f
rom
ww
w.p
alg
rave
con
nec
t.co
m -
lice
nse
d t
o U
niv
ersi
ty o
f S
ydn
ey -
Pal
gra
veC
on
nec
t -
2014
-08-
27

viii List of Tables and Figures
5.10 Party support combining post-election experimentalhalves, row percentages 126
6.1 Variables with statistically significant effects inmultinomial logit of list vote 134
A2 2.1 Multinomial logit of regional party choice ondemographic characteristics (for Figure 2.1) 161
A2 3.1 OLS regressions of party like/dislike (0–10 scale) onparty image assessments, controlling for partyidentification (for Figure 3.1) 162
A2 3.2 Multinomial logit of regional party choice on leaderevaluations and demographic characteristics (forFigure 3.2) 163
A2 4.1 Structural model estimates (for Figure 4.2) 165A2 6.1 Multinomial logit of regional party choice on
attitudinal and demographic predictors(for Figure 6.1) 166
Figures
1.1 Turnout, 1997–2011 101.2 Holyrood list voting intention, January 2009–May
2011 142.1 Multinomial logistic regression of list vote on
socio-demographic predictors 392.2 Deviation from proportionality and Scottish
Labour’s share of the vote, 1945–2010 UK elections 412.3 Number of constituency and region MSPs elected by
party, 1999–2011 433.1 Impact (standardized regression coefficients) of
image variables on party like-dislike ratings 633.2 Mean effects of leadership evaluations on party
choice 744.1 Voter self-placements and mean party placements
on two issue scales 944.2 Structural model predicting attitudes to the SNP in
2011 (N = 559) 1005.1 Multi-level party identification experiment 1255.2 Multi-level party identification experiment 125
10.1057/9781137023704 - More Scottish than British, Christopher Carman, Robert Johns and James Mitchell
Co
pyr
igh
t m
ater
ial f
rom
ww
w.p
alg
rave
con
nec
t.co
m -
lice
nse
d t
o U
niv
ersi
ty o
f S
ydn
ey -
Pal
gra
veC
on
nec
t -
2014
-08-
27

List of Tables and Figures ix
6.1 Effects of significant variables on the probability ofvoting SNP 138
6.2 Effects of significant variables on the probability ofvoting Labour 141
6.3 Effects of significant variables on the probability ofvoting Conservative 143
6.4 Effects of significant variables on the probability ofvoting Liberal Democrat 145
10.1057/9781137023704 - More Scottish than British, Christopher Carman, Robert Johns and James Mitchell
Co
pyr
igh
t m
ater
ial f
rom
ww
w.p
alg
rave
con
nec
t.co
m -
lice
nse
d t
o U
niv
ersi
ty o
f S
ydn
ey -
Pal
gra
veC
on
nec
t -
2014
-08-
27

This page intentionally left blank
10.1057/9781137023704 - More Scottish than British, Christopher Carman, Robert Johns and James Mitchell
Co
pyr
igh
t m
ater
ial f
rom
ww
w.p
alg
rave
con
nec
t.co
m -
lice
nse
d t
o U
niv
ersi
ty o
f S
ydn
ey -
Pal
gra
veC
on
nec
t -
2014
-08-
27

1The 2011 Scottish Electionin Context
The elections to the Scottish Parliament in 2011 were unusual in anumber of respects. The Scottish National Party (SNP) was defendinga record in government for the first time in its history. It had gov-erned Scotland since 2007 without an overall majority when it won47 of Holyrood’s 129 seats, only winning one more seat than theLabour Party, which until then had governed Scotland in coalitionwith the Liberal Democrats since the establishment of the ScottishParliament in 1999. The elections would be a test of both the SNPand minority government. The 2011 elections to Holyrood came ayear after elections to the House of Commons, when Labour hadbeen defeated after being in power since 1997. In the three previousHolyrood elections, there had been two years between Westminsterand Holyrood elections taking place, which increased the prospectof a spill-over effect from the Westminster elections this time. Theformation of a Conservative–Liberal Democrat coalition in Londonaltered the political landscape. Devolution came into being largely inresponse to the lack of support in Scotland for Conservative govern-ments in the 1980s and 1990s (Denver et al. 2000). The 2011 electionswere also the first devolved elections fought against the backdrop ofserious economic and fiscal problems. Public expenditure had grownyear on year under devolution, in common with spending across theUK, but this had now ended.
These novel aspects of the 2011 Scottish elections created a fas-cinating context in which to explore political behaviour but alsochallenges, not least given the need to disentangle the impact ofdifferent factors that might each have affected the outcome of the
1
10.1057/9781137023704 - More Scottish than British, Christopher Carman, Robert Johns and James Mitchell
Co
pyr
igh
t m
ater
ial f
rom
ww
w.p
alg
rave
con
nec
t.co
m -
lice
nse
d t
o U
niv
ersi
ty o
f S
ydn
ey -
Pal
gra
veC
on
nec
t -
2014
-08-
27

2 More Scottish than British
election. Disentangling the variables needs to be combined withunderstanding the impact each had on other factors. To what extentwere expectations of what the Scottish government could deliveraltered as a result of the economic crisis? To what extent did theelection of a Conservative-led coalition increase the likelihood thatthe Scottish public would hold the UK government responsible for(prospective) public spending cuts? To what extent did the publictake account of the absence of an overall majority in accreditingeither blame or credit to the devolved government? This also raisesthe importance of the previous Scottish elections in 2007 when theSNP emerged with its slight lead over Labour. What expectations didvoters have of an SNP government then as compared with 2011? And,of course, the SNP is committed to independence. To what extent andin what ways did the SNP’s constitutional position influence voters’behaviour?
These questions were all-important in the Scottish elections buthave resonance with questions asked in other liberal democracies,especially with tiered levels of elected government undergoing signif-icant economic and fiscal dislocation. Governments across the worldhave been adversely affected by economic forces beyond their con-trol but are nonetheless accountable to their electorates. Additionally,a growing literature addresses the impact on political behaviourof multi-tiered systems of representation. Understanding the 2011Scottish election helps us understand political behaviour beyondScotland. Equally, this study contributes to the literature on politicalbehaviour in multi-tiered polities especially in the context of fiscaland economic crises.
From coalition to minority government
Vowles has identified two key theories in discussing publicperceptions of coalitions, single-party and minority governments:clarity of responsibility and the role of ‘veto players’ (Vowles 2010:372). Clarity of responsibility concerns which party or parties areaccountable for policy decisions and thereby accountable to theelectorate. It is generally assumed that coalition and minority govern-ment blur accountability as no single party can be held fully account-able for public policy. Minority government has been describedas the least accountable form of government (Powell 2000). Such
10.1057/9781137023704 - More Scottish than British, Christopher Carman, Robert Johns and James Mitchell
Co
pyr
igh
t m
ater
ial f
rom
ww
w.p
alg
rave
con
nec
t.co
m -
lice
nse
d t
o U
niv
ersi
ty o
f S
ydn
ey -
Pal
gra
veC
on
nec
t -
2014
-08-
27

The 2011 Scottish Election in Context 3
governments can blame opposition parties for failing to cooperatein pursuit of policy goals. The second theory considers accountabil-ity differently. The expectation of ‘minimum winning coalitions’(Downs 1962: 47) suggests that coalitions do not require any moreparties than would provide the government with a majority. Theunderlying assumption about minority government is that suchgovernments confront a single majority veto player in opposition.In practice, minority governments may confront a divided oppo-sition. The stability of a minority government will depend on thecohesion of the majority opposition. This is affected by the partysystem, which is affected in turn by the electoral system.
The Mixed Member Proportional (MMP) electoral system used forHolyrood elections, generally referred to in the UK as the Addi-tional Member System (AMS), has its origins in debates within theConstitutional Convention, a cross/non-party body that formulatedthe outlines of a scheme of devolution between 1989 and 1992.The system involves voters electing a single district Member of theScottish Parliament (MSP) in 73 constituencies plus an additional56 members, seven from each of eight regions. Constituency MSPsare elected using single member districts with a simple plurality,first past the post system. The regional members are elected usingclosed party lists where members are selected using a system (modi-fied D’Hondt) that takes account of the number of constituency MSPselected within each region and each party’s share of the regional vote,thus providing the Parliament with a degree of proportionality.
The widely held assumption was that AMS would prevent any partyhaving an overall majority. This assumption was based on past perfor-mance of the parties, or more specifically the Labour Party, under thesimple plurality system in election to the House of Commons. In thefirst elections to the Scottish Parliament in 1999, Labour achieved anoverall majority of constituency MSPs with 53 seats but only 3 listseats, falling 9 seats short of an overall majority. Labour formed acoalition with the Liberal Democrats, providing an overall majorityof 8 with 73 seats. The same coalition was formed following the 2003elections after Labour lost 6 seats, but remained the largest party,and the Liberal Democrats won 17 seats, gaining a constituency seatbut consequently losing a list seat. Partnership Agreements betweenthe coalition parties set out the programme for government after1999 and 2003. But in 2007, when the SNP emerged with its slight
10.1057/9781137023704 - More Scottish than British, Christopher Carman, Robert Johns and James Mitchell
Co
pyr
igh
t m
ater
ial f
rom
ww
w.p
alg
rave
con
nec
t.co
m -
lice
nse
d t
o U
niv
ersi
ty o
f S
ydn
ey -
Pal
gra
veC
on
nec
t -
2014
-08-
27

4 More Scottish than British
lead over Labour, and well short of an overall majority, the Lib-eral Democrats chose to move out of government. Alex Salmond, asleader of the SNP in Holyrood, defeated Jack McConnell, Labour’sleader in the election of Scotland’s First Minister by 49 votes to 46with 33 abstentions. The two Green MSPs voted for Salmond alongwith the contingent of SNP MSPs. An agreement, short of a coalition,had been reached with the Greens, on three ‘core issues’: oppositionto building new nuclear power stations; agreement to early legisla-tion to reduce climate change pollution annually; and agreementthat independence would make Scotland more successful and thatthe parties would work to ‘extend the powers of the Scottish Par-liament’ (SNP and Greens 2007). These were matters on which thetwo parties agreed and required no compromises. The Greens agreedto support the minority government ‘in votes for First Minister andMinisterial appointments’ and the SNP agreed to consult the GreenMSPs in advance of each year’s legislative and policy programme aswell as key measures announced in-year, the substance of the budgetand to nominate a Green MSP as convener of a subject committee inthe Parliament (SNP and Greens 2007).
In his speech prior to the vote, Alex Salmond had said,
This Parliament is a proportional Parliament. It is a Parliamentof minorities where no one party rules without compromise orconcession. The SNP believes that we have the moral authority togovern, but we have no arbitrary authority over this Parliament.The Parliament will be one in which the Scottish Governmentrelies on the merits of its legislation, not the might of a parlia-mentary majority. The Parliament will be about compromise andconcession, intelligent debate and mature discussion. That is noaccident. If we look back, we see that it is precisely the Parliamentthat the consultative steering group – the founding fathers of thisplace – envisaged.
Official Report Scottish Parliament(16 May 2007, col. 24)
The new First Minister discovered the virtues of a proportional Par-liament. The much-trumpeted ‘new politics’, implying a more con-sensual approach, which some advocates of devolution had hopedwould emerge with devolution, was finally becoming a reality. New
10.1057/9781137023704 - More Scottish than British, Christopher Carman, Robert Johns and James Mitchell
Co
pyr
igh
t m
ater
ial f
rom
ww
w.p
alg
rave
con
nec
t.co
m -
lice
nse
d t
o U
niv
ersi
ty o
f S
ydn
ey -
Pal
gra
veC
on
nec
t -
2014
-08-
27

The 2011 Scottish Election in Context 5
politics operated alongside typically British adversarial politics withinthe Holyrood chamber due to the necessity of parliamentary arith-metic rather than a revolution in political attitudes. Westminster-style adversarial politics lived on alongside the need continuouslyto construct coalitions over the next four years in Holyrood.
During election campaigns, parties do not tend to indicate withwhom they will coalesce in the event that no party has a majority(Katz 1997: 165–167). Parties in a coalition will each claim primarycredit for a popular policy or try to evade responsibility for lesspopular policies (Gallagher, Laver and Mair 2005), as both Scottishcoalition parties did in 2003 on policies such as opposing tuition feesfor university students and offering generous ‘care for the elderly’policies. It is difficult for a minority government to keep its promisesand easier to evade responsibility as it does not have a majority. Thismight allow it to ditch promises that might have made sense forelectoral purposes but proved costly in implementation. Popular SNPmanifesto commitments in 2007 included abolishing the council taxand replacing it with a local income tax. Absence of a parliamentarymajority prevented this policy chance but, argued the SNP’s critics,also meant that the SNP could avoid the troublesome business ofintroducing a new form of local taxation (Table 1.1).
It has been suggested by a leading scholar of minority govern-ment that conventional wisdom associating minority cabinets with‘instability, fractionalization, polarization, and long and difficult for-mation processes’ is a ‘historically bounded proposition’ (Strøm 1990:89–90). The UK has experienced minority government at variousintervals during the twentieth century: 1910–1915; 1924; 1929–1931;1974; 1976–1979; 1997. These have usually coincided with peri-ods of economic instability though this coincidence had little todo, at least directly, with minority government. However, this ‘his-torically bounded’ association may have coloured expectations ofminority government. Strøm’s exhaustive analysis of minority gov-ernment (Strøm 1990) challenges these negative associations, andreminds us of how common minority government is in some parlia-mentary democracies and that minority can be a rational responseby party leaders. David Butler, too, has noted that minority gov-ernments outside the UK have proved ‘quite stable with few of thedire consequences usually suggested’ (Butler 2008: 11). As Strømnotes, minority status allows a government maximum flexibility
10.1057/9781137023704 - More Scottish than British, Christopher Carman, Robert Johns and James Mitchell
Co
pyr
igh
t m
ater
ial f
rom
ww
w.p
alg
rave
con
nec
t.co
m -
lice
nse
d t
o U
niv
ersi
ty o
f S
ydn
ey -
Pal
gra
veC
on
nec
t -
2014
-08-
27

6 More Scottish than British
Table 1.1 Results of Scottish Parliament elections, 1999, 2003, 2007 and 2011
Constituencies Regional lists Total
Votes % Seats Votes % Seats Seats Seats %
1999Conservative 15.6 0 15.4 18 18 13.9Labour 38.8 53 33.8 3 56 43.4Lib Dem 14.2 12 12.5 5 17 13.2SNP 28.7 7 27.5 28 35 27.1Green 3.6 11 0.8Others 2.7 1 7.2 1 2 1.6
2003Conservative 16.6 3 15.5 15 18 (−) 13.9Labour 34.6 46 29.3 4 50 (−6) 38.8Lib Dem 15.3 13 11.8 4 17 (−) 13.2SNP 23.8 9 20.9 18 27 (−8) 20.9Green 6.9 7 7 (+6) 5.4Others 9.7 2 15.8 8 8 (+6) 6.2
2007Conservative 16.6 4 13.9 13 17 (−1) 13.2Labour 32.2 37 29.2 9 46 (−4) 35.7Lib Dem 16.2 11 11.3 5 16 (−1) 12.4SNP 32.9 21 31.0 26 47 (+20) 36.4Green 0.2 0 4.0 2 2 (−5) 1.6Others 1.9 0 10.6 1 1 (−7) 0.8
2011Conservative 13.9 3 12.4 12 15 (+23) 11.6Labour 31.7 15 26.3 22 37 (−7) 28.7Lib Dem 7.9 2 5.2 3 5 (−12) 4.8SNP 45.4 53 44.0 16 69 (+23) 53.5Green - - 4.4 2 2 (n.c.) 1.6Others 1.1 0 7.7 1 1 (n.c.) .8
Note: Rounding may result in columns adding to more than 100 per cent.
in seeking support for its policies with shifting coalition strategies,though it also makes them vulnerable to defeat (Strøm 1990: 97).Green-Pedersen also noted, ‘shifting coalition strategies offer minor-ity governments optimal conditions for having their policies passed,but it also renders them vulnerable to defeat’ (Green-Pederson 2001:56). Research on how successive Danish minority governments
10.1057/9781137023704 - More Scottish than British, Christopher Carman, Robert Johns and James Mitchell
Co
pyr
igh
t m
ater
ial f
rom
ww
w.p
alg
rave
con
nec
t.co
m -
lice
nse
d t
o U
niv
ersi
ty o
f S
ydn
ey -
Pal
gra
veC
on
nec
t -
2014
-08-
27

The 2011 Scottish Election in Context 7
have operated is particularly relevant. Scottish government officialsprepared for the possibility of minority government before 2007 byenquiring into the Danish experience.
When a minority government has only one way of building amajority, this gives the supporting opposition party veto powersover individual policies as well as over maintaining the governingparty in office. The SNP found itself with limited options in buildingmajorities (see Table 1.2). Minority governments require more thanone way of building a majority to maximize its prospects of ensur-ing its policies pass through parliament. The SNP’s advance in 2007occurred partly due to the decline of the ‘Others’ but meant that therewere fewer means of combining to create a majority in Holyrood.Nonetheless, assuming coherence of party groups in Holyrood, theSNP had five ways of constructing a parliamentary majority after2007 prior to the appointment of a Conservative MSP as PresidingOfficer. Margo MacDonald, the former SNP MSP, sitting as the onlyIndependent since 2003, might prove important in Holyrood votes.The period 2007–2011 would test an inexperienced party governingwithout a majority. The keys to success for minority governmentslie in winning important votes, especially on budgets, but also inan ability to devise policies for which it can claim credit without aparliamentary majority and use existing powers to pursue its policyprogramme.
Three important caveats have to be noted with respect to major-ity building. First, much policy-making occurs within the frameworkof existing legislation and the powers granted to ministers do notrequire a parliamentary majority. Alex Salmond was keen to quoteDonald Dewar, his Labour predecessor as First Minister, who hadsaid: ‘As part of the perfectly normal constitutional arrangement,except in certain circumstances, the Scottish Executive is not nec-essarily bound by resolutions or motions passed by the ScottishParliament’ (Scottish Parliament 31 May 2007). Secondly, theatri-cal, adversarial politics often hides a willingness to cooperate. Thisbecame apparent in annual budget debates during which the minor-ity SNP government had sought to build a parliamentary majorityvoting in favour of each budget. Labour, the main opposition party,calculated how to oppose each SNP budget formally while, at thesame time, ensuring that the SNP government was not brought downby the defeat of the budget. This was highlighted in 2009. Against
10.1057/9781137023704 - More Scottish than British, Christopher Carman, Robert Johns and James Mitchell
Co
pyr
igh
t m
ater
ial f
rom
ww
w.p
alg
rave
con
nec
t.co
m -
lice
nse
d t
o U
niv
ersi
ty o
f S
ydn
ey -
Pal
gra
veC
on
nec
t -
2014
-08-
27

8 More Scottish than British
Table 1.2 Majority building 1999–2003; 2003–2007; 2007–2011
Majority combinations 1999–2003 ParliamentLabour 56 MSPs requires 9 other for minimum winning coalition
i. With SNP = 56 + 35ii. With LibDems = 56 + 17
iii. With Conservatives = 56 + 18
SNP 35 MSPs requires 30 others for minimum winning coalition
i. With Conservative and Liberal Democrats = 35 + 18 + 17
Majority combinations 2003–2007 ParliamentLabour 50 MSPs requires 15 for minimum winning coalition
i. With SNP = 50 + 27ii. With LibDems = 50 + 17
iii. With Conservatives = 50 + 18iv. With Greens, SSP, and three ‘Others’∗ = 50 + 7 + 6 + 3
∗This grouping consisted of 4 ‘Others’ in total.SNP 27 MSPs requires 38 others for minimum winning coalition
i. With Conservatives+ LibDems+ Greens = 18 + 17 + 7ii. With Conservatives+ LibDems+ SSP = 18 + 17 + 6
iii. With Conservatives+ LibDems + 3 ‘Others’∗ = 18 + 17 + 3∗This grouping consisted of 4 ‘Others’ in total.
Majority combinations 2007–2011 ParliamentSNP 47 MSPs requires 18 others for minimum winning coalition.
i. With Labour 47 + 46ii. With Conservatives + Liberal Democrats = 47 + 17 + 16
iii. With Conservatives + greens = 47 + 17 + 2iv. With Conservatives + one other∗+ 47 + 17 + 1v. With Liberal Democrats + greens = 47 + 16 + 2
Labour 46 MSPs requires 19 others for minimum winning coalition.
i. With Conservatives + Liberal Democrats = 46 + 17 + 16ii. With Conservatives + Greens = 46 + 17 + 2
iii. With Liberal Democrats + Greens+ Independent = 46 + 16 + 2 + 1
the expectations of all other MSPs, the two Green MSPs decided tojoin with Labour and Liberal Democrat MSPs to vote against theSNP budget, causing the budget to fall. This would normally precip-itate an election but a second budget, almost identical to the first,was proposed, and won the support of Labour and Liberal Demo-crat MSPs who had opposed the original measure (on the assumption
10.1057/9781137023704 - More Scottish than British, Christopher Carman, Robert Johns and James Mitchell
Co
pyr
igh
t m
ater
ial f
rom
ww
w.p
alg
rave
con
nec
t.co
m -
lice
nse
d t
o U
niv
ersi
ty o
f S
ydn
ey -
Pal
gra
veC
on
nec
t -
2014
-08-
27

The 2011 Scottish Election in Context 9
that the Green MSPs would vote for the budget) and thereby allowedthe amended budget to pass. Thirdly, and most important in thecontext of voting behaviour, there is the question of the extent towhich the electorate are aware of the existence of, and constraintsupon, a minority government. As is well documented in the poli-tics literature, minority governments must build a unique coalitionof the willing on each legislative measure put forward. This need toconstantly build a voting majority through negotiation and com-promise is not something that we would expect the voting publicto understand and even consider when evaluating the minoritygovernment.
Multi-level elections
The establishment of the Scottish Parliament created a new tier ofelected representatives. Public perceptions of the devolved govern-ment, especially as it relates to attitudes to the Westminster Parlia-ment and government, can be expected to have influenced politicalbehaviour. A well-established literature on US elections suggests thatmid-term elections are quasi-referendums on the federal governmentand used to punish federal governments (Tufte 1978; Erikson 1988).Much of the work on political behaviour in tiered polities begins withReif and Schmitt’s (1980) work on second-order elections that pro-posed a series of consequences of elections in which there is ‘less atstake’:
Lower levels of participationBrighter prospects for small and new political partiesHigher percentage of invalidated ballotsand [Central] Government parties lose.
(Reif and Schmitt 1980: 9)
Further work has suggested that subnational elections are not alwayssecond order and that there are degrees of ‘second-orderness’ (Abediand Siaroff 1999; Hough and Jeffrey 2006; Scully and Elias 2008;McLean et al. 1996; Wyn Jones and Scully 2006). Using Reifand Schmitt’s proposed consequences of second order elections, itis less than completely clear how to classify Scottish Parliament
10.1057/9781137023704 - More Scottish than British, Christopher Carman, Robert Johns and James Mitchell
Co
pyr
igh
t m
ater
ial f
rom
ww
w.p
alg
rave
con
nec
t.co
m -
lice
nse
d t
o U
niv
ersi
ty o
f S
ydn
ey -
Pal
gra
veC
on
nec
t -
2014
-08-
27

10 More Scottish than British
elections – while there may be a perception that less is at issue, thereis also evidence that Scottish elections are increasingly seen as beingconsequential, influencing policy in Scotland and the wider UK.
While turnout tends to be lower in sub-state elections, this is notalways the case. It is not unknown for turnout in some Canadianprovinces to be higher than in federal elections including, thoughnot only, Quebec (Studlar 2001). Elections in highly contested poli-ties can produce high levels of turnout, as in Northern Ireland.Henderson and McEwen (2010) found evidence that variations inturnout were affected by two ‘region-specific variables’: regionalattachment and regional autonomy. This argument resembles theview that the ‘amount at stake’ (Heath et al. 1999) is important. View-ing Scottish Parliament elections in this light (Figure 1.1), the rawturnout numbers would seem to point to Scottish elections being ofless than first-order importance. The Scottish public was exuberant inturning out for the first Holyrood elections in 1999, but since then,the percentage of people voting in the Scottish elections has laggedbehind those voting in the general election contests.
What is clear is that voters can and do behave differently in state-wide and sub-state elections, assuming ceteris paribus. However, thereare some key differences between how elections are held for Holyroodand Westminster, including the electoral system. The electoral system
1997UK
2001UK
2005UK
2010UK
2011200720031999
71.380
70
60
50
Per
cen
t tu
rno
ut
40
30
20
10
0
58.2 60.663.8
50.451.749.4
58.8
Figure 1.1 Turnout, 1997–2011
10.1057/9781137023704 - More Scottish than British, Christopher Carman, Robert Johns and James Mitchell
Co
pyr
igh
t m
ater
ial f
rom
ww
w.p
alg
rave
con
nec
t.co
m -
lice
nse
d t
o U
niv
ersi
ty o
f S
ydn
ey -
Pal
gra
veC
on
nec
t -
2014
-08-
27

The 2011 Scottish Election in Context 11
has created brighter prospects for small and new political parties andthis may be a better explanation than the ‘less at stake’ explanation.In 2003, the ‘Others’, that is, parties other than the four main partieswith Scottish representation in the House of Commons, performedstrongly winning 17 seats (13.2 per cent of the total). However, thesmall parties owe much to the regional lists – only two ‘Others’ wereelected under the single-member plurality system, and each was anindependent rather than a party representative – highlighting thevalue of the electoral system in ensuring the election of small andnew political parties. The Greens now hold a seat in the Commons(for Brighton Pavilion) but their lack of geographically concentratedsupport in Scotland has led them to contest only the list seats forHolyrood, which they did with much less success in 2007, winningjust two seats.
The third criterion, mentioned above, that we might use to con-sider the ‘orderedness’ of an election is the relative number of invali-dated ballots in the electoral contest. The obvious assumption is thatvoters who take an election more seriously will attempt to ensure thattheir ballot is completely and correctly filled in. This, however, couldbe a crude and error-prone measure of voter interest in an election.For instance, the number of invalidated ballots at Scottish electionsrose to unprecedented levels in 2007 but this was not because of voterdisinterest, signalling it was a second-order election, but because ofballot paper design (Carman et al. 2008). The structure of the ballotmeant that in order to accommodate the excessively long list of par-ties contesting the regional list, two regions dramatically truncatedthe instructions on the ballot paper, leading to a much higher per-centage of spoiled ballots in those regions (Carman et al. 2008) Thenumber of spoiled ballots in 2011 fell ten-fold compared with 2007(0.42 per cent and 0.34 per cent of constituency and regional listballots in 2011 compared with 4.08 per cent and 2.88 per cent in2007) but remained still higher than in Westminster elections. Thatsaid, the average number of spoiled ballots per constituency in elec-tions to the House of Commons was generally lower in Scotland thanother parts of the UK over elections since 1945. The average numberof spoiled papers in Scottish constituency contests in 2005 and 2010UK elections was 79 and 92 respectively, whereas the average num-ber of spoiled ballots in constituencies for the Holyrood elections in2011 was 115 but, again, it is unclear whether this was a second-order
10.1057/9781137023704 - More Scottish than British, Christopher Carman, Robert Johns and James Mitchell
Co
pyr
igh
t m
ater
ial f
rom
ww
w.p
alg
rave
con
nec
t.co
m -
lice
nse
d t
o U
niv
ersi
ty o
f S
ydn
ey -
Pal
gra
veC
on
nec
t -
2014
-08-
27

12 More Scottish than British
or electoral system effect or something tied to the different electoralsystem and ballot structure.
There is a body of work at the other end of the spectrum fromthe second-order election theory which suggests that elections atsub-state level operate almost in isolation from state-wide politicswith minimal central government effects. The notion that ‘twopolitical worlds’ operate in British Columbia with a ‘small world’of provincial politics not affecting and unaffected by the ‘largerworld’ of Canadian politics is used to explain partisan ‘inconsistency’(Blake 1982; Blake et al. 1985). This is the behavioural equivalentof the dual, as distinct from interdependent, models of federalism.The dual model ‘holds that each level of government, nation andstate, is supreme within its area of responsibility. According to thismodel, neither level is dominant in any general sense, and nei-ther level should interfere in the affairs of the other’ (Nice andFredericksen 1996: 6) while ‘[ . . . ] interdependent models are basedon a sharing of power and responsibility, with the various partic-ipants often working toward shared goals’ (Ibid.: 7–15). Scottishdevolution conforms with the latter notion especially regarding fis-cal and economic competences though it was conceived in dualistterms (Mitchell 2010a). This interdependence of levels of governmentmay create problems for voters in assigning responsibility acrossthe levels of government. Voters in federal systems do not alwaysattribute responsibility for public policy decisions and their outcomescorresponding well with the formal allocation of competences, sug-gesting that federal systems create challenges for voters seeking toreward or punish governments for policy outcomes (Cutler 2008).León (2010, 2011) argues that clarity of responsibility requires avertical distribution of government competences that correspondswith a dual model of tiered government, warning that interde-pendent models hamper clarity of responsibility. The relationshipbetween decentralization and clarity of responsibilities, accordingto León, is ‘contingent upon the balance of expenditure and fis-cal powers across levels of government’ resulting in a ‘u-shaped’relationship in which citizens are ‘better able to ascribe responsibil-ities in contexts where the level of decentralization is either verylow or very high – that is, where there is a level of governmentthat concentrates powers and clearly predominates over the other’(León 2011: 83).
10.1057/9781137023704 - More Scottish than British, Christopher Carman, Robert Johns and James Mitchell
Co
pyr
igh
t m
ater
ial f
rom
ww
w.p
alg
rave
con
nec
t.co
m -
lice
nse
d t
o U
niv
ersi
ty o
f S
ydn
ey -
Pal
gra
veC
on
nec
t -
2014
-08-
27

The 2011 Scottish Election in Context 13
Donald Dewar, who became First Minister at the establishment ofdevolution, maintained that the Scottish Parliament would allow for‘Scottish solutions to Scottish problems’ (Scottish Parliament, 15 June1999; Dewar 1999). The implication of the rhetoric at the Parlia-ment’s inception was that devolved government involved a discretelevel of decision-making, free from London interference. The real-ity in practice has been different largely, not exclusively, due to thefinancing of devolution that ties the amount of money availableto the Scottish Parliament to spending decisions in the rest of theUK. But equally, evidence from the 1997 referendum that approveddevolution showed that opposition to London control of Scottishaffairs lay behind support for the establishment of a Scottish Par-liament (Denver et al. 2000). The evidence from the 2007 Scottishelections suggested that voters were less inclined to vote against theUK central government, though this was a factor, and more willing toconsider which party was most likely to be competent in governmentin Edinburgh (Johns et al. 2010).
It has long been noted in the Canadian and US literature that votersnot only vote differently in elections to different levels of govern-ment but assume different party identification depending on whichlevel of government is being elected. Party identification was viewedas a long-term psychological attachment in the classic work onparty identification (Campbell et al. 1960). This social psychologicaltheory emphasized social structures and socialization in explain-ing party identification and consequent stability over time. Fiorina(1981) offered an alternative perspective, viewing party identificationas rationally constructed and utility-maximizing. Voters are morelikely to alter their identification as perceptions of parties retrospec-tively. Jennings and Niemi (1966) noted that the standard Michiganstudy question on party identification is ‘not directed to any specificlevel of governmental system’ (Jennings and Niemi 1966: 86) butthe socialization processes envisaged in the Michigan model wouldlead us to expect that there should be no differences in party identi-fication in different elections. The federal system and fragmented,decentralized political parties were ‘conducive to such splitting ofloyalties’ (Ibid.: 100). A very high proportion of those with ‘mixed-identification pairings’ involved an Independent identification at onelevel or other (Ibid.: 88). Having a party/Independent mixed iden-tification might indicate a weakened version of party identification
10.1057/9781137023704 - More Scottish than British, Christopher Carman, Robert Johns and James Mitchell
Co
pyr
igh
t m
ater
ial f
rom
ww
w.p
alg
rave
con
nec
t.co
m -
lice
nse
d t
o U
niv
ersi
ty o
f S
ydn
ey -
Pal
gra
veC
on
nec
t -
2014
-08-
27

14 More Scottish than British
whereas the less prevalent identification involving two different par-ties may be qualitatively different. Stewart and Clarke (1998) explainthis ‘inconsistent’ partisan identity in terms of the ‘evaluative theoryof party identification’ meaning simply that voters alter their identi-ties according to existing or prospective evaluations. We return to thequestion of multi-level party identification in Chapter 5.
For now, we want to raise the possibility that the 2011 Scottishparliamentary elections might be expected to have been affectedby the UK level more than previous devolved elections for a num-ber of reasons. First, there was only one year between the UK andScottish elections and the UK elections resulted in the first changeof government at Westminster since devolution, bringing back topower – though as the main party in a coalition rather than withan overall majority – the party that Scots reacted against in their sup-port for devolution more than a decade before. Following the 2010general election, as Figure 1.2 indicates, the Holyrood voting inten-tion polls saw a decided shift toward Labour – the main oppositionparty to the Conservative-Liberal Democrat coalition in Westminster.
50%
45%
40%
35%
30%
25%
20%
15%
10%
5%
0%
Jan
09M
ar 0
9A
pr 0
9A
pr 0
9Ju
n 09
Jun
09A
ug 0
9A
ug 0
9S
ep 0
9O
ct 0
9N
ov 0
9N
ov 0
9F
eb 1
0F
eb 1
0M
ar 1
0A
pr 1
0A
pr 1
0A
pr 1
0A
pr 1
0A
pr 1
0M
ay 1
0Ju
n 10
Aug
10
Aug
10
Aug
10
Sep
10
Oct
10
Nov
10
10−
Jan−
1114
−F
eb−
1122
−F
eb−
1102
−M
ar−
1113
−M
ar−
1115
−M
ar−
1118
−M
ar−
1127
−M
ar−
1128
−M
ar−
1104
−A
pr−
1109
−A
pr−
1115
−A
pr−
1121
−A
pr−
1121
−A
pr−
1129
−A
pr−
1103
−M
ay−
1104
−M
ay−
11E
lect
ion
SNP Con GreenLab LD Other
Figure 1.2 Holyrood list voting intention, January 2009–May 2011
10.1057/9781137023704 - More Scottish than British, Christopher Carman, Robert Johns and James Mitchell
Co
pyr
igh
t m
ater
ial f
rom
ww
w.p
alg
rave
con
nec
t.co
m -
lice
nse
d t
o U
niv
ersi
ty o
f S
ydn
ey -
Pal
gra
veC
on
nec
t -
2014
-08-
27

The 2011 Scottish Election in Context 15
One reading of these post-2010 election polls suggests that the UKdimension became uppermost in the Scottish electorate’s mind asattention was focused on political events in London. That is, the UKdimension seemed to spill over into Holyrood voting intentions fora period. It was not until the 2011 Holyrood campaign was in fullswing, about a month before the May 2011 election, that the aggre-gate voting intentions began to reflect what we would think of as the‘Scottish dimension’ (with the SNP assuming the lead over Labour).We return to the relative importance of the ‘Scottish dimension’throughout this book, but pay it special attention in Chapter 4.
Economic and fiscal crisis
In the previous section we discussed the blurring of responsibilitythat occurs with minority government. A further blurring of respon-sibility occurs when responsibility for economic and political out-comes is unclear to voters. A growing literature attempts to assess theimportance of globalization on the vote. Hellwig argues that voterswill evaluate political parties differently when parties are perceivedto be constrained by exogenous economic factors. Voters compensatefor this lack of responsibility by adjusting the criteria on which theyevaluate political actors and increase the salience of non-economicfactors (Hellwig 2008). Extending this argument to sub-state govern-ments, it is similarly likely that voters might adjust evaluation criteriaby prioritizing non-economic factors to account for the limitationsimposed by globalization and central governments.
Scholars have highlighted implications of the overall context ofglobalization and public perceptions of governmental responsibil-ity for economic management. Hyper-globalists suggest the end ofthe state (Ohmae 1990; Horsman and Marshall 1994) while more‘moderate’ globalists view state autonomy as diminished, constrain-ing the state’s policy-making capacity (Friedman 1999; Scholte 2000).National governments, it is maintained, are no longer the ‘locus ofeffective political power’ (Held and McGrew 1998: 242). An alter-native view challenges the powerlessness of states (Weiss 1998; alsoWeiss 2003 for debate). What concerns us is how the electorate per-ceives the impact of globalization on responsibility. At best, it hasbeen argued, the evidence is ambivalent on whether citizens per-ceive constraints that are claimed to exist to limit political leaders’
10.1057/9781137023704 - More Scottish than British, Christopher Carman, Robert Johns and James Mitchell
Co
pyr
igh
t m
ater
ial f
rom
ww
w.p
alg
rave
con
nec
t.co
m -
lice
nse
d t
o U
niv
ersi
ty o
f S
ydn
ey -
Pal
gra
veC
on
nec
t -
2014
-08-
27

16 More Scottish than British
abilities to ‘make a difference’ (Vowles 2008). Voters would not ratio-nally blame governing parties for economic conditions that were notcaused by governing parties (Duch and Stevenson 2008).
The Scottish block grant providing finance for the Scottish Parlia-ment increased by 60 per cent in real terms between 1999 and 2010,amounting to annual average increases of 5 per cent. This contextof ever-increasing growth in spending was abruptly halted followingthe economic and fiscal crises that occurred over the months follow-ing the 2007 election. Difficulties in managing Scottish finances hadbeen anticipated even before the crisis. A report produced in July2006, but only published after the 2007 election, reviewed ScottishExecutive budgets and concluded that the Partnership Agreementbetween Labour and the Liberal Democrats setting out prioritieshad been agreed in a ‘relatively benign economic climate wherethere was little evidence of pressure on public sector spending. Thenext PA is unlikely to be set in such a benign economic climate’(Howat 2006: 4.2.3). There would be no Partnership Agreement in2007 as the SNP governed as a minority but the benign climatehad gone. The economic and fiscal crises significantly exacerbatedthese problems. In 2010, the Auditor General for Scotland, chargedwith auditing Scottish public bodies, referred to a ‘long hard finan-cial winter’ (Black 2010). An Independent Budget Review (IBR) panelestablished by the Scottish government, at the insistence of the Con-servative opposition in Holyrood, produced a sobering report in July2010 (Beveridge 2010). The IBR set out public spending and publicpolicy options in the context of the tightened fiscal environment.It noted that it was reporting less than a year before the Holyroodelections,
The pre-election period, though a natural opportunity to debatematters of public policy, inevitably heightens the risk that short-term political imperatives polarize national discourse and exagger-ate differences of approach. Given the seriousness of the currentfiscal situation, and the high degree of consensus evident in repre-sentations to the Review, the Panel would strongly encourage themaximum degree of frankness and cross-party agreement aboutthe scale of the problem, potential solutions and the necessity toact now
(Beveridge 2010: 1.2.7)
10.1057/9781137023704 - More Scottish than British, Christopher Carman, Robert Johns and James Mitchell
Co
pyr
igh
t m
ater
ial f
rom
ww
w.p
alg
rave
con
nec
t.co
m -
lice
nse
d t
o U
niv
ersi
ty o
f S
ydn
ey -
Pal
gra
veC
on
nec
t -
2014
-08-
27

The 2011 Scottish Election in Context 17
The campaign
Labour was ahead in the polls for much of the year prior to May2011, leading commentators to predict a change of government atHolyrood. The Liberal Democrats were signalling support for a returnto coalition with Labour, and the Greens were signalling a willing-ness to work with Labour. But as the election approached, the pollsshifted in favour of the SNP (see Figure 1.2). By 23 March, the last daythe Parliament sat before the election, the SNP had pulled ahead andthis lead increased over the course of the following weeks leading upto polling day. As has become standard in Holyrood elections, therewere a number of leadership debates with the four main party lead-ers: Alex Salmond of the SNP, Iain Gray of Labour, Annabel Goldieof the Conservatives and Tavish Scott of the Liberal Democrats (seeChapter 3). Manifestos were launched during the campaign withmore similarities than differences between the parties on substan-tive public policies, other than the constitution. The SNP arguedfor a referendum on independence, which was opposed by all otherparties represented in Holyrood after 2007 except the Greens. Somemonths before the election, Labour abandoned its opposition to acouncil tax freeze and promised that a Labour Government wouldfreeze council tax for two years. It also mimicked the SNP in sup-porting free university education. However, the SNP promised tofreeze the council tax for the duration of the Parliament, thus out-bidding Labour while Labour was unable to criticize the policy inprinciple. Each party promised to increase police numbers and allbut the Liberal Democrats supported the creation of a single policeforce. Labour promised to reinstate a plan to link Glasgow Centraland Glasgow airport by rail, end youth unemployment through anapprenticeship scheme and introduce mandatory six-month prisonsentences for people found in possession of knives. Of the four mainparties, the Conservatives stepped outside the policy mainstreammore than the others, promising to reintroduce prescription charges,which had been abolished by the SNP, give support to building newnuclear power stations, introduce a variable university graduate feeand replace community service with short prison sentences.
In 2007, voters were attracted to the SNP’s positive campaigningand put off by a perceived negativity in Labour’s campaign (Pattieet al. 2011). Once more, the overall perception was that the SNP
10.1057/9781137023704 - More Scottish than British, Christopher Carman, Robert Johns and James Mitchell
Co
pyr
igh
t m
ater
ial f
rom
ww
w.p
alg
rave
con
nec
t.co
m -
lice
nse
d t
o U
niv
ersi
ty o
f S
ydn
ey -
Pal
gra
veC
on
nec
t -
2014
-08-
27

18 More Scottish than British
fought a positive campaign, even more so than in 2007 while Labourparticularly was perceived to have been negative in its campaign tone(see Chapter 3). If we measured how important an election was to aparty by the amount spent on its election campaign, then it wouldappear that this was a first-order election for the SNP. Against thebackdrop of having fought a UK general election campaign in 2010and a difficult economic climate, it was to be expected that the partieswould have less available to fight the 2011 campaign. This pattern isrevealed in Table 1.3, with only the Greens increasing their campaignspending over the 2007 campaign. As in 2007, the SNP outspent theother parties though less than it had spent four years previously butcloser to its previous figure than was achieved by the other parties.This meant that the SNP spent three-quarters of the legal limit per-mitted, whereas Labour spent just over half the amount it was legallyentitled to spend. The SNP had spent only £315,776 in 2010 (Elec-toral Commission 2011), 28 per cent of the amount it spent in 2011.In 2011, the Conservatives spent a fifth of the amount it had spentat the previous year’s UK election. Labour spent less in 2011 than in2010 though the difference was much smaller than the Conservativeor SNP margins and the Liberal Democrats spent under 40 per cent ofthe amount they had spent in 2010.
Looking at where the campaigns devoted their resources inTables 1.4 and 1.5, we see further evidence that all of the partiesshifted their campaign strategies from 2007. Reflecting the decreas-ing importance of the parties’ political broadcasts, all of the parties,aside from the Greens, decreased the amount they spent on theirparty broadcasts. On the other hand, most of the parties (asidefrom the Conservatives) increased the amount devoted to sendingmailings through prospective voters’ letterboxes, while at the sametime decreasing their general advertising budgets. On the surface,this would seem to mirror a general trend in British elections – theincreased targeting of specific sets of voters and a decline in broad,generalized campaigning (Denver, Carman and Johns 2012).
Overall, the general campaign was fairly low key with the usualstage-managed events organized by the parties. One of the fewmoments when a party lost control of such an event occurred early inthe campaign. Iain Gray was at Glasgow Central train station to high-light the SNP government’s decision to cancel a planned rail link toGlasgow airport when he was ‘ambushed’ by a group calling itself
10.1057/9781137023704 - More Scottish than British, Christopher Carman, Robert Johns and James Mitchell
Co
pyr
igh
t m
ater
ial f
rom
ww
w.p
alg
rave
con
nec
t.co
m -
lice
nse
d t
o U
niv
ersi
ty o
f S
ydn
ey -
Pal
gra
veC
on
nec
t -
2014
-08-
27

19
Table 1.3 2011 Campaign spending in Scottish elections compared to Westminster (general) elections, in GBP
Holyrood2003
Westminster2005
Holyrood2007
Westminster2010
Holyrood2011
2011–2007Change in £
2011 Spendingas a percent of2007 (%)
Conservative 323,279 1,317,192 601,982 1,273,110 273,462 −328,520 45labour 726,702 1,636,450 1,102,866 967,904 816,889 −285,977 74Lib Dems 130,360 435,406 297,572 470,619 176,300 −121,272 59Greens 63,864 0 99,132 0 132,464 33,332 134SNP 473,107 193,987 1,382,730 315,776 1,141,662 −241,068 83Other parties 354,853 83,135 576,242 63,135 90,469 −485,773 16Total 2,072,165 3,666,170 4,060,524 3,090,544 2,631,246
Source: Electoral Commission (2012).
10.1057/9781137023704 - More Scottish than British, Christopher Carman, Robert Johns and James Mitchell
Co
pyr
igh
t m
ater
ial f
rom
ww
w.p
alg
rave
con
nec
t.co
m -
lice
nse
d t
o U
niv
ersi
ty o
f S
ydn
ey -
Pal
gra
veC
on
nec
t -
2014
-08-
27

20
Table 1.4 2011 Party spending by expenditure category
Conservatives Labour Lib Dems Scottish Greens SNP
2007 2011 2007 2011 2007 2011 2007 2011 2007 2011
Party politicalbroadcasts
29,338 5088 59,685 46,236 15,381 4558 3161 7630 90,726 71,961
Advertising 119,419 664 337,609 115,986 26,166 8441 28,979 10,699 494,642 294,601Unsolicited
material toelectors
247,521 200,150 270,020 545,746 98,323 104,274 35,947 73,572 323,580 405,728
Manifesto orreferendummaterial
9134 4062 17,525 9147 6905 1972 7111 2665 56,999 14,067
Marketingresearch/canvassing
15,353 1434 107,477 32,623 64,626 20,680 2199 1860 178,705 201,613
Media 17,957 1922 29,710 6153 29,481 73 3855 14,123 45,041 32,269Transport 2243 10,475 72,366 16,799 29,635 10,530 565 951 52,239 34,957Rallies and other
events270 1783 89,685 19,693 1710 1936 2036 194 64,652 20,689
Overheads/generaladministration
160,747 47,884 118,789 24,503 25,345 23,836 15,279 20,771 76,146 65,777
Source: Electoral Commission (2012).
10.1057/9781137023704 - More Scottish than British, Christopher Carman, Robert Johns and James Mitchell
Co
pyr
igh
t m
ater
ial f
rom
ww
w.p
alg
rave
con
nec
t.co
m -
lice
nse
d t
o U
niv
ersi
ty o
f S
ydn
ey -
Pal
gra
veC
on
nec
t -
2014
-08-
27

The 2011 Scottish Election in Context 21
Table 1.5 2011 Party spending by expenditure category as a percentage of2007 spending
Conservatives(%)
Labour(%)
Lib Dems(%)
Greens(%)
SNP(%)
Party politicalbroadcasts
17.3 77.5 29.6 241.4 79.3
Advertising 0.6 34.4 32.3 36.9 59.6Unsolicited material
to electors80.9 202.1 106.1 204.7 125.4
Manifesto orreferendum material
44.5 52.2 28.6 37.5 24.7
Marketing research/canvassing
9.3 30.4 32.0 84.6 112.8
Media 10.7 20.7 0.2 366.4 71.6Transport 467.0 23.2 35.5 168.3 66.9Rallies and other
events660.4 22.0 113.2 9.5 32.0
Overheads/generaladministration
29.8 20.6 94.0 135.9 86.4
Source: Electoral Commission (2012).
‘Citizens United Against Cuts to Public Services’. Mr Gray and histeam of Labour members sought refuge in a nearby fast-food outletonly to be followed by the protesters and the media, creating scenesthat allowed his opponents to characterize Mr Gray as running awayfrom a difficult situation. The Conservatives also suffered an earlyembarrassment in the campaign when three of the party’s candidateswithdrew, including one who accused the party of forcing him out tomake way for Ruth Davidson, who would become leader shortly afterthe election.
In 2007, the SNP was endorsed by a number of newspapers butthe large circulation papers had continued to back Labour. The frontpage of the Scottish edition of The Sun in 2007 had shown a pic-ture of a noose with the words, ‘VOTE SNP TODAY AND YOUPUT SCOTLAND’S HEAD IN THE NOOSE’ followed by a series ofpages offering, ‘Reasons to be fearful’. By 2011, The Sun had decidedthat the SNP was to be trusted and while it made it clear that itopposed independence, its front-page headline on 19 April read,‘PLAY IT AGAIN SALM’, followed by six pages of support for the SNP,
10.1057/9781137023704 - More Scottish than British, Christopher Carman, Robert Johns and James Mitchell
Co
pyr
igh
t m
ater
ial f
rom
ww
w.p
alg
rave
con
nec
t.co
m -
lice
nse
d t
o U
niv
ersi
ty o
f S
ydn
ey -
Pal
gra
veC
on
nec
t -
2014
-08-
27

22 More Scottish than British
especially First Minister Alex Salmond, and excoriation of Labour.It printed a picture of its front page from four years before andexplained why it had changed its mind. As Scotland’s largest sellingnewspaper, with 330,000 sales, this was a major boost to the SNP.
Conclusion
The Scottish electorate was faced with choices made difficult withthe blurring of accountability in a number of ways. Minority gov-ernment gives the governing party scope to blame its opponents forblocking its policy programme. Devolved government further blurslines of accountability, especially given the financing of devolution.The global financial crisis has been used by governments of all huesaround the world to shift responsibility for poor economic perfor-mance away from those heading governments. Voters might havebeen inclined to judge the governing party at Holyrood or thegoverning parties at Holyrood or even pass judgement on the pre-vious UK Labour Government. Whoever won the election would faceunprecedented difficulties managing economic and fiscal difficultiesunder devolution, indeed with the prospect of public spending cutsunprecedented in modern UK politics. The constitutional questionhas long been a feature of Scottish elections but its impact on theelection was unclear. The SNP’s commitment to independence hadbeen played down in successive Holyrood elections, largely by a com-mitment to hold a referendum on independence, de-coupling or atleast diluting the connection between a vote for the SNP from a votefor independence. After four years of an SNP Government that hadbeen unable to pass legislation to hold a referendum, this de-couplingmay have appeared to have succeeded.
In the following chapters, we develop an explanation of howScotland votes today. More accurately, we develop an explanation ofwhat motivates Scottish voters voting in Scottish elections. We beginthis explanation in Chapter 2 with a discussion of the classic sourcesof variation in Scottish voting behaviour: demographic differences,religious differences and class differences. We find that these vari-ables are proving less useful than they used to be in delineatingdifferent voters – Labour and SNP voters, for instance, are very hardto distinguish by class and religious background.
10.1057/9781137023704 - More Scottish than British, Christopher Carman, Robert Johns and James Mitchell
Co
pyr
igh
t m
ater
ial f
rom
ww
w.p
alg
rave
con
nec
t.co
m -
lice
nse
d t
o U
niv
ersi
ty o
f S
ydn
ey -
Pal
gra
veC
on
nec
t -
2014
-08-
27

The 2011 Scottish Election in Context 23
With the traditional dividing lines between voters becomingblurred, in the following chapters we turn to other possible variableswe can use to predict how (and why) Scottish voters vote as theydo in Holyrood elections. In Chapter 3 we address the pivotal rolethat parties and leaders play in helping to formulate voters’ electoraldecisions. In many ways, this chapter deals with the question of whythe dominant position that Labour has long enjoyed in Scottish pol-itics did not equate to a Scottish Labour Government being returnedfollowing the 2011 election. Turning that question on its head, wealso address how the SNP’s minority government managed to over-come the ‘costs of ruling’ and produce such a resounding victory.The unsurprising answer lies in the fact that the SNP had, in AlexSalmond, the most popular and most influential leader, and that theparty had cultivated an image of competence, trustworthiness andcommitment to stand up for Scotland’s interests within the UK.
Chapter 4 delves more deeply into the importance of publicperceptions of the parties’ capacities to deal with the important issuesfacing Scotland. Since the main parties did not much distinguishthemselves from one another in terms of their stances on the mainpolicy questions of the day, the electorate was left to focus on theissues on which there is agreement about outcomes but not necessar-ily about who is best placed to achieve that outcome. Here we findthat the SNP managed to secure its landslide victory through one ofthe most prosaic of reasons – it was seen as the party most competentto govern. Yet, and importantly, it is also clear that the SNP’s victorywas not a ringing endorsement of the one major policy that distin-guishes the party from the other ‘leading’ Holyrood parties. We useour panel data to demonstrate that, while voters’ constitutional pref-erences may have led some to vote for the SNP in 2007, the 2011 voteshowed little sign of being swayed by constitutional politics. Indeed,it seems that the 2007–2011 SNP minority government may haveeased some voters’ fears and concerns about the SNP’s independenceagenda.
This leads us to address the particular ‘Scottish dimension’ of the2011 Scottish elections and brings us back to the question: After threefull sessions of the Scottish Parliament, how much do voters feel isat stake in Scottish Parliament elections? We would imagine that,as the Scottish public increasingly comes to grips with devolution
10.1057/9781137023704 - More Scottish than British, Christopher Carman, Robert Johns and James Mitchell
Co
pyr
igh
t m
ater
ial f
rom
ww
w.p
alg
rave
con
nec
t.co
m -
lice
nse
d t
o U
niv
ersi
ty o
f S
ydn
ey -
Pal
gra
veC
on
nec
t -
2014
-08-
27

24 More Scottish than British
and better understands the ebb and flow of Holyrood politics, voterswould increasingly develop uniquely Scottish political identities. Thisis confirmed in Chapter 5. Even the economy, ostensibly a domain inwhich Westminster rather than Holyrood pulls the levers, became inmany respects a ‘Scottish’ issue in 2011 as the parties fought overwho could best insulate Scotland against the chill wind of fiscalausterity blowing from London. We argue that Scottish voters facetwo political worlds and, because Scottish Parliament elections takeplace in a now distinct devolved world, they are becoming increas-ingly ‘Scottish’. The notion of parallel political worlds is supportedby evidence from a survey experiment embedded within the ScottishElection Study (SES), which shows that the patterns of party iden-tification within the Scottish electorate depend heavily on whetherrespondents are primed to think about ‘UK politics at Westminster’or ‘Scottish politics at Holyrood’. These differences go a long wayto explaining why the 2010 and 2011 elections, while just one yearapart, saw such dramatically different outcomes in Scotland.
In Chapter 6 we pull together the different influences on voterchoice in Scottish Parliament elections discussed in the previouschapters into a single statistical model of party choice in the 2011Scottish parliament elections. Our models largely reinforce the ‘per-formance politics’ (or ‘valence’) model of party choice: voters arelargely influenced by their evaluations of relative party (and govern-ment) competence. Tied to this, leader evaluations came to play arole in the election, where Alex Salmond’s appeal to voters helpedthe SNP to victory. Perhaps as interesting as the variables that are sig-nificant predictors of party choice in the 2011 election are those dogsthat barked only quietly, such as constitutional preferences. As wehighlight several times throughout this book, in 2011 Scots were, byand large, voting for the SNP as a Scottish government, not as a routeto independence.
10.1057/9781137023704 - More Scottish than British, Christopher Carman, Robert Johns and James Mitchell
Co
pyr
igh
t m
ater
ial f
rom
ww
w.p
alg
rave
con
nec
t.co
m -
lice
nse
d t
o U
niv
ersi
ty o
f S
ydn
ey -
Pal
gra
veC
on
nec
t -
2014
-08-
27

2Results and the Sourcesof Party Support
In this chapter we will use data from the 2011 SES to consider whovotes for the various parties, the impact that the electoral systemhad on the outcome, the relationship between constituency and listvoting and how voters’ allegiances shifted over time. In essence, thechapter aims to describe the typical voter for each of the main parties.In the past, this was deemed a relatively easy task but this electionhas shown that it is less easy to distinguish between the main partiesin terms of socio-economic backgrounds. The biggest shock of theelection was the overall majority won by the SNP, a result that waswidely viewed as highly unlikely. The mixed-member proportionalelectoral system used in Scottish Parliamentary elections had had animmediate impact from the first Holyrood elections in 1999 whenLabour, by far the main beneficiary of the simple plurality system,was predictably unable to command an overall majority and formedtwo consecutive coalition governments with the Liberal Democrats.Leading into the 2011 election, while some commentators may haveexpected that the SNP might retain or strengthen its positions asScotland’s largest party, few anticipated that it would have an over-all majority. We will explore how this was achieved under a systemassumed by its designers to be almost impossible. We will also con-sider how voters shifted allegiances from 2007, when the SNP wonits one-seat advantage over Labour, through the 2010 UK generalelection, which saw Labour not only win a convincing overall major-ity of Scottish seats but witnessed an increase in its Scottish supportwhile its vote south of the border declined. We are able to follow theviews of a panel of the same voters to track these changes in politicalbehaviour.
25
10.1057/9781137023704 - More Scottish than British, Christopher Carman, Robert Johns and James Mitchell
Co
pyr
igh
t m
ater
ial f
rom
ww
w.p
alg
rave
con
nec
t.co
m -
lice
nse
d t
o U
niv
ersi
ty o
f S
ydn
ey -
Pal
gra
veC
on
nec
t -
2014
-08-
27

26 More Scottish than British
Scottish Election Study (SES), 2011
The analyses we present in this and the following chapters makeextensive use of data collected for the 2011 SES. The Economic andSocial Research Council-funded 2011 SES was a large survey designedspecifically to assist academics, practitioners and the public to betterunderstand how the Scottish electorate perceives and understandselections to the Scottish Parliament. The specific technical infor-mation about the pre- and post-wave surveys – including samplinginformation, fieldwork dates, survey instrument construction and soon – is provided in Appendix 1. There are, however, several aspectsof the 2011 SES that we should elaborate on before we turn to ouranalyses of the data: namely, the survey mode and the SES’s inter-and intra-panel design.
First, as it did in 2007, the SES contracted with YouGov to conductthe election study over the internet. The main reason for conduct-ing the SES online is, of course, cost. It is significantly less expensiveto conduct surveys online than it is to conduct face-to-face surveys.As in all things, however, there are trade-offs between the two meth-ods of survey administration. While internet surveys are substantiallyless expensive to conduct, they do tend to be somewhat less accu-rate in replicating known turnout parameters. Generally speaking, awell-designed face-to-face survey can do a better job of replicating dif-ferences in turnout across groups than can an equally well-designedinternet survey. That said, face-to-face surveys, in addition to beingextremely expensive to conduct, tend to be a rather lethargic methodof gathering public opinion data. As long as there are public opin-ion scholars – and, more importantly, firms that profit by conductingsurveys on behalf of those scholars – there is likely to be an activedebate on the ‘best’ mode for surveying large populations. Indeedthere is already an extensive literature on the subject. Looking specif-ically to compare different survey modes used in Scotland, Johnset al. (2007), compared predictions derived from the 2007 SES andthe 2007 Scottish Social Attitudes survey, both conducted followingthe 2007 Holyrood election. While they find that the internet surveydid over-report turnout (though the difference between the surveyswas not statistically significant), their analysis shows little differencein the main predictors of party choice. Where they do identify dif-ferences in prediction, these seem to be due to the fact that the
10.1057/9781137023704 - More Scottish than British, Christopher Carman, Robert Johns and James Mitchell
Co
pyr
igh
t m
ater
ial f
rom
ww
w.p
alg
rave
con
nec
t.co
m -
lice
nse
d t
o U
niv
ersi
ty o
f S
ydn
ey -
Pal
gra
veC
on
nec
t -
2014
-08-
27

Results and the Sources of Party Support 27
SSA’s face-to-face interviews were held several weeks after the elec-tion. They conclude that, as long as we recognize their weaknesses,there is much to recommend internet surveys as a (relatively) inex-pensive method for capturing responses much sooner after an event(such as an election), than face-to-face surveys.
Using the internet as the mode for administering the SES allowedus to include multiple panels in the 2011 study. Following whathas become the common practice for election studies, the 2011 SESincluded a pre- and post-election panel. That is, the same respon-dents were surveyed the week before the election and then againin the two weeks following the election. The key advantage of thisdesign in 2011 is that it allows us to analyse party choice – that is, thevote – based on information gathered before our respondents wentto the polls. This helps us deal with the problem of survey respon-dents adjusting their responses to survey questions to match theirvote choice. For instance, we could imagine that a respondent whodecided to cast a vote for, say, the SNP, would adjust their responsesto questions asking about issues closely identified with the SNP –for example, constitutional issues – to more closely align with theirperceptions of the SNP’s positions. By asking about relevant issuesand controversies prior to the election, and using those responsesto predict vote choice, we are able to deal with the problem ofrespondents aligning their personal policy preferences with their votechoice after the fact.
Using YouGov’s pool of respondents, the SES was able to consti-tute a ‘panel’ with responses from the 2007 election study. That is,since YouGov uses a unique identifier for the respondents in theirpool, the 2011 study was able to return to respondents from the 2007study. This creates a somewhat unique Scottish data set – respondentsinterviewed in two consecutive election studies were asked a wideswathe of questions about party preferences, issue positions and con-stitutional dispositions as well as the usual battery of election-relatedquestions. Leveraging these data, we are able to compare individualresponses to these questions across election cycles, examining the(in)stability of individual issue positions and vote choice over time.
Socio-demography of the Scottish vote
Parties draw support unevenly from the electorate, differing in termsof class, religion, age, gender and geography. Core support provides
10.1057/9781137023704 - More Scottish than British, Christopher Carman, Robert Johns and James Mitchell
Co
pyr
igh
t m
ater
ial f
rom
ww
w.p
alg
rave
con
nec
t.co
m -
lice
nse
d t
o U
niv
ersi
ty o
f S
ydn
ey -
Pal
gra
veC
on
nec
t -
2014
-08-
27

28 More Scottish than British
parties with an important electoral base but parties seeking to maxi-mize electoral support need to build beyond that core. Analysing ourdata, we are able to paint a picture of the kind of voters most likelyto vote for each of the main parties and how this has changed overtime. While this tells us who votes for whom, this does not tell uswhy they vote in this way but may provide some clues.
An earlier generation of psephologists focused heavily on soci-etal cleavages. In a widely quoted statement, Lazarsfeld, Berelsonand Gaudet maintained that, ‘a person thinks, politically, as heis, socially. Social characteristics determine political preference’(Lazarsfeld, Berelson and Gaudet 1968: 27). This has often been inter-preted as a determinist view of political behaviour but only whenread out of context, as Zuckerman pointed out (Zuckerman 2005: 6).Lazarsfeld, Berelson and Gaudet had noted the tendency rather thanthe certainty of social contextual influence and that people ‘belongto a variety of groups’ and it was unclear ‘with which group’ they aremost likely to vote (Lazarsfeld et al. 1968: 170). Whether expressed indeterminist terms or only as a tendency, the key point was that socialstructures had a significant influence on political behaviour.
In their historical work on social cleavages, Lipset and Rokkanargued that two critical junctures in European history had given riseto societal cleavages with path-dependent qualities: the ‘national’revolution when states were formed led to a centre-periphery cleav-age and a church-state cleavage, as emerging central governmentscompeted for the loyalties and asserted authority over populationsacross the state; the ‘industrial’ revolution which gave rise to classand urban-rural cleavages. They maintained that, ‘the party sys-tems of the 1960s reflect, with few but significant exceptions, thecleavage structures of the 1920s [ . . . ] [T]he party alternatives, andin remarkably many cases, the party organizations, are older thanthe majorities of the national electorates’ (Lipset and Rokkan 1967:50). Rose and Urwin (1970) provided confirmation of this ‘freezinghypotheses’ in Western Europe, suggesting that the ‘first priority ofsocial scientists is to explain the absence of change’ (Rose and Urwin1970: 295).
Much was to change in understandings of political behaviour overthe next decade. But the question at this point in time was whichcleavage was most important. In an earlier publication, Rose andUrwin argued that religious divisions ‘not class, are the main social
10.1057/9781137023704 - More Scottish than British, Christopher Carman, Robert Johns and James Mitchell
Co
pyr
igh
t m
ater
ial f
rom
ww
w.p
alg
rave
con
nec
t.co
m -
lice
nse
d t
o U
niv
ersi
ty o
f S
ydn
ey -
Pal
gra
veC
on
nec
t -
2014
-08-
27

Results and the Sources of Party Support 29
bases of parties in the Western world today’ (Rose and Urwin 1969:12); across most of Europe, only in the Scandinavian states andBritain was class found to be more useful than religion in predictingleft-right party choice (Rose 1974: 16–18). A rather parochial Britishperspective viewed class as all-important, mixed with a tendency toignore the territorial dimension of voting behaviour. Class may havebeen very significant in Scottish electoral politics but to argue thatall else was merely embellishment oversimplified the analysis. Whilesocial class was the ‘strongest influence upon voting choice [ . . . ]other influences may not be so totally eclipsed by class in Scotlandas the theory of British homogeneity maintains’ (Budge and Urwin1966: 50).
As voting patterns show, even accounting for class, there was a dis-tinct pattern to political behaviour in Scotland compared to otherparts of Britain, whether this was a manifestation of the centre-periphery cleavage or a manifestation of other social differences.Religion, for example, has had enduring significance in Scottish polit-ical behaviour (Bochel and Denver 1970; Budge and Urwin 1966;Budge et al. 1972). However, the religious dimension to Scottishelectoral behaviour did not conform to the classic cleavage modeldevised by Lipset and Rokkan (Lipset and Rokkan 1967). The cleav-age manifested itself less as a clerical vs. anti-clerical divide invoting behaviour, instead manifesting as an inter-denominational(Catholic/Protestant) cleavage. Labour appealed more to Catholicsand the Conservatives and Liberals to Protestants, giving them signif-icant core supporters especially when combined with class identity.Moving beyond a basic examination of denominational divides, itis now widely acknowledged in the comparative study of religionand political behaviour that the religious cleavage has two dimen-sions: the religion or denomination to which voters belong (orwhether they have any religious affiliation at all); and the degreeof religiosity (Dalton 1996: 177–179). Beyond religion, there wassome additional evidence of an urban-rural divide in Scottish vot-ing behaviour though this manifestation of another of the Lipsetand Rokkan cleavages may have owed much to class identities.In essence, even at the high point when class dominated under-standings of British electoral politics there was evidence that muchelse needed to be taken into account in understanding Scottishpolitics.
10.1057/9781137023704 - More Scottish than British, Christopher Carman, Robert Johns and James Mitchell
Co
pyr
igh
t m
ater
ial f
rom
ww
w.p
alg
rave
con
nec
t.co
m -
lice
nse
d t
o U
niv
ersi
ty o
f S
ydn
ey -
Pal
gra
veC
on
nec
t -
2014
-08-
27

30 More Scottish than British
In the 2011 election, the old cleavages remained relevant but weremuch less useful in helping us distinguish between the main partiesthan they have been in the past. As the SES data reveals, in largemeasure this was due to increasing similarities (or decreasing differ-ences) in the compositions of SNP and Labour supporters comparedto previous electoral cycles. The SNP advanced among all groups butnotably so among those social groups from whom it had previouslystruggled to win support. At first glance, it appeared that the SNP hadbroken through Labour’s classic citadels by winning more supportamong the subjective working-class Catholics and in urban Scotland.An additional distinguishing characteristic of the SNP vote, and itsmembership more specifically, as shown in other research (Johnset al. 2011), was gender. Previously, the party’s advances, and partic-ularly in 2007, had been associated with its advantage among men.But in 2011, it increased its support among women to a greater extentand largely removed the gender gap that had previously existed.Labour now appears to have a greater gender gap but in the oppositedirection.
But there are several important observations that should be empha-sized. First, the SNP’s support rose among all social groups. Lookingat Table 2.1 and more specifically the column denoting the changein SNP support (i.e., its share of the list, or regional, vote) between2007 and 2011, we see a full slate of positive figures to the SNP’sadvantage. This is the proverbial rising tide that raises all of the ships.The SNP’s appeal may have differed across social groups, suggestingthat social structure still matters in some way, but there were no majorgroups in which the SNP failed to improve its appeal. This suggests thatsocial structural explanations are likely to be inadequate in explain-ing the outcome of the 2011 election. Perhaps more importantly, thisalso means that it is now more difficult to predict an individual’s vot-ing behaviour based on socio-demographic characteristics in Scotlandthan at any previous time.
Secondly, while the SNP may have become the most popular partyamong Catholics, for example, we should heed the distinction foundin the comparative literature between religious affiliation and reli-giosity, or the intensity of religious belief and practice in one’s life.Table 2.2 presents the list vote by both religious affiliation and reli-giosity. Here, we classified respondents who say that they attendchurches services at least once a fortnight as being ‘religious’, com-pared to identifiers who attend services less often.1 As Table 2.2
10.1057/9781137023704 - More Scottish than British, Christopher Carman, Robert Johns and James Mitchell
Co
pyr
igh
t m
ater
ial f
rom
ww
w.p
alg
rave
con
nec
t.co
m -
lice
nse
d t
o U
niv
ersi
ty o
f S
ydn
ey -
Pal
gra
veC
on
nec
t -
2014
-08-
27

Results and the Sources of Party Support 31
Table 2.1 List vote by demographic group, 2011 and change 2007–2011
2011 Change 2007–2011
Cons Lab Lib Dem SNP Cons Lab Lib Dem SNP
SexMale 12 24 6 46 −2 −5 −4 +11Female 12 29 4 43 −2 −1 −9 +16
Age18−34 7 24 8 43 −6 −9 −3 +1735−54 10 28 4 47 − −2 −8 +1655+ 17 26 5 42 −2 −1 −5 +7
ResidenceUrban 11 28 4 43 −1 −6 −7 +15Rural 14 25 6 45 −5 +6 −7 +8
Social classA, B 14 25 5 41 −4 −3 −7 +15C1 17 25 8 41 +5 −3 −5 +9C2, D, E 9 28 4 47 − −6 −3 +9
ReligionNone 9 25 5 47 −4 −2 −8 +15Church of
Scotland15 26 6 44 − −2 −4 +9
Catholic 9 36 2 43 −1 −10 −3 +15
Table 2.2 List vote by religion and religiosity
Secular Catholic Church of Scotland Other Protestant
Religious Cultural Religious Cultural Religious Cultural
DNV 19 12 19 8 13 6 15Conservative 7 5 8 19 12 33 21Labour 18 35 23 14 20 12 21Lib Dem 4 0 2 6 5 6 6SNP 36 36 38 42 40 22 28Other 16 12 9 12 10 22 1N 989 58 107 61 302 51 102
shows, more religious Catholics were significantly less likely to shiftaway from Labour than ‘cultural Catholics’, those who may havebeen born in the faith but do not practice their faith on a regularbasis. This conforms with earlier understandings of voting behaviour
10.1057/9781137023704 - More Scottish than British, Christopher Carman, Robert Johns and James Mitchell
Co
pyr
igh
t m
ater
ial f
rom
ww
w.p
alg
rave
con
nec
t.co
m -
lice
nse
d t
o U
niv
ersi
ty o
f S
ydn
ey -
Pal
gra
veC
on
nec
t -
2014
-08-
27

32 More Scottish than British
discussed above in which it was found that those with a strongersense of community, or communion, within a social group willbe least likely to shift political allegiance. It was among culturalCatholics that the SNP has seen its greatest advances over a longperiod of time, but most notably in 2011.
Similarly, Labour retains its core support among those with thestrongest identification with class. Indeed, one of the clearest aspectsto shine through the analysis of social class and the Labour vote is thedistinct and clear differences in objective and subjective social class.Here we use the standard NRS (A, B, C1, C2, D and E) ‘social grade’,or class, scale as the ‘objective’ indicator (where this scale is basedon employment or job function). For the subjective indicator we usethe question from the post-election wave that simply and straight-forwardly put it to respondents, ‘Most people say they belong eitherto the middle class or the working class. If you had to make a choice,which would you say that you belong to?’ Respondents were giventhe options ‘Middle class’, ‘Working class’ and ‘Can’t choose’.
Using these two indicators, Table 2.3 presents the differences inregional vote by where the objective measure places respondents(with C2, D and E being classified as ‘working class’) and where theyplace themselves on the subjective measure.
One of the interesting blocks here is the one in which respondentsobjectively fall into the ‘working class’ but subjectively identified
Table 2.3 Party vote by objective and subjective social class,column percentages
Subjective
Middle Working
Objective Middle 28 9 Conservative19 34 Labour10 4 Lib Dem43 52 SNP
277 271 N
Working 22 8 Conservative19 33 Labour9 4 Lib Dem
50 55 SNP126 445 N
10.1057/9781137023704 - More Scottish than British, Christopher Carman, Robert Johns and James Mitchell
Co
pyr
igh
t m
ater
ial f
rom
ww
w.p
alg
rave
con
nec
t.co
m -
lice
nse
d t
o U
niv
ersi
ty o
f S
ydn
ey -
Pal
gra
veC
on
nec
t -
2014
-08-
27

Results and the Sources of Party Support 33
themselves with the ‘middle’ class. The only difference between theserespondents and those who both objectively and subjectively fellin the middle-class category is a slight shift from Conservative vot-ing toward SNP voting. The same percentage (19 per cent) in theworking/middle category said that they voted Labour as in the mid-dle/middle category. The shift in the Labour vote is between the sub-jective and objective working-class classifications. Those respondentsself-identifying as ‘working class’ showed a much greater inclinationto vote Labour than those who said that they are middle class. Reportsof the death of social cleavages may be exaggerated (Elff 2007: 289).That said, referring back to Table 2.1, the evidence in Scotland sug-gests that the core vote has shrunk and that parties must now workmuch harder to build beyond this core.
From class to national identity
While socio-economic structures gave rise to these changes, theyinvolved a sense of collective identity. Cleavages are important elec-torally so long as they have distinct social bases, members have asense of collective identity and party organizations are organizedaround these cleavages (Gallagher et al. 2006: 268–269). In thissense, class is as much an ‘imagined community’ as is national iden-tity (Anderson 1991). Changes in electoral behaviour in the 1970ssuggested a thawing of the social structural explanations. A neworthodoxy challenged the importance of structural explanations ofvoting behaviour. The ‘decline of class voting in Britain’ (Franklin1985) was thought to lead to unpredictable election outcomes (Crewe1982). This finding in British electoral politics was evident elsewhere(Franklin et al. 1992; Dalton 2002) though others challenged this newemerging orthodoxy (Bartolini and Mair 1990). This thaw createdopportunities for new and smaller parties. Indeed, it was conceiv-able that the thawing of one form of collective identity createdopportunities for alternative identities to arise. This thaw, or de-alignment, focused almost exclusively on class when discussing socialstructural and electoral behaviour, though also included party de-alignment, but established parties benefited from other alignmentstoo. As we can see, there has been a significant religious de-alignmentin Scotland.
There have been attempts to explain the rise of the SNP as therise in importance of the centre-periphery cleavage. However, the
10.1057/9781137023704 - More Scottish than British, Christopher Carman, Robert Johns and James Mitchell
Co
pyr
igh
t m
ater
ial f
rom
ww
w.p
alg
rave
con
nec
t.co
m -
lice
nse
d t
o U
niv
ersi
ty o
f S
ydn
ey -
Pal
gra
veC
on
nec
t -
2014
-08-
27
34 More Scottish than British
extent of the thaw should not be exaggerated. The emerging SNPstruggled to break into these more aligned sections of the community(Miller 1981: 146). In 1979, Labour won 67 per cent of the ScottishCatholic vote (cf 42 per cent of overall vote) while the Conserva-tive support among Protestants was 39 per cent (cf 31 per cent ofoverall vote) suggesting the persistence of a religious denominationalcleavage.
In the 1980s, Labour’s support in Scotland held up well comparedwith its decline south of the border. A higher proportion of Scottishvoters recorded both a class and national identity in 1992 than in1979 (Brand et al. 1993) creating a ‘distinctive form of politics inScotland’ (Bennie et al. 1997: 106). A larger proportion of objec-tively middle-class voters identified with the working-class and votedLabour than south of the border. Crudely expressed, it was as if an oldScotland continued to live on in the minds of the Scottish electorate.That pattern has altered since devolution, especially in the context ofHolyrood elections. Paradoxically, the distinctive form of politics pre-devolution appeared to act as a break on de-alignment in Scotlandbut, since devolution, appears to have accelerated de-alignment. Butwhat made Scottish politics distinct was not simply the existence ofthe SNP.
New Labour was in part a response to the decline of the working-class after 1945, a need to build a coalition of support that extendedbeyond its declining core. As Heath and MacDonald (1987) noted,social change between 1964 and 1988 cost Labour about 5 per cent ofits ‘natural’ support raising questions as to whether there was roomfor class politics or socialism in Labour’s programme (Heath et al.2001: 18–29). However, while class de-alignment may have occurredacross Britain (Crewe, Sarlvik and Alt 1977), this thesis was felt tobe insufficiently attentive to the ‘contextualised meaning of socialclass in political action’ in different parts of Britain (Brown et al.1996: 142). Labour’s dominance of Scottish politics pre-devolutionwas also based on an efficient vote within a favourable electoral sys-tem. Labour’s overall share of the vote in Scotland reached its highpoint in 1966 when it won 49.9 per cent of the vote and 64.8 per centof Scottish seats, but its highest share of seats came in 1997 when itwon 77.8 per cent of Scottish seats with only 45.6 per cent of thevote. The electoral system had created increasingly disproportionalresults with Labour the beneficiary.
10.1057/9781137023704 - More Scottish than British, Christopher Carman, Robert Johns and James Mitchell
Co
pyr
igh
t m
ater
ial f
rom
ww
w.p
alg
rave
con
nec
t.co
m -
lice
nse
d t
o U
niv
ersi
ty o
f S
ydn
ey -
Pal
gra
veC
on
nec
t -
2014
-08-
27

Results and the Sources of Party Support 35
These pictures today are very different from those of the past, notleast because society has changed. It would be difficult to find manypeople who conform to the image conjured up by the ‘working-class’ in previous decades. The decline of Scottish heavy industries,the changing nature of employment, the reduction in the numberof council houses and the decline of trade union membership hasaltered Scottish society and Scottish electoral politics.
It has now become standard practice to consider the national iden-tities of voters in Scottish elections. This follows the work of JuanLinz, who pioneered the question often referred to in the UK asthe ‘Moreno Question’ (for origins see Peres 2007).2 We might haveexpected two related phenomena had the centre-periphery cleavagebeen in the process of supplanting other cleavages in determiningelectoral behaviour. First, there would have been an increase in theproportions of people inclined to identify towards the Scottish endof the political spectrum than in the past and secondly that the SNP’sopponents would have dominated the ‘British not Scottish’ end ofthe spectrum. However, the picture is far less clear. There has not beena statistically significant increase in identification with the Scottishend of the spectrum since 2007. The SNP has increased its supportacross the entire spectrum but especially among the small group whosee themselves as exclusively British. Perhaps most counterintuitiveis the fact that the SNP won as much support as the Conservatives,traditionally seen as the quintessentially British party, among thosewho saw themselves as ‘British not Scottish’. Once more, as Table 2.4shows, the SNP picked up support in parts of the electorate previouslythought beyond its reach and could claim to be as attractive to Britishidentifiers as its competitors.
An alternative explanation for changing electoral behaviourfocused on changing values. Old class alignments based on materi-alism were thought to have been replaced by post-material values(Flanagan 1987; Inglehart 1999). In his early work on post-materialistpolitics, Inglehart had included study of ethno-regionalist parties andsuggested that some support for some of these parties was linked toa form of post-material identity politics (Inglehart 1977). However,support for the SNP has been materialist rather than post-materialistin the past (Bennie et al. 1997: 106–7). Given the backdrop of eco-nomic insecurity and imminent public spending cuts, we mightexpect that materialist concerns in some form would dominate the
10.1057/9781137023704 - More Scottish than British, Christopher Carman, Robert Johns and James Mitchell
Co
pyr
igh
t m
ater
ial f
rom
ww
w.p
alg
rave
con
nec
t.co
m -
lice
nse
d t
o U
niv
ersi
ty o
f S
ydn
ey -
Pal
gra
veC
on
nec
t -
2014
-08-
27
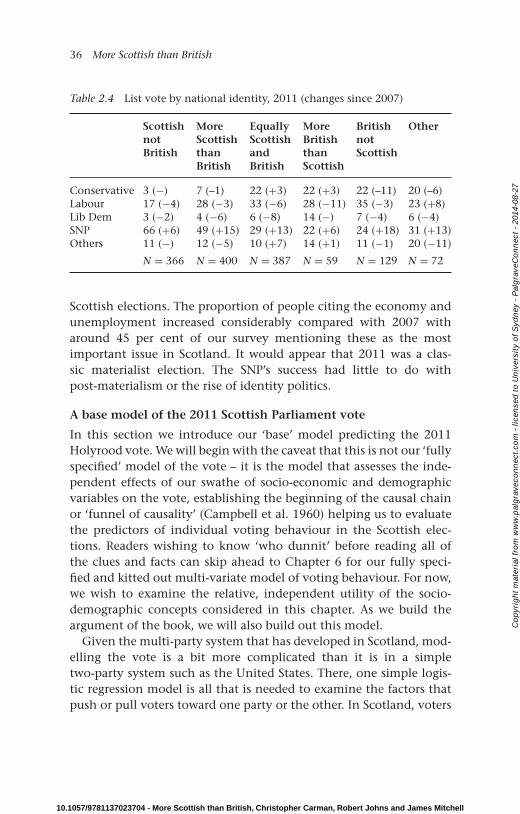
36 More Scottish than British
Table 2.4 List vote by national identity, 2011 (changes since 2007)
ScottishnotBritish
MoreScottishthanBritish
EquallyScottishandBritish
MoreBritishthanScottish
BritishnotScottish
Other
Conservative 3 (−) 7 (–1) 22 (+3) 22 (+3) 22 (–11) 20 (–6)Labour 17 (−4) 28 (−3) 33 (−6) 28 (−11) 35 (−3) 23 (+8)Lib Dem 3 (−2) 4 (−6) 6 (−8) 14 (−) 7 (−4) 6 (−4)SNP 66 (+6) 49 (+15) 29 (+13) 22 (+6) 24 (+18) 31 (+13)Others 11 (−) 12 (−5) 10 (+7) 14 (+1) 11 (−1) 20 (−11)
N = 366 N = 400 N = 387 N = 59 N = 129 N = 72
Scottish elections. The proportion of people citing the economy andunemployment increased considerably compared with 2007 witharound 45 per cent of our survey mentioning these as the mostimportant issue in Scotland. It would appear that 2011 was a clas-sic materialist election. The SNP’s success had little to do withpost-materialism or the rise of identity politics.
A base model of the 2011 Scottish Parliament vote
In this section we introduce our ‘base’ model predicting the 2011Holyrood vote. We will begin with the caveat that this is not our ‘fullyspecified’ model of the vote – it is the model that assesses the inde-pendent effects of our swathe of socio-economic and demographicvariables on the vote, establishing the beginning of the causal chainor ‘funnel of causality’ (Campbell et al. 1960) helping us to evaluatethe predictors of individual voting behaviour in the Scottish elec-tions. Readers wishing to know ‘who dunnit’ before reading all ofthe clues and facts can skip ahead to Chapter 6 for our fully speci-fied and kitted out multi-variate model of voting behaviour. For now,we wish to examine the relative, independent utility of the socio-demographic concepts considered in this chapter. As we build theargument of the book, we will also build out this model.
Given the multi-party system that has developed in Scotland, mod-elling the vote is a bit more complicated than it is in a simpletwo-party system such as the United States. There, one simple logis-tic regression model is all that is needed to examine the factors thatpush or pull voters toward one party or the other. In Scotland, voters
10.1057/9781137023704 - More Scottish than British, Christopher Carman, Robert Johns and James Mitchell
Co
pyr
igh
t m
ater
ial f
rom
ww
w.p
alg
rave
con
nec
t.co
m -
lice
nse
d t
o U
niv
ersi
ty o
f S
ydn
ey -
Pal
gra
veC
on
nec
t -
2014
-08-
27

Results and the Sources of Party Support 37
have a far greater number of parties to consider on election day – andthat means that the variable indicating which party a voter selectedis a ‘categorical’ variable, indicating a series of discrete choices thatdo not have an inherent ordering.3 Thus, the models that we runto predict the vote in this book are a bit more involved than thebasic logistic models that are often used to model vote choice (Johnset al. 2009). Here we decided to model as fully as possible the Scottishvote, and not limit ourselves to a series of independent compar-isons through logistic models comparing, say, the Labour vs. SNPvote. To include the other parties in the model, we use multinomiallogistic regression to model the 2011 vote. This technique, whilesounding complicated, is conceptually straightforward. Multinomiallogistic models use a series of independent predictor variables todetermine the odds, or probability of each possible outcome of thedependent variable – in this case vote choice. Thus, using these mod-els, we can begin to better understand what are the statistically (andsubstantively) significant traits, attitudes and dispositions of individ-uals that predict their vote choice. As we ‘build’ toward our finalvote choice model in Chapter 6, we will add to the list of predictorvariables, examining to see which attitudes and predispositions indi-viduals hold help us better understand voting behaviour in Scottishelections.
As we indicated with our caveat above, however, in this sectionwe have a more modest goal. Here we seek to examine the socio-economic and demographic factors that might help us predict anindividual’s vote choice. It is important to develop this basic under-standing using multi-variate modelling techniques, because it isthrough these statistical models that we begin to understand theextent to which individual traits or characteristics have an indepen-dent effect on vote choice once we control for the other relevant traitsand characteristics. For example, it might seem that, say, whethersomeone lives in an urban or rural area is a strong predictor of theway they vote when we look at the basic tabulations; however, oncewe control for other factors such as social class and trade unionmembership we find out that it is those variables that are actuallythe relevant considerations and that where the individual lives reallydoes not matter after all.
In the results we present below, in addition to the standard socio-demographic factors, such as age, sex, education, social class, religion,
10.1057/9781137023704 - More Scottish than British, Christopher Carman, Robert Johns and James Mitchell
Co
pyr
igh
t m
ater
ial f
rom
ww
w.p
alg
rave
con
nec
t.co
m -
lice
nse
d t
o U
niv
ersi
ty o
f S
ydn
ey -
Pal
gra
veC
on
nec
t -
2014
-08-
27

38 More Scottish than British
employment sector (private versus public), trade union membershipand urban (vs. rural) residence, we opted to also include news-paper readership (tabloid versus non-reader and broadsheet versusnon-reader).
In these initial models, we broke down each of the predictorvariables into a series of discrete indicator (dummy) variables toassist in understanding how the individual subgroups voted in 2011.As multinomial logistic regressions create a rather substantial vol-ume of statistical output, the full statistical models are presented inAppendix 2. In the chapters, we will adopt the convention of present-ing the changes in predicted probabilities derived from the models.These statistics tell us the extent to which a variable increases (ordecreases) the probability that a voter will have opted to vote for oneparty rather than the others.
Figure 2.1 presents the model predicting the regional, or list,vote based on our set of socio-demographic predictors. Before dis-cussing the more interesting findings, we should first offer a briefpoint on why we present models of the list vote (and not the con-stituency vote). In Scotland’s mixed-member proportional electoralsystem (discussed in greater detail below) voters, of course, cast twoballots – one for a ‘constituency MSP’ who is selected using the basicsingle-member district, plurality system and one for a party’s ‘list’ ofcandidates who are selected using a closed-list proportional system.All of the major parties contest all of the regional list contests, butin 2011 only the SNP and Labour contested all of the constituencycontests. This means that in many constituencies in Scotland, vot-ers simply did not have the option to vote for the Liberal Democratsor even the Conservatives. Thus the list contests provide us with asomewhat ‘cleaner’ assessment of what drives individuals to selectone party over the other as all of the major parties contested all of theregional list contests and all voters were then able to choose betweenthe parties.
Overall, the socio-demographic variable model leaves a good dealof room for improvement in our modelling exercises in the chaptersthat follow (Pseudo-R2 = 0.06). That is, the socio-demographic vari-ables alone are not terribly strong predictors of vote choice inScotland. A casual glance down the predicted probabilities shows thatfew of the variables help beyond a 5 per cent increase in the pre-dicted probability of selecting one of the parties. Further, given the
10.1057/9781137023704 - More Scottish than British, Christopher Carman, Robert Johns and James Mitchell
Co
pyr
igh
t m
ater
ial f
rom
ww
w.p
alg
rave
con
nec
t.co
m -
lice
nse
d t
o U
niv
ersi
ty o
f S
ydn
ey -
Pal
gra
veC
on
nec
t -
2014
-08-
27

Results and the Sources of Party Support 39
Conservatives Lib Dems SNP Labour
Age 18–34Age 55–81
MenClass A B
Class C2 D EEduc vocational
Educ standardEduc highersEduc degree
CatholicChurch of Scotland
Other protestant
Other regionsTabloid readers
Broadsheet readersUrban
Private sectorTrade union
–0.25 –0.2 –0.15 –0.1 –0.05
Age 18–34Age 55–81
MenClass A B
Class C2 D EEduc vocational
Educ standardEduc highersEduc degree
CatholicChurch of Scotland
Other protestantOther religions
Tabloid readersBroadsheet readers
UrbanPrivate sector
Trade union
0 0.05 0.1 0.15 0.2 0.25
Figure 2.1 Multinomial logistic regression of list vote on socio-demographicpredictors
somewhat anaemic results, it will not be surprising to most readersthat very few of the variables are statistically significant in predict-ing one party vote versus another. For example, the only variablethat improves our chances of predicting whether someone voted SNPvs. Labour (controlling for all of the other variables in the model)is whether or not the person is employed in the private sector (ver-sus the public sector) – being a private sector employee increased theprobability of voting SNP by about 6 per cent. This simple findingclearly supports the point made above – it is now very difficult toeasily distinguish between Labour and SNP voters using the classicsocio-demographic predictors. They just simply do not provide anystatistically significant leverage in improving our prediction abouthow someone is likely to vote.
Looking at the rest of the variables and comparisons, it should notbe a surprise to find that people classified as ‘Other Protestant’ – theselargely being Anglicans – are far more likely to vote Conservative (and
10.1057/9781137023704 - More Scottish than British, Christopher Carman, Robert Johns and James Mitchell
Co
pyr
igh
t m
ater
ial f
rom
ww
w.p
alg
rave
con
nec
t.co
m -
lice
nse
d t
o U
niv
ersi
ty o
f S
ydn
ey -
Pal
gra
veC
on
nec
t -
2014
-08-
27

40 More Scottish than British
much less likely to vote SNP). People whose profession places themin the ‘working class’ and trade union members are still significantlymore likely to vote Labour (and significantly less likely to vote Con-servative). And people with university degrees are more likely to voteLiberal Democrat while tabloid readers tend to shun them.
What if we include the other variable mentioned above, nationalidentity? How do responses to the ‘Moreno question’ stack up com-pared to social class and the other socio-demographic variables?In short, national identity dwarfs the other variables in the model.Controlling for the other variables in the model, people who identifyas ‘Scottish not British’ are about 60 per cent more likely to vote SNPcompared to people who identify as ‘British not Scottish’. On theother hand, the probability of people at the far end of the Britishside of the scale is about 30 per cent higher than people at the farScottish side.
With voters seeming to be increasingly comfortable with the ideaof shifting their vote between parties come election day, it is becom-ing an increasingly difficult task to identify the ‘typical’ voter basedon social and demographic traits alone. Indeed, as we have pointedout here, the only ‘social’ trait that distinguished between a Labourand SNP voter – once we put them all in the same model and con-trolled for the effects of the other social traits – was whether the voterwas employed in the private or public sector. Therefore, as we willshow in later chapters, we need to take into account other factors tomodel vote choice in the 2011 election.
Electoral system effects
Labour’s dominance of Scottish electoral politics in the late twen-tieth century was assisted by an electoral system that favoured theparty. The disproportionate effects of the system became increas-ingly evident with the erosion of Labour support. While Labour lostvotes, it held onto its seats. The system was highly disproportional(see Figure 2.2) though not on the scale that existed in Wales whereLabour’s advantage was even greater than it was in Scotland (Jonesand Scully 2008). This fed into debates on the nature of devolution inthe 1980s and 1990s when a consensus was reached among support-ers of a Scottish Parliament that an alternative, more proportionate,system ought to be introduced.
10.1057/9781137023704 - More Scottish than British, Christopher Carman, Robert Johns and James Mitchell
Co
pyr
igh
t m
ater
ial f
rom
ww
w.p
alg
rave
con
nec
t.co
m -
lice
nse
d t
o U
niv
ersi
ty o
f S
ydn
ey -
Pal
gra
veC
on
nec
t -
2014
-08-
27

Results and the Sources of Party Support 41
0
10
20
30
40
50
60
1945
1950
1951
1955
1959
1964
1966
1970
F19
74
O19
74
1979
1983
1987
1992
1997
2001
2005
2010
Deviation from proportionality Labour share of vote
Figure 2.2 Deviation from proportionality and Scottish Labour’s share of thevote, 1945–2010 UK elections
There are competing perspectives on the reasons that the MMPelectoral system was adopted for elections to the Scottish Parlia-ment. An idealist perspective was offered by Brown who argued thatdevolution’s architects wanted to
usher in a way of politics that is radically different from the ritualsof Westminster; more participative, more creative, less confronta-tional [ . . . ] a culture of openness which will enable the people tosee how decisions are being taken in their name, and why. TheParliament we propose is much more than a mere institutionaladjustment.
(Brown 2000: 542)
The more rationalist explanation acknowledges party interests. WhileLabour would lose out under MMP and have less chance to have anoverall majority, it needed to concede this in order to win cross-party
10.1057/9781137023704 - More Scottish than British, Christopher Carman, Robert Johns and James Mitchell
Co
pyr
igh
t m
ater
ial f
rom
ww
w.p
alg
rave
con
nec
t.co
m -
lice
nse
d t
o U
niv
ersi
ty o
f S
ydn
ey -
Pal
gra
veC
on
nec
t -
2014
-08-
27

42 More Scottish than British
Table 2.5 Constituency list share of the vote by party
SNP Labour Conservatives Liberaldemocrats
1999 1.7 5.0 0.2 1.72003 2.9 5.2 1.0 3.52007 1.9 3.0 2.7 4.52011 1.4 5.4 1.5 2.7
support for devolution but also created what was expected to be abreak on the SNP achieving an overall majority (Table 2.5).
The expectation had been that no party would be able to achieve anoverall majority was understandable. In Wales, where a less propor-tional form of MMP was introduced for devolution at the same time,Rhodri Morgan, Welsh First Minister in 2000–2009, explained thatthe Welsh system had been devised to ensure that Labour would winan overall majority in three out of four elections (Osmond 2005: 7).In fact, no party has yet succeeded in winning an overall majorityin Wales though Welsh Labour won 30 of the Assembly’s 60 seats in2011 when the SNP achieved an overall majority in the Scottish Par-liament. The SNP won 53 constituency seats in 2011 on 45.4 per centof the vote, the same number of constituencies Labour had won in1999 on 38.8 per cent of the vote showing that the simple plural-ity element of MMP in Scotland still favoured Labour. As Table 2.5shows, the SNP managed to retain a higher proportion of its con-stituency to list vote than Labour. Over four elections, the differencebetween Labour’s constituency and list share of the vote has beenbetween 3.0 and 5.4 per cent while the SNP’s has been between 1.4and 2.9 per cent. Labour’s 1999 list vote was 5 per cent less than itsefficient constituency vote resulting in it winning only 3 of the 56 listseats. By contrast, the SNP’s list vote in 2011 was only 1.4 per centless than its high constituency vote giving the SNP 16 list seats andan overall majority whereas Labour won only 3 list seats (Figure 2.3).
Scottish Labour’s advantage under the simple plurality electoralsystem used for Westminster elections has been increasingly com-promised under each successive MMP, Scottish Parliament election.The party’s share of the constituency vote has fallen at each electionunder devolution but its share of the list vote has offered little by wayof compensation. Put another way, for Labour to have maintained
10.1057/9781137023704 - More Scottish than British, Christopher Carman, Robert Johns and James Mitchell
Co
pyr
igh
t m
ater
ial f
rom
ww
w.p
alg
rave
con
nec
t.co
m -
lice
nse
d t
o U
niv
ersi
ty o
f S
ydn
ey -
Pal
gra
veC
on
nec
t -
2014
-08-
27

Results and the Sources of Party Support 43
Conservatives 1999
0 10 20 30 40 50 60 70
Conservatives 2003
Conservatives 2007
Conservatives 2011
Labour 1999
Labour 2003
Labour 2007
Labour 2011
Lib Dem 1999
Lib Dem 2003
Lib Dem 2007
Lib Dem 2011
SNP 1999
SNP 2003
SNP 2007
SNP 2011
Constituecy MSPs Regional MSPs
Figure 2.3 Number of constituency and region MSPs elected by party,1999–2011
(or advanced) its share of seats in the Scottish Parliament, it wouldhave needed to adopt a strategy seeking more list seats to offsetlosses in constituencies – a strategy it has been unable to implementsuccessfully. On the other hand, the SNP had long been the mainloser under the single-member constituency, simple plurality elec-toral system used for the general (UK) elections (though in Scotlandthe Conservatives have since overtaken them in this respect) but,as Figure 2.3 shows, have been the clear winners under Scotland’sMMP system. However, the electoral system alone does not explainthe SNP’s advance.
Flows of the vote
Aggregate data shows that the SNP’s support rose in 2011 comparedwith 2007, having fallen back in the UK general election in 2010.It also shows that the Liberal Democrat vote collapsed in 2011 whilevotes for the Conservatives and Labour declined between 2007 and
10.1057/9781137023704 - More Scottish than British, Christopher Carman, Robert Johns and James Mitchell
Co
pyr
igh
t m
ater
ial f
rom
ww
w.p
alg
rave
con
nec
t.co
m -
lice
nse
d t
o U
niv
ersi
ty o
f S
ydn
ey -
Pal
gra
veC
on
nec
t -
2014
-08-
27

44 More Scottish than British
2011. It would be tempting to assume that the SNP advance simplyinvolved former Liberal Democrat voters shifting en masse to theSNP in 2011. The SES data allows us to look below the surface ofthe aggregate data and observe flows of vote. This disproves pre-election predictions that Liberal Democrat decline would mainly beto Labour’s advantage but also some media commentators’ imme-diate post-election assertions that former Liberal Democrat votersmoved as an undifferentiated mass to the SNP. While the SNP was themain beneficiary of the Liberal Democrat decline, there were impor-tant flows of voters between the SNP and Labour over the four yearsbetween the 2007 and 2011 elections. There are two ways of ascer-taining where the increased support for the SNP came from: responsesto questions asking voters to recall how they had voted in previouselections and observing how the same voters, who are part of a long-term panel of respondents, voted over time. Our data allows us toconsider both.
What becomes clear from the panel data displayed in Table 2.6,which compares the same SES respondents’ the reported vote in 2007and 2011, is that the SNP was particularly successful in retainingthe support of those who had voted SNP in constituency contestsin 2007. The collapse of the Liberal Democrats resulted in the partyretaining only a third of those who had voted for it in 2007 withthe SNP winning a slightly higher proportion. But the SNP also wonthe support of one in five of those who had voted Labour in 2007 andone in ten of previous Conservative voters. Labour’s loss of support tothe SNP was partly offset by winning a similar proportion of formerConservative voters as had the SNP and 16 per cent of former LiberalDemocrat voters. A similar pattern occurred with the list vote but thepattern is slightly more complicated by the fact that the Greens andothers contested lists and not constituencies. The Greens succeededin winning over the same proportion of former Labour voters from2007 as the SNP, but once more the SNP was the main beneficiaryacross the board picking up far more support than it lost.
There had, of course, been a UK general election between the 2007and 2011 Scottish parliamentary elections at which Scottish Labourperformed particularly strongly. In 2010, Labour had increased itsshare of the vote by 2.5 percentage points to 42 per cent making itindisputably Scotland’s largest Westminster party with over twice asmany votes as the SNP, its nearest rival. Only managing to hold on to
10.1057/9781137023704 - More Scottish than British, Christopher Carman, Robert Johns and James Mitchell
Co
pyr
igh
t m
ater
ial f
rom
ww
w.p
alg
rave
con
nec
t.co
m -
lice
nse
d t
o U
niv
ersi
ty o
f S
ydn
ey -
Pal
gra
veC
on
nec
t -
2014
-08-
27

Results and the Sources of Party Support 45
Table 2.6 Vote in 2011 (constituency and region) by 2007 vote for the panelrespondents
Constituency Panel 2007 vote Other
2011vote
Did notvote
Con Lab LD SNP
Did notvote
41 2 10 7 3 2.94
Conservative 9 61 5 4 1 15Labour 16 10 61 16 6 9Lib Dem 4 7 4 33 3 9SNP 24 11 19 37 84 41Other 6 8 1 3 3 24
N 82 88 97 73 210 34
Region Panel 2007 vote Green Other
2011vote
Did notvote
Con Lab LD SNP
Did notvote
42 3 12 6 4 3 3
Conservative 11 71 3 11 4 0 8Labour 13 4 60 27 3 10 11Lib Dem 1 3 4 25 2 7 8SNP 21 9 10 21 79 20 27Green 2 1 11 6 2 47 8Other 10 9 1 6 8 13 36
N 82 76 74 53 194 75 30
a much smaller core of Nationalist voters, the SNP struggles to attainthe levels of support in elections to the Commons that it achievesin Holyrood elections and so it is little surprise to find that almostnine in ten of those who had voted SNP at the previous year’s UKelection voted for that party in 2011. The Scottish Liberal Democratshad become Scotland’s second party in share of the Commons votein 2005, outpolling the SNP by almost 5 per cent though the SNPpulled slightly ahead of the Liberal Democrats in 2010. In the 2011Scottish election, the SNP took more than one in five of those whohad voted for the Conservatives at the previous year’s UK generalelection, almost four in ten of those who had voted Liberal Democrat
10.1057/9781137023704 - More Scottish than British, Christopher Carman, Robert Johns and James Mitchell
Co
pyr
igh
t m
ater
ial f
rom
ww
w.p
alg
rave
con
nec
t.co
m -
lice
nse
d t
o U
niv
ersi
ty o
f S
ydn
ey -
Pal
gra
veC
on
nec
t -
2014
-08-
27

46 More Scottish than British
Table 2.7 Constituency vote in 2011 by recalled 2010 general election vote
Constituency Recalled 2010general election vote
Other
2011 vote Did notvote
Con Lab LD SNP
Did not vote 70 6 13 12 6 26Conservative 2 59 1 2 1 7Labour 11 6 59 17 2 10Lib Dem 1 5 2 28 0 7SNP 14 21 25 38 88 30Other 2 3 1 4 2 19
N 149 241 502 272 425 174
and one in four of those who had voted Labour (see Table 2.7).Though the UK general election was held only a year earlier, vot-ers were even more inclined to alter their behaviour between thisand the 2011 Scottish election than over the longer period betweenthe Holyrood elections. In Chapter 5 we return to this issue with anexamination of how voters’ partisan allegiances shift as they comparethe UK and Scottish political systems.
Conclusion
Using socio-demographic variables alone, it is difficult to paint apicture of typical SNP voters in 2011 that distinguishes them fromLabour voters. The SNP has become a catch-all party (Kirchheimer1966). For a party that styles itself ‘National’, this might seem easy asthis suggests an appeal to all socio-demographic groups and a rejec-tion of a special appeal to sectional groups. Yet the SNP’s ‘National’refers to Scotland, not the state as a whole, so this might be expectedto have limited its appeal, as indeed had been the case in the past.But this was not the case in 2011. What emerges from this chapter isthe clear finding that the SNP’s appeal across all social groups, espe-cially among groups where it had previously done relatively poorly.Recall that the rising tide of support for the SNP in 2011 raised theirsupport across all socio-demographic groups.
10.1057/9781137023704 - More Scottish than British, Christopher Carman, Robert Johns and James Mitchell
Co
pyr
igh
t m
ater
ial f
rom
ww
w.p
alg
rave
con
nec
t.co
m -
lice
nse
d t
o U
niv
ersi
ty o
f S
ydn
ey -
Pal
gra
veC
on
nec
t -
2014
-08-
27

Results and the Sources of Party Support 47
There is also little doubt that the electoral system has worked tothe SNP’s advantage (or the SNP has worked the electoral system toits advantage) but even this does not explain why the SNP succeededin winning an overall majority. This comes down to the simple expla-nation: the SNP succeeded not only in doing well on the simpleplurality element but succeeded in winning a similarly high propor-tion of list voters. In sum, the SNP’s ability to retain its support – from2007 to 2011 and from constituency vote to list vote – combined withwinning the lion’s share of defecting former Liberal Democrat votersprovided it with an overall majority. This may mean that there is notypical SNP voter but it also indicates the emergence of a very differ-ent party system from that of the recent past. While we have outlinedwho voted for the main parties in this chapter, we will consider whythey did so in subsequent chapters.
10.1057/9781137023704 - More Scottish than British, Christopher Carman, Robert Johns and James Mitchell
Co
pyr
igh
t m
ater
ial f
rom
ww
w.p
alg
rave
con
nec
t.co
m -
lice
nse
d t
o U
niv
ersi
ty o
f S
ydn
ey -
Pal
gra
veC
on
nec
t -
2014
-08-
27

3Parties and Leaders
Although the Scottish Parliament has often been presented as aform of ‘new politics’, it is essentially a Westminster-style Par-liament (Mitchell 2010b). Its electoral system is its most obvi-ous distinguishing feature but in terms of the classic functions ofparliaments (Copeland and Patterson 1994: 154), Holyrood is partof the Westminster family. This is evident in its linkage function, therelationship between the electorate and the government – in choos-ing the legislative branch, Scottish voters also (indirectly) choose theexecutive branch.
Voters’ attitudes to the contending parties are therefore crucial.Indeed, while all of the chapters in this book are, in some way, shapeor form, concerned with voters’ attitudes to parties – to the socialgroups that they defend, to their policies and broader ideologies,to their records in office, to their relationships with Westminster –the particular focus of this chapter is on voters’ impressions of theparties themselves. Do voters feel allegiance to one of the compet-ing parties and, if so, does that loyalty translate into a vote for thatparty? Do they at least like some parties more than other parties, andwhat does the pattern of likes and dislikes tell us about the nature ofparty competition in Scotland? What images do the parties projectto the electorate? Which – if any (amid general public scepticismabout politics) – are seen as trustworthy or positive, or in touch withordinary Scots?
Voters’ impressions of a party are often affected by their impres-sions of its leader. Butler and Stokes highlighted the importance ofparty leaders in British elections (Butler and Stokes 1974: ch.17).
48
10.1057/9781137023704 - More Scottish than British, Christopher Carman, Robert Johns and James Mitchell
Co
pyr
igh
t m
ater
ial f
rom
ww
w.p
alg
rave
con
nec
t.co
m -
lice
nse
d t
o U
niv
ersi
ty o
f S
ydn
ey -
Pal
gra
veC
on
nec
t -
2014
-08-
27

Parties and Leaders 49
This is particularly relevant in a system of government in which theexecutive is chosen from within the legislature and electoral compe-tition is often presented as a competition to become chief executivebetween different party leaders. It has become customary within theWestminster system for the leader of the largest party to form thegovernment. In strict constitutional terms, as is the case in practicein many multi-party polities in which no single party dominates,this need not be the case. Indeed, Gordon Brown as leader of theLabour Party sought to hang on to office as Prime Minister despitehis party coming second to the Conservatives after the 2010 UK gen-eral election. Nonetheless, the general expectation as expressed inmedia commentary was that the leader of the largest party wouldform the government. The Scottish Parliament’s electoral system cre-ated opportunities for a break with the British tradition; however,to date it has proved no less British than Westminster in that theleader of the largest party is assumed to have the right to becomeFirst Minister.
Holyrood does break with Westminster’s tradition through an elec-toral system (described in Chapter 1) that dramatically increases thelikelihood that the largest party in the parliament will not securea majority of seats, resulting in coalition and even minority gov-ernments. Under successive Labour-Liberal Democrat coalition gov-ernments between 1999 and 2007, Labour, the larger party in bothsessions, held the office of First Minister with the Liberal Democratshaving the post of Deputy First Minister as the junior partner. From2007 to 2011, Alex Salmond’s position within his party as First Min-ister leading a minority government (Mitchell et al. 2012: 46–49),combined with media coverage that portrayed the SNP leader as pres-idential, may have enhanced the importance of ‘leadership’ in the2011 election.
A leader perceived to be capable and honest helps convey an imageof his or her party sharing those characteristics. Strictly speaking,the electoral choice is between constituency candidates or party lists;however, given their roles in electioneering and as potential chiefexecutives, in modern politics party leaders have become the focusof choice themselves. This may be actively encouraged by the parties:in 2007 and again in 2011, the SNP appeared on the list ballot paperin each region as ‘SCOTTISH NATIONAL PARTY Alex Salmond forFirst Minister’. Each of the main parties arrange media events with
10.1057/9781137023704 - More Scottish than British, Christopher Carman, Robert Johns and James Mitchell
Co
pyr
igh
t m
ater
ial f
rom
ww
w.p
alg
rave
con
nec
t.co
m -
lice
nse
d t
o U
niv
ersi
ty o
f S
ydn
ey -
Pal
gra
veC
on
nec
t -
2014
-08-
27

50 More Scottish than British
‘photo-opportunities’, alerting the media to where the leader willbe each day of the campaign. This can work against a party leader,as in the case of Iain Gray’s encounter with anti-public spendingcuts protesters early in the campaign. Television, however, has longbeen the main campaign battleground and has equally long beenaccused of personalizing – or ‘presidentialising’ – elections (Foley1993; Mughan 2000). This tendency is exacerbated by the introduc-tion of leader debates. Of course, leadership debates were a featureof Scottish Parliamentary elections prior to the Westminster leaders’debates in 2010. Televised Scottish debates were standard in by-elections in Scotland prior to devolution with the format adopted andthen largely replicated for the leadership contests since devolution.Nonetheless, despite this focus on the party leaders, there remainsdisagreement among students of politics of the importance of lead-ers in electoral contests. Research on British general elections andelections in other European polities concluded that there was littleevidence to corroborate widespread media and public perceptionsthat the personalities of leaders influenced elections (Bartle andCrewe 2002; Curtice and Holmberg 2005).
Leaders can be victims of their parties as well as vice versa. A pop-ular leader will not drag a deeply unpopular party to victory; in anycase, it is hard to be a popular leader of an unpopular party becausethe negative image tends to rub off. There are complex reciprocalrelations between the public images of parties and their leaders, withthe two often inextricably entangled in voters’ minds (Butt 2006).What is clear is that leaders have the potential to win votes both asindividuals and as shapers of their party’s image. We need thereforeto examine voters’ evaluations of both leaders and parties, and it alsomakes sense to do so in the same chapter.
Party identification
Party identification is the starting point for any analysis of voters’attitudes towards parties. At its most basic, party identification, orpartisanship, reflects the fact that voters do not approach the partiesafresh at each election. Most people have inclinations, sometimesof very long standing, towards a certain party and often againstothers. Understanding electoral behaviour in 2011 requires that wetake account of the various ways in which voters were predisposed
10.1057/9781137023704 - More Scottish than British, Christopher Carman, Robert Johns and James Mitchell
Co
pyr
igh
t m
ater
ial f
rom
ww
w.p
alg
rave
con
nec
t.co
m -
lice
nse
d t
o U
niv
ersi
ty o
f S
ydn
ey -
Pal
gra
veC
on
nec
t -
2014
-08-
27

Parties and Leaders 51
towards or against different choices. This matters not only becauseparty identifiers are highly likely to vote for the party to which theyhave an enduring attachment. Partisanship also acts as a ‘percep-tual screen’ through which identifiers view politics (Campbell et al.1960; Zaller 1992). For example, those who support a party are morelikely to view that party’s leader favourably, more likely to take a dimview of its opponents’ economic competence and less likely to sup-port a policy proposed by another party. Thus, party identificationcan have both a direct effect and an indirect effect on vote choice.Even if identifiers do not choose their party simply out of habit, theyare likely to do so because their interpretation of political events,issues and personalities steer them in that direction. The second pointmeans that partisanship remains an important consideration in laterchapters of this book. For now, we simply assess the partisan profileof the Scottish electorate going into the 2011 contest.
Before looking at the survey evidence, we recall the disagreementon the nature and origins of party identification. The ‘traditional’ orMichigan interpretation (so called because it was developed by AngusCampbell and his colleagues from the University of Michigan), sug-gested that partisanship is an emotional bond with a particular party,not unlike religious, national or sporting identities (Campbell et al.1960; Green et al. 2002). Like these, it is typically acquired early fromparents and tends to endure, and often strengthen, over a voter’s life-time (Butler and Stokes 1974; Tilley 2003). This account goes a longway to explain why quite a large fraction of the electorate turns outand votes for the same party in election after election. It can alsoexplain the inter-generational transmission of partisanship. Somefamilies have supported the same party for many decades, which, inturn, explains why the menu of parties available to voters can changelittle over long periods. A different account of partisanship was pre-sented by Fiorina (1981) and has been adopted in the British contextby Clarke et al. (2004, ch. 6; see also Clarke and McCutcheon 2009).On the ‘revisionist’ or Fiorina account, party identification is not seenas an emotional tie or loyalty to a particular party but as little morethan attitudes towards the political parties much the same as peo-ple view party leaders, television shows and work colleagues. Theseattitudes represent ‘running tallies’ of their assessments, whether pos-itive or negative, of the parties over time. Such assessments may bebased on the usual wide range of factors – leaders, policies, priorities,
10.1057/9781137023704 - More Scottish than British, Christopher Carman, Robert Johns and James Mitchell
Co
pyr
igh
t m
ater
ial f
rom
ww
w.p
alg
rave
con
nec
t.co
m -
lice
nse
d t
o U
niv
ersi
ty o
f S
ydn
ey -
Pal
gra
veC
on
nec
t -
2014
-08-
27

52 More Scottish than British
record in office, and so on – and the detailed information is oftenforgotten. But the overall tallies remain and, for Fiorina, they repre-sent party identification: that is, voters’ predispositions to vote for oragainst a party at any given election.
This revisionist approach has two major explanatory strengths.First, survey evidence has long documented a marked fall in the pro-portion of voters reporting the kind of strong party identificationdescribed by the Michigan model. The reasons are in some disputebut the trend, known as partisan de-alignment, is unmistakable invirtually all Western democracies (Dalton and Wattenberg 2000). Theproportion of voters describing themselves as ‘very strong’ or ‘fairlystrong’ identifiers has declined from around three-quarters to aroundhalf of the Scottish electorate (Johns et al. 2010: 41–44). That leaves ahalf of the electorate whose partisan predispositions are better cap-tured by Fiorina’s dynamic attitudinal model than by the kind ofenduring emotional identity envisaged in the Michigan model. Thesecond advantage of the Fiorina model is that it explains why, asrevealed by panel surveys, party identification at the individual levelis less stable than is consistent with a lifetime-loyalty model.
Any debate about which account of partisanship is ‘correct’ tendsto obscure what would otherwise be an obvious point: both modelsmay be correct but for different parts of the electorate. Recent anal-yses suggest instead a ‘mover-stayer’ model, whereby some partisansmaintain their allegiances but plenty of others withdraw their sup-port or even transfer it to a different party. These switches can beexplained by exactly those factors – events, performance, changesof leadership and so on – that Fiorina identified as driving vot-ers’ running tallies. The reason why the distinction matters here isbecause of the changing patterns of party competition in Scotland.Over 90 per cent of voters supported either Labour or the Conserva-tives in every election between 1950 and 1959, and between 80 and90 per cent from 1964 to 1970. These parties had deep social roots,identification with which was passed down through the generations,while few voters supported the Liberals and only tiny fractions ofthe Scottish electorate declared any attachment to the then fringeSNP. Since 1970, however, the combined Labour and Conservativevote has not exceeded 70 per cent except in 1979 when togetherthey won 72.9 per cent of the vote. De-alignment has weakenedbut not eradicated the process of inter-generational transmission
10.1057/9781137023704 - More Scottish than British, Christopher Carman, Robert Johns and James Mitchell
Co
pyr
igh
t m
ater
ial f
rom
ww
w.p
alg
rave
con
nec
t.co
m -
lice
nse
d t
o U
niv
ersi
ty o
f S
ydn
ey -
Pal
gra
veC
on
nec
t -
2014
-08-
27

Parties and Leaders 53
of partisanship, and so the long-established Labour and Conserva-tive parties can still call upon at least some traditional loyalists –particularly among older voters. The SNP’s support may also reflecta mix of ‘movers’ and ‘stayers’. On the one hand, SNP support mayreflect Fiorina-style identification: that is, voters are predisposed tothe party because their accumulated experience of its policies, image,leadership and record; however, the SNP too may have developed aninter-generational Michigan type of party identifiers since its electoralbreakthrough in the late 1960s.
Given that a large and growing proportion of the Scottish elec-torate has no strong partisan allegiance, we use the familiar two-partquestion to measure party identification. In the pre-election survey,respondents were first asked whether they thought of themselvesas a supporter of any one political party, to which 56 per cent ofrespondents answered ‘yes’, up from 50 per cent in 2007. Therewas also an increase in the proportion of ‘leaners’, respondentswho answered ‘no’ to the question above but ‘yes’ to whether theythought of themselves as a ‘little closer to one political party thanto the others’. In 2011, leaners comprised 28 per cent of the Scottishelectorate, leaving just 16 per cent who answered ‘no’ to both ques-tions, disclaiming either identification or leaning. The correspondingpercentages in 2007 were 24 per cent and 26 per cent, so leaners havegone from being outnumbered by non-identifiers to clearly outnum-bering them. These changes are statistically significant and interruptwhat had been assumed to be an inexorable trend of de-alignment.Something about the 2011 election appears to have ‘activated’ somepartisan leanings that had lain dormant for a while, as we will discussbelow.
Respondents answering ‘yes’ to either of the questions above arethen asked to name the party. The distribution of identification andleaning among the parties, in both 2011 and 2007, is shown inTable 3.1. Looking first at the identifiers, that is those declaring sup-port for one of the parties, the proportion of those identifying asLabour and SNP are almost a mirror image of these parties’ share ofthe vote – but with the Labour and the SNP percentages reversed.So the 2011 outcome was anything but a simple reflection of theparties’ core strengths in the electorate. In fact, as predicted earlier,Labour enjoys a large advantage over the Nationalists in terms of ‘tra-ditional’ partisanship. This advantage was wider in 2011 than 2007,
10.1057/9781137023704 - More Scottish than British, Christopher Carman, Robert Johns and James Mitchell
Co
pyr
igh
t m
ater
ial f
rom
ww
w.p
alg
rave
con
nec
t.co
m -
lice
nse
d t
o U
niv
ersi
ty o
f S
ydn
ey -
Pal
gra
veC
on
nec
t -
2014
-08-
27

54 More Scottish than British
Table 3.1 Partisanship (identification, leaning and combined) in 2007 and2011
Identifiers Leaners Combined
2011 2007 2011 2007 2011 2007
Conservative 16 16 14 17 12 12Labour 46 40 33 30 35 27Lib Dem 8 10 8 15 7 9SNP 28 30 34 27 25 21Others 2 5 11 11 4 5None – – – – 16 26
N 1,141 874 574 414 2,046 1,774
Source: Pre-election survey.
again at odds with the election results. The explanation may lie inthe changing political context, notably the change of government atWestminster. As discussed in Chapter 1, Labour performed well in the2010 general election in Scotland and in subsequent opinion polls.The return of a Conservative-led government at Westminster mayhave refreshed Labour sympathies that had faded in recent years.
That may explain Labour’s strengthened advantage in terms of‘core vote’. It leaves unanswered the question of why this did nottranslate into victory but heavy defeat in the Scottish Parliamentelection. Two points about the role of party identification in 2011 arenotable. The first is a reminder that there is more to partisanship thanthe Michigan-style loyalties that are thought to be measured by theparty identification question. We simply cannot equate ‘identifiers’with Michigan partisans and ‘leaners’ with Fiorina partisans, thoughconceptually a partisan leaning, that is, not explicitly identifyingwith a party but inclining towards one, would seem to be better cap-tured by the Fiorina explanation of voting behaviour. It is notablethat the Labour-SNP gap closed completely among the leaners in2011. The SNP may have fewer loyalists but has as many sympa-thizers as Labour and its share of leaners grew appreciably comparedwith 2007.
Nonetheless, as the final column, combining identifiers andleaners, in Table 3.1 shows, Labour went into the 2011 election with asignificant advantage over the SNP, and an even wider margin over all
10.1057/9781137023704 - More Scottish than British, Christopher Carman, Robert Johns and James Mitchell
Co
pyr
igh
t m
ater
ial f
rom
ww
w.p
alg
rave
con
nec
t.co
m -
lice
nse
d t
o U
niv
ersi
ty o
f S
ydn
ey -
Pal
gra
veC
on
nec
t -
2014
-08-
27
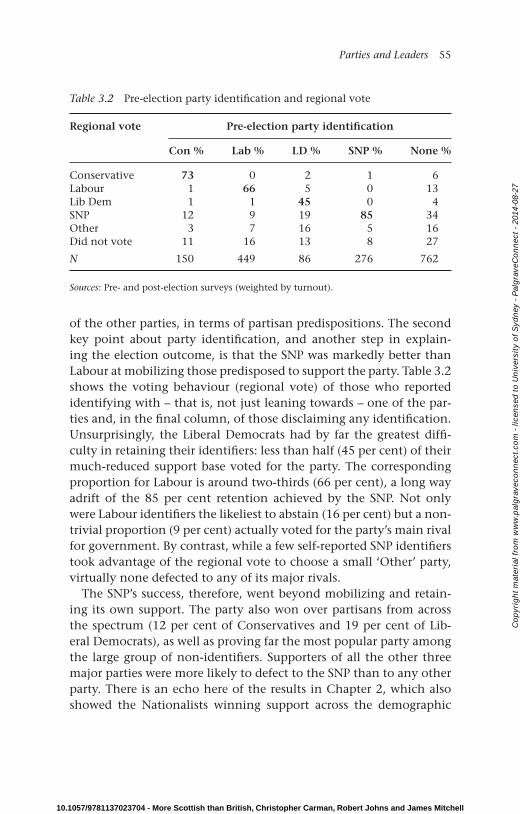
Parties and Leaders 55
Table 3.2 Pre-election party identification and regional vote
Regional vote Pre-election party identification
Con % Lab % LD % SNP % None %
Conservative 73 0 2 1 6Labour 1 66 5 0 13Lib Dem 1 1 45 0 4SNP 12 9 19 85 34Other 3 7 16 5 16Did not vote 11 16 13 8 27
N 150 449 86 276 762
Sources: Pre- and post-election surveys (weighted by turnout).
of the other parties, in terms of partisan predispositions. The secondkey point about party identification, and another step in explain-ing the election outcome, is that the SNP was markedly better thanLabour at mobilizing those predisposed to support the party. Table 3.2shows the voting behaviour (regional vote) of those who reportedidentifying with – that is, not just leaning towards – one of the par-ties and, in the final column, of those disclaiming any identification.Unsurprisingly, the Liberal Democrats had by far the greatest diffi-culty in retaining their identifiers: less than half (45 per cent) of theirmuch-reduced support base voted for the party. The correspondingproportion for Labour is around two-thirds (66 per cent), a long wayadrift of the 85 per cent retention achieved by the SNP. Not onlywere Labour identifiers the likeliest to abstain (16 per cent) but a non-trivial proportion (9 per cent) actually voted for the party’s main rivalfor government. By contrast, while a few self-reported SNP identifierstook advantage of the regional vote to choose a small ‘Other’ party,virtually none defected to any of its major rivals.
The SNP’s success, therefore, went beyond mobilizing and retain-ing its own support. The party also won over partisans from acrossthe spectrum (12 per cent of Conservatives and 19 per cent of Lib-eral Democrats), as well as proving far the most popular party amongthe large group of non-identifiers. Supporters of all the other threemajor parties were more likely to defect to the SNP than to any otherparty. There is an echo here of the results in Chapter 2, which alsoshowed the Nationalists winning support across the demographic
10.1057/9781137023704 - More Scottish than British, Christopher Carman, Robert Johns and James Mitchell
Co
pyr
igh
t m
ater
ial f
rom
ww
w.p
alg
rave
con
nec
t.co
m -
lice
nse
d t
o U
niv
ersi
ty o
f S
ydn
ey -
Pal
gra
veC
on
nec
t -
2014
-08-
27

56 More Scottish than British
board rather than from some particular part of the community. Thesame was true in 2007 and indeed these results closely parallel thosefrom an equivalent analysis at that election (Johns et al. 2010: 43).The SNP maintained its progress while Labour continued to struggle.
There are two reasons for the disparity between Labour and the SNPin the ease with which they converted predispositions into votes. Thefirst is simple. Electoral behaviour is a function both of long-term loy-alties and short-term factors and, as is clear from comparing Table 3.1with the election results, the SNP had a considerable advantage interms of short-term factors. As the Fiorina model highlights, partyidentifiers may be resistant, but are not impervious, to those short-term factors. The second point is less obvious and more speculative.It is exemplified by our suggestion that developments at the UK levelexplain the increase or ‘reactivation’ of Labour identification. Theparty identification question begins with ‘Generally speaking [ . . . ]’and is expressly intended to measure a general and enduring iden-tity. There is no contextual cue in the question and no mention ofthe upcoming election. However, survey respondents answer ques-tions with the considerations that are uppermost in their mind atthe time, and the multi-level nature of the Scottish polity means thatthese considerations could derive from different contexts. In particu-lar, it is conceivable that those reporting a Labour attachment tend tohave Westminster politics in mind, while SNP identification is morecommon among those thinking about the Scottish context in whichthat party is relatively strong and, more recently, also in power. If thatis the case, then it is not hard to see why Labour identifiers were moreprone to abstain or to defect in 2011, because their identification isrooted in a different electoral sphere. Put another way, Labour iden-tities were not activated by the 2011 election as they had been theprevious year. This is a speculative argument because to date therehas been no test of the hypothesis that citizens’ party identificationsmight be specific to a level of government. However, in Chapter 5,which is all about placing the 2011 election in its multi-level context,we provide just such a test.
For now, we recap the discussion so far. Labour went into the 2011election, as it has in all previous Scottish Parliament contests, with aclear advantage in terms of partisan attachments. Yet the party wasunable to capitalize on this historical legacy. As far as Labour and,especially, the Liberal Democrats were concerned, party identification
10.1057/9781137023704 - More Scottish than British, Christopher Carman, Robert Johns and James Mitchell
Co
pyr
igh
t m
ater
ial f
rom
ww
w.p
alg
rave
con
nec
t.co
m -
lice
nse
d t
o U
niv
ersi
ty o
f S
ydn
ey -
Pal
gra
veC
on
nec
t -
2014
-08-
27

Parties and Leaders 57
did not mean party loyalty: substantial portions of what should havebeen the parties’ ‘core vote’ chose another party or stayed at home.Although the decline in party identification seems to have beenarrested, around half of the voters still only lean towards a party (andas often towards the SNP as towards Labour) or are, in American elec-toral parlance, ‘independents’. For the parties, an advantage amonglong-term partisans needs to be accompanied by an appeal to ‘float-ing’ voters. All the signs so far are that the SNP’s short-term appeal faroutstripped that of Labour and the other contenders in 2011. In thenext section we confirm the point.
Partisan attitudes
According to Fiorina (1981), voters maintain and update ‘runningtally’ attitudes towards the competing parties, and electoral choice isprincipally a reflection of those attitudes. Put simply, voters opt forthe party with the highest tally. This model was developed in theresolutely two-party US system but there is no reason why the sameshould not apply in Scotland’s multi-party system. Here, then, welook at voters’ attitudes to the parties via a simple measure, a 0–10scale running from ‘strongly dislike’ to ‘strongly like’, that capturesthese running tallies. These like-dislike ratings are, of course, influ-enced by partisanship – the strongest Michigan-style identifiers willlike their party a great deal and the others not at all – but they alsoreflect a range of shorter-term evaluations, recent and not so recent,although probably weighted towards the former. They thus give theclearest idea of the ‘state of the parties’ going in to the 2011 election.
The first column of Table 3.3 shows the mean rating of each partyamong all respondents in the pre-election survey (excluding thosewho said ‘don’t know’ – usually small numbers except in the caseof the less familiar Green Party). The 2007 ratings are provided inthe next column for comparison. One notable contrast between thetwo elections is that the mean ratings are more dispersed in 2011.In 2007, three of the four major parties were clustered between 4.4and 4.8. Four years later, the Liberal Democrats’ popularity had fallenalmost to the depths long plumbed in Scottish public opinion by theConservatives while, perhaps less predictably, the ratings of the twoleading parties had increased significantly. This apparently positivenews for Labour needs to be tempered by two points. First, echoing
10.1057/9781137023704 - More Scottish than British, Christopher Carman, Robert Johns and James Mitchell
Co
pyr
igh
t m
ater
ial f
rom
ww
w.p
alg
rave
con
nec
t.co
m -
lice
nse
d t
o U
niv
ersi
ty o
f S
ydn
ey -
Pal
gra
veC
on
nec
t -
2014
-08-
27

58 More Scottish than British
Table 3.3 Mean party ratings on 0–10 scale: (i) all respondents (ii) by partyidentification
Party rated Allrespondents
2011 by partyidentification
2011 2007 Con Lab LD SNP None
Conservative 3.0 3.2 8.6 1.3 3.7 2.0 3.1Labour 5.1 4.4 1.5 8.5 3.9 3.6 4.7Lib Dem 3.4 4.7 5.2 2.4 7.9 2.6 3.6SNP 5.9 4.8 3.5 4.7 4.9 9.3 5.9Green 4.7 4.5 3.3 5.2 5.2 5.0 4.6N (min.) 1783 1713 161 464 89 304 743
Source: Pre-election survey.
an earlier point, if this boost in popularity was driven more by theWestminster concerns that delivered the party’s strong showing inthe 2010 UK general election, it is at least questionable whether itwould also pay off in a Holyrood context. Secondly, the SNP’s ratingrose further, thus doubling its advantage over Labour. A mean ratingof 5.9, comfortably above the middle point of the scale, is impressivefor a party without a large base of Michigan-style identifiers that canbe relied on for very positive ratings, and doubly so in a multi-partycontext where each party generally has more opponents than sup-porters. The SNP clearly received at least grudging praise from someof those who did not vote for it.
This point is confirmed by the right-hand panel of Table 3.3, whichshows the mean party ratings among groups of party (and non-)identifiers. The high scores on the central diagonal reflect the pointthat identifiers tend to like their party a lot more than the others, butthere are some notable differences even here. Even Liberal Democratidentifiers were relatively unimpressed by their party in 2011, whilethe SNP’s supporters were extremely satisfied. This helps to explainthe differentials in mobilization and retention shown in Table 3.2,as does the relative popularity of the SNP across the partisan board.The Nationalists’ ratings resemble those of the Greens, which is sig-nificant given that the latter tend to elicit widespread sympathy andto be many voters’ second choice. The Conservatives’ tolerance ofthe SNP is striking given their staunch opposition to independence,
10.1057/9781137023704 - More Scottish than British, Christopher Carman, Robert Johns and James Mitchell
Co
pyr
igh
t m
ater
ial f
rom
ww
w.p
alg
rave
con
nec
t.co
m -
lice
nse
d t
o U
niv
ersi
ty o
f S
ydn
ey -
Pal
gra
veC
on
nec
t -
2014
-08-
27

Parties and Leaders 59
but perhaps most notable is that Labour identifiers gave the SNPalmost a midpoint average rating, despite the fact that the two partieshave been the leading rivals of Scottish politics for several years now.Most importantly of all, the SNP’s rating amongst non-identifiers –the key electoral market – was as high as among the electorate as awhole, while Labour’s popularity in this group dipped below the mid-point. Table 3.2 has already shown that the SNP’s popularity advan-tage over Labour among non-partisans went on to deliver electoralbenefits.
In 2007, the close contest between the two leading parties could beseen as the cancelling out of two differences: while Labour enjoyeda broader electoral base in terms of long-term attachments, the SNPhad a lead in terms of short-term or ‘running tally’ attitudes. Fouryears later, the pattern is similar but with two key differences thathelp to explain why the SNP performed so strongly. Labour’s advan-tage on party identification yielded only limited electoral benefits,perhaps because the renewed loyalty was to the new opposition atWestminster more than to the Scottish party competing in 2011.Meanwhile, the SNP had stretched its popularity advantage, espe-cially among the key group of non-aligned or ‘floating’ voters, andmore generally seems to have given quite a positive impression acrossthe electorate. In the next section, on party images, we explore thesources of this positive impression and also look at why the otherparties proved less attractive.
Party image
For Butler and Rose (1960: 17), ‘a party image is nothing more thana party as it appears to the public, the picture left by its surface char-acteristics’. This definition is suitably broad because the content ofthese mental pictures may vary a good deal across voters, partiesand elections. Nonetheless, impressions of the parties are often dom-inated by one or two associations that may persist over time andbecome widely shared within the electorate. These associations maybe positive or negative but the latter tend to receive most attention.Parties in the electoral doldrums – Labour at UK level during the1980s, and the Conservatives in Scotland since the Thatcher era –often conclude that a tarnished image or ‘brand’ is at the root oftheir problems (see, e.g., Quinn 2008).
10.1057/9781137023704 - More Scottish than British, Christopher Carman, Robert Johns and James Mitchell
Co
pyr
igh
t m
ater
ial f
rom
ww
w.p
alg
rave
con
nec
t.co
m -
lice
nse
d t
o U
niv
ersi
ty o
f S
ydn
ey -
Pal
gra
veC
on
nec
t -
2014
-08-
27

60 More Scottish than British
In Chapter 2, we looked at the social class images of the partiesand their associations with groups more generally. Another facet ofparty image might be a prominent stance on a core issue. If vot-ers were to play a word-association game, the chances are that thename ‘SNP’ would be followed by the word ‘independence’. Theproblem with both class and issue images is that they are inevitablyexclusionary – they are the basis not only for attracting support-ers but also for repelling those from a different social backgroundor taking the opposite view on that issue. Hence the major parties,notably ‘New Labour’, have long downplayed social divisions andsought instead to appeal to all classes – that is, to be ‘catch-all’ par-ties (Kirchheimer 1966). This is a relatively recent phenomenon inScottish politics. A generation ago, the SNP sought to claim Labour’straditional reputation as the party that best represented the working-class (Bennie et al. 1997). The SNP has sought to rebalance its imageaway from simply being a party committed to independence toone that places greater emphasis on a broader appeal and to beingthe party that represents Scottish interests of concern to the wholeelectorate, regardless of constitutional preferences.
What these examples show is the importance of what might becalled the ‘valence’ aspects of party image. As discussed in more detailin the next chapter, valence objectives are those shared by the entireelectorate (see Stokes 1963, 1992). Economic prosperity is a classicexample and, again as discussed in Chapter 4, economic competenceis a key valence aspect of party image. Yet the valence dimensions ofimage are often more general, as described by Butler and Stokes:
[s]ome qualities of party image, such as strength or modernity orreliability, are so broad that they could be linked to almost any setof government outputs. A party may be seen as trustworthy or asbound to make a mess of things without any necessary referenceto the area in which it can be trusted or in which it is bound tomake a mess. Indeed, some image qualities have much more to dowith ‘intrinsic’ values of party, which are not related to outputs ofgovernment at all [ . . . ]
(Butler and Stokes 1974)
These are ‘valence’ aspects of party image because, just as no voterwants economic decline, no voter wants a governing party that is
10.1057/9781137023704 - More Scottish than British, Christopher Carman, Robert Johns and James Mitchell
Co
pyr
igh
t m
ater
ial f
rom
ww
w.p
alg
rave
con
nec
t.co
m -
lice
nse
d t
o U
niv
ersi
ty o
f S
ydn
ey -
Pal
gra
veC
on
nec
t -
2014
-08-
27

Parties and Leaders 61
untrustworthy or incompetent. In the 2011 SES, we asked about fivesuch ‘intrinsic values’ that could influence voters’ willingness to sup-port a party. Respondents were asked whether they see each of thefour major parties as ‘capable’ or ‘not capable of being a strong gov-ernment’; as ‘united’ or ‘divided’; as ‘in touch’ or ‘out of touch withordinary people’; as a party that ‘keeps’ or that ‘breaks its promises’;and finally as ‘standing up’ or ‘not standing up for Scotland’. A ‘notsure’ option was offered and was routinely chosen by around 15–20per cent of respondents but these respondents are omitted fromTable 3.4 to help clarify the patterns in party image. This table reportsresults first for all respondents and then for the important ‘unde-cided’ group, that is the approximately 20 per cent of the samplethat answered at the midpoint or below on a pre-election scale fromzero (‘not at all’) to ten (‘absolutely’) gauging how sure respondentswere about the regional list vote choice.
Table 3.4 Party ratings on five facets of party image: (i) all respon-dents (ii) undecided voters
All respondents(min. N = 1,543)
Con Lab LD SNP% % % %
Capable of strong government 46 62 14 71United 51 52 15 86In touch with ordinary people 15 57 29 75Keep their promises 20 31 9 50Standing up for Scotland 18 56 27 95
Undecided voters(min. N = 240)
Con Lab LD SNP
Capable of strong government 47 65 18 66United 52 44 18 87In touch with ordinary people 13 53 32 66Keep their promises 14 22 9 37Standing up for Scotland 16 53 29 95
Source: Pre-election survey.
10.1057/9781137023704 - More Scottish than British, Christopher Carman, Robert Johns and James Mitchell
Co
pyr
igh
t m
ater
ial f
rom
ww
w.p
alg
rave
con
nec
t.co
m -
lice
nse
d t
o U
niv
ersi
ty o
f S
ydn
ey -
Pal
gra
veC
on
nec
t -
2014
-08-
27

62 More Scottish than British
It is plain that images are coloured by a party’s general popular-ity. The Liberal Democrats won little credit for anything whereas theSNP’s ratings were strong across the board, but there is more to thepicture than this. The Conservatives were fairly widely credited withcompetence and unity, even if dismissed on the other three crite-ria. While Labour’s scorecard was generally quite good, the party’spromises were not widely valued. There was a similar pattern for theSNP – there is a tendency for the electorate to distrust parties to keeptheir promises. However, the SNP’s image as a party that stands upfor Scotland was almost universally recognized. Above all, the SNPclearly projected the most favourable image in 2011. It led Labour bysome distance, and the other parties even further, on all five criteria.
We might expect that undecided voters would be more scepticaland they were indeed a little less likely to give the SNP credit forkeeping promises and being in touch with ordinary people. But theresults in the lower panel are generally very similar to those for allrespondents. In particular, the Nationalists retain their advantageover Labour on four of the five dimensions, and the gap only closes,without reversing, on capacity for strong government.
The fact that the different party image ratings are to some extentdistinct from a party’s general popularity means that these ratingsmay potentially have an independent impact on voting behaviour.There has been remarkably little research into the electoral effectsof party image, one consequence of which is that we know littleabout the relative importance of the five facets of image examinedabove. One way of addressing this issue is to conduct a series of sim-ple regression analyses for each party, predicting its 0–10 like-dislikerating based on the five assessments of its image. By also controllingfor party identification in those regressions, we can mitigate the biasinherent in the fact that those who already support a party are likelyto perceive it more favourably on all dimensions. The full results ofthe regressions are available in Appendix 2 Table 3.1; here, we illus-trate in Figure 3.1 the coefficients for party image that are our mainconcern.
There is considerable variation across parties in the image criteriaby which they are judged. Some of these differences are more easilyexplained than others. For instance, Labour and the SNP, the lead-ing rivals for Holyrood office, are judged more than the others bythe perceived capacity for strong government. The incumbent SNP
10.1057/9781137023704 - More Scottish than British, Christopher Carman, Robert Johns and James Mitchell
Co
pyr
igh
t m
ater
ial f
rom
ww
w.p
alg
rave
con
nec
t.co
m -
lice
nse
d t
o U
niv
ersi
ty o
f S
ydn
ey -
Pal
gra
veC
on
nec
t -
2014
-08-
27

Parties and Leaders 63
0 0.1 0.2 0.3 0.4
Stronggovernment
United
In touch
Keepspromises
Stands upfor Scotland
Standardized coefficient
Conservative Labour Lib Dem SNP
Figure 3.1 Impact (standardized regression coefficients) of image variables onparty like-dislike ratingsSource: Pre-election survey.
was judged most by the worth of its promises. The Westminster gov-erning coalition parties were judged mostly on their willingness tostand up for Scotland, though being seen as in touch with ordinarypeople, while somewhat important for all parties, did most to deter-mine attitudes to the Liberal Democrats. Finally, while unity is oftenregarded by party elites as essential for projecting a favourable image,it matters less to voters. In order to determine what these results mean
10.1057/9781137023704 - More Scottish than British, Christopher Carman, Robert Johns and James Mitchell
Co
pyr
igh
t m
ater
ial f
rom
ww
w.p
alg
rave
con
nec
t.co
m -
lice
nse
d t
o U
niv
ersi
ty o
f S
ydn
ey -
Pal
gra
veC
on
nec
t -
2014
-08-
27

64 More Scottish than British
for each party, they must be read in conjunction with the ratings inTable 3.4. The broad pattern appears to be that parties are judgedmost on their weakest criteria. One exception is the strongest effectin all four regressions, the SNP coefficient for strong government. TheNationalists were untested as a party of government when elected in2007; their popularity in 2011 owed a good deal to the fact that manyvoters saw them as having passed that test.
Another aspect that might be considered under the heading ofparty image is the degree to which the parties project a ‘positive’image through their campaigns. In 2011 the SNP in particular seemedto be determined to appear as positive campaigners. This maintainedan approach that the party adopted in 2007 and was perceived by SNPstrategists as having been important in that election. Evidence fromthe 2007 SES supports their case. Post-election survey respondentswere asked to rate each party’s campaign on a five-point scale from‘very positive’ to ‘very negative’ (with a brief description of what eachentails). Not only was the SNP campaign’s seen as by far the mostpositive and Labour’s as the most negative, but these evaluations hadan independent effect on party choice, even controlling for partisanpredispositions and a vast array of other variables (Pattie et al., 2011;Johns et al. 2010, ch. 10).
The same questions were included in the 2011 post-election surveyand the results are shown in Table 3.5. In addition to the basic per-centages, we calculate a mean ‘positivity’ rating based on numberingthe scale from one (‘very negative’) to five (‘very positive’), and use
Table 3.5 Perceptions of campaign tone by party, 2011 and 2007
Con%
Lab%
LD%
SNP%
Very positive 5 4 2 33Fairly positive 24 14 16 38Neither positive nor negative 28 19 34 16Fairly negative 24 33 31 8Very negative 18 30 17 4N 1402 1434 1382 1436
Mean positivity rating 2011 2.74 2.29 2.56 3.88(1 = v. negative, 5 = v. positive) 2007 2.97 2.29 3.09 3.30
Source: Pre-election survey.
10.1057/9781137023704 - More Scottish than British, Christopher Carman, Robert Johns and James Mitchell
Co
pyr
igh
t m
ater
ial f
rom
ww
w.p
alg
rave
con
nec
t.co
m -
lice
nse
d t
o U
niv
ersi
ty o
f S
ydn
ey -
Pal
gra
veC
on
nec
t -
2014
-08-
27

Parties and Leaders 65
this to provide an economical comparison with 2007. The contrastbetween the two leading parties is clear: as in 2007, the medianrespondent saw the SNP’s campaign as ‘fairly positive’, Labour’s as‘fairly negative’, and the other two parties’ campaigns as more mixedbut on balance negative. Labour’s mean rating was unchanged acrossthe two elections despite the fact that the focus of the party’s attacksshifted between 2007 and 2011: in 2007, Labour focused its attackson the SNP and the danger of independence while in 2011 its empha-sis, particularly in the early part of the campaign, was an attemptto ride a tide of anti-Conservative feeling by trying to resurrectmemories of when the Conservatives were last in government inWestminster. The Liberal Democrat mean score declined but thisprobably has more to do the party’s tainted image as part of thecoalition in London than to do with specific judgements of its 2011Scottish campaigning. The SNP rating increased markedly, with over71 per cent of respondents rating its campaign in one of the two ‘pos-itive’ categories. That is too large a proportion to be comprised only,or even mainly, of those already predisposed towards the SNP, and thepoint is confirmed by looking at the campaign tone ratings of Labouridentifiers. Even among that group, 63 per cent acknowledged theSNP campaign as positive but only 36 per cent said the same of theirown party’s campaign, 42 per cent describing the Labour approachas negative. Like other indicators of party image, perceptions of cam-paign tone are coloured by partisan predispositions but also containa substantial objective component. This gives them the potential forthe kind of independent impact on voting behaviour that they had in2007. In the final chapter, we estimate the kind of full multi-variatemodels required to test whether the same was true this time around.For now we can conclude that, insofar as campaign tone did influenceparty choice in 2011, we would expect this to have worked stronglyin the SNP’s favour.
The leaders
Paying attention to party image raises further questions. How didvoters decide whether Labour was capable of strong government, orwhether the SNP would keep its promises? More broadly, what are thesources of a party’s image, especially when it has been out of powerfor some time? One key answer to that question is the party’s leader.
10.1057/9781137023704 - More Scottish than British, Christopher Carman, Robert Johns and James Mitchell
Co
pyr
igh
t m
ater
ial f
rom
ww
w.p
alg
rave
con
nec
t.co
m -
lice
nse
d t
o U
niv
ersi
ty o
f S
ydn
ey -
Pal
gra
veC
on
nec
t -
2014
-08-
27

66 More Scottish than British
In introducing this chapter, we noted the ‘presidentialization’ pro-cesses that have placed leaders at the forefront of party and especiallyelectoral politics. Another important point is that voters, especiallythose – the majority – with limited interest in and knowledge of pol-itics, will find leaders easier to judge than parties. Voters are muchmore accustomed and adept at judging other humans than complex,multi-faceted and perhaps quite nebulous entities as political parties(Miller et al. 1986). When voters in 2011 were judging the SNP’s per-formance in office, it makes sense that they would draw on theirjudgements of Alex Salmond, by then into his seventh year of hissecond stint as SNP leader, having served a full term as First Minis-ter and very familiar on the Scottish political scene. Such inference ishardly irrational given the perceived capacity of powerful leaders toshape parties in their own image.
What we have just described would be classified by Anthony King(2002, ch. 1) as an indirect effect of leadership. Voters are choosingbetween parties but their view of a party, and hence their choice, isinfluenced by the leader’s impact on that party. Leadership may alsohave direct effects. In that case, party is bypassed and voters sim-ply choose between leaders – in the Scottish context, they chooseamong the options for First Minister. The distinction between directand indirect effects is easily blurred because leader and party imagesare themselves so closely enmeshed, making it hard to say whichis ultimately driving voters’ choices. However, it is clear that voters’evaluations of party leaders have a significant independent impact onvoting behaviour in UK general elections (Andersen and Evans 2003;Evans and Andersen 2005; Clarke et al. 2004, 2009, 2011; Stevenset al. 2011).
The evidence is a little patchier from the four Scottish elections sofar. This may be due in part to a rapid turnover of leaders, whichhas left the average contender less familiar to voters, and in turn lessinfluential over their choices, than was the case with major figureslike Tony Blair in the 2001 and 2005 general elections, or GordonBrown and David Cameron in 2010. But that cannot explain why,in the 2007 Scottish election, evaluations of the long-prominentSalmond had limited independent impact on party choice. Thisseems a case in which a leader’s impact was predominantly indi-rect: voters liked the SNP under Salmond at least as much as theyliked him personally (Johns et al. 2009). However, other analyses
10.1057/9781137023704 - More Scottish than British, Christopher Carman, Robert Johns and James Mitchell
Co
pyr
igh
t m
ater
ial f
rom
ww
w.p
alg
rave
con
nec
t.co
m -
lice
nse
d t
o U
niv
ersi
ty o
f S
ydn
ey -
Pal
gra
veC
on
nec
t -
2014
-08-
27

Parties and Leaders 67
suggested a direct Salmond effect (Curtice et al. 2009), though thismay have been a consequence of the timing of the fieldwork thattook place in the period immediately following the election when theFirst Minister was enjoying a honeymoon effect (even among news-papers that had been, and would again be, his staunchest critics).There was also evidence that attitudes to the Labour, Conservativeand Liberal Democrat leaders influenced choice in 2007 (Johns et al.2010, ch. 10). So there is at least the potential for influence in 2011.
This potential may have been reinforced by the series of televiseddebates between the party leaders. These did not have the noveltyvalue of those at the UK general election a year earlier as there hadbeen debates in previous Scottish Parliament elections. There werethree leader debates, broadcast on 29 March, 1 May and 3 May, as wellas a further debate between the party finance spokespeople. Betweenthem, they reached 780,000 viewers.1 Ratings provide a more reliableindicator of reach than do survey data like the SES results, becausethe kinds of politically engaged people who watch leader debates areoverrepresented in survey samples like ours. So, when 33 per centof SES respondents report that they watched at least some of oneof the debates, this may overstate the proportion of viewers in thepopulation but without implying that the survey respondents arelying.
Media reaction to each televised debate begins while the closingcredits are rolling and so it is impossible, especially with a post-election survey, to gauge voters’ responses to the debates themselvesrather than the subsequent media narrative. We should thereforeapproach respondents’ self-reports of debate influence with partic-ular caution. Of those who watched the debates, 24 per cent (i.e.8 per cent of the whole sample) said that they saw something which‘influenced their vote in the Scottish Parliament election’. Givenknown limits on voters’ introspective capacities, that is, the fact thatpeople seldom have a clear idea of what drives their decisions (Wilson2004; Lodge and Taber 2013), means that we have very little idea ofthe accuracy of that percentage.
On the other hand, it could be that the impact of the debates isitself indirect. If voters, even those who did not watch, are repeat-edly exposed to a narrative about the leaders’ debating performance,with some hailed as successes and others as failures, this could influ-ence their evaluations of those leaders and ultimately their vote
10.1057/9781137023704 - More Scottish than British, Christopher Carman, Robert Johns and James Mitchell
Co
pyr
igh
t m
ater
ial f
rom
ww
w.p
alg
rave
con
nec
t.co
m -
lice
nse
d t
o U
niv
ersi
ty o
f S
ydn
ey -
Pal
gra
veC
on
nec
t -
2014
-08-
27

68 More Scottish than British
Table 3.6 Perceived best and worst debate performers: (i) all watchers (ii) byparty identification
Leader Allrespondents
Best, by partyidentification
Best Worst Con Lab LD SNP None
Anabel Goldie (Con) 14 9 49 18 15 0 18Iain Gray (Lab) 4 68 3 18 8 0 1Tavish Scott (Lib Dem) 1 21 5 0 15 0 1Alex Salmond (SNP) 81 3 43 64 62 100 80N 552 540 37 106 13 187 204
Source: Post-election survey.
choice. In that case, we can gauge public impressions of the debatesas a whole, whether these impressions were first- or second-hand.Table 3.6 shows widespread public agreement on both the big win-ner and big loser from the debates: 76 per cent of watchers declaredthat Alex Salmond had done ‘the best job’, and 63 per cent thoughtthat Labour’s Iain Gray had done ‘the worst job’. Percentages ofthis size cannot be explained by partisan predispositions that aredistributed more evenly within the electorate. The breakdown byparty identification confirms the point. While almost half of Con-servative identifiers designated their leader Annabel Goldie as thewinner, a clear majority within all of the other groups nominatedAlex Salmond as doing the best job. In illustration of the combinationof objectivity and partisan bias, all of the SNP-identifying respon-dents who watched the debates dutifully reported that Alex Salmondwas the winner.
Although there were only two realistic contenders for First Minis-ter in 2011, the image and popularity of each party depends in parton its leader and so attitudes to all of the Scottish leaders are impor-tant. We should extend this analysis a little further, however, to takein evaluations of the party leaders at UK level. There are theoreticaland empirical reasons to suspect that the key players at Westminsterhad an impact on voters in 2011. As discussed in our later chapteron the multi-level context of Scottish elections (Chapter 5), thosedifferent levels are not neatly distinct but entangled and blurred.Events and personalities from one level influence choices at another
10.1057/9781137023704 - More Scottish than British, Christopher Carman, Robert Johns and James Mitchell
Co
pyr
igh
t m
ater
ial f
rom
ww
w.p
alg
rave
con
nec
t.co
m -
lice
nse
d t
o U
niv
ersi
ty o
f S
ydn
ey -
Pal
gra
veC
on
nec
t -
2014
-08-
27

Parties and Leaders 69
level, a process encouraged by the fact that the menu of parties onoffer is basically the same. We have already noted the impact ofthe Conservatives’ return to power at Westminster; Labour’s sup-port in Scotland may have solidified in reaction to the deluge ofcriticism suffered by the UK party’s Scottish leader, Gordon Brown.Further, UK party leaders typically participate actively in Scottishelections. David Cameron, Ed Miliband and Nick Clegg all madewell-publicized stops on the 2011 campaign trail. In this context, itwould not be surprising if attitudes to Westminster leaders influenceHolyrood votes. Analysing party choice at the 2007 Scottish Parlia-ment election, Johns et al. (2010: ch. 3) found that willingness tosupport Labour was actually influenced more by evaluations of out-going Westminster leader Tony Blair than by those of incumbent FirstMinister Jack McConnell.
We measure leader evaluations with the same 0–10 like-dislikescale by which we measured feelings about parties. This does notdo justice to the numerous traits and criteria against which leaders,like parties, can be judged (Stevens et al. 2011). However, previ-ous research suggests that leadership effects can be reasonably wellcaptured with a single affect dimension (Clarke et al. 2009), andconstraints on survey space precluded a more detailed scrutiny ofthe various leaders’ personalities. Table 3.7 reports the mean evalu-ation for each of the major Scottish party leaders and five potentialplayers from Westminster. Where available, there is also a compar-ison with that leader’s mean rating in 2007 or with the currentleader’s predecessor in the case of Labour and the Liberal Democratsin Scotland. There are then three further statistics for each leader: thestandard deviation, which measures the spread of ratings and thusthe extent to which a leader polarizes opinion; the Pearson correla-tion between respondents’ ratings of that leader and those of his orher party, which shows the extent to which the two are separated invoters’ minds; and the proportion of respondents answering ‘don’tknow’ (DK) when asked their view on that leader, indicating publicfamiliarity with that leader.
Media treatments of the election during the campaign and espe-cially after the results seemed to present a mismatch between the twocontenders for First Minister. These pre-election ratings lend somesupport to that portrayal. Alex Salmond was clearly the most popu-lar of the Scottish leaders and his advantage over Iain Gray, at 1.5
10.1057/9781137023704 - More Scottish than British, Christopher Carman, Robert Johns and James Mitchell
Co
pyr
igh
t m
ater
ial f
rom
ww
w.p
alg
rave
con
nec
t.co
m -
lice
nse
d t
o U
niv
ersi
ty o
f S
ydn
ey -
Pal
gra
veC
on
nec
t -
2014
-08-
27
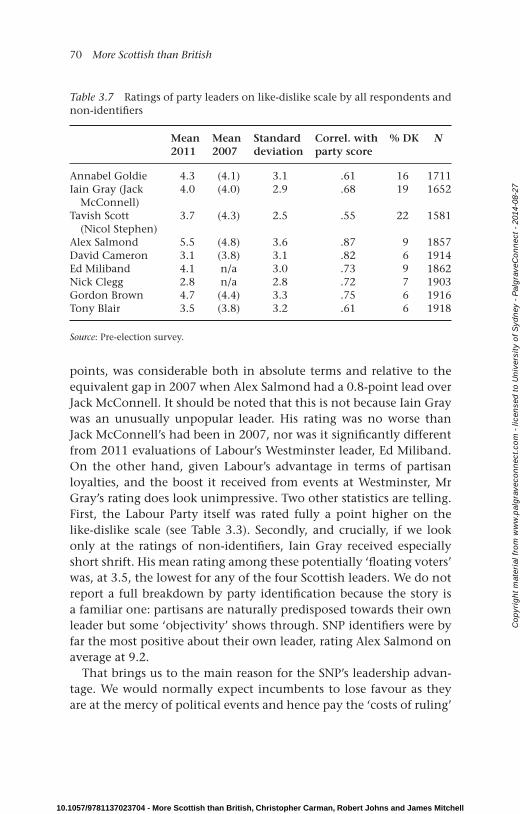
70 More Scottish than British
Table 3.7 Ratings of party leaders on like-dislike scale by all respondents andnon-identifiers
Mean2011
Mean2007
Standarddeviation
Correl. withparty score
% DK N
Annabel Goldie 4.3 (4.1) 3.1 .61 16 1711Iain Gray (Jack
McConnell)4.0 (4.0) 2.9 .68 19 1652
Tavish Scott(Nicol Stephen)
3.7 (4.3) 2.5 .55 22 1581
Alex Salmond 5.5 (4.8) 3.6 .87 9 1857David Cameron 3.1 (3.8) 3.1 .82 6 1914Ed Miliband 4.1 n/a 3.0 .73 9 1862Nick Clegg 2.8 n/a 2.8 .72 7 1903Gordon Brown 4.7 (4.4) 3.3 .75 6 1916Tony Blair 3.5 (3.8) 3.2 .61 6 1918
Source: Pre-election survey.
points, was considerable both in absolute terms and relative to theequivalent gap in 2007 when Alex Salmond had a 0.8-point lead overJack McConnell. It should be noted that this is not because Iain Graywas an unusually unpopular leader. His rating was no worse thanJack McConnell’s had been in 2007, nor was it significantly differentfrom 2011 evaluations of Labour’s Westminster leader, Ed Miliband.On the other hand, given Labour’s advantage in terms of partisanloyalties, and the boost it received from events at Westminster, MrGray’s rating does look unimpressive. Two other statistics are telling.First, the Labour Party itself was rated fully a point higher on thelike-dislike scale (see Table 3.3). Secondly, and crucially, if we lookonly at the ratings of non-identifiers, Iain Gray received especiallyshort shrift. His mean rating among these potentially ‘floating voters’was, at 3.5, the lowest for any of the four Scottish leaders. We do notreport a full breakdown by party identification because the story isa familiar one: partisans are naturally predisposed towards their ownleader but some ‘objectivity’ shows through. SNP identifiers were byfar the most positive about their own leader, rating Alex Salmond onaverage at 9.2.
That brings us to the main reason for the SNP’s leadership advan-tage. We would normally expect incumbents to lose favour as theyare at the mercy of political events and hence pay the ‘costs of ruling’
10.1057/9781137023704 - More Scottish than British, Christopher Carman, Robert Johns and James Mitchell
Co
pyr
igh
t m
ater
ial f
rom
ww
w.p
alg
rave
con
nec
t.co
m -
lice
nse
d t
o U
niv
ersi
ty o
f S
ydn
ey -
Pal
gra
veC
on
nec
t -
2014
-08-
27

Parties and Leaders 71
but a term as First Minister served to strengthen Salmond’s popular-ity. This pushed him over the neutral point in the scale and thus wellclear of all of the other ratings in the table. However, it is also worthrecalling that the SNP’s popularity boost outstripped Mr. Salmond’ssuch that, like Mr. Gray, he was somewhat less popular than his partyin 2011. One reason is that the First Minister continued to divideopinion: the standard deviation of Salmond’s ratings is the highest inthe table, indicating that he repelled many voters as well as attractingmany others.
Tavish Scott looks to have suffered from the Liberal Democrats’general travails while Annabel Goldie remained a good deal betterliked than her party – thus illustrating the limits on the capac-ity of a popular leader to salvage an unpopular party. Both lead-ers were viewed markedly more positively than their counterpartsat Westminster. However, Iain Gray’s unimpressive rating under-mines any suggestion that there is a general bias in favour ofScottish leaders. Perhaps the most noticeable feature of the resultsfor Mr Salmond’s three challengers at Holyrood is the commonnon-response rate. Iain Gray’s main problem looks to have beenanonymity as much as unpopularity. Almost one in five respondentsfelt they knew too little about him to offer an opinion, and therewere similar proportions for Tavish Scott and Annabel Goldie suggest-ing that the televised debates failed to provide a major platform forthe party leaders. Judged by the frequency of ‘don’t know’ responses,all five Westminster leaders proved at least as familiar as First Minis-ter Salmond. The fact that Scottish voters have readier opinions onWestminster leaders indicates that these opinions were more influen-tial on their vote choice though, at this stage, this is circumstantialevidence in that direction.
There is more suggestive evidence from another contrast betweenthe results for Holyrood and Westminster leaders. For the three par-ties with both Scottish and British leaders, the correlation betweenleader and party effect is always stronger for the Westminster leader.That difference is large and statistically significant in the case of theConservatives and Liberal Democrats and smaller for Labour (proba-bly due to Ed Miliband’s relative novelty at the time of the survey).In other words, it seems that parties are more readily associated invoters’ minds with their UK leaders than with their Scottish leaders,even when these ratings are given in the run-up to a Holyrood
10.1057/9781137023704 - More Scottish than British, Christopher Carman, Robert Johns and James Mitchell
Co
pyr
igh
t m
ater
ial f
rom
ww
w.p
alg
rave
con
nec
t.co
m -
lice
nse
d t
o U
niv
ersi
ty o
f S
ydn
ey -
Pal
gra
veC
on
nec
t -
2014
-08-
27

72 More Scottish than British
election. This may in turn imply that the British party leaders wereuppermost in voters’ minds as they assessed the options in that elec-tion. If that is the case, then it was predictably bad news for theWestminster coalition parties but may have helped Labour, partic-ularly if choices were influenced by sympathy for Gordon Brown andthis is illustrated in his having the second highest mean rating ofall nine leaders. Matters are different for the SNP, whose leader inHolyrood is unambiguously its pre-eminent figure. This may explainwhy the strongest correlation is between ratings of Alex Salmondand the SNP. Nonetheless, the sheer strength of that correlation(r = 0.87) warrants further explanation. It suggests that Salmond hasbecome such a prominent and dominant figure within his party thatthe two are almost seen as interchangeable or equivalent in voters’minds.
A strong correlation cannot confirm the direction of causal rela-tions between party and leader evaluations. Are voters’ feelings aboutthe SNP driven by their attitude towards its leader, or are theirviews of Salmond largely driven by their views of his party and,for example, its flagship constitutional policy? The answer is almostcertainly ‘both’ but the predominant direction is of obvious impor-tance because it determines the scope for leadership effects on votingbehaviour. If leaders are judged by their parties, then evaluations ofthose leaders will not make an independent contribution to predict-ing attitudes to, and eventually choice between, those parties. So, oneway of resolving the issue of causal direction is to see whether leaderevaluations do make such an independent contribution to predictingparty choice. If they do, then parties are being judged at least partlyon the basis of their leaders.
Leadership evaluations and party choice
We test for this using the method of multinomial logistic regressionthat was introduced in Chapter 2. In that chapter, we presented amodel including the core demographic and socio-economic variablesthat are at the beginning of the causal chain or ‘funnel of causality’(Campbell et al. 1960) that drives voting behaviour. The regressionanalysis presented below includes all of those variables but here theyserve as controls, allowing us to make cleaner estimates of the effectof leader evaluations. For example, it may be that working-class Scots
10.1057/9781137023704 - More Scottish than British, Christopher Carman, Robert Johns and James Mitchell
Co
pyr
igh
t m
ater
ial f
rom
ww
w.p
alg
rave
con
nec
t.co
m -
lice
nse
d t
o U
niv
ersi
ty o
f S
ydn
ey -
Pal
gra
veC
on
nec
t -
2014
-08-
27

Parties and Leaders 73
have a distaste both for David Cameron and the Conservative Party.If we omit social class from our analysis, and consider only theleader evaluation and the vote, we risk concluding that the evalua-tion rather than social class is the causal force. We also include partyidentification as a control variable and for the same reason: it is afactor that is likely both to shape leader evaluations and to influencevote choice. A trickier question is whether to include the party like-dislike ratings. Including them creates a stiff test of whether leadershave a direct effect on voting choice, independent of their impacton the party’s likeability, but it also conceals the potential indirecteffect: we would not know whether the effect of party likeability wasthe result of other factors or of how that leader had shaped his orher party. The easiest way round this is to do both: to report modelswith and without the party evaluations. Explaining the differencesbetween the results also helps to clarify the rather complicated logicbehind the previous few sentences.
All nine leaders rated in Table 3.7 are included in the analysis. Thisenables us to assess the relative importance of Scottish and UK lead-ers on the choices made in 2011. The impact of a leader’s evaluationon regional list vote is denoted by the size of the bars in Figure 3.2.While the full results of the regression are reported in Appendix 2Table A2 3.1, the chart illustrates the effects of each leadership eval-uation variable on predicted probabilities of the dependent variable.As in Chapter 2, the specific effect calculated is the change in pre-dicted probability associated with a full range (0–10) change in thatleader rating. In this multinomial context, there are multiple effectsizes for each predictor (reflecting the multiple coefficients: Lab vs.Con, Lab vs. Lib Dem, Lab vs. SNP) and so the changes in pre-dicted probabilities are averaged across the three. Two effect sizes arecalculated, reflecting the earlier discussion about whether party eval-uations should be controlled when calculating leadership effects. The‘net’ (or direct) effect is calculated from the models including thoseevaluations; the ‘gross’ (direct and indirect) effect is from models withparty ratings omitted. To save lots of cross-checking with the modelin Appendix A2 3.1, statistical significance is shown graphically:where none of the three coefficients for that leader was significantat the p < 0.05 level, the effect size bar has been made transparent.
The ‘gross’ effects in the chart are very large. This is partly becausea full range change in these independent variables is a major change:
10.1057/9781137023704 - More Scottish than British, Christopher Carman, Robert Johns and James Mitchell
Co
pyr
igh
t m
ater
ial f
rom
ww
w.p
alg
rave
con
nec
t.co
m -
lice
nse
d t
o U
niv
ersi
ty o
f S
ydn
ey -
Pal
gra
veC
on
nec
t -
2014
-08-
27

74 More Scottish than British
‘Gross’ ‘Net’
0 0.1 0.2 0.3 0.4 0.5
Salmond
Gray
Goldie
Scott
Cameron
Clegg
Miliband
Brown
Blair
Average change in predicted probability for a 0–10 change in leader evaluation
Figure 3.2 Mean effects of leadership evaluations on party choiceSources: Pre- and post-election surveys.
we would expect those who strongly dislike a party’s leader to bemuch less likely to support that party than those who strongly likeit. Most respondents fall into the intermediate categories anyway,often at or near the midpoint. Even controlling for party identifi-cation, leader evaluations help us considerably in predicting voters’choices. They also reveal two important comparative conclusions.Perhaps reflecting his prominence in the campaign, it was attitudesto Alex Salmond that were the best predictors of choice in 2011 and,
10.1057/9781137023704 - More Scottish than British, Christopher Carman, Robert Johns and James Mitchell
Co
pyr
igh
t m
ater
ial f
rom
ww
w.p
alg
rave
con
nec
t.co
m -
lice
nse
d t
o U
niv
ersi
ty o
f S
ydn
ey -
Pal
gra
veC
on
nec
t -
2014
-08-
27

Parties and Leaders 75
unlike in 2007, voting behaviour was overall better predicted by atti-tudes to the leaders at Holyrood than by attitudes to key figures atWestminster. In particular, and dashing the hopes for Labour raisedearlier in the chapter, attitudes to Gordon Brown proved to have nosignificant relationship with party choice in 2011. Sympathy theremay have been, but it did not translate into votes.
The ‘net’ effects of leadership, controlling for attitudes to the lead-ers’ parties, are much weaker in almost all cases. This does not meanthat leaders are unimportant. For one thing, most of the effectsremain statistically significant and several are far from negligiblein size. They are just dwarfed by the gross effects that now looksuspiciously large, as if they were mainly a reflection of those par-tisan attitudes that are now controlled. The Salmond effect remainsstrong enough to suggest that the SNP benefited from the increase inhis personal popularity compared to 2007. Secondly, a weaker ‘net’effect leaves open the possibility of a strong but indirect impact ofleadership. If Alex Salmond’s major contribution was to boost theelectability of the SNP, then the ‘net’ effect simply records that extraimpact on voting of his polarizing image. As we have stressed, thecausality could run the other way – that is, from party to leaderevaluations. It seems likely, for example, that the apparently strongeffect of attitudes to Tavish Scott was due to the fact that many vot-ers simply projected their probably negative attitude to the LiberalDemocrats onto the party’s less familiar leader. There are two excep-tions to the general rule that ‘net’ effects are far weaker. Controllingfor partisan attitudes leaves in place much of the effect of attitudesto Annabel Goldie, indicating that she had carved out an image dis-tinct from that of her party. Less easily explicable is the fact thatratings of Nick Clegg were barely affected by controlling for atti-tudes to the Liberal Democrats. It may be that he personally wasblamed more than his party for the decision to join the Conserva-tives in coalition at Westminster. The Alternative Vote referendumheld on the same day as the Scottish Parliament elections returnedClegg to the public spotlight, potentially reawakening awarenessof the Liberal Democrats’ leader. He remains an exception to therule highlighted above. Whether we consider ‘gross’ or ‘net’ effectson voting, the Scottish leaders proved more influential than theBritish leaders in 2011. This introduces a theme that will recur inChapter 5.
10.1057/9781137023704 - More Scottish than British, Christopher Carman, Robert Johns and James Mitchell
Co
pyr
igh
t m
ater
ial f
rom
ww
w.p
alg
rave
con
nec
t.co
m -
lice
nse
d t
o U
niv
ersi
ty o
f S
ydn
ey -
Pal
gra
veC
on
nec
t -
2014
-08-
27

76 More Scottish than British
Conclusion
Labour entered the election year of 2011 with grounds for confi-dence. It had polled strongly in Scotland at the general election in2010 and, following its replacement with a Conservative-led coali-tion at Westminster, had enjoyed a resurgence in Holyrood votingintentions. The party began to look likely to become the largest partyat Holyrood following the 2011 elections. One of the bases for suchoptimism was made clear in this chapter. In terms of enduring par-tisan identities, Labour seems to be comfortably better off than anyof its rivals. If regarded as a ‘core vote’, this bloc of self-proclaimedLabour supporters provided at least the basis for the victory charge in2011. We return to this issue in Chapter 5.
The evidence presented in this chapter highlights three key rea-sons why that victory did not materialize. First, Labour’s base did notserve as a ‘core vote’: many Labour identifiers abstained or even votedfor other parties. Secondly, party identification is not just a matterof enduring attachments that voters learn early and stick to fromthen on. There are other considerations that influence vote choices,including the perceived performance, policies and leadership. More-over, since these short-term factors differ across electoral context (forexample, a party might have a more popular leader at Westminsterthan at Holyrood), we cannot expect attachments formed in one con-text to be important in another. Thirdly, party identifiers form onlyaround half of the electorate and so even a dominant position amongthat group takes a party only so far towards the electoral winning-line. Election outcomes are ultimately determined by the competingparties’ appeal to the unattached voters.
In 2007, Labour’s stronger support base was almost but not quiteenough to outweigh the SNP’s advantage in more immediate popu-larity. By 2011, that SNP advantage had widened considerably andso in turn did the party’s margin of victory. Both the party and itsleader had become more popular. This is notable not least because itbucks the ‘cost of ruling’ (Nannestad and Paldam 2000) trend thatsees a general downward drift in the popularity of governing par-ties and leaders. Incumbents often recover from mid-term blues butrarely to the point of surpassing their showing at the previous elec-tion, let alone achieving the double-digit gains that the SNP managed
10.1057/9781137023704 - More Scottish than British, Christopher Carman, Robert Johns and James Mitchell
Co
pyr
igh
t m
ater
ial f
rom
ww
w.p
alg
rave
con
nec
t.co
m -
lice
nse
d t
o U
niv
ersi
ty o
f S
ydn
ey -
Pal
gra
veC
on
nec
t -
2014
-08-
27

Parties and Leaders 77
in 2011. So how did the SNP turn the potential disadvantage of gov-erning, during a difficult economic and fiscal period and without anoverall majority, into an advantage?
One part of the answer lies in the SNP’s performance in office.As we see in the next chapter, voters were on the whole impressedby the government’s record. Yet the basis for such evaluations is notalways obvious. Voters keep no more than half on eye on the detail ofgovernment activity (see Delli Carpini and Keeter 1996). This is whereparty image comes in. Voters’ performance evaluations are driven asmuch by their general impression of a party as by specifics of its poli-cies and record (Crewe 1988: 49), and the results in this chapter showthat the SNP gave by far the most favourable impression to voters in2011. Two aspects of that image – capacity for strong governmentand standing up for Scotland – are particularly important and weexamine both in the next chapter. The SNP’s appeal was more gen-eral and it even trumped Labour on a characteristic, being in touchwith ordinary people, that might be thought of as central to the lat-ter’s traditional ‘brand’. Party image has been largely neglected instudies of British electoral behaviour – surprisingly so, given that pol-itics is often characterised as image-dominated. Yet such studies asthere are, whether recent (Andersen and Evans 2003) or not so recent(Butler and Stokes 1974; Bennie et al. 1997), indicate that such imageshave a marked influence on voters’ behaviour. In our full models ofparty choice in Chapter 6, we examine whether the same was truein Scotland in 2011. If so, it will have worked strongly in the SNP’sfavour.
10.1057/9781137023704 - More Scottish than British, Christopher Carman, Robert Johns and James Mitchell
Co
pyr
igh
t m
ater
ial f
rom
ww
w.p
alg
rave
con
nec
t.co
m -
lice
nse
d t
o U
niv
ersi
ty o
f S
ydn
ey -
Pal
gra
veC
on
nec
t -
2014
-08-
27

4Performance Politics at Holyrood
‘What policies politicians follow is their business; what theyaccomplish is the voter’s business’ (Fiorina 1981: 13). This sums upthe ‘performance politics’ model of voting that, in a series of publica-tions, Harold Clarke and his British Election Study colleagues argueis the key to understanding recent British general elections (Clarkeet al. 2004, 2009, 2011). In this approach, also known as the valencemodel, there is broad agreement among parties, if not voters, aboutthe desired outcomes of policy. Electoral competition is thus aboutwhich contender for office is most likely to deliver. The notion of‘performance politics’ is rooted in models of retrospective votingdeveloped for US elections by Downs (1957), Key (1966) and Fiorina(1981) in which presidents and executives are rewarded or punishedaccording to their record in office. Voters assess whether the incum-bent has performed satisfactorily and, if not, whether it seems likelythat the challenger would have done any better.
In line with Fiorina’s dictum, few voters have anything more thanminimal awareness of the specific policies outlined in the parties’manifestos at a given election and few have strong opinions aboutthose policies (Converse 1964; Zaller 1992). But it is misleading tosuggest that there is public agreement on objectives and disagreementonly on the party thought best able to achieve them. There are broadideological differences within the British, and Scottish, electorate,most notably in terms of the left-right dimension that has been themain basis of party competition for the past century. Voters mayskate over the policy detail but most will have at least some generalview on, for example, how far government should intervene in the
78
10.1057/9781137023704 - More Scottish than British, Christopher Carman, Robert Johns and James Mitchell
Co
pyr
igh
t m
ater
ial f
rom
ww
w.p
alg
rave
con
nec
t.co
m -
lice
nse
d t
o U
niv
ersi
ty o
f S
ydn
ey -
Pal
gra
veC
on
nec
t -
2014
-08-
27

Performance Politics at Holyrood 79
economy. However, these differences in core values or principles canonly determine voting behaviour insofar as the parties themselvesdiffer on the same lines. So one key reason why the ‘performancepolitics’ model has currency in Britain is that, especially since ‘New’Labour’s shift to the centre ground, policy differences between themajor parties have narrowed (Green 2007; Paterson 2006). If themajor contenders are agreed on what should be done, voters are leftonly to judge which party is best equipped to do it.
A second reason why the valence model has gained explanatorypower is partisan de-alignment. As we saw in Chapter 3, while manyvoters feel at least some lingering connection to a particular party,these ties have loosened considerably over the past few decades andmay not deserve to be called ‘loyalties’ given the willingness ofidentifiers to abstain or even to defect to other parties at electiontime. Less partisan voters are more likely to make a late decision abouthow to vote and more likely to be swayed by short-term factors suchas government performance.
It is useful here to introduce a distinction between explaining indi-vidual votes and explaining election outcomes. Long-term partisan orideological identifications can explain the choices of many individ-uals within the electorate but such factors are generally static: theyaccount for people voting the same way at election after election.In the Scottish context, an important example is constitutional pref-erence. This influences voting behaviour – staunch opponents ofindependence are unlikely to vote SNP while many staunch sup-porters of independence would never vote any other way. Suchstrongly held opinions are very unlikely to change between elections.By contrast, perceptions of government performance – and relatedcomponents of the ‘performance politics’ model such as leader eval-uations and party image – fluctuate much more and tend, therefore,to be what swings the election outcome. The central argument of thisbook is that this is what happened in 2011. In concluding the pre-vious chapter, we suggested a ‘performance politics’ explanation ofthe marked increase in like-dislike ratings for both the SNP and itsFirst Minister. We have already seen that most voters were convincedof the party’s capacity for strong government, and many trusted theSNP to keep its promises. In this chapter, we look in more detail atvoters’ assessment of the government’s record. Particular attentionis paid to the economy, which, understandably given the context,
10.1057/9781137023704 - More Scottish than British, Christopher Carman, Robert Johns and James Mitchell
Co
pyr
igh
t m
ater
ial f
rom
ww
w.p
alg
rave
con
nec
t.co
m -
lice
nse
d t
o U
niv
ersi
ty o
f S
ydn
ey -
Pal
gra
veC
on
nec
t -
2014
-08-
27

80 More Scottish than British
elbowed most other issues off the agenda. The economic difficulties,and particularly the consequences for Scotland of the UK govern-ment’s fiscal retrenchment, provide a useful illustration of the specificway in which the valence model operates in Scottish elections. Partof what it means ‘to perform well’ for a Scottish government is tomanage relations with Westminster in a way that defends Scottishinterests. The SNP’s strong reputation in this regard was a cornerstoneof its electoral success in 2011.
Assessing the government’s record
The valence model envisages voters assessing past and future per-formance in office. As such, it also implies that voters are primarilyfocused on those parties with a realistic chance of governing. Iden-tifying likely parties of government is generally more difficult ina multi-party system under proportional representation, as existsin devolved elections in Scotland, than in a simpler party systemunder majoritarian rules, as in elections to the House of Commons.Despite the current role-reversal (with a coalition at Westminster andmajority government at Holyrood), a more proportional system ismore likely to result in a coalition as occurred following the firsttwo Scottish elections. However, predicting both the likely coali-tion permutations and their potential performance is well beyondthe commitment and knowledge of most voters. Whether anticipat-ing future performance or administering credit or blame for pastperformance, voters usually focus on the larger parties that are thedominant coalition partners. The media do likewise. In 2011 (as in2007), the election was presented as a battle for government betweenLabour and the SNP despite the fact that, at least until very late inthe campaign, neither party was thought to have a realistic prospectof winning an overall majority. This tendency to focus on the twolargest parties may have been reinforced by the formation of anSNP minority government in 2007. Neither the SNP nor Labour wereunder pressure to explain whether or with whom they would coalesceduring the election campaign despite reports suggesting that both theLiberal Democrats and Greens were willing to reach agreement withLabour. Given the focus on them as the two potential (main) gov-erning parties, in this section our main concern is with the SNP andLabour.
10.1057/9781137023704 - More Scottish than British, Christopher Carman, Robert Johns and James Mitchell
Co
pyr
igh
t m
ater
ial f
rom
ww
w.p
alg
rave
con
nec
t.co
m -
lice
nse
d t
o U
niv
ersi
ty o
f S
ydn
ey -
Pal
gra
veC
on
nec
t -
2014
-08-
27

Performance Politics at Holyrood 81
One contrast between 2007 and 2011 is that, by the time of thelatter election, most Scots had experience of both leading parties inoffice. This makes it easier to assess their valence credentials. If aparty has been out of power for a decade or more then estimatingperformance is difficult, leaving voters to rely heavily on less directevidence such as party image and leader evaluations (Butt 2006).However, in 2011 there was a relatively recent history of Labourin power (though as the larger party in coalition), which will havehelped Scots to judge how the party would have performed had itwon the 2007 election. It might be wondered why we are focusingon past performance, whether real or estimated, given that votingis about choosing a future government. As Clarke et al. (2004: 26)put it, ‘[r]ational voters have no interest in rewarding or punish-ing anybody’. Yet the past is often voters’ most reliable guide to thefuture – especially given public scepticism about the value of parties’promises. As Downs put it, the voter:
must either compare (1) two hypothetical future utility incomes or(2) one actual present utility income and one hypothetical presentone. Without question, the latter comparison allows him, to makemore direct use of concrete facts than the former. Not only is oneof its terms a real entity, but the other can be calculated in fullview of the situation from which it springs.
(1957: 40)
Knowing the context in which a Labour-led Scottish governmentwould have been operating, voters can assess how its performancewould compare with that of the SNP administration. Hence our coremeasures of perceived performance are retrospective: ‘How good orbad a job of running Scotland do you think SNP ministers in theScottish Government have done since 2007?’ and ‘If Labour had beenleading the Scottish Government over the past four years, how goodor bad a job of running Scotland do you think they would havedone?’
Table 4.1 shows voters’ assessments alongside, for the purposes ofcomparison, performance evaluations for the outgoing and incomingWestminster governing parties. It is clear that voters were rela-tively impressed by the performance of the SNP minority govern-ment. Indeed, since even popular governments usually win grudging
10.1057/9781137023704 - More Scottish than British, Christopher Carman, Robert Johns and James Mitchell
Co
pyr
igh
t m
ater
ial f
rom
ww
w.p
alg
rave
con
nec
t.co
m -
lice
nse
d t
o U
niv
ersi
ty o
f S
ydn
ey -
Pal
gra
veC
on
nec
t -
2014
-08-
27

82 More Scottish than British
Table 4.1 Evaluations of governing party performance: Scottish andWestminster governments
How good a job done by . . .
Scottish government Westminster government
SNP Labour if Labour Con Lib Dem2007–2011 in power 1997–2010 2010– 2010–% % % % %
Very good 14 4 5 4 1Fairly good 42 27 31 18 13Neither 25 26 19 23 23Fairly bad 12 25 21 25 26Very bad 8 18 25 30 36Good – Bad +36 −12 −10 −33 −48N 1923 1613 1967 1951 1943
Note: The base N for the Labour at Holyrood assessment is lower because that questionwas taken from the post-election wave of the survey.Source: Pre- and post-election surveys.
respect rather than lavish praise, the SNP’s +36 rating (obtained bysubtracting the two ‘bad’ percentages from the two ‘good’ percent-ages) is impressive. Notably, voters did not believe that Labour wouldhave done an especially good job if in power at Holyrood. Indeed, thesimilarity of the Labour ratings for Westminster and Holyrood tendsto belie any notion that Labour in Westminster was a drag on theparty at Holyrood, or vice versa. Another similarity is with Labour’snet rating of -14 from the equivalent retrospective evaluation ques-tion in the 2007 SES. While there are clearly other factors at play, thecloseness of the 2003–2007 (actual) and 2007–2011 (hypothetical)ratings does suggest that voters drew on their recollections of Labourin office when forming their expectations of how Labour would haveperformed had it won in 2007.
In the light of the SNP-Labour gap in Table 4.1, a substantial vic-tory for the former in 2011 is not hard to explain. While we do nothave an exact comparison with an SNP overall performance evalua-tion from 2007, there is strong indirect evidence of change betweenthe two elections that can explain the SNP’s surge. Respondents in the2007 SES were asked to rate Labour (actual) and SNP (hypothetical)performance in six issue areas (see Johns et al. 2009: 217–218). While
10.1057/9781137023704 - More Scottish than British, Christopher Carman, Robert Johns and James Mitchell
Co
pyr
igh
t m
ater
ial f
rom
ww
w.p
alg
rave
con
nec
t.co
m -
lice
nse
d t
o U
niv
ersi
ty o
f S
ydn
ey -
Pal
gra
veC
on
nec
t -
2014
-08-
27

Performance Politics at Holyrood 83
the SNP led Labour on four of the six issues, these advantages weretypically quite narrow, and are dwarfed by the difference in Table 4.1.In 2011, the SNP had pulled away from Labour to enjoy a clear andcrucial competence advantage.
These evaluations are subjective and, in particular, they will bestrongly influenced by partisan predispositions. Rather than present-ing a full breakdown of the results by party identification, we pickout some specific statistics from that analysis. First, among non-identifiers, the SNP net rating was +38 while Labour’s was −26.The fact that Labour’s rating is more negative than that shownin Table 4.1 is not that surprising: non-identifiers have in a senserejected the political parties and so we would expect them generallyto take a more jaundiced view of likely performance. The strikingresult is that non-identifiers took just as positive a view of the SNP’srecord as the electorate as a whole. Second, apart from the Conser-vatives, all of the other groups of identifiers gave the SNP overallpositive evaluations. Among self-proclaimed Labour supporters – thatis, supporters of the SNP’s main opposition party – the SNP received anet rating of +13. We have seen in previous chapters that the SNP wasable to win votes across the socio-demographic and partisan board.The consistently favourable evaluations of the party’s performance ingovernment look a likely reason for this.
What, then, were the drivers of these positive evaluations? Oneway of addressing this question is to consider voters’ assessments ofoutcomes in key policy areas. Voters were asked whether the stan-dard of health in Scotland had increased or fallen since 2007. Thesame question was then asked about education, standards of living,and law and order. Responses are reported in Table 4.2, along withthe kind of net rating (per cent ‘increased’ minus per cent ‘fallen’)calculated in the previous table.
Most respondents were willing to offer an assessment on most ofthe issue areas. Only in the field of education, with which many peo-ple have little or no direct contact, did fewer than seven in eightrespondents express no opinion. Those who did offer a view wereseldom very complimentary. The most clearly negative figure canbe heavily discounted because, as we see shortly, the Scottish gov-ernment was largely exempted from blame for a plunge in livingstandards experienced far beyond Scotland. But, in the three majordevolved issue domains of health, education, and law and order,
10.1057/9781137023704 - More Scottish than British, Christopher Carman, Robert Johns and James Mitchell
Co
pyr
igh
t m
ater
ial f
rom
ww
w.p
alg
rave
con
nec
t.co
m -
lice
nse
d t
o U
niv
ersi
ty o
f S
ydn
ey -
Pal
gra
veC
on
nec
t -
2014
-08-
27

84 More Scottish than British
Table 4.2 Evaluations of outcomes in four key issue areas
Health Education Living Law and(% DK = 9) (% DK = 23) standards order% % (% DK = 7) (% DK = 12)
% %
Increased a lot 5 3 1 4Increased a little 27 19 13 20Stayed the same 41 38 27 40Fallen a little 18 28 40 23Fallen a lot 8 11 19 13Increased – Fallen +6 −17 −44 −11N 1832 1571 1897 1763
Source: Pre-election survey.
assessments were at best mixed and, on balance, negative. Pluralitiesin all three cases detected no change. In short, Table 4.2 is of littlehelp in accounting for the strongly positive assessments of the SNP’srecord in office.
There are a number of potential explanations for the discrepancybetween the issue outcomes and the overall evaluation. It mightbe that voters’ expectations of government performance are so lowthat ‘no change’ is regarded as something of a triumph. Anotherpoint, discussed in the previous chapter, is that voters incorporatelittle detail on policy and outcomes into their overall assessmentsof a party, relying instead on broad impressions of party image andheuristics such as leadership evaluations. Thirdly, it may be that theissues in Table 4.2 were not those uppermost in voters’ minds whenassessing the SNP, and voting, in 2011. We address that issue in thenext section on issue salience. Meanwhile, we consider a final possi-bility: that, as with living standards, the Scottish government tendedto escape the blame for negative evaluations.
That hypothesis is tested using a follow-up to the questions setout in Table 4.2. Having reported their assessment of outcomes,respondents were asked for each issue: ‘And is this mainly the resultof: (i) the policies of the UK government at Westminster; (ii) thepolicies of the Scottish Government; (iii) both equally; (iv) someother reason?’ We look at these questions in detail in Chapter 5,assessing the extent to which the different governments were being
10.1057/9781137023704 - More Scottish than British, Christopher Carman, Robert Johns and James Mitchell
Co
pyr
igh
t m
ater
ial f
rom
ww
w.p
alg
rave
con
nec
t.co
m -
lice
nse
d t
o U
niv
ersi
ty o
f S
ydn
ey -
Pal
gra
veC
on
nec
t -
2014
-08-
27

Performance Politics at Holyrood 85
Table 4.3 Attributions of responsibility for outcomes in four issue areas byevaluations
Health Education
UK Scottish N UK Scottish N
Increased 4 96 489 4 96 309Stayed the same 28 72 321 16 84 260Fallen 52 48 233 31 69 404
Living standards Law and order
UK Scottish N UK Scottish N
Increased 10 90 201 6 94 351Stayed the same 33 67 193 20 80 254Fallen 83 17 664 34 66 368
Source: Pre-election survey.
held to account in this Scottish Parliament election. Here, for thesake of simplicity and maximizing cell sizes, we confine analysis tothose choosing one of the first two categories. For the same rea-sons, we also simplify the outcome evaluations into three-categoryvariables. Table 4.3 shows the attributions of responsibility for eachissue according to whether respondents had previously reported animprovement, a deterioration or no change.
In all four issue areas, those perceiving improvements overwhelm-ingly attributed these to the Scottish government. The less impressedthe respondents, the more likely they were to blame the UK gov-ernment. The extent to which blame was transferred may dependon how unambiguously devolved an issue is believed to be. On edu-cation and crime, even those perceiving deterioration thought thatthis fell within the Scottish government’s remit. But declining liv-ing standards were in most cases blamed on the UK government,and presumably therefore on its economic management. The qual-ification reflects the ambiguity of ‘living standards’: they need notbe confined to economic matters (and indeed might be influencedby developments in the other three issue areas). And it is noticeablethat, in a time of economic gloom, substantial minorities reportedtheir living standards to have improved or at least held steady. Stillmore striking is that those successes were mostly attributed to the
10.1057/9781137023704 - More Scottish than British, Christopher Carman, Robert Johns and James Mitchell
Co
pyr
igh
t m
ater
ial f
rom
ww
w.p
alg
rave
con
nec
t.co
m -
lice
nse
d t
o U
niv
ersi
ty o
f S
ydn
ey -
Pal
gra
veC
on
nec
t -
2014
-08-
27

86 More Scottish than British
Scottish government. This is consistent with findings from the 2007SES that, while voters tend to see Westminster as on balance morepowerful in the economic domain, they also perceive the Holyroodgovernment as fairly influential over economic outcomes (Johns et al.2010: 139).
Our now oft-repeated acknowledgement of partisan bias is requiredhere. SNP supporters are inclined to credit their government for suc-cesses and to exempt it from blame for failures. But there simplyare not enough SNP supporters to generate the large and consistentdifferences in Table 4.3 and, of course, the Scottish government’sopponents have the opposite partisan motivation. These results canonly be explained if Scottish voters as a whole were prone to attributeimprovements to the government at Holyrood and to blame prob-lems on Westminster. This might be thought to be a general bias infavour of Scottish over UK institutions, perhaps driven by nationalrather than partisan identity. But it seems likely to be due at least inpart to the gulf in overall competence evaluations between the SNPand the Westminster governing parties between 2007 and 2011 (seeTable 4.1). Respondents with those general opinions of the Scottishand UK governments might reasonably have inferred that problemswere the fault of the latter. As usual, the causal relations betweengeneral impressions and specific evaluations are hard to disentangle.What is clear is that Table 4.3 goes a long way to explain how the SNPwas able to maintain a strong reputation for competence though notcredited with major policy achievements.
Issue salience
As mentioned earlier, another possible reason why the SNP was ableto overcome lacklustre ratings on health, education and crime is thatthese matters may not have been of much concern to voters in 2011.On the one hand this seems unlikely as these are bread-and-butterpublic service issues, routinely important in British elections anyway,and they are the most significant areas in which powers have beendevolved to the Scottish Parliament. On the other hand, the economyhad long dominated the political and media agenda in Scotland as inthe rest of Britain. Scottish voters were no less affected by the crisis forthe fact that the macro-economic levers were still pulled in Londonor elsewhere. With constitutional arrangements and context pulling
10.1057/9781137023704 - More Scottish than British, Christopher Carman, Robert Johns and James Mitchell
Co
pyr
igh
t m
ater
ial f
rom
ww
w.p
alg
rave
con
nec
t.co
m -
lice
nse
d t
o U
niv
ersi
ty o
f S
ydn
ey -
Pal
gra
veC
on
nec
t -
2014
-08-
27

Performance Politics at Holyrood 87
in opposite directions, the 2011 election makes for an interesting casestudy of issue salience.
Issue importance was addressed in two ways in the 2011 SES. In thepre-election survey, we asked respondents about the most importantproblems facing first Scotland and then the UK. Analysis of thoseresults follows in the next chapter, in the multi-level context of theelection. Here, we focus on a question from the post-election surveythat asks more directly about electoral salience. Respondents offered abroad range of answers in explaining what they regarded as the singlemost important issue in deciding how they had voted in response toan open-ended question: ‘What was the single most important issue foryou when deciding how to vote in the Scottish Parliament election?’[emphasis in the original question]. This was an open-ended questionand, as we shall see, respondents took advantage of the full rein thisgave them to say whatever was on their mind. Digesting this richvariety of responses requires us to code them into categories. Table 4.4compares the answers given in 2011 with those given in 2007 usingthe same coding scheme developed for the previous election. In the
Table 4.4 Open-ended ‘most important issue’ responses, 2007 and 2011
2007%
2011%
Change2007–2011
Constitutional question 26 15 −11Council tax 9 3 −6Health 7 2 −5Crime 7 2 −5Education 6 4 −2Economy 6 33 +27Defence/military 5 1 −4Environment/energy 3 0 −3Others 31 39 +8Other specific issues 7Parties – general 13Government record 5Scottish interests 10Leaders 3Local candidate 2N 916 1134
Source: Post-election surveys, 2007 and 2011.
10.1057/9781137023704 - More Scottish than British, Christopher Carman, Robert Johns and James Mitchell
Co
pyr
igh
t m
ater
ial f
rom
ww
w.p
alg
rave
con
nec
t.co
m -
lice
nse
d t
o U
niv
ersi
ty o
f S
ydn
ey -
Pal
gra
veC
on
nec
t -
2014
-08-
27

88 More Scottish than British
upper rows we present a comparison based on the issues mentionedmost often across the two elections. Non-responses such as ‘don’tknow’ or ‘none’ are omitted from the analysis.1
The pattern is clear. Not only was the economy far more salientin 2011 than it had been in 2007 but it gained importance at theexpense of all other issues. Some of these, like the environmentand Britain’s military action in Iraq and Afghanistan, slipped almostcompletely off the electorate’s agenda. The constitutional questionremained important relative to other issues – as in 2007, it was men-tioned more often than health, education and crime combined butnow fewer than one in six voters described it as the key driver oftheir choice, compared to one in three citing the broad categoryof the economy. Whether we are able to conclude from this ques-tion that independence was less important to voters in 2011 thanin 2007 depends on whether we are referring to relative or abso-lute importance: that is, whether salience is regarded as a zero-sumgame whereby, given a limited amount of public attention, greatlyheightened concern with one issue inevitably means that others falldown the agenda or if the public’s attention can expand, allowingsome issues to gain in importance while others retain their posi-tion. While that difficult question is well beyond this book (but seeWlezien, 2005), we can at least say that a party seen as strong on theeconomy but more vulnerable on the constitutional question would,other things remaining the same, fare better in the 2011 than in the2007 election.
Aside from the economy, the only other category that grew inimportance in 2011 was the clustering of ‘Other’ responses. It isworth examining this category in more detail, partly because of itssize – accounting for almost 40 per cent of all responses – but alsobecause it is less heterogeneous than might be thought. What isstriking about these ‘Other’ responses is that only a relatively smallproportion (less than 20 per cent of the ‘Other’ category and henceonly 7 per cent of responses overall) referred to specific issues in theway envisaged by those designing the ‘most important issue’ ques-tion (see Wlezien 2005). Many gave responses with no content otherthan the mention of parties or leaders and many more gave whatmight be called ‘general valence’ responses, either commenting onthe government’s record or on their chosen party’s capacity to pro-mote or protect Scottish interests. Many of these ‘Other’ responses
10.1057/9781137023704 - More Scottish than British, Christopher Carman, Robert Johns and James Mitchell
Co
pyr
igh
t m
ater
ial f
rom
ww
w.p
alg
rave
con
nec
t.co
m -
lice
nse
d t
o U
niv
ersi
ty o
f S
ydn
ey -
Pal
gra
veC
on
nec
t -
2014
-08-
27
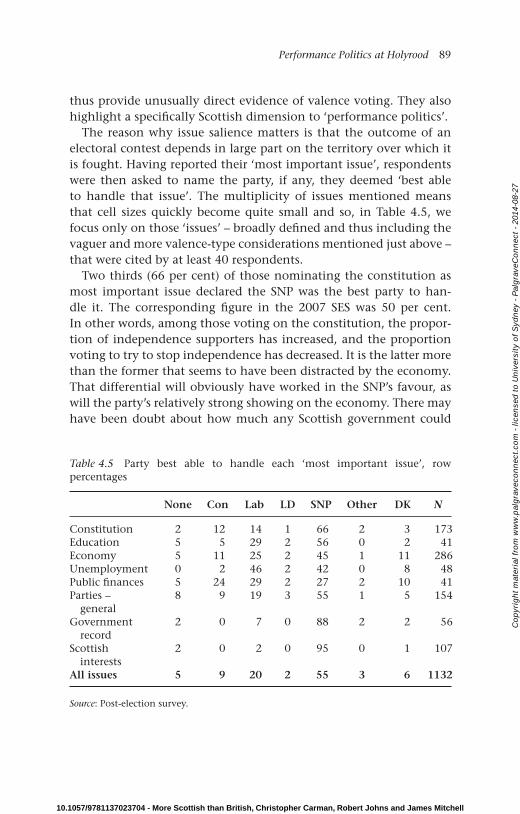
Performance Politics at Holyrood 89
thus provide unusually direct evidence of valence voting. They alsohighlight a specifically Scottish dimension to ‘performance politics’.
The reason why issue salience matters is that the outcome of anelectoral contest depends in large part on the territory over which itis fought. Having reported their ‘most important issue’, respondentswere then asked to name the party, if any, they deemed ‘best ableto handle that issue’. The multiplicity of issues mentioned meansthat cell sizes quickly become quite small and so, in Table 4.5, wefocus only on those ‘issues’ – broadly defined and thus including thevaguer and more valence-type considerations mentioned just above –that were cited by at least 40 respondents.
Two thirds (66 per cent) of those nominating the constitution asmost important issue declared the SNP was the best party to han-dle it. The corresponding figure in the 2007 SES was 50 per cent.In other words, among those voting on the constitution, the propor-tion of independence supporters has increased, and the proportionvoting to try to stop independence has decreased. It is the latter morethan the former that seems to have been distracted by the economy.That differential will obviously have worked in the SNP’s favour, aswill the party’s relatively strong showing on the economy. There mayhave been doubt about how much any Scottish government could
Table 4.5 Party best able to handle each ‘most important issue’, rowpercentages
None Con Lab LD SNP Other DK N
Constitution 2 12 14 1 66 2 3 173Education 5 5 29 2 56 0 2 41Economy 5 11 25 2 45 1 11 286Unemployment 0 2 46 2 42 0 8 48Public finances 5 24 29 2 27 2 10 41Parties –
general8 9 19 3 55 1 5 154
Governmentrecord
2 0 7 0 88 2 2 56
Scottishinterests
2 0 2 0 95 0 1 107
All issues 5 9 20 2 55 3 6 1132
Source: Post-election survey.
10.1057/9781137023704 - More Scottish than British, Christopher Carman, Robert Johns and James Mitchell
Co
pyr
igh
t m
ater
ial f
rom
ww
w.p
alg
rave
con
nec
t.co
m -
lice
nse
d t
o U
niv
ersi
ty o
f S
ydn
ey -
Pal
gra
veC
on
nec
t -
2014
-08-
27

90 More Scottish than British
do to influence macro-economic outcomes but, of the alternatives foroffice, the SNP was clearly the plurality preference. This is consistentwith the earlier results on attributions of responsibility (Table 4.3),which showed that the Scottish government tended to receive creditbut avoid blame for changes in living standards. The SNP-Labourbattle was a lot closer on more specific economic matters like unem-ployment and the public finances.2 However, given that these aretraditional Labour strengths and, in the case of protecting the pub-lic sector, also major campaign themes in 2011, the lack of anysignificant advantage over the SNP is notable. Education, anotherof Labour’s chosen battlegrounds, was an issue on which the SNPenjoyed a large lead. In short, it is hard to identify an SNP weak pointin Table 4.5. The party may have been vulnerable on other issues, likelaw and order, but these were not high enough on voters’ agenda tocause serious problems in 2011.
But the most obvious advantage for the SNP lies not with specificissues but on the more general valence criteria in the lower rowsof the table. The ‘best party to handle’ follow-up question becomesalmost superfluous when the reported ‘most important issue’ is sim-ply the approval of a party, its record or its commitment to Scottishinterests. The key point here is that, in the large majority of cases,that party was the SNP. Virtually no one commented adversely on theSNP government’s record. There were many more ‘keep Labour out’than ‘get the SNP out’ responses and the SNP had a monopoly in the‘Scottish interests’ category. All of this reinforces our argument thatpositive evaluations of the SNP were based more on general impres-sions of competence and commitment to Scottish interests than ontheir record or policies on specific issues. A final point to note isthat, especially in a post-election survey, the ‘party best to handle’responses are inevitably prone to rationalization. It might seem per-verse to choose a different party from the one voted for just a dayor so before. Yet the proportions in the final ‘All issues’ row do notsimply replicate the vote shares. Clearly, some people voted for otherparties, perhaps out of loyalty, fear of independence or for some otherreason despite having nominated the SNP as best able to handletheir agenda-topping issue. This echoes the persistent finding fromChapter 3: the election outcome reflected the partial cancelling of theSNP’s disadvantage in terms of longstanding predispositions and itsmajor advantage in terms of short-term popularity and competence.
10.1057/9781137023704 - More Scottish than British, Christopher Carman, Robert Johns and James Mitchell
Co
pyr
igh
t m
ater
ial f
rom
ww
w.p
alg
rave
con
nec
t.co
m -
lice
nse
d t
o U
niv
ersi
ty o
f S
ydn
ey -
Pal
gra
veC
on
nec
t -
2014
-08-
27

Performance Politics at Holyrood 91
Issues, policies and performance
So far, in discussing valence politics, we have used the term to referto voters choosing the party they see as generally most competent.Yet the term ‘valence’ originated as a description for particular issues(Stokes 1963, 1992): that is, those on which voters and parties sharethe same objectives, and so issue competition revolves around whichparty is likeliest to achieve them. The quintessential example is eco-nomic prosperity: everyone wants it but the question is which partywill deliver it. Valence issues are to be distinguished from positionissues, on which voters, and potentially parties, take different posi-tions and have different policy preferences. A prominent positionissue at the 2007 Scottish Parliament election (see Table 4.4) was thatof whether the council tax should be retained (as argued by Labourand the Conservatives) or replaced by a local income tax (favouredby the SNP and the Liberal Democrats).
The distinction is useful but is overdrawn if used to classify entirepolicy areas as valence or position (Stokes 1963: 373). Any issue hasboth valence and positional components, because even with sharedobjectives there is considerable potential to disagree about the poli-cies necessary to achieve them. The recession overshadowing recentelections provides a good example. Some argue that the route togrowth is fiscal retrenchment in order to assuage market fears, keepinterest rates low and tackle debt. Others favour a more expansionaryfiscal policy in order to boost employment and increase the ratio oftax revenue to benefit expenditure. As Table 4.6 shows, the Scottishelectorate was divided on that question and on several other policyissues that were at stake in the 2011 election.3 The electorate mightbe unified in its wish for lower crime, improved health provisionand so on, but they do not agree about the best means of achievingthose ends. Even if the balance of opinion was usually clear – thoughthis was least so on that fiscal policy question – there was always asubstantial minority dissenting from the general view.
Why, then, did most of these issues rarely if ever appear in ‘mostimportant issue’ responses? And why has it become customary inBritish electoral studies to characterize domains like law and order,education and health as valence issues (e.g. Clarke et al. 2004, 2009)?One reason is summarized by Fiorina quoted in the opening sentenceof this chapter. In essence, voters eschew policy detail and focus on
10.1057/9781137023704 - More Scottish than British, Christopher Carman, Robert Johns and James Mitchell
Co
pyr
igh
t m
ater
ial f
rom
ww
w.p
alg
rave
con
nec
t.co
m -
lice
nse
d t
o U
niv
ersi
ty o
f S
ydn
ey -
Pal
gra
veC
on
nec
t -
2014
-08-
27

92 More Scottish than British
Table 4.6 Distribution of voters’ opinions on six policy issues
Agree Neither Disagree N
For less serious offences, shorter,community sentences should replaceimprisonment
55 15 30 1973
Free medical prescriptions for all shouldbe abolished
31 11 57 1996
The Scottish government should makemore use of tax varying powers toraise revenue
50 23 27 1871
Mandatory prison sentences for anyonefound carrying a knife should be usedto cut down on knife crime
67 13 20 1984
University students should contribute tothe costs of their education aftergraduation
56 15 29 1986
In the current economic climate, thegovernment should maintain the sizeof the public sector
46 20 34 1901
Source: Pre-election survey.
broad outcomes. But, as the example of local taxation in 2007 makesclear, a divisive issue made prominent by a party and media will reg-ister with significant numbers of voters. The other key reason forthe dominance of valence competition in the 2011 election is thelack of positional differences between the parties. However stronglya voter feels on a policy issue, it cannot determine their vote if theyare choosing between parties with the same position on that issue(see Butler and Stokes 1974: 276–295). Returning to the example offiscal policy, it is instructive to compare 2011 with the UK generalelection the previous year. The two leading contenders in the gen-eral election, the Conservatives and Labour, took a different viewon the final statement in Table 4.6, giving this highly salient issuethe potential to shape voting behaviour. In the 2011 election, how-ever, Labour and the SNP and, for that matter, the Liberal Democratswere hard to separate on fiscal policy. Only the Conservatives devi-ated from the consensus against cuts. As a result, only the choices ofthose willing to contemplate a Conservative vote, a small proportionof the Scottish electorate, could be influenced by the debt reduction
10.1057/9781137023704 - More Scottish than British, Christopher Carman, Robert Johns and James Mitchell
Co
pyr
igh
t m
ater
ial f
rom
ww
w.p
alg
rave
con
nec
t.co
m -
lice
nse
d t
o U
niv
ersi
ty o
f S
ydn
ey -
Pal
gra
veC
on
nec
t -
2014
-08-
27

Performance Politics at Holyrood 93
issue. The rest had to find another basis for choosing between theremaining options.
This is borne out by evidence from the 2011 SES. Respondentswere asked to locate the parties on two 0–10 issue placement scales:from ‘cut taxes a lot and spend much less on public services’ to‘raise taxes a lot and spend much more on public services’; and from‘abolishing the Scottish Parliament and returning to pre-devolutionarrangements’ to ‘independence for Scotland’. Figure 4.1 shows thedistribution of voters’ self-placements and also their mean place-ments of the four main parties for each statement. The two graphsare in sharp contrast. In the tax-spending case, three of the fourmain parties, including the main two contenders, were clusteredclosely together. Only the Conservatives were seen as offering any-thing remotely distinctive on that dimension. Because many voterswere also located at or near the middle point of the scale, it makessense from the parties’ point of view to position themselves in thesame area. While the tax-spending issue was very prominent in the2011 campaign, albeit often in the context of Westminster’s budgetdecisions, there was little scope for policy voting in that domain.Self-placements on the constitutional issue range more widely thanthose on taxes and spending, with large minorities in both extremepositions, but the more striking polarization is among the politicalparties, which between them cover almost the entire scale ratherthan huddling in the middle. This means that there is more scope forconstitutional preferences to drive voting behaviour, and Table 4.4suggests that this happened.
The proximity of Labour and the SNP in Figure 4.1(i) is an illus-tration of the ideological convergence that has characterized Scottishpolitics over many years, especially now that Labour and the SNPare clearly the dominant forces. The two have traditionally had sim-ilar policies and adjacent stances on the left-right spectrum and theSNP eventually followed Labour in its move to the right in the 1990s.Thus, at each of the Scottish Parliament elections so far, voters’ left-right position proved not to be a significant predictor of choicebetween the two parties (Paterson et al. 2001: chs. 4, 8; Paterson2006; Johns et al. 2010, ch. 10). The only appreciable ideological dif-ference remains the gap between these parties and the Conservativeswho, as indicated in Figure 4.1(i), are perceived to have maintained acentre-right position (Bennie et al. 1997; Paterson 2006).
10.1057/9781137023704 - More Scottish than British, Christopher Carman, Robert Johns and James Mitchell
Co
pyr
igh
t m
ater
ial f
rom
ww
w.p
alg
rave
con
nec
t.co
m -
lice
nse
d t
o U
niv
ersi
ty o
f S
ydn
ey -
Pal
gra
veC
on
nec
t -
2014
-08-
27

94
0
5
10
15
20
25
30
35
0 1 2 3 4 5 6 7 8 9 10
Per
cen
t o
f re
spo
nd
ents
Cut IncreasePosition on tax/spending
ii) Constitution
i) Taxes and spending
0
5
10
15
20
25
30
35
0 1 2 3 4 5 6 7 8 9 10
Per
cen
t o
f re
spo
nd
ents
Abolish SP IndependencePosition on constitution
SNP Lib Dems Labour Conservatives
Figure 4.1 Voter self-placements and mean party placements on two issuescalesSource: Pre-election survey.
10.1057/9781137023704 - More Scottish than British, Christopher Carman, Robert Johns and James Mitchell
Co
pyr
igh
t m
ater
ial f
rom
ww
w.p
alg
rave
con
nec
t.co
m -
lice
nse
d t
o U
niv
ersi
ty o
f S
ydn
ey -
Pal
gra
veC
on
nec
t -
2014
-08-
27

Performance Politics at Holyrood 95
In addition to the issue placement scales, 2011 SES respondentswere asked, ‘Considering everything that the SNP and the Labourparty stand for, how much difference would you say there is betweenthem?’ Most voters acknowledged at least some difference betweenthe two main parties: 52 per cent choosing either ‘a great deal’ or‘quite a lot’. What we have seen suggests that these responses aredriven largely by positions on the central question of the consti-tution. Some indirect evidence supporting that suggestion comesfrom a comparison with the 2007 survey in which the equivalentpercentage was 68 per cent. This is not because the parties have con-verged on the constitutional question but instead reflects the salienceshifts observed in Table 4.4. The most important issues in 2011 wereeconomic matters on which Labour and the SNP did not advocatesignificantly different policies or approaches, though there were per-ceived differences in levels of competence. The constitutional issue,however, which really divides the parties, was less prominent invoters’ thinking.
This is not to say that matters of tax and spending were irrelevantin the 2011 election. However, in the absence of broad policy dif-ferences between the main parties, the valence aspects of an issue –that is, which party will handle it best – come to the fore. What itmeans to ‘handle’ an issue depends on the context and, in partic-ular, on the extent to which the Scottish government is perceivedas making policy itself or as reacting to policies made by the UKgovernment. Given the financial regime governing the Scottish gov-ernment, major decisions on revenues and expenditures are takenat Westminster. In valence terms, the Scottish parties in 2011 wouldbe judged first on their capacity to minimize the constraints placedon the Scottish government, and second on their ability to managewithin those constraints. Our characterization of this as a valenceissue is consistent with its treatment by the parties, especially theSNP and Labour, during the campaign. They competed explicitlyon the question of who would best defend Scotland against theexpenditure-cutting agenda of the UK’s coalition government.
The upper panel of Table 4.7 shows results to a question ask-ing about the effectiveness of the different parties in managing theimpact of cuts from Westminster. Labour was given some credit for itsability to defend Scotland against the impact of the UK government’scuts: 48 per cent of respondents expected the party to be ‘very’ or
10.1057/9781137023704 - More Scottish than British, Christopher Carman, Robert Johns and James Mitchell
Co
pyr
igh
t m
ater
ial f
rom
ww
w.p
alg
rave
con
nec
t.co
m -
lice
nse
d t
o U
niv
ersi
ty o
f S
ydn
ey -
Pal
gra
veC
on
nec
t -
2014
-08-
27

96 More Scottish than British
Table 4.7 Perception of parties’ commitment to defending (i) Scotlandagainst the cuts; (ii) Scottish interests in general
Con%
Lab%
Lib Dem%
SNP%
i) Managing impact of cutsVery effective 7 10 2 18Fairly effective 24 38 20 46Not very effective 31 30 40 22Not at all effective 38 21 38 14N 1,701 1,704 1,678 1,702
ii) Look after Scottish interestsVery closely 3 9 2 58Fairly closely 15 45 30 32Not very closely 36 31 43 6Not at all closely 47 15 24 3
2011Mean 1.7 2.5 2.1 3.5N 1,529 1,536 1,492 1,574
2007Mean 2.0 2.4 2.5 3.0N 1,353 1,377 1,333 1,353
iii) Correlation between i) and ii)Kendall’s tau-c 0.47 0.44 0.37 0.37N 1383 1390 1352 1408
Sources: 2011 pre- and post-election surveys; 2007 post-election survey.
‘fairly’ effective in this respect. However, in fighting the campaignon that issue, the party was triumphing only over the Westminstercoalition parties, who were already defeated on this issue. This wasfertile territory for the SNP, which, judging by these data, had suc-cessfully positioned itself as Scotland’s strongest defence against whatwere widely seen as ‘London’s cuts’. If managing the impact of bud-get cuts was a particularly important test of competence in 2011, theSNP passed that test comfortably ahead of its rivals.
A similar story can be told about the second part of the table.It reports responses to a more general question about how closely theparties look after Scottish interests. In addition to the distribution ofresponses, mean scores are provided, based on coding the scale from1 (‘not at all closely’) to 4 (‘very closely’), to enable an economicalcomparison with 2007 ratings. Again, Labour outperforms the coali-tion parties on this criterion, but not by the margin it might have
10.1057/9781137023704 - More Scottish than British, Christopher Carman, Robert Johns and James Mitchell
Co
pyr
igh
t m
ater
ial f
rom
ww
w.p
alg
rave
con
nec
t.co
m -
lice
nse
d t
o U
niv
ersi
ty o
f S
ydn
ey -
Pal
gra
veC
on
nec
t -
2014
-08-
27

Performance Politics at Holyrood 97
hoped for and with little sign of improvement from 2007: Labour’smean score lifted only from 2.4 to 2.5 (the middle point of the scale).This undermines any ideas that the key to Labour’s rating is whetherthey are in power at Westminster. It suggests that Labour needs morethan the election of a Conservative-led government in London inorder to regain its reputation for defending Scotland. Unsurprisingly,given the results on the ‘standing up for Scotland’ party image ques-tion (see Table 3.4), by far the strongest ‘Scottish interest’ ratings werefor the SNP. Not only that but it was the SNP that gained significantground between 2007 and 2011. It is hard to say whether the SNP’simproved reputation is due to events at Westminster, to their recordin office at Holyrood or both. In any case, to the extent that the 2011election was about who would defend Scottish interests, it was theSNP that stood to gain.
In the final rows of the table, we report the correlation between thetwo ratings for each party: on defending Scotland against the cuts andon general concern for Scottish interests. Not surprisingly, all of thecorrelations are positive and fairly strong. They key point for presentpurposes, however, is that they are not very strong. Some voters mayinfer the specific issue stance from the general commitment (and oth-ers do the reverse), these are distinct evaluations and thus each hadthe potential to influence voting behaviour in 2011. Analysis of the2007 survey shows that the general Scottish interests ratings were apowerful influence over party choice in that election (Johns et al.2010, ch. 10), and there is no reason to suppose that things havechanged in 2011. Yet, even taking these ratings into account, ourprediction of party choice may be further improved by knowing howvoters rate the parties on the specific matter of ‘defending Scotlandagainst the cuts’. We test that hypothesis via the full vote models inthe final chapter.
The constitutional issue in 2011
No one should doubt the enduring prominence of the constitu-tional question in Scottish politics. In particular, it might be assumedthat both support for and opposition to the SNP is driven largelyby constitutional preferences. Supporters of independence continueto comprise the SNP’s core vote, and the ‘most important issue’responses confirm that part of the electorate votes against the SNP
10.1057/9781137023704 - More Scottish than British, Christopher Carman, Robert Johns and James Mitchell
Co
pyr
igh
t m
ater
ial f
rom
ww
w.p
alg
rave
con
nec
t.co
m -
lice
nse
d t
o U
niv
ersi
ty o
f S
ydn
ey -
Pal
gra
veC
on
nec
t -
2014
-08-
27

98 More Scottish than British
with the aim of preventing independence. However, there are twoimportant points to note about those who vote primarily on the con-stitutional issue. First, they are clearly in the minority. Secondly, theirvotes are quite predictable, such that their behaviour cannot explainthe kind of swings in vote shares seen in Scottish Parliament electionssince 1999. In particular, there are compelling reasons to believe thatthe constitutional issue contributed only minimally to explaining thesurge in SNP support between 2007 and 2011 that gave the party itsmajority.
One reason was shown in Table 4.4: the constitution was a lesssalient issue in 2011 than at the previous election. As the economygrew in importance at this election, it is the more likely source of theSNP’s electoral advance. The declining salience of the constitutionalissue might be seen as a consequence not only of the economic con-text but also of the SNP’s campaigning, which, since devolution, hasnot centred on independence but emphasizes the party’s governingcompetence. The success of this strategy is indicated by responses toSES question: ‘How do you think that the return of an SNP minor-ity government would affect the likelihood of independence?’ Only7 per cent of respondents thought that independence was ‘muchmore likely’ with the return of an SNP minority government and thelargest group (42 per cent) thought that it would ‘make no difference’.What might have once been a major deterrent to voting SNP, thefear of independence, is now less of a source of anxiety and concernwithin the electorate. By easing concerns about the constitutionalissue, the SNP were able to take fuller advantage of the other factors,such as competence, leadership and image, which are the more likelysources of its advance in 2011.
But the clearest evidence that the constitution did not drive the2011 outcome comes from the stability of constitutional preferencesthemselves. Table 4.8 presents two measures of constitutional pref-erences. The first is a simplified version of a long-running Scottishsurvey question, which offers respondents five options ranging fromabolition of the Scottish Parliament to independence outside theEuropean Union.4 This question has the particular advantage oflongevity, enabling comparison across time. However, it is supple-mented by a newer question that more closely reflects current debateon the issue. This question is in the form of a hypothetical refer-endum vote with three options: the status quo (‘Keep the Scottish
10.1057/9781137023704 - More Scottish than British, Christopher Carman, Robert Johns and James Mitchell
Co
pyr
igh
t m
ater
ial f
rom
ww
w.p
alg
rave
con
nec
t.co
m -
lice
nse
d t
o U
niv
ersi
ty o
f S
ydn
ey -
Pal
gra
veC
on
nec
t -
2014
-08-
27

Performance Politics at Holyrood 99
Table 4.8 Two measures of constitutional preference at Scottish electionssince 1999
1999%
2003%
2007%
2011%
Five-option questionIndependence (in or out of EU) 28 28 25 26Devolution (with or without tax powers) 62 59 65 63No Parliament 9 14 10 11N 1482 1508 1508 1854
Three-option referendumIndependence − − 24 24More powers − − 43 38Status quo − − 33 38N 1330 1558SNP % regional vote 27 21 31 44
Sources: Scottish Social Attitudes 1999–2007; SES 2007 post-election survey; SES 2011 pre-and post-election surveys.
Parliament with its existing powers’), further devolution (‘Give theScottish Parliament power over all domestic matters including taxesand spending’), and independence (‘Make Scotland an independentstate within the European Union’). This question was asked in 2007and 2011 but, in the earlier version, the middle option was morevaguely worded as ‘Keep the Scottish Parliament but give it greaterpowers’ while in the 2011 version fiscal control was mentionedexplicitly. By 2011 fiscal autonomy had become a more central partof elite political debates (though whether these debates were appre-ciated by the public is unclear) and may explain why ‘more powers’lost support to the ‘status quo’ option between the two elections.However, it is clear that, regardless of the measure used, support forindependence barely changed between 2007 and 2011 and indeedsince devolution (see Curtice et al. 2009: 57–59). This becomes evenclearer when we also consider the SNP’s share of the regional listvote at each election. The stasis in support for independence com-pared with the large fluctuations in vote shares shows clearly that theformer cannot explain the latter.
There is no paradox in the fact that SNP support has more thandoubled between 2003 and 2011 while support for independence hasflatlined. It simply means that other factors drove the party’s vote
10.1057/9781137023704 - More Scottish than British, Christopher Carman, Robert Johns and James Mitchell
Co
pyr
igh
t m
ater
ial f
rom
ww
w.p
alg
rave
con
nec
t.co
m -
lice
nse
d t
o U
niv
ersi
ty o
f S
ydn
ey -
Pal
gra
veC
on
nec
t -
2014
-08-
27

100 More Scottish than British
share. That conclusion is consistent with evidence, accumulated froma series of surveys of the Scottish electorate, that constitutional pref-erences are an important influence on party choice but are far fromthe whole story (Paterson et al. 2001: ch. 4; Bromley et al. 2006: ch. 4;Johns et al. 2010: ch. 10). Voters can and do distinguish betweenchoosing Scotland’s government and choosing Scotland’s constitu-tional future. As emphasized in this chapter, the SNP stood to gainfrom voters doing the former because of the positive evaluationsof the SNP’s record in office and scepticism about Labour’s likelyperformance.
Next we use a structural model to test our thesis that the SNP gainsare better explained by perceptions of competence than by consti-tutional preferences. For this, we turn to our panel of respondentswho participated in both the 2007 and the 2011 election surveysin order to investigate the sources of opinion change between thetwo elections. All of the variables in this model have been intro-duced in previous analyses: the five-point national identity scale(see Table 2.4); self-placements on the 0–10 constitutional prefer-ence scale (Figure 4.1(ii)); SNP ratings on the 0–10 like/dislike scale(Table 3.3); and SNP competence evaluations via the assessment of itsperformance in office (Table 4.1).5 Figure 4.2 presents the core resultsfrom estimating this model with the arrows being labelled with stan-dardized path coefficients (betas or ‘β’s). A bold arrow indicates thatthat coefficient is statistically significantly different from zero.
.39
.36 .58
.51
.09
.18
.15
–.03
.00
.00 .72
–.38
–.49
.01
.00
.29
.69
2007 SNPlike
2011 SNPCompetence
2011 SNPlike
2011 Constpref
2007 Constpref
.00
2007National ID
Figure 4.2 Structural model predicting attitudes to the SNP in 2011 (N = 559)Source: SES panel (pre-election surveys), 2007–2011.
10.1057/9781137023704 - More Scottish than British, Christopher Carman, Robert Johns and James Mitchell
Co
pyr
igh
t m
ater
ial f
rom
ww
w.p
alg
rave
con
nec
t.co
m -
lice
nse
d t
o U
niv
ersi
ty o
f S
ydn
ey -
Pal
gra
veC
on
nec
t -
2014
-08-
27

Performance Politics at Holyrood 101
The 2007 variables serve as baselines for analysis. Not surprisingly,voters’ attitudes to the SNP in 2007 were strongly influenced by theirnational identity and their constitutional preferences. Equally pre-dictable is that those who liked the SNP in 2007 were, other thingsbeing equal, more likely to like the SNP in 2011 (β = 0.39) and thatconstitutional preference in 2007 was a powerful predictor of con-stitutional preference in 2011 (β = 0.51). The latter result furtherattests to the stability of constitutional attitudes between 2007 and2011. More noteworthy is the fact that, once these 2007 variablesare taken into account, constitutional preferences in 2011 have nosignificant influence on attitudes to the SNP in 2011. Voters werenot won over to the SNP by its flagship policy of independence.Instead, the big driver of change in attitudes towards the SNP, thatis, by far the most powerful influence once prior (2007) attitudesto the party are taken into account, was the competence evalua-tion (β = 0.58). Assessments of the SNP’s record were themselvesinfluenced by predispositions to like the party (β = 0.36) and tosupport its constitutional policy (β = 0.15), but these are influencesand not determinants. Perceptions of the government’s performancewere formed to a considerable extent independently of prior SNP orindependence sympathies, but then became a powerful influence onsubsequent attitudes to the SNP.
As respondents’ views on the constitutional question in 2011 werenot perfectly predicted by respondents’ views on the issue four yearsearlier, it is worth considering what else influenced the later pref-erences. It might have been thought that competence evaluationswould have an impact: the stronger the performance of the Scottishgovernment, the more likely voters would be to support indepen-dence or, at least, further devolution. There is some sign of a directeffect of competence on constitutional preferences but, at β = 0.09,it does not quite reach statistical significance. However, there is alsoan indirect effect of competence via attitudes to the SNP. Positiveassessments of the government’s performance generate support forthe SNP and, in turn, boost support for its constitutional policy.The point should not be overstated: the indirect effect of compe-tence on constitutional preferences amounts to the product of thetwo effects (0.58×0.18 = 0.10) and, as such, is barely stronger thanthe direct effect. Nonetheless, this indirect effect highlights an inter-esting possibility, namely that it is not so much competent Scottish
10.1057/9781137023704 - More Scottish than British, Christopher Carman, Robert Johns and James Mitchell
Co
pyr
igh
t m
ater
ial f
rom
ww
w.p
alg
rave
con
nec
t.co
m -
lice
nse
d t
o U
niv
ersi
ty o
f S
ydn
ey -
Pal
gra
veC
on
nec
t -
2014
-08-
27

102 More Scottish than British
government in general but competent SNP government that makespeople more willing to support constitutional change.
All of this highlights one link between ‘performance politics’ andthe constitutional issue. Constitutional preferences themselves havea valence dimension: that is, voters endorse the option that theydeem most likely to deliver the desired outcomes. This was madeclear as early as the 1997 devolution referendum (Brown et al. 1999,ch. 6; Denver et al. 2000: 159–168; see also Surridge 2006). Brownet al. summarize the point: ‘Scots do not distinguish fundamentallybetween judging the effectiveness of policy and assessing the ade-quacy of the constitutional framework through which policy is made’(1999: 162). This echoes Fiorina’s remark with which we openedthis chapter. The constitutional issue is not so distinct from oth-ers. Though a minority of voters have strong views on constitutionalpolitics, most simply care about what works.
There is another link between constitutional preferences and thespecifically Scottish version of ‘performance politics’ that has beenoutlined in this chapter. The constitutional positions of interest hereare not those of voters but those of the parties. We have emphasizedthe importance for parties of being seen to look after Scottish inter-ests. It might reasonably be asked how voters determine whethera party ‘looks after Scottish interests’. One means of judging thismight be the parties’ constitutional stances. Most agreed that theConservatives’ unpopularity in Scotland since the 1980s derived inpart from opposition to devolution, not just because the majorityof voters disagreed, but because it made the Conservatives appearanti-Scottish (Mitchell 1990; Brown et al. 1999: 89–90). Evidencefrom the 2007 SES indicated that Labour’s perceived opposition tofurther devolution led voters to doubt the party’s commitment toScottish interests (Johns et al. 2010: 119–121). Here, we replicate thatanalysis using the 2011 data, calculating correlations between vot-ers’ placement of each party on the 0–10 constitution issue scalewith their ratings of that party on Scottish interests. Positive corre-lations support the hypothesis that a party’s willingness to supportfurther devolution persuades voters of its concern for Scottish inter-ests. In Table 4.9 the coefficients are shown for the full samples in2007 and 2011, and then for each category of constitutional pref-erence in 2011 as measured by the referendum question. We alsoshow the mean placements of the parties in 2007 and 2011, useful
10.1057/9781137023704 - More Scottish than British, Christopher Carman, Robert Johns and James Mitchell
Co
pyr
igh
t m
ater
ial f
rom
ww
w.p
alg
rave
con
nec
t.co
m -
lice
nse
d t
o U
niv
ersi
ty o
f S
ydn
ey -
Pal
gra
veC
on
nec
t -
2014
-08-
27

Performance Politics at Holyrood 103
Table 4.9 Perceived constitutional stances and correlations with perceivedcommitment to Scottish interests, 2007 and 2011
Conservative Labour LibDems
SNP N(min.)
Mean placement on constitution scale2011 2.4 4.3 3.9 9.2 16182007 2.8 4.4 4.8 9.1 1479
Correlation with Scottish interests ratingAll voters – 2011 0.28 0.19 0.27 0.20 1301All voters – 2007 0.09 0.19 0.19 0.16 1333Status quo 2011 0.22 0.04 0.13 0.12 428More powers 2011 0.28 0.21 0.37 0.12 455Independence 2011 0.31 0.25 0.28 0.33 323
Note: The only correlation not significant at the p <0.05 level is italicized.Sources: Pre-and post-election surveys.
contextual information given the argument that these perceptionsare a means for judging commitment to Scottish interests.
Looking first at the results for all voters, we see that the corre-lations are all positive and statistically significant. Moreover, theyare generally stronger in 2011 than in 2007, indicating that consti-tutional preferences have if anything become a more useful or, atleast, a more widely used cue. This strengthening is clearest in thecase of the two Westminster coalition parties, which is bad news forboth as both were seen as having shifted their constitutional posi-tion towards the anti-devolution end of the scale (and thus awayfrom the median voter’s position on this issue). Labour got off morelightly but still suffered from voters’ tendency to doubt its commit-ment to Scottish interests based on what they perceived as the party’scontinuing opposition to further devolution.
The breakdown by respondents’ own constitutional preferences isinstructive. It is not surprising that the correlations are generallystrongest among those who themselves favour independence: thisis naturally the group most likely to respond positively to partiesthat support substantial constitutional change. More telling are thepositive correlations among the larger group favouring ‘more pow-ers’, and the indications of at least some positive correlations amongthose favouring the status quo. In other words, voters do not haveto share a party’s support for further devolution or independence in
10.1057/9781137023704 - More Scottish than British, Christopher Carman, Robert Johns and James Mitchell
Co
pyr
igh
t m
ater
ial f
rom
ww
w.p
alg
rave
con
nec
t.co
m -
lice
nse
d t
o U
niv
ersi
ty o
f S
ydn
ey -
Pal
gra
veC
on
nec
t -
2014
-08-
27

104 More Scottish than British
order to give it credit for that stance if supporting further devolutionor independence is seen as an indication of supporting Scottish inter-ests even among opponents of these constitutional options. Thismay help explain why the SNP was credited almost universally withconcern for Scottish interests, despite its policy of independenceenjoying only minority support. In a situation where voters do notexpect or particularly fear independence, it is easy to see how theindirect benefits of the party’s constitutional stance could begin tostack up against the costs.
Conclusion
In the search for what is distinctive about Scottish Parliament elec-tions, it is easy to overlook what is normal about them. The 2011election was first and foremost about electing a party to governScotland. Even if a parliamentary majority for any party seemedhighly unlikely, both of the leading contenders were perceived tobe competing against each other for government office. Polls sug-gested that the electorate largely saw a choice between re-electingthe SNP and replacing them with Labour. Our central argument inthis chapter is that this choice helped the SNP for that most normalof reasons: most voters thought that the SNP was more competent togovern than its competitors, including its leading rival, the LabourParty. To explain the outcome of an election in one or two statisticsis inevitably a crass exercise but the contrasting performance evalu-ations in Table 4.1 are a good place to start. To that extent, this is astraightforward case of ‘performance politics’.
In concluding this chapter, we want to highlight a reason for thepositive assessments of the SNP’s term in office. The starting pointis a contrast with 2007. At that election, voters were underwhelmedby Labour and had a relatively positive impression of the SNP andits leader. One reason for the very close race was that, because theSNP had no experience of government, voters were doubtful aboutthe party’s likely performance in government. Tabloid front pageson polling day in 2007 sought to play on such doubts, sketchingapocalyptic scenarios in the event of an SNP victory, and manycommentators expected the party’s first experience of governmentto come to an abrupt end long before 2011. Since then, of course,
10.1057/9781137023704 - More Scottish than British, Christopher Carman, Robert Johns and James Mitchell
Co
pyr
igh
t m
ater
ial f
rom
ww
w.p
alg
rave
con
nec
t.co
m -
lice
nse
d t
o U
niv
ersi
ty o
f S
ydn
ey -
Pal
gra
veC
on
nec
t -
2014
-08-
27

Performance Politics at Holyrood 105
much of the uncertainty about the SNP as a party of government hasdissipated.
This notion of the SNP easing voters’ doubts is particularly appli-cable to the constitutional issue. Principally via its commitment to areferendum, the party sought to reassure voters that the election of anSNP government would not lead inevitably to independence. On thecontrary, during the 2007–2011 term, the SNP focused instead ondeveloping the kind of valence credentials – competence, financialcredibility, strong leadership – that we have argued were crucial toits electoral gains. The SNP’s case for re-election may have been fur-ther helped by the economic crisis, which, for most voters, becamea more immediate concern than the constitutional question. TheSNP appeared competent in government, dealing with the economicand fiscal crisis and the resultant UK government’s strategy of fiscalretrenchment. The second point highlights the specifically Scottishdimension to ‘performance politics’ in this context: prospective gov-ernments are judged by their capacity not just to govern competentlybut to do so in a manner that defends Scotland’s interests. Of course,none of this is to say that the constitutional question was irrelevantin this election. As we will see in the full models in Chapter 6, itremains quite a powerful predictor of party choice, and there remainsa substantial group of voters who are strongly opposed to indepen-dence and are worried enough at the prospect to vote accordingly,just as there is an element that is strongly in favour of independence.
10.1057/9781137023704 - More Scottish than British, Christopher Carman, Robert Johns and James Mitchell
Co
pyr
igh
t m
ater
ial f
rom
ww
w.p
alg
rave
con
nec
t.co
m -
lice
nse
d t
o U
niv
ersi
ty o
f S
ydn
ey -
Pal
gra
veC
on
nec
t -
2014
-08-
27

5How ‘Scottish’ Was this Election?
From before the first devolved contest in 1999, there have beenconcerns about the extent to which Scottish voters would useHolyrood elections to focus on the stuff of domestic politics, andto hold the Scottish government accountable, rather than to passcomment on the performance of the Westminster government orto express their views on recent or future constitutional change.In the terms introduced in the opening chapter, the question waswhether these were first- or second-order elections (Reif and Schmitt1980). We also noted in Chapter 1 that subsequent work has longsince refined that simple dichotomy, instead positing a continuumfrom purely second order to purely first order. In this context, thesecond-order extreme of that continuum would be a Scottish electionentirely driven by events and personalities at Westminster, while thefirst-order extreme would be one in which politics at the UK levelwas entirely irrelevant and voters chose purely according to whatwas going on at Holyrood. Put simply, the question concerns the‘Scottishness’ of this election.
Borrowing from the scale conventionally used (including inChapter 2 of this book) to measure national identity, Denver andJohns (2010) characterized the 2007 election as ‘More Scottish thanBritish’ – that is, closer to the first- than to the second-order end ofthe continuum sketched above. It was also appreciably more Scottishthan the first two devolved contests. Voting in those elections, asdescribed by Paterson et al. (2001) and Curtice (2006), was consid-erably influenced by evaluations of the UK government but, evenmore so, by attitudes to devolution itself. In both elections, party
106
10.1057/9781137023704 - More Scottish than British, Christopher Carman, Robert Johns and James Mitchell
Co
pyr
igh
t m
ater
ial f
rom
ww
w.p
alg
rave
con
nec
t.co
m -
lice
nse
d t
o U
niv
ersi
ty o
f S
ydn
ey -
Pal
gra
veC
on
nec
t -
2014
-08-
27

How ‘Scottish’ Was this Election? 107
choice reflected above all voters’ attitudes towards the Parliament andtowards the possibility of further constitutional change, and seemedto have rather little to do with goings on at Holyrood.
There is an obvious reason why 2007 was a more Scottish elec-tion. Devolution had had another four years to bed in and so theelected Scottish government was a more familiar, a more power-ful and a more prominent player. For the same reasons, we wouldexpect the 2011 election to be still more Scottish – that is, to fallcloser to the first-order end of the continuum. The impact of theScottish government’s policies and performance on the average voteris strengthening with each election. Moreover, the devolved arena isthe focus of considerable media attention. Coverage such as the tele-vising of First Minister’s Questions is a specific example of a moregeneral commitment to cover Scotland not just as a region with dis-tinctive attitudes and reactions to Westminster politics but as a polityin itself. In sum, devolution has enhanced a Scottish political arenathat, though sharing reciprocal influence with Westminster’s eventsand personalities, is increasingly distinct from the UK political arena.Scottish voters inhabit two political worlds (Blake et al. 1985).
Adopting this notion of two worlds, or two parallel arenas, the rel-evance of the first- to second-order model of elections becomes morequestionable. We have already noted in Chapter 1 that Scotland’ssemi-proportional electoral system and distinct party system thusmake it difficult to assess the ‘order’ of Scottish Parliament elections(Reif and Schmitt 1980). Holyrood and Westminster are not simplytwo alternative arenas in which the same politics are played out. Therules, the players, and above all the relative strength of those playersare all quite different. The SNP did not edge the 2007 election becausethey were a suitable channel for protest voting against Labour’srecord at the UK level. It was because, in a Scottish-only election, theSNP becomes a viable contender for office and was marginally pre-ferred to a Labour-led Scottish government whose record left votersgenerally unimpressed (Johns et al. 2010).
There is another reason why, if we think of Scottish elections astaking place in a distinct political arena, assessing whether these arefirst order, second order or something in between may be to addressthe wrong question. The notion of the ‘order’ of an election gives pri-macy to relative importance – how much voters see at stake in theseelections compared with those to Westminster or to local councils.
10.1057/9781137023704 - More Scottish than British, Christopher Carman, Robert Johns and James Mitchell
Co
pyr
igh
t m
ater
ial f
rom
ww
w.p
alg
rave
con
nec
t.co
m -
lice
nse
d t
o U
niv
ersi
ty o
f S
ydn
ey -
Pal
gra
veC
on
nec
t -
2014
-08-
27

108 More Scottish than British
This question, however, fails to consider that the ‘Scottishness’ ofScottish elections is probably at least as much a function of absoluteimportance. That is, a voter who thought there was much at stake inthe 2011 Scottish election, and therefore cared who won, could beexpected to vote based on Scottish matters. It would not matter thatthere had been a Westminster election in 2010 in which the samevoter believed there was even more at stake. What matters is the sig-nificance attributed by voters to what goes on in the Scottish politicalworld at the time of the Scottish elections.
What voters see at stake in Scottish elections
A first empirical look at this question of perceived importance comesfrom a long-established survey question asking respondents: ‘Howmuch of a difference do you think it makes who wins in elections:(i) to the Scottish Parliament? (ii) to the UK House of Commons?In previous surveys, Westminster elections have been seen as mak-ing slightly more difference than Holyrood elections (Curtice 2006;Johns et al. 2010). By 2011, that gap narrowed so that there was nota significant difference in the perceived relative importance of theelections. In both cases, about half of the respondents (51.5 per centfor Westminster, 50 per cent for Holyrood) declared that the elec-tions in question made ‘a great deal’ of difference. Only 7 per cent ofrespondents (down from 11 per cent in 2007) thought that Scottishelection outcomes made ‘not very much’ or ‘no difference at all’.These results may exaggerate voters’ interest: by asking a long seriesof questions about elections, we make it harder for a respondentto report indifference to their outcomes. Nonetheless, the resultsfrom this question are consistent with our argument that Scottishelections are regarded as important in absolute as well as relativeterms.
This leads to the questions: why do voters think it matters whowins Scottish elections? What do they think is at stake? One answerto these questions lies in voters’ attributions of responsibility: thatis, the extent to which they see the Scottish government as respon-sible for key policy areas. SES respondents were asked: ‘Thinkingabout the Scottish and UK governments, which do you think ismainly responsible for the following issue areas?’ Four areas – lawand order, health, education and the economy – were asked about
10.1057/9781137023704 - More Scottish than British, Christopher Carman, Robert Johns and James Mitchell
Co
pyr
igh
t m
ater
ial f
rom
ww
w.p
alg
rave
con
nec
t.co
m -
lice
nse
d t
o U
niv
ersi
ty o
f S
ydn
ey -
Pal
gra
veC
on
nec
t -
2014
-08-
27

How ‘Scottish’ Was this Election? 109
Table 5.1 Percentage deeming each level ‘mainly responsible’ forkey policy areas, 2007–2011
Scottish UK Don’tknow
N
Law & order 2007 50 39 11 18722011 57 34 9 1756
Health 2007 59 31 10 18722011 68 24 8 1756
Education 2007 70 20 10 18722011 74 18 8 1756
Economy 2007 26 60 14 15522011 10 82 8 1756
Sources: SES 2007 pre- and post-election surveys; SES 2011 post-electionsurvey.
in both the 2007 and 2011 surveys and responses from both yearsare presented in Table 5.1. The results suggest a growing tendencyto attribute responsibility to one or other level of government whilethe proportion of ‘don’t know’ responses fell on each issue. Moresignificantly, in all four cases there was a move towards consensus.On the economy, this meant a substantial proportion believing thatthe UK government was mainly responsible for economic policy.However, with the other three issues, growing proportions believedthat devolution leaves them mainly the province of the governmentin Edinburgh.
Law and order, health and education encompass many of vot-ers’ most pressing everyday concerns. Indeed, as Table 4.4 shows,each had been reported by significant proportions of voters as their‘most important issue’ when deciding how to vote in the 2007 elec-tion. So there is at the very least the potential for voters to seemuch at stake in Scottish elections. However, as the same tableshows, those issues were hugely overshadowed by the economy in2011. If economic responsibility was overwhelmingly attributed tothe UK government, then we might expect 2011 to have reversedthe trend towards ‘first-order’ status for Scottish elections. At firstglance, it looks as if many voters reported basing their choice onan issue they thought the government up for election could do lit-tle about. On this reading, the context of the 2011 election made it
10.1057/9781137023704 - More Scottish than British, Christopher Carman, Robert Johns and James Mitchell
Co
pyr
igh
t m
ater
ial f
rom
ww
w.p
alg
rave
con
nec
t.co
m -
lice
nse
d t
o U
niv
ersi
ty o
f S
ydn
ey -
Pal
gra
veC
on
nec
t -
2014
-08-
27

110 More Scottish than British
a multi-level contest in which the more economically powerful levelwas inevitably dominant.
However, we cannot conclude from Table 5.1 that economic votingin 2011 was inevitably a second-order commentary on developmentsat Westminster. Two aspects of the survey question involved meanthat such a conclusion would be premature. The first, echoing a pointmade earlier, is that it is a relative rather than an absolute measure.Respondents might concede that Westminster is mainly responsiblefor economic policy but nonetheless also see the Scottish governmentas having some responsibility for this. Secondly, there is an importantdistinction between responsibility for policy (or functional respon-sibility) and responsibility for outcomes (or causal responsibility).Governments are functionally responsible for those policy domainsconstitutionally assigned to them; they are causally responsible forthe outcomes that result from their actions (Brickman et al. 1982;Iyengar 1989). Admittedly, this distinction should not be overdrawn.In politics, as Arceneaux (2006: 736) points out, ‘outcomes are oftencomplex and the product of multiple causes. Voters need only believethat government policy could have done more to avert a problemeven if it was caused by something else’. On this reading, a govern-ment could be deemed causally responsible for an outcome if it holdsthe powers – the functional responsibility – to have done somethingabout that outcome. Nonetheless, it is worth considering whethervoters distinguish between policy outcomes and responsibility forthose outcomes.
That may be achieved by returning to the questions initially anal-ysed in Tables 4.2 and 4.3 in the previous chapter. Having reportedtheir assessment of outcomes in four policy areas, respondents wereasked whether this was mainly the result of the policies of theUK government at Westminster, the policies of the Scottish govern-ment, both equally or some other reason. The results are shown inTable 5.2. On each of the four issues, the picture is less clear-cutthan Table 5.1 implies. This is not surprising. Quite apart from thedifficulties in partitioning responsibility between Westminster andHolyrood, both levels are at the mercy of external circumstances:demographic trends, global economic conditions, the choices of pre-vious governments (see Chapter 1 for discussion). The relatively largepercentages of ‘don’t knows’ are therefore unsurprising. Among thosewho did respond, there is a clear and consistent pattern on the firstthree issues. Citizens recognize the Scottish government’s greater
10.1057/9781137023704 - More Scottish than British, Christopher Carman, Robert Johns and James Mitchell
Co
pyr
igh
t m
ater
ial f
rom
ww
w.p
alg
rave
con
nec
t.co
m -
lice
nse
d t
o U
niv
ersi
ty o
f S
ydn
ey -
Pal
gra
veC
on
nec
t -
2014
-08-
27

How ‘Scottish’ Was this Election? 111
Table 5.2 Percentage deeming each level ‘mainly responsible’ for outcomessince 2007
Law andorder%
Health%
Education%
Livingstandards%
Scottish government 38 41 40 21UK government 10 11 9 32Both equally 28 27 22 29Some other reason 5 4 3 7Don’t know 20 17 26 12N 1760 1760 1760 1760
Source: SES 2011 post-election survey.
influence in these devolved areas but many assign at least someresponsibility to the UK government. The considerable proportionsopting for ‘both equally’ might reflect uncertainty or might reflect arecognition that ‘in devolved policy domains’ Holyrood’s scope foraction is influenced by Westminster’s budgetary policies.
There is a similar pattern in reverse on the living stan-dards question. The overall balance of responses reflects the viewthat Westminster is more often deemed responsible though fully50 per cent of respondents assign equal or primary responsibil-ity to Holyrood. This is likely to be at least partly due to theuse of ‘living standards’ rather than ‘the economy’ in the ques-tion. It makes sense that the Scottish government (not least dueto its responsibility for policies that influence public health, educa-tion, welfare and well-being) would have more influence over thebroader matter of living standards than over the economy in particu-lar. Nonetheless, the results suggest that devolved affairs will havecontributed to shaping economic evaluations and expectations in2011. The point is reinforced by a separate question, cast in abso-lute rather than relative terms, asking respondents: ‘How much doyou think the Scottish government’s policies influence the overallperformance of Scotland’s economy?’ Fully 77 per cent of respon-dents (cf 53 per cent in 2007) credited the Scottish government with‘a great deal’ or a ‘fair amount’ of influence, opening up the possi-bility that there was a multi-level dimension not only to voting ingeneral in 2011 but, in particular, to voting on the key issue of theeconomy.
10.1057/9781137023704 - More Scottish than British, Christopher Carman, Robert Johns and James Mitchell
Co
pyr
igh
t m
ater
ial f
rom
ww
w.p
alg
rave
con
nec
t.co
m -
lice
nse
d t
o U
niv
ersi
ty o
f S
ydn
ey -
Pal
gra
veC
on
nec
t -
2014
-08-
27
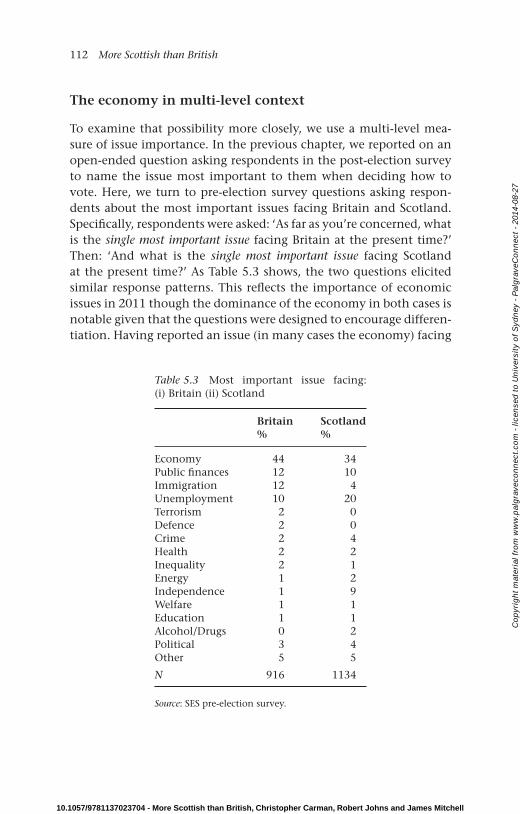
112 More Scottish than British
The economy in multi-level context
To examine that possibility more closely, we use a multi-level mea-sure of issue importance. In the previous chapter, we reported on anopen-ended question asking respondents in the post-election surveyto name the issue most important to them when deciding how tovote. Here, we turn to pre-election survey questions asking respon-dents about the most important issues facing Britain and Scotland.Specifically, respondents were asked: ‘As far as you’re concerned, whatis the single most important issue facing Britain at the present time?’Then: ‘And what is the single most important issue facing Scotlandat the present time?’ As Table 5.3 shows, the two questions elicitedsimilar response patterns. This reflects the importance of economicissues in 2011 though the dominance of the economy in both cases isnotable given that the questions were designed to encourage differen-tiation. Having reported an issue (in many cases the economy) facing
Table 5.3 Most important issue facing:(i) Britain (ii) Scotland
Britain%
Scotland%
Economy 44 34Public finances 12 10Immigration 12 4Unemployment 10 20Terrorism 2 0Defence 2 0Crime 2 4Health 2 2Inequality 2 1Energy 1 2Independence 1 9Welfare 1 1Education 1 1Alcohol/Drugs 0 2Political 3 4Other 5 5
N 916 1134
Source: SES pre-election survey.
10.1057/9781137023704 - More Scottish than British, Christopher Carman, Robert Johns and James Mitchell
Co
pyr
igh
t m
ater
ial f
rom
ww
w.p
alg
rave
con
nec
t.co
m -
lice
nse
d t
o U
niv
ersi
ty o
f S
ydn
ey -
Pal
gra
veC
on
nec
t -
2014
-08-
27

How ‘Scottish’ Was this Election? 113
Britain in general, respondents were then invited to consider whethera different issue faced Scotland more specifically. There was someevidence of a distinction between levels in that many respondentsnamed ‘the economy’ in general to the first question and cited unem-ployment as the particular economic problem confronting Scotland.However, the overall result is clear and consistent across both ques-tions: if concerns about the public finances are included, aroundtwo-thirds of respondents saw economic issues as the most importantfacing Britain and Scotland.1
This does not in itself demonstrate a multi-level economic votein 2011. Respondents may have seen economic problems as themost pressing issue facing Scotland but, at the same time, believedthat only the Westminster government – or that neither level ofgovernment – could do anything about these problems. However,a more interesting pattern than that emerges when we look at theresults from the same follow-up question about party competencethat formed the basis for Table 4.5 in the previous chapter. Afterthe ‘most important issue’ question for each level, respondents wereasked to name the party that they regarded as best able to handle thatissue. In Table 5.4, we show the results for those naming either theeconomy (a broad category also including references to ‘the finan-cial crisis’) or unemployment. To make the distribution among theparties clearer, we exclude the roughly 20 per cent in each case whoanswered ‘don’t know’ when asked which party would handle theseissues best.
The results highlight the multi-level nature of economic evalu-ations in 2011. When respondents thought about the economicproblems facing Britain, they were likeliest to name Labour as best
Table 5.4 Party best able to handle economic issues facing Britain andScotland (row percentages)
None Con Lab LD SNP Other N
Britain Economy 18 25 34 3 18 2 594Unemployment 10 7 45 4 34 1 133
Scotland Economy 13 8 28 3 47 1 478Unemployment 11 4 33 3 48 1 267
Source: Pre-election survey.
10.1057/9781137023704 - More Scottish than British, Christopher Carman, Robert Johns and James Mitchell
Co
pyr
igh
t m
ater
ial f
rom
ww
w.p
alg
rave
con
nec
t.co
m -
lice
nse
d t
o U
niv
ersi
ty o
f S
ydn
ey -
Pal
gra
veC
on
nec
t -
2014
-08-
27

114 More Scottish than British
equipped to deal with them, with the Conservatives also given somecredit (for handling the economy if not unemployment). However,when respondents – in many cases the same respondents – consideredthe economic and employment situation in Scotland, comfortablythe largest proportion named the SNP as best able to handle theseproblems. In the previous chapter, we highlighted the SNP’s lead interms of economic competence as an important plank in their elec-toral success. Now we can see why that advantage was so important.Had the economy simply been a Westminster issue intruding on aHolyrood election, then the SNP’s perceived competence would havemattered little and, presumably, Labour would have stood to benefit –as it had in the general election the previous year. The SNP was cred-ited with influence over the nation’s economy, and voters tended tothink the SNP best equipped to exert that influence.
The point about a ‘multi-level economic vote’ is reinforced by com-paring respondents’ pre-election reports of the most important issuesfacing Britain and Scotland with their post-election reports of themost important issue in their voting decision. There was surprisinglylittle consistency between the two: it seems that ‘objective’ assess-ments of the country’s priorities play only a limited role in drivingpersonal vote choices. For example, only around two in five of thosewho said that the economy or employment was the most impor-tant problem facing the country then cited either of those issuesas the primary motivation behind their party choice. The key pointfor present purposes, however, is that that proportion was basicallythe same, regardless of whether the country in question was Britain(41 per cent) or Scotland (42 per cent).2 In other words, economicvoting was no less common among those whose principal focus wason the Scottish level. While some voters were choosing between thealternative economic strategies proposed by the two main rivals atWestminster, plenty of others were assessing how the Scottish econ-omy would fare under the leading contenders for government atHolyrood.
The basis for decision-making: Voters’ self-reports
The same argument – that some voters focus principally on UK pol-itics while others’ decisions are based on the Scottish level – appliesnot only to the economy but to electoral choice in general. What
10.1057/9781137023704 - More Scottish than British, Christopher Carman, Robert Johns and James Mitchell
Co
pyr
igh
t m
ater
ial f
rom
ww
w.p
alg
rave
con
nec
t.co
m -
lice
nse
d t
o U
niv
ersi
ty o
f S
ydn
ey -
Pal
gra
veC
on
nec
t -
2014
-08-
27

How ‘Scottish’ Was this Election? 115
is difficult is to determine is the relative importance of the differ-ent levels: that is, which drives more voting decisions? There are,broadly speaking, two ways of addressing this question. One is to usethe kinds of multivariate models of party choice reported in previouschapters and to examine whether the more powerful predictors ofparty choice have more to do with UK or with Scottish politics. Forexample, in Chapter 3 we showed that attitudes to the Scottish partyleaders had more influence over party choice than did attitudes tothe Westminster leaders. We return to such comparisons in the nextchapter when reporting our full models of party choice in 2011. Here,we use the second approach to determining the relative importanceof arenas – that is, simply asking voters. This direct approach has itslimitations. The title of Timothy D. Wilson’s (2004) Strangers to Our-selves encapsulates the central message of his psychological research,that people seldom have a clear idea of what drives their decisions.This is why political scientists have rarely paid much heed to respon-dents’ own accounts of why they voted a certain way – such reportsare unreliable and often consist of rationalizations rather than truereasons. However, unreliability need not imply bias. There is no obvi-ous reason why limits on introspective access would lead respondentsto overstate the impact of either the Scottish or the British level ontheir voting decision. So, while we might be sceptical about any givenindividual’s reported reasons for their vote, the aggregated resultsfrom our sample may still be informative.
In surveys at all four Scottish elections, those who reported votingwere asked whether, in choosing their party, they had in mind mostlywhat was going on in Scotland or mostly what was going on in Britainas a whole (Curtice 2006: 93).3 The top panel of Table 5.5 shows that,throughout this period, a clear majority of voters have reported decid-ing primarily on Scottish matters. The proportion had looked to berising steadily as devolution bedded in, giving Scottish Parliamentelections an increasingly first-order character, but that trend levelledoff in 2011. This could reflect a kind of ‘ceiling effect’, whereby thecontinuing importance of Westminster in Scottish politics meansthat the proportion is unlikely to rise much above 70 per cent.However, it might instead reflect only a temporary interruption ofthe upward trend, due perhaps to the importance of the economyin 2011. This will be best resolved by surveys at future elections.In the meantime, some light can be shed on the matter by looking at
10.1057/9781137023704 - More Scottish than British, Christopher Carman, Robert Johns and James Mitchell
Co
pyr
igh
t m
ater
ial f
rom
ww
w.p
alg
rave
con
nec
t.co
m -
lice
nse
d t
o U
niv
ersi
ty o
f S
ydn
ey -
Pal
gra
veC
on
nec
t -
2014
-08-
27

116 More Scottish than British
Table 5.5 Basis for voting decision, 1999–2011, and byselected ‘most important issue’ in 2011
MostlyScotland
MostlyBritain
N
All voters1999 62 38 8782003 67 33 7362007 71 29 10912011 70 30 1367
2011 by ‘most important issue’Economy/jobs 67 33 327Education/health 76 24 82Constitution 65 35 140Parties/leaders 65 35 139No issue mentioned 69 31 331
Note: This question was asked only of those who reported voting inthat election.Sources: SSA (1999, 2003); SES post-election surveys (2007, 2011).
responses to the Scottish/British question by reported ‘most impor-tant issue’ when voting. Rather than taking up the space required fora full breakdown, we focus in the bottom panel of Table 5.5 on themost common issue responses.
The breakdown by most important issue reinforces the centralmessage from the previous section: economic voting in 2011 wasby no means just a second-order reaction to the British govern-ment’s economic management. Those citing the economy as themost important issue in their decision split in roughly the same wayas the electorate as a whole in reporting their focus when voting.This exemplifies the more general point that Table 5.5 shows littlesign of the kind of differences that we might expect given the consti-tutional arrangements. Those concerned with education and healthwere a little more likely to report focusing on the devolved level, butthe main theme is homogeneity. One could argue that this betterreflects the constitutional reality, whereby almost any issue has bothBritish and Scottish dimensions. In that case, what Table 5.5 tells us isless about voters’ attributions of responsibility and more about theirfocus of interest. A substantial minority described their 2011 vote asa response to what was going on in British politics. Whatever their
10.1057/9781137023704 - More Scottish than British, Christopher Carman, Robert Johns and James Mitchell
Co
pyr
igh
t m
ater
ial f
rom
ww
w.p
alg
rave
con
nec
t.co
m -
lice
nse
d t
o U
niv
ersi
ty o
f S
ydn
ey -
Pal
gra
veC
on
nec
t -
2014
-08-
27

How ‘Scottish’ Was this Election? 117
issue priorities, most voters were focused principally on the Scottisharena.4
Questions about the basis for voters’ choices have typically beenasked in the context of discussions about the status, rather than aboutthe outcomes, of Scottish Parliament elections. Yet, in 2011 in partic-ular, there is good reason to suppose that the result – or, at least, themargin of victory – depended on whether voters’ main focus was onBritish or Scottish politics. Labour’s best hope of replicating its suc-cess in 2010 was by encouraging a referendum on the Westminstergovernment; the SNP preferred a ‘domestic valence’ competitionin order to maximize profits from its competence advantage overScottish Labour. Table 5.4 has already illustrated the point in the eco-nomic context: voters thinking about Britain’s problems tended tosee Labour as best equipped to handle the issue, while those focusedon the Scottish economy favoured the SNP. In Table 5.6, we look moredirectly at voting behaviour, investigating for both 2011 and 2007how regional vote choice varied by reported basis for choice.
Looking first at the 2011 results, we see clear confirmation of the(hardly startling) hypothesis that party choice differs according to thepolitical arena on which voters are focusing. The SNP is the majoritychoice among those deciding mostly according to what was going onin Scotland. Labour trails by fully 31 points in that category – which,
Table 5.6 Regional list vote by reported main focus, 2011and 2007
2011 2007
Scotland%
Britain%
Scotland%
Britain%
Conservative 9 20 11 21Labour 22 37 27 34Lib Dem 6 3 10 12SNP 53 27 37 19Other 12 11 14 15
N 941 410 748 324
Note: The data are weighted by actual vote shares so that comparisonis not distorted by any changes in sampling or non-response bias.Source: SES post-election surveys, 2007 and 2011.
10.1057/9781137023704 - More Scottish than British, Christopher Carman, Robert Johns and James Mitchell
Co
pyr
igh
t m
ater
ial f
rom
ww
w.p
alg
rave
con
nec
t.co
m -
lice
nse
d t
o U
niv
ersi
ty o
f S
ydn
ey -
Pal
gra
veC
on
nec
t -
2014
-08-
27

118 More Scottish than British
as we saw earlier, contains more than two thirds of those who voted.By contrast, when we consider those focused principally on theBritish level, Labour has a ten-point lead over the SNP and the Con-servatives enjoy at least a relatively strong showing. (Leaving asidethe predictable collapse in the Liberal Democrat percentage, theseresults are at least somewhat reminiscent of the 2010 general elec-tion results in Scotland.) It is not difficult to see why Labour and theSNP went into the 2011 campaign wanting the election to be foughton very different territory.
However, the comparison with 2007 adds nuance to that conclu-sion. The election of a Conservative-led government at Westminsterdid not lead to a marked improvement in Labour’s showing amongthose focused on that British level; if anything, it is the SNP thatadvanced most among that group to become clearly the second party.So, while it made sense for Labour in 2011 to try to focus voters’attention on Westminster rather than Holyrood, the party wouldhave had to be spectacularly successful in that regard – far moreso than looks remotely likely given the trend shown in Table 5.5 –in order to deliver victory. Labour’s advantage over the SNP amongBritish-focused voters was relatively narrow and certainly dwarfedby its disadvantage among the Scottish-focused. Put another way,while the SNP’s landslide was owed primarily to its huge lead amongthat latter group, it was also enabled by the party’s ability to winsignificant numbers of votes from those focused on British politics.This echoes conclusions from earlier in this book about the broadbase of the SNP’s gains. Headway was made in all groups, even – orespecially – among those hitherto harder for the party to reach.
That last point should not obscure the clear comparative advan-tages shown in Table 5.6. In 2007 and 2011, Labour was clearlypreferred among those basing their choice on British politics andthe SNP clearly preferred among those instead concerned with theScottish level. The differences are sufficiently large that we can notonly speak of different political worlds but say that, within Scotland,the British and Scottish political worlds have different party systems.The former resembles the British party system as a whole but with thefamiliar differences: Labour stronger, the Conservatives weaker, and astrong SNP presence. The latter is very different, with two-party com-petition between the currently dominant SNP and Labour and theothers playing only a minor role. In the final section of this chapter,
10.1057/9781137023704 - More Scottish than British, Christopher Carman, Robert Johns and James Mitchell
Co
pyr
igh
t m
ater
ial f
rom
ww
w.p
alg
rave
con
nec
t.co
m -
lice
nse
d t
o U
niv
ersi
ty o
f S
ydn
ey -
Pal
gra
veC
on
nec
t -
2014
-08-
27

How ‘Scottish’ Was this Election? 119
we examine whether these different party systems are reflected indifferent patterns of party allegiances when voters are prompted todistinguish these two political worlds.
Multi-level party support
The multi-level context that has developed under devolution has, aswe have already pointed out, complicated how we think of party sup-port and vote choice in Scotland. With the creation and expansionof multiple levels of government in what was the model unitary sys-tem, we can expect that the party systems in the nations (Scotland,Wales and Northern Ireland) would take on unique characteristicsspecific to those systems (Dunleavy 2005). One way to examine theextent to which devolution has reshaped the party system in Scotlandis to look at the patterns of partisan attachments within the Scottishelectorate. The question addressed in this section, then, is whether,in line with the different incentives, incumbents and incidents inthe Westminster and Holyrood arenas, the Scots have also developeddistinct partisan attachments across these contexts. We know thatvoting patterns differ substantially across the two arenas; here, weconsider whether it is not just short-term behaviour but also long-term partisan allegiances that varies. Are these allegiances contingenton the arena that voters are thinking about at the time?
Repeated analyses (Clarke et al. 2004; Johns et al. 2010) havedemonstrated that many voters still broadly ‘identify’ with par-ties and that these identities or affiliations matter – and mattersubstantially – in predicting vote choice. However, party identifica-tion is decreasing across most established democracies (Dalton 2006;Scarrow 2000; Whiteley 2009) and some parties are disproportion-ately feeling the effects of de-alignment (Dunleavy 2005). And, asnoted in Chapter 3, many scholars have questioned whether weshould really discuss party identification as a longstanding allegianceor instead think of it as a more ephemeral preference (Fiorina 1981;Burden and Klofstad 2005; Johnston 2006). Panel studies using theBritish Election Study surveys have shown that around two-thirds ofthose who report a party allegiance maintain a consistent identifica-tion with that same political party. That leaves a substantial groupthat switches not only vote but also reported allegiance betweenelections – sometimes more than once (Clarke and Stewart 1998: 371;
10.1057/9781137023704 - More Scottish than British, Christopher Carman, Robert Johns and James Mitchell
Co
pyr
igh
t m
ater
ial f
rom
ww
w.p
alg
rave
con
nec
t.co
m -
lice
nse
d t
o U
niv
ersi
ty o
f S
ydn
ey -
Pal
gra
veC
on
nec
t -
2014
-08-
27

120 More Scottish than British
but see Dunleavy 2005: 511). This transience or flexibility is highlyrelevant for our question about the possibility of parallel identifica-tions across political arenas. If party identification conforms simplyto the Michigan model, with most voters socialized in early life intoa strong emotional bond with a party, we would expect not only sta-bility in partisanship but also consistency across the Scottish andBritish political arenas. Such party loyalties would not be so condi-tional. However, if partisan attitudes are more ephemeral, driven byshort-term factors like performance, policies and personalities, thenwe might well expect reported party identification to differ acrossarenas insofar as the parties have experienced contrasting fortunes atWestminster and Holyrood.
While there are several different ways that we could go about prim-ing respondents to consider different levels of government and thenobserving any impact on their party attachments, in this instancewe opted for the most straightforward prime – we instructed respon-dents directly to think about the different arenas. At the beginning ofthe second, or post-election, wave of the SES, we embedded a simplesurvey experiment prompting respondents to consider their parti-san allegiances at different levels of government. Respondents wereasked two sets of questions, one about their party preference at theUK (Westminster) level and the other about their preference at theScottish (Holyrood) level. These were worded as follows:
Some people think of themselves as usually being a supporter ofone political party rather than another (even if they might vote fora different party from time to time). Thinking about UK politics atWestminster, do you usually think of yourself as being a supporterof one particular party or not?
Thinking now about Scottish politics at Holyrood, do you usuallythink of yourself as being a supporter of one particular party ornot?
In either case, those who answered ‘Yes, I do’ were then asked:
Which Party is that?LabourConservative
10.1057/9781137023704 - More Scottish than British, Christopher Carman, Robert Johns and James Mitchell
Co
pyr
igh
t m
ater
ial f
rom
ww
w.p
alg
rave
con
nec
t.co
m -
lice
nse
d t
o U
niv
ersi
ty o
f S
ydn
ey -
Pal
gra
veC
on
nec
t -
2014
-08-
27

How ‘Scottish’ Was this Election? 121
Liberal DemocratScottish National PartyGreen PartyOther [write in option]
It is well established that responses to survey questions can be shapedby the context set by previous questions (Schuman and Presser 1996,ch. 2). It is possible, for example, that asking first about respondentparty preferences at the UK level would put that context into respon-dents’ minds in a way that persisted despite the fact that the nextquestion specifically mentions Holyrood. Another possibility is thatrespondents might wish to appear consistent in their preferences, orto avoid appearing ‘disloyal’ to the party that they named first. Allof these biases would artificially inflate the observed level of partisanconsistency across arenas, and all of them imply that responses to thesecond question are somehow contaminated. We therefore randomlyassigned half of the SES respondents to receive first the UK questionfollowed by the Scotland question, while the other half of respon-dents were first asked about Scottish politics, then UK. Put anotherway, the order of the two questions above was switched between ourtwo randomly assigned groups of respondents.
Table 5.7 presents the basic response patterns for the two sets ofmulti-level party identification questions. On the left, under ‘SplitHalf 1’, is the series that first asks respondents to report their partypreference at the UK level, then at the Scottish level. The twocolumns on the right (‘Split Half 2’) present the percentages ofrespondents identifying with the parties (or not) when we first askabout the Scottish level, then the UK. Two basic patterns are evidentwith these responses. First, there is a great deal of aggregate stabilityin the percentages of people saying that they do not think of them-selves as supporting the parties at both levels no matter whether theyare first primed to think about Scotland or the UK. Similarly, the per-centages of respondents saying that they support the smaller Scottishparties (the Liberal Democrats, Greens and ‘Others’) are stable nomatter whether they are prompted to first think about Holyrood orWestminster.
On the other hand, Table 5.7 also reveals some slight evidence ofshifting between Labour and SNP support depending on the orderof consideration. SNP support is slightly stronger when respondents
10.1057/9781137023704 - More Scottish than British, Christopher Carman, Robert Johns and James Mitchell
Co
pyr
igh
t m
ater
ial f
rom
ww
w.p
alg
rave
con
nec
t.co
m -
lice
nse
d t
o U
niv
ersi
ty o
f S
ydn
ey -
Pal
gra
veC
on
nec
t -
2014
-08-
27

122 More Scottish than British
Table 5.7 Responses to multi-level party identification questions, columnpercentages
Split half 1 Split half 2
UK (askedfirst)
Scotland(asked second)
Scotland(asked first)
UK (askedsecond)
None 40% 38% 36% 40%Conservative 13 8 9 13Labour 23 16 21 27Lib Dem 4 3 4 5SNP 19 33 30 13Green 1 1 1 0Other 1 1 1 2
N 896 896 867 867
are first primed to think about the UK level. That is, comparing theSNP support across the two halves of the sample, we find that the SNPfairs slightly better if respondents first consider the UK level, then theScottish level. The opposite holds for Labour support. When respon-dents are asked to first consider the Scottish level, then the UK level,support for Labour improves slightly. In other words, asking firstabout the UK improves Labour identification (and suppresses SNPidentification) at that level, but then somewhat suppresses Labouridentification at the Scottish level (but improves SNP identificationat that level). For both Labour and the SNP the shifts are noticeable,though not exactly earth-shattering (in the 3–6 percentage range).
The pattern revealed in the marginals immediately draws us tothe question about shifting party support across the levels of gov-ernance. Tables 5.8 and 5.9 display SES respondents’ Scottish andUK party support, conditional on the level they were first primedto consider. First we consider those respondents who were initiallyprimed to think about the UK, then were asked about their Scottishparty support (Table 5.8). Owing to the SNP being largely associatedwith Scotland, we could imagine that there might be some individ-uals who see themselves as SNP supporters within Scotland, but donot think much about a specific party at Westminster. Along theselines Table 5.8 shows that 18 per cent of those who say they do notsupport a party in Westminster (or 64 respondents) support the SNPin Scotland. Of course, one possibility here is that this is a survey
10.1057/9781137023704 - More Scottish than British, Christopher Carman, Robert Johns and James Mitchell
Co
pyr
igh
t m
ater
ial f
rom
ww
w.p
alg
rave
con
nec
t.co
m -
lice
nse
d t
o U
niv
ersi
ty o
f S
ydn
ey -
Pal
gra
veC
on
nec
t -
2014
-08-
27

How ‘Scottish’ Was this Election? 123
Table 5.8 Scottish party identification conditional on UK party identifica-tion, column percentages
Scottish PID UK PID (asked first)
None Conservative Labour Lib Dem SNP
None 79 21 14 14 0Conservative 0 60 1 0 0Labour 1 0 66 0 0Lib Dem 1 2 0 71 0SNP 18 18 19 9 100Green 0 0 0 6 0Other 0 0 0 0 0
N 356 114 209 35 168
Table 5.9 UK party identification conditional on Scottish party identifica-tion, column percentages
UK PID Scottish PID (asked first)
None Conservative Labour Lib Dem SNP
None 78 3 4 6 35Conservative 8 97 0 3 5Labour 9 0 96 0 13Lib Dem 3 0 0 91 2SNP 0 0 0 0 43Green 0 0 0 0 0Other 1 0 0 0 2
N 309 74 178 32 262
‘artefact’ that is the result of the Scottish question falling second inthe sequence. Some relatively small percentage of respondents mayhave thought that, not having specified a party at the UK level, theyshould specify a party at the Scottish level to avoid looking com-pletely apolitical. And there is some evidence of this – of the 64respondents in the second wave who said they did not support aparty in Westminster but supported the SNP in Scotland, 44 of themsaid that they were non-partisans in the SES’ first wave while just 16said that they supported the SNP. On the other hand, we do not see
10.1057/9781137023704 - More Scottish than British, Christopher Carman, Robert Johns and James Mitchell
Co
pyr
igh
t m
ater
ial f
rom
ww
w.p
alg
rave
con
nec
t.co
m -
lice
nse
d t
o U
niv
ersi
ty o
f S
ydn
ey -
Pal
gra
veC
on
nec
t -
2014
-08-
27

124 More Scottish than British
a similar pattern when we reverse the order of the UK and Scottishquestions.
Turning to respondents who specified a party at the UK level, thebroad pattern is that those respondents also generally report support-ing the same party in Scotland: 60 per cent of UK Conservatives,66 per cent of UK Labour and 71 per cent of Liberal Democrats saidthat they supported the same party when primed to consider Scottishpolitics. At the same time, non-trivial percentages of UK partisansseemed to be hard-pressed to declare a party at the Scottish level and,not surprisingly, this problem seemed to afflict the UK Conservativeidentifiers (21 per cent) more so than the UK Labour (14 per cent)or UK Liberal Democrats (14 per cent). Of course, what we areparticularly intrigued by are those people who report party switch-ing. Consistently across the parties, the main beneficiary of partyswitching between levels of government was the SNP: 18 per centof Conservatives, 19 per cent of Labour and 9 per cent of LiberalDemocrats said that when they thought about Scottish politics, theywere inclined to support the SNP. (As a side note, we would pointout that the slightly lower percentage of Liberal Democrat ‘switchers’is likely owing to the phenomenon we have mentioned throughoutthis book – the collapse of the Liberal Democrat support generallymeans that by the time of our survey only the ‘hardcore’ supportersdeclared fealty to the Liberal Democrats, thus we are less likely to findLiberal Democrat ‘switchers’.)
So far we have not mentioned the UK SNP supporters. Not surpris-ingly, all (100 per cent) of respondents who said they support theSNP at the UK level went on to declare support for the same party atthe Scottish level. A similar pattern is apparent in Table 5.9, whichreports respondent UK party support for the other half of the sampleof respondents (first asked about their Scottish party support). Herethe overwhelming pattern is that those respondents who declaredsupport for Scottish Conservatives, Scottish Labour and Scottish Lib-eral Democrats consistently supported the same party at the UK level.What seems to be important to determining the consistency of partysupport across the UK and Scottish levels of government is the mainarena of political conflict as perceived by the individual. For exam-ple, respondents who consistently support the SNP at the UK leveltend to see the outcome of the Scottish Parliament elections as being
10.1057/9781137023704 - More Scottish than British, Christopher Carman, Robert Johns and James Mitchell
Co
pyr
igh
t m
ater
ial f
rom
ww
w.p
alg
rave
con
nec
t.co
m -
lice
nse
d t
o U
niv
ersi
ty o
f S
ydn
ey -
Pal
gra
veC
on
nec
t -
2014
-08-
27

How ‘Scottish’ Was this Election? 125
Multi-level party identification experimentQuestion 1: UK (Westminster) party identification
Question 2: Scottish party identification
N = 882
Labour
Labour
Conser
Conser
SNP
SNP SNP SNP SNP Green
LibDem
LibDem
77% 76%22% 22% 100% 10% 7%83%
Figure 5.1 Multi-level party identification experiment
Labour Conserv SNP LibDem
N = 855
Labour Conserv Labour Conserv SNP LibDemLibDem
100% 100% 19% 8% 4% 66% 97%
Multi-level party identification experimentQuestion 1: Scottish party identification
Question 2: UK (Westminster) party identification
Figure 5.2 Multi-level party identification experiment
far more important (mean = 1.2) than do consistent supporters of theConservatives and Labour (means = 1.9 and 1.8, respectively).
These patterns are perhaps a bit easier to discern in Figures 5.1and 5.2. Excluding non-partisans, these figures show the patterns ofparty switching depending on the order (UK or Scotland) in whichwe primed respondents to think about their party support. Figure 5.1
10.1057/9781137023704 - More Scottish than British, Christopher Carman, Robert Johns and James Mitchell
Co
pyr
igh
t m
ater
ial f
rom
ww
w.p
alg
rave
con
nec
t.co
m -
lice
nse
d t
o U
niv
ersi
ty o
f S
ydn
ey -
Pal
gra
veC
on
nec
t -
2014
-08-
27

126 More Scottish than British
shows the ‘Scottish-centric’ nature of those supporters who consis-tently support the SNP. Of interest also is the fact that the SNPis the main (and, indeed in the case of Labour and Conservative,only) beneficiary of switching from the UK to the Scottish level.Figure 5.2 shows that Scottish Labour and Conservative (and almostall Scottish Liberal Democrats) consistently support the same partyat the UK level, while in that other arena of conflict, SNP supporterssplit between the parties (with almost 20 per cent of support going toUK Labour).
What do these patterns mean for ‘real world’ political competition?We would posit, as mentioned above, that the relative success (ornot) of the parties’ election campaigns in the General and Scottishelections has a great deal to do with their assumed pattern of partysupport. In 2011 Scottish Labour ran what we and many othershave identified as a Westminster-focused campaign, basing their cam-paign on an implicit model of party support wherein Scottish Labourcould count on the votes of those people who just voted for ScottishLabour candidates in the previous year’s general election. But theSES data reveal that when priming the different political arenas, dif-ferent patterns of party support, and therefore vote choice, emerge(Table 5.10).
A final point to address with our experiment in multi-level partysupport is how the questions priming different governing levelscompare to the standard, non-level specific party support measure.As noted above, in addition to our post-election party support exper-iment, the SES asked the standard party support question in thepre-election wave. Table 5.10 presents a comparison between thequestions priming the Scottish and UK levels with the pre-electionparty support question. Here, we simply combined the responses
Table 5.10 Party support combining post-election experimental halves, rowpercentages
Conservative Labour LibDem
SNP Green Other No party N
Scotland(%) 8 18 4 32 1 1 37 1763UK(%) 13 25 4 16 0 1 40 1763Pre-election(%) 9 20 4 19 0 1 46 2046
10.1057/9781137023704 - More Scottish than British, Christopher Carman, Robert Johns and James Mitchell
Co
pyr
igh
t m
ater
ial f
rom
ww
w.p
alg
rave
con
nec
t.co
m -
lice
nse
d t
o U
niv
ersi
ty o
f S
ydn
ey -
Pal
gra
veC
on
nec
t -
2014
-08-
27

How ‘Scottish’ Was this Election? 127
from the two-halves to create single party support measures for thedifferent levels.5 It appears that the aggregated response pattern tothe general party support measure used in most surveys in Scotland issomething of a rough ‘average’ of the Scottish and UK party supportmeasures. Looking specifically at Conservative and Labour support,the pre-election measure falls right in between the Scottish and UKmeasures while SNP support comes in at somewhat below the ‘aver-age’ of the two. Further, the general measure seems to elicit – at leastin the case of the 2011 SES – a higher percentage of non-identifiers.Clearly, the level of government under consideration when surveyrespondents report their party support matters a great deal. At thesame time, we would emphasize the usual caveats when drawing con-clusions from cross-sectional survey evidence. To use the standardcliché, cross-sectional surveys provide a ‘snapshot in time’ that drawson one particular sample of respondents. To understand how robustthese results are, we will have to replicate this experiment in futuresurveys.
Conclusion: ‘More Scottish than British’
Scottish governance involves an increasingly complex set of arrange-ments that share power for devolved policy domains across Scottishand UK institutions. In that sense, no Scottish election is isolatedfrom British politics and no UK election in Scotland is isolated fromScottish politics. Yet the very complexity of those arrangements issuch that we cannot expect a voter to pay much heed to them whenmaking his or her decision. There is mounting evidence that voters,while they may have a reasonably clear idea of how formal policyresponsibilities are shared among different levels of government (seeTable 5.1), do not take account of these attributions when voting(Anderson 2006; Cutler 2004: 34–35; Arceneaux 2006; Johns 2011;León 2011). The simplest explanation for this is that voters lack themotivation to consider constitutional niceties when making a choice.Rather, they are more passive consumers. If an issue is prominentduring an election campaign, it is likely to influence voting decisionsregardless of whether it is, in strictly constitutional terms, ‘at stake’in that election.
Broadening this from specific issues to the importance of over-all arenas – that is, to the question of the ‘Scottishness’ of this
10.1057/9781137023704 - More Scottish than British, Christopher Carman, Robert Johns and James Mitchell
Co
pyr
igh
t m
ater
ial f
rom
ww
w.p
alg
rave
con
nec
t.co
m -
lice
nse
d t
o U
niv
ersi
ty o
f S
ydn
ey -
Pal
gra
veC
on
nec
t -
2014
-08-
27

128 More Scottish than British
election – we find drawbacks in the ‘order of elections’ approach thathas dominated research in this area. In that model, voters are pic-tured as cognitively active, calculating the relative importance of thelevel to be elected. More likely is that they are passive, respondingto the way that Scottish election campaigns are presented to themby the parties and the media. If, during a Holyrood campaign, themedia were preoccupied by events at Westminster and the parties inopposition at Westminster campaigned for a protest vote against theUK government, then we would not expect that election to be par-ticularly Scottish. Conversely, a campaign focused on the devolvedarena will generate a Scottish election, regardless of the fact that theWestminster government might be more powerful. This is why wehave emphasized the idea of parallel political worlds or arenas, ratherthan the more commonly used term ‘levels’ of government. A hori-zontal is more apt than a vertical metaphor in a situation where whatmatters is not the relative importance of the body to be elected butthe shifting focus of campaign attention.
Scottish elections have thus become more Scottish becausedevolution has carved out a distinct political arena within whichthese elections are conducted. The 2010 and 2011 elections yieldedsuch starkly different results in Scotland because they were conductedin two different political worlds, each placing its own set of con-siderations and incentives before voters. The issue of the economyillustrates the point very well. While it was clearly the dominantconcern in both elections, the nature of economic voting was con-spicuously different across the two. In 2010, many voters ralliedbehind Labour in a bid to prevent a Conservative-led governmenttaking office at Westminster. In 2011, voters could do nothing aboutthe make-up of the UK government but they could elect the partyat Holyrood that they deemed best able to defend Scotland againstthe effects of the coalition’s fiscal tightening. The more powerfuleconomic levers remained in the control of Westminster but, ina campaign taking place within the devolved arena, the principalfocus was on how the rivals for Scottish government would deploywhatever powers they have.
We should not overstate the case. This election was ‘more Scottishthan British’ rather than purely Scottish. A substantial proportionof SES respondents reported choosing in 2011 ‘mainly according towhat was going on in Britain as a whole’. However, even this is
10.1057/9781137023704 - More Scottish than British, Christopher Carman, Robert Johns and James Mitchell
Co
pyr
igh
t m
ater
ial f
rom
ww
w.p
alg
rave
con
nec
t.co
m -
lice
nse
d t
o U
niv
ersi
ty o
f S
ydn
ey -
Pal
gra
veC
on
nec
t -
2014
-08-
27

How ‘Scottish’ Was this Election? 129
unlikely to reflect calculations of Westminster’s constitutional pre-eminence. There are two more plausible explanations. The first issimply that, even in a Scottish election, some UK-level considera-tions will supervene. In 2011 these were often macro-economic but,as we will see in the next chapter, party choice was also influenced byattitudes to the party leaders at Westminster. The two political worldsmay be distinct but they still overlap or, at least, they are not closedoff from one another. Second, we should not overstate the passivity ofvoters. Some are simply more interested in one arena than anotherand are therefore likely to focus on that arena when voting. Theseindividual differences in focus and interest are clearly correlated withpartisan preferences: SNP supporters, predictably enough, are dis-proportionately likely to report voting on Scottish matters, whilesupporters of Labour and the Conservatives have been less inclinedto shift focus to Holyrood following devolution. To that extent, thefact that this election was ‘more Scottish than British’ in itself helpsto explain the SNP’s victory.
10.1057/9781137023704 - More Scottish than British, Christopher Carman, Robert Johns and James Mitchell
Co
pyr
igh
t m
ater
ial f
rom
ww
w.p
alg
rave
con
nec
t.co
m -
lice
nse
d t
o U
niv
ersi
ty o
f S
ydn
ey -
Pal
gra
veC
on
nec
t -
2014
-08-
27

6Party Choice in 2011
Those seeking to explain voting behaviour and election outcomes areprone to treat voters as a single actor. Journalists discuss whether theelectorate was ‘content’ or ‘hesitant’ or ‘ready for change’, implyingsome sort of collective mind-set or motivation. Academics have writ-ten about The American Voter (Campbell et al. 1960) and PerformancePolitics and the British Voter (Clarke et al. 2009), the archetypal singularimplying homogeneity in the way that voters make their decisions.These are drastic over-simplifications. Any major election involvesthousands (if not millions) of voters as well as hundreds of candi-dates, dozens of issues, and several parties and leaders. The electoratecontains the contented and the discontented, the hesitant and thegung-ho, those keen for change and those preferring the status quo,and so on. Voters also differ in the way that they reach their deci-sions: some will be guided by performance, others by a long-standingaffinity with a particular party, still others choose a preferred leader,and of course many are influenced by a combination of such factorsbut weighted to different degrees. Yet it is precisely this complexitywhich means that some simplification is inevitable. Any intelligibleexplanation of an election outcome requires us to pick out thosefactors that were most important, and any useful model of partychoice can allow only a limited typology of voters and their modesof decision.
Striking a balance between over-simplification and over-complication is an important task for this final chapter. The chapterserves three main purposes. First, we present the results of our fullmulti-variate models of party choice. This identifies the issues and
130
10.1057/9781137023704 - More Scottish than British, Christopher Carman, Robert Johns and James Mitchell
Co
pyr
igh
t m
ater
ial f
rom
ww
w.p
alg
rave
con
nec
t.co
m -
lice
nse
d t
o U
niv
ersi
ty o
f S
ydn
ey -
Pal
gra
veC
on
nec
t -
2014
-08-
27

Party Choice in 2011 131
factors that did most to drive voting behaviour in 2011. We thenlink these findings to our evidence from elsewhere in the book abouthow parties were perceived and rated in this election cycle. Forinstance, it is not enough to know that voters were influenced bytheir attitudes to the party leaders; leadership can only be an impor-tant factor in the election outcome if there were clear disparities inthe overall evaluations of these leaders. So our second purpose isto offer an explanation of the 2011 outcome based on combiningthese two types of survey results: what mattered, and how the par-ties rated on what mattered. Third, in the concluding section, webroaden the focus to sketch a more general model of party choice inScottish Parliament elections and to contrast this with Scottish vot-ing behaviour in other contexts, not only Westminster elections butalso the upcoming referendum on independence.
Models of party choice in 2011
During the previous four chapters, we have examined a huge rangeof potential influences on voting behaviour in 2011, and built upa detailed profile of Scottish public opinion at the time of thatelection. Yet the relevance of these analyses hinges on assumptionsthat the variables involved did indeed affect party choice in 2011.Many of those assumptions seem highly plausible given previousresearch, which has shown for example that a perceived commit-ment to Scottish interests is an important asset for parties contestingHolyrood elections, and that a popular leader is an asset for a partyin more or less any electoral setting. Yet they remain assumptions inthe context of the 2011 election until, as in this section, we test themmore formally.
That testing is achieved by the same technique of multinomiallogistic regression that was introduced in Chapter 2 and used there tosketch the socio-demographic profile of each party’s electorate. Thismethod allows us to include all of the potential influences on partychoice simultaneously and thus to assess whether each exerts an inde-pendent impact on party choice – that is, whether it improves ourprediction of voting behaviour even when all of the other influencesare taken into account as well. The premise underlying this approachis that a variable can only contribute to an explanation of the elec-tion outcome if it is shown to have such a separate and independent
10.1057/9781137023704 - More Scottish than British, Christopher Carman, Robert Johns and James Mitchell
Co
pyr
igh
t m
ater
ial f
rom
ww
w.p
alg
rave
con
nec
t.co
m -
lice
nse
d t
o U
niv
ersi
ty o
f S
ydn
ey -
Pal
gra
veC
on
nec
t -
2014
-08-
27

132 More Scottish than British
impact. If, for example, voters’ evaluations of a party’s leader areunrelated to the probability of voting for that party when we alsoconsider attitudes towards that party and its record and policies, thenwe can reasonably conclude that leadership was not a major influenceon that party’s performance.
That logic, and this approach in general, represents another com-promise between over-simplifying and over-complicating. It is over-simplified because including all of the variables at once neglects thecasual interrelations between them. If voters’ evaluations of a party’sleader in turn influence their perception of that party’s competence,then it becomes more difficult to interpret results in which com-petence has a significant association with party choice but leaderevaluations do not. This would not necessarily mean that leadershiphad no influence; it might simply mean that the effect of leadershipwas through competence – that is, leaders matter because of howthey shape their party’s image. Of course, as noted in Chapter 3,the problem is that these causal interrelations are entangled. Takeany pair of attitudinal or perceptual variables – attitudes to leaders,perceptions of party image, approval of policies, competence evalu-ations and so on – and there is good reason to suppose that eachmight affect the other. Allowing for this would be fiendishly compli-cated, would require more waves of data collection and many morerespondents than we have available here, and even then we wouldbe unable fully to disentangle these causal chains. So including all ofthese variables at once is a simplification, but a necessary one.
The same issue of causal direction generates another dilemma:that is, whether to include party identification as a predictor vari-able in these models of party choice. We rehearsed the arguments inChapter 3. On the one hand, longstanding partisan predispositionsinfluence not only voting behaviour but also voters’ perceptions andevaluations, and so failing to control for party allegiances may over-state the effect of the latter on the former. On the other hand, thereis growing evidence that party identification is not an ‘unmovedmover’, and that it is itself influenced by the kinds of variables –leader images, policy preferences, competence evaluations – that areincluded in our models. And that would make ‘controlling for’ partyidentification a misleading notion: we would be controlling for avariable that is in fact one route through which the other variablesexert their impact. In the models included here, we exclude party
10.1057/9781137023704 - More Scottish than British, Christopher Carman, Robert Johns and James Mitchell
Co
pyr
igh
t m
ater
ial f
rom
ww
w.p
alg
rave
con
nec
t.co
m -
lice
nse
d t
o U
niv
ersi
ty o
f S
ydn
ey -
Pal
gra
veC
on
nec
t -
2014
-08-
27

Party Choice in 2011 133
identification for two reasons. First, the sheer number and range ofindependent variables reduces the risk that, by omitting party iden-tification, we will overstate the effect of any one predictor. If thecorrelation between leader evaluations and vote is due partly to a gen-uine leadership effect and partly to the fact that both are driven byprior feelings towards a party, then controlling for a variety of eval-uations of that party will help to isolate that independent effect ofleadership. Second, a more detailed scrutiny of party choice in 2011(Johns et al. 2013) showed that the substantive conclusions aboutvoting behaviour, especially about the relative importance of the vari-ous factors driving it, were unaffected by whether party identificationwas omitted or included.
There is no such confusion about causal order when it comes tothe socio-demographic variables that formed our first multi-variatemodel (see Figure 2.1). As noted at the time, variables like age, sexand religion are at the beginning of the causal chain – that is, at themouth of the ‘funnel of causality’ (Campbell et al. 1960) – leadingto vote choice. In order to gauge their impact, it is neither necessarynor even desirable to control for causally posterior variables like issuepositions or leader evaluations. Hence the ‘socio-demographics only’model presented in Chapter 2 provides the cleanest measure of the(as it turns out, rather limited) impact of these variables. And, whilethey are also included as controls in the full models presented in thischapter, we do not report the results in full.
As in Chapters 2 and 3, and for the reasons given there, our modelof party choice is a multinomial logistic regression based on theregional list vote. Also as before, the full statistical results are con-fined to an appendix (see Appendix 2) and more digestible versionsare presented here. The sheer size of these models means that it makessense to present the results in two phases. First, in Table 6.1, we showthe full list of variables included and use a simple system (plus orminus) to indicate the direction of the relationships when p≤ . 01 anduse bolded signs when the relationship was statistically significant atp≤ . 05 in each of the three comparisons (Labour vs. each other majorparty) that make up the multinomial logit models.1 Second, focusingon those variables which did have a significant and non-negligibleeffect, we present a series of charts – one for each major party –showing the relative impact of each predictor and thus identifyingthose variables that did most to shape the election outcome.
10.1057/9781137023704 - More Scottish than British, Christopher Carman, Robert Johns and James Mitchell
Co
pyr
igh
t m
ater
ial f
rom
ww
w.p
alg
rave
con
nec
t.co
m -
lice
nse
d t
o U
niv
ersi
ty o
f S
ydn
ey -
Pal
gra
veC
on
nec
t -
2014
-08-
27

134
Table 6.1 Variables with statistically significant effects in multinomial logitof list vote
Con (vs.Lab)
LD (vs.Lab)
SNP (vs.Lab)
Issue positionsSupport community sentences –Oppose free prescriptions + + +More use of tax-varying powers + +Support prison for knife crime – – –Support tuition feesOppose spending cutsTax-spend scale (increase)Green vs. growth scale (growth) +Constitution scale (independence) +Performance evaluationsStandards of healthStandards of educationLiving standardsStandards of law and orderConservative UK (2010–) + +Lib Dem UK (2010-)Labour UK (–2010)SNP Scottish (2007–11) + +Labour Scottish (hypothetical
2007–2011)– – –
Economic evaluationsExpectations – UK economyExpectations – Scottish economyHandle cuts – Conservatives +Handle cuts – Labour –Handle cuts – Lib Dems +Handle cuts – SNP
Leader evaluationsSalmond +Gray –Goldie –Scott +Cameron + +Clegg –Miliband – –Brown – –Blair –
10.1057/9781137023704 - More Scottish than British, Christopher Carman, Robert Johns and James Mitchell
Co
pyr
igh
t m
ater
ial f
rom
ww
w.p
alg
rave
con
nec
t.co
m -
lice
nse
d t
o U
niv
ersi
ty o
f S
ydn
ey -
Pal
gra
veC
on
nec
t -
2014
-08-
27

Party Choice in 2011 135
Party imageOverall image – Conservatives +Overall image – Labour –Overall image – Lib Dems +Overall image – SNPScottish interests – Conservatives +Scottish interests – Labour – – –Scottish interests – Lib Dems +Scottish interests – SNP + + +Campaign tone – Conservatives +Campaign tone – Labour –Campaign tone – Lib Dems + +Campaign tone – SNP
Note: signs indicate direction of relationship, where signs in bold p ≤ . 05, otherwise p ≤.1Sources: SES pre- and post-election surveys.
Table 6.1 is particularly useful in highlighting those variables thatturned out to have no independent influence over electoral choicein 2011. Sometimes this has more to do with the parties than withthe voters. For example, neither the Likert item on spending cuts(‘In the current economic climate, the government should main-tain the size of the public sector’) nor the 0–10 tax-spending scale(see Figure 4.1) showed a significant association with party choice.This is not because voters do not care or are of one mind when itcomes to the public finances; rather, it is because the major parties –especially Labour and the SNP but with the Conservatives only apartial exception – offer little choice on that issue.
Other non-significant variables tell us about how voters simplifythe decision making process. Voters’ assessments of outcomes in spe-cific issue domains (see Table 4.2) had no separate impact on partychoice in 2011. More strikingly, given the context of the election,economic expectations also had no significant effect. Instead, it wasthe overall performance evaluations – of the SNP in office, and Labourhad it been in office – that drove voting behaviour. Of course, specificpolicies, events and economic evaluations will feed into those over-all assessments – we are certainly not arguing that the government’srecord on health, crime or the economy is irrelevant. The point israther that, when it comes to polling day, it is the overall impression –what Fiorina would call the ‘running tally’ – that matters rather thanthe detailed information that built it.
10.1057/9781137023704 - More Scottish than British, Christopher Carman, Robert Johns and James Mitchell
Co
pyr
igh
t m
ater
ial f
rom
ww
w.p
alg
rave
con
nec
t.co
m -
lice
nse
d t
o U
niv
ersi
ty o
f S
ydn
ey -
Pal
gra
veC
on
nec
t -
2014
-08-
27

136 More Scottish than British
A different type of simplification is shown by the non-significanceof the Liberal Democrat performance variable. Rather than trying toassess separately the contributions of the two Westminster coalitionpartners, voters look to have judged this basically as a Conserva-tive government. On this reading, the Liberal Democrats’ very poorshowing in the 2011 election is owed to their decision to jointhe Conservatives in the first place rather than to their perceivedperformance in that coalition. This is consistent with the party’strajectory in the opinion polls. Another notable feature of the over-all performance evaluations is that Labour’s record as the outgoingWestminster government looks to have done little to win or losethe party votes in 2011. What mattered was how voters thoughtthat Labour would have performed in office at Holyrood. To thatextent, the 2011 Holyrood election was more of a first-order con-test; however, the significant effects of Conservative performance atWestminster show that some UK-level considerations continue tobear on voting in Scottish Parliament elections.
One final pair of variables that is noticeably non-significant is theratings of the SNP’s general image and the tone of its campaigningin particular. It seems that the cornerstones of the party’s successwere the more tangible aspects of ‘performance politics’, notably thefavourable assessments of its record at Holyrood and the popularityof Alex Salmond. This is not to say that the intangibles were unim-portant; as we have often noted, voters’ impressions of a party witha positive image and agenda may bias their perceptions of its record.However, judging by Table 6.1, insofar as image and campaign tonecontributed to the SNP’s success, it was because the (typically nega-tive) ratings of the other parties will have cost them votes in 2011.As in previous chapters, in order to illustrate the statistically sig-nificant effects we show the effect that they have on the predictedprobability of voting for each party. Figure 2.1 and the accompa-nying discussion provide the blueprint for the presentation in thischapter. So, in the upcoming graphs, each bar represents the extentto which that predictor variable increases or reduces the probabilitythat a voter will have opted for that party rather than one of the oth-ers. Our method of presenting the data does change in three ways,however. First, because of the much larger number of variables inthese models, we do not present the results for all four parties in thesame figure but instead provide a chart for each major party. Second,
10.1057/9781137023704 - More Scottish than British, Christopher Carman, Robert Johns and James Mitchell
Co
pyr
igh
t m
ater
ial f
rom
ww
w.p
alg
rave
con
nec
t.co
m -
lice
nse
d t
o U
niv
ersi
ty o
f S
ydn
ey -
Pal
gra
veC
on
nec
t -
2014
-08-
27
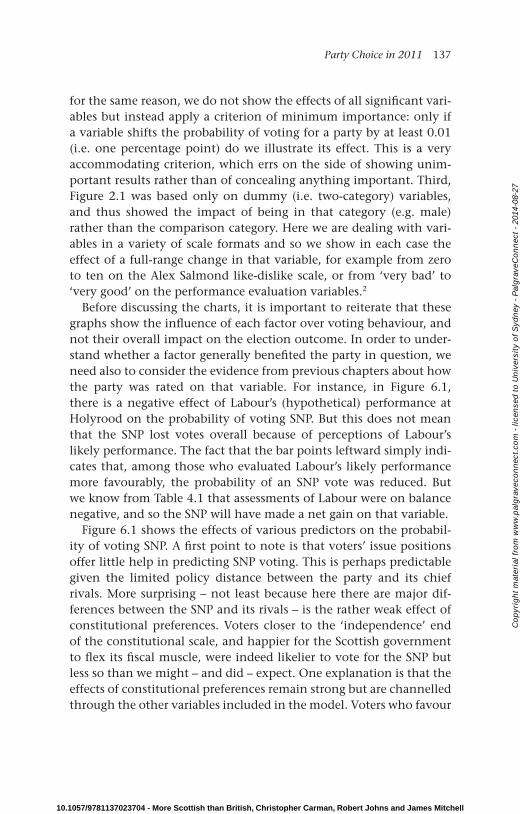
Party Choice in 2011 137
for the same reason, we do not show the effects of all significant vari-ables but instead apply a criterion of minimum importance: only ifa variable shifts the probability of voting for a party by at least 0.01(i.e. one percentage point) do we illustrate its effect. This is a veryaccommodating criterion, which errs on the side of showing unim-portant results rather than of concealing anything important. Third,Figure 2.1 was based only on dummy (i.e. two-category) variables,and thus showed the impact of being in that category (e.g. male)rather than the comparison category. Here we are dealing with vari-ables in a variety of scale formats and so we show in each case theeffect of a full-range change in that variable, for example from zeroto ten on the Alex Salmond like-dislike scale, or from ‘very bad’ to‘very good’ on the performance evaluation variables.2
Before discussing the charts, it is important to reiterate that thesegraphs show the influence of each factor over voting behaviour, andnot their overall impact on the election outcome. In order to under-stand whether a factor generally benefited the party in question, weneed also to consider the evidence from previous chapters about howthe party was rated on that variable. For instance, in Figure 6.1,there is a negative effect of Labour’s (hypothetical) performance atHolyrood on the probability of voting SNP. But this does not meanthat the SNP lost votes overall because of perceptions of Labour’slikely performance. The fact that the bar points leftward simply indi-cates that, among those who evaluated Labour’s likely performancemore favourably, the probability of an SNP vote was reduced. Butwe know from Table 4.1 that assessments of Labour were on balancenegative, and so the SNP will have made a net gain on that variable.
Figure 6.1 shows the effects of various predictors on the probabil-ity of voting SNP. A first point to note is that voters’ issue positionsoffer little help in predicting SNP voting. This is perhaps predictablegiven the limited policy distance between the party and its chiefrivals. More surprising – not least because here there are major dif-ferences between the SNP and its rivals – is the rather weak effect ofconstitutional preferences. Voters closer to the ‘independence’ endof the constitutional scale, and happier for the Scottish governmentto flex its fiscal muscle, were indeed likelier to vote for the SNP butless so than we might – and did – expect. One explanation is that theeffects of constitutional preferences remain strong but are channelledthrough the other variables included in the model. Voters who favour
10.1057/9781137023704 - More Scottish than British, Christopher Carman, Robert Johns and James Mitchell
Co
pyr
igh
t m
ater
ial f
rom
ww
w.p
alg
rave
con
nec
t.co
m -
lice
nse
d t
o U
niv
ersi
ty o
f S
ydn
ey -
Pal
gra
veC
on
nec
t -
2014
-08-
27

138
Communitysentences
Use tax powersPrison for knife
crime Green/growth scale (growth)
Constitution scale(indep.) Con UK
performanceSNP Scoperformance
Lab Scoperformance
Handle cuts – Con
Handle cuts – Lab
Handle cuts – LD
Salmond
Gray
Goldie
Scott
Cameron
Miliband
Brown
Blair
Image – Con
Image – Lab
Image – LD
Image – SNPSco interests –
Con Sco interests – Lab
Sco interests – LD
Sco interests – SNP
Campaign – Con
Campaign – Lab
Campaign – LD
–1.00 –0.75 –0.50 –0.25 0.00 0.25 0.50 0.75 1.00Average change in predicted probability for a full-range
change in each variable
Figure 6.1 Effects of significant variables on the probability of voting SNPSource: SES pre- and post-election surveys
10.1057/9781137023704 - More Scottish than British, Christopher Carman, Robert Johns and James Mitchell
Co
pyr
igh
t m
ater
ial f
rom
ww
w.p
alg
rave
con
nec
t.co
m -
lice
nse
d t
o U
niv
ersi
ty o
f S
ydn
ey -
Pal
gra
veC
on
nec
t -
2014
-08-
27
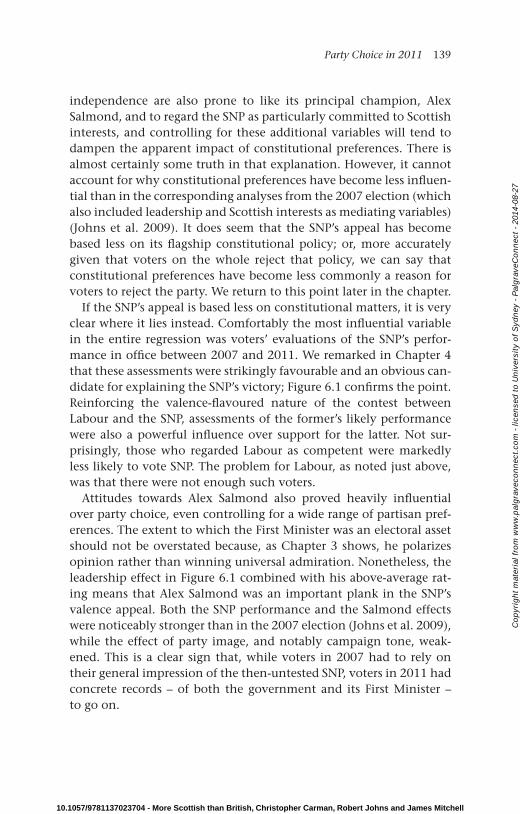
Party Choice in 2011 139
independence are also prone to like its principal champion, AlexSalmond, and to regard the SNP as particularly committed to Scottishinterests, and controlling for these additional variables will tend todampen the apparent impact of constitutional preferences. There isalmost certainly some truth in that explanation. However, it cannotaccount for why constitutional preferences have become less influen-tial than in the corresponding analyses from the 2007 election (whichalso included leadership and Scottish interests as mediating variables)(Johns et al. 2009). It does seem that the SNP’s appeal has becomebased less on its flagship constitutional policy; or, more accuratelygiven that voters on the whole reject that policy, we can say thatconstitutional preferences have become less commonly a reason forvoters to reject the party. We return to this point later in the chapter.
If the SNP’s appeal is based less on constitutional matters, it is veryclear where it lies instead. Comfortably the most influential variablein the entire regression was voters’ evaluations of the SNP’s perfor-mance in office between 2007 and 2011. We remarked in Chapter 4that these assessments were strikingly favourable and an obvious can-didate for explaining the SNP’s victory; Figure 6.1 confirms the point.Reinforcing the valence-flavoured nature of the contest betweenLabour and the SNP, assessments of the former’s likely performancewere also a powerful influence over support for the latter. Not sur-prisingly, those who regarded Labour as competent were markedlyless likely to vote SNP. The problem for Labour, as noted just above,was that there were not enough such voters.
Attitudes towards Alex Salmond also proved heavily influentialover party choice, even controlling for a wide range of partisan pref-erences. The extent to which the First Minister was an electoral assetshould not be overstated because, as Chapter 3 shows, he polarizesopinion rather than winning universal admiration. Nonetheless, theleadership effect in Figure 6.1 combined with his above-average rat-ing means that Alex Salmond was an important plank in the SNP’svalence appeal. Both the SNP performance and the Salmond effectswere noticeably stronger than in the 2007 election (Johns et al. 2009),while the effect of party image, and notably campaign tone, weak-ened. This is a clear sign that, while voters in 2007 had to rely ontheir general impression of the then-untested SNP, voters in 2011 hadconcrete records – of both the government and its First Minister –to go on.
10.1057/9781137023704 - More Scottish than British, Christopher Carman, Robert Johns and James Mitchell
Co
pyr
igh
t m
ater
ial f
rom
ww
w.p
alg
rave
con
nec
t.co
m -
lice
nse
d t
o U
niv
ersi
ty o
f S
ydn
ey -
Pal
gra
veC
on
nec
t -
2014
-08-
27

140 More Scottish than British
There remained a specifically Scottish dimension to the SNP’svalence appeal, however. Although the party’s own rating on han-dling ‘cuts from Westminster’ did not prove a significant influenceover voting behaviour, it will have gained from the widespreadscepticism about the Conservatives and Liberal Democrats in thatregard. On the key general indicator of concern for Scottish inter-ests, Figure 6.1 shows that the SNP will have gained both fromtheir own strong rating and from any doubts about Labour’s creden-tials. However, as Table 4.7 confirms, Labour’s perceived commitmentto Scottish interests was not as widely questioned as their generalcompetence. So the strong effect in Figure 6.1 of Labour’s Scottishinterests rating will have translated into little overall effect on theSNP. Labour was able to prevent support leaking to the SNP to theextent that it could persuade voters that it was also standing up forScotland.
That brings us to Figure 6.2 and the factors influencing the prob-ability of voting for Labour. Indeed, these results closely parallelthose from Figure 6.1, re-emphasizing that the election was first andforemost a valence battle between the incumbent SNP and its onlyrealistic challenger for office. Position issues are again largely irrele-vant, with just small effects for constitutional preferences indicatingthat Labour has largely become, if anything, a party for those scepti-cal not just about independence but even about the use of Holyrood’stax powers. Performance was again overwhelmingly important: those(a substantial minority) who thought Labour would have performedwell were far more likely to vote for the party; those (a clear majority)who thought the SNP had performed well were far less likely to voteLabour.
Leadership mattered too, but a good deal less and in a way thatgraphically illustrates the difference in profile between the two con-tenders for First Minister. The probability of voting for Labour wasclearly negatively associated with ratings for Alex Salmond, but wasunaffected by voters’ attitudes to the party’s own leader, Iain Gray.The latter’s lacklustre showing may have contributed to doubts aboutLabour’s general performance but overall, rather than costing hisparty votes as was suggested in much critical campaign coverage,Gray seems instead to have been largely peripheral to the outcome.Perhaps because of Iain Gray’s relative obscurity, it was Labour’sWestminster leaders who mattered in 2011 and there is at least some
10.1057/9781137023704 - More Scottish than British, Christopher Carman, Robert Johns and James Mitchell
Co
pyr
igh
t m
ater
ial f
rom
ww
w.p
alg
rave
con
nec
t.co
m -
lice
nse
d t
o U
niv
ersi
ty o
f S
ydn
ey -
Pal
gra
veC
on
nec
t -
2014
-08-
27

141
Communitysentences
–1.00 –0.75 –0.50 –0.25 0.00 0.25 0.50 0.75 1.00Average change in predicted probability for a full-range
change in each variable
Oppose free prescriptions
Use tax powersPrison for knife
crimeTax-spend scale(increase) Constitution scale
(indep.)Con UK performance SNP Sco
performanceLab Sco
performanceHandle cuts – Con
Handle cuts – Lab
Handle cuts – LD
Salmond
Goldie
Cameron
Clegg
Miliband
Brown
Blair
Image – Con
Image – Lab
Image – LLD
Image – SNPSco interests –
ConSco interests – Lab
Sco interests – LDSco interests –
SNPCampaign – Lab
Figure 6.2 Effects of significant variables on the probability of voting LabourSource: Pre- and post-election surveys
10.1057/9781137023704 - More Scottish than British, Christopher Carman, Robert Johns and James Mitchell
Co
pyr
igh
t m
ater
ial f
rom
ww
w.p
alg
rave
con
nec
t.co
m -
lice
nse
d t
o U
niv
ersi
ty o
f S
ydn
ey -
Pal
gra
veC
on
nec
t -
2014
-08-
27

142 More Scottish than British
sign of the sympathy vote for Gordon Brown. The less favourableevaluations of Miliband and especially Blair (see Table 3.7) mean thatthey will, if anything, have cost the party a few votes.
Again in parallel to the SNP analysis, the only other factor thatstrongly influenced voters’ likelihood of choosing Labour was theScottish interests ratings, and, again, evaluations of both major par-ties mattered. As noted above, because Labour was almost equallywidely trusted and distrusted in terms of commitment to Scottishinterests, the net electoral effect of its rating will have been negligible.However, the fact that Labour was much less popular among thosecrediting the SNP with commitment to Scottish interests, coupledwith the fact that the large majority of voters fell into that category,means a considerable loss of support and thus another reason whythe party eventually trailed so far behind in second place.
Moving to the Conservative analysis, we first notice the rathersmaller size of the graph (Figure 6.3). Not only did fewer of thevariables have a noteworthy impact on the probability of voting Con-servative in 2011, but none of those impacts were on anything likethe scale of the performance effects in the SNP and Labour analy-ses. In a sense, this reinforces our conclusion about the importanceof ‘performance politics’ in 2011: because the Conservatives werenot realistic contenders for office, it is harder to predict why vot-ers would or would not support them. However, this valence accountdoes not extend to second-order voting based on UK-level perfor-mance. Voting for the Conservatives in 2011 was almost unaffectedby perceptions of the party’s record at Westminster; more attentionwas paid to the Holyrood party’s capacity – widely seen as verylimited – to manage the impact on Scotland of the coalition’s bud-get cuts. Some voters were also mindful of the Conservatives’ broadercommitment to defending Scottish interests. In neither the specificnor the general variable case will these effects have worked to theparty’s advantage (see Table 4.7).
There is also little sign that the Conservatives will have gainedfrom having, in Annabel Goldie, a relatively popular leader. As inthe Labour analysis, and reinforcing the dominant position of AlexSalmond, the probability of voting Conservative was more influencedby attitudes to the First Minister than by attitudes to the party’s ownleader. Also as in the Labour analysis, the party’s Scottish leader seemsto have been overshadowed by a prominent figure at Westminster.
10.1057/9781137023704 - More Scottish than British, Christopher Carman, Robert Johns and James Mitchell
Co
pyr
igh
t m
ater
ial f
rom
ww
w.p
alg
rave
con
nec
t.co
m -
lice
nse
d t
o U
niv
ersi
ty o
f S
ydn
ey -
Pal
gra
veC
on
nec
t -
2014
-08-
27

Party Choice in 2011 143
–1.00 –0.75 –0.50 –0.25 0.00 0.25 0.50 0.75 1.00Average change in predicted probability for a full-range
change in each variable
Oppose freeprescriptions
Tax-spend scale(increase)
Green/growth scale (growth)
Con UK performance
SNP Sco performance
Handle cuts – Con
Handle cuts – Lab
Salmond
Gray
Goldie
Cameron
Clegg
Miliband
Blair
Image – Con
Sco interests –Con
Sco interests – LD
Campaign – Con
Campaign – LD
Figure 6.3 Effects of significant variables on the probability of votingConservativeSource: Pre- and post-election surveys
Table 3.7 confirms that the Conservatives would have been better offhad voters focused on Annabel Goldie more than on David Cameron.
A final notable feature of the Conservative results is the very weakeffects of issue positions. There are two reasons why this is surprising:
10.1057/9781137023704 - More Scottish than British, Christopher Carman, Robert Johns and James Mitchell
Co
pyr
igh
t m
ater
ial f
rom
ww
w.p
alg
rave
con
nec
t.co
m -
lice
nse
d t
o U
niv
ersi
ty o
f S
ydn
ey -
Pal
gra
veC
on
nec
t -
2014
-08-
27

144 More Scottish than British
first, at least among the major parties, the Conservatives offer themost distinctive ideological or policy profile; second, as the partywas unlikely to achieve office, we would expect its voters to beassessing its policies more than its expected performance. Yet, eventhough several of the issues that we asked about bear on the left-rightscale on which the Conservatives are at least somewhat separatedfrom the other parties, there is virtually no sign of an ideologicalvote. And there was not even any significant effect of constitutionalpreferences, despite the party’s strongly unionist history. All of thisreinforces the impression that the party is confined to a rump of par-tisans with a fairly distinctive socio-demographic profile but unableto attract new voters to its ideas and programme.
If it proved rather harder to predict voting for the Conservativesthan for the two major parties, it proved all but impossible to accountfor Liberal Democrat support. That is a familiar story from UK elec-tions (Fieldhouse and Russell 2001) but this is an extreme case ofthat general tendency. Compared to the 45 variables in Table 6.1,Figure 6.4 reports just seven effects, none of them anything morethan meagre in size. The few that stand out at all can help to explainthe party’s poor showing. Liberal Democrat voting was significantlyless likely among those that distrusted the party’s ability to handlethe cuts and those that rated its Scottish leader unfavourably, andboth groups were comfortable majorities in the electorate. In such anuneventful graph, it is more instructive to consider the dogs that didnot bark and, of these, probably the most obvious are attitudes toNick Clegg and evaluations of the Liberal Democrats’ performance ingovernment at Westminster. It would stretch credulity beyond break-ing point to argue that the party’s plummeting poll ratings sinceforming the 2010 coalition had nothing to do with its disastrousshowing in 2011, and indeed that it is not what is implied by the(non-) findings in Figure 6.4. We reach here the limits of what theSES can do to explain a shift in opinion that happened almost a yearearlier. Our survey can tell us that, in May 2011, those who liked NickClegg more were not noticeably more likely to vote Liberal Democratin the Scottish Parliament election. This is indeed counter-intuitive.However, it is consistent with the idea that the Liberal Democrats,by joining the Conservatives in coalition, had by June 2010 ensuredtheir rejection by the vast majority of Scottish voters. Some of thesecame to dislike Clegg intensely, others were a little more forgiving,
10.1057/9781137023704 - More Scottish than British, Christopher Carman, Robert Johns and James Mitchell
Co
pyr
igh
t m
ater
ial f
rom
ww
w.p
alg
rave
con
nec
t.co
m -
lice
nse
d t
o U
niv
ersi
ty o
f S
ydn
ey -
Pal
gra
veC
on
nec
t -
2014
-08-
27

Party Choice in 2011 145
–1.00 –0.75 –0.50 –0.25 0.00 0.25 0.50 0.75 1.00Average change in predicted probability for a full-range
change in each variable
Handle cuts – LD
Salmond
Scott
Brown
Image – LD
Sco interests – LD
Campaign – Lab
Campaign – LD
Figure 6.4 Effects of significant variables on the probability of voting LiberalDemocratSource: Pre- and post-election surveys.
but neither group voted Liberal Democrat anyway and so the impactof evaluations of Clegg on party choice is negligible.
Explaining the outcome
We referred earlier in the chapter to the risk of an over-simplifiedaccount of the election. Yet these graphs suggest that a simpleaccount is justified. Party choice in 2011 was driven overwhelminglyby overall assessments of the SNP’s record in office and Labour’s likelyperformance had it been in power. As the SNP enjoyed a big leadover Labour on that yardstick, the outcome of the election – and theunanticipated scale of SNP victory – is thus also straightforwardlyexplained. This election was a clear case of ‘performance politics’.
Of course, this simply pushes the question back a causal stage: wethen need to explain why it is that the SNP’s record was evaluatedso much more positively than Labour’s expected performance? Forthis reason, it would be premature to conclude that the other factors
10.1057/9781137023704 - More Scottish than British, Christopher Carman, Robert Johns and James Mitchell
Co
pyr
igh
t m
ater
ial f
rom
ww
w.p
alg
rave
con
nec
t.co
m -
lice
nse
d t
o U
niv
ersi
ty o
f S
ydn
ey -
Pal
gra
veC
on
nec
t -
2014
-08-
27

146 More Scottish than British
discussed in this book – even those which, according to Table 6.1, hadno significant effect on party choice – were unimportant. Those fac-tors are quite likely to have fed in to the performance evaluations thatthen proved so important. For instance, voters who share a party’spolicy orientation are more likely to be satisfied with its performance,because one aspect of performance is enacting those preferred poli-cies. Yet the broader conclusion about ‘performance politics’ remainsvalid. The dominance of performance evaluations in the regressionresults suggests that most of the other variables matter largely – insome cases only – insofar as they shape evaluations or expectationsof performance. And this is a noteworthy conclusion in the broadercontext of electoral research because such variables have generallybeen regarded as having an independent impact. The argument wasnot that voters support the party closest to them ideologically merelybecause they would then expect that party to perform best in office;proximity was held to be desirable for other reasons. This would leadus to expect an association between policy positions and party choiceeven when controlling for performance evaluations and, indeed, suchan effect does show up in parallel models of voting at UK generalelections (e.g. Clarke et al. 2009, 2011). Proximity matters in generalelections, then, even if ‘performance politics’ still prevails. It is inthis Scottish Parliament election that the valence model dominatesthe proximity model so completely.
This might be thought counter-intuitive given that it is themajoritarian electoral system at Westminster that is held to encour-age policy convergence and thus encourage valence voting, whileproportional systems allow for more ideological diversity. However,we need to consider the party system as well as the electoral systemand, in particular, the absence of the Conservatives as serious con-tenders in Scotland. This means that the leading rivals for office atWestminster, even if they have converged dramatically in compari-son with the polarized 1980s, remain more distinct than the leadingrivals at Holyrood. Aside from the constitutional issue, voters findvirtually no difference between Labour and the SNP. In this context,electoral competition based largely on performance is exactly whatwe would expect (Green 2007).
Before continuing, we should address a reason why some mightbe sceptical about the powerful performance effects observed in ouranalyses. The problem, known technically as ‘endogeneity’, is that
10.1057/9781137023704 - More Scottish than British, Christopher Carman, Robert Johns and James Mitchell
Co
pyr
igh
t m
ater
ial f
rom
ww
w.p
alg
rave
con
nec
t.co
m -
lice
nse
d t
o U
niv
ersi
ty o
f S
ydn
ey -
Pal
gra
veC
on
nec
t -
2014
-08-
27

Party Choice in 2011 147
performance evaluations might be thought the consequence ratherthan the cause of voting intentions. The argument runs thus: thosewho already intend to vote for a party for other reasons will tend toevaluate its record more favourably, and to decry those of its rivals,and so we would see a strong correlation between performance assess-ments and party choice without any implication that the formerdrive the latter. This complaint is particularly compelling where per-formance evaluations are collected in a post-election survey, whenthe vote has already been cast. However, it also carries force in situa-tions like this one where vote is predicted by pre-election evaluations,because many people will already have made up their mind by thenand so already have the incentive to bring their performance evalua-tions into line with their vote intention. Yet there are four reasons tobelieve that our conclusion about performance politics stands firm.
The first is that these very detailed models of party choice includecontrols for most of the ‘other reasons’ that could drive vote inten-tion. Many voters will indeed have already decided to vote for theSNP because of its constitutional stance, its commitment to Scottishinterests, its leader, and so on, but these variables cannot explain theperformance effects because they are held constant in the regressionanalyses. Second, the evaluations of SNP performance were retro-spective. Expectations of future records are more uncertain, moreimpressionistic and thus more likely to be contaminated by partisanbias. By contrast, as we saw in Chapter 4, there was a fair degree ofconsensus about the SNP’s showing – much more so than we wouldexpect if evaluations simply reflected party sympathies. A third rea-son is that we would expect endogeneity bias to afflict any explicitlypartisan variable in the model. Those who already like a party shouldgive favourable ratings not only to its performance but also to itsimage, campaigning, ability to handle spending cuts, and so on.Why, then, was it the performance variables that had the strongestassociations with party choice? The obvious answer is that they areindeed the most important influence on voting behaviour. Fourth,by considering only those who were not sure how they would voteat the time of the pre-election survey, we can isolate a group whoseperformance evaluations are less likely to be biased by partisan predis-positions. In an analysis of those ‘undecided’ voters, the performanceeffects were just as strong as in – indeed, slightly stronger than – thesample as a whole. Again, the explanation most consistent with the
10.1057/9781137023704 - More Scottish than British, Christopher Carman, Robert Johns and James Mitchell
Co
pyr
igh
t m
ater
ial f
rom
ww
w.p
alg
rave
con
nec
t.co
m -
lice
nse
d t
o U
niv
ersi
ty o
f S
ydn
ey -
Pal
gra
veC
on
nec
t -
2014
-08-
27

148 More Scottish than British
empirical evidence is that performance assessments really did drivethe eventual party choice.
However, performance evaluations were not the only thing thatmattered. Leadership was, in some form or other, a significant andoften quite a powerful predictor of support for all four parties. Atti-tudes to Alex Salmond were clearly and strongly influential over thepropensity to vote for the SNP, Labour and the Conservatives (seeFigures 6.1–6.3). No other leader left anything like that stamp on theelection and, indeed, accusations that Iain Gray was an insignificantfigure are borne out by the fact that evaluations of the Scottish Labourleader had no statistically significant effect. Nonetheless, overall,leader evaluations were second only to performance evaluations inthe Labour and SNP analyses and were the strongest (if, in absoluteterms, still rather weak) effects on choice for the other two parties.
In referring to leadership as having an effect distinct from – thatis, over and above – that of performance, we diverge from the inter-pretation of leader effects put forward by Clarke et al. (2004, 2009,2011) in their analyses of UK general election voting. They regardleaders principally as a heuristic device to judge parties’ likely perfor-mance. If voters see a competent leader, they anticipate competentperformance from his or her party. This may well be the case but,as assessments of party performance are extensively controlled in ourregression analyses, there is obviously more to leadership voting thana competence heuristic. Leaders might also be a cue to party charac-teristics other than competence. Stevens et al. (2011) find that, in the2010 general election, trustworthiness was the leadership trait thatdid most to influence voting behaviour, and voters might reasonablyinfer that the party of a trustworthy leader is more likely to keep itspromises. Yet we also control for that latter variable as part of theparty image variable. Indeed, insofar as the key characteristics of par-ties are held constant in analyses like these, any remaining leadereffects look like a more direct or ‘pure’ effect of leadership. Votersare simply more likely to vote for a party whose leader’s personalityappeals to them, an effect greatly magnified when that personality isas prominent and familiar as that of Alex Salmond.
This point is reinforced by the effects of evaluations of Westminsterfigures. If leadership was simply a cue to party competence, thenthese figures would be irrelevant because they were not up forelection and cannot – except highly indirectly – influence the
10.1057/9781137023704 - More Scottish than British, Christopher Carman, Robert Johns and James Mitchell
Co
pyr
igh
t m
ater
ial f
rom
ww
w.p
alg
rave
con
nec
t.co
m -
lice
nse
d t
o U
niv
ersi
ty o
f S
ydn
ey -
Pal
gra
veC
on
nec
t -
2014
-08-
27

Party Choice in 2011 149
performance of the Scottish government. (Some of them wereretired, in any case.) However, setting aside the dominant figure ofSalmond, the evaluations of various Westminster leaders proved, ifanything, more influential than those of Iain Gray, Annabel Goldieand Tavish Scott. That is consistent with a simple ‘personality voting’account of leadership effects. Together, prominence and popularity(or unpopularity) are sufficient conditions for a leader to win (or lose)his or her party votes.
To recap: the single most important reason for the outcome of the2011 election was the strongly positive assessment of the SNP’s termin office. A second plank in the party’s victory was the popularity ofAlex Salmond, who was not only rated a good deal more favourablythan any of his Holyrood contenders but was also quite a lot morepopular than he had been in 2007, which helps to explain why theSNP was able to extend its margin of victory so dramatically. (IainGray’s rating was no better than Jack McConnell’s unimpressive eval-uations in 2007, thus also helping to explain why Labour’s vote shareremained steady.)
The third important factor is the SNP’s clear advantage overLabour – and massive advantage over the other parties – in termsof ‘looking after Scottish interests’. Like leadership, this variable wasimportant across the regressions: that is, the prospects of all four par-ties depended at least to some extent on whether they were seen asdefending Scotland. When it comes to the central battle between theSNP and Labour, there was an interesting asymmetry on the ‘Scottishinterests’ effects – it was perceptions of Labour that mattered more.The likeliest reason for this is that Labour’s credentials were more indoubt. As Table 4.7 confirms, most voters credited the SNP with astrong commitment to Scottish interests, regardless of whether theysupported the party. Put another way, there was little scope for the‘Scottish interests’ variable to discriminate between those who didand those who did not vote for the SNP. (A parallel argument can bemade about the more specific issue of managing the impact of spend-ing cuts from Westminster. Voters’ generally positive endorsementsof the SNP on this criterion turned out to matter little; it was evalua-tions of Labour that mattered more. Because, as Table 4.7 also shows,Labour had a more mixed report, this ‘defending Scotland againstthe cuts’ variable was not the vote-winner that the party’s strategistsappear to have thought it would be.)
10.1057/9781137023704 - More Scottish than British, Christopher Carman, Robert Johns and James Mitchell
Co
pyr
igh
t m
ater
ial f
rom
ww
w.p
alg
rave
con
nec
t.co
m -
lice
nse
d t
o U
niv
ersi
ty o
f S
ydn
ey -
Pal
gra
veC
on
nec
t -
2014
-08-
27

150 More Scottish than British
When respondents judge whether a party ‘looks after’ or ‘defends’Scottish interests, an obvious question is: against what? One of thelimitations of such survey data is that we lack detailed information inanswer to that question. However, the accumulated evidence pointsto some conclusions. First, this is not some kind of extension of theconstitutional issue. Certainly there should be no implication thatthose who opposed devolution in the first place, or who oppose‘more powers’ or independence now, are any less keen to defendScottish interests. Instead, it probably has more to do with fight-ing Scotland’s corner within whatever are the current constitutionalarrangements. But even that may be too narrow an interpretationof what is potentially a very broad notion. There may well bewidespread disagreement about what it means to serve Scottish inter-ests, as well as about how they would be best served. Where there isno significant disagreement is in whether they should be served. Thatis why, in previous discussions, we have referred to Scottish inter-ests as a valence issue (Johns et al. 2010, 2013). Voters might varyin the extent to which they feel British as well as Scottish, and dis-agree about the constitutional arrangements that best serve Scotland,but they are more or less unanimous in wanting the Scottish gov-ernment to deliver the best deal for the country. Put another way,this is the Scottish dimension of ‘performance politics’. In a ScottishParliament election, impressions of a party’s willingness and abilityto defend Scottish interests are an important component of overallperformance evaluations.
The SNP has long been highly regarded in this respect. ‘Standingup for Scotland’s interests’ is one of the two core goals enshrinedin the party’s constitution and is a point that seems to be acknowl-edged even by those who do not support its other goal of indepen-dence. The SNP’s favourable ratings on ‘Scottish interests’ recordedin Table 4.7 are an echo of Miller’s (1981) finding that the party’s1970s breakthrough was widely regarded, even by Labour and Con-servative sympathizers, as a good thing for Scotland. The other mainparties’ reputations in terms of defending Scottish interests are, atbest, much less secure. One obvious reason for this is that, whilethe formal structures and relationships may vary, all three are insome sense Scottish versions of a British party. As such, the cre-dentials of the Scottish party depend in part on events and policiesat Westminster. In the 1980s and 1990s, Labour won considerable
10.1057/9781137023704 - More Scottish than British, Christopher Carman, Robert Johns and James Mitchell
Co
pyr
igh
t m
ater
ial f
rom
ww
w.p
alg
rave
con
nec
t.co
m -
lice
nse
d t
o U
niv
ersi
ty o
f S
ydn
ey -
Pal
gra
veC
on
nec
t -
2014
-08-
27

Party Choice in 2011 151
credit for defending Scottish interests, being a left-leaning (and theonly realistic) opposition to a Conservative government seen as anti-Scottish. The downturn in Labour’s reputation in this regard followedtheir return to power at Westminster, and Table 4.7 confirms that theConservatives and Liberal Democrats also lost ground on ‘Scottishinterests’ on taking power at the UK level.
In this context, and with a view to explaining the 2011 outcome,the most pertinent question is why Labour saw only a negligibleimprovement in its reputation for defending Scotland following its2010 defeat at Westminster. The party certainly seemed to anticipatemore of a boost, judging by its main 2011 campaign strategy which,at least until the final days before polling, was to try to reawakenScottish hostility towards the Conservatives. Such hostility probablywas reawakened – indeed, it had not exactly been dormant anyway –but there are two reasons why Labour was not a beneficiary. First,devolution made the SNP into a credible contender for governmentin Scotland and thus a rival to Labour when it comes to defendingScottish interests against the perceived threat posed by a Conserva-tive government at Westminster. Second, as we showed in Chapter 4,Labour’s commitment to Scottish interests has been somewhat under-mined by its constitutional stance, notably the perceived oppositionto further devolution (see also Johns et al. 2010, ch. 5). By contrast,the SNP’s commitment to independence wins it credit for fightingfor Scottish interests, even among opponents of these constitutionaloptions. The upshot is that the SNP currently looks the more crediblerepository of anti-Tory feeling and so, following the Conservatives’return to power at Westminster, it was the SNP’s rather than Labour’sScottish interests rating that increased significantly.
How Scotland votes today
Conspicuously absent from that account of the 2011 election out-come was the constitutional issue that has been central to Scottishpolitical debate, and to the winning party’s platform, for decades.One reason for this is precisely because the issue is so familiar.Many voters have very firmly held nationalist or unionist views, andthese long-held constitutional preferences will often have cementedinto enduring identifications with the parties that share them. Theresult is that the votes of those who strongly oppose or strongly
10.1057/9781137023704 - More Scottish than British, Christopher Carman, Robert Johns and James Mitchell
Co
pyr
igh
t m
ater
ial f
rom
ww
w.p
alg
rave
con
nec
t.co
m -
lice
nse
d t
o U
niv
ersi
ty o
f S
ydn
ey -
Pal
gra
veC
on
nec
t -
2014
-08-
27
152 More Scottish than British
support independence are largely determined long before polling day.In turn, the constitutional issue is less useful in explaining electoralchange and hence election outcomes. Certainly the constitution can-not explain the sharp increase in SNP support between 2007 and2011 – just as it could not explain the party’s similarly major gainsbetween 2003 and 2007 – because, as any observer of Scottish pub-lic opinion knows, support for independence has basically flatlinedduring that entire period. The period since devolution has seen con-siderable electoral volatility but very little change in constitutionalpreferences, reinforcing the point that the latter is not driving theformer. Put bluntly, we know that this election was won on perfor-mance because the SNP could not and would not have won it onpolicy.
There is a distinction between explaining an overall election out-come and explaining individual voters’ decisions. The constitutionalissue is more useful for the latter purpose: there remain significantnumbers of voters who will invariably vote for or against the SNPbecause of its pro-independence stance. It was the only positionissue that showed much sign of electoral importance, unsurprisinglygiven that it is the only such issue on which the leading contenderstake – and are perceived as taking – sharply differing positions. How-ever, we noted in discussing Figure 6.1 that the constitution seemsto be diminishing in its influence over party choice. One reasonfor this in 2011 was that the economy took centre stage, reducingthe proportion of voters citing any other major issue – includingindependence – as the most important in their voting decision. Yetit was not the economic variables that drove party choice in 2011.The importance of the constitutional issue has instead waned relativeto that of more general valence variables like performance, leader-ship and Scottish interests. And it is implausible to argue, along thelines sketched earlier, that the latter variables are simply the chan-nel through which constitutional preferences take electoral effect.Of course, those who favour independence are more likely to evalu-ate the SNP and Alex Salmond more favourably. But there are too fewsupporters of independence to generate the kind of positive evalua-tions of the SNP’s record, image and leadership that were recorded inthe 2011 SES. What has happened over the past two elections, then,is that the SNP built up an election-winning coalition of support, ofwhich longstanding supporters of independence form the foundation
10.1057/9781137023704 - More Scottish than British, Christopher Carman, Robert Johns and James Mitchell
Co
pyr
igh
t m
ater
ial f
rom
ww
w.p
alg
rave
con
nec
t.co
m -
lice
nse
d t
o U
niv
ersi
ty o
f S
ydn
ey -
Pal
gra
veC
on
nec
t -
2014
-08-
27

Party Choice in 2011 153
but represent a dwindling proportion. The newer ‘recruits’ to theparty are attracted by the key variables in our ‘performance politics’model, and those have now become the most potent predictors of anSNP vote.
There is a parallel here with evidence from a late 2007 survey ofthe SNP membership. It showed that those who joined the partymore recently – notably in the surge following reorganization andSalmond’s resumption of the leadership in 2004 – were markedly lesslikely to cite independence as their main reason for signing up, andmore likely instead to mention the party’s leadership, its commit-ment to Scottish interests, or some other more performance-relatedendorsement of the party (Mitchell et al. 2011). Given the evidencepresented in this book, and the fact that the SNP’s membership hasgrown quickly alongside its vote share, we might reasonably expectthat trend to have continued, even accelerated. Again, then, the rel-ative importance of support for independence within the SNP can beseen as having declined.
Turning back to electoral support, we might interpret the stronglyvalence-flavoured basis of the SNP’s 2011 vote as showing the successof the party’s strategic approach. Summarized crudely, this was toemphasize its governing competence and, as far as possible, to allayfears about independence. As the SNP vote increases (but supportfor independence does not), it follows that the proportion of SNPvoters who support its flagship policy is declining. The party there-fore has an incentive to downplay its constitutional ambitions or, atleast, to emphasize its other offerings. Its commitment to a referen-dum was the foundation stone of this strategy in 2011 as in 2007.Besides, of course, voters in 2011 could look back on a term of SNPgovernment – albeit, crucially, a minority administration – duringwhich the prospect of independence had apparently advanced no fur-ther. As we saw in Chapter 4, all of this served to weaken in voters’minds any association between an SNP victory and the likelihood ofScottish independence. And, again as in 2007, the party was thus ableto maximize the electoral profit accruing from its advantages on keyvalence criteria.
Now that the SNP has won a majority and was thus able tolegislate for an independence referendum in October 2014, any strat-egy of downplaying the party’s commitment to independence hasobviously to be shelved. More generally, the relationship between
10.1057/9781137023704 - More Scottish than British, Christopher Carman, Robert Johns and James Mitchell
Co
pyr
igh
t m
ater
ial f
rom
ww
w.p
alg
rave
con
nec
t.co
m -
lice
nse
d t
o U
niv
ersi
ty o
f S
ydn
ey -
Pal
gra
veC
on
nec
t -
2014
-08-
27

154 More Scottish than British
Holyrood election outcomes and Scotland’s constitutional future isset to change. Given the uncertainty over the referendum result, itis difficult and probably fruitless to speculate on the nature of thatchange. What we can argue with more confidence is that ‘perfor-mance politics’ looks likely to remain a convincing explanation forScottish Parliament election outcomes. One reason for this is thatthere seems no immediate prospect of ideological divergence. Whilethe leading parties retain broadly similar outlooks and objectives, vot-ers have little option but to choose according to which contenderseems most likely to achieve these shared aims.
But there are less contingent reasons, too. First, while it wouldbe an exaggeration to talk of two-party politics, a party system hasemerged wherein the two leading contenders are large enough to bethe only plausible contenders to lead a government. Second, thereis the arrival of ‘alternance’: that is, the alternating of those twomajor parties in power. As we noted in Chapter 4, most Scottishvoters by 2011 had had experience of both Labour and the SNP inoffice, and that encourages valence comparisons between the two.In 2007, the SNP was for many a potentially attractive option but theparty was largely untested in office (even at local government level).And a likely contributing factor in the party’s positive evaluations in2011 is a sense of reassurance, even relief, that this novice party ofgovernment had not only averted disaster but enjoyed a relativelytranquil term.
It is not only the party system that is bedding in followingdevolution. The Scottish Parliament is using more of the powersavailable to it; and, in turn, citizens come to recognize its role andimpact on their lives. Voters are slowly but steadily perceiving more atstake in Scottish elections and the more that the elected governmentcan do, the more its performance matters. Second-order electionsgive voters the freedom to express their preferences, often for smallerand radical parties; in first-order contests, which Scottish electionsincreasingly resemble, there is more incentive for valence voting.If the Scottish government were seen as economically impotent, anelection in the context of 2011 would have been a highly second-order affair with voters preoccupied by – and commenting on –the attempts of the Westminster government to address the ongo-ing crisis. In fact, however, voters credited the Scottish government
10.1057/9781137023704 - More Scottish than British, Christopher Carman, Robert Johns and James Mitchell
Co
pyr
igh
t m
ater
ial f
rom
ww
w.p
alg
rave
con
nec
t.co
m -
lice
nse
d t
o U
niv
ersi
ty o
f S
ydn
ey -
Pal
gra
veC
on
nec
t -
2014
-08-
27

Party Choice in 2011 155
with considerable influence over economic outcomes, and those whoreported this as their ‘most important issue’ when voting were aslikely to have the Scottish economy as the British economy in mind.The SNP was thus able to profit from its favourable rating in termsof handling the Scottish economy; and Labour gained less than itmight have hoped from its advantage when it came to dealing witheconomic problems at the UK level.
This dual focus of economic voting in 2011 is one example of abroader consequence of devolution. Scottish politics and electionsare increasingly a distinct sphere – and not one that simply orbitsaround Westminster. There are new political institutions with sig-nificant powers, distinctively Scottish issues and public policies, astrikingly different party system, and so on, all of this covered byScottish media increasingly focused on these new ‘domestic’ politics.In this context, it makes more sense to talk about Scottish and UKpolitics in terms of parallel arenas rather than multiple levels. Hier-archy is inherent in the notion of first- and second-order elections,with choice at any given election driven by the level identified asmore important or powerful. However, as noted in Chapter 5, thereis reason to suppose that absolute importance matters more than rel-ative importance. We would expect Scottish Parliament elections tobe predominantly Scottish affairs, not because they have supplantedWestminster elections as first order, but because they are now the rec-ognized ‘general’ elections in an arena regarded by voters, parties andthe media as important.
Again, there is a danger of over-simplifying here. There remains asignificant minority of voters that is focused on British politics evenat Scottish elections. This is not merely a historical legacy of the pre-devolution era; it is encouraged by the fact that three of the main fourparties in Scottish elections are the three main players at Westminster.As the case of the Liberal Democrats in 2011 shows, it is unrealisticto expect voters carefully to distinguish between the policies, recordsand images of the British and Scottish versions of the same party.So we would expect events and personalities from the Westminsterarena to influence voting in Scottish Parliament elections – andvice versa. Nonetheless, the evidence is clear that Scottish Parlia-ment elections are increasingly determined by Scottish-level factors.Figures 6.1–6.4 made the point very clearly by illustrating both the
10.1057/9781137023704 - More Scottish than British, Christopher Carman, Robert Johns and James Mitchell
Co
pyr
igh
t m
ater
ial f
rom
ww
w.p
alg
rave
con
nec
t.co
m -
lice
nse
d t
o U
niv
ersi
ty o
f S
ydn
ey -
Pal
gra
veC
on
nec
t -
2014
-08-
27

156 More Scottish than British
supreme importance of SNP and Labour performance at Holyroodand the negligible influence carried by evaluations of the governingparties at Westminster.
This notion of distinct political arenas, each with its own generalelection, can explain the drastically different outcomes of the 2010general election in Scotland and the 2011 Scottish Parliament elec-tion. There is no great puzzle in the fact that Labour performed farbetter in the first than the second while the SNP did the opposite, andno implication that either election is therefore anything other thanfirst order. Quite simply, Labour was the only plausible challengerto the Conservatives in 2010, a popularity contest that it won withease, and the only plausible challenger to the SNP in 2011, a popular-ity contest that it lost by a similar margin. Just as the 2010 electionturned out to have minimal implications for the 2011 results, thisScottish Parliament election tells us little about how Scotland willvote in the next UK general election in 2015. That contest is toofar away for it to be worth further speculation here; what we can say,however, is that the outcome will be determined by factors belongingin that same Westminster arena.
Further strong support for the idea of parallel political arenas comesfrom our multi-level party identification experiment, which tendedto replicate the results of the 2010 and 2011 elections dependingon whether respondents were primed to consider Westminster orHolyrood politics respectively. It is quite common for voters to havetwo distinct and potentially conflicting party allegiances, one apply-ing in the Scottish and one in the British political arena. Indeed,the word ‘conflicting’ may mislead here because, given the differentelectoral and party systems and hence the different incentives facingvoters in the different arenas, they may pursue exactly the same goalsby supporting a different party depending on the arena in question.For example, the most common ‘mixed’ identification was to sup-port Labour at the UK level but the SNP at the Scottish level. Manyvoters may regard this as the most viable combination for defendingScottish interests in the two arenas. In any case, it is clear that votersnot only distinguish two political arenas but form distinct attitudesand preferences accordingly.
Two of our conclusions are worth reiterating here. First, the 2011Scottish Parliament election took place in its own sphere, distinctfrom and certainly not eclipsed by that of Westminster politics.
10.1057/9781137023704 - More Scottish than British, Christopher Carman, Robert Johns and James Mitchell
Co
pyr
igh
t m
ater
ial f
rom
ww
w.p
alg
rave
con
nec
t.co
m -
lice
nse
d t
o U
niv
ersi
ty o
f S
ydn
ey -
Pal
gra
veC
on
nec
t -
2014
-08-
27

Party Choice in 2011 157
Second, the constitutional question was neither a pivotal factornor even among the most important determinants of party choice.This election was a particularly vivid illustration of the general rulethat voters distinguish between choosing a Scottish government andchoosing a constitutional future. Together, those conclusions makeclear that the 2011 results give little or no guidance about the out-come of the referendum on independence scheduled for October2014. As with Westminster elections, however, our arguments enableus to say something about the basis for voting in the referendum. Andhere we return to the notion of ‘performance politics’. While a largenumber, perhaps already a majority, of Scottish voters have alreadymade up their minds about independence, that still leaves plenty –enough to swing the outcome either way – who are as yet unresolved.Their decisions are likely to be swayed by practice rather than princi-ple; that is, by whether they think that Scotland will perform betteror worse, and be more or less able to defend its own interests, if inde-pendent. In that sense, winning this referendum is another test – andthe stiffest yet – of the performance politics credentials that won theSNP its surprise majority in 2011.
10.1057/9781137023704 - More Scottish than British, Christopher Carman, Robert Johns and James Mitchell
Co
pyr
igh
t m
ater
ial f
rom
ww
w.p
alg
rave
con
nec
t.co
m -
lice
nse
d t
o U
niv
ersi
ty o
f S
ydn
ey -
Pal
gra
veC
on
nec
t -
2014
-08-
27

Appendix 1: The 2011 ScottishElection Study
The 2011 Scottish Election Study (SES) is an ongoing effort to chroniclethe Scottish electorate’s opinions before and after the Scottish Parliamentelections. In addition to the standard pre- and post-election waves (as wereconducted in previous Scottish Election Studies), the 2011 study containeda unique panel component, re-interviewing respondents who participated inthe 2007 SES. The 2011 study was funded by a grant from the Economic andSocial Research Council (ESRC) (ref. 000-22-4539), directed by the authors ofthis volume and was based in the School of Government and Public Policyat the University of Strathclyde. The data and questionnaires are available onthe project’s website (www.scottishelectionstudy.org.uk) and have also beenarchived with the UK Data Archive (www.data-archive.ac.uk).
Data collection
The methodology of the 2011 SES largely reflects that adopted for the 2007SES. The surveys were conducted over the internet, with the fieldwork beingcontracted to YouGov, one of the leading internet survey polling firms inthe UK. The sample was drawn from YouGov’s panel of respondents andwas selected to be demographically representative of the Scottish electorate(details on YouGov’s fieldwork and methods can be found at www.yougov.co.uk/corporate/about). The study was designed as a two-wave panel, interview-ing the same respondents before and after the election. Owing to unforeseendelays, the pre-election survey was not in the field until a week before the elec-tion, thus the 2011 SES is limited in what information it can provide aboutwhat is usually called the ‘long campaign.’
Despite the limitation in covering public opinion over the course of thelong campaign, the SES 2011 does have a distinct advantage over similarelection surveys. The 2011 SES was able to leverage the fact that YouGov con-ducted both the 2007 and 2011 surveys to create a panel design between thetwo election studies. That is, the 2011 survey was able to return to respondentsfrom the 2007 study who were still in the YouGov respondent pool, allowingus to associate the same respondent’s answers to the 2007 questionnaire withtheir 2011 responses. As is detailed in Chapter 5, we are able to leverage thispanel design to associate constitutional preferences and party support overthe two election cycles. Table A1.1 summarizes the key information on thepre- and post-election waves as well as the 2007–2011 panel.
The SES questionnaires developed by the research team sought to retaincontinuity over time and further develop the SES time series by incorporating
158
10.1057/9781137023704 - More Scottish than British, Christopher Carman, Robert Johns and James Mitchell
Co
pyr
igh
t m
ater
ial f
rom
ww
w.p
alg
rave
con
nec
t.co
m -
lice
nse
d t
o U
niv
ersi
ty o
f S
ydn
ey -
Pal
gra
veC
on
nec
t -
2014
-08-
27

Appendix 1: The 2011 Scottish Election Study 159
Wave Fieldwork dates N Response/retentionrate (denominator)
1, pre-election 28 April–4 May 2011 2046 61% (sampledrespondents)
2, post-election 7–16 May 2011 1763 86% (pre-electionrespondents)
2007–2011 Panel 767 49% (2007post-electionrespondents)
Note: The Scottish Parliament election was held on 5 May 2011.
as much of the question wording from the 2007 SES as the 2011 aims andobjectives allowed. The core battery of ‘standard’ survey questions, measur-ing relevant predispositions were included in the 2011 survey. In addition tothe core battery, new questions were developed to further probe respondentconstitutional preferences and responsibility attributions (reflecting the 2011focus on the multi-level nature of the Scottish elections). Additionally, the2011 SES included several ‘split-half’ survey experiments designed to exploremulti-level party identification and understanding of political processes
Representativeness and weighting
To adjust for non-response bias, we made use of weighting variables whenconducting our analyses. As a general rule, we relied on the weight vari-ables supplied by YouGov, which adjust the observed data to reflect the targetsample. The YouGov weight variables take into account respondent demo-graphic and attitudinal variables, including respondent age, gender, socialclass, region, newspaper readership and past vote. In additional analyses,where appropriate and as indicated in the text, we also employ turnoutweights, ensuring that the analysis results match with the actual party choice.
10.1057/9781137023704 - More Scottish than British, Christopher Carman, Robert Johns and James Mitchell
Co
pyr
igh
t m
ater
ial f
rom
ww
w.p
alg
rave
con
nec
t.co
m -
lice
nse
d t
o U
niv
ersi
ty o
f S
ydn
ey -
Pal
gra
veC
on
nec
t -
2014
-08-
27

Appendix 2: Full Results ofStatistical (Regression) Analyses
This Appendix contains the full results of the various statistical analysesassociated with the results presented in graphical form throughout the book.In general, we aimed to make our presentation of statistical results withinthe chapters as easy to interpret as possible. That said, the more statisticallyinclined will want to peruse the complete results in the following tables.Here we display the full results of the ordinary least squared regressions,the multinomial logistic regressions and the structural equations model withunstandardized coefficients (except for the structural model which also dis-plays the standardized coefficients). Each table is numbered according tothe chapter associated with that analysis, and each table’s title indicates thecorresponding figure from the main text.
160
10.1057/9781137023704 - More Scottish than British, Christopher Carman, Robert Johns and James Mitchell
Co
pyr
igh
t m
ater
ial f
rom
ww
w.p
alg
rave
con
nec
t.co
m -
lice
nse
d t
o U
niv
ersi
ty o
f S
ydn
ey -
Pal
gra
veC
on
nec
t -
2014
-08-
27

161
Table A2 2.1 Multinomial logit of regional party choice on demographic characteristics (for Figure 2.1)
Conservative(vs. Labour)
Lib Dems(vs. Labour)
SNP(vs. Labour)
B s.e. p = B s.e. p = B s.e. p =Age 18–34 –0.48 0.36 0.18 0.56 0.47 0.23 –0.07 0.23 0.77Age 55–81 0.60 0.26 0.02 0.29 0.35 0.41 –0.03 0.18 0.86Men 0.20 0.22 0.38 –0.20 0.29 0.48 0.18 0.16 0.26Social class A, B –0.34 0.30 0.26 –0.70 0.41 0.09 –0.02 0.24 0.94Social class C2, D, E –0.75 0.27 0.01 –0.49 0.33 0.14 0.06 0.19 0.74Education, Vocational 0.86 0.50 0.08 –0.32 1.12 0.78 –0.12 0.35 0.74Education, Standard grade 0.24 0.38 0.54 0.30 0.53 0.57 –0.31 0.25 0.22Education, Highers 0.53 0.34 0.12 0.10 0.49 0.85 –0.09 0.22 0.69Education, Degree 0.90 0.39 0.02 1.10 0.49 0.02 0.21 0.25 0.41Religion, Catholic –0.31 0.40 0.44 –1.18 0.94 0.21 –0.39 0.26 0.13Religion, Church of Scotland 0.39 0.27 0.16 0.52 0.34 0.12 –0.09 0.20 0.66Religion, Other Protestant 0.95 0.39 0.02 –0.01 0.52 0.98 –0.55 0.31 0.07Religion, Others 0.10 0.51 0.85 0.40 0.54 0.45 0.01 0.39 0.99Tabloid readers 0.10 0.35 0.77 –1.00 0.43 0.02 –0.03 0.22 0.88Broadsheet readers 0.43 0.35 0.22 –0.09 0.39 0.82 0.22 0.23 0.36Urban resident –0.29 0.22 0.19 –0.65 0.33 0.05 –0.27 0.16 0.09Employed in private sector 0.41 0.22 0.07 0.12 0.34 0.72 0.35 0.16 0.03Trade union member –0.84 0.22 0.00 –0.63 0.35 0.07 –0.05 0.16 0.77Constant –1.40 0.50 0.01 –0.94 0.62 0.13 0.38 0.34 0.28
N = 1211 Pseudo R2 = .06Coefficients in bold p ≤ .05
10.1057/9781137023704 - More Scottish than British, Christopher Carman, Robert Johns and James Mitchell
Co
pyr
igh
t m
ater
ial f
rom
ww
w.p
alg
rave
con
nec
t.co
m -
lice
nse
d t
o U
niv
ersi
ty o
f S
ydn
ey -
Pal
gra
veC
on
nec
t -
2014
-08-
27

162
Table A2 3.1 OLS regressions of party like/dislike (0–10 scale) on party image assessments, controlling for party identification(for Figure 3.1)
Conservativelike
Labour like Lib dem like SNP Like
B s.e. p = B s.e. p = B s.e. p = B s.e. p =Image: Capable strong
government1.08 0.14 0.00 1.91 0.15 0.00 1.26 0.23 0.00 2.47 0.17 0.00
Image: United (ordivided)
0.64 0.13 0.00 0.87 0.15 0.00 0.55 0.21 0.01 0.44 0.18 0.02
Image: Standing upfor Scotland
1.53 0.23 0.00 1.16 0.15 0.00 1.96 0.17 0.00 1.20 0.16 0.00
Image: In touchw/ordinary people
1.15 0.18 0.00 0.92 0.15 0.00 0.68 0.25 0.00 1.49 0.13 0.00
Image: Keep promises 1.70 0.20 0.00 0.83 0.15 0.00 1.32 0.17 0.00 1.15 0.26 0.00PID: Conservative 2.46 0.25 0.00 –1.16 0.20 0.00 0.42 0.23 0.06 –0.87 0.19 0.00PID: Labour –1.08 0.15 0.00 2.10 0.15 0.00 –0.50 0.14 0.00 –0.49 0.14 0.00PID: Lib Dem 0.36 0.31 0.25 –0.14 0.29 0.64 2.07 0.34 0.00 –0.95 0.29 0.00PID: SNP –0.50 0.15 0.00 –0.08 0.14 0.57 –0.28 0.15 0.06 1.88 0.13 0.00PID: Other –0.33 0.45 0.47 0.36 0.52 0.49 –0.67 0.48 0.17 –0.19 0.42 0.66Constant 2.26 0.11 0.00 2.57 0.11 0.00 2.87 0.10 0.00 2.06 0.25 0.00
N 1235 1241 1158 1361R2 adj 0.63 0.73 0.51 0.67
10.1057/9781137023704 - More Scottish than British, Christopher Carman, Robert Johns and James Mitchell
Co
pyr
igh
t m
ater
ial f
rom
ww
w.p
alg
rave
con
nec
t.co
m -
lice
nse
d t
o U
niv
ersi
ty o
f S
ydn
ey -
Pal
gra
veC
on
nec
t -
2014
-08-
27

163
Table A2 3.2 Multinomial logit of regional party choice on leader evaluations and demographic characteristics (for Figure 3.2)
Conservative(vs. Labour)
Lib Dems(vs. Labour)
SNP(vs. Labour)
B s.e. p = B s.e. p = B s.e. p =Age 18–34 –0.55 0.67 0.41 –0.51 0.70 0.47 0.89 0.48 0.07Age 55–81 –0.75 0.51 0.14 –0.08 0.59 0.90 –0.57 0.40 0.16Men 0.72 0.46 0.12 –0.59 0.50 0.23 –0.42 0.34 0.21Social class A,B 0.26 0.53 0.62 –0.25 0.61 0.68 –0.24 0.43 0.57Social class C1 0.15 0.54 0.78 0.22 0.58 0.71 –0.88 0.40 0.03Education, Vocational 0.94 1.07 0.38 –1.70 1.68 0.31 –0.41 0.75 0.59Education, Standard grade 0.64 0.77 0.41 0.64 0.79 0.42 –0.06 0.54 0.91Education, Highers 0.44 0.63 0.49 0.01 0.74 0.99 0.16 0.48 0.74Education, Degree 0.56 0.70 0.42 0.85 0.77 0.27 0.08 0.55 0.88Religion, Catholic –1.98 0.93 0.03 –2.09 1.51 0.17 0.13 0.52 0.81Religion, Church of Scotland –0.57 0.53 0.29 0.65 0.56 0.25 –0.16 0.41 0.70Religion, Other Protestant 0.40 0.70 0.57 0.00 0.90 1.00 0.16 0.57 0.78Religion, Others –0.40 0.80 0.62 0.31 0.87 0.72 –1.80 0.77 0.02Tabloid readers –0.94 0.67 0.16 –1.54 0.66 0.02 –1.06 0.47 0.03Broadsheet readers –0.28 0.69 0.68 –0.97 0.70 0.16 –0.76 0.52 0.15Urban resident –0.11 0.45 0.81 –0.26 0.51 0.61 –0.08 0.34 0.82Employed in private sector –0.32 0.45 0.47 0.04 0.52 0.94 –0.10 0.34 0.98Trade union member –0.04 0.47 0.94 0.21 0.53 0.69 0.74 0.35 0.04
10.1057/9781137023704 - More Scottish than British, Christopher Carman, Robert Johns and James Mitchell
Co
pyr
igh
t m
ater
ial f
rom
ww
w.p
alg
rave
con
nec
t.co
m -
lice
nse
d t
o U
niv
ersi
ty o
f S
ydn
ey -
Pal
gra
veC
on
nec
t -
2014
-08-
27

164
Table A2 3.2 (Continued)
Conservative(vs. Labour)
Lib Dems(vs. Labour)
SNP(vs. Labour)
B s.e. p = B s.e. p = B s.e. p =PID: Conservative 1.13 0.81 0.16 –2.46 1.35 0.07 –1.31 0.90 0.14PID: Labour –2.14 0.87 0.01 –1.47 0.72 0.04 –1.37 0.39 0.00PID: Lib Dem –1.87 1.52 0.22 1.73 0.93 0.06 0.12 0.94 0.90PID: SNP 2.54 1.40 0.07 1.53 1.58 0.33 3.67 1.25 0.00Alex Salmond (SNP) 0.11 0.08 0.18 0.03 0.09 0.77 0.81 0.08 0.00Iain Gray (Labour) –0.45 0.12 0.00 –0.53 0.13 0.00 –0.36 0.08 0.00Annabel Goldie (Conserv) 0.37 0.11 0.00 –0.34 0.13 0.01 0.02 0.08 0.84Tavish Scott (Lib Dem) –0.15 0.13 0.22 0.69 0.17 0.00 –0.18 0.09 0.06David Cameron (UK Conserv PM) 0.51 0.12 0.00 0.23 0.14 0.11 0.14 0.09 0.12Nick Clegg (UK Lib Dem) 0.05 0.12 0.69 0.30 0.14 0.03 0.22 0.09 0.02Ed Miliband (UK Labour) –0.21 0.12 0.08 –0.25 0.13 0.06 –0.25 0.09 0.01Gordon Brown (UK Labour PM) –0.09 0.10 0.40 –0.11 0.12 0.36 –0.07 0.08 0.35Tony Blair (UK Labour PM) –0.24 0.09 0.01 –0.05 0.11 0.66 –0.28 0.07 0.00Constant –0.12 1.33 0.93 0.48 1.33 0.72 1.26 1.00 0.20
N = 1007 Pseudo R2 = .72Coefficients in bold p ≤ .05
10.1057/9781137023704 - More Scottish than British, Christopher Carman, Robert Johns and James Mitchell
Co
pyr
igh
t m
ater
ial f
rom
ww
w.p
alg
rave
con
nec
t.co
m -
lice
nse
d t
o U
niv
ersi
ty o
f S
ydn
ey -
Pal
gra
veC
on
nec
t -
2014
-08-
27

165
Table A2 4.1 Structural model estimates (for Figure 4.2)
Predictors Dependents B s.e. β
Education scale (exogenous) SNP like 2007 –0.15 0.03 –0.07Age (exogenous) SNP like 2007 0.03 0.00 0.14National identity (exogenous) SNP like 2007 –0.86 0.04 –0.38National identity (exogenous) Constitutional preference 2007 –0.43 0.04 –0.49Sex: Men (exogenous) Constitutional preference 2007 0.17 0.06 0.08SNP like 2007 Constitutional preference 2007 –0.01 0.02 –0.03SNP like 2007 SNP competent 2011 0.14 0.02 0.36SNP like 2007 SNP like 2011 0.43 0.04 0.39Constitutional preference 2007 SNP like 2007 1.79 0.04 0.69Constitutional preference 2007 SNP competent 2011 0.15 0.06 0.15Constitutional preference 2007 Constitutional preference 2011 0.55 0.05 0.51SNP competent 2011 SNP like 2011 1.68 0.06 0.58SNP competent 2011 Constitutional preference 2011 0.10 0.07 0.09SNP like 2011 Constitutional preference 2011 0.07 0.03 0.18Constitutional preference 2011 SNP like 2011 0.03 0.15 0.01
R2 for Dependent variablesDependents R2SNP like 2007 0.88Constitutional preference 2007 0.19SNP competent 2011 0.25SNP like 2011 0.72Constitutional preference 2011 0.49N = 559Coefficients in bold p ≤ .05
10.1057/9781137023704 - More Scottish than British, Christopher Carman, Robert Johns and James Mitchell
Co
pyr
igh
t m
ater
ial f
rom
ww
w.p
alg
rave
con
nec
t.co
m -
lice
nse
d t
o U
niv
ersi
ty o
f S
ydn
ey -
Pal
gra
veC
on
nec
t -
2014
-08-
27
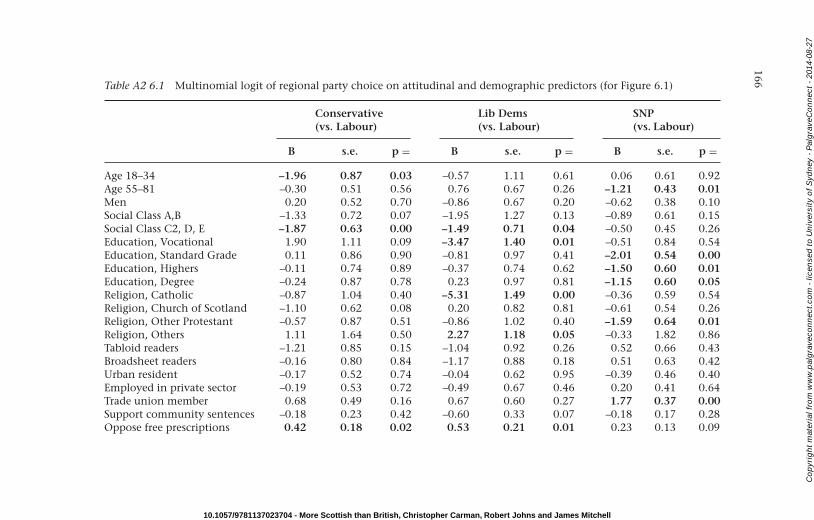
166
Table A2 6.1 Multinomial logit of regional party choice on attitudinal and demographic predictors (for Figure 6.1)
Conservative(vs. Labour)
Lib Dems(vs. Labour)
SNP(vs. Labour)
B s.e. p = B s.e. p = B s.e. p =Age 18–34 –1.96 0.87 0.03 –0.57 1.11 0.61 0.06 0.61 0.92Age 55–81 –0.30 0.51 0.56 0.76 0.67 0.26 –1.21 0.43 0.01Men 0.20 0.52 0.70 –0.86 0.67 0.20 –0.62 0.38 0.10Social Class A,B –1.33 0.72 0.07 –1.95 1.27 0.13 –0.89 0.61 0.15Social Class C2, D, E –1.87 0.63 0.00 –1.49 0.71 0.04 –0.50 0.45 0.26Education, Vocational 1.90 1.11 0.09 –3.47 1.40 0.01 –0.51 0.84 0.54Education, Standard Grade 0.11 0.86 0.90 –0.81 0.97 0.41 –2.01 0.54 0.00Education, Highers –0.11 0.74 0.89 –0.37 0.74 0.62 –1.50 0.60 0.01Education, Degree –0.24 0.87 0.78 0.23 0.97 0.81 –1.15 0.60 0.05Religion, Catholic –0.87 1.04 0.40 –5.31 1.49 0.00 –0.36 0.59 0.54Religion, Church of Scotland –1.10 0.62 0.08 0.20 0.82 0.81 –0.61 0.54 0.26Religion, Other Protestant –0.57 0.87 0.51 –0.86 1.02 0.40 –1.59 0.64 0.01Religion, Others 1.11 1.64 0.50 2.27 1.18 0.05 –0.33 1.82 0.86Tabloid readers –1.21 0.85 0.15 –1.04 0.92 0.26 0.52 0.66 0.43Broadsheet readers –0.16 0.80 0.84 –1.17 0.88 0.18 0.51 0.63 0.42Urban resident –0.17 0.52 0.74 –0.04 0.62 0.95 –0.39 0.46 0.40Employed in private sector –0.19 0.53 0.72 –0.49 0.67 0.46 0.20 0.41 0.64Trade union member 0.68 0.49 0.16 0.67 0.60 0.27 1.77 0.37 0.00Support community sentences –0.18 0.23 0.42 –0.60 0.33 0.07 –0.18 0.17 0.28Oppose free prescriptions 0.42 0.18 0.02 0.53 0.21 0.01 0.23 0.13 0.09
10.1057/9781137023704 - More Scottish than British, Christopher Carman, Robert Johns and James Mitchell
Co
pyr
igh
t m
ater
ial f
rom
ww
w.p
alg
rave
con
nec
t.co
m -
lice
nse
d t
o U
niv
ersi
ty o
f S
ydn
ey -
Pal
gra
veC
on
nec
t -
2014
-08-
27

167
More use of tax-varying powers 0.62 0.23 0.01 0.16 0.24 0.49 0.57 0.19 0.00Support prison for knife crime –0.77 0.23 0.00 –0.51 0.31 0.09 –0.65 0.17 0.00Support tuition fees –0.19 0.24 0.43 –0.36 0.24 0.14 –0.07 0.17 0.68Oppose spending cuts 0.22 0.27 0.42 0.08 0.34 0.83 0.10 0.20 0.63Tax-spend scale (increase) –0.13 0.14 0.38 –0.19 0.17 0.25 –0.05 0.11 0.68Green vs. growth scale (growth) 0.33 0.14 0.02 –0.11 0.17 0.51 0.02 0.11 0.89Constitution scale (independence) 0.20 0.12 0.10 0.01 0.14 0.97 0.28 0.09 0.00Standards of health –0.40 0.33 0.23 –0.21 0.41 0.62 0.05 0.23 0.83Standards of education –0.14 0.35 0.69 0.14 0.48 0.77 0.04 0.27 0.88Living standards 0.12 0.31 0.71 0.03 0.44 0.95 –0.03 0.23 0.89Standards of law and order 0.39 0.39 0.32 0.32 0.51 0.53 –0.18 0.33 0.59Con UK performance 0.84 0.43 0.05 0.54 0.45 0.23 0.58 0.31 0.06Lib Dem UK performance 0.28 0.41 0.49 –0.19 0.51 0.70 –0.27 0.37 0.46Lab UK performance 0.00 0.38 0.99 0.28 0.58 0.63 0.02 0.32 0.95SNP Sco performance 0.62 0.36 0.09 0.74 0.45 0.10 2.16 0.37 0.00Lab Sco performance –1.44 0.41 0.00 –1.14 0.54 0.04 –1.66 0.38 0.00Prospective evaluation – UK economy 0.18 0.34 0.61 0.14 0.53 0.80 0.31 0.24 0.20Prospective evaluation – Scottish economy –0.01 0.35 0.97 0.16 0.56 0.78 0.36 0.26 0.17Handle cuts – Conservatives 0.72 0.44 0.10 –0.98 0.63 0.12 –0.32 0.30 0.28Handle cuts – Labour –0.44 0.54 0.42 –0.08 0.65 0.91 –0.91 0.44 0.04Handle cuts – Lib Dems –0.07 0.50 0.89 1.54 0.85 0.07 –0.33 0.34 0.34Handle cuts – SNP 0.19 0.49 0.70 –0.71 0.77 0.35 0.14 0.40 0.73Alex Salmond –0.10 0.14 0.49 0.01 0.12 0.94 0.47 0.12 0.00Iain Gray –0.16 0.15 0.27 –0.44 0.19 0.02 0.01 0.11 0.96Annabel Goldie 0.15 0.11 0.19 –0.40 0.13 0.00 –0.12 0.08 0.14Tavish Scott 0.06 0.16 0.68 0.66 0.23 0.00 0.02 0.12 0.90David Cameron 0.46 0.17 0.01 0.12 0.20 0.54 0.20 0.11 0.06
10.1057/9781137023704 - More Scottish than British, Christopher Carman, Robert Johns and James Mitchell
Co
pyr
igh
t m
ater
ial f
rom
ww
w.p
alg
rave
con
nec
t.co
m -
lice
nse
d t
o U
niv
ersi
ty o
f S
ydn
ey -
Pal
gra
veC
on
nec
t -
2014
-08-
27

168
Table A2 6.1 (Continued)
Conservative(vs. Labour)
Lib Dems(vs. Labour)
SNP(vs. Labour)
B s.e. p = B s.e. p = B s.e. p =Nick Clegg –0.27 0.16 0.09 –0.07 0.18 0.69 –0.05 0.12 0.65Ed Miliband –0.41 0.15 0.01 –0.22 0.19 0.25 –0.22 0.11 0.04Gordon Brown –0.21 0.11 0.07 0.06 0.18 0.72 –0.30 0.10 0.00Tony Blair –0.11 0.10 0.25 –0.10 0.13 0.47 –0.19 0.08 0.01Party image – Conservatives 1.00 0.30 0.00 0.12 0.38 0.76 0.18 0.24 0.46Party image – Labour –0.45 0.33 0.18 –0.95 0.40 0.02 –0.54 0.27 0.04Party image – Lib Dems 0.01 0.33 0.97 1.31 0.41 0.00 0.27 0.24 0.27Party image – SNP 0.32 0.39 0.40 –0.06 0.41 0.88 0.45 0.30 0.14Scottish interests – Conservatives 0.16 0.41 0.00 –0.34 0.54 0.53 0.31 0.31 0.33Scottish interests – Labour –1.48 0.51 0.00 –2.15 0.71 0.00 –1.94 0.45 0.00Scottish interests – Lib Dems –0.74 0.49 0.13 1.86 0.76 0.02 0.46 0.31 0.14Scottish interests – SNP 0.94 0.36 0.01 0.85 0.48 0.08 0.99 0.34 0.00Campaign tone – Conservatives 0.62 0.35 0.08 –0.10 0.40 0.80 –0.05 0.23 0.81Campaign tone – Labour –0.43 0.35 0.22 –1.61 0.56 0.00 –0.29 0.23 0.19Campaign tone – Lib Dems 0.64 0.27 0.02 0.98 0.36 0.01 –0.10 0.23 0.68Campaign tone – SNP 0.40 0.29 0.17 0.43 0.30 0.14 0.30 0.21 0.15Constant 2.86 4.78 0.55 1.71 5.90 0.77 –4.01 4.01 0.32
N = 1211 Pseudo R2 = .80Coefficients in bold p ≤ .05
10.1057/9781137023704 - More Scottish than British, Christopher Carman, Robert Johns and James Mitchell
Co
pyr
igh
t m
ater
ial f
rom
ww
w.p
alg
rave
con
nec
t.co
m -
lice
nse
d t
o U
niv
ersi
ty o
f S
ydn
ey -
Pal
gra
veC
on
nec
t -
2014
-08-
27

Notes
2 Results and the Sources of Party Support
1. We recognize, of course that church attendance is not the most precisemeasure of religiosity. That said, given data limitations owing to ques-tionnaire length, we were unable to include a more extensive battery ofquestions assessing religiosity. That said, there is plenty of support for ourapproach in the existing literature (Green 2010).
2. In the 2011 SES, the ‘Moreno question’ took the form, ‘Which, if any, of thefollowing best describes how you see yourself?’, with the response options:
Scottish not BritishMore Scottish than BritishEqually Scottish and BritishMore British than ScottishBritish not Scottish
Respondents were also permitted to respond ‘Other’ (and given an opentext box to describe themselves) or ‘Don’t Know’.
3. That is, the variable indicating a voter’s vote choice contains a series ofcategories in which we can indicate whether a person opted to vote forthe Conservatives, Labour, Liberal Democrats, SNP, Greens or some otherparty. These are discrete and mutually exclusive categories – a voter couldnot (legally) vote for both Labour and the Liberal Democrats on their listballot.
3 Parties and Leaders
1. Evidence submitted by Ian Small, Head of Public Policy & CorporateAffairs, BBC Scotland, to Education and Culture Committee, 24 January2012, paper EC/S4/12/21.
4 Performance Politics at Holyrood
1. We also exclude the 3 per cent who misinterpreted the question as oneabout how or why they cast a vote at all (citing civic duty or the merits ofa postal vote, for example).
2. The ‘Public finances’ category inevitably includes both those lamentingthe size of the deficit (many of whom named the Conservatives as thebest-equipped party) and those lamenting the cuts planned to deal with it(who were split fairly evenly between Labour and the SNP).
169
10.1057/9781137023704 - More Scottish than British, Christopher Carman, Robert Johns and James Mitchell
Co
pyr
igh
t m
ater
ial f
rom
ww
w.p
alg
rave
con
nec
t.co
m -
lice
nse
d t
o U
niv
ersi
ty o
f S
ydn
ey -
Pal
gra
veC
on
nec
t -
2014
-08-
27
170 Notes
3. The issue statements are taken from the Scottish Vote Compass (seeWheatley et al. forthcoming), an online Voting Advice Application avail-able to Scottish voters in the run-up to the 2011 election. This recordedvoters’ policy preferences and matched them to the parties’ offerings atthis election. Since it is explicitly designed to probe those areas on whichthe parties disagree, it is a useful guide to the position issues that were atleast potentially in play at this election.
4. The five options are as follows:
– Scotland should become independent, separate from the UK and theEuropean Union.
– Scotland should become independent, separate from the UK but part ofthe European Union.
– Scotland should remain part of the UK, with its own elected parliamentwhich has some taxation powers.
– Scotland should remain part of the UK, with its own elected parliament,which has no taxation powers.
– Scotland should remain part of the UK without an elected parliament.
The 2011 SES question is phrased a little differently, clarifying that the sta-tus quo involves some but limited taxation powers, but is similar enoughto be regarded as broadly comparable. The slightly amended options are:
– Scotland should be independent outside the European Union.– Scotland should be independent within the European Union.– The Scottish Parliament’s powers should be increased and it should raise
more of its own taxes.– There should be no change to the present arrangements: Scotland
should have a devolved Parliament with limited powers.– The Scottish Parliament should be abolished and all Scottish laws passed
by Westminster again.
5. Age, sex and education were also included in the model as control vari-ables but are not shown in Figure 4.2 because their effects are not themain concern here. The full model, including all parameter estimates, errorvariances and measures of fit, is presented in Appendix 2 Table A2 4.1.
5 How ‘Scottish’ Was this Election?
1. The nature of this question, asking about the ‘present time’, discour-ages mentions of longstanding issues like the constitutional question.So Table 5.3 should not be read as implying that independence was unim-portant in the 2011 election. Table 4.1 already contradicts that idea.However, the results in this chapter show the potential for short-termconcerns like the economy in 2011 to overshadow those more enduringconcerns.
2. A parallel result is obtained by broadening this analysis beyond the econ-omy to a comparison based on the full range of issues. Cramer’s V
10.1057/9781137023704 - More Scottish than British, Christopher Carman, Robert Johns and James Mitchell
Co
pyr
igh
t m
ater
ial f
rom
ww
w.p
alg
rave
con
nec
t.co
m -
lice
nse
d t
o U
niv
ersi
ty o
f S
ydn
ey -
Pal
gra
veC
on
nec
t -
2014
-08-
27
Notes 171
summarizes the similarities between the ‘most important issue when vot-ing’ responses and each of the multi-level measures, and the coefficient is0.31 – at most a moderate association – for both the ‘facing Britain’ and‘facing Scotland’ questions. Again, the obvious conclusion is that somevoters were driven by British considerations while others were focused onthe Scottish level.
3. There was an ‘Other reasons’ option offered but, since our principal con-cern is with the relative importance of British and Scottish levels, we omitthat third option in analysis here.
4. It hardly needs saying – and so we did not report in Table 5.5 – that thosereferring explicitly to ‘Scotland’, ‘Scottish interests’, or the record of theScottish government when asked the most important issue question werealso overwhelmingly likely to report a vote focused mostly on what wasgoing on in Scotland. More important is that they far outnumber thosewhose ‘most important issue’ response referred to the British level (e.g.criticizing the government or the parties at Westminster). This reinforcesthe first-order credentials of the 2011 election.
5. Given that above we reported that there were some differences in responsepatterns discernible across the two halves, we would caution that thesemeasures of multi-level party support should be viewed with some degreeof scepticism. While the differences in response patterns were slightenough that we feel we can broadly characterise party support at theScottish and UK levels, there will be measurement error in these measures.
6 Party Choice in 2011
1. We adopt a relatively relaxed criterion for significance, p < 0.1, becausethe small cell sizes in such a full specification – especially when predictingvotes for the Conservatives and the Liberal Democrats –mean that even rel-atively strong substantive effects sometimes fall short of the more standardp < 0.05 statistical significance requirement.
2. This introduces a slight bias because, other things remaining the same, afull-range change on an 11-point scale is a more dramatic shift than thecorresponding change on a 4-point scale. However, eliminating this biasis only possible with much less intuitive statistics such as the effect ofmoving one standard deviation along a scale. Here we opt for the sim-pler version; Johns et al. (2013), using the more complex approach, reachidentical substantive conclusions.
10.1057/9781137023704 - More Scottish than British, Christopher Carman, Robert Johns and James Mitchell
Co
pyr
igh
t m
ater
ial f
rom
ww
w.p
alg
rave
con
nec
t.co
m -
lice
nse
d t
o U
niv
ersi
ty o
f S
ydn
ey -
Pal
gra
veC
on
nec
t -
2014
-08-
27

References
Abedi, A. and A. Siaroff (1999). ‘The mirror has broken: Increasing divergencebetween national and land elections in Austria’, German Politics, 8: 207–227.
Anderson, B. (1991). Imagined communities: Reflections on the origin and spreadof nationalism, London: Verso.
Anderson, C. D. (2006). ‘Economic voting and multilevel governance: A com-parative individual-level analysis’, American Journal of Political Science, 50(2):449–463.
Andersen, R. and Evans, G. (2003). ‘Who Blairs wins? Leadership and votingin the 2001 election’, British Elections & Parties Review, 13, 229–247.
Arceneaux, K. (2006). ‘The federal face of voting: Are elected officials heldaccountable for the functions relevant to their office?’ Political Psychology,27(5): 731–754.
Bartolini, S. and P. Mair (1990). Identity, competition and electoral availability:The stabilization of European electorates 1885–1985, Cambridge: CambridgeUniversity Press.
Bennie, L., J. Brand and J. Mitchell (1997). How Scotland votes, Manchester:Manchester University Press.
Beveridge, C. (2010). Report of the Independent budget review panel, availableonline at: www.scotland.gov.uk/Resource/Doc/919/0102335.pdf
Black, R. (2010). Letter to independent budget review panel, June, quoted inC. Beveridge (2010), Report of the independent budget review panel, availableonline at: www.scotland.gov.uk/Resource/Doc/919/0102335.pdf.
Blake, D. (1982). ‘The consistency of inconsistency: Party identification inFederal provincial politics’, Canadian Journal of Political Science, 15: 691–710.
Blake, D. with D. Elkins and R. Johnston (1985). Two political worlds: Partiesand voting in British Columbia, Vancouver: University of British ColumbiaPress.
Bochel, J. and D. Denver (1970). ‘Religion and voting: A critical review and anew analysis’, Political Studies, 18: 205–219.
Brand, J., J. Mitchell and P. Surridge (1993). ‘Identity and the vote: Classand nationality in Scotland’, in D. Denver, P. Norris, D. Broughton andC. Rallings (eds.), British elections and parties yearbook, Hemel Hempstead,Herts: Harvester Wheatsheaf, 143–157.
Brickman, P., V. C. Rabinowitz, D. Coates, E. Cohn, and L. Kidder (1982).‘Models of helping and coping’, American Psychologist, 37: 364–384.
Bromley, C., J. Curtice, D. McCrone and A. Park (eds.) (2006) Has devolutiondelivered? Edinburgh: Edinburgh University Press.
Brown, A. (2000). ‘Designing the Scottish Parliament’, Parliamentary Affairs,53: 542–556
Brown, A., D. McCrone and L. Paterson (1996). Politics and society in Scotland,Basingstoke: MacMillan Press.
172
10.1057/9781137023704 - More Scottish than British, Christopher Carman, Robert Johns and James Mitchell
Co
pyr
igh
t m
ater
ial f
rom
ww
w.p
alg
rave
con
nec
t.co
m -
lice
nse
d t
o U
niv
ersi
ty o
f S
ydn
ey -
Pal
gra
veC
on
nec
t -
2014
-08-
27

References 173
Brown, A., D. McCrone, L. Paterson and P. Surridge (1999) The Scottishelectorate, Basingstoke: Macmillan.
Budge, I. and D. Urwin (1966). Scottish political behaviour: A case study in Britishhomogeneity, London: Longman.
Budge, I., J. Brand, M. Margolis and A. Smith (1972). Political stratification anddemocracy, London: Macmillan.
Burden, B. C. and C. A. Klofstad (2005). ‘Affect and cognition in partyidentification’, Political Psychology, 26(6): 869–886.
Butler, D. (2008). ‘Hung parliaments: Context and background’ in A. Brazierand S. Kilitowski (eds.), No overall control? The impact of a ‘hung parliament’on British politics, London: Hansard Society.
Butler, D. and R. Rose (1960). The British General Election of 1959. London:Macmillan.
Butler, D. and D. Stokes (1974). Political change in Britain: The evolution ofelectoral choice, London: Macmillan.
Butt, S. (2006). ‘How Voters Evaluate Economic Competence: A Com-parison between Parties In and Out of Power.’ Political Studies 54:743–766.
Campbell, A., P. Converse, W. Miller and D. Stokes (1960). The American voter,Chicago: University of Chicago Press.
Carman, C., J. Mitchell and R. Johns (2008). ‘The unfortunate natural exper-iment in ballot design: The Scottish parliamentary elections of 2007’,Electoral Studies, 27: 442–459.
Clarke, Harold D. and Allan McCutcheon (2009). The dynamics of partyidentification reconsidered. Public Opinion Quarterly, 73: 704–728.
Clarke, H. D. and M. C. Stewart (1998). ‘The decline of parties in the minds ofcitizens’, Annual Review of Political Science, 1: 357–378.
Clarke, H. D., D. Sanders, M. C. Stewart and P. Whiteley (2004). Political choicein Britain. Oxford: Oxford University Press.
Clarke, H., D. Sanders, M. Stewart, and P. Whiteley (2011). ‘Valence politicsand electoral choice in Britain, 2010’, Journal of Elections, Public Opinion &Parties, 21(2): 237–253.
Clarke, H. D., D. Sanders, M. C. Stewart and P. Whiteley (2009). Per-formance politics and the British voter. Cambridge: Cambridge UniversityPress.
Converse, P. (1964) ‘The nature of belief systems in mass publics’ in D. Apter(ed.): Ideology and discontent, London: Free Press of Glencoe, 206–261.
Copeland, G. and S. Patterson (1994). ‘Changing an institutionalized setting’in G. Copeland and S. Patterson (eds.) Parliaments in the modern world, AnnArbor: Michigan University Press.
Curtice, J. (2006). ‘Is Holyrood accountable and representative?’ inC. Bromley, J. Curtice, D. McCrone and A. Park (eds.) Has devolutiondelivered? Edinburgh: Edinburgh University Press, pp. 90–122.
Curtice, J. and S. Holmberg (2005). ‘Leaders’, in J. Thomassen (ed.) TheEuropean voter: A comparative study of modern democracies, Oxford: OxfordUniversity Press, pp. 125–166.
10.1057/9781137023704 - More Scottish than British, Christopher Carman, Robert Johns and James Mitchell
Co
pyr
igh
t m
ater
ial f
rom
ww
w.p
alg
rave
con
nec
t.co
m -
lice
nse
d t
o U
niv
ersi
ty o
f S
ydn
ey -
Pal
gra
veC
on
nec
t -
2014
-08-
27

174 References
Curtice, J., D. McCrone, N. McEwen, M. Marsh, and R. Ormston (2009)Revolution or evolution? The 2007 Scottish elections. Edinburgh: EdinburghUniversity Press.
Cutler, F. (2004). ‘Government responsibility and electoral accountability infederations’, Publius, 34(1): 19–38.
Cutler, F. (2008). ‘Whodunnit? voters and responsibility in Canadianfederalism’, Canadian Journal of Political Science, 41: 627–654.
Crewe, I. (1982). ‘Is Britain’s two-party system really about to crumble?’,Electoral Studies, 1: 275–314.
Crewe, I. (1988). ‘Partisan alignment ten years on’ in Berrington, H. (ed.),Change in British politics. London: Frank Cass.
Crewe, I., B. Sarlvik and J. Alt (1977). ‘Partisan dealignment in Britain,1964–1974’, British Journal of Political Science, 7: 129–190.
Dalton, R. (1996). Citizen politics: Public opinion and political parties in advancedwestern democracies, Chatham NJ: Chatham House Publishers.
Dalton, R. (2002). ‘Political cleavages, issues, and electoral change’ in L. LeDuc, R.G. Niemi and P. Norris (eds.), Comparing democracies 2: New challengesin the study of elections and voting, Thousand Oaks, CA: Sage.
Dalton, R. (2006). Citizen politics: Public opinion and political parties in advancedwestern democracies, 4th ed., Washington, DC: CQ Press.
Dalton, Russell J. and Martin P. Wattenberg (eds.) (2000). Parties withoutpartisans. Oxford: Oxford University Press.
Delli Carpini, X. Michael and Scott Keeter (1996). What Americans know aboutpolitics and why it matters. New Haven: Yale University Press.
Denver, D., C. Carman and R. Johns (2012). Elections and voters in Britain, 3rded. Basingstoke: Palgrave.
Denver, D. and R. Johns (2010). ‘Scottish Parliament elections: “British notScottish” or “More Scottish than British”?’ Scottish Affairs, 70(1): 9–28.
Denver, D., J. Mitchell, C. Pattie, and H. Bochel (2000). Scotland decides: Thedevolution issue and the 1997 referendum, London: Frank Cass.
Dewar, D. (1999). ‘Speech to Labour Party conference,’ 27 September, avail-able online at: http://news.bbc.co.uk/1/hi/uk_politics/459041.stm Downs,Anthony (1957). An economic theory of democracy. New York: Harper & Row.
Downs, A. (1962). The theory of political coalitions, New Haven, CT: YaleUniversity Press.
Duch, R.M. and R.T. Stevenson (2008). The economic vote: How political and eco-nomic institutions condition election results, Cambridge: Cambridge UniversityPress.
Dunleavy, P. (2005). ‘Facing up to multi-party politics: How partisan dealign-ment and PR voting have fundamentally changed Britain’s party systems’,Parliamentary Affairs, 58(3): 503–532.
Electoral Commission (2012). Scottish Parliament Election 2011: Campaignexpenditure, Edinburgh, Electoral Commission.
Elff, M. (2007). ‘Social structure and electoral behavior in comparative per-spective: The decline of social cleavages in western Europe revisited’,Perspectives on Politics, 5: 277–294.
10.1057/9781137023704 - More Scottish than British, Christopher Carman, Robert Johns and James Mitchell
Co
pyr
igh
t m
ater
ial f
rom
ww
w.p
alg
rave
con
nec
t.co
m -
lice
nse
d t
o U
niv
ersi
ty o
f S
ydn
ey -
Pal
gra
veC
on
nec
t -
2014
-08-
27

References 175
Erikson, R.S. (1988). ‘The puzzle of midterm loss’, Journal of Politics, 50:1011–1029.
Evans, G. and R. Andersen (2005). ‘The impact of party leaders: How Blair lostLabour votes’ in P. Norris and C. Wlezien (eds.), Britain Votes 2005, Oxford:Oxford University Press, 162–180.
Fieldhouse, E. and A. Russell (2001). ‘Latent Liberals? Sympathy and supportfor the Liberal Democrats in Britain’, Party Politics, 7: 711–738.
Fiorina, M. (1981). Retrospective voting in American national election, NewHaven: Yale University Press.
Flanagan, S. (1987). ‘Value change in industrial society,’ American PoliticalScience Review, 81: 1303–1319.
Foley, Michael. (1993). The Rise of British Presidency, Manchester: ManchesterUniversity Press.
Franklin, M. (1985). The decline of class voting in Britain: Changes in the basis ofelectoral choice, 1964–1983, Oxford: Clarendon Press.
Franklin, M.N., T.T. Mackie and H. Valen (1992). Electoral change: Responseto evolving social and attitudinal structures in Western countries, Cambridge:Cambridge University Press.
Friedman, T. (1999). The Lexus and the Olive tree: Understanding globalisation,Anchor Books.
Gallagher, M., M. Laver, and P. Mair, (2006). Representative government inmodern Europe, New York: McGraw-Hill.
Green, J. (2007). ‘When voters and parties agree: Valence issues and partycompetition’, Political Studies, 55 (3): 629–655.
Green, J.C. (2010). “Gauging the God Gap: Religion and Voting in US Pres-idential Elections,” in J E Leighley (ed.), The Oxford Handbook of AmericanElections and Political Behavior, Oxford: Oxford University Press.
Green, Donald P., Bradley Palmquist and Eric Schickler (2002). Partisan Heartsand Minds. New Haven, CT: Yale University Press.
Green-Pederson, C. (2001). ‘Minority governments and party politics: Thepolitical and institutional background to the “Danish Miracle” ’, Journal ofPublic Policy, 21: 53–70.
Heath, A.F., R. Jowell and J. Curtice (2001). The rise of new labour, Oxford:Oxford University Press.
Heath, A.F., and S.K. MacDonald (1987). ‘Social change and the future of theleft’, Political Quarterly, 58: 364–377.
Heath, A., I. McLean, B. Taylor and J. Curtice (1999). ‘Between first and secondorder: A comparison of voting behaviour in European and local elections inBritain’, European Journal of Political Research, 35: 389–414.
Held, D. and A. McGrew (1998) ‘The end of the old order? Globalization andthe prospects for world order,’ Review of International Studies, 24(5): 219–254.
Hellwig, T. (2008). ‘Globalization, policy constraints, and vote choice’, Journalof Politics, 70: 1128–1141.
Henderson, A. and N. McEwen (2010). ‘A comparative analysis of voterturnout in regional elections’, Electoral Studies, 29: 405–416.
Horsman, M. and A. Marshall (1994). After the nation state, London:HarperCollins.
10.1057/9781137023704 - More Scottish than British, Christopher Carman, Robert Johns and James Mitchell
Co
pyr
igh
t m
ater
ial f
rom
ww
w.p
alg
rave
con
nec
t.co
m -
lice
nse
d t
o U
niv
ersi
ty o
f S
ydn
ey -
Pal
gra
veC
on
nec
t -
2014
-08-
27
176 References
Hough, D. and C. Jeffrey (2006). Devolution and electoral politics, Manchester:Manchester University Press.
Howat, B. (2006). Choices for a purpose: Review of Scottish executive budgets,report of the budget review group, available online at: www.scotland.gov.uk/Resource/Doc/178289/0050741.pdf13
Inglehart, R. (1977). The Silent revolution: Changing values and political stylesamong Western publics, Princeton, NJ: Princeton University Press.
Inglehart, R. (1999). ‘Postmodernization, authority and democracy’, inP. Norris (ed.) Critical citizens, Oxford: Oxford University Press.
Iyengar, S. (1989). News that matters: Television and American opinion, Chicago:University of Chicago Press.
Jennings, K. and R. Niemi (1966). ‘Party identification at multiple levels ofgovernments,’ American Journal of Sociology, 72(1): 86–101.
Johns, R. (2011). ‘Credit where it’s due? Valence politics, attributionsof responsibility, and multi-level elections’, Political Behavior, 33(1):53–77.
Johns, R., L. Bennie and J. Mitchell (2011). ‘Gendered nationalism? Thegender gap in support for the Scottish National Party’, Party Politics, 18:581–601.
Johns, R., C.J. Carman and J. Mitchell (2013). ‘Constitution or competence?The SNP’s re-election in 2011’, Political Studies, 61(S1): 158–78.
Johns, R., D. Denver, J. Mitchell, and C. Pattie (2007). SES 2007: Comparisonof face-to-face and internet samples. Unpublished paper.
Johns, R., D. Denver, J. Mitchell, and C. Pattie (2009). ‘Valence politics inScotland: Towards an explanation of the 2007 election’, Political Studies,57(1): 207–233.
Johns, R., J. Mitchell, D. Denver, and C. Pattie (2010). Voting for a Scottish Gov-ernment: The Scottish Parliament Elections of 2007, Manchester: ManchesterUniversity Press.
Johnston, R. (2006). ‘Party identification: Unmoved mover or sum of prefer-ences?’ Annual Review of Political Science, 9: 329–351.
Jones, R.W and R. Scully (2008). ‘The end of one-partyism? Party politicsin Wales in the second decade of devolution,’ Contemporary Wales, 21:207–217.
Katz, R. (1997). Democracy and elections, Oxford: Oxford UniversityPress.
Kemmelmeier, M. and D. Winter (2008). ‘Sowing patriotism, but reapingnationalism? Consequences of exposure to the American flag’. PoliticalPsychology, 29(6): 859–879.
Key, V. O. (1966). The responsible electorate. Cambridge, MA: Belknap.King, A. (2002). ‘Do leaders’ personalities really matter?’, in Anthony King
(ed), Leaders’ personalities and the outcomes of democratic elections, Oxford:Oxford University Press.
Kirchheimer, O. (1966). ‘The transformation of Western European Party Sys-tems’, in J. LaPalombara and M. Weiner (eds.), Political parties and politicaldevelopment, Princeton: Princeton University Press.
10.1057/9781137023704 - More Scottish than British, Christopher Carman, Robert Johns and James Mitchell
Co
pyr
igh
t m
ater
ial f
rom
ww
w.p
alg
rave
con
nec
t.co
m -
lice
nse
d t
o U
niv
ersi
ty o
f S
ydn
ey -
Pal
gra
veC
on
nec
t -
2014
-08-
27

References 177
Lazarsfeld, P., B. Berelson, and H. Gaudet (1968). The people’s choice, New York:Columbia University Press.
León, S. (2010). ‘Who is responsible for what? Clarity of responsibility in mul-tilevel systems. The case of Spain’, European Journal of Political Research, 50:80–109.
León, S. (2011). ‘How does decentralization affect electoral competi-tion of state-wide parties? Evidence from Spain’, Party Politics, online,80–109.
Lipset S.M. and S. Rokkan (eds.) (1967). Party systems and voter alignments:Cross-national perspectives, London: Collier-Macmillan.
Lodge, Milton, and Charles S. Taber (2013). The rationalizing voter. New York:Cambridge University Press.
Miller, W. (1981). The end of British politics, Oxford: Clarendon Press.Miller, A. E., M.P. Wattenberg, and O. Malanchuk, (1986). ‘Schematic assess-
ments of presidential candidates’, American Political Science Review, 80:521–540.
McLean. I., A. Heath and B. Taylor (1996). ‘Were the 1994 Euro- and localelections in Britain really second order? Evidence from the British electionpanel study’, Journal of Elections, Public Opinion and Parties, 6: 1–20.
Mitchell, J. (2010). ‘Two models of devolution: A framework of analysis’in K. Stolz (ed.), Ten years of devolution in the United Kingdom, Augsburg:Wissner-Verlag.
Mitchell, James (1990). Conservatives and the union, Edinburgh, EdinburghUniversity Press.
Mitchell, J. (2010b). ‘The Narcissism of small differences: Scotland andWestminster’, Parliamentary Affairs, 63: 98–116.
Mitchell, J., R. Johns and L. Bennie (2011). The Scottish National Party:Transition to Power, Oxford University Press.
Mughan, Anthony (2000). Media and the Presidentialisation of ParliamentaryElections, Houndmills, Basingstoke: Macmillan.
Nannestad, P. and M. Paldam (1994). ‘The VP-function: A survey of the litera-ture on vote and popularity functions after 25 Years’, Public Choice, 79(3–4):213–245.
Nice, D. and P. Fredericksen (1996). The politics of intergovernmental relations,Chicago: Nelson-Hall Publishers.
Ohmae, K. (1990). The borderless world, London: Collins.Osmond, J. (2005). ‘Provenance and promise’ in J. Osmond (ed.), Welsh Politics
come of age, Cardiff: Institute of Welsh Politics.Paterson, L. (2006). ‘Sources of support for the SNP’ in C. Bromley, J. Curtice,
D. McCrone and A. Park (eds.), Has devolution delivered? Edinburgh:Edinburgh University Press, 46–68.
Paterson, L., A. Brown, J. Curtice, K. Hinds, D. McCrone, A. Park, K. Sprostonand P. Surridge (2001). New Scotland, new politics? Edinburgh: Polygon.
Pattie, C., D. Denver, R. Johns, and J. Mitchell (2011). ‘Raising the tone?The impact of ‘positive’ and ‘negative’ campaigning on voting in the 2007Scottish Parliament election’, Electoral Studies, 30: 333–343.
10.1057/9781137023704 - More Scottish than British, Christopher Carman, Robert Johns and James Mitchell
Co
pyr
igh
t m
ater
ial f
rom
ww
w.p
alg
rave
con
nec
t.co
m -
lice
nse
d t
o U
niv
ersi
ty o
f S
ydn
ey -
Pal
gra
veC
on
nec
t -
2014
-08-
27

178 References
Peres, H. (2007). ‘Genèse et contexte d’une invention : le questionnairede Juan Linz entre identité subjective et prétentions nationalistes’, Revueinternationale de politique compare, 14: 515–530.
Powell, G.B. (2000). Elections as instruments of democracy: Majoritarian andproportional visions, New Haven, CT: Yale University Press.
Quinn, Thomas (2008) ‘The conservative party and the ‘centre ground’of British politics’, Journal of Elections, Public Opinion and Parties, 18(2):177–199.
Reif, K. and H. Schmitt (1980). ‘Nine second-order national elections: A con-ceptual framework for the analysis of European election results’, EuropeanJournal of Political Research, 8: 3–44.
Rose, R. (1974). ‘Comparability in electoral studies’, in R. Rose (ed.), Electoralbehaviour: A comparative handbook, New York: The Free Press.
Rose, R. and D. Urwin (1969). ‘Persistence and change in Western Partysystems since 1945’, Political Studies, 18: 287–319.
Rose, R. and D. Urwin (1970). ‘Social cohesion, political parties and strains inregimes’, Comparative Political Studies, 2: 7–67.
Scarrow, S. (2000). ‘Parties without members? Party organization in a chang-ing electoral environment,’ in R. Dalton and M. Wattenberg (eds.), Partieswithout Partisans: Political change in advanced industrial democracies, Oxford:Oxford University Press.
Scully, R. and A. Elias (2008). ‘The 2007 Welsh Assembly Elections’, Regionaland Federal Studies, 18: 103–109.
Scholte, J.A. (2000). Globalisation: A critical introduction, London:Macmillan.
Schuman, H. and S. Presser (1996). Questions and answers in attitude surveys.London: Sage.
SNP and Greens (2007). ‘Scottish National Party & Scottish Green Party Coop-eration Agreement’, available online at: http://news.bbc.co.uk/1/shared/bsp/hi/pdfs/11_05_07_agreement.pdf.
Stevens, D., J. Karp, and R. Hodgson (2011) ‘Party leaders as movers and shak-ers in British campaigns? Results from the 2010 election’, Journal of Elections,Public Opinion & Parties, 21 (2), 125–145.
Stewart, M.C. and H.D. Clarke (1998). ‘The dynamics of Party identificationin Federal Systems: The Canadian Case,’ American Journal of Political Science,42 (1): 97–116.
Strøm, K. (1990). Minority Government and Majority Rule, Cambridge:Cambridge University Press.
Stokes, D. (1963). ‘Spatial models of party competition’, American PoliticalScience Review, 57: 368–377.
Stokes, D. (1992). ‘Valence politics’, in D. Kavanagh (ed.), Electoral politics.Oxford: Clarendon.
Studlar, D. (2001). ‘Canadian exceptionalism: Explaining differences overtime in provincial and federal voter turnout’, Canadian Journal of PoliticalScience, 34: 299–319.
10.1057/9781137023704 - More Scottish than British, Christopher Carman, Robert Johns and James Mitchell
Co
pyr
igh
t m
ater
ial f
rom
ww
w.p
alg
rave
con
nec
t.co
m -
lice
nse
d t
o U
niv
ersi
ty o
f S
ydn
ey -
Pal
gra
veC
on
nec
t -
2014
-08-
27

References 179
Surridge, P. (2006). ‘A better union?’ in C. Bromley, J. Curtice, D. McCroneand A. Park (eds.), Has devolution delivered? Edinburgh: Edinburgh UniversityPress, 29–45.
Tilley, James (2003).’ Party identification in Britain: Does length of time in theelectorate affect strength of partisanship?’ British Journal of Political Science,33(2): 332–344.
Tufte, E. (1978). Political control of the economy, Princeton: Princeton UniversityPress.
Vowles, J. (2008). ‘Does globalization affect public perceptions of “Who inpower can make a difference”? Evidence from 40 countries, 1996–2006’,Electoral Studies, 27: 63–76.
Vowles, J. (2010). ‘Making a difference? Public perceptions of coalition, single-party, and minority governments’, Electoral Studies, 29(3): 370–380.
Weiss, L. (1998). The myth of the powerless state, Cambridge: Polity Press.Weiss, L. (ed.) (2003). Studies in the global economy: Bringing domestic institutions
back in, Cambridge: Cambridge University.Wheatley, J., Christopher Carman, Fernando Mendez, J. Mitchell, ‘The dimen-
sionality of the Scottish political space: Results from an experiment on the2011 Holyrood elections’, Party Politics forthcoming
Whiteley, P. (2009). ‘Is the party over? The decline of party activism andmembership across the democratic world,’ Paper Presented at the AnnualMeeting of the Poltical Studies Association, University of Manchester.
Wilson, T.D. (2004). Strangers to ourselves: Discovering the adaptive unconscious,Cambridge: Harvard University Press.
Wlezien, Christopher (2005). ‘On the salience of political issues: The problemwith “most important problem” ’. Electoral Studies 24: 555–579.
Wyn Jones, R. and R. Scully (2006). ‘Devolution and electoral politics inScotland and Wales’, Publius, 36: 115–134.
Zaller, John R. (1992). The Nature and Origins of Mass Opinion. New York:Cambridge University Press.
Zuckerman, A. (2005). ‘Returning to the social logic of political behaviour’, inA. Zuckerman (ed.), The social logic of politics: Personal networks as contexts forpolitical behaviour, Philadelphia, PA: Temple University Press.
10.1057/9781137023704 - More Scottish than British, Christopher Carman, Robert Johns and James Mitchell
Co
pyr
igh
t m
ater
ial f
rom
ww
w.p
alg
rave
con
nec
t.co
m -
lice
nse
d t
o U
niv
ersi
ty o
f S
ydn
ey -
Pal
gra
veC
on
nec
t -
2014
-08-
27

Index
Note: Page numbers in italic refer to tables; page numbers in bold refer tofigures
Abedi, A., 9Additional Member System (AMS),
origins, 3Afghanistan, Iraq and, 88Alt, J., 34Andersen, R., 66, 77Anderson, B., 33Anderson, C. D., 127Arceneaux, K., 110, 127
Bartolini, S., 33Bennie, L., 34, 35, 60, 77, 93Berelson, B., 28Beveridge, C., 16Black, R., 16Blair, T., 66, 69Blake, D., 12, 107Bochel, H., 29Bochel, J., 29Brand, J., 34Brickman, P., 110Britain
class de-alignment, 33–4currency of ‘performance politics’
model, 79military action, 88‘most important issue’ findings,
112–13political behaviour comparison, 29salience of the economy, 86,
113–14and Scottish voting decisions, 115,
117Bromley, C., 100Brown, A., 34, 41, 102Brown, G., 49, 66, 69, 72, 75Budge, I., 29
Burden, B. C., 119Butler, D., 5, 48, 51, 59, 60, 77, 92Butt, S., 50, 81
Cameron, D., 66, 69, 73campaign spending
Holyrood-Westminstercomparison, 19
by party, 18campaign tone, perceptions of, 64Campbell, A., 13, 36, 51, 72, 130, 133care for the elderly, 5Carman, C. J., 11Catholics
cultural, 31–2voting behaviour, 29–31
centre-periphery cleavage, 28–9,33, 35
Citizens United Against Cuts toPublic Services, 21
Clarke, H. D., 14, 51, 66, 69, 78, 81,91, 119, 130, 146, 148
class, social, see social classClegg, N., 69, 75climate change, 4coalition
coalitions and minoritygovernments, 2–9
formation of Labour-LiberalDemocrat, 3
likelihood under proportionalrepresentation, 80
necessity of in Holyrood, 5party behaviour, 5public perceptions, 2and the Scottish electoral
system, 49
180
10.1057/9781137023704 - More Scottish than British, Christopher Carman, Robert Johns and James Mitchell
Co
pyr
igh
t m
ater
ial f
rom
ww
w.p
alg
rave
con
nec
t.co
m -
lice
nse
d t
o U
niv
ersi
ty o
f S
ydn
ey -
Pal
gra
veC
on
nec
t -
2014
-08-
27

Index 181
Conservativescandidate withdrawals, 21centre-right perceptions, 93economic evaluations, 114election promises, 17election spending, 18fiscal policy, 92ideological distinctiveness, 93party image, 59, 62party switching and, 124perceptions of anti-Scottishness,
102perceptions of Britishness, 35performance with British-focused
voters, 118position on independence, 58positioning in the Scottish party
system, 118and religious identity, 29, 39return to Westminster power, 69tax-spending perceptions, 93tolerance of the SNP, 58voting options, 38voting probabilities by variable,
143constituency party, vote share by, 42Constitutional Convention, 3constitutional preferences, 99
drivers, 72, 101influence on voting behaviour, 79,
93, 100, 103salience, 88and SNP support, 97–8, 101stability, 98–9, 101valence dimension, 102voting behaviour and, 79, 89, 93,
97–104contextual analysis
the campaign, 17–22from coalition to minority
government, 2–9economic and fiscal crisis, 15–16multi-level elections, 9–15
Converse, P., 78Copeland, G., 48council tax, 5, 17, 91
Crewe, I., 33, 34, 50, 77crime
salience, 85–6, 88, 91; see also lawand order
Curtice, J., 50, 67, 99, 106, 108, 115Cutler, F., 12, 127
Dalton, Russell J., 29, 33, 52, 119Danish minority governments,
relevance of research, 6–7Davidson, R., 21de-alignment, 33–4, 52–3, 79, 119decentralization, 12Delli Carpini, M., 77Denver, D., 1, 13, 18, 29, 102, 106devolution
and commitment to Scottishinterests, 102–4
and de-alignment, 34drivers of, 1financing impact, 13first change of government at
Westminster since, 14impact on first-order voting, 115impact on voting, 106–7influence on political behaviour, 9and interdependent model, 12and Labour’s share of the
constituency vote, 42and leadership debates, 50and public expenditure, 1and reshaping of the party system,
119and SNP campaign focus, 98and support for independence, 99Welsh experience, 42
Dewar, D., 7, 13Downs, A., 3, 78, 81dual model of federalism, 12Duch, R. M., 16Dunleavy, P., 119, 120
economic and fiscal crisis,contextual analysis, 15–16
10.1057/9781137023704 - More Scottish than British, Christopher Carman, Robert Johns and James Mitchell
Co
pyr
igh
t m
ater
ial f
rom
ww
w.p
alg
rave
con
nec
t.co
m -
lice
nse
d t
o U
niv
ersi
ty o
f S
ydn
ey -
Pal
gra
veC
on
nec
t -
2014
-08-
27

182 Index
economic competenceperceptions by party, 113as valence aspect of party
image, 60economic voting, 110, 113–14, 116the economy
multi-level context, 112-14perceptions of party competence
on, 114salience, 36, 79-80, 86-8,
98, 116voters’ attribution of responsibility
for, 109-11education, salience, 83, 85, 86,
88, 90, 91, 108–9, 111, 116election manifestos, party
promises, 17election turnout, 10
less-at-stake explanation, 9, 11region-specific variables, 10in sub-state elections, 10
electoral competition, 49, 78electoral system
Holyrood vs. Westminster,10–11, 49
of the Scottish Parliament, 3, 48the electorate, treatment of as single
actor, 130Elff, M., 33Elias, A., 9employment sector, as predictor of
voting behaviour, 39Erikson, R. S., 9European Union, 98–9Evans, G., 66, 77
federal systems, challenges forvoters, 12
federalism, dual vs. interdependentmodels, 12
Fieldhouse, E., 144Fiorina, M., 13, 51, 52, 56, 57, 78,
91, 102, 119, 135Fiorina model, of party
identification, 13, 51–2, 56–7,78, 91
First Minister’s Questions, mediacoverage, 107
fiscal autonomy, 99fiscal retrenchment, 80, 91Flanagan, S., 35Foley, M., 50Franklin, M. N., 33Fredericksen, P., 12Friedman, T., 15funnel of causality, 36, 72
Gallagher, M., 5, 33Gaudet, H., 28gender, significance of in Scottish
political behaviour, 30globalization, electorate’s perception
of impact on responsibility,15–16
Goldie, A., 17, 68, 71, 75governing party performance,
Holyrood and Westminsterevaluations, 82
government performance,perceptions of and electionoutcome, 79
Gray, I., 17, 18, 21, 50, 68,69–70, 71
Green, D. P., 6Green, J., 79Green-Pederson, C., 6Greens
campaign spending, 18electoral performance, 11and flows of voting, 44position on independence, 4, 17SNP agreement, 4sympathy for, 58willingness to work with
Labour, 17
health, salience, 83, 86, 88, 91,108–9, 116
Heath, A. F., 10, 34Held, D., 15Hellwig, T., 15Henderson, A., 10
10.1057/9781137023704 - More Scottish than British, Christopher Carman, Robert Johns and James Mitchell
Co
pyr
igh
t m
ater
ial f
rom
ww
w.p
alg
rave
con
nec
t.co
m -
lice
nse
d t
o U
niv
ersi
ty o
f S
ydn
ey -
Pal
gra
veC
on
nec
t -
2014
-08-
27

Index 183
Holmberg, S., 50Horsman, M., 15Hough, D., 9Howat, B., 16
ideological convergence, 93independence
Conservative position, 58Green and SNP positions, 4, 17impact of competence evaluations
on support for, 101Labour position, 65SNP position, 2, 60and voting behaviour, 79, 88–90,
93, 97–9, 101, 103–4industrial revolution, 28Inglehart, R., 35interdependent model of
federalism, 12invalidated ballots, 9, 11Iraq and Afghanistan, 88issue placement, 95Iyengar, S., 110
Jeffrey, C., 9Jennings, K., 13Johns, R., 13, 17, 18, 26, 30, 37, 52,
56, 64, 66, 67, 69, 82, 86, 93, 97,100, 102, 106, 107, 108, 119,127, 133, 139, 150, 151, 171
Johnston, R., 119Jones, R. W., 9, 40
Katz, R., 5Keeter, S., 77Key, V. O., 78King, A., 66Kirchheimer, O., 46, 60Klofstad, C. A., 119
Labouradvantage over SNP among
British-focused voters, 118deviation from proportionality
and chair of the Scottishvote, 41
economic evaluations, 113election performances, 3, 54flows of voters between SNP and,
43–6, 121–2, 124governing performance
assessment, 80–2impact of social change on
support for, 34multi-level context of
identification with, 122partisanship advantage, 53party image, 62perceptions of commitment to
Scottish interests, 102–3perceptions of performance on
Scottish interests, 96–7position on independence, 65post-2010 shift towards, 14proximity of the SNP and, 93retention of identifiers, 55scepticism about likely
performance, 100showing at British level, 118voting probabilities by variable,
141Laver, M., 5law and order
salience, 83, 90–1, 108–9; see alsocrime
Lazarsfeld, P., 28leader evaluations, measuring, 69leadership debates, 17, 50, 67
media reaction, 67perceived performances, 68
leadership evaluationsimpact on party choice, 74like-dislike ratings, 70and party choice, 72–5and Scottish electoral behaviour,
66–7televised debates and, 67–8and UK electoral behaviour, 66Westminster’s influence, 69, 71
León, S., 12, 127less-at-stake explanation, of election
turnout, 9, 11
10.1057/9781137023704 - More Scottish than British, Christopher Carman, Robert Johns and James Mitchell
Co
pyr
igh
t m
ater
ial f
rom
ww
w.p
alg
rave
con
nec
t.co
m -
lice
nse
d t
o U
niv
ersi
ty o
f S
ydn
ey -
Pal
gra
veC
on
nec
t -
2014
-08-
27

184 Index
Liberal Democrats, 16beneficiaries of decline, 44campaign spending, 18coalition with Labour, 1, 3, 49collapse of vote, 43–4election promises, 17fall in popularity, 57–8, 65, 75multi-level context of
support, 124party identification, 56party image, 62retention of identifiers, 55share of Commons vote, 45voting options, 38voting probabilities by variable,
145Linz, J., 35Lipset, S. M., 28–9living standards, salience, 83, 84, 85,
90, 111local taxation, 5, 91–2Lodge, M., 67loyalty, 13, 28, 48, 51, 79, 90
MacDonald, M., 7MacDonald, S. K., 34Mair, P., 5, 33majority building, 7, 8manifesto commitments, SNP, 5manifestos, voter awareness, 78Marshall, A., 15McConnell, J., 4, 69–70McCutcheon, A., 51McEwen, N., 10McGrew, A., 15McLean, I., 9Michigan model, of party
identification, 13, 51–2, 54,57–8, 120
mid-term elections, 9Miliband, E., 69–71Miller, A. E., 66Miller, W., 150minority government
accountability, 2blurring of responsibility, 15
Danish experience, 6–7and economic instability, 5Green MSPs’ support for SNP, 4keys to success, 7leadership, 49and majority building, 7minority governments and
coalitions, 2–9need for coalition building, 9UK’s experience, 5
Mitchell, J., 12, 48, 49, 102,153
Moreno Question, 35, 40Morgan, R., 42‘most important issue,’ 36, 89–90,
95, 109, 112–14, 116Mughan, A., 50multi-level elections, contextual
analysis, 9–15multi-level perspectives
partisanship, 119–27party identification, 122, 125perceptions of policy
responsibility by level, 109responsibility for policy outcomes
by level, 111
Nannestad, P., 76national identity
as predictor of voting behaviour,35, 40
social class and, 33–6new politics, 48newspaper readership, as predictor
of voting behaviour, 38Nice, D., 12Niemi, R., 13Northern Ireland, 10nuclear power stations, 4
Ohmae, K., 15Ormston, R., 15Osmond, J., 42Other parties
decline, 7electoral performance, 11
10.1057/9781137023704 - More Scottish than British, Christopher Carman, Robert Johns and James Mitchell
Co
pyr
igh
t m
ater
ial f
rom
ww
w.p
alg
rave
con
nec
t.co
m -
lice
nse
d t
o U
niv
ersi
ty o
f S
ydn
ey -
Pal
gra
veC
on
nec
t -
2014
-08-
27

Index 185
Paldam, M., 76partisanship
inflating consistency levels, 121inter-generational transmission,
51–3mover-stayer model, 52–3multi-level context, 119–27in the Scottish electorate, 53and voting behaviour, 57–9
Partnership Agreements, 3, 16party choice
effects of leadership evaluationson, 74
explaining the outcome,145–51
how Scotland votes today,151–7
leadership evaluations and,72–5
models of, 131–45multi-level perspective, 114–19
party identification, 55, 123flexibility, 119–20influence of Westminster
politics, 56levels of government and, 13–14main social bases for, 28–9measuring, 53Michigan model, 13, 51–2, 54,
57–8, 120multi-level context, 56nature and origins, 51and public impressions of
leadership debates, 68role of, 54traditional vs. revisionist accounts,
51–2, 54and voting behaviour, 50–7
party imagecore issues and, 60definition, 59general popularity and, 62impact on like-dislike ratings, 63judging criteria, 62–3party ratings on facets of, 61
and perceptions of campaign tone,64–5
positive projection and, 64ratings, 61valence aspects, 60and voting behaviour, 59–65
party leadersand government formation, 49like-dislike ratings, 70
party political broadcasts, 18party ratings, mean, 58Paterson, L., 79, 93, 100, 106Patterson, S., 48Pattie, C., 64Peres, H., 35performance politics
assessing the government’s record,80–6
constitutional perspective, 97–104issues/policies/performance, 91–7roots of, 78salience of issues, 86–90specifically Scottish dimension, 89
policy issuesopinion distributions, 92voter self-placements and mean
party placements, 94political behaviour
devolution’s influence, 9distinct Scottish pattern, 29influence of social structures on,
28–9Powell, G. B., 2predictor variables, of voting
behaviour, 37–9presidentialization, 49–50, 66Presser, S., 121proportional representation, 4, 80public finances, 90public sector, 90
Quebec, 10Quinn, T., 59
referendum, 13, 17, 117, 131Reif, K., 9, 106, 107
10.1057/9781137023704 - More Scottish than British, Christopher Carman, Robert Johns and James Mitchell
Co
pyr
igh
t m
ater
ial f
rom
ww
w.p
alg
rave
con
nec
t.co
m -
lice
nse
d t
o U
niv
ersi
ty o
f S
ydn
ey -
Pal
gra
veC
on
nec
t -
2014
-08-
27

186 Index
religionpersistence of denominational
cleavage, 34religion/religiosity and voting
behaviour, 31religious divisions as social bases
of parties, 28significance of in Scottish political
behaviour, 29retrospective voting, 78Rokkan, S., 28–9Rose, R., 28, 29, 59Russell, A., 144
salience, 15, 86–90, 92,95, 98
Salmond, A., 4, 7, 17, 22, 49, 66–72,74–5
Sarlvik, B., 34Scarrow, S., 119Schmitt, H., 9, 106, 107Scholte, J. A., 15Schuman, H., 121Scott, T., 17, 70–1, 75Scottish Election Study (SES)
data collection, 158–9full results, 160–8methodology, 158representativeness and weighting,
159see also survey analyses
Scottish electionscampaign spending, 19, 21perceptions of what’s at stake,
108–11Scottish interests, judging
commitment to, 80, 88, 90,96–7, 102–4
Scottish Parliamentbase model of the 2011 vote,
36–40drivers of support for
establishment, 13election results, 6election turnout levels, 10electoral system, 3, 48
establishment, 1financing increase, 16
Scottishness of the electionbasis for decision-making, 114–19multi-level context, 119–27multi-level economic context,
112–14perceptions of importance, 108–11
Scully, R., 9, 40second-order election theory, 9–10,
106–7Siaroff, A., 9SNP
attitudes prediction model, 100ballot paper listing, 49competence evaluations, 100–2constitutional preference and, 89,
97–8, 101drivers of change in attitudes
towards, 101economic evaluations, 114effects of significant variables on
voting probability, 138flows of voters between Labour
and, 43–6, 121–2governing performance
assessment, 80–1Labour’s advantage over among
British-focused voters, 118main reason for leadership
advantage, 70–1materialist basis of support,
35–6mobilization performance, 55multi-level context of
identification with, 122–3multi-level context of support,
124, 126party identification model, 53party image, 60, 62perceptions of economic
competence, 114perceptions of performance on
Scottish interests, 97position on independence, 2, 4,
17, 60
10.1057/9781137023704 - More Scottish than British, Christopher Carman, Robert Johns and James Mitchell
Co
pyr
igh
t m
ater
ial f
rom
ww
w.p
alg
rave
con
nec
t.co
m -
lice
nse
d t
o U
niv
ersi
ty o
f S
ydn
ey -
Pal
gra
veC
on
nec
t -
2014
-08-
27

Index 187
press endorsement, 21–2proximity with Labour, 93public perceptions of election
campaign, 17reputation for competence, 86retention of identifiers, 55supporters’ partisan bias, 86valence criteria and, 90viability of for office, 107
social classand the Industrial Revolution,
28and the Labour vote, 32–3, 40,
60and national identity, 33–6and party choice, 29, 32and party image, 60party vote by, 32
social cleavage, literature review,28
socio-demographic perspective, ofvoting behaviour, 27–33, 39
spoiled ballots, 11Stevens, D., 66, 69Stevenson, R. T., 16Stewart, M. C., 14, 119Stokes, D., 48, 51, 60, 77, 91, 92Strangers to Ourselves (Wilson),
115Strøm, K., 5, 6Studlar, D., 10sub-state elections, turnout levels,
10The Sun, 21–2Surridge, P., 102
Taber, Charles S., 67tax and spending, 93, 95, 99television, as campaign
battleground, 50Tilley, J., 51Tufte, E., 9tuition fees, 5
unemployment, 36, 90, 113–14Urwin, D., 28, 29
valenceorigins of term, 91SNP’s preference, 117
valence dimension, of constitutionalpreference, 102
valence issueseconomic competence
and, 60vs. position issues,
91–2valence model of voting, 78–80valence voting
dominance in the 2011 election,92, 95
evidence of, 88–9veto power, 2–3, 7voting, performance politics
model, 78voting behaviour
base model, 36–40changes in, 45, 46and collective identity, 33–6by constituency party, 42constitutional preferences and, 79,
89, 93, 97–104vs. election outcome, 79electoral system effects, 40–3flows, 43–6importance of party leaders,
48–50; see also leadershipevaluations
key drivers, 88by national identity, 36by objective/subjective social
class, 32partisanship and, 57–9party identification and, 50–7party image and, 59–65predictor variables, 37–9religion/religiosity and, 31socio-demographic perspective,
27–33, 39statistically significant variables,
134–5voting intentions, Holyrood, 14–15Vowles, J., 2, 16
10.1057/9781137023704 - More Scottish than British, Christopher Carman, Robert Johns and James Mitchell
Co
pyr
igh
t m
ater
ial f
rom
ww
w.p
alg
rave
con
nec
t.co
m -
lice
nse
d t
o U
niv
ersi
ty o
f S
ydn
ey -
Pal
gra
veC
on
nec
t -
2014
-08-
27

188 Index
Wattenberg, M. P., 52Weiss, L., 15Westminster elections, spillover
effect, 1Wheatley, J., 170Whiteley, P., 119
Wilson, T. D., 67, 115Wlezien, C., 88Wyn Jones, R., 9
Zaller, J. R., 51, 78Zuckerman, A., 28
10.1057/9781137023704 - More Scottish than British, Christopher Carman, Robert Johns and James Mitchell
Co
pyr
igh
t m
ater
ial f
rom
ww
w.p
alg
rave
con
nec
t.co
m -
lice
nse
d t
o U
niv
ersi
ty o
f S
ydn
ey -
Pal
gra
veC
on
nec
t -
2014
-08-
27