more than 60 years of unique heritage h1 2016 … · 4 our story: more than 60 years of heritage...
TRANSCRIPT
MORE THAN 60 YEARS OF UNIQUE HERITAGE H1 2016 Financial Results

COMPANY OVERVIEW

Our story is made of
Heritage Uniqueness
Quality Consistency
4
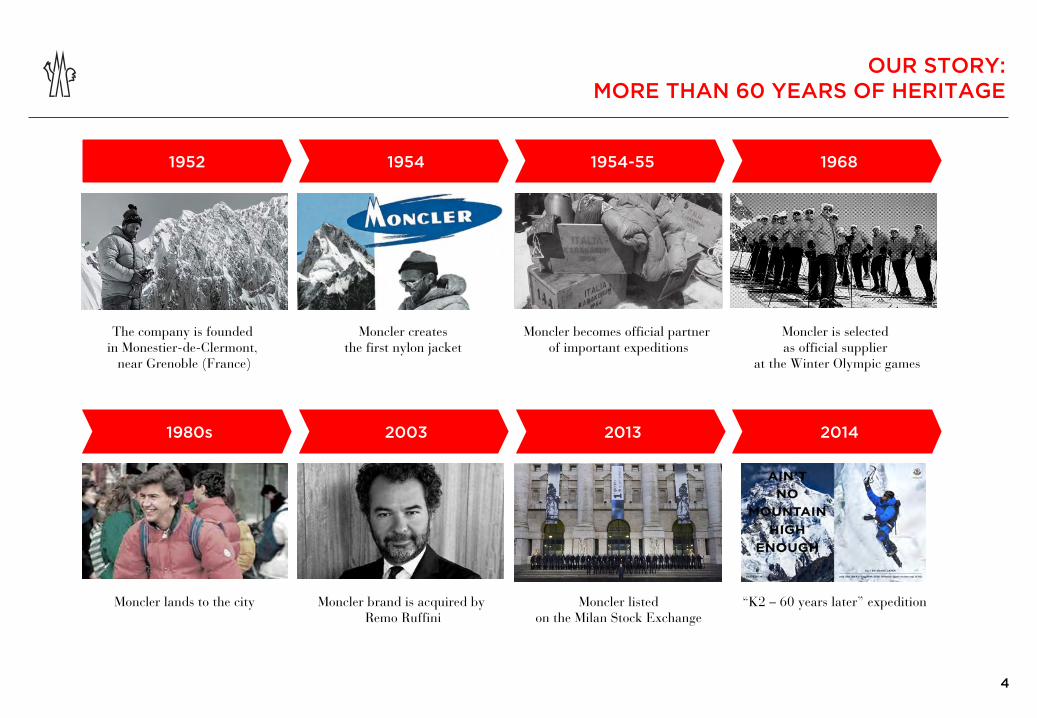
OUR STORY: MORE THAN 60 YEARS OF HERITAGE
Moncler lands to the city Moncler brand is acquired by Remo Ruffini
Moncler listed on the Milan Stock Exchange
“K2 – 60 years later” expedition
The company is founded in Monestier-de-Clermont,
near Grenoble (France)
Moncler creates the first nylon jacket
Moncler becomes official partner of important expeditions
Moncler is selected as official supplier
at the Winter Olympic games
1952 1954 1954-55 1968
2003 2013 2014 1980s
4
5
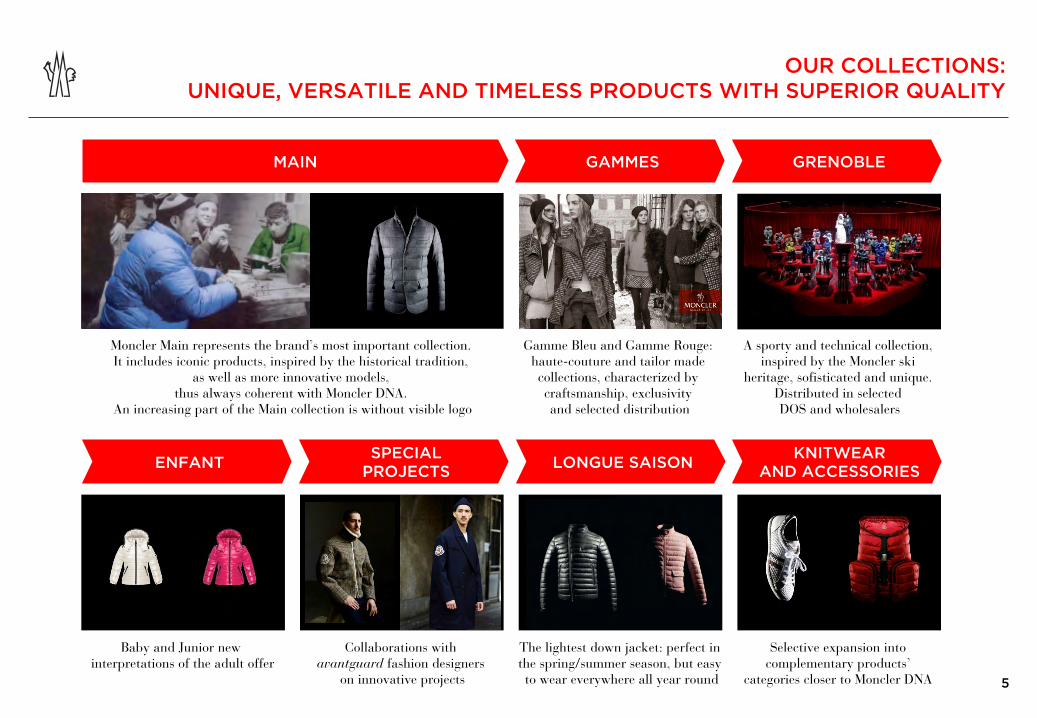
OUR COLLECTIONS: UNIQUE, VERSATILE AND TIMELESS PRODUCTS WITH SUPERIOR QUALITY
Collaborations with avantguard fashion designers
on innovative projects
The lightest down jacket: perfect in the spring/summer season, but easy to wear everywhere all year round
Selective expansion into complementary products’
categories closer to Moncler DNA
Moncler Main represents the brand’s most important collection. It includes iconic products, inspired by the historical tradition,
as well as more innovative models, thus always coherent with Moncler DNA.
An increasing part of the Main collection is without visible logo
Gamme Bleu and Gamme Rouge: haute-couture and tailor made collections, characterized by craftsmanship, exclusivity and selected distribution
A sporty and technical collection, inspired by the Moncler ski
heritage, sofisticated and unique. Distributed in selected DOS and wholesalers
MAIN GAMMES GRENOBLE
SPECIAL PROJECTS LONGUE SAISON KNITWEAR
AND ACCESSORIES ENFANT
Baby and Junior new interpretations of the adult offer
6
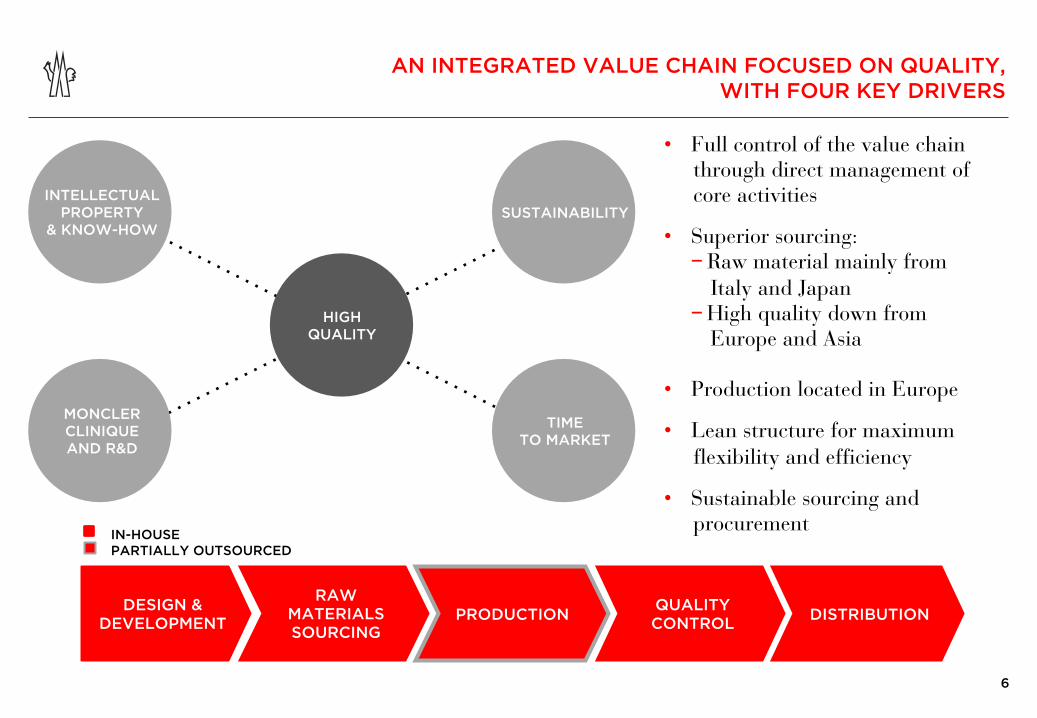
IN-HOUSE PARTIALLY OUTSOURCED
DESIGN & DEVELOPMENT
RAW MATERIALS SOURCING
QUALITY CONTROL DISTRIBUTION PRODUCTION
AN INTEGRATED VALUE CHAIN FOCUSED ON QUALITY, WITH FOUR KEY DRIVERS
• Full control of the value chain through direct management of core activities
• Superior sourcing: − Raw material mainly from
Italy and Japan − High quality down from
Europe and Asia
• Production located in Europe
• Lean structure for maximum flexibility and efficiency
• Sustainable sourcing and procurement
HIGH QUALITY
SUSTAINABILITY
TIME TO MARKET
INTELLECTUAL PROPERTY
& KNOW-HOW
MONCLER CLINIQUE AND R&D
7
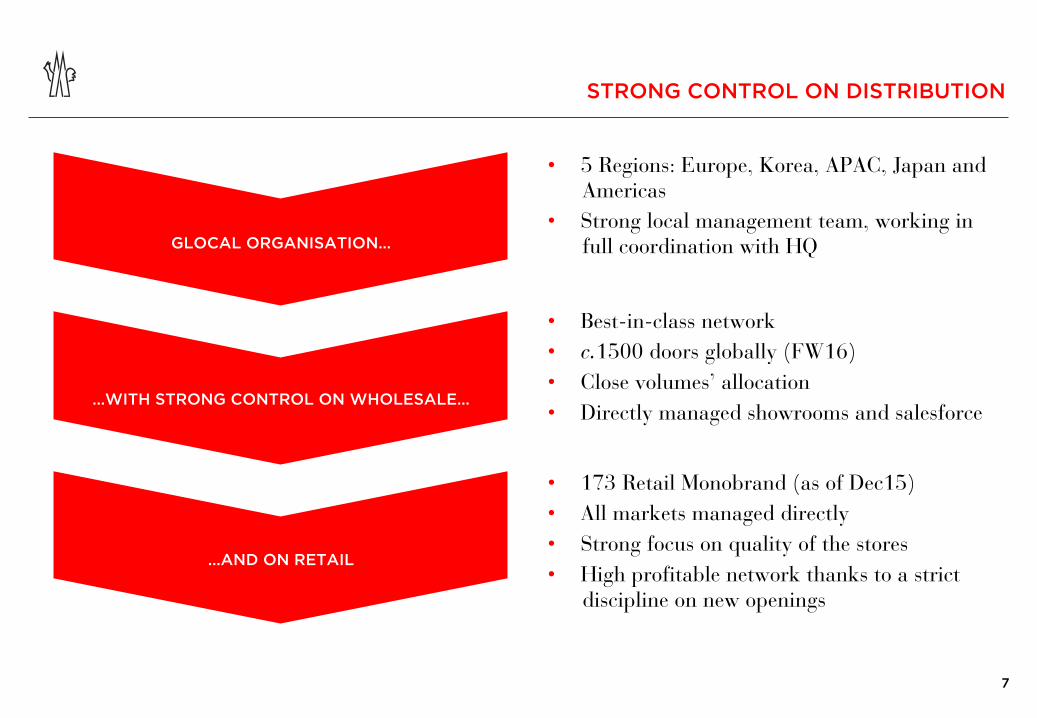
STRONG CONTROL ON DISTRIBUTION
• 5 Regions: Europe, Korea, APAC, Japan and Americas
• Strong local management team, working in full coordination with HQ GLOCAL ORGANISATION…
…WITH STRONG CONTROL ON WHOLESALE…
…AND ON RETAIL
• Best-in-class network • c.1500 doors globally (FW16) • Close volumes’ allocation • Directly managed showrooms and salesforce
• 173 Retail Monobrand (as of Dec15) • All markets managed directly • Strong focus on quality of the stores • High profitable network thanks to a strict
discipline on new openings

8
AN OUTSTANDING TRACK RECORD
0 100 200 300 400 500 600 700 800 900
2003 2004 2005 2006 2007 2008 2009 2010 2011 2012 2013 2014 2015
REVENUES – Eur m
16%
30% 38%
16%
42%
34%
18%
6%
2010 2015
Italy EMEA
Americas Asia & RoW
Wholesale Retail
2003-2015: +26% CAGR
9
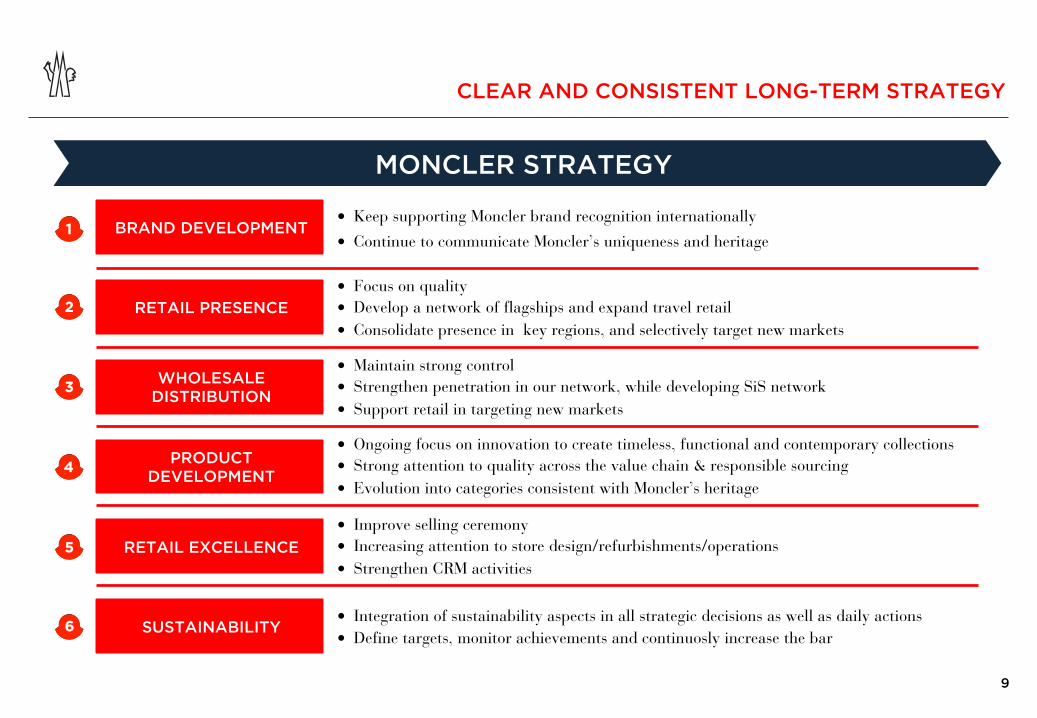
MONCLER STRATEGY
BRAND DEVELOPMENT
RETAIL PRESENCE
WHOLESALE DISTRIBUTION
PRODUCT DEVELOPMENT
• Keep supporting Moncler brand recognition internationally • Continue to communicate Moncler’s uniqueness and heritage
• Focus on quality • Develop a network of flagships and expand travel retail • Consolidate presence in key regions, and selectively target new markets
• Maintain strong control • Strengthen penetration in our network, while developing SiS network • Support retail in targeting new markets
• Ongoing focus on innovation to create timeless, functional and contemporary collections • Strong attention to quality across the value chain & responsible sourcing • Evolution into categories consistent with Moncler’s heritage
1
2
3
4
5 RETAIL EXCELLENCE • Improve selling ceremony • Increasing attention to store design/refurbishments/operations • Strengthen CRM activities
6
CLEAR AND CONSISTENT LONG-TERM STRATEGY
SUSTAINABILITY • Integration of sustainability aspects in all strategic decisions as well as daily actions • Define targets, monitor achievements and continuosly increase the bar

10
UNTAPPED GROWTH POTENTIALS: RETAIL
Consolidated Strengthen Penetration New Markets
• Consolidation of key regions - Western Europe - Japan - Mainland China
• Strengthen penetration in high potential markets - North America - Korea - Eastern Europe - Travel retail
• Careful assessment of new markets - UAE and Australia - Nordic countries - Mexico
• Selective Flagships Expansion - Target 6-8 locations in the main
luxury streets
11
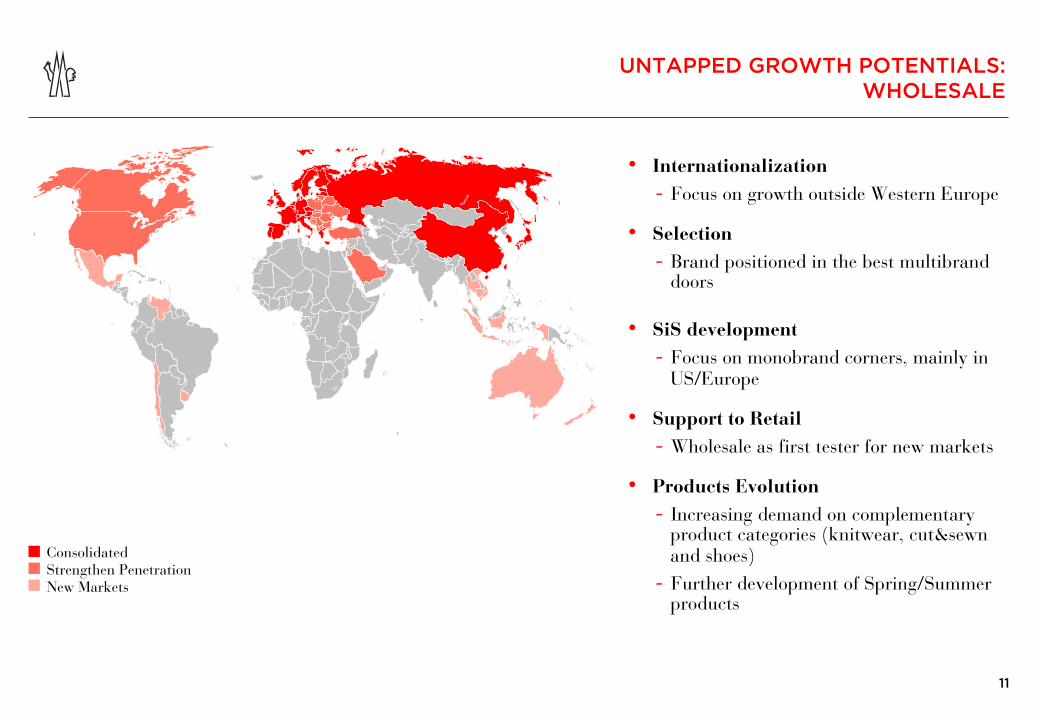
UNTAPPED GROWTH POTENTIALS: WHOLESALE
• Internationalization - Focus on growth outside Western Europe
• Selection
- Brand positioned in the best multibrand doors
• SiS development - Focus on monobrand corners, mainly in US/Europe
• Support to Retail
- Wholesale as first tester for new markets • Products Evolution
- Increasing demand on complementary product categories (knitwear, cut&sewn and shoes) - Further development of Spring/Summer products
Consolidated Strengthen Penetration New Markets

12
We care not only to deliver our promises
but how we reach our goals

13
SUSTAINABILITY 2015: FACTS AND FIGURES
(*) Excluding workers. Percentage calculated on 2014 total number of employees, the year in which the 2015 assessment process began. (**) Excluding nine shop-in-shops in which lighting is provided by the host department store, where Moncler cannot take action.
Approx. 995 tonnes of CO2
estimated savings through the use of video/tele conferencing systems
120 audits
Conducted throughout the down supply chain, to check compliance with the DIST protocol
Created to assure animal welfare and traceability, throughout the down supply chain
DIST PROTOCOL 43.1% of new hires are under 30
Control, Risks and Sustainability Committee established at BoD level
SUSTAINABILITY GOVERNANCE
Sustainability Report and Sustainability Plan
1st
of employees* assessed on performance
45.2%
52% of stores have LED lighting** of the total value of supplier
orders covered by social audits
26% Incorporated into the Enterprise Risk Management system
SUSTAINABILITY RISKS
of employees are women
68.1% Staff growth versus 2014
+38.1%
14
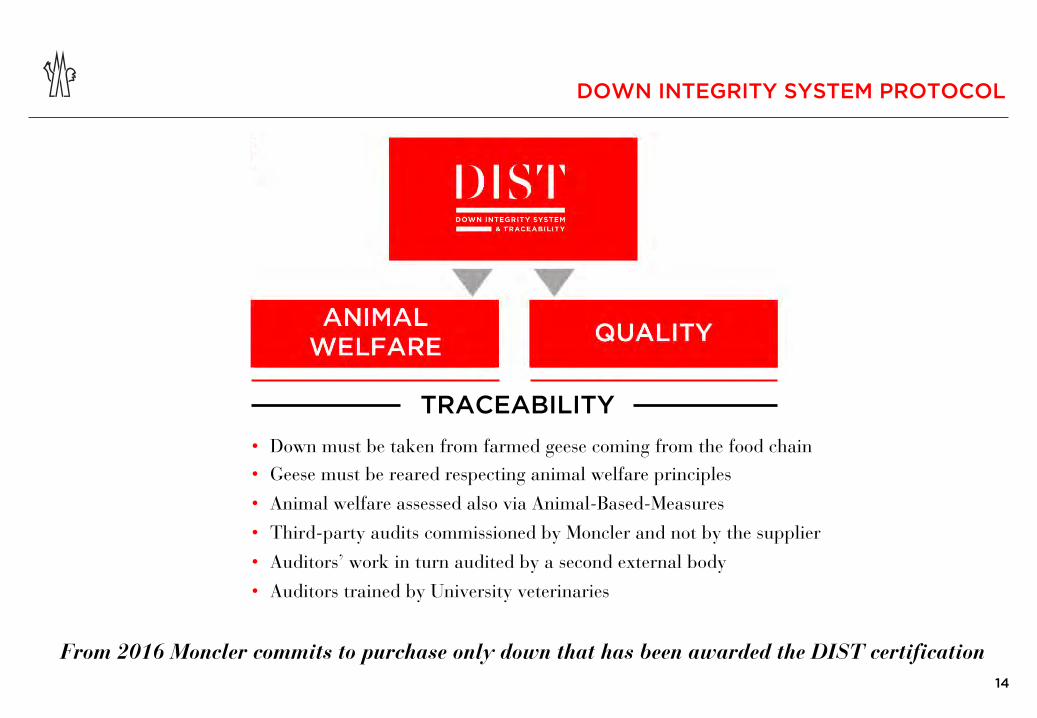
DOWN INTEGRITY SYSTEM PROTOCOL
TRACEABILITY • Down must be taken from farmed geese coming from the food chain • Geese must be reared respecting animal welfare principles • Animal welfare assessed also via Animal-Based-Measures • Third-party audits commissioned by Moncler and not by the supplier • Auditors’ work in turn audited by a second external body • Auditors trained by University veterinaries
From 2016 Moncler commits to purchase only down that has been awarded the DIST certification
15
H1 2016 RESULTS

16

17
“We hosted our first World Wide Summit
to roll-out our Retail Excellence project”

18
“Our flagship store in London - Bond Street, another important step in our strategy to focus
on high quality openings”
19
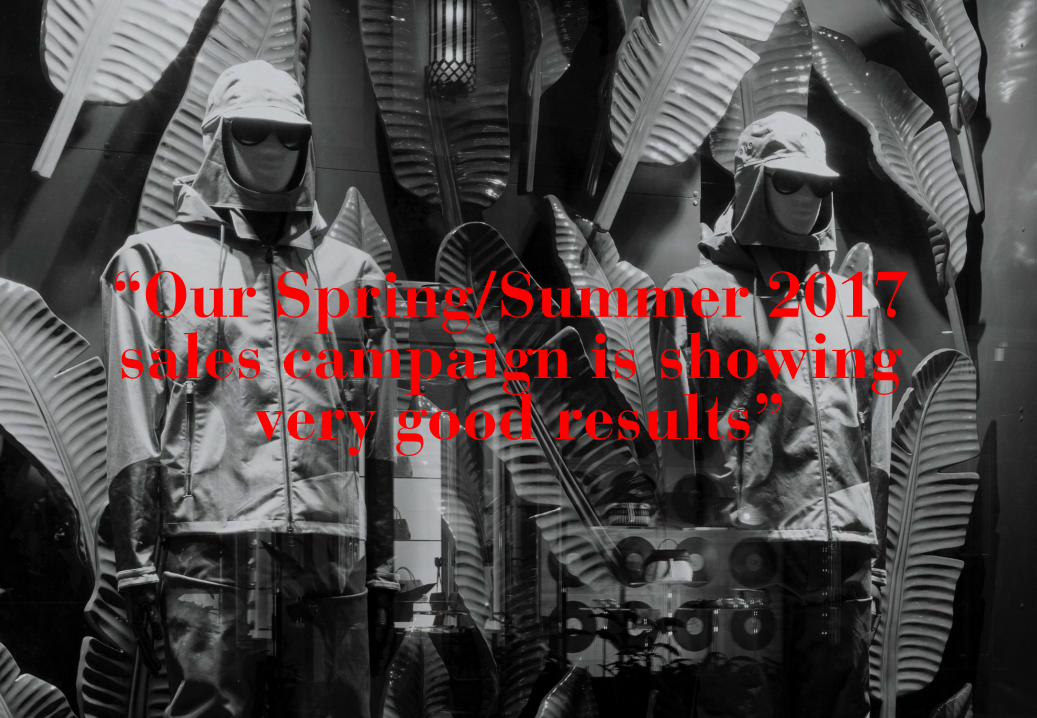
“Our Spring/Summer 2017 sales campaign is showing
very good results”

20
“All this makes me confident about the future”

21
H1 2016 RESULTS HIGHLIGHTS (*)
• Consolidated Revenues: Eur 346.5m, +17% YoY growth reported (+17% at constant exchange rates)
• International markets: Eur 292.3m, equal to 84% of total revenues (83% in H1 2015)
• Retail Revenues: Eur 245.9m, 71% of total revenues (68% in H1 2015)
• H1 2016 Comparable Store Sales Growth: +5%
• EBITDA Adjusted(**): Eur 78.3m with a margin on sales of 22.6% (24.0% in H1 2015)
− Eur 3m net negative impact of rents for stores not yet opened
• EBIT Adjusted(**): Eur 59.0m, with a margin on sales of 17.0% (18.2% in H1 2015)
• Net Income, Group share: Eur 33.6m with a margin on sales of 9.7% (11.5% in H1 2015)
• Net Debt: Eur 84.9m vs. Eur 49.6m as of December 2015 and Eur 175.3m as of June 2015
(*) This applies to all pages: rounded figures
(**) Before non-recurring items
1
2
3
4
5
6
7
8
22
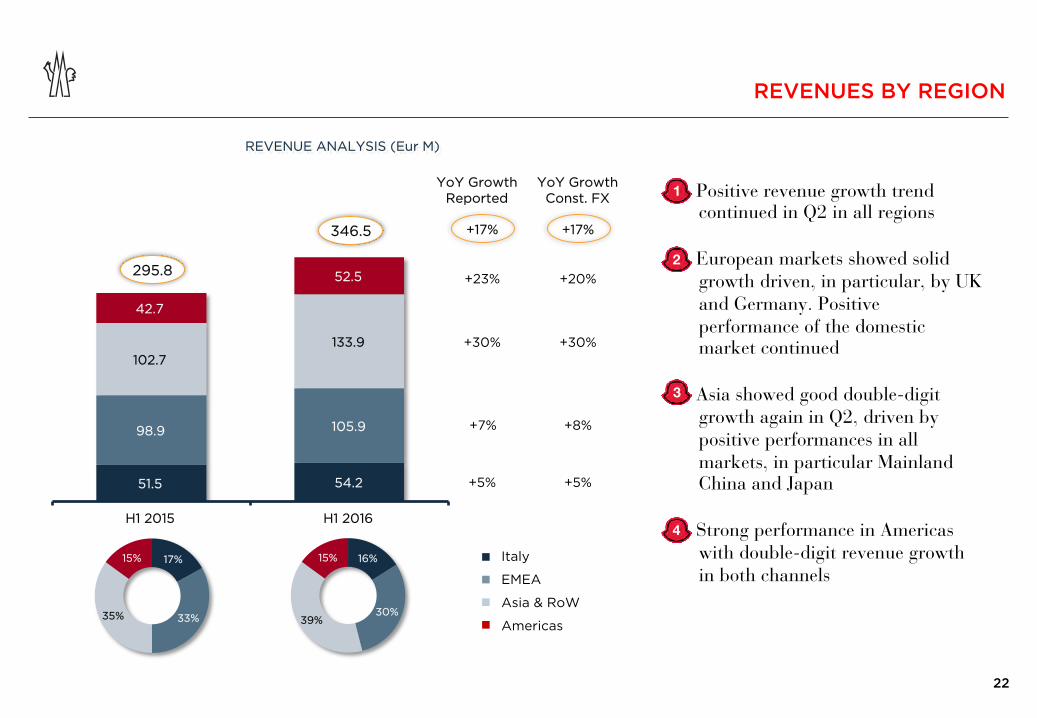
• Positive revenue growth trend continued in Q2 in all regions
• European markets showed solid growth driven, in particular, by UK and Germany. Positive performance of the domestic market continued
• Asia showed good double-digit growth again in Q2, driven by positive performances in all markets, in particular Mainland China and Japan
• Strong performance in Americas with double-digit revenue growth in both channels
REVENUES BY REGION
2
1
4
REVENUE ANALYSIS (Eur M)
Asia & RoW
Italy
EMEA
Americas
51.5 54.2
98.9 105.9
102.7 133.9
42.7
52.5
H1 2015 H1 2016
17%
33% 35%
15%
YoY Growth Reported
YoY Growth Const. FX
295.8
346.5 +17%
+23%
+30%
+7%
+5%
+17%
+20%
+30%
+8%
+5%
16%
30% 39%
15%
3

23
REVENUES BY DISTRIBUTION CHANNEL
• Both distribution channels registered solid growth
• Retail revenues continued double-digit rise, supported by organic growth and good performance of new openings
• Sales of comparable DOS (Comp-Store Sales) rose 5% in the first six months of 2016, with positive performances in all regions
• Wholesale sales achieved +6% growth at constant exchange rates, mainly driven by North America and Europe
REVENUE ANALYSIS (Eur M)
29%
71%
32%
68%
YoY Growth Reported
YoY Growth Const. FX
+22%
+7%
+22%
+6%
Wholesale
Retail
+17% +17%
94.4 100.6
201.4 245.9
H1 2015 H1 2016
295.8
346.5
2
1
4
3

24
MONOBRAND STORES NETWORK
30/06/2015 31/12/2015 30/06/2016
Retail 153 173 179
Italy 19 19 19
EMEA (excl. Italy) 51 53 54
Asia & RoW 69 82 85
Americas 14 19 21
Wholesale 31 34 36
TOTAL 184 207 215
• Retail network reached 179 mono-brand stores at end of June
• 6 new retail stores opened in the first half with 4 opening in Q2, including a flagship store in London - Bond Street, a travel retail store in Seoul - Incheon airport and Moncler’s first DOS in San Francisco
• Further 9 retail stores expected to be opened in H2 (2 have already opened), including the NY Madison Avenue flagship store
• 8 relocations expected in FY 2016, including in Miami (already opened) and the flagship store in Seoul, Korea
• 5 additional wholesale monobrand stores expected in H2, including some shop-in-shops in North America
2
1
4
3
5

25

26
Eur m % Eur m % Eur m %
Revenues 346.5 100.0% 295.8 100.0% 880.4 100.0%
YoY growth +17% +35% +27%
Cost of sales (89.7) (25.9%) (80.8) (27.3%) (225.5) (25.6%)
Gross margin 256.8 74.1% 215.0 72.7% 654.9 74.4%
Selling expenses (128.9) (37.2%) (102.5) (34.6%) (253.5) (28.8%)
General & Administrative expenses (44.1) (12.7%) (37.9) (12.8%) (79.5) (9.0%)
Advertising & Promotion (24.8) (7.2%) (20.8) (7.0%) (57.8) (6.6%)
EBIT ADJ 59.0 17.0% 53.8 18.2% 264.1 30.0%
Non-recurring items (5.5) (1.6%) (5.8) (2.0%) (11.4) (1.3%)
EBIT 53.5 15.4% 47.9 16.2% 252.7 28.7%
Net financial result (3.5) (1.0%) 3.2 1.1% (1.7) (0.2%)
EBT 50.0 14.4% 51.1 17.3% 251.0 28.5%
Taxes (16.4) (4.7%) (17.0) (5.7%) (83.1) (9.4%)
Tax Rate 32.8% 33.2% 33.1%
Net Income 33.6 9.7% 34.1 11.5% 167.9 19.1%
Non-controlling interests 0.0 0.0% (0.1) (0.0%) (0.0) (0.0%)
Net Income, Group share 33.6 9.7% 34.0 11.5% 167.9 19.1%
YoY growth -1% +88% +29%
EBITDA ADJ 78.3 22.6% 70.9 24.0% 300.0 34.1%
YoY growth +10% +53% +29%
H1 2016 H1 2015 FY 2015
INCOME STATEMENT
(*) Non-recurring items include mainly non-cash costs related to stock based compensation plans and, in H1 2015, also extraordinary costs related to the Other Brands Division
*
(**) Net Financial Result includes FX Gain/(Losses): Eur (1.4)m in H1 2016, Eur 5.9m in H1 2015, Eur 4.0m in FY 2015
**
27
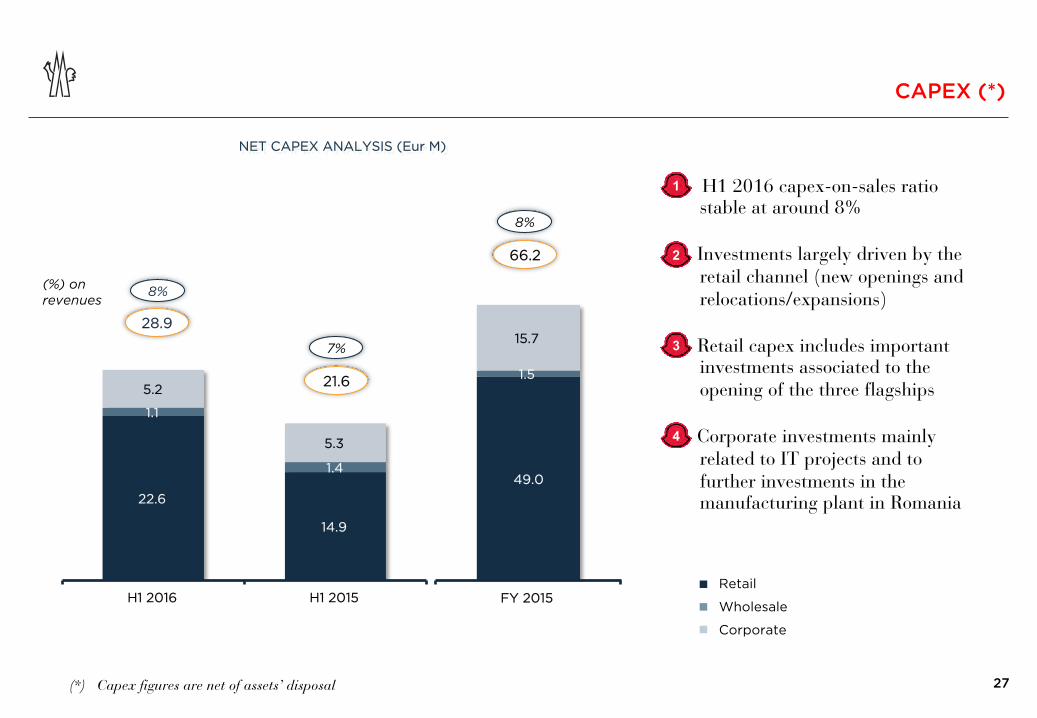
CAPEX (*)
(*) Capex figures are net of assets’ disposal
• H1 2016 capex-on-sales ratio stable at around 8%
• Investments largely driven by the retail channel (new openings and relocations/expansions)
• Retail capex includes important investments associated to the opening of the three flagships
• Corporate investments mainly related to IT projects and to further investments in the manufacturing plant in Romania
1
2
Corporate
Retail
Wholesale
3
21.6
7%
22.6
14.9
1.1
1.4
5.2
5.3
H1 2016 H1 2015
(%) on revenues
NET CAPEX ANALYSIS (Eur M)
28.9
8%
49.0
1.5
15.7
FY 2015
66.2
8%
4

28
NET WORKING CAPITAL
(156.7) (113.0)
178.5 134.1
57.2 89.8
30/06/2016 31/12/2015
79.0 110.9
(%) on LTM revenues 8%
13% • Solid Working Capital management
• Tight control on Receivables confirmed as well as strong Inventories management
• Working Capital influenced by the seasonality of the business
1
Account receivables
Account payables
Inventory
NET WORKING CAPITAL ANALYSIS (Eur M)
91.8
12%
59.4
30/06/2015
175.2
(142.8)
2
3

29
30/06/2015
NET FINANCIAL POSITION
(115.8) (148.6)
99.1 71.2
101.6 127.0
30/06/2016 31/12/2015
84.9 49.6
• Trend in Cash Flow evolution remained solid
• At the end of June 2016 the Group’s Net Debt halved compared to the same period of 2015
• Financial Position influenced by the seasonality of the business
1
2
NET DEBT ANALYSIS (Eur M)
Long-term borrowings, net
Cash and cash equivalents
Short-term borrowings, net
175.3
126.5
(102.1)
150.9
3
30
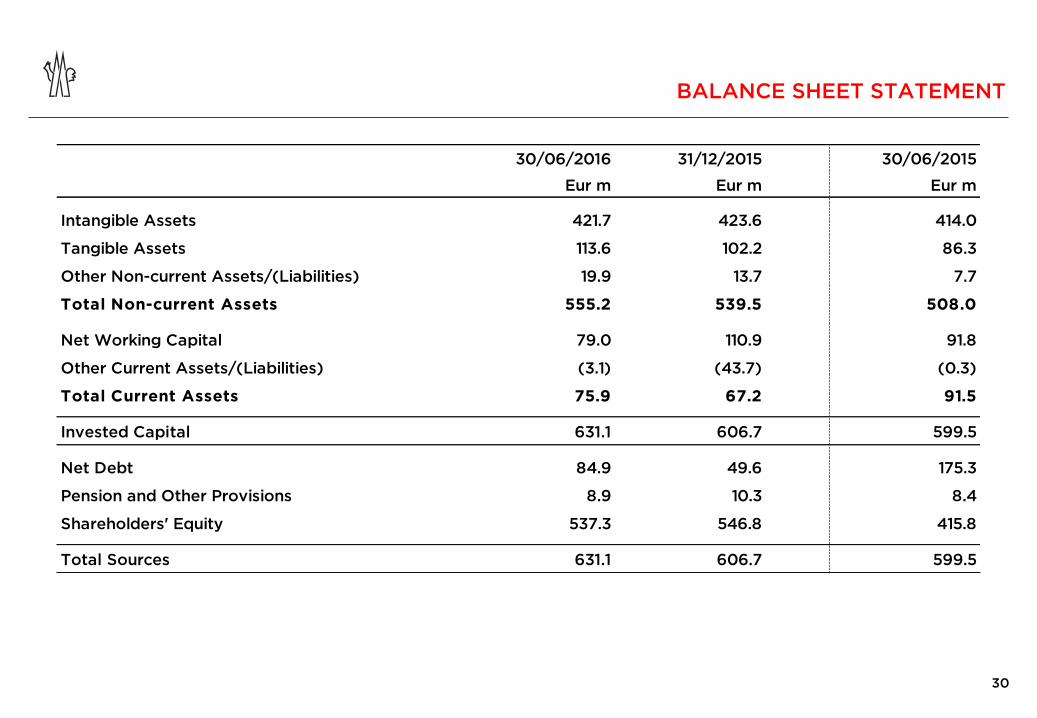
BALANCE SHEET STATEMENT
30/06/2016 31/12/2015 30/06/2015Eur m Eur m Eur m
Intangible Assets 421.7 423.6 414.0
Tangible Assets 113.6 102.2 86.3
Other Non-current Assets/(Liabilities) 19.9 13.7 7.7
Total Non-current Assets 555.2 539.5 508.0
Net Working Capital 79.0 110.9 91.8
Other Current Assets/(Liabilities) (3.1) (43.7) (0.3)
Total Current Assets 75.9 67.2 91.5
Invested Capital 631.1 606.7 599.5
Net Debt 84.9 49.6 175.3
Pension and Other Provisions 8.9 10.3 8.4
Shareholders' Equity 537.3 546.8 415.8
Total Sources 631.1 606.7 599.5

31
CASH FLOW STATEMENT
H1 2016 H1 2015 FY 2015Eur m Eur m Eur m
EBITDA Adjusted 78.3 70.9 300.0
Change in Net Working Capital 31.8 5.3 (13.8)
Change in other curr./non-curr. assets/(liabilities) (48.1) (55.9) (16.6)
Capex, net (28.9) (21.6) (66.2)
Operating Cash Flow 33.1 (1.3) 203.4
Net financial result (3.5) 3.2 (1.7)
Taxes (16.4) (17.0) (83.1)
Free Cash Flow 13.2 (15.1) 118.6
Dividends paid (34.9) (30.4) (30.5)
Changes in equity and other changes (13.6) (18.6) (26.5)
Net cash Flow (35.3) (64.1) 61.6
Net Financial Debt - Beginning of Period 49.6 111.2 111.2
Net Financial Debt - End of Period 84.9 175.3 49.6
Change in Net Financial Debt (35.3) (64.1) 61.6
32
APPENDIX

33
2016 QUARTERLY REVENUE BREAKDOWN BY REGION AND CHANNEL
Eur m 2016 2015 Rep. ex FX 2016 2015 Rep. ex FX 2016 2015 Rep. ex FX
Italy 36.6 34.9 +5% +5% 17.5 16.6 +6% +6% 54.2 51.5 +5% +5%
EMEA (excl. Italy) 67.7 64.6 +5% +5% 38.2 34.3 +11% +13% 105.9 98.9 +7% +8%
Asia & RoW 99.5 75.3 +32% +30% 34.4 27.4 +26% +30% 133.9 102.7 +30% +30%
Americas 33.5 26.2 +28% +21% 19.0 16.5 +15% +17% 52.5 42.7 +23% +20%
Total Revenues 237.3 201.0 +18% +17% 109.1 94.8 +15% +17% 346.5 295.8 +17% +17%
Q1 YoY growth Q2 YoY growth H1 YoY growth
Eur m 2016 2015 Rep. ex FX 2016 2015 Rep. ex FX 2016 2015 Rep. ex FX
Retail 170.1 138.1 +23% +22% 75.8 63.2 +20% +21% 245.9 201.4 +22% +22%
Wholesale 67.2 62.9 +7% +5% 33.4 31.6 +6% +9% 100.6 94.4 +7% +6%
Total Revenues 237.3 201.0 +18% +17% 109.1 94.8 +15% +17% 346.5 295.8 +17% +17%
Q1 YoY growth Q2 YoY growth H1 YoY growth
34
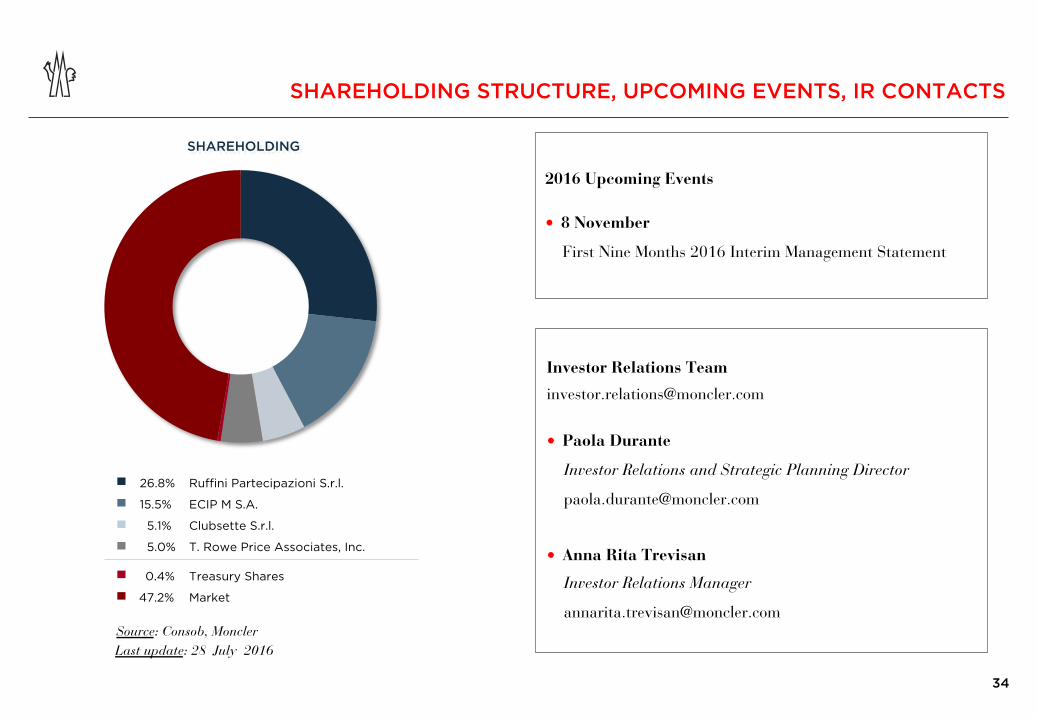
SHAREHOLDING STRUCTURE, UPCOMING EVENTS, IR CONTACTS
Investor Relations Team
• Paola Durante
Investor Relations and Strategic Planning Director
• Anna Rita Trevisan
Investor Relations Manager
2016 Upcoming Events
• 8 November
First Nine Months 2016 Interim Management Statement
SHAREHOLDING
Last update: 28 July 2016 Source: Consob, Moncler
26.8% Ruffini Partecipazioni S.r.l.
15.5% ECIP M S.A.
5.1% Clubsette S.r.l.
5.0% T. Rowe Price Associates, Inc.
0.4% Treasury Shares
47.2% Market

35
This presentation is being furnished to you solely for your information and may not be reproduced or redistributed to any other person.
This presentation might contain certain forward-looking statements that reflect the Company’s management’s current views with respect to future events and financial and operational performance of the Company and its subsidiaries. These forward-looking statements are based on Moncler S.p.A.’s current expectations and projections about future events. Because these forward-looking statements are subject to risks and uncertainties, actual future results or performance may differ materially from those expressed in or implied by these statements due to any number of different factors, many of which are beyond the ability of Moncler S.p.A. to control or estimate. You are cautioned not to place undue reliance on the forward-looking statements contained herein, which are made only as of the date of this presentation. Moncler S.p.A. does not undertake any obligation to publicly release any updates or revisions to any forward-looking statements to reflect events or circumstances after the date of this presentation.
Any reference to past performance or trends or activities of the Moncler Group shall not be taken as a representation or indication that such performance, trends or activities will continue in the future.
This presentation does not constitute an offer to sell or the solicitation of an offer to buy Moncler’s securities, nor shall the document form the basis of or be relied on in connection with any contract or investment decision relating thereto, or constitute a recommendation regarding the securities of Moncler.
Moncler’s securities referred to in this document have not been and will not be registered under the U.S. Securities Act of 1933 and may not be offered or sold in the United States absent registration or an applicable exemption from registration requirements.
Luciano Santel, the Manager in charge of preparing the corporate accounting documents, declares that, pursuant to art. 154-bis, paragraph 2, of the Legislative Decree no. 58 of February 24, 1998, the accounting information contained herein correspond to document results, books and accounting records.
DISCLAIMER