more than mining more than mining - … · reappointed pricewaterhousecoopers inc. and mr d shango,...
TRANSCRIPT

MORE THAN MINING
Annual Financial Statements 2017
RO
YAL BA
FOK
ENG
PLATIN
UM
AN
NU
AL FIN
AN
CIA
L STATEM
ENT
S 2017 M
ORE TH
AN
MIN
ING


Royal Bafokeng Platinum Annual Financial Statements 2017 1
GROUP AND COMPANY REPORTS
Statement of responsibility by the Board of Directors 2
Certificate of the Company Secretary 2
Audit and Risk Committee report 3 — 4
Directors’ report for the Group and Company 5 — 8
INDEPENDENT AUDITOR’S REPORT 9 — 13
CONSOLIDATED ANNUAL FINANCIAL STATEMENTS
14 — 66
Consolidated statement of financial position 14
Consolidated statement of comprehensive income 15
Consolidated statement of changes in equity 16
Consolidated statement of cash flows 17
Notes to the consolidated annual financial statements including accounting policies, critical accounting estimates and judgements
18 — 66
COMPANY ANNUAL FINANCIAL STATEMENTS, ACCOUNTING POLICIES AND NOTES
67 — 77
NON-IFRS MEASURES 78
ROYAL BAFOKENG PLATINUM GROUP STRUCTURE
79
ADMINISTRATION 80
FUNDING AND FACILITIES
Convertible bond 35
Cash on hand 31
Funding and facilities 32
RISK
Financial risk management 57
UNRECOGNISED ITEMS
Guarantees 38
Operating and capital commitments 39
Contingent liabilities 39
ENVIRONMENTAL REHABILITATION
Environmental trust deposits 26
Restoration and rehabilitation provision 37
Guarantees issued 38
HOW NUMBERS ARE CALCULATED
Segment information 62
OTHER INFORMATION
Related party transactions 49
Share-based payments 43
Impairment 48
Dividend per share 57
Earnings per share 66
Group structure 79
RBPLAT EMPLOYEE HOUSING
Employee housing loan receivable 28
Employee housing benefit 29
Housing insurance investment 29
Employee housing assets 29
PIC housing facility 36
Net finance income 42
CONTENTS

2 Royal Bafokeng Platinum Annual Financial Statements 2017
STATEMENT OF RESPONSIBILITY BY THE BOARD OF DIRECTORS
CERTIFICATE OF THE COMPANY SECRETARY
The board of directors are responsible for the preparation, integrity and fair presentation of the annual financial statements of the Royal Bafokeng Platinum Group. The financial statements presented on pages 14 to 77 have been prepared in accordance with International Financial Reporting Standards as issued by the International Accounting Standards Board (IASB) and IFRIC interpretations (collectively IFRS), the SAICA Financial Reporting Guidelines as issued by the Accounting Practices Committee, Financial Pronouncements as issued by the Financial Reporting Standards Council and the Companies Act 71 of 2008 of South Africa, and include amounts based on judgements and estimates made by management.
The board considered whether in preparing the financial statements they have used the most appropriate accounting policies, consistently applied and supported by reasonable and prudent judgements and estimates. The board is satisfied that the information contained in the financial statements fairly presents the results of operations for the year and the financial position of the Group at year-end.
The board has responsibility for ensuring that proper records are kept to enable the preparation of the financial statements in compliance with relevant legislation.
The going concern basis of accounting has been adopted in preparing the financial statements. The directors have no reason to believe that the Company and the Group will not be a going concern in the foreseeable future.
The annual financial statements were audited by PricewaterhouseCoopers Inc. who expressed an unqualified opinion thereon.
Board approval of annual financial statementsThe annual financial statements for the year ended 31 December 2017 are set out on pages 14 to 77. The preparation thereof was supervised by the Financial Director, Martin Prinsloo, who is a qualified chartered accountant CA(SA), and approved by the Board of Directors on 27 February 2018 and are signed on its behalf by:
KD Moroka SCChairman
SD PhiriChief Executive Officer
I, the undersigned, certify that to the best of my knowledge and in my capacity as the Company Secretary, the Company has lodged all such returns with the Companies Intellectual and Property Commission in compliance with the Companies Act 71 of 2008.
All the filed required returns and notices are true, correct and up to date.
LC JoosteCompany Secretary
27 February 2018

Royal Bafokeng Platinum Annual Financial Statements 2017 3
AUDIT AND RISK COMMITTEE REPORT
This report is provided by RBPlat’s independent Audit and Risk Committee for the financial year ended 31 December 2017.
The committee has discharged its responsibilities as mandated by the Board, its statutory duties in compliance with the Companies Act 71 of 2008 and the JSE Listings Requirements, and best practice in corporate governance, as set by King IV.
Composition, meetings and committee assessmentThe committee’s membership comprised four independent non-executive directors during the year under review, namely: > Linda de Beer (Chair) > Robin Mills > Mark Moffett > Louisa Stephens.
A brief profile of each of the members can be viewed on page 18 of the 2017 integrated report and the Company’s website. The committee met on six occasions during the year and all members were present at each of these scheduled meetings.
Key members of management attend meetings of the committee by invitation. During the year, closed sessions were also held for committee members only, as well as with internal audit, external audit, risk, finance and management.
The committee and its Chairman are assessed annually.
Execution of functionsThe committee has executed its role with specific reference to the following key areas of responsibility: > Performing its statutory duties as prescribed by the Companies Act, with specific reference to the audit quality, auditor independence and financial policies and reporting concerns
> Considering the financial performance, financial position, cash flow and treasury status of the Company on a quarterly basis, including solvency and liquidity of entities in the Group
> Overseeing, assessing and approving the internal and external audit functions with respect to appointment, work plans, quality of work executed, matters arising from the work performed and independence
> Considering the enterprise risk management framework and policy, including compliance matters, risk appetite and tolerances as well as the risk profile of the Group, for recommendation to the Board for consideration and approval, as applicable
> Overseeing the governance of information and technology within the Group > Overseeing the combined assurance framework and plan, including the quality of and reporting by assurance services within the Group and assurance providers in order to ensure the integrity of information for internal and stakeholder decision-making as well as the adequacy and effectiveness of internal controls. Considering the skills and capacity of the finance function in general and the Financial Director in particular
> Recommending to the Board for approval, the interim and annual financial statements as well as the integrated report.
In addition to the work of the committee, the full Board also holds an annual integrated reporting workshop in January every year, to satisfy itself of the integrity of the integrated report.
Areas of specific focus by the committee in 2017 included an enhanced emphasis on information and technology and how that can be harnessed to further support the strategy of the Company and address risks; financial oversight over and input into the Maseve transaction, through the Finance Sub-committee; a focus on enhancing processes relating to procurement as well as enhanced focus on ethics.
Annual confirmationsThe principal matters attended to by the committee during the year included: > Annual financial statements and integrated reportThe committee is satisfied that the Company’s financial reporting procedures are operating appropriately. The committee reviewed and considered the annual financial statements and the 2017 integrated report and has recommended it for approval by the Board.
> Solvency and liquidityThe committee reviewed quarterly assessments by management of the going concern premise of the Company before recommending to the Board that the Company and the Group will be a going concern in the foreseeable future.
> Independence and reappointment of suitable external auditorReappointed PricewaterhouseCoopers Inc. and Mr D Shango, who, in the opinion of the committee, is independent of the Company, as the external auditor for the financial year ended 31 December 2017. Determined the fees to be paid to the external auditor and the terms of engagement as well as the nature and extent of any non-audit fees that the external auditor provided to the Company.
The committee’s terms of reference, which can be found on the Company’s website, www.bafokengplatinum.co.za, are aligned with the above legislation, regulations and practices.

4 Royal Bafokeng Platinum Annual Financial Statements 2017
AUDIT AND RISK COMMITTEE REPORT CONTINUED
> Evaluation of the expertise and adequacy of the Financial Director and the finance functionConsidered and satisfied itself of the appropriateness of the expertise and adequacy of resources within the Company’s finance function and of the Financial Director.
> Effectiveness of internal controlsUsing the Company’s combined assurance model and the related assurance obtained from the various assurance providers in the three lines of defence as a basis, the committee recommended to the Board that it issues a statement as to the adequacy of the Company’s internal control environment. The committee assessed our financial controls and risk management and recommended RBPlat’s risk appetite and risk tolerance to the Board.
> Retaining KPMG as Internal AuditorThe committee considered the Group’s ongoing relationship with KPMG as internal audit service provider. In 2016 we reported that EY was appointed as the new service provider for a three-year period. Unfortunately the committee was not satisfied with the services EY provided and agreed to part ways with EY on amicable terms and to reinstate KPMG. KPMG has made an extraordinary effort to catch up on reviews and address the Company’s original concern regarding transformation of the internal audit team. The committee considered the negative perceptions and reputational concerns regarding KPMG and their impact on our reputation. However, for the time being, and in the interests of ensuring the adequacy and effectiveness of the internal control environment of the Group, the committee decided it would not be responsible to have another change of internal audit service provider in such a short space of time. The committee continues to engage with KPMG and will monitor the situation closely.
Comments on key audit mattersWith respect to key audit matters, addressed by PwC in their external audit report, the committee provides some insight at a high level as to the oversight function of the committee:
Impairment of goodwillGoodwill is tested annually for impairment and this area was a key focus area for the committee in 2017 specifically due to the recent strengthening in the ZAR:USD exchange rate. The committee assessed the methodology, assumptions and judgements applied by management as set out in Note 5 of the annual financial statements. Furthermore, the committee had robust discussions with the external auditors regarding their audit processes and views.
We recognise that there were no structural changes either to the business, which performed better than in 2016, the industry, or the long-term view on the Rand basket price. However, the recent ZAR:USD exchange rate volatility and the apparent structural strengthening in the ZAR:USD exchange rate, led to a reduction in our short and medium-term Rand basket price assumptions. This resulted in an impairment of our goodwill of R863.3 million in 2017. Refer to Notes 5 and 29 of our annual financial statements for details.
Convertible bond accountingOn 15 March 2017 the Company issued R1.2 billion 7% senior unsecured convertible bonds. The committee is satisfied with the accounting treatment of the convertible bonds as detailed in Note 19 to the annual financial statements.
L de BeerChairman of the Audit and Risk Committee
27 February 2018

Royal Bafokeng Platinum Annual Financial Statements 2017 5
DIRECTORS’ REPORT FOR THE GROUP AND COMPANY
Principal activities and profileRBPlat was incorporated in July 2008 by Royal Bafokeng Holdings (RBH), the investment arm of the Royal Bafokeng Nation (RBN). When the Bafokeng Rasimone Platinum Mine Joint Venture (BRPM JV) between RBH and Anglo American Platinum Limited was restructured in 2009, operational control of the Joint Venture vested in RBPlat. RBPlat, through the BRPM JV, operates BRPM and is developing the Styldrift I project. RBPlat’s significant reserves and resources can sustain operations for at least the next 60 years.
Results and dividendThe Group’s and Company’s financial results are set out on pages 14 to 77. These annual financial statements have been prepared using appropriate accounting policies, in accordance with International Financial Reporting Standards as issued by the International Accounting Standards Board (IASB) and IFRIC interpretations (collectively IFRS), the SAICA Financial Reporting Guidelines as issued by the Accounting Practices Committee, financial pronouncements as issued by the Financial Reporting Standards Council (FRSC) and the Companies Act 71 of 2008, the JSE Listings Requirements and include amounts based on judgements and estimates made by management.
We do not intend declaring a dividend until Styldrift I is operating at a steady state. Thereafter, a market-related dividend cover ratio is anticipated.
Review of the business, future developments and post-statement of financial position eventsThe operating context on page 26 of our 2017 integrated report provides details of the Group’s operating environment. The Group’s operational performance for 2017 is discussed on pages 42 to 130 and information on our future outlook can be found throughout the 2017 integrated report. The Financial capital section on pages 42 to 51 of the 2017 integrated report, together with these annual financial statements, provide a full description of our financial performance for the year.
ImpairmentGoodwill of R863.3 million was impaired during 2017. Refer to Notes 5 and 29 of the annual financial statements for details.
Going concernThe directors believe that the Group and the Company will continue as a going concern in the foreseeable future.
Corporate governanceA report on our corporate governance and our application of the principles of King IV is included in our 2017 integrated reporting.
Health, safety, environment and communityInformation on our health, safety and environmental performance and community participation is provided under the Natural, Human and Social capitals in our 2017 integrated report.
Employee policies and involvementThe Group’s policies and performance regarding employee involvement, disabled employees, labour relations and employee share schemes are provided under Remuneration on pages 132 to 137 of our 2017 integrated report.
Material borrowingsThe Group concluded R2 billion debt facilities in March 2017 which will be utilised to fund RBR’s 67% share of the BRPM JV funding requirements for the Styldrift I project. These facilities consist of a seven-year term debt facility of R750 million, a five-year revolving credit facility of R750 million and one-year general banking facilities of R508 million.
For material borrowings and facilities please refer to Note 14 of the annual financial statements on pages 31 and 32.
Convertible bondThe Company issued 120 000 7% senior unsecured convertible bonds for R1.2 billion on 15 March 2017. Details of the convertible bonds are disclosed in Note 19 of the annual financial statements on page 35.
Maseve mine acquisitionOn 6 September 2017, the Company announced terms for the acquisition of Maseve Investments II Proprietary Limited (Maseve) in a two-phased approach:1. Phase 1 — Acquisition of the concentrator plant, related water and power allocations and surface rights required by RBPlat to
access and operate the plant for the ZAR equivalent of US$58 million. A deposit of US$3 million (ZAR41.4 million) was paid in October 2017.
2. Phase 2 — Acquisition of all the shares and loan claims of Maseve for the ZAR equivalent of US$12 million to be settled with the issue of RBPlat shares.
South African Competition Tribunal approval for the Maseve acquisition was obtained on 16 January 2018.
Phase 1 of the Maseve acquisition closed on 14 February 2018. Phase 2 is subject to the approval of the Department: Mineral Resources.
On 30 November 2017, shareholders of RBPlat approved the issue of up to 37 million shares for cash, for the purpose of raising proceeds of up to R1 billion, to fund Phase 1 (plant transaction) and upgrades to the plant and related infrastructure.

6 Royal Bafokeng Platinum Annual Financial Statements 2017
DIRECTORS’ REPORT FOR THE GROUP AND COMPANY CONTINUED
DirectorateThe directors for the year under review were:
Director Position First appointed
Standing for re-election and election
Elected or re-elected at the last AGM
Kgomotso Moroka Chairman and independent non-executive director
1 June 2010
Linda de Beer Independent non-executive director 1 June 2010
Robin Mills Independent non-executive director 20 September 2010
Mark Moffett Independent non-executive director 22 September 2014 Yes
Thoko Mokgosi-Mwantembe Independent non-executive director 5 November 2014 Yes
Velile Nhlapo* Non-executive director 24 November 2015
Steve Phiri Executive director 1 April 2010 Yes
Martin Prinsloo Executive director 1 March 2009 Yes
Mike Rogers Independent non-executive director 7 December 2009 Yes
Louisa Stephens Independent non-executive director 22 September 2014 Yes
David Wilson Non-executive director 29 May 2014 Yes
* Resigned on 9 November 2017
Directors’ and officers’ disclosure of interests in contractsDuring the period under review and at the time of signing off the 2017 integrated report, no contracts were entered into in which directors and officers of the Company had an interest and which would affect the business of the Group.
Service contracts of directors and prescribed officersThe Company has not entered into any contracts other than the normal employment service contracts with executive directors and other prescribed officers.
Special resolutions
A special resolution to convert the ordinary shares of the Company from shares having a par value to no par value will be tabled at the next AGM. In addition, approval will be requested to increase the authorised share capital from 250 000 000 to 1 000 000 000 together with the relevant amendments to be made to the Company’s Memorandum of Incorporation (MOI).
Shareholders’ approval is requested for a new two-year special resolution governing financial assistance to companies within the RBPlat Group effective from that date of the next AGM.
The Company has not exercised the general authority granted to it by shareholders to buy back issued ordinary shares. Shareholders will be requested to renew this authority at the next AGM.
Power of the BoardSubject to RBPlat’s MOI, South African legislation and to any directions given by special resolution, the business of the Group is managed by the Board which may exercise all the powers of the Group. The MOI contains specific provisions concerning the power of RBPlat to borrow money and also the power to purchase its own shares. The Board has been authorised to allot and issue ordinary shares up to a maximum of 5% of the issued share capital of the Company and a further 10% of the issued share capital in return for cash.
These powers are exercised in terms of its MOI and resolutions passed at the AGM held on 12 April 2017. No shares have been issued under this authority in 2017. The Board has decided to seek renewal of this authority in accordance with best practice.
RBPlat subsidiary companiesThe following companies are wholly owned subsidiaries of Royal Bafokeng Platinum Limited: > Royal Bafokeng Resources Proprietary Limited (RBR) > Royal Bafokeng Platinum Management Services Proprietary Limited (RBP MS) > Bafokeng Rasimone Management Services Proprietary Limited (BRMS) (100% held indirectly via RBR) > Royal Bafokeng Resources Properties (RF) Proprietary Limited (RBRP) (100% held indirectly via RBR).
Details of the ordinary and special resolutions to be approved by shareholders at the next Annual General Meeting (AGM) are outlined in the Notice of Annual General Meeting (pages 150 to 166 of the 2017 integrated annual report) and are available online.
Royal Bafokeng Platinum Annual Financial Statements 2017 7
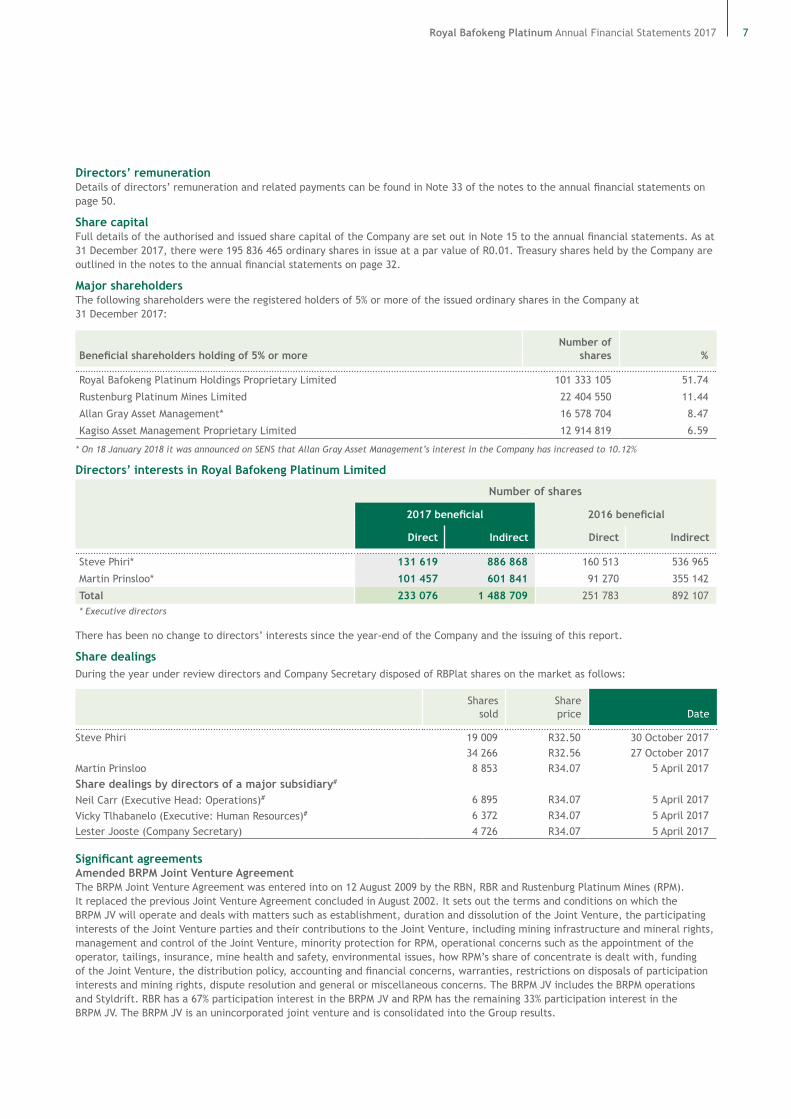
Directors’ remunerationDetails of directors’ remuneration and related payments can be found in Note 33 of the notes to the annual financial statements on page 50.
Share capitalFull details of the authorised and issued share capital of the Company are set out in Note 15 to the annual financial statements. As at 31 December 2017, there were 195 836 465 ordinary shares in issue at a par value of R0.01. Treasury shares held by the Company are outlined in the notes to the annual financial statements on page 32.
Major shareholdersThe following shareholders were the registered holders of 5% or more of the issued ordinary shares in the Company at 31 December 2017:
Beneficial shareholders holding of 5% or moreNumber of
shares %
Royal Bafokeng Platinum Holdings Proprietary Limited 101 333 105 51.74
Rustenburg Platinum Mines Limited 22 404 550 11.44
Allan Gray Asset Management* 16 578 704 8.47
Kagiso Asset Management Proprietary Limited 12 914 819 6.59
* On 18 January 2018 it was announced on SENS that Allan Gray Asset Management’s interest in the Company has increased to 10.12%
Directors’ interests in Royal Bafokeng Platinum Limited
Number of shares
2017 beneficial 2016 beneficial
Direct Indirect Direct Indirect
Steve Phiri* 131 619 886 868 160 513 536 965
Martin Prinsloo* 101 457 601 841 91 270 355 142
Total 233 076 1 488 709 251 783 892 107* Executive directors
There has been no change to directors’ interests since the year-end of the Company and the issuing of this report.
Share dealingsDuring the year under review directors and Company Secretary disposed of RBPlat shares on the market as follows:
Sharessold
Share price Date
Steve Phiri 19 009 R32.50 30 October 201734 266 R32.56 27 October 2017
Martin Prinsloo 8 853 R34.07 5 April 2017Share dealings by directors of a major subsidiary#
Neil Carr (Executive Head: Operations)# 6 895 R34.07 5 April 2017
Vicky Tlhabanelo (Executive: Human Resources)# 6 372 R34.07 5 April 2017Lester Jooste (Company Secretary) 4 726 R34.07 5 April 2017
Significant agreementsAmended BRPM Joint Venture AgreementThe BRPM Joint Venture Agreement was entered into on 12 August 2009 by the RBN, RBR and Rustenburg Platinum Mines (RPM). It replaced the previous Joint Venture Agreement concluded in August 2002. It sets out the terms and conditions on which the BRPM JV will operate and deals with matters such as establishment, duration and dissolution of the Joint Venture, the participating interests of the Joint Venture parties and their contributions to the Joint Venture, including mining infrastructure and mineral rights, management and control of the Joint Venture, minority protection for RPM, operational concerns such as the appointment of the operator, tailings, insurance, mine health and safety, environmental issues, how RPM’s share of concentrate is dealt with, funding of the Joint Venture, the distribution policy, accounting and financial concerns, warranties, restrictions on disposals of participation interests and mining rights, dispute resolution and general or miscellaneous concerns. The BRPM JV includes the BRPM operations and Styldrift. RBR has a 67% participation interest in the BRPM JV and RPM has the remaining 33% participation interest in the BRPM JV. The BRPM JV is an unincorporated joint venture and is consolidated into the Group results.

8 Royal Bafokeng Platinum Annual Financial Statements 2017
DIRECTORS’ REPORT FOR THE GROUP AND COMPANY CONTINUED
Services agreementAs part of the BRPM JV restructuring a services agreement was entered into between RBP MS, RBR and RPM on 9 September 2009 in terms of which RBP MS was appointed as operator of BRPM JV in place of Anglo Platinum Management Services Proprietary Limited (AMS) with effect from 4 January 2010. In terms of this agreement RBP MS was appointed to provide mining services as an independent contractor and as an agent of the Joint Venture parties.
Disposal of concentrate agreementThe Disposal of Concentrate Agreement regulates the terms on which RBR disposes of its share of the concentrate produced by the BRPM JV to RPM. The agreement provides for RBR’s share of the concentrate produced by the BRPM JV to be sold to, and processed by RPM. RBR is responsible for delivery of the concentrate to RPM’s smelting and refining facility situated at Rustenburg, the costs of which are borne by the BRPM JV. Risk and ownership passes to RPM once the concentrate leaves the gates of the concentrator plant.
RBR is obliged to sell and RPM is obliged to purchase 50% of the concentrate of the BRPM JV up until 11 August 2022, the optional termination date in terms of the disposal of concentrate agreement. Thereafter, while RBR retains the right to sell 50% of the BRPM JV concentrate to RPM for the life of BRPM JV, it is also entitled to terminate the relationship on 11 August 2022 by giving written notice by no later than 11 August 2020. Subsequent to this date it is also entitled to terminate the relationship by providing written notice two years prior to each fifth anniversary of 11 August 2022. RPM may terminate its obligation to purchase and refine the additional 17% of the concentrate with effect from the relevant date on two years written notice to RBR, in which case the concentrate will need to be sent to a third-party refiner. RPM is also entitled to terminate its entitlement to receive and process its proportionate share (33%) of the BRPM concentrate on the same basis. For so long as RPM receives its proportionate share of the BRPM concentrate, however, it is required to make a proportionate matching payment for the proceeds from such concentrate into the BRPM JV bank account.
Impala Platinum royalty agreementsThese agreements regulate the terms on which RBR and RPM dispose of their respective shares of the UG2 ore mined by Impala Platinum from its 6 and 8 shafts and the UG2 and Merensky ore mined from its 20 shaft. A royalty equivalent to 17.5% of gross PGM, gold, nickel and copper revenue will be paid for the UG2 and Merensky ore mined from the 20 shaft area. The 6 and 8 shaft royalty agreement was renegotiated in 2013 and is linked to market conditions and therefore the profitability of the Impala Rustenburg operations. In terms of the amended royalty agreement for 6 and 8 shafts, Impala will pay the BRPM JV a royalty that is based upon a factor that is linked to the Impala Rustenburg operations’ gross margin with a minimum of 5% and a maximum of 25% of gross PGM, gold, nickel and copper revenue.
We anticipate earning royalties from the 6 shaft agreement up to 2024 and from the 20 shaft agreement for approximately 30 years.

Royal Bafokeng Platinum Annual Financial Statements 2017 9
INDEPENDENT AUDITOR’S REPORT TO THE SHAREHOLDERS OF ROYAL BAFOKENG PLATINUM LIMITEDFOR THE YEAR ENDED 31 DECEMBER 2017
Report on the audit of the consolidated and separate financial statements Our opinion In our opinion, the consolidated and separate financial statements present fairly, in all material respects, the consolidated and separate financial position of Royal Bafokeng Platinum Limited (the Company) and its subsidiaries (together the Group) as at 31 December 2017, and its consolidated and separate financial performance and its consolidated and separate cash flows for the year then ended in accordance with International Financial Reporting Standards (IFRS) and the requirements of the Companies Act of South Africa.
What we have auditedRoyal Bafokeng Platinum Limited’s consolidated and separate financial statements, set out on pages 14 to 77, comprise: > the consolidated and Company statements of financial position as at 31 December 2017; > the consolidated and Company statements of comprehensive income for the year then ended; > the consolidated and Company statements of changes in equity for the year then ended; > the consolidated and Company statements of cash flows for the year then ended; and > the notes to the financial statements, which include a summary of significant accounting policies.
Basis for opinion We conducted our audit in accordance with International Standards on Auditing (ISA). Our responsibilities under those standards are further described in the Auditor’s responsibilities for the audit of the consolidated and separate financial statements section of our report.
We believe that the audit evidence we have obtained is sufficient and appropriate to provide a basis for our opinion.
IndependenceWe are independent of the Group in accordance with the Independent Regulatory Board for Auditors Code of Professional Conduct for Registered Auditors (IRBA Code) and other independence requirements applicable to performing audits of financial statements in South Africa. We have fulfilled our other ethical responsibilities in accordance with the IRBA Code and in accordance with other ethical requirements applicable to performing audits in South Africa. The IRBA Code is consistent with the International Ethics Standards Board for Accountants Code of Ethics for Professional Accountants (Parts A and B).
Our audit approachOverview
Overall Group materiality > R18 700 000, which represents 5% of a four-year adjusted average consolidated profit or loss before tax.
Group audit scope > The Group comprises six components, all of which were required to report on full scope audit procedures.
Key audit matters > Impairment assessment of long-lived assets; and > Valuation relating to convertible bonds.
As part of designing our audit, we determined materiality and assessed the risks of material misstatement in the consolidated and separate financial statements. In particular, we considered where the directors made subjective judgements; for example, in respect of significant accounting estimates that involved making assumptions and considering future events that are inherently uncertain. As in all of our audits, we also addressed the risk of management override of internal controls, including among other matters, consideration of whether there was evidence of bias that represented a risk of material misstatement due to fraud.
MaterialityThe scope of our audit was influenced by our application of materiality. An audit is designed to obtain reasonable assurance whether the financial statements are free from material misstatement. Misstatements may arise due to fraud or error. They are considered material if individually or in aggregate, they could reasonably be expected to influence the economic decisions of users taken on the basis of the consolidated financial statements.
Based on our professional judgement, we determined certain quantitative thresholds for materiality, including the overall Group materiality for the consolidated financial statements as a whole as set out in the table below. These, together with qualitative considerations, helped us to determine the scope of our audit and the nature, timing and extent of our audit procedures and to evaluate the effect of misstatements, both individually and in aggregate on the financial statements as a whole.
Overall Group materiality R18 700 000How we determined it 5% of a four-year average consolidated profit or loss before tax adjusted for
impairment provisions and restructuring costs.Rationale for the materiality benchmark applied We chose consolidated profit before tax as the benchmark because, in our view, it
is the benchmark against which the performance of the Group is most commonly measured by users, and is a generally accepted benchmark.
In 2017, 2016 and 2014, the Group generated profits. Conversely, in 2015, the Group incurred a loss. Due to the fluctuation caused by the loss, a four-year average consolidated profit or loss before tax was used as the appropriate benchmark.
The consolidated profit or loss before tax was adjusted for the impairment provision in 2015 which was the result of a decrease in platinum group metal prices and the reduction in the market value of the Company. The 2017 consolidated profit or loss before tax was adjusted for the restructuring costs which were the result of the closure of UG2 South shaft.
We chose 5% which is consistent with quantitative materiality thresholds used for profit-oriented companies in this sector.
Materiality
Audit scope
Key auditmatters

10 Royal Bafokeng Platinum Annual Financial Statements 2017
INDEPENDENT AUDITOR’S REPORT TO THE SHAREHOLDERS OF ROYAL BAFOKENG PLATINUM LIMITED CONTINUED
FOR THE YEAR ENDED 31 DECEMBER 2017
How we tailored our Group audit scope We tailored the scope of our audit in order to perform sufficient work to enable us to provide an opinion on the consolidated financial statements as a whole, taking into account the structure of the Group, the accounting processes and controls, and the industry in which the Group operates.
The Group consists of six components (Royal Bafokeng Platinum Limited, Royal Bafokeng Platinum Management Services Proprietary Limited, Royal Bafokeng Resources Properties Proprietary Limited, Royal Bafokeng Resources Proprietary Limited, Bafokeng Rasimone Platinum Mine Unincorporated Joint Venture and Bafokeng Rasimone Management Services Proprietary Limited), which are considered to be within the full scope audit requirements.
Key audit matters Key audit matters are those matters that, in our professional judgement, were of most significance in our audit of the consolidated and separate financial statements of the current period. These matters were addressed in the context of our audit of the consolidated and separate financial statements as a whole, and in forming our opinion thereon, and we do not provide a separate opinion on these matters.
Key audit matters How our audit addressed the key audit matter
Impairment of assessment of long-lived assetsKey audit matter relates to the consolidated financial statements
We gained an understanding as to how impairments were considered by management across the long-lived assets as well as the methodologies and models used. For purposes of the impairment assessment management has valued the CGUs using discounted cash flow models and valuation of mineral resources beyond approved mine plans.
In assessing the future cash flows, our audit procedures included:
1. We utilised our valuation expertise to test the accuracy of the model used by management by performing an independent recalculation and comparing the results of our calculation with management’s calculations.
2. The significant assumptions used by management in their impairment assessment were subjected to the following audit procedures: Long-term real platinum price of US$1 305/ounce, palladium price of US$1 240/ounce, rhodium price of US$1 406/ounce and gold price US$1 280/ounce at an exchange rate of R14.46/US$1 were tested with the assistance of our valuation expertise by benchmarking the price and exchange rate against analysts’ forecasts. Based on the work performed, we found management’s assumption to be within reasonable ranges of possible prices. Our testing of the assumptions included: > Long-term US inflation rate assumption was compared to externally obtained sources and we found management’s assumption to be acceptable.
> Long-term real discount rates were tested for reasonability with the assistance of our valuation expertise by independently calculating the discount rates, taking into account independently obtained data. While our discount rate is, itself, subjective, the discount rate adopted by management fell within an acceptable range from our independent calculation.
> Production volumes as per the life-of-mine plan assumption were compared to reserves signed off by the Group’s competent person and to existing production volumes and approved business plans.
> Life-of-mine plan operating and capital costs were compared to budgeted and actual costs for reasonableness. In considering the accuracy of the value of in situ (outside life of mine) resources we used our valuations expertise to independently calculate the resource multiple by benchmarking the valuation against comparable transactions. Based on our independent calculation, management’s resource multiple was found to be within an acceptable range.
3. In order to assess the reasonability of the management’s recognised impairment charge, we compared the amount to our independently calculated impairment charge, which was based on the assumptions described above.
Goodwill is tested annually for impairment or whenever there is an impairment indicator. Goodwill arose when the Group assumed control over Bafokeng Rasimone Platinum Mine (BRPM) upon listing in 2010. Royal Bafokeng Resources Proprietary Limited (RBR), a wholly owned subsidiary of the Company, has an undivided 67% participation interest in the BRPM Joint Venture (BRPM JV). The BRPM JV is made up of BRPM and Styldrift.
Goodwill was calculated as the difference between the purchase consideration for the 67% interest in the BRPM JV and the Group’s share of net assets acquired. The carrying value of the remaining goodwill at the beginning of the financial year was R863.3 million (refer to Note 5) and was allocated to the Styldrift cash-generating unit (CGU). Management identified each of its operations as the lowest level for which there are separately identifiable cash flows i.e. a cash-generating unit (CGU).
The Company determines the recoverable amount of CGUs at the higher of fair value less costs of disposal and value in use. The recoverable amount is determined using the discounted cash flow model and the in situ value for 4E (four platinum group elements, namely platinum, palladium, rhodium and gold) resource ounces outside the life of mine plan. Refer to Note 5 (goodwill) to the consolidated financial statements where the impairment of goodwill is discussed.
We focused on this area due to the materiality of the carrying amount of the CGU to which goodwill has been allocated, as well as the significant judgement involved in performing the impairment test.
In the current year, a gross impairment loss of R863.3 million was recognised against the remaining goodwill allocated to Styldrift. Refer to Note 5 (goodwill) and Note 29 (impairment of non-financial assets) where the impairment loss has been discussed.

Royal Bafokeng Platinum Annual Financial Statements 2017 11
Key audit matters How our audit addressed the key audit matter
Valuation relating to convertible bondsKey audit matter relates to both the consolidated and separate financial statements
On 15 March 2017 the Company issued R1.2 billion 7% senior unsecured convertible bonds. The term of the bond issue is five years with a final redemption date of 16 September 2022 and a coupon payable semi-annually. As at the date of issue of the convertible bonds, the shareholder approval for the settlement of bonds in shares had not yet been obtained. The convertible bonds were consequently recognised as a liability with an embedded derivative.
After the shareholders approve, the holder’s option to convert the instrument into a fixed number of shares meets the definition of an equity instrument in accordance with IAS 32: Financial Instruments: Presentation. The embedded derivative was reclassified to equity. The fair value gain in the derivative liability from the date of issue of the convertible bonds (15 March 2017) to the date that the shareholders’ approval was obtained (8 May 2017) was recognised as a gain in profit and loss and the fair value of the derivative liability at 8 May 2017 was derecognised and a corresponding increase in equity was recognised.
The valuation of the embedded derivative, settlement amount taken to equity and initial liability was a matter of most significance to our current year audit due to the significance of the amount to the consolidated and separate financial statements and the high level of estimation in arriving at the embedded derivatives value.
Refer to Note 19 (convertible bond liability) of the consolidated financial statements.
Utilising our valuation expertise, we independently calculated the fair values of the embedded derivative as at the following dates: > issue date for the embedded derivative with the residual being accounted for as the bond liability; and
> date of receipt of shareholders’ approval for the embedded derivative with the fair value gain taken to profit and loss.
We independently calculated the amortised cost of the loan (as at 31 December 2017) to be settled, by discounting the coupon payments from 17 March 2017 to 17 March 2022 and subsequent settlement of the face value of the bond on 17 March 2022.
We traced the amount paid net of transaction costs to the bank statements. In addition we compared management’s interest rate and forward looking volatility inputs in the model to our own independent determined inputs, and found them to be reasonable.

12 Royal Bafokeng Platinum Annual Financial Statements 2017
INDEPENDENT AUDITOR’S REPORT TO THE SHAREHOLDERS OF ROYAL BAFOKENG PLATINUM LIMITED CONTINUED
FOR THE YEAR ENDED 31 DECEMBER 2017
Other information The directors are responsible for the other information. The other information comprises the annual financial statements for the year ended 31 December 2017, which includes the directors’ report for Group and Company, the Audit and Risk Committee’s report and the certificate of the Company Secretary as required by the Companies Act of South Africa, and the Integrated Report 2017. Other information does not include the consolidated and separate financial statements and our auditor’s report thereon.
Our opinion on the consolidated and separate financial statements does not cover the other information and we do not express an audit opinion or any form of assurance conclusion thereon.
In connection with our audit of the consolidated and separate financial statements, our responsibility is to read the other information identified above and, in doing so, consider whether the other information is materially inconsistent with the consolidated and separate financial statements or our knowledge obtained in the audit, or otherwise appears to be materially misstated.
If, based on the work we have performed, we conclude that there is a material misstatement of this other information, we are required to report that fact. We have nothing to report in this regard.
Responsibilities of the directors for the consolidated and separate financial statementsThe directors are responsible for the preparation and fair presentation of the consolidated and separate financial statements in accordance with International Financial Reporting Standards and the requirements of the Companies Act of South Africa, and for such internal control as the directors determine is necessary to enable the preparation of consolidated and separate financial statements that are free from material misstatement, whether due to fraud or error.
In preparing the consolidated and separate financial statements, the directors are responsible for assessing the Group and the Company’s ability to continue as a going concern, disclosing, as applicable, matters related to going concern and using the going concern basis of accounting unless the directors either intend to liquidate the Group and/or the Company or to cease operations, or have no realistic alternative but to do so.
Auditor’s responsibilities for the audit of the consolidated and separate financial statementsOur objectives are to obtain reasonable assurance about whether the consolidated and separate financial statements as a whole are free from material misstatement, whether due to fraud or error, and to issue an auditor’s report that includes our opinion. Reasonable assurance is a high level of assurance, but is not a guarantee that an audit conducted in accordance with ISA will always detect a material misstatement when it exists. Misstatements can arise from fraud or error and are considered material if, individually or in the aggregate, they could reasonably be expected to influence the economic decisions of users taken on the basis of these consolidated and separate financial statements.
As part of an audit in accordance with ISA, we exercise professional judgement and maintain professional scepticism throughout the audit. We also: > Identify and assess the risks of material misstatement of the consolidated and separate financial statements, whether due to fraud or error, design and perform audit procedures responsive to those risks, and obtain audit evidence that is sufficient and appropriate to provide a basis for our opinion. The risk of not detecting a material misstatement resulting from fraud is higher than for one resulting from error, as fraud may involve collusion, forgery, intentional omissions, misrepresentations, or the override of internal control.
> Obtain an understanding of internal control relevant to the audit in order to design audit procedures that are appropriate in the circumstances, but not for the purpose of expressing an opinion on the effectiveness of the Group’s and the Company’s internal control.
> Evaluate the appropriateness of accounting policies used and the reasonableness of accounting estimates and related disclosures made by the directors.
> Conclude on the appropriateness of the directors’ use of the going concern basis of accounting and, based on the audit evidence obtained, whether a material uncertainty exists related to events or conditions that may cast significant doubt on the Group’s and the Company’s ability to continue as a going concern. If we conclude that a material uncertainty exists, we are required to draw attention in our auditor’s report to the related disclosures in the consolidated and separate financial statements or, if such disclosures are inadequate, to modify our opinion. Our conclusions are based on the audit evidence obtained up to the date of our auditor’s report. However, future events or conditions may cause the Group and/or Company to cease to continue as a going concern.
> Evaluate the overall presentation, structure and content of the consolidated and separate financial statements, including the disclosures, and whether the consolidated and separate financial statements represent the underlying transactions and events in a manner that achieves fair presentation.
> Obtain sufficient appropriate audit evidence regarding the financial information of the entities or business activities within the group to express an opinion on the consolidated financial statements. We are responsible for the direction, supervision and performance of the group audit. We remain solely responsible for our audit opinion.

Royal Bafokeng Platinum Annual Financial Statements 2017 13
We communicate with the directors regarding, among other matters, the planned scope and timing of the audit and significant audit findings, including any significant deficiencies in internal control that we identify during our audit.
We also provide the directors with a statement that we have complied with relevant ethical requirements regarding independence, and to communicate with them all relationships and other matters that may reasonably be thought to bear on our independence, and where applicable, related safeguards.
From the matters communicated with the directors, we determine those matters that were of most significance in the audit of the consolidated and separate financial statements of the current period and are therefore the key audit matters. We describe these matters in our auditor’s report unless law or regulation precludes public disclosure about the matter or when, in extremely rare circumstances, we determine that a matter should not be communicated in our report because the adverse consequences of doing so would reasonably be expected to outweigh the public interest benefits of such communication.
Report on other legal and regulatory requirementsIn terms of the IRBA Rule published in Government Gazette Number 39475 dated 4 December 2015, we report that PricewaterhouseCoopers Inc. has been the auditor of Royal Bafokeng Platinum Limited for nine years.
PricewaterhouseCoopers Inc.Director: TD ShangoRegistered Auditor
4 Lisbon LaneWaterfall CityJukskei View 2090
1 March 2018

14 Royal Bafokeng Platinum Annual Financial Statements 2017
CONSOLIDATED STATEMENT OF FINANCIAL POSITIONAS AT 31 DECEMBER 2017
Group
Notes2017
R (million)2016
R (million)
AssetsNon-current assets 18 448.3 17 614.3
Property, plant and equipment 3 11 912.2 10 587.2
Mineral rights 4 5 686.5 5 729.3
Goodwill 5 — 863.3
Environmental trust deposits and guarantee investments 6 164.7 147.0
Employee housing loan receivable 7 439.5 167.2
Employee housing benefit 8 163.2 46.5
Housing insurance investment 9 35.7 35.0
Deferred tax asset 18 46.5 38.8
Current assets 3 697.1 2 703.6
Employee housing benefit 8 11.8 4.2
Employee housing assets 10 579.3 377.3
Inventories 11 105.6 79.4
Trade and other receivables 12 1 667.1 1 405.6
Current tax receivable 13 0.2 1.6
Cash and cash equivalents 14 1 333.1 835.5
Total assets 22 145.4 20 317.9
Equity and liabilitiesTotal equity 14 423.9 14 813.9
Share capital 15 1.9 1.9
Share premium 15 9 643.2 9 400.8
Retained earnings 701.5 1 454.2
Share-based payment reserve 16 240.8 216.2
Non-distributable reserve 17 82.5 82.5
Non-controlling interest 3 754.0 3 658.3
Non-current liabilities 5 837.7 4 165.0
Deferred tax liability 18 3 774.3 3 635.3
Convertible bond liability 19 932.4 —
PIC housing facility 20 975.0 434.0
Restoration, rehabilitation and other provisions 21 156.0 95.7
Current liabilities 1 883.8 1 339.0
Trade and other payables 23 544.9 449.3
Current tax payable 13 5.0 —
RPM payable 24 1 333.9 889.7
Total equity and liabilities 22 145.4 20 317.9
The notes on pages 18 to 66 form an integral part of these consolidated annual financial statements.

Royal Bafokeng Platinum Annual Financial Statements 2017 15
CONSOLIDATED STATEMENT OF COMPREHENSIVE INCOMEFOR THE YEAR ENDED 31 DECEMBER 2017
Group
Notes2017
R (million)2016
R (million)
Revenue 25 3 498.5 3 342.2
Cost of sales 28 (3 186.5) (3 101.5)
Gross profit 312.0 240.7
Other income 26 150.5 88.1
Administration expenses (256.2) (155.6)
Corporate office 28 (189.4) (138.4)
Housing project 28 (17.8) (17.2)
Restructuring costs 28 (49.0) —
Impairment of non-financial assets 29 (864.3) (2.6)
Finance income 27.1 137.4 91.8
Finance cost 27.2 (52.3) (7.4)
(Loss)/profit before tax (572.9) 255.0
Income tax (expense)/credit 30 (84.1) 7.7
Income tax expense 30 (31.5) (24.7)
Deferred tax (expense)/credit 30 (52.6) 32.4
Net (loss)/profit for the year (657.0) 262.7
Other comprehensive income — —
Total comprehensive (loss)/income (657.0) 262.7
Total comprehensive (loss)/income attributable to:
Owners of the Company (752.7) 168.3
Non-controlling interest 95.7 94.4
Basic (loss)/earnings per share (cents/share) 37 (390.6) 87.6
Diluted (loss)/earnings per share (cents/share) 37 (390.6) 87.5
The notes on pages 18 to 66 form an integral part of these consolidated annual financial statements.

16 Royal Bafokeng Platinum Annual Financial Statements 2017
CONSOLIDATED STATEMENT OF CHANGES IN EQUITYFOR THE YEAR ENDED 31 DECEMBER 2017
Number of shares
issued*
Ordinary shares
R(million)
Share premium
R(million)
Share-based
payment reserve
R(million)
Non-distri-
butable reserves
R(million)
Retained earnings
R(million)
Attribu-table to owners of the
CompanyR
(million)
Non-con-
trolling interest
R(million)
TotalR
(million)
2017
Balance at 31 December 2016 192 277 990 1.9 9 400.8 216.2 82.5 1 454.2 11 155.6 3 658.3 14 813.9
Share-based payment charge — — — 64.6 — — 64.6 — 64.6
Convertible bonds — equity portion — — 202.4 — — — 202.4 — 202.4
2014 BSP shares vested in April 2017 590 851 — 40.0 (40.0) — — — — —
Total comprehensive (loss)/income — — — — — (752.7) (752.7) 95.7 (657.0)
Balance at 31 December 2017 192 868 841 1.9 9 643.2 240.8 82.5 701.5 10 669.9 3 754.0 14 423.9
2016
Balance at 31 December 2015 191 743 614 1.9 9 366.1 194.7 71.8 1 285.9 10 920.4 3 563.9 14 484.3
Share-based payment charge — — — 52.8 — — 52.8 — 52.8
2013 BSP shares vested in April 2016 534 376 — 31.3 (31.3) — — — — —
Share options exercised — — 3.4 — — — 3.4 — 3.4
RPM contribution to housing project — — — — 10.7 — 10.7 — 10.7
Total comprehensive income — — — — — 168.3 168.3 94.4 262.7
Balance at 31 December 2016 192 277 990 1.9 9 400.8 216.2 82.5 1 454.2 11 155.6 3 658.3 14 813.9
* The number of shares is net of 2 967 624 (2016: 3 558 475) treasury shares relating to the Company’s management share incentive scheme and the Mahube Employee Share Trust as shares held by these special purpose vehicles are eliminated on consolidation
The notes on pages 18 to 66 form an integral part of these consolidated annual financial statements.

Royal Bafokeng Platinum Annual Financial Statements 2017 17
CONSOLIDATED STATEMENT OF CASH FLOWSFOR THE YEAR ENDED 31 DECEMBER 2017
Group
Notes2017
R (million)2016
R (million)
Cash flows from operating activitiesCash generated by operations 31 569.5 528.8
Interest paid (42.8) (0.2)
Interest received 114.7 74.4
Dividend received 2.1 5.0
Tax refund 13 2.4 2.5
Tax paid 13 (27.5) (25.2)
Net cash flow generated by operating activities 618.4 585.3
Cash flows from investing activities
Proceeds from disposal of property, plant and equipment — 47.2
Acquisition of property, plant and equipment 3 (2 138.3) (1 136.5)
Styldrift on-reef development revenue receipts 451.1 273.9
Acquisition of employee housing assets 10 (493.9) (83.2)
Employee housing loan receivable repayments 1.3 —
Deposit paid for Maseve acquisition 12 (41.4) —
Acquisition of housing insurance investment 9 — (2.9)
Increase in environmental trust deposits and investments 6 (9.8) (20.1)
Net cash flow utilised by investing activities (2 231.0) (921.6)
Cash flows from financing activities
Increase in amounts owing to RPM 444.2 128.8
Drawdown of PIC housing facility 20 535.0 40.0
Repayment of PIC housing facility 20 (40.0) —
RPM contribution to housing fund received — 82.5
Proceeds from share options exercised — 2.9
Proceeds from convertible bonds issued 19 1 200.0 —
Costs relating to issue of convertible bonds capitalised 19 (29.0) —
Net cash flow generated by financing activities 2 110.2 254.2
Net increase/(decrease) in cash and cash equivalents 497.6 (82.1)
Cash and cash equivalents at beginning of year 14 835.5 917.6
Cash and cash equivalents at end of year 14 1 333.1 835.5
The notes on pages 18 to 66 form an integral part of these consolidated annual financial statements.

18 Royal Bafokeng Platinum Annual Financial Statements 2017
SUMMARY OF THE GENERAL ACCOUNTING POLICIES FOR THE YEAR ENDED 31 DECEMBER 2017
1. General information The annual financial statements have been prepared in accordance with International Financial Reporting Standards (IFRS).
“Group” in the annual financial statements refers to the economic entity which includes the Company, its subsidiaries and controlled special purpose entities.
Summaryofsignificantaccountingpolicies Theprincipalaccountingpoliciesandcriticalestimatesandassumptionsadoptedinthepreparationoftheseconsolidated
annualfinancialstatementsaresetoutindetailintherelevantnotestotheannualfinancialstatements. The policies have been consistently applied to all the years presented, unless otherwise stated.
Basisofpresentation The Group annual financial statements have been prepared in accordance with IFRS as issued by the International Accounting
Standards Board (IASB), including IFRIC interpretations (collectively IFRS), the SAICA Financial Reporting Guidelines as issued by the Accounting Practices Committee, financial pronouncements as issued by the Financial Reporting Standards Council (FRSC) and the requirements of the South African Companies Act 71 of 2008 of South Africa.
The Group annual financial statements have been prepared under the historic cost convention except for certain financial assets, which are measured at fair value.
The preparation of the Group annual financial statements in accordance with IFRS requires the use of estimates and assumptions that affect the reported amounts of assets and liabilities at the date of the financial statements and the reported amounts of revenues and expenses during the reporting period based on management and the Board’s best knowledge of current events and actions. Actual results may ultimately differ from these estimates. The areas involving a higher degree of judgement or complexity, or areas where assumptions and estimates are significant to the consolidated annual financial statements are detailed in the relevant notes to the annual financial statements.
Functionalandpresentationcurrency These consolidated annual financial statements are presented in ZAR, which is the Company’s functional currency. All financial
information is presented in Rand million, unless otherwise stated.
Standards,amendmentsandinterpretationstoexistingstandardsthatarenotyeteffectiveandhavenotbeenearlyadoptedbytheGroup
The following standards, amendments to standards and interpretations for existing standards may possibly have an impact on the Group: > IFRS 15: Revenue from Contracts with Customers effective 1 January 2018, issued on 29 May 2014. It is a single, comprehensive revenue recognition model for all contracts with customers to achieve greater consistency in the recognition and presentation of revenue. Revenue is recognised based on the satisfaction of performance obligations, which occurs when control of good or service transfers to a customer.
Revenue from the disposal of concentrate, which is our main revenue stream, will not be impacted by the standard.
> IFRS 9: Financial Instruments (2014) effective 1 January 2018, addressing:— Financial liabilities— Derecognition of financial instruments— Financial assets— General hedge accounting— Expected credit loss model for the impairment of financial assets.
IFRS 9 addresses classification and measurement of financial assets and replaces the multiple classification and measurement models in IAS 39 with a single model that has only two classification categories: amortised cost and fair value. IFRS 9: Financial Instruments includes guidance on financial liabilities and derecognition of financial instruments.
The classification of financial assets are set out in Note 35.1. The Company will apply the expected loss model when assessing for impairment of financial assets, but this impairment model is not expected to materially increase the impairment of financial assets.
> IFRS 16: Leases effective 1 January 2019. The new standard provides a comprehensive model to identify lease-arrangements and the treatment thereof in the financial statements of both the lessee and lessor. The Company has non-material operating leases which will have to be brought onto the balance sheet in terms of the new standard and additional disclosure will be required.

Royal Bafokeng Platinum Annual Financial Statements 2017 19
1. General information continued > IFRS 2: Share-based payments effective 1 January 2018. This amendment clarifies the measurement basis for cash-settled, share-based payments and the accounting for modifications that change an award from cash-settled to equity-settled. It also introduces an exception to the principles in IFRS 2 that will require an award to be treated as if it was wholly equity-settled, where an employer is obliged to withhold an amount for the employee’s tax obligation associated with a share-based payment and pay that amount to the tax authority.
The impact of the standard is currently being assessed by management. Initial assessments indicated that the standard would not have a significant impact on the financial statements of the Group.
> IFRIC 22, Foreign currency transactions and advance consideration effective 1 January 2018. New interpretation standard that clarifies what exchange rate should be used in transactions that include advance foreign currency receipts and payments. The IFRIC will not have a material impact on the Group’s financial statements.
> IFRIC 23, Uncertainty over income tax treatments, effective 1 January 2019. The new interpretation standard sets out how to determine the accounting tax position when there is uncertainty over income tax treatments. The impact of the interpretation will be assessed and applied to uncertain tax positions in future.
2. Groupaccountingpolicies 2.1GroupandCompanyannualfinancialstatements These consolidated annual financial statements incorporate the Company, its subsidiaries and interest and controlled
special purpose entities using uniform accounting policies.
Subsidiaries Subsidiaries are all entities (including special purpose entities) over which the Group has control. The Group controls an
entity when the Group is exposed to, or has rights to variable returns from its involvement with the entity and has the ability to affect these returns through its power over the entity. Subsidiaries are fully consolidated from the date on which control is transferred to the Group. They are deconsolidated from the date that control ceases.
The Group uses the acquisition method of accounting to account for business combinations. The consideration transferred for the acquisition of a subsidiary is the fair values of the assets transferred, the liabilities incurred and the equity interests issued by the Group. The consideration transferred includes the fair value of any asset or liability resulting from a contingent consideration arrangement. Acquisition-related costs are expensed as incurred. Identifiable assets acquired and liabilities and contingent liabilities assumed in a business combination are measured initially at their fair values at the acquisition date.
On an acquisition-by-acquisition basis, the Group recognises any non-controlling interest in the acquiree either at fair value or at the non-controlling interest’s proportionate share of the acquiree’s net assets.
The excess of the consideration transferred, the amount of any non-controlling interest in the acquiree and the acquisition-date fair value of any previous equity interest in the acquiree over the fair value of the Group’s share of the identifiable net assets acquired is recorded as goodwill. If this is less than the fair value of the net assets of the subsidiary acquired in the case of a bargain purchase, the difference is recognised directly in the statement of comprehensive income.
Goodwill is tested annually for impairment or whenever there is an impairment indicator. Goodwill is carried at cost less accumulated impairment losses. Gains or losses on the disposal of an entity include the carrying amount of goodwill relating to the entity sold.
Intercompany transactions, balances and unrealised gains on transactions between Group companies are eliminated. Unrealised losses are also eliminated. Accounting policies of subsidiaries have been changed where necessary to ensure consistency with the policies adopted by the Group.
Royal Bafokeng Resources Proprietary Limited (RBR), a wholly owned subsidiary of the Company, has an undivided 67% participation interest in the Bafokeng Rasimone Platinum Mine Joint Venture (BRPM JV). Rustenburg Platinum Mines Limited (RPM) owns the remaining 33% participation interest in the BRPM JV.
The Group consolidates the unincorporated BRPM JV and accounts of RPM’s 33% interest in the BRPM JV as the non-controlling interest.

20 Royal Bafokeng Platinum Annual Financial Statements 2017
SUMMARY OF THE GENERAL ACCOUNTING POLICIES CONTINUED
FOR THE YEAR ENDED 31 DECEMBER 2017
2. Groupaccountingpoliciescontinued 2.1 GroupandCompanyannualfinancialstatementscontinued Changes in ownership interests in subsidiaries without change in control Transactions with non-controlling interests that do not result in loss of control are accounted for as equity transactions,
that is, as transactions with the owners in their capacity as owners. The Group treats transactions with non-controlling interests as transactions with equity owners of the Group. For purchases from non-controlling interests, the difference between any consideration paid and the relevant share acquired of the carrying amount of net assets of the subsidiary is recorded in equity. Gains or losses on disposals to non-controlling interests are also recorded in equity.
In the Company financial statements, investments in subsidiaries are accounted for at cost less impairment. Cost is adjusted to reflect changes in consideration arising from contingent consideration amendments. Cost also includes directly attributable costs of investment.
Disposal of subsidiaries When the Group ceases to have control then any retained interest in the entity is remeasured to its fair value at the date
when control is lost, with the change in carrying amount recognised in profit or loss. The fair value is the initial carrying amount for the purposes of subsequently accounting for the retained interest as an associate, joint venture or financial asset. In addition, any amounts previously recognised in other comprehensive income in respect of that entity are accounted for as if the Group had directly disposed of the related assets or liabilities. This may mean that amounts previously recognised in other comprehensive income are reclassified to profit or loss.
2.2 General 2.2.1 Financial instruments Financial assets comprise environmental trust deposits, trade and other receivables (excluding prepaid expenses and
VAT receivable), cash and cash equivalents and the employee housing loan receivable.
The Group classifies its financial assets at fair value through profit or loss and loans and receivables. The classification depends on the purpose for which the financial assets were acquired. Management determines the classification of its financial assets at initial recognition.
Financial liabilities comprise borrowings, shareholder loan and trade and other payables. The Group classifies its financial liabilities as liabilities at amortised cost and at fair value through profit or loss.
2.2.2 Fair value estimation The fair value of financial instruments traded in active markets is based on quoted market prices at the reporting
date.
The nominal value less estimated credit adjustments of trade receivables and payables is assumed to approximate their fair values. The fair value of financial liabilities for disclosure purposes is estimated by discounting the future contractual cash flows at the current market interest rate that is available to the Group for similar financial instruments.
The carrying amounts of current financial assets and current financial liabilities approximate their fair values.
2.2.3 Offset Financial assets and financial liabilities are offset and the net amount reported in the statement of financial position
only when the Group has a legally enforceable right to set off the recognised amounts and intends either to settle on a net basis or to realise the asset and liability simultaneously.

Royal Bafokeng Platinum Annual Financial Statements 2017 21
NOTES TO THE CONSOLIDATED ANNUAL FINANCIAL STATEMENTS AND RELATED ACCOUNTING POLICIESFOR THE YEAR ENDED 31 DECEMBER 2017
3. Property,plantandequipment Items of property, plant and equipment are measured at cost less accumulated depreciation and impairment. Cost includes
expenditure that is directly attributable to the acquisition of the asset.
Pre-production expenditure, incurred to establish or expand productive capacity, to support and maintain that productive capacity incurred on mines, is capitalised to property, plant and equipment. The recognition of costs in the carrying amount of the asset ceases when the item is in the location and condition necessary to operate as intended by management. Any net income earned while the item is not yet capable of operating as intended, reduces the capital amount. Interest on borrowings, specifically to finance the establishment of mining assets, is capitalised during the construction phase.
Items of mine property, plant and equipment, excluding capitalised mine development and infrastructure costs, are depreciated on a straight-line basis over their expected useful lives. Capitalised mine development and infrastructure costs (shown as mining assets in this note) are depreciated on a unit-of-production basis. Depreciation is charged on mining assets from the date on which the assets are available for use as intended by management.
Non-mining assets are measured at historical cost less accumulated depreciation. Depreciation is charged on the straight-line basis over the useful lives of these assets. Non-mining assets include corporate office and RBRP property, plant and equipment.
The present value of the decommissioning cost, which is the dismantling and removal of the asset included in the environmental rehabilitation obligation, is included in the cost of the related assets and changes in the liability resulting from changes in the estimates are accounted for as follows: > Any decrease in the liability reduces the cost of the asset. The decrease in the asset is limited to its carrying amount and any excess is accounted for in profit or loss
> Any increase in the liability increases the carrying amount of the asset. An increase to the cost of the asset is tested for impairment when there is an indication of impairment
> These assets are depreciated over their useful lives and are expensed in profit and loss as a cost of production.
Depreciation is calculated to write off the cost of each asset to its residual value over its estimated useful life and residual value as reassessed on an annual basis and approximates the following:
Buildings 5 — 30 years (straight-line) Computer equipment and software 3 — 5 years (straight-line) Furniture and fittings 4 — 10 years (straight-line) Plant and machinery 5 — 30 years (straight-line) Vehicles and equipment 6 years (straight-line) Mining assets (shaft and development) Units-of-production Mineral rights Units-of-production
Depreciation periods are assessed annually and adjusted if and where appropriate.
Where the carrying amount of an asset is greater than its estimated recoverable amount, it is written down immediately to its recoverable amount. Gains or losses on disposal of property, plant and equipment are determined by comparing proceeds on disposal with carrying amounts and are included in operating profit.
Impairment An impairment review of property, plant and equipment is carried out when there is an indication that these assets may be
impaired by comparing the carrying amount thereof to its recoverable amount.
The recoverable amount of property, plant and equipment is determined as the higher of the fair value less cost to sell and its value in use. For mining assets this is determined based on the present value of the estimated future cash flows arising from the use of the asset.
Where the recoverable amount is less than the carrying amount, the impairment charge will reduce the carrying amount of property, plant and equipment to its recoverable amount. The adjusted carrying amount is depreciated over the remaining useful life of property, plant and equipment.
When an impairment loss subsequently reverses, the carrying amount of the asset is increased to the revised estimate of its recoverable amount, but so that the increased carrying amount does not exceed the carrying amount that would have been determined had no impairment loss been recognised for the asset in prior years. A reversal of an impairment loss is recognised immediately in profit or loss.

22 Royal Bafokeng Platinum Annual Financial Statements 2017
NOTES TO THE CONSOLIDATED ANNUAL FINANCIAL STATEMENTS AND RELATED ACCOUNTING POLICIES CONTINUED
FOR THE YEAR ENDED 31 DECEMBER 2017
3. Property,plantandequipmentcontinued Capitalworkinprogress
Development costs are capitalised and transferred to the appropriate category of property, plant and equipment when available for use. Capitalised development costs include expenditure to develop new operations and to expand existing capacity.
AccountingtreatmentoftheStyldriftlprojectexpenditure Styldrift I is currently in the development phase, the decision as to when to stop capitalising development costs and start
expensing costs at the Styldrift I project requires judgement. The accounting is dependent on where the project is in terms of the following phases:
Phase 1: Development phase The cost of an item of property, plant and equipment comprises any costs directly attributable to bringing the asset to the
location and condition necessary for it to be capable of operating in the manner intended by management.
The development phase includes the construction of the main infrastructure of the mine, which includes the mine rooms, footwall infrastructure, ventilation shafts, services shaft, silos and the spillage handling ramp. These components are necessary for the mine to be capable of operating in a manner intended by management.
All costs directly attributable to developing the mine will be capitalised, including development taking place on-reef. Incidental revenue generated during the development phase is credited against the capitalised cost of the asset.
Phase 2: Ramp-up phase Recognition of costs in the carrying amount of an item of property, plant and equipment ceases when the item is in the location
and condition necessary for it to be capable of operating in the manner intended by management.
In order to determine whether the Styldrift I mine is ready to operate as intended by management, judgement will be applied taking into account commercial production indicators such as the level of expenditure incurred compared to the total capital cost to completion, pre-production output has reached a nominated percentage, the internal project management team has transferred the mine to the operational team, the majority of the assets necessary for the mining project are substantially complete and ready for use and the project’s ability to sustain commercial levels of production. These indicators will provide guidance to recognise when the mine development phase will cease and the production phase will commence.
During ramp-up phase all costs that are directly attributable to developing the mine will be capitalised and the incidental revenue generated will be credited against the capital cost up to the date when the commercial production indicators are met.
During this phase the mine is not in a condition necessary for it to be capable of operating in the manner as intended by management.
Phase 3: Production phase When the commercial production indicators are met the mine moves to the production phase. Revenue will be recognised in
the statement of comprehensive income as well as operating costs relating to the production from the mine.
Critical accounting estimates and assumptions The recoverability of the BRPM and Styldrift mining assets was assessed using the higher of fair value less cost to sell or value
in use methodology based on the net present value of the current life of mine plan and an in situ value for 4E resource ounces outside the life of mine plan. Refer to Note 5 for detail of assumptions and estimates used in our impairment assessment.
Mineralreserves The estimation of reserves impacts the depreciation of property, plant and equipment, the recoverable amount of property,
plant and equipment and the timing of rehabilitation expenditure.
Management uses past experience and assessment of future conditions, together with external sources of information, such as consensus global assumptions regarding commodity prices and exchange rates, to assign value to the key assumptions.
Factors impacting the determination of proved and probable reserves are as follows: > The grade of mineral reserves may vary significantly from time to time (i.e. differences between actual grades mined and resource model grades)
> Differences between actual commodity prices and commodity price assumptions > Unforeseen operational matters/difficulties at mine sites > Changes in capital, operating, mining, processing and reclamation costs, discount rates and foreign exchange rates.
Assetlives The Group’s assets, excluding mining assets and mineral rights, are depreciated over their expected useful lives which are
reviewed annually to ensure its appropriateness. In assessing useful lives, technological innovation, product life cycles, physical condition of the assets and maintenance programmes are taken into consideration.
Mining assets and mineral rights are depreciated/amortised on a unit-of-production (UOP) basis. The UOP method is based on the actual production of economically recoverable proved and probable mineral reserves over expected estimated economically recoverable proved and probable mineral reserves to be produced or concentrated by that asset.

Royal Bafokeng Platinum Annual Financial Statements 2017 23
3. Property,plantandequipmentcontinued
BuildingsR (million)
Furniture andfittings
andcomputerequipmentR (million)
Mining assets
(includingdecommis-
sioning asset)
R (million)
Capitalworkinprogress
R (million)
Plant and
machineryR (million)
Vehiclesand
equipmentR (million)
TotalR (million)
Property,plantandequipment2017At 1 January 2017 96.8 38.9 3 012.9 6 476.4 959.0 3.2 10 587.2Additions — 0.8 — 1 644.5 — 0.4 1 645.7Change in estimates of decommissioning asset — — (0.5) — — — (0.5)Depreciation (6.0) (14.4) (137.6) — (159.9) (2.3) (320.2)Transfers 0.1 15.1 53.5 (415.5) 345.8 1.0 —
At31December2017 90.9 40.4 2 928.3 7 705.4 1 144.9 2.3 11 912.2
Cost or valuation 124.8 202.2 6 611.7 7 727.8 2 121.0 34.4 16 821.9Accumulated depreciation and impairment (33.9) (161.8) (3 683.4) (22.4) (976.1) (32.1) (4 909.7)
At31December2017 90.9 40.4 2 928.3 7 705.4 1 144.9 2.3 11 912.2
2016At 1 January 2016 97.7 52.6 3 049.3 5 923.3 999.9 6.9 10 129.7
Additions 2.6 2.8 — 777.8 — 0.2 783.4
Change in estimates of decommissioning asset — — (6.7) — — — (6.7)
Disposals — — — (40.3) — — (40.3)
Impairment — — — (0.9) — (0.9) (1.8)
Depreciation (4.6) (25.3) (116.7) — (127.5) (3.0) (277.1)
Transfers 1.1 8.8 87.0 (183.5) 86.6 — —
At31December2016 96.8 38.9 3 012.9 6 476.4 959.0 3.2 10 587.2
Cost or valuation 124.7 186.3 6 558.7 6 498.8 1 775.2 33.0 15 176.7
Accumulated depreciation and impairment (27.9) (147.4) (3 545.8) (22.4) (816.2) (29.8) (4 589.5)
At31December2016 96.8 38.9 3 012.9 6 476.4 959.0 3.2 10 587.2
RBR has the life of mine right to use, but not ownership of assets with a carrying amount of R854 079 041 (2016: R941 708 980) which is included in the balances above.
Exploration and evaluation costs relating to Styldrift II incurred in the current year and included in capital work in progress additions, were R0.2 million (2016: R4.1 million).
Social and labour plan expenditure for Styldrift I of R5.1 million (2016: R1.5 million) and share-based payment expenditure of R12.3 million (2016: R7.7 million) was included in capital work in progress additions in 2017.
For the 2017 financial year Styldrift on-reef development revenue of R571.8 million (2016: R363.3 million) was credited against the capital work in progress additions.
General and specific borrowing costs that are directly attributable to the acquisition, construction or production of a qualifying asset are capitalised during the period of time that is required to complete and prepare the asset for its intended use or sale. On this basis, R58.7 million of the convertible bond fair value interest expense and R15 million costs relating to the R2 billion debt package put in place for Styldrift I, was capitalised in 2017.

24 Royal Bafokeng Platinum Annual Financial Statements 2017
4. Mineral rights Explorationandevaluationassets
Exploration and evaluation assets acquired are initially recognised at cost. Once commercial reserves are found, exploration and evaluation assets are transferred to assets under construction. No amortisation is charged during the exploration, evaluation and development phase.
For the purposes of assessing impairment, the exploration and evaluation assets subject to testing are grouped with existing cash-generating units of operating mines that are located in the same geographical region. Where assets are not associated with a specific cash-generating unit, the recoverable amount is assessed using fair value less cost to sell for the specific exploration area.
All exploration and evaluation costs incurred as part of normal operations are expensed until the Board concludes that a future economic benefit is more likely than not to be realised, i.e. probable. While the criterion for concluding that expenditure should be capitalised is always the probability of future benefits, the information that the Board uses to make that determination depends on the level of exploration. > Exploration and evaluation expenditure on greenfields sites, being those where the Group does not have any mineral deposits which are already being mined or developed, is expensed as incurred until a final feasibility study has been completed, after which the expenditure is capitalised within development costs, if the final feasibility study demonstrates that future economic benefits are probable
> Exploration and evaluation expenditure on brownfields sites, being those adjacent to mineral deposits which are already being mined or developed, is expensed as incurred until the Board is able to demonstrate that future economic benefits are probable through the completion of a pre-feasibility study, after which the expenditure is capitalised as a mine development cost. A ‘pre-feasibility study’ consists of a comprehensive study of the viability of a mineral project that has advanced to a stage where the mining method, in the case of underground mining, or the pit configuration, in the case of an open pit, has been established, and which, if an effective method of mineral processing has been determined, includes a financial analysis based on reasonable assumptions of technical, engineering, operating economic factors and the evaluation of other relevant factors. The pre-feasibility study, when combined with existing knowledge of the mineral property that is adjacent to mineral deposits that are already being mined or developed, allows the directors to conclude that it is more likely than not that the Group will obtain future benefits from the expenditures
> Exploration and evaluation expenditure relating to extensions of mineral deposits which are already being mined or developed, including expenditure on the definition of mineralisation of such mineral deposits, is capitalised as a mine development cost following the completion of an economic evaluation equivalent to a pre-feasibility study. This economic evaluation is distinguished from a pre-feasibility study in that some of the information that would normally be determined in a pre-feasibility study is instead obtained from the existing mine or development. This information when combined with existing knowledge of the mineral property already being mined or developed allows the Board to conclude that it is more likely than not that the Group will obtain future economic benefits from the expenditures.
Critical accounting estimates and assumptions For BRPM and Styldrift, the recoverability of the non-financial assets was assessed using the higher of fair value less cost to sell
or value in use methodology based on the net present value of the current life of mine plan and an in situ value for 4E resource ounces outside the life of mine plan. The Styldrift mineral right includes the Styldrift I and Styldrift II project areas. Refer to Note 5 for details of the estimates and assumptions used in our impairment assessment.
Amortisation of mineral rights is provided on a units-of-production basis.
Group
2017R (million)
2016R (million)
Mineral rightsOpening balance at 1 January 5 729.3 5 766.0
Less: Amortisation (included in cost of sales refer to Note 28) (42.8) (36.7)
Closingbalanceat31December 5 686.5 5 729.3
Cost 6 767.0 6 767.0
Accumulated amortisation and impairment (1 080.5) (1 037.7)
Closingbalanceat31December 5 686.5 5 729.3
In terms of the joint venture agreement between RPM and RBR, RPM contributed its Boschkoppie mineral right and the Frischgewaagd prospecting right while RBR contributed its Styldrift mineral right to the BRPM JV for the full BRPM life of mine. RBR therefore has an undivided 67% participation interest in these rights while RPM has an undivided 33% participation interest in these rights.
NOTES TO THE CONSOLIDATED ANNUAL FINANCIAL STATEMENTS AND RELATED ACCOUNTING POLICIES CONTINUED
FOR THE YEAR ENDED 31 DECEMBER 2017

Royal Bafokeng Platinum Annual Financial Statements 2017 25
5. Goodwill Goodwill is tested annually for impairment. Goodwill is allocated to the BRPM operations and Styldrift cash-generating units
(CGUs) for the purpose of impairment testing. The recoverable amount of the CGU to which goodwill has been allocated is based on the higher of fair value less cost to sell or value in use derived from reserve and resource ounce valuations. An impairment is recognised immediately in the statement of comprehensive income. Impairment write downs on goodwill may not be reversed.
Criticalaccountingestimatesandassumptions Goodwill was calculated as the difference between the purchase consideration for the 67% interest in the BRPM JV and the
Group’s share of net assets acquired when the Group assumed control over the BRPM JV upon listing on 8 November 2010. The BRPM JV consists of the BRPM operations and Styldrift and goodwill was allocated across these CGUs as the difference between the purchase considerations allocated to each CGU and the net assets per CGU. No goodwill was attributed to non-controlling interest.
In the previous periods, Styldrift I and II were treated as separate CGUs. This was reconsidered in 2017, as at 31 December 2017 there was no formal plan as to how the Styldrift II mining area will be mined. The Styldrift mining right is one mining right. The split between Styldrift I and Styldrift II is merely a line on the plan. There is significant flexibility to move this line on the plan depending on the most optimal way to mine the Styldrift II area.
For BRPM and Styldrift, the recoverability of the non-financial assets was assessed using the higher of fair value less cost to sell or value in use methodology based on the net present value of the current life of mine plan and an in situ value for 4E resource ounces outside the life of mine plan.
Mineralrightsinsidelifeofmineplan The following key assumptions were used in the impairment assessment of the BRPM operations and Styldrift:
> Long-term real platinum US$1 305 per ounce (2016: US$1 302 per ounce) > Long-term real palladium US$1 240 per ounce (2016: US$717 per ounce) > Long-term real gold US$1 280 per ounce (2016: US$1 310 per ounce) > Long-term real rhodium US$1 406 per ounce (2016: US$832 per ounce) > A long-term real Rand:US$ exchange rate of R14.46:US$ (2016: R15.36:US$) > A real post-tax discount rate range of 8.6% to 9.1% (2016: 9.1%) > A real pre-tax discount rate range of 9.0% to 9.4% (2016: 9.4%) > Life of mine of 30 years (2016: 30 years) > Production volumes are based on a detailed life of mine plan.
Mineralrightsoutsidethelifeofmineplan For in situ 4E resource ounces a value of US$10 per 4E ounce (2016: US$10 per 4E ounce) was used to calculate the recoverable
amount of outside life of mine 4E ounces for the BRPM operations and Styldrift.
Sensitivityanalysisinrespectofthemostsignificantassumptionsappliedintheimpairmentmodel > BRPM
If all assumptions remain unchanged, a 5% decrease in the average Rand basket over the life of mine will result in an impairment of R289 million. If all assumptions remain unchanged, a 1% increase in the real discount rate to 9.6% would not result in an impairment. 10.6% is the real break-even discount rate.
> Styldrift If all assumptions remain unchanged, a 5% decrease in the average Rand basket over the life of mine will result in a further
impairment of R1.6 billion. If all assumptions remain unchanged, a 1% increase in the real discount rate to 10.1% would result in a further impairment of R898 million.

26 Royal Bafokeng Platinum Annual Financial Statements 2017
5. Goodwillcontinued
BRPM R (million)
StyldriftR (million)
TotalR (million)
Goodwill
2017Openingbalanceat1January — 863.3 863.3
Less: Impairment (refer to Note 29) — (863.3) (863.3)
Closingbalanceat31December — — —
Cost 134.6 2 140.5 2 275.1
Less: Accumulated impairment (134.6) (2 140.5) (2 275.1)
Closingbalanceat31December — — —
2016Openingbalanceat1January — 863.3 863.3
Less: Impairment — — —
Closingbalanceat31December — 863.3 863.3
Cost 134.6 2 140.5 2 275.1
Less: Accumulated impairment (134.6) (1 277.2) (1 411.8)
Closingbalanceat31December — 863.3 863.3
6. Environmentaltrustdepositsandguaranteeinvestments Contributions are made to the Bafokeng Rasimone Platinum JV Environmental Rehabilitation Trust (BRP JV Environmental Rehab
Trust), created in accordance with statutory requirements to provide for the estimated cost of rehabilitation during and at the end of the life of BRPM JV.
Environmental trust deposits held in the Nedbank equity-linked deposits are carried in the statement of financial position at fair value and deposits held in the Nedbank and Standard Bank accounts are carried at amortised cost. Contributions are based on the estimated environmental obligations over the life of mine. Interest earned on monies paid to the trust is accounted for as finance income and income earned linked to the performance of the equity-linked component of the investment is included in other income.
The Company has control over the trust and the special purpose entity is consolidated in the Company.
Financialassetsatfairvaluethroughprofitorloss Initial recognition
Financial assets at fair value through profit or loss are financial assets held for trading. A financial asset is classified in this category if acquired principally for the purpose of selling in the short term. Assets in this category are classified as current assets, except for the environmental deposit which is classified as a non-current asset. Financial assets at fair value through profit or loss are initially recognised at fair value. Nedbank equity-linked deposits are treated at fair value through profit or loss.
BafokengRasimonePlatinumJVEnvironmentalRehabilitationTrust The Bafokeng Rasimone Platinum JV Environmental Rehabilitation Trust was created to fund the estimated cost of pollution
control, rehabilitation and mine closure at the end of the lives of the Group’s mines. The Group funds its environmental obligations through a combination of funding the Bafokeng Rasimone Platinum JV Environmental Rehabilitation Trust and providing guarantees to the Department of Mineral Resources. Contributions made are determined on the basis of the estimated environmental obligation over the life of a mine and are reflected in non-current assets under environmental trust deposits. Refer to Note 21 for details of the environmental rehabilitation provision.
Gains or losses Gains or losses arising from changes in the fair value of the financial assets at fair value through profit or loss category are
presented in the statement of comprehensive income within other income, in the period in which they arise.
Subsequentmeasurement Financial assets at fair value through profit or loss are subsequently measured at the quoted current bid prices. If the market for
a financial asset is not active (and for unlisted securities), the Group establishes fair value by using valuation techniques. These include the use of recent arm’s length transactions, reference to other instruments that are substantially the same, discounted cash flow analysis and option pricing models, making maximum use of market inputs and relying as little as possible on entity-specific inputs.
NOTES TO THE CONSOLIDATED ANNUAL FINANCIAL STATEMENTS AND RELATED ACCOUNTING POLICIES CONTINUED
FOR THE YEAR ENDED 31 DECEMBER 2017

Royal Bafokeng Platinum Annual Financial Statements 2017 27
6. Environmentaltrustdepositsandguaranteeinvestmentscontinued Subsequentmeasurementcontinued
Loans and receivables are non-derivative financial assets with fixed or determinable payments that are not quoted in an active market. The environmental trust deposits held in the Standard Bank, Nedbank and Rand Merchant Bank accounts form part of loans and receivables and is treated at amortised cost. Loans and receivables are initially recognised at cost.
Group
2017R (million)
2016R (million)
EnvironmentaltrustdepositsHeldinStandardBankandRandMerchantBankaccountsOpening balance at 1 January 10.9 7.5
Plus: Interest earned on environmental trust deposit (refer to Note 27.1) 0.6 0.5
Plus: Increase in cash deposit during the year — 2.9
Closingbalanceat31December 11.5 10.9
HeldinNedbankequity-linkeddepositaccountsOpening balance at 1 January 94.9 107.4
Less: Equity-linked deposit matured and invested in Nedbank deposit notes (2016: Nedbank call account) (64.8) (24.2)
Plus: Fair value adjustment of the Nedbank equity-linked deposits (refer to Note 26) 7.8 11.7
Fairvalueat31December 37.9 94.9
HeldinNedbankcallaccountOpening balance at 1 January 24.6 —
Plus: Equity-linked deposit matured in 2016 — funds placed on call — 24.2
Plus: Interest earned on environmental trust deposit (refer to Note 27.1) 1.1 0.4
Less: Funds transferred to Nedbank deposit notes (25.7) —
Closingbalanceat31December — 24.6
HeldinNedbankdepositnotesOpening balance at 1 January — —
Plus: Funds transferred from Nedbank call account 25.7 —
Plus: Equity-linked deposit matured in 2017 64.8 —
Plus: Interest earned on environmental trust deposits (refer to Note 27.1) 2.7 —
Closingbalanceat31December 93.2 —
TotaldepositsheldbytheBRPJVEnvironmentalRehabTrustat31December 142.6 130.4
EnvironmentalguaranteeinvestmentheldbyBRPMJVOpening balance at 1 January 16.6 —
Plus: Contributions made during the year* 5.4 16.3
Plus: Fair value adjustments 0.1 0.3
Closingbalanceat31December 22.1 16.6
Totalenvironmentaltrustdepositsandguaranteeinvestmentsat31December 164.7 147.0
* Subsequent to the 2017 year-end, a R15.1 million contribution was made by the BRPM JV to the environmental guarantee investments
According to the terms of the Nedbank equity-linked deposit, the deposit amount is guaranteed and will earn a guaranteed 3% per annum (naca) interest. In addition, there is a variable return component linked to the Coreshares Green Exchange Traded Fund (previously the Bettabeta CIS BGreen portfolio exchange traded fund) performance and the FTSE/JSE Shareholder Weighted Top 40 Index performance. The variable return is capped based on a participation interest percentage of the growth in the relevant index to maturity. The Nedbank equity-linked deposits have been invested for a one/two/three/four/five-year period to ensure flexibility for when the cash will be required for rehabilitation.
Rnil (2016: R51.8 million) of the R37.9 million (2016: R94.9 million) Nedbank equity-linked deposits is invested in the Coreshares Green Exchange Traded Fund and R37.9 million (2016: R43.1 million) is invested in the FTSE/JSE Shareholder Weighted Top 40 Index equity-linked deposits.
The Nedbank equity-linked deposits and environmental guarantee investments are fair valued every month and the fair value adjustment is taken through the statement of comprehensive income as an adjustment to other income.
The environmental guarantee investments were issued in terms of the insurance guarantee relating to the BRPM JV’s environmental liability. The investments have been provided as security for the insurance guarantees issued as shown in Note 22.1. The assets, which mainly consist of cash, are separately administered and the Group’s access to these funds are restricted. These investments are managed by Centriq Insurance Company Limited.
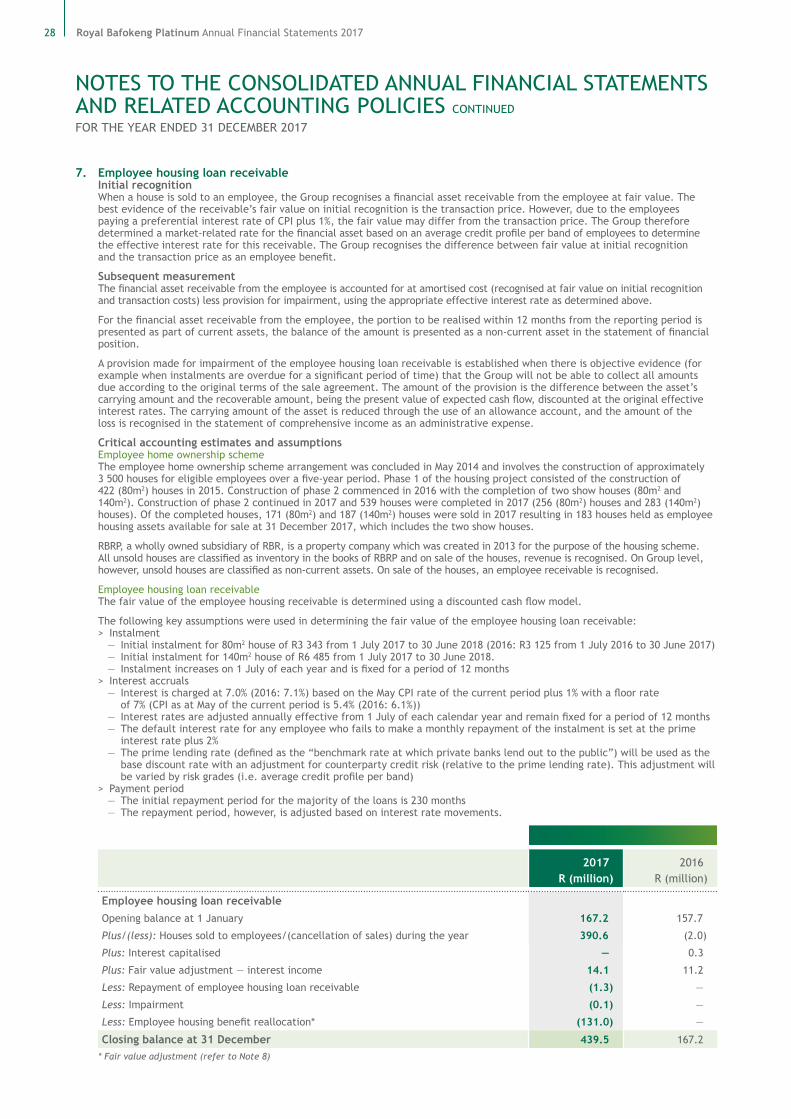
28 Royal Bafokeng Platinum Annual Financial Statements 2017
7. Employeehousingloanreceivable Initialrecognition
When a house is sold to an employee, the Group recognises a financial asset receivable from the employee at fair value. The best evidence of the receivable’s fair value on initial recognition is the transaction price. However, due to the employees paying a preferential interest rate of CPI plus 1%, the fair value may differ from the transaction price. The Group therefore determined a market-related rate for the financial asset based on an average credit profile per band of employees to determine the effective interest rate for this receivable. The Group recognises the difference between fair value at initial recognition and the transaction price as an employee benefit.
Subsequentmeasurement The financial asset receivable from the employee is accounted for at amortised cost (recognised at fair value on initial recognition
and transaction costs) less provision for impairment, using the appropriate effective interest rate as determined above.
For the financial asset receivable from the employee, the portion to be realised within 12 months from the reporting period is presented as part of current assets, the balance of the amount is presented as a non-current asset in the statement of financial position.
A provision made for impairment of the employee housing loan receivable is established when there is objective evidence (for example when instalments are overdue for a significant period of time) that the Group will not be able to collect all amounts due according to the original terms of the sale agreement. The amount of the provision is the difference between the asset’s carrying amount and the recoverable amount, being the present value of expected cash flow, discounted at the original effective interest rates. The carrying amount of the asset is reduced through the use of an allowance account, and the amount of the loss is recognised in the statement of comprehensive income as an administrative expense.
Criticalaccountingestimatesandassumptions Employee home ownership scheme
The employee home ownership scheme arrangement was concluded in May 2014 and involves the construction of approximately 3 500 houses for eligible employees over a five-year period. Phase 1 of the housing project consisted of the construction of 422 (80m2) houses in 2015. Construction of phase 2 commenced in 2016 with the completion of two show houses (80m2 and 140m2). Construction of phase 2 continued in 2017 and 539 houses were completed in 2017 (256 (80m2) houses and 283 (140m2) houses). Of the completed houses, 171 (80m2) and 187 (140m2) houses were sold in 2017 resulting in 183 houses held as employee housing assets available for sale at 31 December 2017, which includes the two show houses.
RBRP, a wholly owned subsidiary of RBR, is a property company which was created in 2013 for the purpose of the housing scheme. All unsold houses are classified as inventory in the books of RBRP and on sale of the houses, revenue is recognised. On Group level, however, unsold houses are classified as non-current assets. On sale of the houses, an employee receivable is recognised.
Employee housing loan receivable The fair value of the employee housing receivable is determined using a discounted cash flow model.
The following key assumptions were used in determining the fair value of the employee housing loan receivable: > Instalment
― Initial instalment for 80m2 house of R3 343 from 1 July 2017 to 30 June 2018 (2016: R3 125 from 1 July 2016 to 30 June 2017) ― Initial instalment for 140m2 house of R6 485 from 1 July 2017 to 30 June 2018. ― Instalment increases on 1 July of each year and is fixed for a period of 12 months
> Interest accruals ― Interest is charged at 7.0% (2016: 7.1%) based on the May CPI rate of the current period plus 1% with a floor rate of 7% (CPI as at May of the current period is 5.4% (2016: 6.1%))
― Interest rates are adjusted annually effective from 1 July of each calendar year and remain fixed for a period of 12 months ― The default interest rate for any employee who fails to make a monthly repayment of the instalment is set at the prime interest rate plus 2%
― The prime lending rate (defined as the “benchmark rate at which private banks lend out to the public”) will be used as the base discount rate with an adjustment for counterparty credit risk (relative to the prime lending rate). This adjustment will be varied by risk grades (i.e. average credit profile per band)
> Payment period ― The initial repayment period for the majority of the loans is 230 months ― The repayment period, however, is adjusted based on interest rate movements.
Group
2017R (million)
2016R (million)
EmployeehousingloanreceivableOpening balance at 1 January 167.2 157.7
Plus/(less): Houses sold to employees/(cancellation of sales) during the year 390.6 (2.0)
Plus: Interest capitalised — 0.3
Plus: Fair value adjustment — interest income 14.1 11.2
Less: Repayment of employee housing loan receivable (1.3) —
Less: Impairment (0.1) —
Less: Employee housing benefit reallocation* (131.0) —
Closingbalanceat31December 439.5 167.2
* Fair value adjustment (refer to Note 8)
NOTES TO THE CONSOLIDATED ANNUAL FINANCIAL STATEMENTS AND RELATED ACCOUNTING POLICIES CONTINUED
FOR THE YEAR ENDED 31 DECEMBER 2017

Royal Bafokeng Platinum Annual Financial Statements 2017 29
8. Employeehousingbenefit The Group recognises the difference between the fair value of the employee housing receivable at initial recognition and
the transaction price as an employee benefit. The initial difference is amortised over the shorter of the service period of the employee or the loan period. If the employee’s service period differs from the initial expectation on occupation date, the change in expectation is recognised as a profit or loss in the statement of comprehensive income. The portion of the short-term employee benefit to be realised within 12 months from the reporting date is presented as part of current assets, the balance of the amount is presented as a non-current asset in the statement of financial position.
Group
2017R (million)
2016R (million)
EmployeehousingbenefitOpening balance at 1 January 50.7 55.7Plus: Additions for the year (reallocations from employee housing loan receivable — refer to Note 7) 131.0 —Less: Amortisation charge for the year (5.8) (4.2)Less: Impairment* (0.9) (0.8)
Closingbalanceat31December 175.0 50.7
Splitbetween:Non-current portion of employee housing benefit 163.2 46.5
Current portion of employee housing benefit 11.8 4.2
* The impairment is as a result of agreements being terminated due to dismissals, resignations or cancellations
9. HousinginsuranceinvestmentThe insurance investment is classified at fair value through profit or loss (FVTPL). These assets are recognised at fair value and any subsequent gains or losses are recognised in the statement of comprehensive income and shown under other income.
The insurance investment relates to a cell captive set up to cover retrenchment for employees having an employee housing loan.
Group
2017R (million)
2016R (million)
InsuranceinvestmentrelatingtotheRBPlathousingprojectOpening balance at 1 January 35.0 31.0Plus: Additions for the year — 2.9Plus: Fair value adjustments 0.7 1.1
Closingbalanceat31December 35.7 35.0
10.Employeehousingassets Employee housing assets are recognised at cost which consists of the cost of the land and the cost to construct the houses. No
depreciation is recognised on the employee houses as the intention is to sell the houses within a short period of time after their construction.
When the employee housing assets are sold to employees, the carrying amount of the house is derecognised. The difference between the proceeds received and the carrying amount of the house is recognised in profit or loss as a gain or loss on disposal of employee housing.
The employee housing assets are held for the purpose of trading and are classified as current assets.
Group
2017R (million)
2016R (million)
EmployeehousingassetsOpening balance 377.3 264.2
Additions of houses for the year (includes cancellation of sale agreements) 3.5 1.7
Additions due to construction of houses for Phase 2 of the housing project 493.9 83.2
Houses sold to employees during the year (exclusive of VAT) (344.4) —
Transfer of house to property, plant and equipment — (0.4)
Interest on PIC housing facility capitalised (refer to Note 20) 49.0 28.6
Closingbalance 579.3 377.3

30 Royal Bafokeng Platinum Annual Financial Statements 2017
NOTES TO THE CONSOLIDATED ANNUAL FINANCIAL STATEMENTS AND RELATED ACCOUNTING POLICIES CONTINUED
FOR THE YEAR ENDED 31 DECEMBER 2017
11.Inventories Stores and materials (consumables) are valued at the lower of cost or net realisable value, on a weighted average basis.
Obsolete, redundant and slow-moving stores are identified and written down to their net realisable values. Net realisable value is the estimated selling price in the ordinary course of business, less selling expenses. This write-down is reflected in cost of sales.
Product inventory consists of stockpiles of ore mined for processing at a later stage. Stockpiles are stated at the lower of cost or net realisable value. Cost is determined using the weighted average cost method. The cost of stockpiles comprises directly attributable mining costs including depreciation. It excludes borrowing costs. Net realisable value is the estimated selling price in the ordinary course of business, less the costs of processing to concentrate as final product and selling expenses.
Group
2017R (million)
2016R (million)
InventoriesConsumables 57.4 51.7
Stockpiles 48.2 27.7
Closingbalanceat31December 105.6 79.4
All inventories are carried at cost. There is no inventory write-down to net realisable value.
12.Tradeandotherreceivables Trade receivables are recognised initially at fair value and subsequently measured at amortised cost using the effective interest
method, less provision for impairment. A provision made for impairment of trade receivables is established when there is objective evidence (e.g. when amounts are overdue for a significant period of time) that the Group will not be able to collect all amounts due according to the original terms of the receivables. The amount of the provision is the difference between the asset’s carrying amount and the recoverable amount, being the present value of expected cash flows, discounted at the original effective interest rates. The carrying amount of the asset is reduced through the use of an allowance account, and the amount of the loss is recognised in the statement of comprehensive income as an administrative expense.
Loans and receivables are non-derivative financial assets with fixed or determinable payments that are not quoted in an active market. They are included in current assets except for maturities greater than 12 months after the statement of financial position date. Loans and receivables comprise trade and other receivables in the statement of financial position excluding prepaid tax, prepaid expenses and VAT receivable. Loans and receivables are initially recognised at cost.
Financial assets are classified at fair value through profit or loss (FVTPL) when the asset is either held for trading or is a derivative that does not satisfy the criteria for hedge accounting or is designated at FVTPL.
Group
2017R (million)
2016Restated
R (million)
TradeandotherreceivablesTrade receivables (RPM concentrate debtors — refer to Note 32) 1 500.9 1 313.0
Impala royalty receivable (refer to Note 26) 24.5 22.2
VAT receivable 42.3 13.9
Deposit paid: Maseve acquisition (refer to Note 38) 41.4 —
Styldrift deposit 38.0 36.0
Other receivables 20.0 20.5
Closingbalanceat31December 1 667.1 1 405.6
RBR entered into a disposal of concentrate agreement with RPM during 2002 in terms of which RBR’s share of the concentrate of the PGMs produced by the BRPM JV will be treated by RPM.
In terms of the agreement, the commodity prices used in the calculation of the concentrate payments are based on the average daily rates for the third month following the month of delivery. Payment is due on the last day of the fourth month following delivery (refer to Note 35.1.1 for sensitivity analysis).
Concentrate debtors is fair valued every month following delivery until the price is fixed at the end of the third month. The fair value adjustment is recognised in the statement of comprehensive income as an adjustment to revenue.

Royal Bafokeng Platinum Annual Financial Statements 2017 31
13. Currenttaxreceivable/(payable)Group
2017R (million)
2016R (million)
Currenttaxreceivable/(payable)Opening balance at 1 January 1.6 3.6
Income tax charge (refer to Note 30) (31.5) (24.7)
Refund received (2.4) (2.5)
Payments made 27.5 25.2
Closingbalanceat31December (4.8) 1.6
Currenttaxreceivable/(payable)comprises:
Current tax receivable 0.2 1.6
Current tax payable (5.0) —
Closingbalanceat31December (4.8) 1.6
14.Cashandcashequivalents Cash and cash equivalents are recognised in the statement of financial position at cost. For the purposes of the cash flow
statement, cash and cash equivalents comprise cash on hand, deposits held on call with banks, money market investments and other short-term highly liquid investments with original maturities of three months or less. Bank overdrafts are shown within borrowings in current liabilities on the statement of financial position.
Group
2017R (million)
2016R (million)
CashandcashequivalentsCash at bank and on hand 99.2 65.3
Short-term deposits 1 233.9 770.2
Closingbalanceat31December 1 333.1 835.5
The cash and cash equivalents above are split as follows:
Cash and cash equivalents — 100% BRPM JV 571.2 370.5
Cash and cash equivalents — RBPlat corporate office 696.5 426.0
Cash and cash equivalents — RBRP (housing project ring-fenced cash) 65.4 39.0
Closingbalanceat31December 1 333.1 835.5
Included in RBPlat corporate office cash balance is restricted cash of R84 million earmarked for the payment of the convertible bond coupon.

32 Royal Bafokeng Platinum Annual Financial Statements 2017
14.Cashandcashequivalentscontinued Facilities
RBR concluded R2 billion debt facilities in March 2017. The debt facilities consist of a seven-year term debt facility of R750 million, a five-year revolving credit facility (RCF) and a one-year general banking facility (GBF).
The security provided in connection with the term debt, RCF and GBF includes a limited guarantee by the Company in favour of Rand Merchant Bank (RMB) and Nedbank, a cession and pledge of the Company’s shares in and claims against RBR as security for its obligations under the limited guarantee and a subordination by the Company of its claims against RBR in favour of the banks. RBR also provides a cession in security pursuant to which it cedes and pledges its rights, title and interest in respect of, or connected with, BRPM and the joint venture agreement. RBR can voluntarily prepay and cancel the facility at any time without penalty.
RBR may also not, without the prior written approval of RMB and Nedbank, inter alia: > encumber any of its assets > make any substantial change to the nature of its business > dispose of any assets or enter into an amalgamation, demerger, merger or corporate reconstruction (other than certain permitted disposals)
> enter into a transaction or acquisition classified as a Category 1 transaction under the JSE Listings Requirements > amend any material term of a material contract including the joint venture agreement and the disposal of concentrate agreement, although in the latter three cases Nedbank’s consent may not be unreasonably withheld.
If RBR undertakes any of these actions without RMB and Nedbank’s prior written consent, it is obliged, if the banks so require, to immediately repay the term debt, RCF and GBF.
At year-end RBR utilised R118.6 million (2016: R201.2 million) of its R500 million general banking facility for guarantees. RBP MS utilised R0.8 million (2016: R0.8 million) of its general banking facility of R5 million for guarantees. RBPlat has a R3 million general banking facility which is unutilised at year-end. Refer to Note 22 for further details.
RBR’s term debt and RCF remained undrawn at 31 December 2017.
The Group’s utilised and available facilities are shown in the table below:
FacilityamountR (million)
UtilisedamountR (million)
AvailablefundsR (million)
Repaymentdate
Interestrate
Committedfacilities
2017Term debt facility 750.0 — 750.0 31March2024 JIBARplus3.7%
Revolving credit facility 750.0 — 750.0 31March2020 JIBARplus3.75%
General banking facilities 508.0 (119.4) 388.6 31December2017 Primeless0.25%
PIC housing facility 2 200.0 (884.2) 1 315.8 ReferNote20 CPIplus1%
Totalat31December2017 4 208.0 (1 003.6) 3 204.4
2016Revolving credit facility 500.0 — 500.0 30 June 2017 JIBAR plus 2.85%
General banking facilities 458.0 (202.0) 256.0 30 June 2017 Prime
PIC housing facility 2 200.0 (389.2) 1 810.8 Refer Note 20 CPI plus 1%
Totalat31December2016 3 158.0 (591.2) 2 566.8
The revolving credit and working capital facilities commitment fees as well as administration fees on guarantees are recognised in corporate office administration expenses (refer to Note 28).
15.Sharecapitalandsharepremium Ordinary shares are classified as equity.
Incremental costs directly attributable to the issue of new ordinary shares or options are shown in equity as a deduction, net of tax, from the proceeds.
The carrying value of the Company’s shares held by the Mahube Trust and the Company’s subsidiaries in respect of the Group’s share option and bonus share schemes are reflected as treasury shares and shown as a reduction in shareholders’ equity.
When share options are exercised, the Company issues new shares or issues shares from the treasury shares. The proceeds received net of any directly attributable transaction costs are credited to share capital and share premium when options are exercised.
NOTES TO THE CONSOLIDATED ANNUAL FINANCIAL STATEMENTS AND RELATED ACCOUNTING POLICIES CONTINUED
FOR THE YEAR ENDED 31 DECEMBER 2017

Royal Bafokeng Platinum Annual Financial Statements 2017 33
15.Sharecapitalandsharepremiumcontinued
Group
2017R
2016R
SharecapitalandsharepremiumAuthorised share capital
250 000 000 (2016: 250 000 000) ordinary shares with a par value of R0.01 each 2 500 000 2 500 000
1 500 000 (2016: 1 500 000) “A1” ordinary shares with a par value of R0.01 each 15 000 15 000
1 500 000 (2016: 1 500 000) “A2” ordinary shares with a par value of R0.01 each 15 000 15 000
1 500 000 (2016: 1 500 000) “A3” ordinary shares with a par value of R0.01 each 15 000 15 000
Totalauthorisedsharecapital 2 545 000 2 545 000
Issued ordinary share capital
The movement in the issued share capital of the Company is as follows:
Opening balance of 192 277 990 (2016: 191 130 657) ordinary shares with a par value of R0.01 1 922 779 1 917 436
Nil* (2016: 2 110 091) ordinary shares issued as part of management share incentive schemes — 21 101
590 851 BSP shares vested April 2017 5 909 —
534 376 BSP shares vested April 2016 — 5 343
Less: Treasury shares Nil* (2016: 2 110 091) ordinary shares issued as part of management share incentive schemes — (21 101)
Total192868841(2016:192277990)ordinaryshares 1 928 688 1 922 779
At 31 December 2017, the treasury shares outstanding amounted to 2 967 624 (2016: 3 558 475) ordinary shares.
R (million) R (million)
Share premium
Opening balance 9 400.8 9 366.1
Nil* (2016: 2 110 091) ordinary shares issued as part of management share incentive schemes — 81.8
590 851 BSP shares vested in April 2017 40.0 —
534 376 BSP shares vested in April 2016 — 31.3
Share options exercised — 3.4
Convertible bonds — equity portion 202.4 —
Less: Treasury shares
Nil* (2016: 2 110 091) ordinary shares issued as part of management share incentive schemes — (81.8)
Totalsharepremium 9 643.2 9 400.8
* During the year 2 684 297 ordinary shares were awarded as part of the Company’s employee incentive schemes. These shares will only be issued following shareholder approval of the amended and new employee share scheme rules and revised scheme share limits as noted in the notice of the annual general meeting 2 110 091 ordinary shares were issued in 2016 as part of the Company’s employee incentive schemes

34 Royal Bafokeng Platinum Annual Financial Statements 2017
16. Share-basedpaymentreserveGroup
2017R (million)
2016R (million)
Share-basedpaymentreserveOpening balance at 1 January 216.2 194.7
Share-based payment expense 52.3 45.1
Share-based payment expense capitalised to Styldrift I project 12.3 7.7
BSP shares vested (40.0) (31.3)
Closingbalanceat31December 240.8 216.2
17. Non-distributablereserveGroup
2017R (million)
2016R (million)
CapitalcontributionfromRPMrelatingtothehousingprojectOpening balance 82.5 71.8
Increase in contribution — 10.7
Closingbalanceat31December 82.5 82.5
18. Deferredtax Deferred tax assets and liabilities are determined using the liability method for all timing differences arising between the tax
bases of assets and liabilities and their carrying amounts for financial reporting purposes. Deferred tax is determined using tax rates that have been enacted or substantially enacted before the statement of financial position date and are expected to apply when the related deferred tax asset is realised or the deferred tax liability is settled.
Deferred tax assets are recognised to the extent that it is probable that future taxable profits will be available, against which the temporary differences can be utilised.
Deferred tax assets and liabilities are only offset when they relate to income taxes levied by the same tax authority and the Group intends to settle its current tax assets and liabilities on a net basis.
Group
2017R (million)
2016R (million)
Deferred tax comprises:
Deferred tax asset (46.5) (38.8)
Deferred tax liability 3 774.3 3 635.3
Closingbalanceat31December 3 727.8 3 596.5
Mineral rights
R (million)
Property,plantand
equipmentR (million)
Unredeemedcapitalbalance
R (million)ProvisionsR (million)
Other R (million)
TotalR (million)
Deferredtax2017At 1 January 2017 1 604.2 2 961.0 (1 002.8) (66.9) 101.0 3 596.5
Charged to equity# — — — — 78.7 78.7
Charged to statement of comprehensive income (12.0) 348.9 (290.6) (9.7) 16.0 52.6
At31December2017 1 592.2 3 309.9 (1 293.4) (76.6) 195.7 3 727.8
2016*At 1 January 2016 1 614.5 2 818.1 (915.9) (56.1) 168.3 3 628.9
Charged to statement of comprehensive income (10.3) 142.9 (86.9) (10.8) (67.3) (32.4)
At31December2016 1 604.2 2 961.0 (1 002.8) (66.9) 101.0 3 596.5
* Comparatives restated to separate unredeemed capex balance# Convertible bond equity shown net of tax. Refer to Note 19.2 for details
Tax losses included in RBP MS and RBRP, which are not recognised as deferred tax assets, amount to R205 million (2016: R151 million) and R72 million (2016: R31 million) respectively. RBR has an unredeemed capital allowance of R2 963 million (2016: R2 225 million) which will be carried forward to 2018. Of the deferred tax liability, approximately R3 605 million (2016: R3 267 million) will realise after 12 months.
NOTES TO THE CONSOLIDATED ANNUAL FINANCIAL STATEMENTS AND RELATED ACCOUNTING POLICIES CONTINUED
FOR THE YEAR ENDED 31 DECEMBER 2017

Royal Bafokeng Platinum Annual Financial Statements 2017 35
19. ConvertiblebondliabilityConvertiblebondsRBPlat issued 120 000 7% senior unsecured convertible bonds for R1.2 billion on 15 March 2017. Shareholders’ approval for the conversion of the convertible bonds was obtained on 8 May 2017. The bonds are convertible into ordinary shares of RBPlat at the option of the holder at an initial conversion price of R42.9438. The conversion price is subject to customary adjustments for reconstructions of equity. These customary adjustments maintain the relative rights of the bondholders. Interest on the bonds is payable semi-annually in arrears on 16 March and 16 September of each year for five years ending 16 September 2022.
The bonds are listed on the JSE Main Board under stock code number RBPCB.
The R1.2 billion convertible bond was initially recognised as a R300.6 million derivative liability and a R899.4 million liability.
31December2017
R (million)
31 December 2016
R (million)
19.1 Derivative—initialrecognition 300.6 —
Less: Fair value up to date of shareholder approval (refer to Note 26) (19.5) —
Derivative fair value at date of shareholder approval (8 May 2017) 281.1 —
Less: Derivative derecognised (281.1) —
Derivativebalanceat31December2017 — —
19.2 ConvertiblebondequityEquity recognised on date of shareholder approval (8 May 2017) 281.1 —
Less: Deferred tax recognised on equity portion (78.7) —
Netequityrecognisedasperstatementofchangesinequity 202.4 —
19.3 ConvertiblebondliabilityLiability — initial recognition 899.4 —
Less: Transaction cost capitalised (29.0) —
Plus: Fair value interest* 104.6 —
Less: Interest paid (42.6) —
Convertiblebondliabilityat31December2017 932.4 —
* R58.7 million of the fair value interest was capitalised to Styldrift I project at RBPlat Group level
The carrying amount of the liability portion at initial recognition was measured as the difference between the cash proceeds and the fair value of the embedded derivative. The liability is subsequently recognised on an amortised cost basis until extinguished on conversion or maturity of the bonds using the effective interest rate method.
Disclosure relating to the reconciliation of other liabilities is set out in Note 20 and Note 24.

36 Royal Bafokeng Platinum Annual Financial Statements 2017
20.PIChousingfacility During the period under review the PIC housing facility was utilised to fund the construction of houses for Phase 2 of the housing
project as well as the insurance investment referred to in Notes 9 and 10. The PIC housing facility is a R2.2 billion facility accruing interest at CPI plus a margin of 1%. Security for the PIC housing facility is ring-fenced to the housing project assets with no recourse to the BRPM JV business.
The PIC housing facility was initially recognised at the fair value of the consideration received, net of transaction costs incurred. In subsequent periods, borrowings are stated at amortised cost using the effective interest rate method. Any difference between proceeds (net of transaction costs) and the redemption value is recognised in the statement of comprehensive income over the period of the borrowing.
The effective interest method is a method of calculating the amortised cost of a financial asset or a financial liability (or group of financial assets or liabilities) and of allocating the interest income or interest expense over the relevant period. The effective interest rate is the rate that discounts estimated future cash payments or receipts through the expected life of the financial instrument or, where appropriate, a shorter period to the net carrying amount of the financial asset or liability. When calculating the effective interest rate, the Group estimates cash flows, considering all the contractual terms of the financial instrument but does not consider future credit losses.
The calculation includes all fees paid or received between the parties to the contract that are an integral part of the effective interest rate, transaction costs, and all other premiums or discounts. There is a presumption that the cash flows and the expected life of a group of similar financial instruments can be estimated reliably. However, in those rare cases when it is not possible to estimate reliably the cash flows or the expected life of a financial instrument (or group of financial instruments), the Group shall use the contractual cash flows over the full contractual term of the financial instrument (or group of financial instruments).
Initialrecognition The best evidence of the PIC housing facility’s fair value on initial recognition is the transaction price. However, due to RBRP
paying a preferential interest rate of CPI plus 1%, the fair value may differ from the transaction price. The Group therefore determined a market-related rate for the financial liability based on the rate of debt funding available to the Group at that specific point in time. The Group recognises the difference between fair value at initial recognition and the transaction price as a fair value adjustment to loan. The initial difference is amortised over the term of the PIC housing facility.
Subsequentmeasurement The financial liability payable to the PIC is accounted for at amortised cost (recognised at fair value at initial recognition) using
the appropriate effective interest rate as determined above.
The PIC housing facility is not repayable within 12 months from the reporting period and is presented as part of non-current liabilities in the statement of financial position.
General and specific borrowing costs that are directly attributable to the acquisition, construction or production of a qualifying asset are capitalised during the period of time that is required to complete and prepare the asset for its intended use or sale. On this basis, the interest expense on the PIC housing facility is capitalised to employee housing assets from 2016 (refer to Note 10).
Group
2017R (million)
2016R (million)
PIChousingfacilityOpening balance at 1 January 434.0 366.9Plus: Drawdowns 535.0 40.0Less: Repayment (40.0) —Plus: Contractual interest charges capitalised to loan (refer to Note 10) 43.3 24.2Plus: Fair value interest charges capitalised to loan (refer to Note 10) 5.7 4.4
Less: Amortisation of fair value adjustment to loan (3.0) (1.5)
Closingbalanceat31December 975.0 434.0
NOTES TO THE CONSOLIDATED ANNUAL FINANCIAL STATEMENTS AND RELATED ACCOUNTING POLICIES CONTINUED
FOR THE YEAR ENDED 31 DECEMBER 2017
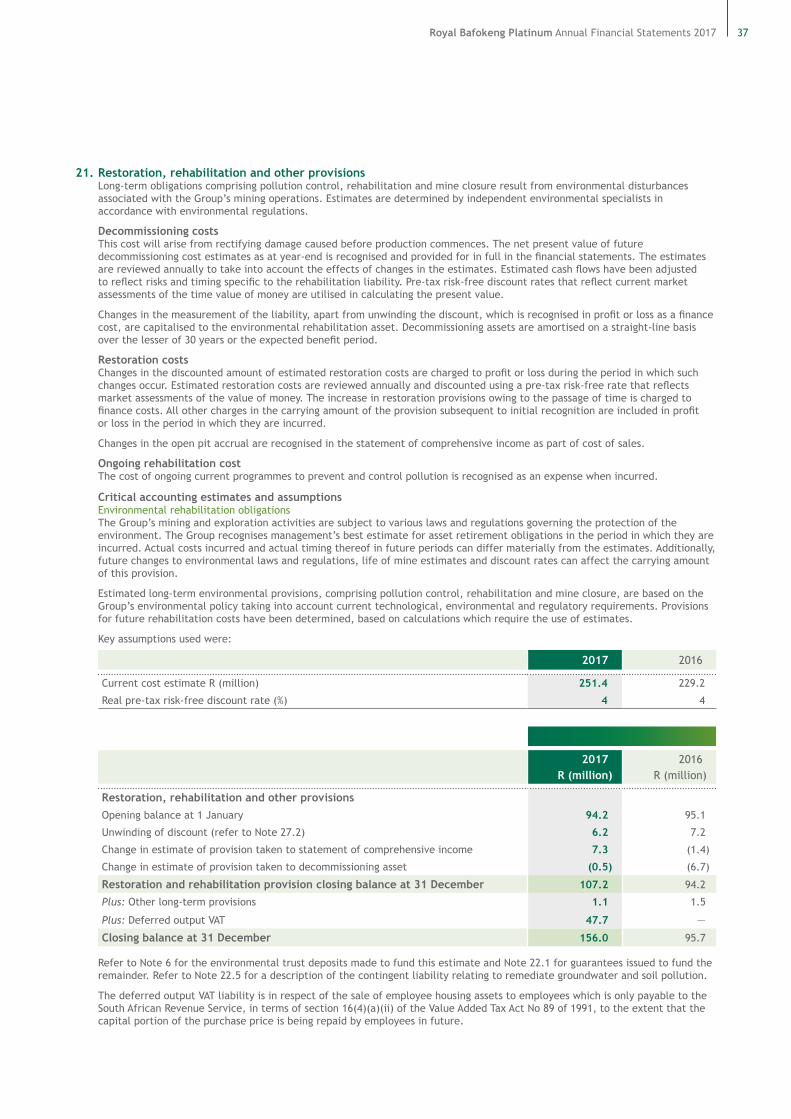
Royal Bafokeng Platinum Annual Financial Statements 2017 37
21.Restoration,rehabilitationandotherprovisions Long-term obligations comprising pollution control, rehabilitation and mine closure result from environmental disturbances
associated with the Group’s mining operations. Estimates are determined by independent environmental specialists in accordance with environmental regulations.
Decommissioningcosts This cost will arise from rectifying damage caused before production commences. The net present value of future
decommissioning cost estimates as at year-end is recognised and provided for in full in the financial statements. The estimates are reviewed annually to take into account the effects of changes in the estimates. Estimated cash flows have been adjusted to reflect risks and timing specific to the rehabilitation liability. Pre-tax risk-free discount rates that reflect current market assessments of the time value of money are utilised in calculating the present value.
Changes in the measurement of the liability, apart from unwinding the discount, which is recognised in profit or loss as a finance cost, are capitalised to the environmental rehabilitation asset. Decommissioning assets are amortised on a straight-line basis over the lesser of 30 years or the expected benefit period.
Restorationcosts Changes in the discounted amount of estimated restoration costs are charged to profit or loss during the period in which such
changes occur. Estimated restoration costs are reviewed annually and discounted using a pre-tax risk-free rate that reflects market assessments of the value of money. The increase in restoration provisions owing to the passage of time is charged to finance costs. All other charges in the carrying amount of the provision subsequent to initial recognition are included in profit or loss in the period in which they are incurred.
Changes in the open pit accrual are recognised in the statement of comprehensive income as part of cost of sales.
Ongoingrehabilitationcost The cost of ongoing current programmes to prevent and control pollution is recognised as an expense when incurred.
Criticalaccountingestimatesandassumptions Environmental rehabilitation obligations
The Group’s mining and exploration activities are subject to various laws and regulations governing the protection of the environment. The Group recognises management’s best estimate for asset retirement obligations in the period in which they are incurred. Actual costs incurred and actual timing thereof in future periods can differ materially from the estimates. Additionally, future changes to environmental laws and regulations, life of mine estimates and discount rates can affect the carrying amount of this provision.
Estimated long-term environmental provisions, comprising pollution control, rehabilitation and mine closure, are based on the Group’s environmental policy taking into account current technological, environmental and regulatory requirements. Provisions for future rehabilitation costs have been determined, based on calculations which require the use of estimates.
Key assumptions used were:
2017 2016
Current cost estimate R (million) 251.4 229.2
Real pre-tax risk-free discount rate (%) 4 4
Group
2017R (million)
2016R (million)
Restoration,rehabilitationandotherprovisionsOpening balance at 1 January 94.2 95.1
Unwinding of discount (refer to Note 27.2) 6.2 7.2
Change in estimate of provision taken to statement of comprehensive income 7.3 (1.4)
Change in estimate of provision taken to decommissioning asset (0.5) (6.7)
Restorationandrehabilitationprovisionclosingbalanceat31December 107.2 94.2
Plus: Other long-term provisions 1.1 1.5
Plus: Deferred output VAT 47.7 —Closingbalanceat31December 156.0 95.7
Refer to Note 6 for the environmental trust deposits made to fund this estimate and Note 22.1 for guarantees issued to fund the remainder. Refer to Note 22.5 for a description of the contingent liability relating to remediate groundwater and soil pollution.
The deferred output VAT liability is in respect of the sale of employee housing assets to employees which is only payable to the South African Revenue Service, in terms of section 16(4)(a)(ii) of the Value Added Tax Act No 89 of 1991, to the extent that the capital portion of the purchase price is being repaid by employees in future.

38 Royal Bafokeng Platinum Annual Financial Statements 2017
NOTES TO THE CONSOLIDATED ANNUAL FINANCIAL STATEMENTS AND RELATED ACCOUNTING POLICIES CONTINUED
FOR THE YEAR ENDED 31 DECEMBER 2017
22. Contingencies and commitmentsGroup
2017R (million)
2016R (million)
Guarantees and commitments
22.1 Guarantees issuedRoyal Bafokeng Resources Proprietary Limited, a wholly owned subsidiary of RBPlat, granted the following guarantees:
Eskom to secure power supply for Styldrift I project (guarantee 30823102) 17.1 17.1
Eskom early termination guarantee for the Styldrift I project (guarantee 31160603) 17.5 17.5
Eskom connection charges guarantee for the Styldrift I project (guarantee 31173918) 40.0 40.0
Anglo American Platinum for the rehabilitation of land disturbed by mining activities and BRPM (guarantee 31247601)* — 82.6
Department of Mineral Resources for the rehabilitation of land disturbed by prospecting/mining (guarantee 32388608) 1.3 1.3
Eskom security guarantee for power supply to Styldrift I project (guarantee 34058907) 42.7 42.7
Royal Bafokeng Platinum Management Services Proprietary Limited, a wholly owned subsidiary of RBPlat, granted the following guarantees:
Tsogo Sun guarantee arising from lease agreement (guarantee 34045600) 0.7 0.7
Tsogo Sun guarantee arising from lease agreement (guarantee 34045708) 0.1 0.1
Total bank guarantees issued at 31 December 119.4 202.0
Department of Mineral Resources guarantee for environmental rehabilitation liability* 150.7 —
Department of Mineral Resources guarantee for Styldrift II project* 45.7 45.7
Total insurance guarantees issued at 31 December 196.4 45.7
22.2 Guarantees received from Anglo American PlatinumFor Anglo American Platinum’s 33% share of the Eskom guarantee to secure power supply for Styldrift I project (guarantee M523084) (5.6) (5.6)
For Anglo American Platinum’s 33% share of the Eskom early termination guarantee for the Styldrift I project (guarantee M529349) (5.8) (5.8)
For Anglo American Platinum’s 33% share of the Eskom connection charges guarantee for the Styldrift I project (guarantee M529350) (13.2) (13.2)
For Anglo American Platinum’s 33% share of the Eskom security guarantee for power supply to the Styldrift I project (14.1) —
Total guarantees received at 31 December (38.7) (24.6)
* During 2017 the bank guarantees issued for RBPlat’s attributable 67% share of the BRPM JV environmental rehabilitation liabilities were replaced with insurance guarantees. The insurance guarantees were issued by the BRPM JV to cover 100% of the BRPM JV environmental rehabilitation liabilities

Royal Bafokeng Platinum Annual Financial Statements 2017 39
22. Contingencies and commitments continued
Group
2017R (million)
2016R (million)
22.3 Capital commitments in respect of property, plant and equipmentCapital commitments relate to the Styldrift I and BRPM Phase III projects
Contracted commitments 969.8 485.3
Approved expenditure not yet contracted for 3 670.5 3 311.3
Total 4 640.3 3 796.6
Thecapitalcommitmentsreflect100%oftheBRPMJVprojectcommitments.IntermsoftheBRPMJVagreement,RBR must fund 67% thereof and RPM the remaining 33%.
Shouldeitherpartyelectnottofunditsshare,itsinterestwillbedilutedaccordingtothetermsoftheBRPMJVagreement.
22.4 Operating commitments Leases Determiningwhetheranarrangementis,orcontains,aleaseisbasedonthesubstanceofthearrangement,and
requiresanassessmentofwhetherfulfilmentofthearrangementisdependentontheuseofaspecificassetorassetsand whether the arrangement conveys the right to control the asset.
Leasesofassetsunderwhichsubstantiallyallthebenefitsandrisksofownershipareeffectivelyretainedbythelessorareclassifiedasoperatingleases.Paymentsmadeunderoperatingleasesareexpensedtoprofitorlossonthestraight-linebasisoverthelifeofthelease.Whenanoperatingleaseisterminatedbeforetheleaseperiodhasexpired,anypayment required to be made by the lessor by way of a penalty is recognised as an expense in the period in which the termination takes place.
TheGroupleasesofficesforitscorporateofficeinJohannesburg.Thecorporateofficeleasetermisfiveyearsandisrenewable at the end of the lease period at market rates. The lease expired at the end of September 2016 and was renewedforafurtherfiveyears.
Minimumleasepaymentsonthecorporateofficeoperatingleasearechargedagainstadministrationexpensesforcorporateofficeonastraight-linebasisovertheleaseterm.
TheGroupleasesdrillandsupportrigsforathree-yearperiodunderanoperatinglease.MinimumleasepaymentsonthedrillandsupportrigsleasearechargedagainstmaterialandotherminingcostsfortheBRPMJV.
Group
2017R (million)
2016R (million)
The future aggregate lease payments under our operating leases are as follows:
No later than one year 6.0 4.0
Laterthanoneyearandnolaterthanfiveyears 10.7 10.6
Total 16.7 14.6
22.5 Contingent liability — remediate groundwater and soil pollution TheBRPMJVhasexposuretoremediategroundwaterandsoilpollutionwheretheJVoperates.Theoperationscontinue
to monitor and mitigate impacts if and when they arise. Our groundwater pollution plume model was updated in 2017 to quantify the size and rate of the plume movement. Remediation recommendations are currently being reviewed to determine the 2018 implementation plan.
The ultimate outcome of the matter cannot presently be determined and no liability has been raised in the annual financialstatements.BRPM’swatertreatmentplantreducesourdependenceonMagaliesWater.

40 Royal Bafokeng Platinum Annual Financial Statements 2017
NOTES TO THE CONSOLIDATED ANNUAL FINANCIAL STATEMENTS AND RELATED ACCOUNTING POLICIES CONTINUED
FOR THE YEAR ENDED 31 DECEMBER 2017
23. Trade and other payables Trade payables are recognised initially at fair value and subsequently measured at amortised cost.
ProvisionsarerecognisedwhentheGrouphasapresentlegalorconstructiveobligationasaresultofpastevents,whenitisprobablethatanoutflowofresourcesembodyingeconomicbenefitswillberequiredtosettletheobligationandwhenareliableestimate of the amount of the obligation can be made.
Provisionsaremeasuredusingthebestestimateofexpenditurerequiredtosettletheobligation,i.e.theamountthattheGroupwould rationally pay to settle the obligation or transfer to a third party.
Wheretheeffectofdiscountingismaterial,provisionsarediscountedtoreflectthepresentvalue.Thediscountrateusedisapre-taxratethatreflectscurrentmarketassessmentsofthetimevalueofmoneyand,whereappropriate,therisksspecifictothe obligation. Provisions are not recognised for future operational losses.
FinancialliabilitiesatFVTPLarerecognisedatfairvalueandanysubsequentgainsorlossesarerecognisedinthestatementofcomprehensive income and shown under other income. The forward exchange contracts entered into to pay Euros for equipment importedfromEuropefortheStyldriftIprojectaredesignatedasfinancialliabilitiesheldfortrading(atFVTPL)astheyarenotdesignated as hedges.
Group
2017R (million)
2016R (million)
Trade and other payablesTrade payables 126.3 113.6Payroll accruals and provisions 57.5 45.8Housing project accruals and provisions 45.8 26.1BRPM and Styldrift I accruals and provisions 158.2 117.0Leave pay provisions 138.5 127.0VATpayable 18.6 17.1Forward exchange contracts — 2.7
Total 544.9 449.3
24. RPM payableTheRPMpayableismeasuredatamortisedcostandrepresentstheamountinvestedbyRPMintheBRPMJVatyear-end.
Group
2017R (million)
2016R (million)
Openingbalanceat1January 889.7 760.9Plus:InvestmentsintotheBRPMJV 902.6 601.2Less:DistributionsreceivedfromtheBRPMJV (458.4) (472.4)
Closing balance at 31 December 1 333.9 889.7
25. Revenue Revenueisrecognisedonanaccrualbasisbothwhenitisprobablethattheeconomicbenefitsassociatedwiththetransaction
willflowtotheGroupandwhentheamountoftherevenuecanbemeasuredreliably.
Revenue from the sale of products and services is brought to account when the risks and rewards of ownership transfer and it is bothprobablethattheeconomicbenefitsassociatedwiththetransactionwillflowtotheGroupandtheamountoftherevenuecanbemeasuredreliably,netofvalueaddedtax(VAT)anddiscounts.IntermsoftheGroup’sconcentrateofftakeagreementrevenue is therefore recognised on the delivery of concentrate to RPM.
Intermsoftheagreement,thecommoditypricesusedinthecalculationoftheconcentratepaymentarebasedontheaveragedaily prices for the third month following the month of delivery. Payment is due on the last day of the fourth month following themonthofdelivery.Theadjustmenttothetradedebtorstoreflecttheactualamounttobereceivedforconcentratesoldisrecognised through revenue.
Group
2017R (million)
2016R (million)
RevenueRevenue from concentrate sales — production from BRPM concentrator 3 092.9 2 928.3Revenue from UG2 toll concentrate 401.7 343.7Revaluationofrevenue(prioryearOctober,NovemberandDecemberdeliveriespricesfinalised) 3.9 70.2
Total 3 498.5 3 342.2

Royal Bafokeng Platinum Annual Financial Statements 2017 41
25. Revenue continued Revenue and concentrate trade debtors are fair valued every month following the month of delivery of concentrate to RPM
untilthepriceisfixedinthethirdmonthfollowingdelivery.Thefairvalueadjustmentisrecognisedinrevenue.
ThismeansthatrevenuereflectedforthefinancialyearsaboveincludestherevaluationoftheOctober,NovemberandDecemberdeliveriesofthepreviousyearandthecurrentyear’sOctober,NovemberandDecemberconcentratedeliveriesareremeasuredatyear-endattheaveragepricesforDecember.TherealisedpricesforaspecificfinancialyearwillonlybefinalisedinJanuary,FebruaryandMarchofthefollowingfinancialyearasthepricesfordeliveriesforthelastthreemonthsofthefinancialyeararethenfixed.
Group
2017R (million)
2016R (million)
Revenue per metalPlatinum 1 928.5 2 146.3Palladium 802.5 597.7Rhodium 239.4 140.0Gold 118.4 122.0Nickel 205.3 204.4Other 204.4 131.8
Total revenue 3 498.5 3 342.2
2017
■ Platinum ■ Palladium ■ Gold ■ Rhodium ■ Iridium
55.1%
22.9%
5.9%
3.4%
1.7%1.0%
6.8%
2.2% 1.0%
Revenue contribution 2017
■ Platinum ■ Palladium ■ Gold ■ Rhodium ■ Iridium■ Ruthenium ■ Nickel ■ Copper ■ Cobalt
Revenue contribution 2016
2016
64.1%
17.2%
3.4%
4.9% 1.1%
0.4% 6.5% 2.0%
0.4%
■ Platinum ■ Palladium ■ Gold ■ Rhodium ■ Iridium■ Ruthenium ■ Nickel ■ Copper ■ Cobalt
26. Other income Income is recognised on anaccrualbasiswhenitisbothprobablethattheeconomicbenefitsassociatedwiththetransaction
willflowtotheGroupandtheamountoftherevenuecanbemeasuredreliably.
Levyincomefromhousingassetsisrecognisedonanaccrualbasisasitisinvoicedeverymonthandisclassifiedasotherincomefor the Group.
Foreign currency transactions are translated into the functional currency using the exchange rates prevailing at the dates of the transactions or valuation where the items are remeasured. Foreign exchange gains or losses resulting from the settlement of suchtransactionsandfromthetranslationatyear-endexchangeratesofmonetaryassetsandliabilitiesdenominatedinforeigncurrencies,arerecognisedinotherincome.
The forward exchange contracts and call options entered into to pay Euros for equipment imported from Europe for our Styldrift I project are initially recognised at fair value and subsequent gains or losses are recognised in other income.
Group
2017R (million)
2016R (million)
Other incomeImpala royalty (Group resources mined by Impala Platinum Limited) 85.9 65.7FairvalueadjustmentoftheNedbankequity-linkeddeposit(refertoNote6) 7.8 11.7Levy and other income from housing assets 3.0 2.7Realised and unrealised gains and losses on fair value of forward exchange contracts and call options 22.9 1.3Derivative fair value (refer to Note 19) 19.5 —Net gain on fair value of cash held in money market accounts 8.8 0.9Other income 2.6 5.8
Total 150.5 88.1

42 Royal Bafokeng Platinum Annual Financial Statements 2017
NOTES TO THE CONSOLIDATED ANNUAL FINANCIAL STATEMENTS AND RELATED ACCOUNTING POLICIES CONTINUED
FOR THE YEAR ENDED 31 DECEMBER 2017
26. Other income continued The Impala royalty consists of royalties received from Impala for mining from its 6 and 8 shafts and 20 shaft area. The 6 and
8shaftsroyaltyiscalculatedbyapplyingafactorthatislinkedtotheImpalaRustenburgoperations’grossprofitmarginwithaminimumof5%andamaximumof25%ofrevenue.Impalapaysa17.5%ofrevenueroyaltytotheBRPMJVforthe20shaftarea.
During the year R40.9 million (2016: R35.1 million) royalty income was received for the 6 and 8 shaft areas and R45.0 million (2016: R30.6 million) for the 20 shaft area.
27.Netfinanceincome Interestincomeisrecognisedonatimeproportionbasis,takingaccountoftheprincipaloutstandingandtheeffectiverateover
theperiodofmaturity,whenitisprobablethatsuchincomewillaccruetotheGroup.
Theeffectiveinterestrateforthereceivablefromemployeesforhousingassetsisbasedonamarket-relatedinterestratebasedontheaveragecreditprofileperbandofemployees.
Dividend income is recognised when the right to receive payment is established.
Borrowing costs are charged to interest expense. The effective interest rate for the interest payable on the PIC housing facility isbasedonamarket-relatedinterestratebasedontherateoftherevolvingcreditfacilityavailabletotheGroup.
Group
2017
R (million)2016
R (million)
27.1 Finance income consists of the following:Interest received on environmental trust deposits (refer to Note 6) 4.4 0.9Interest received on investments 97.9 59.8Interest received on employee housing receivable 33.0 26.1Dividend income on investments 2.1 5.0Totalfinanceincome 137.4 91.8
27.2 Finance cost consists of the following:Interest expense (0.2) (0.2)Unwinding of discount on decommissioning and restoration provision (refer to Note 21) (6.2) (7.2)
Interest expense – Convertible bond* (104.6) —
Less: Capitalisation of interest expense – convertible bond (refer to Note 3) 58.7 —
Totalfinancecost (52.3) (7.4)
Netfinanceincome 85.1 84.4
* R42.6 million of the convertible bond interest was paid in 2017
28.(Loss)/profitbeforetax Short-termemployeebenefits Remunerationtoemployeesischargedtoprofitorlossonanongoingbasis.Provisionismadeforaccumulatedleave,incentive
bonusesandothershort-termemployeebenefits.
Terminationbenefits TerminationbenefitsarepayablewhenemploymentisterminatedbytheGroupbeforethenormalretirementdate,orwhenever
anemployeeacceptsvoluntaryredundancyinexchangeforthesebenefits.TheGrouprecognisesterminationbenefitsattheearlier of the following dates: > WhentheGroupcannolongerwithdrawtheofferofthosebenefits > When the entity recognises costs for a restructuring that is within the scope of IAS 37 and involves the payment of termination benefits.
Inthecaseofanoffermadetoencouragevoluntaryredundancy,theterminationbenefitsaremeasuredbasedonthenumberofemployeesexpectedtoaccepttheoffer.Benefitsfallingduemorethan12monthsaftertheendofthereportingdatearediscounted to present value.
Definedcontributionretirementplans Employeebenefitschemesarefundedthroughpaymentstotrustee-administeredfunds,determinedbyperiodicactuarial
calculations.
AdefinedcontributionplanisapensionschemeunderwhichtheGrouppaysfixedcontributionsintoaseparateentity.TheGrouphasnolegalorconstructiveobligationtopayfurthercontributionsifthefunddoesnotholdsufficientassetstopayalltheemployeesthebenefitsrelatingtoemployees’serviceinthecurrentandpriorperiods.
TheGroupoperatesorparticipatesindefinedcontributionretirementplansforitsemployees.ThepensionplansarefundedbypaymentsfromemployeesandbytherelevantGroupcompanies’trustee-administeredfunds,andcontributionstothesefunds are expensed as incurred. The assets of the different plans are held by independently managed trust funds. The funds are governed by the South African Pension Funds Act of 1956.
Bonus provision The Group recognises a provision for bonuses based on a formula that takes into consideration production and safety
performance. The Group recognises a provision when contractually obliged or where there is a past practice that has created a constructive obligation.

Royal Bafokeng Platinum Annual Financial Statements 2017 43
28.(Loss)/profitbeforetaxcontinued Share-based payments TheGroupoperatesanumberofequity-settled,share-basedcompensationplans,underwhichtheentityreceivesservicesfrom
employees as consideration for equity instruments (options) of the Group. The fair value of the employee services received in exchange for the grant of the options is recognised as an expense. The total amount to be expensed is determined by reference to the fair value of the options granted: > includinganymarketperformanceconditions(forexample,anentity’sshareprice) > excludingtheimpactofanyserviceandnon-marketperformancevestingconditions(forexample,profitability,productiontargetsandremaininganemployeeoftheentityoveraspecifiedtimeperiod)
> includingtheimpactofanynon-vestingconditions(forexample,therequirementforemployeestosave).
Non-marketvestingconditionsareincludedinassumptionsaboutthenumberofoptionsthatareexpectedtovest.Thetotalexpenseisrecognisedoverthevestingperiod,whichistheperiodoverwhichallofthespecifiedvestingconditionsaretobesatisfied.Attheendofeachreportingperiod,theentityrevisesitsestimatesofthenumberofoptionsthatareexpectedtovestbasedonthenon-marketvestingconditions.Itrecognisestheimpactoftherevisiontooriginalestimates,ifany,inthestatementofcomprehensiveincome,withacorrespondingadjustmenttoequity.
Critical accounting estimates and assumptions Share-basedpayments TheGrouphasvariousshare-basedpaymentplansinplace.Allshare-basedpaymentschemesaretreatedasequity-settledand
therefore valued on grant date.
Bonus share plan TheCompanyhasestablishedabonusshareplan(BSP)foritsexecutivedirectorsandseniormanagers,whichislinkedtothe
employee’s annual cash bonus. The Remuneration Committee of the Company is responsible for operating the BSP.
FollowingtheannouncementoftheCompany’sannualresults,employeesparticipatingintheBSPareawardedanumberofbonusshares,whichconstituteaspecifiedpercentageoftheemployee’sannualcashbonus(dependentonjobcategory).Suchbonus shares are held on the employee’s behalf by an escrow agent for a period of three years after their award. These bonus shareswillbeforfeitedshouldanemployeeleavebeforethethree-yearperiod.
Sharesissuedintermsofthisschemeareaccountedforasequity-settledshare-basedpayments.
The grant date fair value is based on the closing price the day prior to the Remuneration Committee approval of the awards.
Forfeitable share plan The Company has established a forfeitable share plan (FSP) for its executive directors and senior managers. The FSP is linked
tofutureperformanceoftheCompanyascomparedtoitspeers,utilisingthetotalshareholderreturn(TSR)asameasureofperformance. The Remuneration Committee is responsible for managing the FSP.
EmployeesparticipatingintheFSPareawardedanumberofforfeitableshares,basedontheirlevelandresponsibility.TheRemunerationCommitteedecidestheawardpolicy,whichin2016wasamultipleofTGP.Thesharesareheldinescrowuntiltheyvest.Thesharesvestinequaltranchesonthethird,fourthandfifthanniversaryofaward.Theproportionofsharesthatvest is based on the Company’s performance on the third anniversary. The employee has to stay in the employment of the Companyfortheperiodandtheperformancecriteriahavetobemetforthesharestovest.Onthevestingdate,theemployeereceives shares. The forfeitable shares will be forfeited should an employee leave before the three year period.
Sharesissuedintermsofthisschemeareaccountedforasequity-settledshare-basedpayments.
The grant date fair value is based on the closing price the day prior to the Remuneration Committee approval of the awards.
Forfeitable share plan — retention The Company established a forfeitable share plan — retention (FSP — retention) for its executive directors and senior managers
in 2016. The FSP — retention is linked to future performance of the Company.
EmployeesparticipatingintheFSP—retentionareawardedanumberofforfeitableshares,basedontheirlevelofresponsibility. The Remuneration Committee decides the award policy which in 2016 was a multiple of total group package (TGP). The shares are held in escrow until they vest. The shares vest in one tranche on the third anniversary. The employee has to stay in the employment of the Company for the period and the performance criteria have to be met for the shares to vest.Onthevestingdate,theemployeesreceiveshares.Theforfeitableshares-retentionwillbeforfeitedshouldanemployeeleavebeforethethree-yearperiod.
Sharesissuedintermsofthisschemeareaccountedforasequity-settledshare-basedpayments.
The grant date fair value is based on the closing price the day prior to the Remuneration Committee approval of the awards.
2010 share option plan Certain directors and senior managers of the Company (including all of the current executives of the Company) have been
grantedoptionstoacquireshares.Theoptionsweregrantedataninitialprice,whichislinkedtotheJ153PlatinumIndexwhenhired.Thestrikepriceoftheoptionswasadjustedonthelistingoftheholdingcompany,RBPlat,inaccordancewithaspecifiedformulaandwaslinkedtoRBPlat’sshareprice.PostRBPlat’slisting,shareoptionsaregrantedattheRBPlatsharepriceondateof grant. The fair value of options granted is determined using the binomial model. The volatility is measured based on the RBPlatshareprice.Theshareoptionsvestfromyearsthreetofivefromwhentheyweregrantedinthreeequaltranches.

44 Royal Bafokeng Platinum Annual Financial Statements 2017
NOTES TO THE CONSOLIDATED ANNUAL FINANCIAL STATEMENTS AND RELATED ACCOUNTING POLICIES CONTINUED
FOR THE YEAR ENDED 31 DECEMBER 2017
28. (Loss)/profitbeforetaxcontinued Share-based payments continued Initial public offering bonus shares
The Company invited each of the executive directors and certain other employees of the Company to participate in the share offeronlisting,onthebasisthatforeachsharethattheysubscribefor,theCompanywillissuethemwithanadditionalsharefree of charge (with the Company paying for the par value of such shares). The additional shares issued by the Company vested 18monthsafterthelisting.Themaximumnumberofsharesforwhicheachdirectorandemployeecouldsubscribetobenefitfromthisschemewaslimitedbasedonthespecificjobgrade.
Thevalueofthevariousshare-basedpaymentschemeswascalculatedusingthefollowinginputs:
Bonus share plan
2017 2016 2015 2014 2013 2012 2011
Weighted average share price on grant date (R) 41.65 38.79 56.70 64.90 58.50 57.99 64.12
Vestingyears 2020 2019 2018 2017 2016 2015 2014
Forfeitable share plan
2017 2016 2015 2014 2013 2012 2011
Weighted average share price on grant date (R) 41.65 38.79 56.70 71.90 — — —
Vestingyears 2020 to 2022 2019 to 2021 2018 to 2020 2017 to 2019 — — —
Forfeitable share plan — retention
2017 2016 2015 2014 2013 2012 2011
Weighted average share price on grant date (R) 38.79 38.79 — — — — —
Vestingyears 2020 2019 — — — — —
Rights offer
2017 2016 2015 2014 2013 2012 2011
Weighted average share price on grant date (R) — — — 55.00 55.00 55.00 —
Vestingyears — — — 2017 2016 2015 —

Royal Bafokeng Platinum Annual Financial Statements 2017 45
28. (Loss)/profitbeforetaxcontinuedShare-based payments continuedInitial public offering bonus shares continued
2010 share option plan
2017 2016 2015 2014 2013 2012 2011
Weighted average option value on grant date (R) 17.33 19.69 20.91 37.10 37.41 29.07 —
Weighted average share price on grant date (R) 36.17 39.44 44.23 66.83 57.61 57.47 —
Weighted average exercise price (R) 36.17 39.44 44.23 66.83 57.61 57.47 —
Volatility(%) 34.26 to 34.51 30.76 to 34.25 26.54 to 28.55 26.22 to 26.73 47.2 to 57.61 49.5 to 47.8 —
Dividend yield — — — — — — —
Risk-freeinterestrate (%) 7.76 to 7.98 8.13 to 9.79 6.58 to 7.81 7.11 to 8.31 6.08 to 8.51 7.18 to 8.01 —
Vestingyears 2020 to 2022 2019 to 2021 2018 to 2020 2017 to 2019 2016 to 2018 2015 to 2017 2014 to 2016
The expected price volatility is (based on the historic volatility taking into account the remaining life of the options) adjusted for any expected changes to future volatility due to publicly available information.
Initial public
offering bonus shares
Weighted average option value on grant date (R) 64.90
Weighted average share price on grant date (R) 64.90
Volatility(%) 47.90
Dividend yield —
Risk-freeinterestrate(%) 7.52
Vestingyears 8 May 2012
Refer to Note 33 for outstanding shares.

46 Royal Bafokeng Platinum Annual Financial Statements 2017
NOTES TO THE CONSOLIDATED ANNUAL FINANCIAL STATEMENTS AND RELATED ACCOUNTING POLICIES CONTINUED
FOR THE YEAR ENDED 31 DECEMBER 2017
28. (Loss)/profitbeforetaxcontinued Share-based payments continuedActivity on awards outstanding
Forfeitable share plan retention Forfeitable share plan
Number of shares
Weighted average
award price
RNumber
of shares
Weighted average
award price
R
For the year ended 31 December 2017
At1January2017 1 153 147 38.79 1 130 370 49.22
Granted 1 230 137* 38.79 843 541* 41.65
Forfeited — — — —
Exercised/vested — — (66 879) 71.91
Expired — — — —
At 31 December 2017 2 383 284 38.79 1 907 032 45.08
For the year ended 31 December 2016
At1January2016 — — 488 013 62.95
Granted 1 153 147 38.79 642 357 38.79
Forfeited — — — —
Exercised/vested — — — —
Expired — — — —
At 31 December 2016 1 153 147 38.79 1 130 370 49.22
Activity on awards outstanding
2010 share option plan Bonus share plan
Number of options
Weighted average
option price
RNumber of
shares
Weighted average
award price
R
For the year ended 31 December 2017
At1January2017 6 588 587 50.28 919 671 55.23
Granted 724 026 36.17 610 619* 41.65
Forfeited (407 577) 41.80 (13 206) 55.64
Exercised/vested (316 981) 57.44 (360 506) 56.24
Expired — — — —
At 31 December 2017 6 588 055 49.02 1 156 578 47.74
For the year ended 31 December 2016
At1January2016 5 031 262 56.35 1 333 397 59.72
Granted 1 895 514 38.75 69 019 38.79
Forfeited (257 839) 46.48 (31 255) 55.04
Exercised/vested (80 350) 36.30 (451 490) 58.59
Expired — — — —
At 31 December 2016 6 588 587 50.28 919 671 55.23
* During the year, 2 684 297 ordinary shares were awarded as part of the Company’s employee incentive schemes. These shares will only be issued following shareholder approval of the amended and new employee share scheme rules and revised scheme share limits as noted in the notice of the AGM

Royal Bafokeng Platinum Annual Financial Statements 2017 47
28. (Loss)/profitbeforetaxcontinued Group
2017R (million)
2016R (million)
Includedintheprofitbeforetaxarethefollowingitems:On-minecosts: > Labour* 1 077.5 1 072.4 > Utilities 264.9 252.5 > Contractor costs 791.8 701.6 > Movement in inventories (20.5) (14.1) > Materials and other mining costs 636.0 695.8
MaterialsandotherminingcostsforBRPMJV 681.0 738.2Elimination of intergroup management fee (45.0) (42.4)
State royalties 13.4 12.4Depreciation—property,plantandequipment 318.5 275.3Amortisation — mineral rights 42.8 36.7Share-basedpaymentexpense 21.1 27.4Social and labour plan expenditure 35.4 35.6Other 5.6 5.9Total cost of sales 3 186.5 3 101.5Includedincorporateofficeadministrativeexpenses:Advisory fees 11.1 9.7Legal fees 3.6 2.3Employee costs** (including directors’ remuneration) 100.9 76.4Mahube Trust expenditure 0.4 0.6DepreciationofRBPMSproperty,plantandequipment 1.4 1.6Revolving credit facility and working capital facility commitment fees 5.3 7.2Fees for guarantees 2.8 2.4Share-basedpaymentexpense 31.2 17.7Industry membership contributions 7.6 7.1Rentandmaintenanceforcorporateoffice 3.3 2.9Cost relating to Maseve acquisition 8.9 —Other 12.9 10.5Totalcorporateofficeadministrativeexpenses 189.4 138.4Includedinhousingprojectadministrativeexpenses:Legal fees 0.9 1.3Propertyratesandtaxes,andwaterandelectricity 0.4 3.0Security 2.9 2.3Maintenance 3.4 0.7DepreciationofRBRPproperty,plantandequipment 0.3 0.2Amortisationofemployeehousingbenefitandfairvalueadjustmenttoloan 2.9 2.7Insurance expenditure 0.9 1.2Salaries and wages 5.1 2.5Other 1.0 3.3Totalhousingprojectadministrativeexpenses 17.8 17.2Restructuring costs 49.0 —ExternalandinternalauditfeesfortheGroupExternalandinternalauditfeesincludedinprofitbeforetax:External audit fees > Fees for audit 2.0 1.7 > Other services 0.4 0.1Totalexternalauditfees 2.4 1.8Internal audit fees > Fees for internal audit 3.2 2.4 > Other services 0.3 1.0
Total internal audit fees 3.5 3.4* Included in labour costs are pension and provident fund contributions of R75.2 million (2016: R74.7 million)** Included in corporate office employee costs are provident fund contributions of R5.0 million (2016: R4.4 million)
Significantjudgementisrequiredindeterminingtheprovisionforminingroyalties.Theseincludemanytransactionsandcalculations for which the ultimate mining royalties determination is uncertain during the ordinary course of business. Where the finaloutcomeisdifferentfromtheamountsinitiallyrecorded,suchdifferenceswillimpacttheminingroyalties,incometaxanddeferred tax provision in the period in which such determinations are made.

48 Royal Bafokeng Platinum Annual Financial Statements 2017
NOTES TO THE CONSOLIDATED ANNUAL FINANCIAL STATEMENTS AND RELATED ACCOUNTING POLICIES CONTINUED
FOR THE YEAR ENDED 31 DECEMBER 2017
29.Impairmentofnon-financialassets The impairment charge is made up as follows:
Group
2017R (million)
2016R (million)
Impairmentofnon-financialassetsImpairment of goodwill (refer to Note 5) 863.3 —Impairmentofemployeehousingreceivableandbenefit(refertoNotes7and8) 1.0 0.8Impairmentofproperty,plantandequipment(refertoNote3) — 1.8
Total gross impairment 864.3 2.6Less: Tax effect — (0.5)Less:Non-controllinginterest — (0.4)Net impairment 864.3 1.7
WiththelistingoftheCompanyin2010theproperty,plantandequipmentandmineralrightswerefairvaluedandgoodwillwasrecognisedforRBR’s67%interestintheBRPMJVforeachcash-generatingunitundertheBRPMJV,beingtheBRPMoperationsandStyldrift.Nogoodwillwasattributedtonon-controllinginterest.
Thecash-generatingunitswithintheBRPMJVandtheremaininggoodwillallocatedtoeachofthesecash-generatingunitswereassessedforimpairmentbycomparingtherespectiverecoverableamountstothecarryingamountsforeachcash-generatingunit.The recoverable amount for BRPM is R4.6 billion (2016: R5.2 billion). The recoverable amount for Styldrift is R10.7 billion (2016: R10.8 billion). Refer to Note 5 for impairment allocation. The recoverable amounts have been determined on a fair value less costs tosellbasis.Thisisafairvaluemeasurementclassifiedaslevel3.
30.Incometax(expense)/credit Currenttaxcomprisestaxpayablecalculatedonthebasisoftheexpectedtaxableincomefortheyear,usingthetaxrates
enactedatthestatementoffinancialpositiondate,andanyadjustmentoftaxpayableforpreviousyears.
Critical estimates and assumptions Significantjudgementisrequiredindeterminingtheprovisionforincometaxes.Therearemanytransactionsandcalculations
forwhichtheultimatetaxdeterminationisuncertainduringtheordinarycourseofbusiness.Wherethefinaltaxoutcomeisdifferentfromtheamountsthatwereinitiallyrecorded,suchdifferenceswillimpacttheincomeanddeferredtaxprovisionsin the period in which such determinations are made.
Group
2017R (million)
2016(restated)R (million)
Incometax(expense)/creditIncome tax expense (31.5) (24.7)
Current year (31.7) (24.7)Prior year 0.2 —
Deferred tax (expense)/credit (52.6) 32.4Current year (53.5) 30.8Prior year 0.9 1.6
Totalincometax(expense)/credit (84.1) 7.7Taxratereconciliation:(Loss)/profitbeforetax (572.9) 255.0Tax expense calculated at a tax rate of 28% (2016: 28%) 160.4 (71.4)Non-taxableincome—dividends 0.6 1.4Non-taxableincome—other 1.1 8.9TaxonBRPMJV—NCIshare 9.2 7.4Non-deductibleexpenses—impairmentofgoodwill (241.7) —Non-deductibleexpenses—legalandadvisoryfees (3.6) —Non-deductibleexpenses—other (0.6) (0.3)Capital gains tax (0.8) —Tax losses not recognised (9.8) (6.7)Prior year adjustments 1.1 (1.6)Housing contribution net tax credit — 70.0
(84.1) 7.7Effectivetaxrate(%) 14.7 3.0
An unredeemed capital allowance of R2 963 million (2016: R2 225 million) is carried forward to 2018.

Royal Bafokeng Platinum Annual Financial Statements 2017 49
Group
2017R (million)
2016R (million)
31. Cash generated by operationsCash generated by operations is calculated as follows:(Loss)/profitbeforetax (572.9) 255.0Adjustment for:Depreciationofproperty,plantandequipment 320.2 277.1Amortisation of mineral rights 42.8 36.7Amortisationofemployeehousingbenefitandfairvalueadjustmenttoloan 2.8 2.7Impairmentofnon-financialassets 864.3 2.6Share-basedpaymentexpense 64.6 45.1Change in estimate of restoration provision taken to the statement of comprehensive income 7.3 (1.4)Unrealised gains on fair value of forward exchange contracts and call options — 12.2Fair value adjustment — housing insurance investment (0.7) (1.1)Fair value adjustment — environmental guarantee investments (0.1) (0.3)Revaluation of derivative (refer to Note 26) (19.5) —Equity-linkedreturnonBRPMenvironmentaltrustdeposits (7.8) (11.7)Profitonsaleofproperty,plantandequipmentandotherassets (1.8) (6.9)Finance cost 52.3 7.4Finance income (137.4) (91.8)
614.1 525.6Changes in working capital (44.6) 3.2Increase in inventories (26.2) (24.3)Increase in trade and other receivables* (99.4) (34.1)Increase in trade and other payables 81.0 61.6
Cash generated by operations 569.5 528.8
* Excludes Styldrift I on-reef development revenue receivable of R264.6 million (2016: R143.9 million) and the Maseve deposit of R41.4 million
32. Related party transactions TheGroupiscontrolledbyRoyalBafokengPlatinumHoldingsProprietaryLimited(incorporatedinSouthAfrica),whichowns
51.74% of RBPlat’s shares. RPM owns 11.44% of RBPlat’s shares and the remaining 36.82% is widely held.
RBR,awhollyownedsubsidiaryofRBPlat,ownsa67%participationinterestintheBRPMJVandRPMholdstheremaining33%participation interest. The Group’s ultimate parent is Royal Bafokeng Holdings Proprietary Limited (RBH). RBH is an investment holding company with a large number of subsidiaries and is incorporated in South Africa.
Investments in subsidiariesandtheBRPMJVandthedegreeofcontrolexercisedbytheCompanyare:
Issued capital amount Interest in capital
2017
R2016
R2017
%2016
%
Related partiesDirect investmentRoyal Bafokeng Platinum Management Services Proprietary Limited (RBP MS) 1 000 1 000 100 100 Royal Bafokeng Resources Proprietary Limited (RBR) 320 320 100 100Indirect investment via RBRBafokeng Rasimone Management Services Proprietary Limited (BRMS) 1 000 1 000 100 100 BRPMUnincorporatedJointVenture—participationinterest — — 67 67 Royal Bafokeng Resources Properties (RF) Proprietary Limited (RBRP) previously Friedshelf 1408 (RF) Proprietary Limited 100 100 100 100
TransactionsbetweentheCompany,itssubsidiariesandjointventureareeliminatedonconsolidation.RefertoNote22forrelated party guarantees.
RBRandRPMcontribute67%and33%respectivelyofcashcallsissuedbytheBRPMJV.TheBRPMJVreceivesroyaltyincomefromImpala Platinum Limited (as detailed in Note 26) and acquires mining supplies and services from various RBH subsidiaries and associates.TheBRPMJVandcorporateofficemakeuseofthe Royal Marang Hotel for accommodation and conferences.

50 Royal Bafokeng Platinum Annual Financial Statements 2017
NOTES TO THE CONSOLIDATED ANNUAL FINANCIAL STATEMENTS AND RELATED ACCOUNTING POLICIES CONTINUED
FOR THE YEAR ENDED 31 DECEMBER 2017
32. Related party transactions continued The following transactions were carried out with related parties:
Group
2017R (million)
2016R (million)
Related party transactionsBRPM JV balances at 31 December: Amount owing by RPM for concentrate sales (refer to Note 12) 1 500.9 1 313.0Amount owing to RPM for contribution to BRPM (refer to Note 36) 1 495.2 1 051.0
BRPM JV transactions: Concentrate sales to RPM (refer to Note 3 and Note 25) 4 070.3 3 705.5
Associate of holding company (RBH) balances at 31 December: Amount owing by Impala Platinum Limited for the fourth quarter royalty (refer to Note 12) 24.5 22.2
Fellow subsidiary and associates of holding company (RBH) transactions: FraserAlexanderforrentalofminingequipment,maintenanceoftailingsdamandoperation of sewage plant (a subsidiary of RBH) 11.4 8.4Impala Platinum Limited for royalties received (an associate of RBH) (refer to Note 26 and Directors’ report) 85.9 65.7Geoserve Exploration Drilling Company for exploration drilling on Boschkoppie and Styldrift (a subsidiary of RBH) 9.5 3.4Trident South Africa Proprietary Limited for steel supplies (a subsidiary of RBH) 1.1 4.4Mtech Industrial for supply and installation of heat pumps (a subsidiary of RBH) 0.2 0.4The MSA Group for consulting services 0.1 0.4Royal Marang Hotel for accommodation and conferences (a subsidiary of RBH) 0.6 0.6Praxima Holding for payroll administration fees (an associate of RBH) 0.1 0.1Feespaidtonon-executivedirectors(RBH/MOGS) 0.8 0.7
Directors,otherexecutivesandprescribedofficers’remuneration Detailsrelatingtokeymanagementremuneration(prescribedofficers),shareoptionsandshareholdingsintheCompanyare
disclosed in Note 33.
33. Remuneration 33.1 Directors, otherexecutivesandprescribedofficers’remuneration
Directors’ remuneration and related payments for 2017
Date appointed
Directors’fees
R
Basic salary
R
Retirement benefits
R
Other benefits
R
Discre-tionary perfor-mance
bonusesR
Retentionbonus
RTotal
R
2017ExecutivedirectorsSteve Phiri 1 Apr ’10 — 4 250 625 952 419 114 828 3 808 476 5 997 600 15 123 948Martin Prinsloo 1Mar’09 — 3 257 112 296 427 212 856 2 597 000 4 200 000 10 563 395Non-executivedirectors*Linda de Beer 1Jun’10 654 998 — — — — — 654 998Robin Mills 20Sep’10 592 322 — — — — — 592 322Mark Moffett 22Sep’14 459 024 — — — — — 459 024ThokoMokgosi-Mwantembe 5Nov’14 558 476 — — — — — 558 476Kgomotso Moroka 1Jun’10 1 363 215 — — — — — 1 363 215VelileNhlapo**# 24Nov’15 425 571 — — — — — 425 571Mike Rogers 7Dec’09 675 876 — — — — — 675 876Louisa Stephens 22Sep’14 531 948 — — — — — 531 948David Wilson** 29Apr’14 412 600 — — — — — 412 600
Total 5 674 030 7 507 737 1 248 846 327 684 6 405 476 10 197 600 31 361 373* Non-executive director fees are paid on a quarterly basis and their fees accrued for the year were approved at the Annual General
Meeting held on 12 April 2017 ** Fees paid to Royal Bafokeng Holdings Proprietary Limited (David Wilson and Velile Nhlapo). Refer to Note 32# Resigned on 9 November 2017

Royal Bafokeng Platinum Annual Financial Statements 2017 51
33. Remuneration continued 33.1 Directors, otherexecutivesandprescribedofficers’remunerationcontinued
Directors’ remuneration and related payments for 2016
Date appointed
Directors’fees
R
Basic salary
R
Retirement benefits
R
Other benefits
R
Discre-tionary perfor-mance
bonusesR
TotalR
2016
ExecutivedirectorsSteve Phiri 1 Apr ’10 — 3 988 154 899 640 110 206 — 4 998 000
Martin Prinsloo 1 Mar ’09 — 3 059 829 280 000 160 171 — 3 500 000
Non-executivedirectors*Linda de Beer 1Jun’10 604 674 — — — — 604 674
Robin Mills 20 Sep ’10 541 618 — — — — 541 618
Mark Moffett 22 Sep ’14 415 558 — — — — 415 558
ThokoMokgosi-Mwantembe 5 Nov ’14 540 922 — — — — 540 922
Kgomotso Moroka 1Jun’10 1 333 217 — — — — 1 333 217
VelileNhlapo** 24 Nov ’15 321 785 — — — — 321 785
Mike Rogers 7 Dec ’09 573 332 — — — — 573 332
Louisa Stephens 22 Sep ’14 431 558 — — — — 431 558
David Wilson** 29 Apr ’14 390 480 — — — — 390 480
Total 5 153 144 7 047 983 1 179 640 270 377 — 13 651 144
* Non-executive director fees are paid on a quarterly basis and their fees accrued for the year were approved at the Annual General Meeting held on 13 April 2016
** Fees paid to Royal Bafokeng Holdings Proprietary Limited (David Wilson and Velile Nhlapo). Refer to Note 32

52 Royal Bafokeng Platinum Annual Financial Statements 2017
NOTES TO THE CONSOLIDATED ANNUAL FINANCIAL STATEMENTS AND RELATED ACCOUNTING POLICIES CONTINUED
FOR THE YEAR ENDED 31 DECEMBER 2017
33. Remuneration continued 33.1 Directors, otherexecutivesandprescribedofficers’remunerationcontinued
Otherexecutivesandprescribedofficers’remunerationandrelatedpaymentsfor2017
Date appointed
Basic salary
R
Retirement benefits
R
Other benefits
R
Discre-tionary perfor-mance
bonusesR
Under-ground market
premiumR
Retentionbonus
RTotal
R
2017
OtherexecutivesandprescribedofficersNeil Carr 1 Dec ’10 2 858 079 611 909 203 304 2 590 800 — 3 400 000 9 664 092
Reginald Haman 1Oct’12 2 398 612 294 853 102 473 2 002 354 — 2 102 209 6 900 501
Glenn Harris 4Jan’10 3 040 998 394 734 97 716 2 606 878 182 185 3 312 425 9 634 936
Mpueleng Pooe 1Oct’13 2 194 002 197 124 85 343 1 610 636 — 1 396 505 5 483 610
VickyTlhabanelo 1Apr’10 2 164 698 481 649 42 960 1 925 988 — 1 516 526 6 131 821
Lindiwe Montshiwagae 1Jun’10 1 724 404 139 812 202 719 1 182 286 — 904 816 4 154 037
Total 14 380 793 2 120 081 734 515 11 918 942 182 185 12 632 481 41 968 997
Otherexecutivesandprescribedofficers’remunerationandrelatedpaymentsfor2016
Date appointed
Basic salary
R
Retirement benefits
R
Other benefits
R
Discre-tionary perfor-mance
bonuses*R
Under-ground market
premiumR
TotalR
2016
OtherexecutivesandprescribedofficersNeil Carr 1 Dec ’10 2 681 795 578 000 140 205 — — 3 400 000
Reginald Haman 1 Oct ’12 2 341 984 183 943 101 833 — — 2 627 760
Glenn Harris 4Jan’10 2 862 720 370 992 78 720 — 171 227 3 483 659
Mpueleng Pooe 1 Oct ’13 2 070 811 186 201 70 496 — — 2 327 508
VickyTlhabanelo 1 Apr ’10 2 035 283 454 958 37 302 — — 2 527 543
Lindiwe Montshiwagae** 1Jun’10 1 400 069 115 587 135 582 — — 1 651 238
Total 13 392 662 1 889 681 564 138 — 171 227 16 017 708
* No discretionary performance bonuses were paid in 2016** Appointed to RBPlat Exco on 1 August 2016

Royal Bafokeng Platinum Annual Financial Statements 2017 53
33. Remuneration continued 33.1 Directors, otherexecutivesandprescribedofficers’remunerationcontinued
33.1.1 Share options awarded to directors and senior management
Share options
awarded*Award
date
Strike price
R
Award value
R Vesting dates
Vested to date
%
Share options
exercised
Balanceof shareoptions
As at 31 December 2017Executiveandnon-executivedirectorsSteve Phiri 297 521 1Apr’10 60.50 18 000 021 1Apr’13,’14,’15 100 — 297 521
Martin Prinsloo 241 047 1Mar’09 36.30 8 750 006 1Mar’12,’13,’14 100 80 350** 160 697
OtherexecutivesandprescribedofficersVickyTlhabanelo 121 288 1Apr’10 60.50 7 337 924 1Apr’13,’14,’15 100 — 121 288
Glenn Harris 87 789 4Jan’10 60.50 5 311 235 4Jan’13,’14,’15 100 — 87 789
Neil Carr 116 030 1Dec’10 65.50 7 599 965 1Dec’13,’14,’15 100 — 116 030
Reginald Haman 163 599 1Oct’12 48.90 7 999 991 1Oct’15,’16,’17 100 — 163 599
Mpueleng Pooe 136 770 1Oct’13 61.42 8 400 413 1Oct’16,’17,’18 67 — 136 770
Lindiwe Montshiwagae 39 753 1Jun’10 59.74 2 374 844 1Jun’13,’14,’15 100 — 39 753
LesterJooste(CompanySecretary) 40 756 1Jul’10 55.21 2 250 139 1Jul’13,’14,’15 100 — 40 756* Share options are issued to eligible employees at the date of joining the Company at the applicable market valuation or
market share price** The share options were exercised on 2 August 2016 at a market price of R52.61
33.1.2 Forfeitablebonussharesandrightsoffersharesawardedtodirectors,otherexecutivesandprescribedofficers
Forfeitable share plan
— retentionForfeitable share plan
Bonus share plan
Award date
Issue priceR
Award value
RVesting
dates
Vesting amount
%
As at 31 December 2017Executiveandnon-executivedirectorsSteve Phiri 33 054 1Apr’15 56.70 1 874 162 1Apr’18 100
45 720 1Apr’17 41.65 1 904 238 1Apr’20 100
37 629 1Apr’14 71.91 4 058 8161Apr’17,
18, 19 33.3*
75 808 1Apr’15 56.70 4 298 3141Apr’18,
19, 20 33.3*
162 435 1Apr’16 38.79 6 300 8541Apr’19,
20, 21 33.3*
165 984 1Apr’17 41.65 6 913 234 1Apr’20,21, 22
33.3*
183 119 1Apr’16 38.79 7 103 186 1Apr’19 100
183 119 1Apr’17 38.79 7 103 186 1Apr’20 100
Martin Prinsloo 24 268 1Apr’15 56.70 1 375 996 1Apr’18 100
31 176 1Apr’17 41.65 1 298 500 1Apr’20 100
19 817 1Apr’14 71.91 2 137 5251Apr’17,
18, 19 33.3*
40 124 1Apr’15 56.70 2 275 0311Apr’18,
19, 20 33.3*
113 750 1Apr’16 38.79 4 412 3631Apr’19,
20, 21 33.3*
116 236 1Apr’17 41.65 4 841 200 1Apr’20,21, 22
33.3*
128 235 1Apr’16 38.79 4 974 236 1Apr’19 100
128 235 1Apr’17 38.79 4 974 236 1Apr’20 100
* 33% over a period of three years
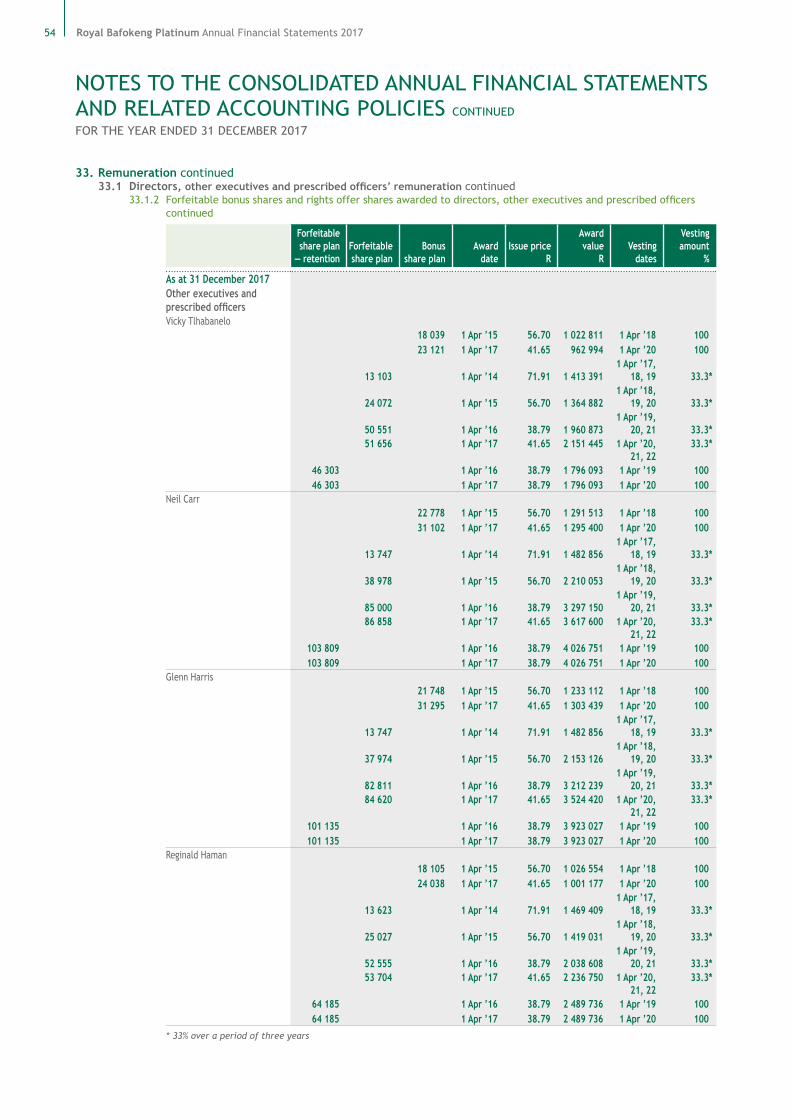
54 Royal Bafokeng Platinum Annual Financial Statements 2017
NOTES TO THE CONSOLIDATED ANNUAL FINANCIAL STATEMENTS AND RELATED ACCOUNTING POLICIES CONTINUED
FOR THE YEAR ENDED 31 DECEMBER 2017
33. Remuneration continued 33.1 Directors, otherexecutivesandprescribedofficers’remunerationcontinued
33.1.2 Forfeitablebonussharesandrightsoffersharesawardedtodirectors,otherexecutivesandprescribedofficerscontinued
Forfeitable share plan
— retentionForfeitable share plan
Bonus share plan
Award date
Issue priceR
Award value
RVesting
dates
Vesting amount
%
As at 31 December 2017OtherexecutivesandprescribedofficersVickyTlhabanelo
18 039 1Apr’15 56.70 1 022 811 1Apr’18 10023 121 1Apr’17 41.65 962 994 1Apr’20 100
13 103 1Apr’14 71.91 1 413 3911Apr’17,
18, 19 33.3*
24 072 1Apr’15 56.70 1 364 8821Apr’18,
19, 20 33.3*
50 551 1Apr’16 38.79 1 960 8731Apr’19,
20, 21 33.3*51 656 1Apr’17 41.65 2 151 445 1Apr’20,
21, 2233.3*
46 303 1Apr’16 38.79 1 796 093 1Apr’19 10046 303 1Apr’17 38.79 1 796 093 1Apr’20 100
Neil Carr22 778 1Apr’15 56.70 1 291 513 1Apr’18 10031 102 1Apr’17 41.65 1 295 400 1Apr’20 100
13 747 1Apr’14 71.91 1 482 8561Apr’17,
18, 19 33.3*
38 978 1Apr’15 56.70 2 210 0531Apr’18,
19, 20 33.3*
85 000 1Apr’16 38.79 3 297 1501Apr’19,
20, 21 33.3*86 858 1Apr’17 41.65 3 617 600 1Apr’20,
21, 2233.3*
103 809 1Apr’16 38.79 4 026 751 1Apr’19 100103 809 1Apr’17 38.79 4 026 751 1Apr’20 100
Glenn Harris21 748 1Apr’15 56.70 1 233 112 1Apr’18 10031 295 1Apr’17 41.65 1 303 439 1Apr’20 100
13 747 1Apr’14 71.91 1 482 8561Apr’17,
18, 19 33.3*
37 974 1Apr’15 56.70 2 153 1261Apr’18,
19, 20 33.3*
82 811 1Apr’16 38.79 3 212 2391Apr’19,
20, 21 33.3*84 620 1Apr’17 41.65 3 524 420 1Apr’20,
21, 2233.3*
101 135 1Apr’16 38.79 3 923 027 1Apr’19 100101 135 1Apr’17 38.79 3 923 027 1Apr’20 100
Reginald Haman18 105 1Apr’15 56.70 1 026 554 1Apr’18 10024 038 1Apr’17 41.65 1 001 177 1Apr’20 100
13 623 1Apr’14 71.91 1 469 4091Apr’17,
18, 19 33.3*
25 027 1Apr’15 56.70 1 419 0311Apr’18,
19, 20 33.3*
52 555 1Apr’16 38.79 2 038 6081Apr’19,
20, 21 33.3*53 704 1Apr’17 41.65 2 236 750 1Apr’20,
21, 2233.3*
64 185 1Apr’16 38.79 2 489 736 1Apr’19 10064 185 1Apr’17 38.79 2 489 736 1Apr’20 100
* 33% over a period of three years

Royal Bafokeng Platinum Annual Financial Statements 2017 55
33. Remuneration continued 33.1 Directors, otherexecutivesandprescribedofficers’remunerationcontinued
33.1.2 Forfeitablebonussharesandrightsoffersharesawardedtodirectors,otherexecutivesandprescribedofficerscontinued
Forfeitable share plan
— retentionForfeitable share plan
Bonus share plan
Award date
Issue priceR
Award value
RVesting
dates
Vesting amount
%
As at 31 December 2017OtherexecutivesandprescribedofficersMpueleng Pooe 14 556 1Apr’15 56.70 825 325 1Apr’18 100
19 335 1Apr’17 41.65 805 308 1Apr’20 100
11 649 1Apr’14 71.91 1 256 5551Apr’17,
18, 19 33.3*
22 167 1Apr’15 56.70 1 256 8691Apr’18,
19, 20 33.3*
46 550 1Apr’16 38.79 1 805 6751Apr’19,
20, 21 33.3*47 568 1Apr’17 41.65 1 981 175 1Apr’20,
21, 2233.3*
42 638 1Apr’16 38.79 1 653 928 1Apr’19 10042 638 1Apr’17 38.79 1 653 928 1Apr’20 100
Lindiwe Montshiwagae12 962 1Apr’15 56.70 734 945 1Apr’18 10014 193 1Apr’17 41.65 591 143 1Apr’20 100
37 844 1Apr’17 41.65 1 576 194 1Apr’20,21, 22
33.3*
27 626 1Apr’16 38.79 1 071 613 1Apr’19 10027 626 1Apr’17 38.79 1 071 613 1Apr’20 100
LesterJooste (Company Secretary)
12 890 1Apr’15 56.70 730 863 1Apr’18 10020 805 1Apr’17 41.65 866 516 1Apr’20 100
28 145 1Apr’16 38.79 1 091 745 1Apr’19 10028 145 1Apr’17 38.79 1 091 745 1Apr’20 100
* 33% over a period of three years

56 Royal Bafokeng Platinum Annual Financial Statements 2017
NOTES TO THE CONSOLIDATED ANNUAL FINANCIAL STATEMENTS AND RELATED ACCOUNTING POLICIES CONTINUED
FOR THE YEAR ENDED 31 DECEMBER 2017
33. Remuneration continued 33.1 Directors, otherexecutivesandprescribedofficers’remunerationcontinued
33.1.3 IPOschemesharesawardedtodirectors,otherexecutivesandprescribedofficers
Executive directors Otherexecutivesandprescribedofficers
Steven Phiri
Martin Prinsloo
VickyTlhabanelo
Glenn Harris
LesterJooste (Company secretary)
As of 31 December 2017IPO scheme shares matched by the Company 99 174 76 272 27 273 31 405 11 901Award date 8Nov’10 8Nov’10 8Nov’10 8Nov’10 8Nov’10Deemed issue price (Rand) 60.50 60.50 60.50 60.50 60.50Rights offer shares (Rand) 12 165 10 615 3 546 — 1 841Issue price (Rand) 55.00 55.00 55.00 55.00 55.00Award values (Rand) 6 669 102 5 198 281 1 845 047 1 900 003 821 266Shares sold 2013 (number of shares) 25 000 10 000 11 300 31 405 1 350Shares sold 2014 (number of shares) — 13 724 — — —Shares sold 2015 (number of shares) — 10 000 — — —Shares sold 2016 (number of shares) — — — — —Shares sold 2017 (number of shares) 28 894 — — — —Balance of shares 57 445 53 163 19 519 — 12 392Value of balance of shares (Rand) 3 408 515 3 157 979 1 161 397 — 739 591
33.2 Group incentive share scheme Total Group share incentive scheme shares issued to date
Opening balance
Cumulative closing
balance
Deemed strike price
R Issue dates
Vested/exercised
and forfeited (cumulative)
Vestingdates
Vesting%
IPO scheme shares 417 416 417 416 60.50 8 Nov ’10 417 416 8 May ’12 100Share options issued to date 5 031 262 6 588 055 * * 1 556 793** *
33.3 over three years
Bonus scheme shares2009 allocation — 55 589 57.48 3 Dec ’09 55 589 3 Dec ’12 1002010 allocations — BSP 55 589 133 432 65.00 1 Dec ’10 77 843 1 Dec ’13 100
2011 allocations — BSP 133 432 463 953 66.9218 Feb ’11 and
1 Apr ’11 330 521 18 Feb ’14 and
1 Apr ’14 1002012 allocations — BSP 463 953 888 938 57.99 1 Apr ’12 424 985 1 Apr ’15 1002013 allocations — BSP 888 958 1 423 314 58.50 1 Apr ’13 534 376 1 Apr ’16 1002014 allocations — BSP 1 423 314 1 778 970 71.91 1 Apr ’14 25 633 1 Apr ’17 1002014 allocations — FSP 1 778 970 2 014 165 71.91 1 Apr ’14 34 525 1Apr’17,
18,1933.3 over
three years2014 share issues*** 2 014 165 2 398 382 — — 384 2172015 allocations — BSP 2 398 382 2 944 124 56.70 1 Apr ’15 7 310 1 Apr ’18 1002015 allocations — FSP 2 944 124 3 231 467 56.70 1 Apr ’15 — 1Apr’18,
19,2033.3 over
three years2016 allocation — BSP 3 231 467 3 300 486 38.79 1 Apr ’16 — 1 Apr ’19 1002016 allocations — FSP 3 300 486 3 942 843 38.79 1 Apr ’16 — 1Apr’19,
’20,’2133.3 over
three years2016 allocations — FSP retention
3 942 843 5 341 558 38.79 1 Apr ’16 — 1 Apr ’19 100
2017 awards — BSP*** 5 341 558 5 952 177 41.65 1 Apr ’17 — 1 Apr ’20 1002017 awards — FSP*** 5 952 177 6 795 718 41.65 1 Apr ’17 — 1Apr’20,
21,2233.3 over
three years2017 awards — FSP retention***
6 795 718 8 025 855 38.79 1 Apr ’17 — 1 Apr ’20 100
Mahube share incentive scheme shares
563 914 — 65.12 27Jan’10 563 914 31Mar’13,’14,’15
33.3 overthree years
* Share options are issued to eligible employees at the date of joining the Company at the applicable market-related share price and therefore range from R23.00 to R74.39 from January 2009 to December 2017. The options vest at a rate of one-third after the third, fourth and fifth anniversary dates
** This net movement includes 724 026 share options issued in 2017 (2016: 1 805 778)*** During the year 2 684 297 ordinary shares were awarded as part of the Company’s employee incentive schemes. These shares will only
be issued following shareholder approval of the amended and new employee share scheme rules and revised scheme share limits as noted in the notice of the AGM

Royal Bafokeng Platinum Annual Financial Statements 2017 57
34. Dividends No dividends have been declared or proposed in the current year (2016: nil).
35. Financial risk management 35.1 Financial risk factors
TheGroup’sactivitiesexposeittoavarietyofstrategicandfinancialrisks,includingmarketrisk(whichcoverscurrencyrisk,fairvalueinterestraterisk,cashflowinterestrateriskandpricerisk),creditriskandliquidityrisk.TheGroup’soverallriskmanagementprogrammefocusesonthebroaderbusinessenvironment,especiallytheunpredictabilityofthefinancialmarkets,andseekstominimisepotentialadverseeffectsontheGroup’sfinancialperformance.
Risk management is carried out in terms of the enterprise risk framework and related policies approved by the Audit and RiskCommitteeandtheBoard,whichsettheoverallriskappetiteandrelatedfinancialrisktolerances.TheAuditandRiskCommitteeandtheBoardprovideprinciplesforriskmanagement,aswellaspoliciesandguidelinescoveringspecificareas,suchasforeignexchangerisk,interestraterisk,andcreditrisk,useofderivativefinancialinstrumentsandnon-derivativeinstruments,andinvestmentofexcessliquidity.
CategoriesoffinancialinstrumentsandfairvaluesThefollowingtablerepresentstheGroup’sassetsandliabilitiesthataremeasuredatfairvalue(allfinancialinstrumentsarecarriedatamortisedcostexceptfortheNedbankequity-linkeddepositsintheenvironmentaltrustdepositsandtheinsurance investment which are carried at fair value):
Carrying amount Fair values
Notes2017
R (million)2016
R (million)2017
R (million)2016
R (million)
Financial assets Financial assets at fair value through profit or lossEnvironmental trust deposits 6 37.9 94.9 37.9 94.9Environmental guarantee investments 6 22.1 16.6 22.1 16.6Housing insurance investment 9 35.7 35.0 35.7 35.0Loans and receivablesEnvironmental trust deposits 6 104.7 35.5 104.7 35.5Employee housing receivable 7 598.4 209.2 439.5 167.2Trade and other receivables (excludingVAT) 12 1 624.8 1 391.7 1 624.8 1 391.7Cash and cash equivalents 14 1 333.1 835.5 1 333.1 835.5Totalfinancialassets 3 756.7 2 618.4 3 597.8 2 576.4Financial liabilities Financial liabilities at fair value through profit or lossForward exchange contracts 23 — 2.7 — 2.7Financial liabilities at amortised costConvertible bond liability 19 932.4 — 932.4 —PIC housing facility 20 966.8 431.1 975.0 434.0RPM payable 24 1 333.9 889.7 1 333.9 889.7Trade and other payables (excludingVATandpayrollaccruals) 23 526.3 383.7 526.3 383.7Totalfinancialliabilities 3 759.4 1 707.2 3 767.6 1 710.1
35.1.1 Market risk Foreignexchangerisk
TheGroupisexposedtoforeignexchangeriskarisingfromvariouscurrencyexposures,primarilywithrespecttothe US Dollar as the concentrate revenue is impacted by the ZAR:US$ exchange rate. Foreign exchange risk arises when future commercial transactions or recognised assets and liabilities are denominated in a currency that is not the entity’s functional currency.
RBR entered into a disposal of concentrate agreement with RPM during 2002 in terms of which RBR’s 67% share oftheconcentrateofthePGMsproducedbyBRPMJVwillbetreatedbyRPM.
Intermsofthedisposalofconcentrateagreement,thecommoditypricesusedinthecalculationoftheconcentrate payment are based on the average prices for the third month following the month of delivery. Payment is due on the last day of the fourth month following the month of delivery.
Revenue and concentrate debtors are remeasured every month following the month of delivery until the price isfixedinthethirdmonth.Theremeasurementisrecognisedinrevenue.
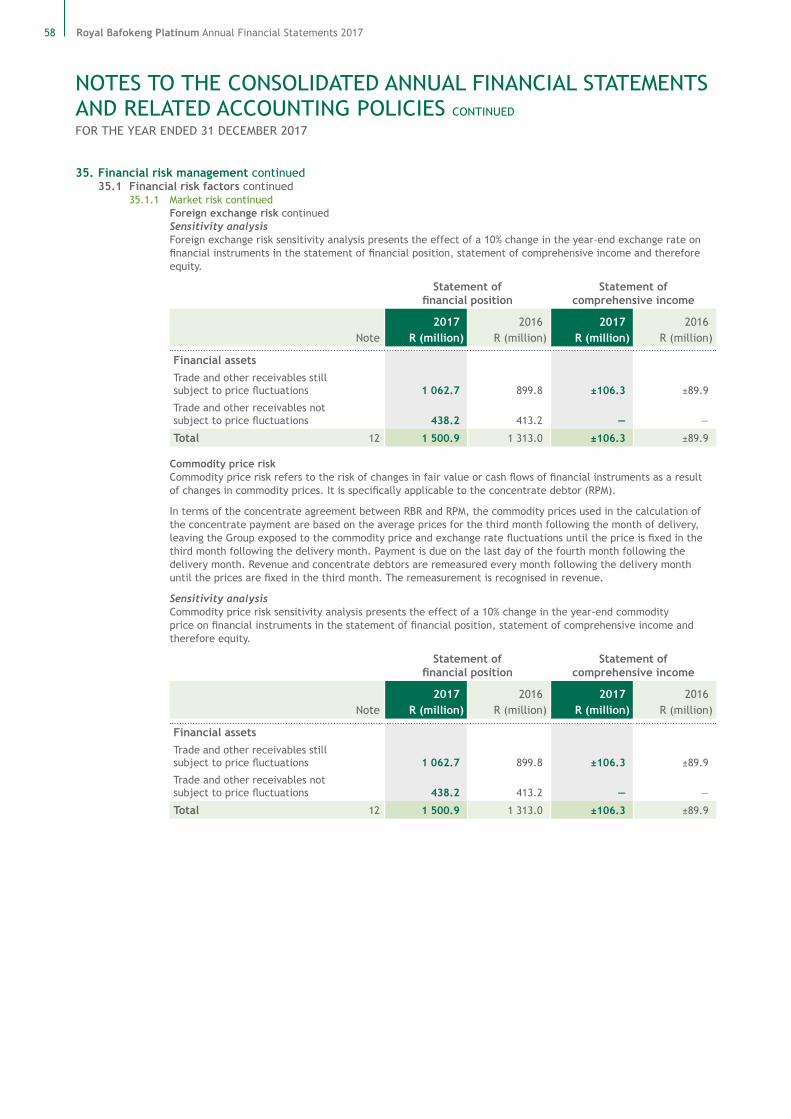
58 Royal Bafokeng Platinum Annual Financial Statements 2017
NOTES TO THE CONSOLIDATED ANNUAL FINANCIAL STATEMENTS AND RELATED ACCOUNTING POLICIES CONTINUED
FOR THE YEAR ENDED 31 DECEMBER 2017
35. Financial risk management continued 35.1 Financial risk factors continued
35.1.1 Market risk continuedForeign exchange risk continuedSensitivity analysisForeign exchange risk sensitivity analysis presents the effect of a 10% change in the year-end exchange rate on financial instruments in the statement of financial position, statement of comprehensive income and therefore equity.
Statement of financial position
Statement of comprehensive income
Note2017
R (million)2016
R (million)2017
R (million)2016
R (million)
Financial assets Trade and other receivables still subject to price fluctuations 1 062.7 899.8 ±106.3 ±89.9
Trade and other receivables not subject to price fluctuations 438.2 413.2 — —
Total 12 1 500.9 1 313.0 ±106.3 ±89.9
Commodity price riskCommodity price risk refers to the risk of changes in fair value or cash flows of financial instruments as a result of changes in commodity prices. It is specifically applicable to the concentrate debtor (RPM).
In terms of the concentrate agreement between RBR and RPM, the commodity prices used in the calculation of the concentrate payment are based on the average prices for the third month following the month of delivery, leaving the Group exposed to the commodity price and exchange rate fluctuations until the price is fixed in the third month following the delivery month. Payment is due on the last day of the fourth month following the delivery month. Revenue and concentrate debtors are remeasured every month following the delivery month until the prices are fixed in the third month. The remeasurement is recognised in revenue.
Sensitivity analysisCommodity price risk sensitivity analysis presents the effect of a 10% change in the year-end commodity price on financial instruments in the statement of financial position, statement of comprehensive income and therefore equity.
Statement of
financial positionStatement of
comprehensive income
Note2017
R (million)2016
R (million)2017
R (million)2016
R (million)
Financial assets Trade and other receivables still subject to price fluctuations 1 062.7 899.8 ±106.3 ±89.9
Trade and other receivables not subject to price fluctuations 438.2 413.2 — —
Total 12 1 500.9 1 313.0 ±106.3 ±89.9
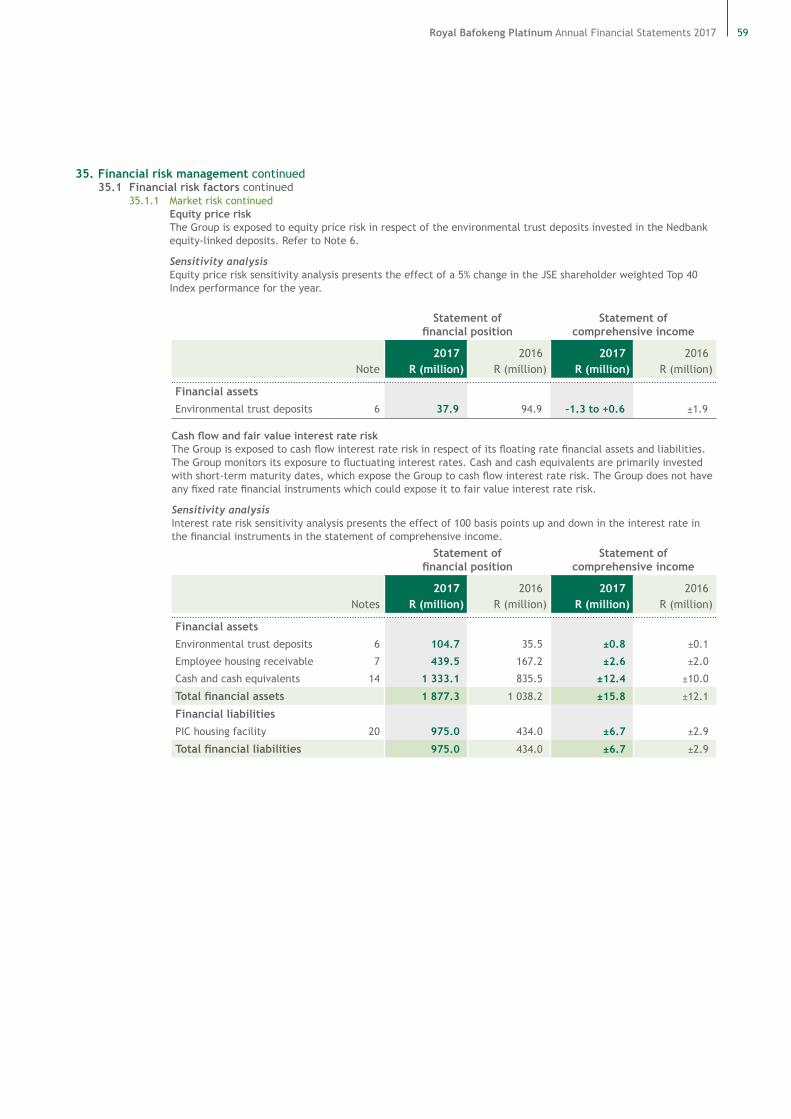
Royal Bafokeng Platinum Annual Financial Statements 2017 59
35. Financial risk management continued 35.1 Financial risk factors continued
35.1.1 Market risk continued Equity price riskThe Group is exposed to equity price risk in respect of the environmental trust deposits invested in the Nedbank equity-linked deposits. Refer to Note 6.
Sensitivity analysisEquity price risk sensitivity analysis presents the effect of a 5% change in the JSE shareholder weighted Top 40 Index performance for the year.
Statement of financial position
Statement of comprehensive income
Note2017
R (million)2016
R (million)2017
R (million)2016
R (million)
Financial assets Environmental trust deposits 6 37.9 94.9 –1.3 to +0.6 ±1.9
Cash flow and fair value interest rate riskThe Group is exposed to cash flow interest rate risk in respect of its floating rate financial assets and liabilities. The Group monitors its exposure to fluctuating interest rates. Cash and cash equivalents are primarily invested with short-term maturity dates, which expose the Group to cash flow interest rate risk. The Group does not have any fixed rate financial instruments which could expose it to fair value interest rate risk.
Sensitivity analysisInterest rate risk sensitivity analysis presents the effect of 100 basis points up and down in the interest rate in the financial instruments in the statement of comprehensive income.
Statement of financial position
Statement of comprehensive income
Notes2017
R (million)2016
R (million)2017
R (million)2016
R (million)
Financial assets Environmental trust deposits 6 104.7 35.5 ±0.8 ±0.1
Employee housing receivable 7 439.5 167.2 ±2.6 ±2.0
Cash and cash equivalents 14 1 333.1 835.5 ±12.4 ±10.0
Total financial assets 1 877.3 1 038.2 ±15.8 ±12.1
Financial liabilities PIC housing facility 20 975.0 434.0 ±6.7 ±2.9
Total financial liabilities 975.0 434.0 ±6.7 ±2.9

60 Royal Bafokeng Platinum Annual Financial Statements 2017
NOTES TO THE CONSOLIDATED ANNUAL FINANCIAL STATEMENTS AND RELATED ACCOUNTING POLICIES CONTINUED
FOR THE YEAR ENDED 31 DECEMBER 2017
35. Financial risk management continued 35.1 Financial risk factors continued
35.1.2 Credit risk Credit risk arises from the risk that the financial asset counterparty may default or not meet its obligations timeously. The maximum exposure to the credit risk is represented by the carrying amount of all the financial assets. The potential concentration of credit risk could arise in cash and cash equivalents, trade receivables, the employee housing receivable and other financial assets and financial guarantees. Refer to Note 22 for financial guarantees.
The Group’s trade debtor credit risk is limited to one customer as all metals in concentrate are sold to RPM. RPM has never defaulted on meeting its obligation. The value of the receivable at year-end was R1 500.9 million (2016: R1 313 million) (Refer to Note 12). The credit risk relates to overall risk of the Anglo American Platinum group, the world’s largest platinum producer.
Management conducted a net assessment for each of the local banking service providers. These included the big five banks in South Africa being Absa, Standard Bank, FNB, Nedbank and Investec. Based on the outcome, we ranked the institutions, categorising them and limiting the investments to be made in each instance based on risk.
In addition to bank investments, RBPlat may invest in collective investment schemes, for example, money market investments. The following limits apply: > RBPlat’s investment may not exceed 20% of the total fund size > the fund must have a minimum Fitch rating of A > minimum Fitch rating of BBB– for individual assets held in the fund.
The limits per bank are applied on a see through basis, taking account of direct investments and indirect investments held via money market fund investments.
With regard to the employee housing receivable, the Group is exposed to the credit risk of employees as houses are sold to employees on credit. The value of the receivable at year-end is R439.5 million (2016: R167.2 million).
Default for reporting purposes is measured as payments outstanding for more than four months. Interest is charged at prime rate on late payments. Default for the employee housing receivable is measured as payments outstanding for more than one month. Where employees have missed one or more instalments, interest is charged at prime rate plus 2%. At year-end, none of the employees have defaulted on meeting their obligation.
No financial assets were past due for the current or the comparative periods under review. No terms relating to financial assets have been renegotiated resulting in assets not being past due.

Royal Bafokeng Platinum Annual Financial Statements 2017 61
35. Financial risk management continued 35.1 Financial risk factors continued
35.1.3 Liquidity riskPrudent liquidity risk management implies maintaining sufficient cash and cash equivalents, the availability of funding through an adequate amount of committed credit facilities and the ability to close out market positions. Due to the dynamic nature of the underlying businesses, the Board aims to maintain flexibility in funding by keeping committed and uncommitted credit lines available. Management monitors rolling forecasts of the Group’s liquidity reserve (comprising undrawn borrowing facilities and cash and cash investments) (refer to Note 14) on the basis of expected cash flows.
The table below analyses the Group’s financial liabilities into the relevant maturity groupings based on the remaining period at the reporting date to the contractual maturity date. The amounts disclosed in the table are the contractual undiscounted cash flows. Balances due within one year equal their carrying amounts as the impact of discounting is insignificant.
Notes
Less than one year
R (million)
Between one and
two yearsR (million)
Between two and
five yearsR (million)
Over five years
R (million)
2017RPM payable 24 1 333.9 — — —
Trade and other payables 23 526.3 — — —
Financial guarantees 22.1 — — 0.8 118.6
PIC housing facility 20 — — 292.6 1 658.0
Convertible bond liability 19 — — 1 200.0 —
2016 (restated)RPM payable 24 889.7 — — —
Trade and other payables 23 429.5 — — —
Financial guarantees 22.1 — — 0.8 201.2
PIC housing facility 20 — — 99.4 894.6
35.1.4 Capital risk managementThe Group defines total capital as equity plus debt in the statement of financial position. The Group’s objectives when managing capital are to safeguard its ability to continue as a going concern in order to provide returns for shareholders and benefits for other stakeholders and to maintain an optimal capital structure in order to reduce the cost of capital.
35.1.5 Fair value determinationThe table below analyses financial instruments carried at fair value, by valuation method. The different levels have been defined as follows: > Quoted prices (unadjusted) in active markets for identical assets and liabilities (level 1) > Inputs other than quoted prices included within level 1 that are observable for the asset or liability, either directly (that is, as prices) or indirectly (that is, derived from prices) (level 2)
> Inputs for the asset or liability that are not based on observable market data (that is, unobservable inputs) (level 3).

62 Royal Bafokeng Platinum Annual Financial Statements 2017
NOTES TO THE CONSOLIDATED ANNUAL FINANCIAL STATEMENTS AND RELATED ACCOUNTING POLICIES CONTINUED
FOR THE YEAR ENDED 31 DECEMBER 2017
35. Financial risk management continued 35.1 Financial risk factors continued 35.1.5 Fair value determination continued The following table presents the financial assets that are measured at fair value as well as the financial
assets and financial liabilities measured at amortised cost but for which fair value disclosure are provided at 31 December:
NotesLevel 1
R (million)Level 2
R (million)Level 3
R (million)
2017
Financial assets at fair value through profit or lossEnvironmental trust deposits1 6 — 37.9 —
Housing insurance investment2 9 — 35.7 —
Loans and receivablesEmployee housing receivable4 7 — — 439.5
Financial liabilities at amortised costConvertible bond liability 19 — — 932.4
PIC housing facility5 20 — — 975.0
2016
Financial assets at fair value through profit or lossEnvironmental trust deposits1 6 — 94.9 —
Housing insurance investment2 9 — 35.0 —
Loans and receivablesEmployee housing receivable4 7 — — 167.2
Financial liabilities at fair value through profit or lossForward exchange contracts3 23 — 2.7 —
Financial liabilities at amortised costPIC housing facility5 20 — — 434.01. This was valued using the level 2 fair values which are directly derived from the Shareholders Weighted Top 40 Index
(SWIX 40) on the JSE2. The fair value was determined using market prices for listed investments and discounted cash flow models for unlisted
investments3. The fair values of the forward exchange contracts and call options are based on mark-to-market values4. The fair value was determined using a discounted cash flow model. Refer to Note 7 for inputs used to determine the fair
value measurement5. The fair value was determined using a discounted cash flow model. Refer to Note 20 for inputs used to determine the fair value measurements
36. Segmental reporting Operating segments are reported in a manner consistent with the internal reporting provided to the chief operating decision-
maker. The chief operating decision-maker, who is responsible for allocating resources and assessing performance of the operating segments, has been identified as the Executive Committee that makes strategic decisions.
The Group is currently operating one mine with two decline shafts and the Styldrift I project. These operations are located in the North West province of South Africa, 120 kilometres from Johannesburg, 30 kilometres from Rustenburg and 17 kilometres from Phokeng. BRPM and Styldrift (Styldrift I and II) are shown as separate segments. In addition, due to the different nature and significance of the employee home ownership scheme, it was decided to show housing as a separate segment. Currently Styldrift I and II are aggregated into a single reportable segment as it is one mining right. The Styldrift II pre-feasibility study has been completed. Once the feasibility study is completed it will move into development phase and may then be reported on as a separate segment.

Royal Bafokeng Platinum Annual Financial Statements 2017 63
For
the
year
end
ed 3
1 De
cem
ber
2017
For
the
year
end
ed 3
1 De
cem
ber
2016
(res
tate
d)#
BRPM
m
inin
g se
gmen
t (A)
R (m
illio
n)
Styl
drift
m
inin
g se
gmen
t (B)
R (m
illio
n)
BRPM
JV
min
ing
segm
ent
(A +
B)
R (m
illio
n)
RBPl
at
hous
ing
segm
ent
R (m
illio
n)
Corp
orat
eof
fice
segm
ent
R (m
illio
n)
Cons
oli-
datio
nad
just
men
tsR
(mill
ion)
Tota
lR
(mill
ion)
BRPM
m
inin
g se
gmen
t (A)
R (m
illio
n)
Styl
drift
m
inin
g se
gmen
t (B)
R (m
illio
n)
BRPM
JV
min
ing
segm
ent
(A +
B)
R (m
illio
n)
RBPl
at
hous
ing
segm
ent
R (m
illio
n)
Corp
orat
eof
fice
segm
ent
R (m
illio
n)
Cons
oli-
dati
onad
just
men
tsR
(mill
ion)
Tota
lR
(mill
ion)
Conc
entr
ate
sale
s3
498.
5—
3 49
8.5
346.
189
.8(4
35.9
)3
498.
53
342.
2—
3 34
2.2
1.8
73.6
(75.
4)3
342.
2
Cost
of
sale
s(3
166
.9)
(8.4
)(3
175
.3)
(344
.4)
(56.
2)38
9.4
(3 1
86.5
)(3
129
.2)
(0.3
)(3
129
.5)
(1.8
)(4
9.1)
78.9
(3 1
01.5
)
Cash
cos
t of
sa
les
excl
udin
g de
prec
iati
on a
nd
amor
tisa
tion
(2 8
69.1
)(8
.2)
(2 8
77.3
)(3
44.4
)(1
3.4)
389.
4(2
845
.7)
(2 8
68.3
)—
(2 8
68.3
)(1
.8)
(12.
4)78
.9(2
803
.6)
Depr
ecia
tion
(318
.3)
(0.2
)(3
18.5
)—
——
(318
.5)
(275
.0)
(0.3
)(2
75.3
)—
——
(275
.3)
Amor
tisa
tion
——
——
(42.
8)—
(42.
8)—
——
—(3
6.7)
—(3
6.7)
Mov
emen
t in
in
vent
orie
s20
.5—
20.5
——
—20
.514
.1—
14.1
——
—14
.1
Gros
s pr
ofit/
(loss
) per
se
gmen
t an
d to
tal
331.
6(8
.4)
323.
21.
733
.6(4
6.5)
312.
021
3.0
(0.3
)21
2.7
—24
.53.
524
0.7
Oth
er in
com
e11
1.5
5.6
117.
13.
129
.40.
915
0.5
75.1
8.9
84.0
2.7
1.4
—88
.1
Tota
l adm
inis
trat
ion
expe
ndit
ure
(43.
7)(5
.3)
(49.
0)(1
7.8)
(196
.6)
7.2
(256
.2)
——
—(1
7.2)
(144
.8)
6.4
(155
.6)
Adm
inis
trat
ion
expe
ndit
ure
——
—(1
4.7)
(195
.1)
7.2
(202
.6)
——
—(1
4.3)
(143
.2)
6.4
(151
.1)
Depr
ecia
tion
—
——
(0.3
)(1
.5)
—(1
.8)
——
—(0
.2)
(1.6
)—
(1.8
)
Amor
tisa
tion
of
empl
oyee
hou
sing
be
nefit
and
fai
r va
lue
adju
stm
ent
to lo
an—
——
(2.8
)—
—(2
.8)
——
—(2
.7)
——
(2.7
)
Rest
ruct
urin
g co
sts
(43.
7)(5
.3)
(49.
0)—
——
(49.
0)—
——
——
——
Impa
irm
ent
of
non-
finan
cial
ass
ets
——
—(1
.0)
(863
.3)
—(8
64.3
)(0
.9)
(0.9
)(1
.8)
(0.8
)—
—(2
.6)
Net
finan
ce in
com
e14
.90.
915
.836
.4(2
5.8)
58.7
85.1
10.8
—10
.828
.645
.0—
84.4
Fina
nce
inco
me
20.1
2.0
22.1
36.4
107.
5(2
8.6)
137.
416
.61.
418
.028
.645
.2—
91.8
Fina
nce
cost
(5.2
)(1
.1)
(6.3
)—
(133
.3)
87.3
(52.
3)(5
.8)
(1.4
)(7
.2)
—(0
.2)
—(7
.4)
Profi
t/(lo
ss) b
efor
e ta
x pe
r se
gmen
t an
d to
tal
414.
3(7
.2)
407.
122
.4(1
022
.7)
20.3
(572
.9)
298.
07.
730
5.7
13.3
(73.
9)9.
925
5.0
Taxa
tion
——
——
——
(84.
1)7.
7
(Los
s)/p
rofit
aft
er t
ax(6
57.0
)26
2.7
Attr
ibut
able
to
owne
rs o
f th
e Co
mpa
ny(7
52.7
)16
8.3
Attr
ibut
able
to
non-
cont
rolli
ng in
tere
st95
.794
.4
# 20
16 r
esta
ted
due
to t
he s
epar
atio
n of
the
cor
pora
te o
ffice
and
con
soli
dati
on a
djus
tmen
t in
the
seg
men
tal
anal
ysis
36. Segmental reporting continued 36.1 Segmental statement of comprehensive income

64 Royal Bafokeng Platinum Annual Financial Statements 2017
NOTES TO THE CONSOLIDATED ANNUAL FINANCIAL STATEMENTS AND RELATED ACCOUNTING POLICIES CONTINUED
FOR THE YEAR ENDED 31 DECEMBER 2017
36. Segmental reporting continued 36.2 Segmental statement of financial position
For
the
year
end
ed 3
1 De
cem
ber
2017
For
the
year
end
ed 3
1 De
cem
ber
2016
(res
tate
d)#
BRPM
m
inin
g se
gmen
t (A)
R (m
illio
n)
Styl
drift
m
inin
g se
gmen
t (B)
R (m
illio
n)
BRPM
JV
min
ing
segm
ent
(A +
B)
R (m
illio
n)
RBPl
at
hous
ing
segm
ent
R (m
illio
n)
Corp
orat
e of
fice
R (m
illio
n)
Cons
oli-
datio
nad
just
men
tR
(mill
ion)
Tota
lR
(mill
ion)
BRPM
m
inin
g se
gmen
t (A)
R (m
illio
n)
Styl
drift
m
inin
g se
gmen
t (B)
R (m
illio
n)
BRPM
JV
min
ing
segm
ent
(A +
B)
R (m
illio
n)
RBPl
at
hous
ing
segm
ent
R (m
illio
n)
Corp
orat
e of
fice
R (m
illio
n)
Cons
oli-
dati
onad
just
men
tR
(mill
ion)
Tota
lR
(mill
ion)
Non-
curr
ent
asse
ts4
080.
18
118.
3*12
198
.464
2.5*
*10
413
.9(4
806
.5)
18 4
48.3
4 26
2.5
6 62
8.0*
10 8
90.5
252.
5**
10 3
04.4
(3 8
33.1
)17
614
.3
Allo
catio
n of
min
eral
ri
ghts
and
seg
men
ts76
1.8
4 92
4.7^
5 68
6.5
——
(5 6
86.5
)—
955.
34
774.
05
729.
3—
—(5
729
.3)
—
Non-
curr
ent
asse
ts
afte
r al
loca
tion
of
min
eral
rig
hts
4 84
1.9
13 0
43.0
17 8
84.9
642.
510
413
.9(1
0 49
3.0)
18 4
48.3
5 21
7.8
11 4
02.0
16 6
19.8
252.
510
304
.4(9
562
.4)
17 6
14.3
Curr
ent
asse
ts
1 95
3.5
333.
12
286.
666
8.7
919.
2(1
77.4
)3
697.
11
587.
124
9.2
1 83
6.3
428.
367
4.2
(235
.2)
2 70
3.6
Empl
oyee
hou
sing
cu
rren
t as
sets
——
—59
1.1
——
591.
1—
——
381.
5—
—38
1.5
Inve
ntor
ies
78.5
27.1
105.
6—
——
105.
656
.323
.179
.4—
——
79.4
Trad
e an
d ot
her
rece
ivab
les
1 30
3.8
306.
01
609.
812
.222
2.5
(177
.4)
1 66
7.1
1 16
0.3
226.
11
386.
47.
824
6.6
(235
.2)
1 40
5.6
Curr
ent
tax
rece
ivab
le—
——
—0.
2—
0.2
——
——
1.6
—1.
6
Cash
and
cas
h eq
uiva
lent
s57
1.2
—57
1.2
65.4
696.
5—
1 33
3.1
370.
5—
370.
539
.042
6.0
—83
5.5
Tota
l ass
ets
per
stat
emen
t of
fina
ncia
l po
sitio
n6
795.
413
376
.120
171
.51
311.
211
333
.1(1
0 67
0.4)
22 1
45.4
6 80
4.9
11 6
51.2
18 4
56.1
680.
810
978
.6(9
797
.6)
20 3
17.9
Non-
curr
ent
liabi
litie
s93
.613
.610
7.2
1 02
3.8
4 70
6.7
—5
837.
781
.712
.594
.243
5.5
3 63
5.3
—4
165.
0
Defe
rred
tax
lia
bilit
y***
——
——
3 77
4.3
—3
774.
3—
——
—3
635.
3—
3 63
5.3
Conv
erti
ble
bond
lia
bilit
y—
——
—93
2.4
—93
2.4
——
——
——
—
PIC
hous
ing
faci
lity
——
—97
5.0
——
975.
0—
——
434.
0—
—43
4.0
Rest
orat
ion
and
reha
bilit
atio
n pr
ovis
ion
and
othe
r93
.613
.610
7.2
48.8
——
156.
081
.712
.594
.21.
5—
—95
.7
Curr
ent
liabi
litie
s4
817.
416
4.7
4 98
2.1
45.8
3 76
8.9
(6 9
13.0
)1
883.
83
566.
477
.93
644.
326
.12
773.
7(5
105
.1)
1 33
9.0
Trad
e an
d ot
her
paya
bles
286.
616
4.7
451.
345
.83
763.
9(3
716
.1)
544.
938
1.6
77.9
459.
526
.12
773.
7(2
810
.0)
449.
3
Curr
ent
tax
paya
ble
——
——
5.0
—5.
0—
——
——
——
RBR
paya
ble
3 03
5.6
—3
035.
6—
—(3
035
.6)
—2
133.
8—
2 13
3.8
——
(2 1
33.8
)—
RPM
pay
able
1 49
5.2
—1
495.
2—
—(1
61.3
)1
333.
91
051.
0—
1 05
1.0
——
(161
.3)
889.
7
Tota
l lia
bilit
ies
per
stat
emen
t of
fina
ncia
l po
sitio
n4
911.
017
8.3
5 08
9.3
1 06
9.6
8 47
5.6
(6 9
13.0
)7
721.
53
648.
190
.43
738.
546
1.6
6 40
9.0
(5 1
05.1
)5
504.
0
* In
clud
es S
tyld
rift
II e
xplo
rati
on a
nd e
valu
atio
n co
sts
**
Empl
oyee
hou
sing
loa
n re
ceiv
able
is
clas
sifi
ed a
s no
n-cu
rren
t as
rep
aym
ent
of t
he c
apit
al p
orti
on o
f th
ese
rece
ivab
les
is e
xpec
ted
to c
omm
ence
aft
er 1
2 m
onth
s fr
om d
ate
of t
he s
tate
men
t of
fina
ncia
l po
siti
on**
* R1
bil
lion
of
the
defe
rred
tax
lia
bili
ty i
s at
trib
utab
le t
o BR
PM m
inin
g se
gmen
t an
d R2
.7 b
illi
on t
o St
yldr
ift
min
ing
segm
ent
(Sty
ldri
ft I
and
Styl
drif
t II)
# 20
16 r
esta
ted
due
to t
he s
epar
atio
n of
the
cor
pora
te o
ffice
and
con
soli
dati
on a
djus
tmen
t in
the
seg
men
tal
anal
ysis
^ D
urin
g 20
17,
the
cost
and
rec
over
able
am
ount
s of
the
20
shaf
t ro
yalt
y m
iner
al r
ight
s w
ere
real
loca
ted
from
the
BRP
M C
GU
to
the
Styl
drif
t CG
U a
s w
e re
cons
ider
ed t
he w
ay w
e w
ill
be m
inin
g th
ese
ounc
es
and
conc
lude
d it
wil
l be
fro
m S
tyld
rift
inf
rast
ruct
ure
and
not
BRPM

Royal Bafokeng Platinum Annual Financial Statements 2017 65
36. Segmental reporting continued 36.3 Segmental statement of cash flows
For
the
year
end
ed 3
1 De
cem
ber
2017
For
the
year
end
ed 3
1 De
cem
ber
2016
BRPM
m
inin
g se
gmen
t (A)
R (m
illio
n)
Styl
drift
m
inin
g se
gmen
t (B)
R (m
illio
n)
BRPM
JV
min
ing
segm
ent
(A +
B)
R (m
illio
n)
RBPl
at
hous
ing
segm
ent
R (m
illio
n)
Corp
orat
e of
fice
and
cons
oli-
datio
n ad
just
-m
ent
R (m
illio
n)To
tal
R (m
illio
n)
BRPM
m
inin
g se
gmen
t (A)
R (m
illio
n)
Styl
drift
m
inin
g se
gmen
t (B)
R (m
illio
n)
BRPM
JV
min
ing
segm
ent
(A +
B)
R (m
illio
n)
RBPl
at
hous
ing
segm
ent
R (m
illio
n)
Corp
orat
e of
fice
and
cons
oli-
dati
on
adju
st-
men
tR
(mill
ion)
Tota
lR
(mill
ion)
Net
cas
h fl
ow g
ener
ated
/(u
tilis
ed)
by o
pera
ting
ac
tivi
ties
585.
2(1
1.5)
573.
724
.520
.261
8.4
518.
51.
451
9.9
25.7
39.7
585.
3Ca
sh fl
ows
from
inve
stin
g ac
tivi
ties
Proc
eeds
fro
m d
ispo
sal o
f pr
oper
ty,
plan
t an
d eq
uipm
ent
——
——
——
2.1
45.1
47.2
——
47.2
Acqu
isit
ion
of p
rope
rty,
pla
nt
and
equi
pmen
t(1
41.3
)(2
019
.0)
(2 1
60.3
)(0
.5)
22.5
(2 1
38.3
)(1
55.0
)(1
011
.8)
(1 1
66.8
)(1
.1)
31.4
(1 1
36.5
)St
yldr
ift
on-r
eef
deve
lopm
ent
reve
nue
rece
ipts
—45
1.1
451.
1—
—45
1.1
—27
3.9
273.
9—
—27
3.9
Acqu
isit
ion
of e
mpl
oyee
ho
usin
g as
sets
——
—(4
93.9
)—
(493
.9)
——
—(8
3.2)
—(8
3.2)
Empl
oyee
hou
sing
rec
eiva
ble
loan
rep
aym
ents
——
—1.
3—
1.3
——
——
——
Dep
osit
pai
d fo
r M
asev
e ac
quis
itio
n—
——
—(4
1.4)
(41.
4)Ac
quis
itio
n of
hou
sing
in
sura
nce
inve
stm
ent
——
——
——
——
—(2
.9)
—(2
.9)
Incr
ease
in e
nvir
onm
enta
l tru
st
depo
sits
(9.8
)—
(9.8
)—
—(9
.8)
(20.
1)—
(20.
1)—
—(2
0.1)
Net
cas
h fl
ow (
utili
sed)
/ge
nera
ted
by in
vest
ing
acti
viti
es(1
51.1
)(1
567
.9)
(1 7
19.0
)(4
93.1
)(1
8.9)
(2 2
31.0
)(1
73.0
)(6
92.8
)(8
65.8
)(8
7.2)
31.4
(921
.6)
Cash
flow
s fr
om fi
nanc
ing
acti
viti
esCa
sh in
vest
men
ts b
y/(d
istr
ibut
ions
to)
BRP
M J
V sh
areh
olde
rs(2
33.4
)1
579.
41
346.
0—
(901
.8)
444.
2(5
1.1)
691.
464
0.3
—(5
11.5
)12
8.8
Net
dra
wdo
wns
of
PIC
hous
ing
faci
lity
——
—49
5.0
—49
5.0
——
—40
.0—
40.0
(Dec
reas
e)/i
ncre
ase
in
inte
rcom
pany
loan
s—
——
——
——
——
(250
.0)
250.
0—
RPM
con
trib
utio
n to
hou
sing
fu
nd r
ecei
ved
——
——
——
(250
.0)
—(2
50.0
)25
0.0
82.5
82.5
Proc
eeds
fro
m s
hare
opt
ions
ex
erci
sed
——
——
——
——
——
2.9
2.9
Net
pro
ceed
s fr
om c
onve
rtib
le
bond
issu
ed—
——
— 1
171
.01
171.
0—
——
——
—
Net
cas
h fl
ow (
utili
sed)
/ge
nera
ted
by fi
nanc
ing
acti
viti
es(2
33.4
)1
579.
41
346.
049
5.0
269.
22
110.
2(3
01.1
)69
1.4
390.
340
.0(1
76.1
)25
4.2
Net
incr
ease
/(de
crea
se)
in
cash
and
cas
h eq
uiva
lent
s20
0.7
—20
0.7
26.4
270.
549
7.6
44.4
—44
.4(2
1.5)
(105
.0)
(82.
1)Ca
sh a
nd c
ash
equi
vale
nts
at
begi
nnin
g of
yea
r37
0.5
—37
0.5
39.0
426.
083
5.5
326.
1—
326.
160
.553
1.0
917.
6Ca
sh a
nd c
ash
equi
vale
nts
at
end
of y
ear
571.
2—
571.
265
.469
6.5
1 33
3.1
370.
5—
370.
539
.042
6.0
835.
5

66 Royal Bafokeng Platinum Annual Financial Statements 2017
NOTES TO THE CONSOLIDATED ANNUAL FINANCIAL STATEMENTS AND RELATED ACCOUNTING POLICIES CONTINUED
FOR THE YEAR ENDED 31 DECEMBER 2017
37. (Loss)/earnings per share The weighted average number of ordinary shares in issue outside the Group for purposes of basic (loss)/earnings per share and
the weighted average number of ordinary shares for diluted (loss)/earnings per share are calculated as follows:
Group
2017 2016
Number of shares issued 195 836 465 195 836 465
Management incentive schemes (3 558 475) (4 092 851)
Number of shares issued outside the Group 192 277 990 191 743 614
Adjusted for weighted shares issued during the year 445 163 401 513
Weighted average number of ordinary shares in issue for earnings per share 192 723 153 192 145 127
Dilutive potential ordinary shares relating to management incentive schemes 9 092 186 357
Dilutive potential ordinary shares relating to the convertible bond 27 808 219 —
Weighted average number of potential dilutive ordinary shares in issue 220 540 464 192 331 484
(Loss)/profit attributable to owners of the Company R (million) (752.7) 168.3
Adjustments:
Add: Net interest on convertible bond (refer to Note 27.2) 45.9 —
Less: Derivative fair value (refer to Note 26) (19.5) —
Less: Tax on the above (7.4) —
Diluted loss R (million) (733.7) —
Basic (loss)/earnings per share (cents/share) (390.6) 87.6
Basic (loss)/earnings per share is calculated by dividing the (loss)/profit attributable to owners of the Company for the year by the weighted average number of ordinary shares in issue for earnings per share.
Diluted (loss)/earnings per share (cents/share) (390.6)# 87.5
Diluted (loss)/earnings per share is calculated by adjusting the weighted number of ordinary shares outstanding to assume conversion of all diluted potential ordinary shares.
Group
2017 2016*
Gross Net Gross Net
Headline earnings (Loss)/profit attributable to owners of the Company R (million) (752.7) 168.3
Adjustments:
Profit on disposal of property, plant and equipment and other assets R (million) (1.8) (1.8) (6.9) (3.3)
Impairment of non-financial assets R (million) 863.3 863.3 2.6 1.7
Headline earnings R (million) 108.8 166.7
Basic headline earnings per share (cents/share) 56.4 86.7
Diluted headline earnings per share (cents/share) 56.4# 86.6# The effects of anti-dilutive potential ordinary shares are ignored in the calculation of diluted (loss)/earnings per share and diluted headline
earnings per share.* An amount of R0.8 million was incorrectly included in the adjustment for "Impairment of non-financial assets" in 2016. This amount relates
to the remeasurement of financial assets (refer to employee housing benefit Note 8) measured in terms of IAS 39 and should not have been adjusted in HEPS. The impact on HEPS in 2016 was 0.4 cents which is not material and therefore we have not restated the 2016 HEPS.
38. Subsequent event On 16 January 2018, South African Competition Tribunal approval was obtained for the Maseve acquisition. Following this
approval, forward cover was taken out for the settlement of the remaining US$55 million phase 1 acquisition price at a ZAR:US$ rate of 12.46 as a deposit of US$3 million (ZAR41.4 million) was paid in October 2017 (refer to Note 12 for details).
Detailed IFRS3, Business combinations, disclosure requirements are not included in these annual financial statements as the exercise to determine the acquisition-date fair value of the total consideration and the amounts to be recognised at the acquisition date for the assets and liabilities have not been determined at the time the financial statements were authorised for issue. These fair values can only be finalised on transfer of the properties of Phase 1 of the transaction.

Royal Bafokeng Platinum Annual Financial Statements 2017 67
COMPANY STATEMENT OF FINANCIAL POSITIONAS AT 31 DECEMBER 2017
Company
Notes2017
R (million)2016
R (million)
AssetsNon-current assets 10 361.5 9 309.5
Investment in subsidiaries 2 6 819.2 6 819.2
Intercompany loans 3.1 3 542.3 2 490.3
Current assets 716.3 485.3
Other receivables 4 45.4 1.0
Current tax receivable 5 0.2 0.2
Intercompany loans 3.1 — 84.5
Cash and cash equivalents 670.7 399.6
Total assets 11 077.8 9 794.8
Equity and liabilitiesTotal equity 10 068.6 9 794.2
Share capital 6 1.9 1.9
Share premium 6 9 666.5 9 424.1
Share-based payment reserve 7 217.6 190.0
Retained earnings 182.6 178.2
Non-current liabilities 1 007.0 —
Deferred tax liability 8 74.6 —
Convertible bond liability 9.3 932.4 —
Current liabilities 2.2 0.6
Accruals and provisions 0.4 0.6
Intercompany loans 3.2 1.8 —
Total equity and liabilities 11 077.8 9 794.8
The notes on pages 71 to 77 form an integral part of these annual financial statements.

68 Royal Bafokeng Platinum Annual Financial Statements 2017
COMPANY STATEMENT OF COMPREHENSIVE INCOMEFOR THE YEAR ENDED 31 DECEMBER 2017
Company
Note2017
R (million)2016
R (million)
Dividend income 1.4 4.1
Finance income 104.0 38.9
Finance cost (104.6) —
Other income 28.3 0.9
Administrative expenses (23.7) (19.4)
Profit before tax 5.4 24.5
Income tax expense 10 (1.0) (5.4)
Income tax expense (5.1) (5.4)
Deferred tax credit 4.1 —
Net profit for the year 4.4 19.1
Other comprehensive income — —
Total comprehensive income 4.4 19.1
The notes on pages 71 to 77 form an integral part of these annual financial statements.

Royal Bafokeng Platinum Annual Financial Statements 2017 69
COMPANY STATEMENT OF CHANGES IN EQUITYFOR THE YEAR ENDED 31 DECEMBER 2017
Number of shares
issued
Ordinary shares
R(million)
Share premium
R(million)
Share-based
payment reserve
R(million)
Retained earnings
R(million)
TotalR
(million)
2017
Balance at 31 December 2016 192 277 990 1.9 9 424.1 190.0 178.2 9 794.2
Share-based payment charge — — — 67.6 — 67.6
Convertible bond — equity portion — — 202.4 — — 202.4
2014 BSP shares vested in April 2017 590 851 — 40.0 (40.0) — —
Total comprehensive income — — — — 4.4 4.4
Balance at 31 December 2017 192 868 841 1.9 9 666.5 217.6 182.6 10 068.6
2016
Restated balance at 31 December 2015 191 743 614 1.9 9 389.4 168.5 159.1 9 718.9
Share-based payment charge — — — 52.8 — 52.8
2013 BSP shares vested in April 2016 534 376 — 31.3 (31.3) — —
Share options exercised — — 3.4 — — 3.4
Total comprehensive income — — — — 19.1 19.1
Balance at 31 December 2016 192 277 990 1.9 9 424.1 190.0 178.2 9 794.2
The notes on pages 71 to 77 form an integral part of these annual financial statements.

70 Royal Bafokeng Platinum Annual Financial Statements 2017
COMPANY STATEMENT OF CASH FLOWSFOR THE YEAR ENDED 31 DECEMBER 2017
Company
Notes2017
R (million)2016
R (million)
Cash flows from operating activitiesCash utilised by operations 11 (18.1) (20.8)
Finance income 75.4 38.9
Finance cost (42.6) —
Dividend received 1.4 4.1
Tax refund received 5 0.5 0.3
Tax paid 5 (5.6) (5.1)
Net cash flow generated by operating activities 11.0 17.4
Cash flows from investing activities
Deposit paid for Maseve acquisition (41.4) —
Related party loans granted* (1 788.8) (1 406.6)
Proceeds on related party loans* 916.3 1 271.5
Proceeds from BRMS share-based payment settlement 3.0 —
Net cash flow utilised by investing activities (910.9) (135.1)
Cash flows from financing activities
Proceeds from share option vested and exercised — 2.9
Proceeds from convertible bond issue 9 1 200.0 —
Costs relating to issue of convertible bonds capitalised (29.0) —
Net cash flow generated by financing activities 1 171.0 2.9
Net increase/(decrease) in cash and cash equivalents 271.1 (114.8)
Cash and cash equivalents at beginning of year 399.6 514.4
Cash and cash equivalents at end of year 670.7 399.6
* Adjusted for non-cash items
The notes on pages 71 to 77 form an integral part of these annual financial statements.

Royal Bafokeng Platinum Annual Financial Statements 2017 71
NOTES TO THE COMPANY ANNUAL FINANCIAL STATEMENTS AND RELATED ACCOUNTING POLICIESFOR THE YEAR ENDED 31 DECEMBER 2017
1. General information and basis of preparation and accounting policies The general information and basis of preparation are disclosed on pages 18 to 20. Accounting policies specific to the items in the notes to the financial statements have been included in the individual notes.
2. Investment in subsidiariesCompany
2017R (million)
2016R (million)
Investments in subsidiaries are accounted for at cost less impairment.
Investment in subsidiaries is accounted for at cost less any impairment provision in the Company’s financial statements. Investments in unlisted companies at cost: Direct investment in subsidiaries consists of: > 1 000 ordinary shares with a par value of R1 each in Royal Bafokeng Platinum
Management Services Proprietary Limited (100% interest) — —
> 320 ordinary shares with a par value of R1 each in Royal Bafokeng Resources Proprietary Limited (100% interest) 6 819.2 6 819.2
Closing balance at 31 December 6 819.2 6 819.2
Indirect investment in subsidiaries consists of:
> Bafokeng Rasimone Management Services Proprietary Limited (100% interest) > Royal Bafokeng Resources Properties (RF) Proprietary Limited (100% interest).
All subsidiaries are incorporated in South Africa.
The 67% participation interest in the BRPM JV is held by Royal Bafokeng Resources Proprietary Limited.There was no impairment of the investment in subsidiaries in the current financial year (2016: nil).
3. Intercompany loansCompany
2017R (million)
2016R (million)
3.1 Intercompany loans receivableIntercompany loans are carried at cost and included in non-current assets as their maturities are greater than 12 months after the statement of financial position date.> Royal Bafokeng Platinum Management Services Proprietary Limited 257.5 190.1> Royal Bafokeng Resources Proprietary Limited 2 360.2 2 300.2
Closing balance at 31 December: Non-interest-bearing 2 617.7 2 490.3
The above intercompany loans bear no interest and have no fixed terms of repayment.> Royal Bafokeng Resources Proprietary Limited 924.6 —
Closing balance at 31 December: Interest-bearing 924.6 —
The loan bears interest at 7% per annum and has no specific repayment terms.
Total intercompany loans receivable 3 542.3 2 490.3
3.2 Intercompany loans (payable)/receivableThe intercompany loan is commercial cost and included in current assets as its maturity is within 12 months after the statement of financial position date
> Bafokeng Rasimone Management Services Proprietary Limited (1.8) 84.5
Closing balance at 31 December: Non-interest-bearing (1.8) 84.5
The intercompany loan bears no interest and has no fixed terms of repayment
4. Other receivablesCompany
2017R (million)
2016R (million)
Deposit paid: Maseve acquisition 41.4 —
Other 4.0 1.0
45.4 1.0

72 Royal Bafokeng Platinum Annual Financial Statements 2017
NOTES TO THE COMPANY ANNUAL FINANCIAL STATEMENTS AND RELATED ACCOUNTING POLICIES CONTINUED
FOR THE YEAR ENDED 31 DECEMBER 2017
5. Current tax receivable Company
2017R (million)
2016R (million)
The movement in the balance can be explained as follows: Opening balance (0.2) (0.8)Income tax charge 5.1 5.4Refund received 0.5 0.3
Payment made (5.6) (5.1)
Closing balance at 31 December (0.2) (0.2)
6. Share capital and share premium Ordinary shares are classified as equity. Incremental costs directly attributable to the issue of new ordinary shares or options are shown in equity as a deduction, net of tax, from the proceeds.
The carrying value of the Company’s shares held by the Mahube Trust and the Company’s subsidiaries in respect of share schemes are shown as a reduction in shareholders’ equity. When share options are exercised, the Company issues new shares or issues shares from treasury shares. The proceeds received net of any directly attributable transaction costs are credited to share capital and share premium when options are exercised.
Company
2017R (million)
2016R (million)
Share capital and share premium The authorised and issued share capital of the Company is as follows: Authorised share capital250 000 000 (2016: 250 000 000) ordinary shares with a par value of R0.01 each 2 500 000 2 500 0001 500 000 (2016: 1 500 000) “A1” ordinary shares with a par value of R0.01 each 15 000 15 0001 500 000 (2016: 1 500 000) “A2” ordinary shares with a par value of R0.01 each 15 000 15 0001 500 000 (2016: 1 500 000) “A3” ordinary shares with a par value of R0.01 each 15 000 15 000
Total authorised share capital 2 545 000 2 545 000
R R
Issued ordinary share capitalOpening balance 192 277 990 (2016: 191 743 614) ordinary shares with a par value of R0.01 1 922 779 1 917 435
Nil* (2016: 2 110 091) ordinary shares issued as part of management share incentive scheme — 21 101
590 851 BSP shares vested in April 2017 5 909 —
534 376 BSP shares vested in April 2016 — 5 344
Less: Treasury shares
Nil* (2016: 2 110 091) ordinary shares issued as part of management share incentive scheme — (21 101)
Total 192 868 841 (2016: 1 922 779) ordinary shares 1 928 688 1 922 779

Royal Bafokeng Platinum Annual Financial Statements 2017 73
6. Share capital and share premium continued
Company
2017R (million)
2016R (million)
Share premiumOpening balance 9 424.1 9 389.4
Nil* (2016: 2 110 091) ordinary shares issued as part of management share incentive scheme — 81.8
590 851 BSP shares vested in April 2017 40.0 —
534 376 BSP shares vested in April 2016 — 31.3
Share options exercised — 3.4
Convertible bonds — equity portion 202.4 —
Less: Treasury shares
Nil* (2016: 2 110 091) ordinary shares issued as part of management share incentive scheme — (81.8)
Total share premium 9 666.5 9 424.1
* During the year 2 684 297 ordinary shares were awarded as part of the Company’s employee incentive schemes. These shares will only be issued following shareholder approval of the amended and new employee share scheme rules and revised scheme share limits as noted in the notice of the annual general meeting
2 110 091 ordinary shares were issued in 2016 as part of the Company’s employee incentive schemes
7. Share-based payment reserve Company
2017R (million)
2016R (million)
The Group operates a number of equity-settled, share-based compensation plans under which the entity receives services from employees as consideration for equity instruments of the Group.
The grant by the Company of options over its equity instruments to the employees of subsidiary undertakings in the Group is treated as a capital contribution. The fair value of employee services received, measured by reference to the grant date fair value, is recognised over the vesting period as an increase to investment in subsidiary undertaking with a corresponding credit to equity. The Company recovers the relevant amounts from the respective subsidiaries and this is accounted for as a reduction of the capital contribution over the vesting period.
Opening balance at 1 January 190.0 168.5
Share-based payment charge 67.6 52.8
BSP shares vested (40.0) (31.3)
Closing balance at 31 December 217.6 190.0
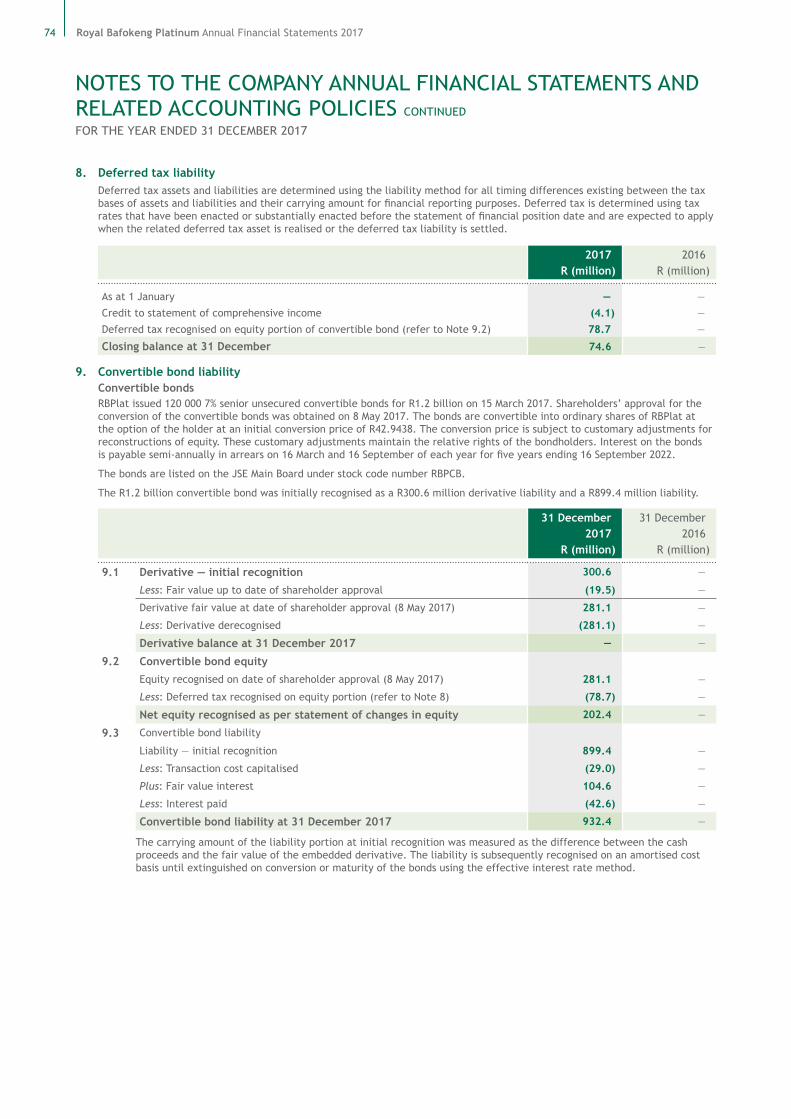
74 Royal Bafokeng Platinum Annual Financial Statements 2017
NOTES TO THE COMPANY ANNUAL FINANCIAL STATEMENTS AND RELATED ACCOUNTING POLICIES CONTINUED
FOR THE YEAR ENDED 31 DECEMBER 2017
8. Deferred tax liabilityDeferred tax assets and liabilities are determined using the liability method for all timing differences existing between the tax bases of assets and liabilities and their carrying amount for financial reporting purposes. Deferred tax is determined using tax rates that have been enacted or substantially enacted before the statement of financial position date and are expected to apply when the related deferred tax asset is realised or the deferred tax liability is settled.
2017R (million)
2016R (million)
As at 1 January — —
Credit to statement of comprehensive income (4.1) —
Deferred tax recognised on equity portion of convertible bond (refer to Note 9.2) 78.7 —
Closing balance at 31 December 74.6 —
9. Convertible bond liabilityConvertible bondsRBPlat issued 120 000 7% senior unsecured convertible bonds for R1.2 billion on 15 March 2017. Shareholders’ approval for the conversion of the convertible bonds was obtained on 8 May 2017. The bonds are convertible into ordinary shares of RBPlat at the option of the holder at an initial conversion price of R42.9438. The conversion price is subject to customary adjustments for reconstructions of equity. These customary adjustments maintain the relative rights of the bondholders. Interest on the bonds is payable semi-annually in arrears on 16 March and 16 September of each year for five years ending 16 September 2022.
The bonds are listed on the JSE Main Board under stock code number RBPCB.
The R1.2 billion convertible bond was initially recognised as a R300.6 million derivative liability and a R899.4 million liability.
31 December 2017
R (million)
31 December 2016
R (million)
9.1 Derivative — initial recognition 300.6 —
Less: Fair value up to date of shareholder approval (19.5) —
Derivative fair value at date of shareholder approval (8 May 2017) 281.1 —
Less: Derivative derecognised (281.1) —
Derivative balance at 31 December 2017 — —
9.2 Convertible bond equityEquity recognised on date of shareholder approval (8 May 2017) 281.1 —
Less: Deferred tax recognised on equity portion (refer to Note 8) (78.7) —
Net equity recognised as per statement of changes in equity 202.4 —
9.3 Convertible bond liability
Liability — initial recognition 899.4 —
Less: Transaction cost capitalised (29.0) —
Plus: Fair value interest 104.6 —
Less: Interest paid (42.6) —
Convertible bond liability at 31 December 2017 932.4 —
The carrying amount of the liability portion at initial recognition was measured as the difference between the cash proceeds and the fair value of the embedded derivative. The liability is subsequently recognised on an amortised cost basis until extinguished on conversion or maturity of the bonds using the effective interest rate method.
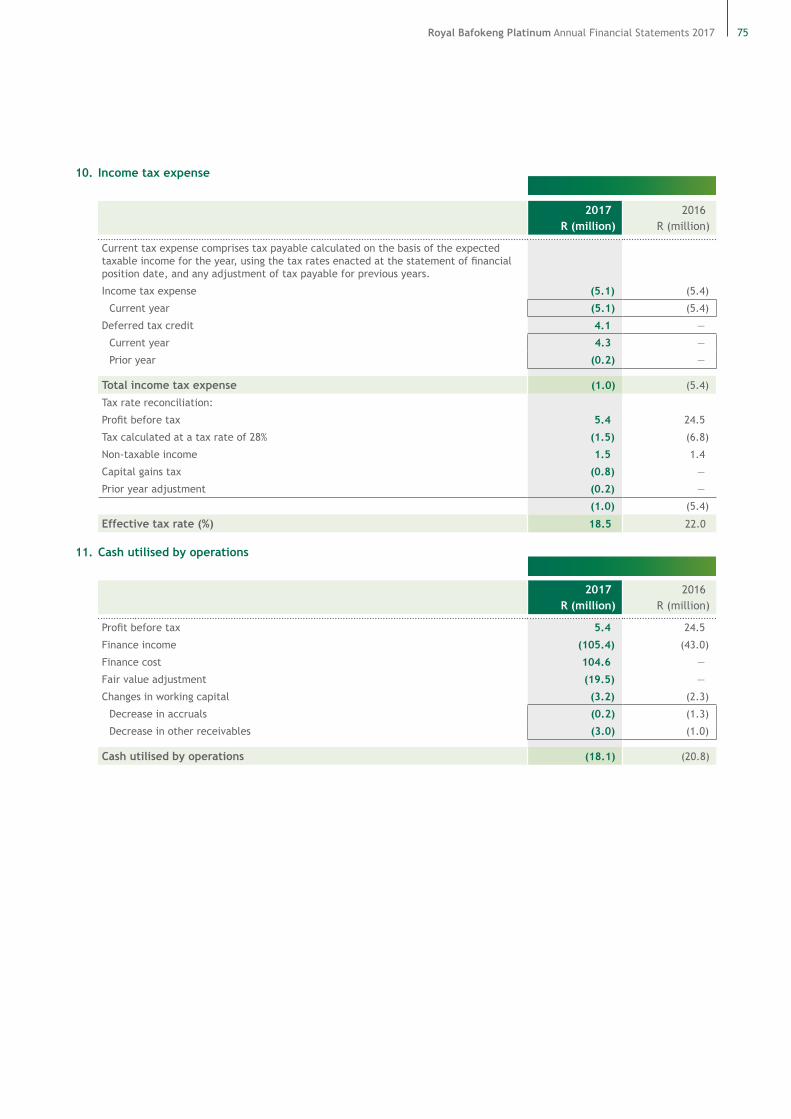
Royal Bafokeng Platinum Annual Financial Statements 2017 75
10. Income tax expenseCompany
2017R (million)
2016R (million)
Current tax expense comprises tax payable calculated on the basis of the expected taxable income for the year, using the tax rates enacted at the statement of financial position date, and any adjustment of tax payable for previous years.
Income tax expense (5.1) (5.4)
Current year (5.1) (5.4)
Deferred tax credit 4.1 —
Current year 4.3 —
Prior year (0.2) —
Total income tax expense (1.0) (5.4)
Tax rate reconciliation:
Profit before tax 5.4 24.5
Tax calculated at a tax rate of 28% (1.5) (6.8)
Non-taxable income 1.5 1.4
Capital gains tax (0.8) —
Prior year adjustment (0.2) —
(1.0) (5.4)
Effective tax rate (%) 18.5 22.0
11. Cash utilised by operationsCompany
2017R (million)
2016R (million)
Profit before tax 5.4 24.5
Finance income (105.4) (43.0)
Finance cost 104.6 —
Fair value adjustment (19.5) —
Changes in working capital (3.2) (2.3)
Decrease in accruals (0.2) (1.3)
Decrease in other receivables (3.0) (1.0)
Cash utilised by operations (18.1) (20.8)

76 Royal Bafokeng Platinum Annual Financial Statements 2017
NOTES TO THE COMPANY ANNUAL FINANCIAL STATEMENTS AND RELATED ACCOUNTING POLICIES CONTINUED
FOR THE YEAR ENDED 31 DECEMBER 2017
12. Financial risk managementThe Company’s activities exposes it to a variety of strategic and financial risks, including liquidity risk. The Company’s overall risk management programme focuses on the broader business environment, especially the unpredictability of the financial markets and seeks to minimise potential adverse effects on the Company’s financial performance.
Risk management is carried out in terms of the enterprise risk framework and related policies approved by the Audit and Risk Committee and the Board, which set the overall risk appetite and related financial risk tolerances.
12.1 Cash flow and fair value interest rate riskThe Company is exposed to cash flow interest rate risk in respect of its floating rate financial assets and liabilities. The Company monitors its exposure to fluctuating interest rates. Cash and cash equivalents are primarily invested with short-term maturity dates, which expose the Company to cash flow interest rate risk.
Sensitivity analysisInterest rate risk sensitivity analysis presents the effect of 100 basis points up and down in the interest rate to the financial instruments in the statement of comprehensive income.
Statement of financial position Statement of comprehensive income
2017R (million)
2016R (million)
2017R (million)
2016R (million)
Financial assetsCash and cash equivalents 670.7 399.6 ±6.3 ±5.1
12.2 Liquidity riskPrudent liquidity risk management implies maintaining sufficient cash and cash equivalents, the availability of funding through an adequate amount of committed credit facilities and the ability to close out market positions. Management monitors rolling forecasts of the Company’s liquidity reserve on the basis of expected cash flows.
The table below analyses the Company’s liabilities in the relevant maturity grouping based on the remaining period at the reporting date to the contractual maturity date. Balances due within one year equal their carrying amounts as the impact of discounting is insignificant.
Note
Less thanone year
R (million)
Betweenone and
two yearsR (million)
Betweentwo and
five yearsR (million)
Over fiveyears
R (million)
2017
Trade and other payables 0.4 — — —
Convertible bond liability 9 — — 1 200.0 —
2016
Trade and other payables 0.6 — — —
12.3 Capital risk managementThe Company defines total capital as equity plus debt in the statement of financial position. The Company’s objectives when managing capital are to safeguard its ability to continue as a going concern in order to provide returns for shareholders and benefits for other stakeholders, and to maintain on optimal structure in order to reduce the cost of capital.

Royal Bafokeng Platinum Annual Financial Statements 2017 77
12. Financial risk management continued12.4 Fair value determination
The table below analyses financial instruments carried at fair value, by valuation method. The different levels have been defined as follows: > Quoted prices (unadjusted) in active markets for identical assets and liabilities (level 1) > Inputs other than quoted prices included within level 1 that are observable for the asset or liability, either directly (that is, as prices) or indirectly (that is, derived from prices) (level 2)
> Inputs for the asset or liability that are not based on observable market data (that is, unobservable inputs) (level 3)
The table presents the financial liabilities measured at amortised cost but for which fair value disclosure are provided at 31 December:
NoteLevel 1
R (million)Level 2
R (million)Level 3
R (million)
2017
Financial liabilities at amortised costConvertible bond liability 9 — — 932.4

78 Royal Bafokeng Platinum Annual Financial Statements 2017
NON-IFRS MEASURESFOR THE YEAR ENDED 31 DECEMBER 2017
The Company utilises certain non-IFRS performance measures and ratios in managing the business and may provide users of the financial information with additional meaningful comparisons between current results and results in the prior period. Non-IFRS financial measures should be viewed in addition to and not as an alternative for the reported operating results or cash flow from operations or any other measure of performance prepared in accordance with IFRS. In addition, these measures may not be comparable to similarly titled measures used by other companies.
Normalised headline earnings and normalised HEPS Normalised headline earnings and normalised HEPS are non-IFRS measures used by the Group in evaluating the Group’s performance against its competitors. This supplements the IFRS measures as normalised headline earnings and normalised HEPS are calculated by adjusting the basic earnings and EPS for the year with:> profit or loss on disposal of property, plant and equipment > impairment of non-financial assets > once-off restructuring costs> tax implications of above adjustments> once-off tax adjustments.
The reconciliation of basic earnings to normalised headline earnings is shown below:
2017R (million)
2016R (million)
Basic (loss)/earnings attributable to owners of the Company (752.7) 168.3
Once-off restructuring costs 32.8 —
Tax impact of above adjustments (9.2) —
Once-off tax adjustment — (46.9)
Normalised basic (loss)/earnings (729.1) 121.4
Impairment of non-financial assets 863.3 1.7
Profit on disposal of assets (1.8) (3.3)
Normalised headline earnings 132.4 119.8
The reconciliation of normalised EPS to the relevant IFRS EPS is shown below:
2017 2016
(LPS)/EPS (cents per share) (390.6) 87.6
Impairment of non-financial assets (cents per share) 448.0 —
Profit on disposal of assets (cents per share) (1.0) (0.9)
HEPS (cents per share) 56.4 86.7
Once-off restructuring costs 17.0 —
Tax impact of above adjustments (cents per share) (4.7) —
Once-off tax adjustment (cents per share) — (24.4)
Normalised HEPS (cents per share) 68.7 62.3
EBITDA Earnings before interest, tax, depreciation and amortisation (EBITDA). The EBITDA gives an indication of the current operational profitability of the business.
The reconciliation of EBITDA to the relevant IFRS profit before tax is shown below:
2017R (million)
2016R (million)
(Loss)/profit before tax (572.9) 255.0
Less: Finance income (137.4) (91.8)
Plus: Finance cost 52.3 7.4
Plus: Impairment of non-financial assets 864.3 2.6
Plus: Depreciation of assets 320.2 277.1
Plus: Amortisation (mineral rights, employee housing receivables and benefits) 45.7 39.4
EBITDA 572.2 489.7

Royal Bafokeng Platinum Annual Financial Statements 2017 79
ROYAL BAFOKENG PLATINUM GROUP STRUCTUREAT 31 DECEMBER 2017
* Incorporates the mining of the Boschkoppie and Styldrift mineral rights
Royal Bafokeng Holdings Proprietary Limited
Rustenburg Platinum Miners Limited Free float
Royal Bafokeng Platinum Management Services Proprietary Limited
Royal Bafokeng Resources Properties (RF)
Proprietary Limited
100%
Bafokeng Rasimone Management Services Proprietary Limited
100%
67%
Bafokeng Rasimone Platinum
Mine Unincorporated Joint Venture*
Royal Bafokeng Resources Proprietary Limited
100%
100%
33%
51.74% 36.82%11.44%

80 Royal Bafokeng Platinum Annual Financial Statements 2017
ADMINISTRATION
Shareholders’ diaryFinancial year-end:31 December of each year
Interim period-end:30 June of each year
Integrated report and annual financial statements(mailed to shareholders)9 March 2018
AdministrationCompany registered officeRoyal Bafokeng Platinum LimitedRegistration number: 2008/015696/06Share code: RBPISIN: ZAE000149936
The PivotNo 1 Monte Casino BoulevardBlock C4th FloorFourwaysJohannesburg2021South Africa
PO Box 2283Fourways2055South Africa
Company SecretaryLester JoosteEmail: [email protected]: +27 10 590 4519Telefax: +27 086 572 8047
Investor relationsLindiwe MontshiwagaeEmail: [email protected]: +27 10 590 4517Telefax: +27 086 219 5131
Public OfficerReginald HamanEmail: [email protected]: +27 10 590 4533Telefax: +27 086 219 5131
Independent external auditorsPricewaterhouseCoopers Inc.4 Lisbon LaneWaterfall CityJukskei View2090South Africa
Transfer secretariesComputershare Investor Services Proprietary LimitedRosebank Towers15 Biermann AvenueRosebankJohannesburg2196
PO Box 61051Marshalltown 2107South AfricaTelephone: +27 11 370 5000Telefax: + 27 11 688 5200
SponsorMerrill Lynch South Africa Proprietary Limited1 Sandton DriveSandhurstJohannesburg2196South Africa


www.bafokengplatinum.co.za
RO
YAL BA
FOK
ENG
PLATIN
UM
AN
NU
AL FIN
AN
CIA
L STATEM
ENT
S 2017 M
ORE TH
AN
MIN
ING