more than we bargained for - centreforum · more than we bargained for ... stephen bach, one of the...
TRANSCRIPT
More than we bargained for
�
About the AuthorAlison Wolf is the Sir Roy Griffiths Professor of Public Sector Management at King’s College London, where she directs the MSc in Public Services Policy and Management. Before becoming an academic, she was a policy analyst for the US government, and she has carried out research and consultancy for a wide range of governments and governmental organisations, in the UK and around the world. She also writes frequently for the national press and is a presenter for Analysis on Radio 4. Alison was educated at the universities of Oxford and Neuchâtel, and her research has always focused on labour market issues, and the interaction between education and employment.
AcknowledgementsI would like to thank CentreForum, and especially its director, Julian Astle, for inviting me to write this pamphlet, and for their valuable comments on early drafts. A number of staff and interns, past and present, provided research support, and I would like to thank, in particular, Lucy Wilkins, Dorothy Leys, Harriet Paterson and Stephanie Larnder. I also owe enormous gratitude to the many people in Sweden who explained their system of wage-bargaining to me, and apologise for my inevitable over-simplifications and for any inadvertent errors. My thanks to all of them, and in particular but in no special order, to Richard Murray; Peter Henriksson (Jusek/SACO); Peter Steiner (ST); Nils Henrik Schager (Arbetsgivarverket); Ola Carnelid and Fredrik Mandelin (Lararforbundet); Goran Nilsson (Fikansli); Björn Lindgren (Svensktnaringsliv); Staffan Löwenborg and Martina Gustaffson (SKL); and Henrik Lindberg and Nils Karlson (Ratio). My thanks also to many people in the UK health service, education, central government and the universities with whom I have discussed these issues over the years: they are numerous and some of our conversations were confidential, so I have not attempted to list people by name. I would also like to express my gratitude to my colleague, Professor Stephen Bach, one of the world’s leading experts on public sector bargaining. I have drawn on his work widely, but would emphasise that the interpretations and opinions, throughout the monograph, are entirely my own.
ISBN 1-902622-76-6
Copyright 2010 CentreForum
All rights reserved
No part of this publication may be reproduced, stored in a retrieval system, or transmitted in any form or by any means, electronic, mechanical, photocopying, recording or otherwise, without the prior permission of CentreForum.
More than we bargained for
�
Contents
Foreword by Julian Astle 4
Executive Summary 6
1. Introduction 9
2. The context: public services and the quest for productivity 11
3. Public sector employment and pay 18
4. National bargaining, incentives and behaviour 30
5. How big is the problem? 42
6. Policy implications: pupil premia, junior doctors and the university sector 61
7. How did we get to this point? 73
8. Paddling back 79
Appendix: teacher vacancy and turnover rates 85
:
More than we bargained for
�
Foreword
Professor Wolf has built a career out of challenging the received wisdoms of the political class, whether by exposing the myths that surround education and economic growth (and the lazy assumption that more of the former is bound, automatically, to produce more of the latter), or, as here, by contesting the view that centralised wage bargaining in the public sector can be justified, either on grounds of equity or efficiency.
The theme that runs through much of her work, this monograph included, is the inevitable failure of central planners to take proper account of the complexity of human activity – a failure that, time and again, leads to unforeseen consequences that do real and lasting damage to citizens, and to the poorest citizens most of all.
In the pages that follow, Professor Wolf walks the reader through the many deleterious effects of managing public sector organisations as if individual, institutional, local or regional differences simply did not exist. As she demonstrates, the fact that those differences – in individual or institutional capacity or regional and local prosperity – are large and growing, matters greatly. By wilfully ignoring them, policy makers end up perpetuating the very inequalities they are trying to iron out. If underperforming schools in deprived neighbourhoods cannot pay more to attract the very best teachers, the quality of their instruction will remain inadequate and their pupils will continue to fail. If hospitals in high wage regions cannot recruit well trained, highly committed nurses and are forced
:

More than we bargained for
�
to rely on agency staff instead, avoidable patient deaths will continue to occur. And if small businesses in low wage regions continue to lose staff as a direct result of the inflated salaries on offer in the public sector, they will continue to go bust, and the communities in which they are located will remain mired in poverty.
The good news is that politicians in all three main parties appear increasingly receptive to the argument that the 20th century model of centrally planned, centrally directed public services needs to be reformed, with the emphasis on radical decentralisation. The idea that service users should, wherever practicable, be empowered to ‘choose’ between competing providers, is now widely supported. But as Professor Wolf notes, the focus has, thus far, been largely on the demand side, with innovations such as nursery vouchers, ‘patient passports’, ‘pupil premia’ and other forms of entitlement designed to encourage people to seek out and obtain the services of their choice. But the supply side reforms needed to make these choices meaningful – reforms that would allow service providers to respond to the particular challenges they face or to capitalise on the specific advantages they possess – remain largely unimplemented, many of them stuck in the ‘too difficult’ tray on ministers’ desks. One such reform is Professor Wolf’s key recommendation; to replace nationally negotiated pay settlements with individually negotiated contracts. Its difficulty, however, is matched by its importance.
This monograph deliberately avoids a detailed discussion of how the transition from the current system to the proposed one might be handled – a process that will pit the cause of rational policy making against the self-interest of a number of powerful and entrenched lobbies. Instead, it focuses on the still pressing task of convincing people of the need for change – a change that any genuinely reforming government should enthusiastically support.
Julian Astle Director, CentreForum

More than we bargained for
�
Executive Summary
Britain’s centralised wage bargaining systems are bad for the country and getting more so. They create enormous barriers to the improvement of public services, and to rational decision-making at a time of fiscal crisis. They penalise our poorest regions, by distorting their labour markets and standing in the way of economic growth. They do not need to be the way they are; and they do need to be changed.
Britain has high levels of unionisation by the standards of large Western democracies, because its public services are very highly unionised. They are also extraordinarily centralised. In England, at least 20 per cent of employees are covered by public service bargaining arrangements which set not just wages but also detailed working conditions for the entire country. In recent years, local variability has been stripped away in favour of all-encompassing pay scales, applied across the sector irrespective of local conditions.
Our system is unique. It also has predictable and often harmful effects on the services people receive. In high wage areas, it is difficult to get good quality staff; researchers have shown that the impact on, for example, hospital death rates and productivity are clear and significant. Deprived neighbourhoods in high wage areas are especially badly hit, struggling to obtain good, or indeed any, GPs or good teachers. But even in low-wage areas, deprived communities lose out. There is clear evidence that, within a local area, better-off neighbourhoods get better teachers; which is as you would expect, given that pay is the same.
:

More than we bargained for
�
Rigid, national bargaining systems make it impossible to respond to local conditions. Reform proposals, across the major parties, emphasise the need to target funds to deprived communities; but wage rigidities doom the reforms before they start. For example, the much-favoured ‘pupil premium’ is intended to make poor pupils more attractive to schools, because each such child would bring more money into the school than would their more affluent peers. But if the money cannot be spent on raising salaries to attract good teachers, and if teachers’ working conditions are rigidly defined by national agreements, much of it will simply be diverted into expenditures of no relevance to pupil achievement.
National wage bargaining systems stop managers from using resources flexibly, and undermine reform. They also create a sclerotic system, which is ill-suited to anything but ever-growing expenditures.
In times of financial crisis, private sector workers can accept pay cuts and freezes to save their and their colleagues’ jobs. Standardised national agreements make this impossible. Managers are tied into uniform pay scales and mandatory annual increments; individual workforces have no ability to suggest or sign up to change. Faced with budget shortfalls (or even budget freezes) cutting services and making people redundant are, by default, the major options.
National wage bargaining also helps perpetuate England’s enormous regional inequalities. These have not declined at all under recent Labour governments, and are worse than in the early 1990s.
Public service professionals can enjoy a fine lifestyle in low wage regions with low house prices; and their local hospitals can hire good, permanent staff rather than agency workers. But the result is that, in order to attract comparable quality staff, private sector employers must pay national public sector wages. England’s poorer regions often have poor transport communications and a legacy of defunct industry, but they should have one major competitive advantage – lower wages.
More than we bargained for
�
The inflated pay imposed on poor regions via national wage bargaining is, in effect, a direct assault on that asset.
Recent governments have argued that raising skill levels is the way for poorer regions to generate economic growth, but the research literature suggests that skill differences are not the major issue. England’s poorest regions are, however, characterised by above-average levels of public service jobs, and this has become more marked, not less, in recent years. Moreover, their public sector pays better, on average, than private employers, even at the top of the income distribution. This is a recipe for continued economic dependency and decline.
Reform will be difficult, since employers, unions and governments have an interest in maintaining the status quo. However, Sweden’s example shows that it is possible, and, once achieved, very popular. Sweden moved from a system just as centralised as ours to one in which public sector employees all have their own contracts, and centrally set pay spines no longer exist. Chaos did not ensue; local union branches are extremely positive about the changes; very high levels of union membership persist.
Britain needs to rid itself of rigid centralised wage bargaining. These systems are economically harmful, undermine quality in the public services, and perpetuate disadvantage. Swedish experience shows that individual contracts are popular and successful and Britain, too, should make that change.
More than we bargained for
�
1. Introduction
Improving public services has been a challenge and a political preoccupation for many decades. Today, after a period of unprecedented expenditure and disappointing productivity, and with major cuts inevitable, this is as much the case as ever. The same is true of regional policy: regional inequalities remain as large as when New Labour won power, and larger than in the early 1990s. Finally, the uniquely centralised nature of the contemporary English state is increasingly the target of criticism, as corrosive of democracy, and as a barrier to efficient and responsive public services.1
This monograph is concerned with one particular aspect of our contemporary public services, but one which connects with all three of these major concerns: centralised wage bargaining. It argues that England’s (and more generally the UK’s) use of highly centralised pay-setting policies for most of its public services has major and negative consequences. It is a barrier to the efficient and innovative supply of services and, especially, to our ability to introduce policies aimed at helping our most disadvantaged citizens. It contributes significantly to the handicaps suffered by unsuccessful regional economies. It also derives from, and cannot be addressed separately from, the cumulative centralisation of decision making which has characterised England for thirty years.
Sections 2 and 3 place the discussion in context, with respect to both the current debate over the nature of public services, and prevailing practice in English wage bargaining.
1 Under devolution, many public services are now dealt with separately in the constituent parts of the UK. The discussion from here on therefore concentrates in England.
:

More than we bargained for
10
Section 4 presents a number of arguments about the likely impact of centralised bargaining on service quality, especially in disadvantaged communities, but also on the economy generally. Section 5 seeks to quantify the damage being done. Section 6 selects some key policy areas and summarises empirical evidence which supports the more general arguments. Section 7 discusses the reasons why centralised bargaining is so popular in England (and the UK). Finally, section 8 puts forward some concrete proposals for change.
More than we bargained for
11
2. The context: public services and the quest for productivity
Modern public services, in Britain and elsewhere, operate in a context of high expenditure, severe cost pressures and unrealised ambitions. All modern developed states are characterised by large-scale welfare provision and high levels of public spending. Countries certainly differ in the percentages of GDP spent on public services, but high expenditure levels, in absolute terms, characterise the relative ‘low spenders’ such as the United States, just as they do ‘high spenders’ such as France or Sweden.2
Countries are also all preoccupied with cost pressures in the public services. The natural tendency of contemporary public spending is to increase, as democratic electorates are wooed with expenditures which turn into entitlements, as populations age and pension costs mount, and as a prosperous citizenry demands higher quality services, especially in health. The areas in which governments are most heavily involved are also those where people cannot easily be replaced by machines; most notably health, care of the elderly and disabled, and education. These are, for exactly that reason, areas in which productivity increases are difficult to achieve.�
Finally, the combination of these pressures, and of our societies’ aspirations, means that public services (and governments) are constantly seen to ‘fail’. They are criticised because they do not, for example, succeed in equalising
2 American public spending on health care, as a proportion of GDP, is at the top end for the OECD.
3 See eg R Towse ed, ‘Baumol’s cost disease’, 1997.
:
More than we bargained for
1�
educational opportunity across and among social groups, or do not always provide the health care citizens want and expect, or do not always succeed in protecting us from physical risks and dangers. Often this ‘failure’ is exaggerated as a result of political competition (which gives politicians a strong incentive to criticise the present, and contrast it with the promised future) and of a media hungry for new stories and bad news. But failures are nonetheless often real – and they matter, in relation to deep-seated social commitments and values.4
The fact that most public services tend naturally to be ‘low productivity growth’ activities, and that failure is common, does not, however, mean that there are no opportunities for substantial improvement. In recent years, two general strategies have been embraced by governments in pursuit of greater efficiency and effectiveness. The first is political decentralisation; the second is the introduction of market characteristics in the way public services are purchased and delivered.
Unlike most of its European neighbours, England has not embraced decentralisation of government activity from central to local political bodies: on the contrary.� It has, however, been at the forefront of moves to encourage productivity improvements and secure quality in public services through quasi-market mechanisms and an increase in user choice. Unfortunately, it has been preoccupied, in some of its most important public services, with reforms in the way ‘demand’ operates, to the near-exclusion of ‘supply’ reforms. This was and is a mistake; as explained below, it greatly reduces the extent to which improvements are possible, even in theory.
4 Contemporary individuals, and political groups, differ in whether they emphasise equality of outcomes, or equality of opportunity and equality before the law; but modern democratic and liberal societies all rest on fundamental assumptions about human equality.
5 There has been one major decentralisation initiative, namely the devolution of powers to Scotland and Wales by the Blair governments. Otherwise, within England, both the Conservative governments of 1979-97, and the New Labour governments from 1997 on, have consistently reduced the revenue-raising and decision-making powers of local government, and exerted detailed control over the activities of bodies providing public services. See e.g. S Jenkins, ‘Big Bang Localism’, Policy Exchange, 2002.
More than we bargained for
1�
‘mArket-bAsed’ reforms The key arguments for introducing market characteristics into public service delivery are the same as those put forward in support of a market-based rather than a centrally planned economy. They are that markets can reflect and respond to myriad individual preferences in a way no central planner can, and that competition is, in theory and in practice, the greatest single spur to both efficiency and innovation. If the people or institutions providing a service have to compete for custom, with their income depending on how many citizens and ‘users’ select them, then they will have a strong incentive to provide better quality. The best will be most successful, while those which provide a very poor quality service or product will find that their customers abandon them entirely. Policy-makers who embrace ‘marketisation’ do so in the hope and expectation not only that the best providers will succeed and grow, but also that there will be general improvement across the board, as people strive to avoid losing clients or customers.
These arguments have been important in both of Britain’s giant public service sectors, education and health. They underpinned the Conservatives’ major school reforms of the late 1980s and 1990s, whereby parents were allowed to choose their schools, and information on school performance was published centrally in order to aid such choice. These reforms were continued almost without exception under Tony Blair. Pro-market arguments also inform the generally less coherent and zig-zagging history of health policy since the 1980s, with GP commissioning introduced, then abolished, then re-introduced in modified form; and spluttering attempts to use private sector providers for particular operations and policies designed to offer patients a choice of hospital.
All of these reforms aim to put choice and ‘purchase’ decisions in the hands of either service users or their individually chosen agents (their GP or a designated family member, for example). However, a public services quasi-market remains fundamentally different from a private sector market.

More than we bargained for
1�
First, the size of the market is determined not by people’s individual valuations of the services, and by how much they, in total, wish to spend, but by what the government, in total, wishes to. Although in some countries individuals are able routinely to top up publicly funded payments for services,6 these top ups tend to make up a relatively small proportion of total expenditure and/or be capped.7 In other words, total demand is fully or largely pre-determined, in a way that demand for a privately produced and privately purchased product is not. Within that context, choice mechanisms will then affect, for better or worse, the nature, quality and quantity of what is supplied.
However, quasi-markets may also differ fundamentally from ‘full’ markets in terms of supply. Governments may allow or encourage people to choose their service provider while at the same time rigidly controlling the number of providers, who they are, and how they operate. This is very common in English quasi-markets where policy-makers (and commentators) have been preoccupied with whether or not people are allowed to ‘choose’, and far less concerned with what they have to choose from.8
This is deeply mistaken, because it is changes on the supply side that ultimately determine whether there is productivity growth and greater efficiency in delivering existing types of service, and/or innovation and changes in overall quality. It is
6 For example, in Belgium and the Netherlands, the state provides health care for all, through a social insurance system which underwrites those unable to pay; but it allows citizens to opt for a number of different levels of care, paying additional amounts according to the option chosen.
7 University fees are an example of co-payment where the amount paid is tightly controlled, and the co-payment mandatory. Until very recently, UK policy was generally opposed to any voluntary topping up, by the individual, of publicly-funded services. However, in the face of enormous public pressure, the government, in 2008, agreed that individuals might purchase additional expensive drugs (from a highly circumscribed list) without thereby losing any entitlement to publicly-funded (NHS) health care. Until this decision was forced on ministers, anyone who paid for any of their treatment had to pay for all of it.
8 There have also been reforms which demand competitive tendering and ‘contestability’ in the supply of public services – i.e. competition between suppliers, combined with the possibility of new entrants. These, however, have largely involved government as purchasers, rather than individuals: for example, local authorities awarding tenders for refuse collection.

More than we bargained for
1�
no good deciding that individual users, rather than government officials, should be the people who ‘demand’ something if there is no mechanism for supply to change as a result.
There are very few cases, in contemporary England, where public service reforms on the supply side and on the demand side have been combined. One such is the introduction of individually held care budgets. These allow individuals, such as the seriously disabled or housebound, to decide for themselves how they will spend the money allocated to their care, and where they will spend it – that is, which suppliers they will use. These are proving highly popular, but also remain highly controversial, and are currently confined to limited pilots.9
Elsewhere, supply remains highly constrained: and the problem this creates is well illustrated by school choice policies. These are generally popular with parents, in the sense that there is little support for (re)creating a situation where pupils are allocated to schools by local authorities, or obliged to attend the school nearest them. However, a very large number of parents and children, especially in large cities, still do not get a place in their first choice of school (or even their second or third) and end up with schools they do not really want.
It is almost certainly impossible for everyone, in any feasible situation, to get their first choice of school. But present policies nonetheless reduce effective choice enormously because local authorities are unwilling to allow popular schools to expand, and very few new schools are established or given permission to open. In this situation, the impact of parental demand on supply is very limited (and the pressure on schools to respond is also reduced, since they will get pupils anyway). A growing awareness of this explains the substantial cross-party support for allowing new state schools to be set up more easily: something which is now official Conservative party policy.
However, supply constraints go well beyond restrictions on who can offer a service, and on whether they can expand (or contract) in size. Myriad additional constraints on supplier
9 See research carried out by the Individual Budgets Evaluation Network and by the Social Care Institute for Excellence.
More than we bargained for
1�
behaviour also exist. Many have been introduced, over the years, on the grounds that they protect consumers or the general public; many others on the grounds that they protect employees from exploitation. Some apply to both private and public sector providers, some to only one. What they all have in common is that they constrain suppliers’ freedom of action – but it is on that freedom of action, that ability to respond to demand competitively (that is, differently), that the argument for markets’ greater efficiency rests.
It is important, therefore, to be confident that restraints on supply really are important, and that their benefits clearly outweigh their disadvantages. Extreme cases sometimes make the headlines: 2009’s prize example involved two English policewomen and mothers, swapping childcare, who were informed – quite correctly under extant law – that they must register and be subject to regular government inspection, or desist immediately from helping each other out. But most regulatory activity, and most constraints on suppliers’ behaviour, are far less dramatic, far less open to ridicule; typically, they lay down stringent requirements for record-keeping, governance, inspections, plant, premises and equipment, and personnel functions. In so doing, they place very large administrative and financial burdens on suppliers (especially small suppliers), and make it very difficult to, for example, open a nursery or nursing home, let alone a school.
This monograph is concerned with some of the most pervasive and major constraints on the behaviour of contemporary suppliers of public services: those imposed via industry or sector-wide central bargaining over wages and conditions of service. Such centrally imposed agreements can limit suppliers’ behaviour tightly, making it hard either to innovate, or to realise major efficiencies. They find friends among some employers, as well as among unions and among many employees. But they can also impose very serious costs on society.
In the UK, central bargaining currently affects the organisation and quality of the public services to an enormous and generally unrecognised degree. On balance, it does so for the worse. It constrains supply, acts as a drag on productivity, and blocks

More than we bargained for
1�
innovation. It also has unintended and negative economic consequences for large segments of the community. If we are serious about improving public service quality, and serious about tackling the glaring economic inequalities in our society, we need to change.
More than we bargained for
1�
3. Public sector employment and pay
Historically, across the world, central bargaining has characterised many sectors in the private as well as the public sector. Today, it is increasingly a public sector phenomenon. It is also particularly important in a few countries, including the UK.
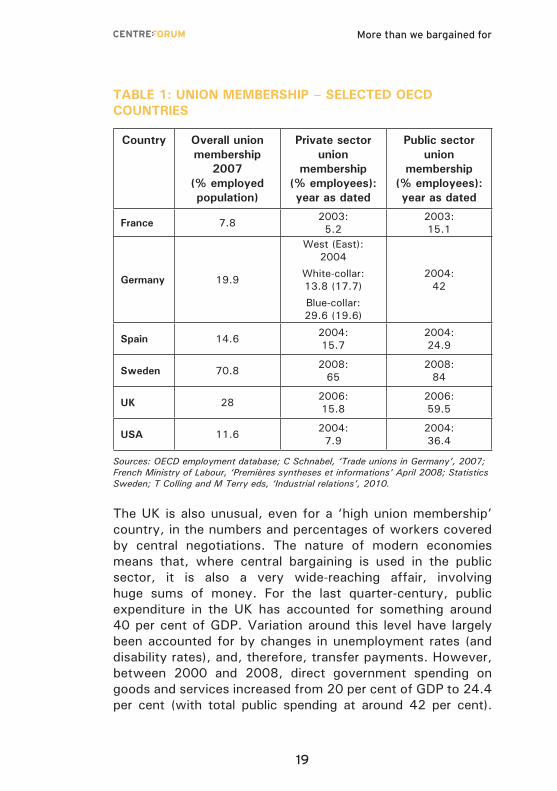
Within the ‘rich man’s club’ of the OECD, overall levels of union membership are quite low. They are highest, by a large margin, in the Nordic countries; but otherwise, only Belgium and Canada (the latter by a tiny margin) have higher levels of union membership than the UK.10 Membership levels have been declining everywhere in recent years (even in Scandinavia); and everywhere are higher in the public than the private sector.
Table 1 illustrates this pattern for selected countries. It shows quite clearly that, compared to the major European countries and the US, Britain currently has unusually high levels of public sector union membership, and a consequently large gap between public and private membership levels.
10 In Denmark it is 69 per cent, in Finland 70 per cent, in Norway 54 per cent and in Belgium 53 per cent. All figures for 2007. OECD Employment Database, 2009.
:
More than we bargained for
1�
tAble 1: unIon membershIP – selected oecd countrIes
country overall union membership
2007 (% employed population)
Private sector union
membership (% employees): year as dated
Public sector union
membership (% employees): year as dated
france 7.8 2003: 5.2
2003: 15.1
germany 19.9
West (East): 2004
White-collar: 13.8 (17.7)
Blue-collar: 29.6 (19.6)
2004: 42
spain 14.6 2004: 15.7
2004: 24.9
sweden 70.8 2008: 65
2008: 84
uk 28 2006: 15.8
2006: 59.5
usA 11.6 2004: 7.9
2004: 36.4
Sources: OECD employment database; C Schnabel, ‘Trade unions in Germany’, 2007; French Ministry of Labour, ‘Premières syntheses et informations’ April 2008; Statistics Sweden; T Colling and M Terry eds, ‘Industrial relations’, 2010.
The UK is also unusual, even for a ‘high union membership’ country, in the numbers and percentages of workers covered by central negotiations. The nature of modern economies means that, where central bargaining is used in the public sector, it is also a very wide-reaching affair, involving huge sums of money. For the last quarter-century, public expenditure in the UK has accounted for something around 40 per cent of GDP. Variation around this level have largely been accounted for by changes in unemployment rates (and disability rates), and, therefore, transfer payments. However, between 2000 and 2008, direct government spending on goods and services increased from 20 per cent of GDP to 24.4 per cent (with total public spending at around 42 per cent).
More than we bargained for
�0
Increases in services, especially in health and education – where most of the rise in direct spending occurred – largely involve increased spending on the people who provide and deliver them, although there was also a significant increase in capital spending by government.
In 2008, before the recession led to a sudden increase in counter-cyclical spending (including bank bail-outs), a little over a quarter of total public spending was accounted for by salary costs for public sector employees.11 If current policies and trends remain unchanged, this is likely to increase, without any increases in employed numbers, simply by virtue of public sector pensions (financed largely out of current tax revenues) increasing with recipient longevity. For example, in 2007-08 teacher pension costs were already 17.5 per cent of the DCSF’s total departmental spending. By 2010-11 – just three years on – the amount spent on pensions is, according to the department’s own figures, set to increase by 15 per cent.12
A more concrete indicator of the scale of provision can be found in public sector employment figures. A figure of 5,469,000 public sector employees in 2008 in England was provided by the ONS’s Annual Survey of Hours and Earnings:13 however, this needs to be treated as one possible rather than the definitive figure, because of the difficulty of defining ‘public sector’. Government figures for numbers of public sector employees, derived from information provided by public bodies, are, in England, consistently lower – by anything up to a million people – than the figures derived from the large,
11 S Bach, ‘Public sector employment relations; the challenge of modernisation’, in T Colling & M Terry eds, ‘Industrial Relations’, 2010 (in press). This figure does not include salary costs for people employed by private companies, but working on government contracts.
12 Department for Children Schools and Families, ‘Annual departmental report’, 2008. Annex A.
13 The total for the UK, excluding Northern Ireland, is 6,636,000. In England, public sector employees/jobs, on this definition, amount to 25 per cent of the workforce/number of jobs: in Scotland they are 36 per cent and in Wales 35 per cent. ONS Annual Survey of Hours and Earnings, 2008.
More than we bargained for
�1
quarterly Labour Force Survey.14 The latter asks individuals, directly, which sector they work in. Government estimates rely on information collected directly from bodies which are defined as public sector, asking them how many people they employ.15 This excludes universities and GPs, as well as the (many) temporary and agency staff employed in public sector settings. Both estimates, moreover, aim to exclude individuals working for private organisations that are entirely or largely contracted to provide services on behalf of public bodies.16
For the purposes of this paper, the figures of most interest are the numbers whose pay and conditions are directly determined by national agreements involving government agencies. The discussion below concentrates on England, but the complex nature of devolution means that, in a few areas, wage bargaining is specific to England, while in others it covers England plus one, two or all three other parts of the UK. National agreements which include England involve all the groups shown in Box 1, totalling over four and a half million people.
14 A Barnard, ‘Regional analysis of public sector employment’, Economic and Labour Market Review, July 2008, pp. 31-36. Some of these differences are because of clear definitional differences. (The LFS treats universities and GPs as public sector and the National Accounts definitions do not.) Some relate to LFS respondents’ perception of their sector: – for example, someone working in a school kitchen may see themselves as working for the school (public sector) and respond that the school employs them in response to the LFS interviewer. If they are in fact being paid by a private organisation with a contract from the LEA to provide the meals, they will be classified for National Accounts purposes as private sector.
15 The figures are collected by ONS and appear in the Annual Survey of Hours and Earnings. For this paper, all data on annual earnings by sector and region, and on numbers of jobs, are taken from this source, with annual earnings computed on the basis of gross weekly pay figures.
16 In 2008, the Financial Times estimated that, on the basis of who was actually paying people’s salaries, up to two-thirds of the 3.8 million jobs created since 1997 were actually in the public sector, and that, for women, this was true of 90 per cent of the ‘new’ jobs. S Briscoe and C Giles, ‘Public sector fuelled the jobs boom’, Financial Times, November 24 2008.

More than we bargained for
��
Box 1: Public sector workers covered by national agreements over pay and conditions
1. local government workersWages are agreed not at individual council level, but through the National Joint Council for Local Government Services. Pay is governed by a national framework, agreed in 1997, ‘The Single Status Agreement’. Although this allows for some local modifications, the main determinant of wage levels remains a national agreement: for example, in 2008-9, the employers’ offer of an across-the-board increase of 2.45 per cent went to arbitration, and ACAS increased the award to 2.75 per cent. TOTAL: 1.4 million, ranging from professionals to support staff.
2. workers whose earnings and conditions are determined by pay review bodiesSchool teachers, doctors and dentists, nurses and other health professionals, prison service, armed forces, senior salaries; and the police, whose Police Negotiating Board is supported by the same secretariat (the Office of Manpower Economics) as the pay review bodies. This included 480,000 teachers (377,000 of them full time) in 2009 in England; while NHS staff numbers are estimated at 1.5 million for the UK. TOTAL: between 1.8 million and 2 million (England).i
3. university employeesWhile universities are not obliged to participate in national bargaining, they almost without exception do so, through the Universities and Colleges’ Employers’ Association, which negotiates with the unions recruiting in the sector, in the Joint Negotiating Committee for Higher Education Staff. TOTAL: 198,000 staff.ii
4. further education employees. Colleges are not obliged to participate in national negotiations, but the vast majority do so, through the Association of Colleges, and implement its national pay agreements. The AOC is is a member of the National Joint Forum, where it negotiates with the six unions that recruit in/cover the sector. The sector skill council for further education estimates that 175,000 staff are covered; the Association of Colleges

More than we bargained for
��
estimates that 263,000 are employed UK-wide, but this includes sixth form colleges.iii
TOTAL: At least 200,000 in England.
5. civil service departments and agenciesThese are each responsible for their own recruitment, salaries and gradings, rather than all being subject to the same single national scale and conditions, as is common to public sector workers. This departmental autonomy was introduced in the early 1990s, under the Conservatives, but has never been reversed under Labour. Agreements apply across the whole of a department, however; and nearly three-quarters of civil servants work outside London and the South-east, while many departments are very large. (For example, over 100,000 work for the Department of Work and Pensions and 86,000 for Revenue and Customs.) TOTAL: 500,000 UK-wide.
6. the royal mail groupTOTAL: 176,000 employees (162,000 of whom work for Royal Mail itself).
7. school support staff (from 2010) This category has increased in size enormously in recent years, but figures are available only in FTE (Full Time Equivalent) rather than head-count form. These increased from 136,460 FTE in English maintained schools in 1997 to 268,560 FTE in 2005, 326,600 FTE in 2008 and 346,900 FTE in January 2009.iv
TOTAL: at least 380,000 employees.v
GRAND TOTAL: Between 4.6 and 5 million (England only).
i The Office of Manpower estimated in 2008 that agreements covered 1.8 million individuals in England. However, headcounts are not available for all sectors (as opposed to Full Time Equivalent numbers): and NHS coverage has recently been expanded following implementation of Agenda for Change (see Box 2). Headcounts for teaching staff are from the Department of Children, Schools and Families Statistical First Release 23/2009.
ii Higher Education Statistical Agency Staff Record, 2007/8.
iii LLUK annual workforce diversity profile, www.lluk.org, Association of Colleges statistics, www.aoc.co.uk.
iv Many support staff work part-time, so the absolute number of individuals is likely to be much higher. DCSF Statistical First Releases http://www.dcsf.gov.uk/rsgateway/DB/SFR/.
v A lower bound, based on the relationship between FTEs and headcounts for fully qualified teachers in England.
More than we bargained for
��
With the exception of universities, all of the groups listed in Box 1 are included in the overall figures for public sector employees provided by the ONS’s Annual Survey of Hours and Earnings.17 Data from the most recent Workplace Employment Relations Survey (WERS) indicate that, in 2004, 92 per cent of local public sector managers had to follow policy on pay that was set elsewhere in their organisation.18 It therefore seems reasonable to assume that, as a lower bound, 80 per cent of public sector employees are involved in national agreements: which means that, for England, at least 20 per cent of jobs in the economy currently fall in this category.
Most of these groups have been engaged in national bargaining for many years. Moreover, the history of national agreements is not as predictable as one might expect. It has not been a question of Tories abolishing, and Labour re-introducing such arrangements.
The Thatcher governments did introduce compulsory competitive tendering for many activities in central and local government and in health. The wages and conditions of those transferring to private and not-for-profit employers are protected under Transfer of Undertakings (Protection of Employment) Regulations (TUPE).19 The regulations, which derive from EU Directives, protect the employment rights and conditions of employees whose employer changes as a result of take-overs, outsourcing of activities and so on. Hence, in addition to those who are directly employed by public bodies, national agreements may also apply to workers currently employed by private or not-for-profit contractors. Nonetheless, these reforms have tended, over time, to reduce the numbers covered by central agreements.20
17 The total for the UK, excluding Northern Ireland, is 6,636,000. See footnote 13 above.
18 S Bach, K. Givan and J. Forth, ‘The public sector in transition’, in W Brown et al eds., ‘The evolution of the modern workplace: a quarter century of change’, 2009.
19 www.berr.gov.uk/whatwedo/employment/trade-union-rights/tupe/page16289.html.
20 See eg S Bach, ‘Public sector employment relations; the challenge of modernisation’, in T Colling and M Terry eds, ‘Industrial relations’, 2010.
More than we bargained for
��
Conservative governments also abolished the previously highly centralised and controlled nature of central government civil service pay. This change was originally associated with the introduction of agencies with freedom to set their own pay regime, but was then extended to government departments proper; although, as noted in Box 1, a given department’s centralised procedures may cover many thousands of people.
However, as Bach and Winchester predicted, Conservative governments’ belief in marketisation did not extend to ceding central control over salaries and wages in the public sector.21 The 1997 ‘single status’ agreement for local government, using a national pay spine, was in fact developed under Conservative governments. There was also a marked retreat from local pay bargaining within the NHS during the 1990s overall (and so largely under the Conservatives), because, in Stephen Bach’s view, of ‘managerial reluctance to antagonize the workforce in a context of forceful union opposition, alongside limited managerial skills and severe financial constraints.’22
Recent (post-1997) Labour governments accepted many of the Thatcher governments’ changes (including the use of competitive tendering) and have not, for example, reinstituted central (for which read Treasury) control over government departments’ pay. However, Labour has also extended the overall scope of central bargaining, having decided that school support staff are to be covered by national negotiations. This change was agreed with the major public service unions by a succession of Education Secretaries. The new pay and conditions framework will come into place in spring 2010, and covers hundreds of thousands of employees who, up to now, have had no such central machinery of their own. Moreover, the change will include support staff in Academies, which are currently not obliged to use national scales for any of their staff.
21 S Bach and D Winchester, ‘Opting out of pay devolution? Prospects for local pay bargaining in UK public services’, British Journal of Industrial Relations, 1994, pp 263-82..
22 S Bach, K Givan and J Forth, ‘The public sector in transition’, 2009.

More than we bargained for
��
chAnges In the nAture of centrAl AgreementsAlthough Labour has not made many changes to the groups covered by central bargaining, it has introduced other changes which increase the importance of centrally-determined agreements, and restrict managers’ freedom of action with respect to pay and conditions. These have been introduced as part of its ‘modernisation agenda’ (sic).
The number and size of Pay Review Bodies have increased (see Box 1). These bodies, which enjoy formal independence, are supposed to arrive at an ‘informed’ and data-based view of what demand and supply factors in a particular occupation indicate pay levels should be, and their recommendations to government on this matter then inform the latter’s decisions. They now cover over 40 per cent of public sector employees; moreover, they are encouraged to look at a whole range of job-related issues, and not just pay. In general, the bargaining process and resulting pay scales have been treated, over the last decade, as a mechanism through which central government could pursue substantive objectives such as gender equality and job flexibility.
The result has been agreements which lay down multiple and specific requirements relating to working conditions. For example, the activities of the School Teachers’ Review Body led to a national agreement, in 2003, which included a long list of administrative tasks which should no longer be carried out by teachers.
In the NHS a highly complex pay structure had developed over many years. This has now been replaced with a simpler consolidated one where progression, for everyone except doctors, dentists and some managers, is linked to a nationally agreed ‘Knowledge and Skills Framework’, and people can only progress when they demonstrate competence against this (See Box 2).
The university sector similarly signed up to a ‘Modernisation Agenda’ which has involved putting all but the most senior employees, academic and non-academic, on a single,
More than we bargained for
��
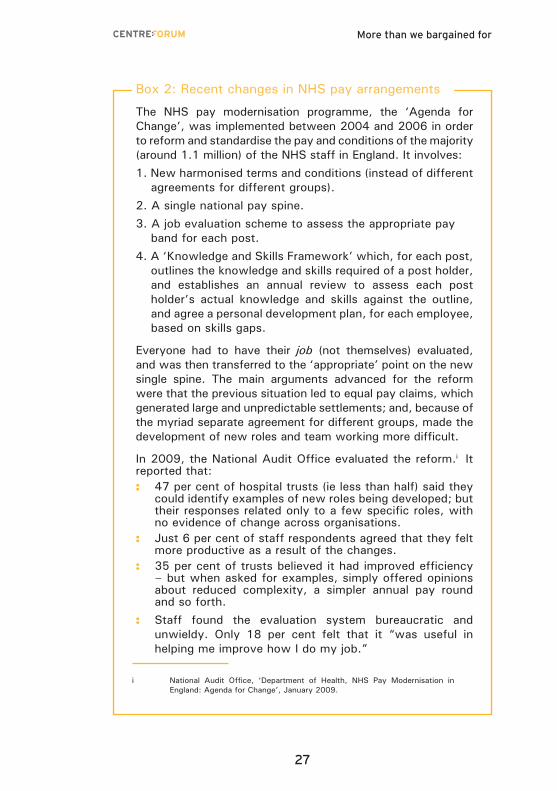
Box 2: Recent changes in NHS pay arrangements
The NHS pay modernisation programme, the ‘Agenda for Change’, was implemented between 2004 and 2006 in order to reform and standardise the pay and conditions of the majority (around 1.1 million) of the NHS staff in England. It involves:1. New harmonised terms and conditions (instead of different
agreements for different groups).2. A single national pay spine.3. A job evaluation scheme to assess the appropriate pay
band for each post.4. A ‘Knowledge and Skills Framework’ which, for each post,
outlines the knowledge and skills required of a post holder, and establishes an annual review to assess each post holder’s actual knowledge and skills against the outline, and agree a personal development plan, for each employee, based on skills gaps.
Everyone had to have their job (not themselves) evaluated, and was then transferred to the ‘appropriate’ point on the new single spine. The main arguments advanced for the reform were that the previous situation led to equal pay claims, which generated large and unpredictable settlements; and, because of the myriad separate agreement for different groups, made the development of new roles and team working more difficult.
In 2009, the National Audit Office evaluated the reform.i It reported that:
47 per cent of hospital trusts (ie less than half) said they could identify examples of new roles being developed; but their responses related only to a few specific roles, with no evidence of change across organisations.Just 6 per cent of staff respondents agreed that they felt more productive as a result of the changes. 35 per cent of trusts believed it had improved efficiency – but when asked for examples, simply offered opinions about reduced complexity, a simpler annual pay round and so forth.Staff found the evaluation system bureaucratic and unwieldy. Only 18 per cent felt that it “was useful in helping me improve how I do my job.”
i National Audit Office, ‘Department of Health, NHS Pay Modernisation in England: Agenda for Change’, January 2009.
:
:
:
:
More than we bargained for
��
nationally agreed, 51-point national scale, and then evaluating every job for its content and ‘contribution’, before amending pay accordingly. As with the NHS reforms, what determines pay is not individual performance, but the way the post is defined, and where this places it on the unified spine. Such reforms generally increase costs, since giving people more pay is always popular, while a pay cut is strongly resisted. Personnel departments and managers thus have a very strong incentive to find reasons not to demote and cut, while at the same time being constrained to increase the pay of people who appear to be unfavourably treated compared to others doing the ‘same’ job.
The NAO concluded (see Box 2) that the ‘Agenda for Change’ reforms in the NHS did not have a major direct impact on total wage bills, probably because they took place within a context of rapidly rising expenditures and extremely generous across-the-board pay settlements. In contrast, UCEA (the University and Colleges Employers Association) reported in 2008 that 8.6 per cent of academics and 15 per cent of support staff had received a pay upgrade in light of their ‘Modernisation Agenda’ job evaluation. In contrast just 2.4 per cent of academics and 6.8 per cent of support staff had their pay frozen, because they were on ‘too high’ a salary.23 In my own institution, for example, our finance office calculated that, 80 per cent of the way through implementation of the new unified pay-scale (with people transferring onto the point for which they had been evaluated), the net cost to the university was about £3 million a year. While such an increase may amount to only a couple of percentage points of turnover, it is also equivalent to several times the pay increase university employers feel they can offer in 2010, and about 20 per cent of the savings now being sought in the face of large cuts in government spending in higher education.
Generally, across the public sector, the ‘modernisation agenda’ has tended to generate big increases for lower paid and
23 Times Higher Education Supplement, 6 March 2008, p. 4.
More than we bargained for
��
especially lower paid female employees. In fact, it seems clear, both from the research literature and from direct comments by senior civil servants (for example, to the NAO), that the reforms were in substantial part a response to a continuing series of ‘equal pay’ claims.24 Because of the national wage bargaining machinery, any successful claims of this sort, even if made in one small locality, have enormous, unpredictable, and country-wide repercussions.
It is only continuing increases in public spending during recent years that have enabled managers to fund them while also maintaining or increasing employment levels – albeit with difficulty, even during the recent ‘seven fat years’ of central government largesse. For example, in September 2008 – the same month that Bradford and Bingley collapsed – central government authorised councils to undertake an additional £450 million of emergency borrowing to help fund the new pay agreements and back pay agreed for low paid women. The changes required by equal pay settlement for low paid women are estimated to have cost local government £3 billion.
In summary, over the last two decades there has been a big increase in the scope and coverage of national agreements over ‘conditions’ as well as pay for public sector workers. The result is that England is now characterised to an unusual degree by nationally agreed pay scales and agreements, covering a very sizeable proportion of the workforce.
24 See S Bach, K Givan and J Forth, ‘The public sector in transition’, 2009. The ‘Modernisation Agenda’ was explicitly intended to ensure that public sector pay was fully in accordance with the requirements of equal pay legislation.
More than we bargained for
�0
4. National bargaining, incentives, and behaviour
As we have seen, the UK (and its constituent countries) has high public sector union membership by OECD standards, and unusually high levels of highly directive centralised bargaining over wages and conditions in the public services. It is tempting to see the two as completely intertwined – high union membership created by and generating central negotiations. In fact, as discussed later, this is not true: one can have high union membership levels and quite decentralised bargaining. What national wage bargaining does require and support, however, are powerful national, or central, trade union offices.
It is also true that, as a general phenomenon, membership density is higher among public sector than private sector employees (see table 1 above). The gap between public and private sectors is unusually large in the UK, but the pattern is the standard one.
This reflects a number of factors, including average enterprise size;25 but among them, a positive preference, on the part of governments and public sector employers, for negotiating with unions, and the opposite tendency among private-sector employers. One result is that, in modern societies, some of the largest and most important unions represent the skilled professionals who make up a large proportion of modern public sector workforces. In the US, the most politically influential unions are those of the teachers; while in the UK,
25 Union membership is higher in large organisations; and public sector organisations are larger on average than private ones. See e.g. N Millward, A Bryson and J Forth, ’All change at work?’ 2000.
:
More than we bargained for
�1
many people (including the author) would nominate the British Medical Association (BMA) as the most powerful British union by a large margin.
A preference for conducting wage negotiations with unions will obviously apply to governments headed by political parties with strong, formal links to the unions, and major financial support from them, like the British Labour Party. But it is by no means confined to them. The reasons for this preference are discussed below (see Section 6); but at this point, we need only note it, and also reiterate that this does not, in itself, imply national wage bargaining. The negotiation of pay scales for public sector workers can, and in many countries does, take place at local, state and regional levels.
In general, of course, ‘he who pays the piper calls the tune’; pay bargaining arrangements provide numerous examples of this. In the US, states have come to contribute greater proportions of school expenditure (often under revenue-equalising programmes), even though schools are a local responsibility. Hence teacher salaries are also tending to be set at state, not school district level.26 And in England, ever greater central control over pay has gone hand in hand with ever greater centralisation, both substantively (in the level of direct management control) and/or through the decline or disappearance of almost all financial and revenue-raising autonomy for local government.
Why might this matter? Because using national-level, centralised bargaining for public sector employees can have a major impact on regional and local economies, and on the quality of public services in a given area. The nature and size of actual effects is an empirical question; they are larger in some countries than others, and the evidence indicates that, in England, they are large and often harmful. Before turning to this evidence, however, it is important to separate out a number of different possible connections between bargaining
26 Between 1972 and 2002, the proportion of expenditure of school education from state sources rose from 44 per cent to 56 per cent, though with major variations between states. US Bureau of the Census, ‘State and local government finances’, 2007.
More than we bargained for
��
structures on the one hand, and the quality of services, and of economic development, on the other.
wAge bArgAInIng Processes In a competitive market, wages are determined largely by the balance between supply and demand. Individual employers will pay more the more people contribute to output and the higher the level of final demand among consumers. Individual workers, given their skills, will accept offers depending on financial rewards but also the difficulty of the job, working conditions, and opportunities to progress. Of course, markets are, in reality, far from perfect, but in most countries private sector wages can and do reflect this balance quite clearly. Wages on North Sea oil platforms are high partly because specific skills are needed but also because of the unpleasant working conditions. Wages for highly-skilled young actors and musicians are very low indeed – indeed young actors will, literally, perform for nothing – because of an enormous over-supply for these intrinsically rewarding jobs.
Public services, even those with quite developed quasi-market elements, are fundamentally different from the private sector, above all because total demand is decided largely or entirely by government appropriations, not by consumer demand. However, this still leaves room for enormous variation in terms of where government appropriations are decided (nationally, or by states, regions, localities), the extent to which public sector pay and conditions are highly standardised and/or determined by formal bargaining, and in the level at which such bargaining takes place.
As we have seen, contemporary Britain is characterised by central bargaining structures which, in much of the public sector, set very detailed conditions for pay, and, in a number of occupations, for other conditions of service as well. The result is dramatically different from the situation in a competitive market, where pay is negotiated between individual employees and employers: in our public services “pay…is better described as a bargain between trade unions
More than we bargained for
��
and the relevant secretary of state, with a pay review body to act as a referee.”27
Crucially, pay and conditions are agreed irrespective of where a job is to be carried out (with the exception of small London allowances), or of the conditions under which the individual will work. The underlying assumption is that supply is spread evenly across the country, and that a given rate of pay will be equally attractive everywhere. The assumption is also made that working conditions are generally equivalent, and therefore, for a given job, a standard pay-and-conditions package is appropriate.
the consequences of stAndArdIsAtIonIf it were indeed the case that public sector jobs across the country were equivalent in their attractiveness, and supply was also evenly spread, standardised national wage bargaining would give every workplace an equal chance of hiring good quality staff, and every service user an equal chance of receiving good quality services. In contemporary England (and the UK) this seems highly implausible. Instead it seems probable that, under conditions of national wage bargaining regions, and areas within regions, will vary significantly in the degree to which public sector jobs are more or less attractive than private sector ones. A number of things then follow:
Places will differ significantly in their capacity to attract high quality public sector personnel. Such differences may apply at regional, county or travel-to-work area level.In regions where public sector pay rates are not attractive, it will generally be more difficult to attract high quality public sector professionals. Overall, the quality of provision will fall below that on offer in lower-pay regions; while the wealthy in such regions will correspondingly be more likely to opt out of public provision.
27 R Harding, ‘Poverty pay: how public sector pay fails deprived areas’, Social Market Foundation, 2007, p.13.
:
:
More than we bargained for
��
The impact of standardised pay and conditions may compound the effects of deprivation in some areas. There are large differences in the working conditions associated with many public sector jobs, notably those involving direct provision to deprived communities and individuals. Standardised conditions preclude paying people more to offset this.In regions where public sector pay rates are highly attractive, it will be more difficult for private sector employers to attract high quality staff. This will tend to further handicap regions which are struggling to generate private sector jobs and wealth creation. The major losers will be the least skilled/most deprived communities within these regions.Conversely, for central government, regional differences will offer attractive opportunities to ‘outsource’ a number of standardised nation-wide activities (for example tax and motor vehicle related functions) to low-wage areas, and obtain higher-quality staffing overall than would be possible if they were spread nationally. (Such outsourcing is also very popular with local politicians who thereby ‘bring jobs’ to their constituencies.) This will be of direct benefit to all users of these services, whether high-end taxpayers, car drivers and purchasers, or recipients of tax credits and pensions.
While the internal logic of these arguments holds generally, countries may differ greatly in the size of these effects, and, therefore, in whether any of this really matters. Some will have very large variations in local costs, unemployment rates, private sector salaries and wages, and the proportion of jobs that are in the public sector; in which case use of standardised pay and conditions across the public sector will set up a self-reinforcing and destructive dynamic. But if a country starts off with fairly standard conditions between regions and among areas within a region, then none of the scenarios outlines above will matter very much. In England, as we shall see, differences are very large; and the results are
:
:
:
More than we bargained for
��
correspondingly and seriously harmful, especially for our most deprived communities.
Obviously these arguments take it as given that quality differences exist among public service employees, and that we should care about them – an assumption supported by a growing body of research evidence. Education, for example, is one of the largest public services in every country: and it is every child and parent’s conviction that the quality of teachers matter. Teachers, however good, cannot easily off-set all the disadvantages (or advantages) created by family background or concentrations of low or high-achieving peers. But they can make a substantial difference to attainment28 – which is why low income parents’ determination to get their children into schools with a high reputation is entirely rational. Doctors are demonstrably not all the same; local governments vary greatly in how well they run services that range from social care provision to rubbish collection; the quality of traffic management and public transport affects economic productivity directly. So if pay structures have a major impact on quality between localities and regions, this matters – and the evidence for England is that they do.
the consequences for PublIc servIces: emPIrIcAl evIdenceThe empirical research supporting these arguments covers a number of separate points. First of all, there is clear evidence that places differ markedly in their ability to attract high quality public services personnel, and that this directly affects service quality. In England, important recent evidence of the impact of local labour markets comes from a study by Hall, Propper and Van Reenan, entitled ‘Can pay regulation kill?’ Like this
28 See e.g. C Clotfelter, H Ladd and J Vigdor, ‘How and why do teacher credentials matter for student achievement?’, Economics of Education Review, (forthcoming). The authors conclude that teachers’ mathematics attainments (measured in terms of their substantive command of material) have as much impact on elementary students’ attainment as does parental education. See also E Hanushek, ’Education production functions’, in ‘The new Palgrave dictionary of economics’ 2008, and J Astle, ‘The surest route: early years education and life chances’, CentreForum, 2007.
More than we bargained for
��
author, they believe that centralised wage setting is an ‘under-studied form of regulation’, and that regulations which impose nominal wage equality will have ‘unintended effects on both labour supply and the quality of service provision in areas with strong local labour markets.’29 In the case of England, where current regional differences are generally very high (see below for a detailed discussion), female white-collar wages are, in their estimation, currently 60 per cent lower in North-East England than in London, while additional ‘London allowances’ for nursing staff allow for a maximum 11 per cent difference between high and low cost areas.
Not surprisingly, there are direct and major repercussions for hospitals hiring nurses, who account for over half of the clinical staff in hospitals. Faced with worse quality applicants for posts, employers in high-wage areas will normally look for ways of changing their job and skill mix – something which it is very difficult for hospitals to do. What they can do, however, is turn to agency staff, who can fill gaps, and whose pay is not regulated; and the data duly show that hospitals in high wage labour markets have far higher vacancy rates and use far more agency staff (especially in A & E).
This is not, unfortunately, a good solution for patients. It is not just that agency staff are more expensive (though they are that too: agency nurses typically get 30 – 40 per cent more than permanent staff, but there is the agency fee on top of this, which can bring costs close to double). Agency staff also often move around a great deal, and do not have time to learn their way around the institution, or become part of a team. They do not have the same incentives to work ‘beyond the minimum’ that come with both work team/friendship group pressures, or a desire to impress superiors. Hall et al report that use of agency staff is significantly associated with rates of hospital-acquired infection (e.g. MRSA).
Overall, the researchers’ conclusions are clear. They find evidence that ‘the regulation of nurses’ pay leads to higher
29 E Hall, C Propper and J Van Reenan, ‘Can pay regulation kill? Panel data evidence on the effect of labor markets on hospital performance’, National Bureau of Economic Research, 2008, p. 2.
More than we bargained for
��
fatality rates after admissions for heart attacks’ (the specific medical condition for which they had national data) in areas with strong labour markets, and also ‘lower productivity’.30 No such associations are found for other service sectors where pay is not regulated – including, for example, care homes for the elderly. And the differences are not small either.
If ‘outside’ wages rise 10 per cent compared to those for nurses, then this “is associated with a 4.6 per cent increase in death rates”, conclude Hall et al.31 In their data, which related to a period in the 1990s when the spread between top and bottom in outside wages was 33 per cent, this meant that a move from high-wage to low-wage areas was associated with a ’15.2 per cent increase in death rates.’ Differences in general productivity are comparable in scale (and can account for a third of the differences in productivity that exist between the best and worst performing hospitals).
Of course, one can look at these figures the other way round. The labour markets in which it is easier to hire permanent hospital staff are found in regions with relatively low wages. This means that the economy is not in great shape: but at least people can count on better public services to make up for things. Health care will be better, not worse, than in the richest regions. Moreover, similar pressures will exist in education, meaning that schools in poorer regions benefit. London is consistently at the top of the list in terms of teacher turnover and percentage of unfilled teacher vacancies. Conversely, there is enormous competition for many of the teaching vacancies that occur in the North East and North West of England; schools choose from a substantial field of qualified candidates, and many newly qualified teachers in these regions do not find jobs (and are also unable or unwilling to move to areas with more vacancies, and much higher living costs).32 So one could see this phenomenon as evening things up a bit from the point of view of a less prosperous region’s inhabitants.
30 Ibid.31 Ibid, p. 28. 32 Teacher Development Agency, Newly Qualified Teachers surveys, 2008,
2009.

More than we bargained for
��
However, while acute hospitals serve wide and mixed areas, many other public services involve much smaller areas and communities; and within less prosperous, as well as more prosperous regions, inequalities remain large. The more deprived the community, the worse its health record and the worse its children’s academic attainment, whichever region they are in. Equally, there is good evidence that deprived communities, everywhere, find it harder to attract good quality local health care personnel, and good teachers.
This is not, or should not be, surprising. Teachers (and doctors) generally prefer to work with less deprived clients because they are less demanding; good conditions help attract, and effectively form part of the pay package for high quality staff in expensive, high-pay areas. In cases – like contemporary England – where there is no direct compensation for working with more deprived clients, the ‘pull’, for a public sector professional, of a low-cost/low-wage travel-to-work area, might outweigh the ‘push’ of working in a deprived setting; but the data suggest otherwise.
There is a strong evidence base for the statement that schools in deprived areas consistently attract less well-qualified staff.�� North American data for a number of different states show that schools in poor areas consistently find it harder to attract and retain high quality teachers than those serving wealthier communities, and that this is true within districts as well as between them. For example, Clotfelter et al examine teacher and head-teacher quality and mobility in North Carolina (which has a single state-wide salary scale, and is therefore comparable
�� In England, as noted earlier, pay scales are national, and so there is no confounding of area effects with pay. In the US, affluent school districts – which were generally also advantaged – traditionally offered higher salaries and thus a doubly attractive option. However, there has been a good deal of within-state equalisation of salaries in recent decades; and the effect of pupil deprivation is clear after controlling for salary differences.

More than we bargained for
��
to England, but allows some discretionary local payments).34 Using an unusually rich database, which provides detailed information on, for example, teachers’ own undergraduate education, they find that high poverty schools ‘have the highest percentages of teachers with little experience, who have graduated from less competitive undergraduate institutions, and who have non-regular licenses’.��
Moreover the differences are often large. When they compare schools in the highest quartile for poverty with those in the lowest, Clotfelter and colleagues find that the former typically have twice as many teachers with irregular licenses, and well under a half as many teachers who have obtained the demanding new National Board Certification (which tests subject knowledge as well as teaching activities, and carries a 12 per cent pay boost.) Similar results are found for principals (head teachers). Moreover, high poverty schools have almost twice as high a rate of teacher turnover, as well as higher rates of turnover among principals; and teachers from high-poverty schools who moved within the state consistently moved to schools with much lower poverty levels.
There is also strong evidence to support the suggestion, made above, that a combination of rigid national pay scales and major differences in local labour markets will drive wealthy consumers in high-wage areas away from public sector provision. This is particularly clear for schooling: it is in big, economically successful cities such as London, New York, or Chicago that well-off families have most clearly abandoned
34 C Clotfelter, H Ladd, J Vigdor and J Wheeler, ‘High-poverty schools and the distribution of teachers and principals’, Working paper 1, Urban Institute, 2007. See also (for New York) H Lankford, S Loeb, and J Wyckoff, ‘Teacher sorting: the plight of urban schools. A descriptive analysis’, Education Evaluation and Policy Analysis, 2002, pp. 37-62; (for California) J Betts, JK Rueben, A and Danenberg, ‘Equal resources, equal outcomes? The distribution of school resources and student achievement in California’, Public Policy Institute of California, 2000.
�� C Clotfelter, H Ladd, J Vigdor and J Wheeler, ‘High-poverty schools and the distribution of teachers and principals’, 2007.
More than we bargained for
�0
state schooling.36 One of the few apparent counter-examples in fact strengthens the argument. In France, the top academic lycées (senior secondary schools) are public and mostly in central Paris. But changing residence patterns have also made most of the city of Paris proper almost entirely middle- and upper-middle class, with poorer (and immigrant) families banished to the estates of the banlieues.
In the case of health, Harding has summarised British evidence on GPs, who provide the most important ‘local’ health service, covering far smaller areas than an acute hospital.37 The data confirm that it is disproportionately difficult to fill GP vacancies in deprived urban areas, that deprivation in the patient population is the single most important consideration for GPs choosing a practice, and that recruitment problems lead to differences in the quality of provision. GPs are self-employed; but they are paid through a uniform, nationally negotiated contract. This has traditionally been based largely on patient numbers but currently includes payments for reaching a number of health-related targets (e.g. vaccinations). Since these will be easier to achieve with a health-conscious, relatively advantaged patient list, the change further reinforces existing incentives to avoid deprived areas.
Overall, it seems clear that both the nature of local labour markets (over quite a broad, regional or travel-to-work area), and the level of deprivation in a local community have a clear impact on the quality of public services people receive; and the more people-intensive these are, the larger the effects will be. The situation creates a self-reinforcing dynamic, especially with respect to schooling. If schools are poor, and the wealthy pull out of state provision, other families, including those headed by public sector workers, feel they must either pay (if
36 For example, in the USA, an average of 10 per cent of students are in private schools: but the figure is 21 per cent in Philadephia, 18 per cent in New York, 17 per cent in Chicago. W Sander, ‘Private schools and school enrolment in Chicago’, Federal Reserve Bank of Chicago, 2006. In England, less than 9 per cent of secondary school pupils are educated at independent schools; but the figure rises to 21.4 per cent in Bristol, 19.1 per cent in Portsmouth, and to over half in the London borough of Kensington and Chelsea. DCSF data released in response to a Freedom of Information request, December 2009.
37 R Harding, ‘Poverty pay: How public sector pay fails deprived areas’, 2007.
More than we bargained for
�1
they can) or move house to localities with better state schools on offer.
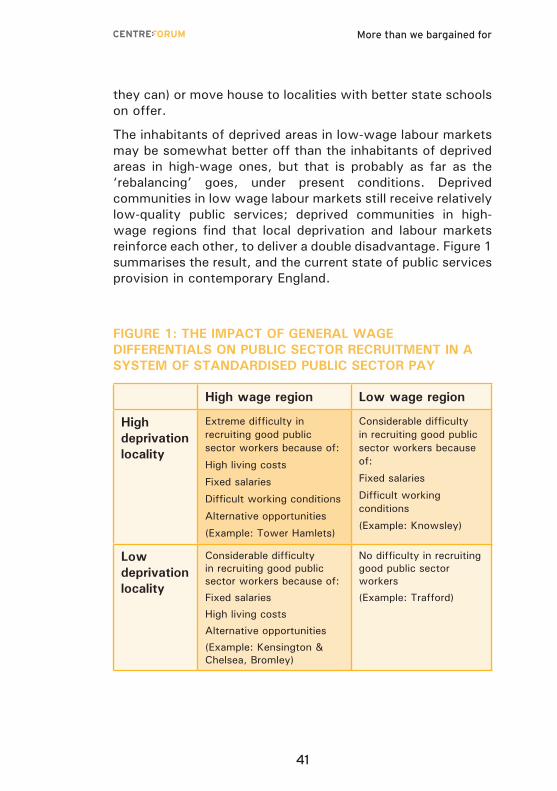
The inhabitants of deprived areas in low-wage labour markets may be somewhat better off than the inhabitants of deprived areas in high-wage ones, but that is probably as far as the ‘rebalancing’ goes, under present conditions. Deprived communities in low wage labour markets still receive relatively low-quality public services; deprived communities in high-wage regions find that local deprivation and labour markets reinforce each other, to deliver a double disadvantage. Figure 1 summarises the result, and the current state of public services provision in contemporary England.
fIgure 1: the ImPAct of generAl wAge dIfferentIAls on PublIc sector recruItment In A system of stAndArdIsed PublIc sector PAy
high wage region low wage region
high deprivation locality
Extreme difficulty in recruiting good public sector workers because of:
High living costs
Fixed salaries
Difficult working conditions
Alternative opportunities
(Example: Tower Hamlets)
Considerable difficulty in recruiting good public sector workers because of:
Fixed salaries
Difficult working conditions
(Example: Knowsley)
low deprivation locality
Considerable difficulty in recruiting good public sector workers because of:
Fixed salaries
High living costs
Alternative opportunities
(Example: Kensington & Chelsea, Bromley)
No difficulty in recruiting good public sector workers
(Example: Trafford)

More than we bargained for
��
5. How big is the problem?
As we have seen, England currently has an unusually centralised approach to public sector pay negotiations, even though there are good reasons to expect this to have a negative effect on the quality of public services. But just how much of an issue is this?
This section argues that the effects are very substantial and something that governments should take very seriously. Indeed, it is one important reason why we have made no recent progress in tackling regional inequalities and poverty levels.
To understand why, we need to place public sector salaries in the context of the wider labour market. All localities will, in any modern welfare state, have substantial health and education sectors, staffed by a workforce which contains many highly educated and qualified people, and underwritten by the country as a whole. The nature of our current public services is such that some groups of professionals – notably in health and education – are overwhelmingly public sector employees. Overall, 23 per cent of the public sector workforce is made up of professionals, compared to 10 per cent in the private sector workforce. Another 24 per cent are classified as ‘associate professional and technical’, compared to 11 per cent in the private sector.38
While regions and localities are similar in the scale of their public service provision, in other respects their economies
38 A Machin and B Millard, ‘Characteristics of public sector workers’, Economic and Labour Market Review, May 2007.
:

More than we bargained for
��
and labour markets are very different. Some were once dominated by heavy industries which have contracted or virtually disappeared; while some of the most successful industries of the early twenty-first century (financial services, pharmaceuticals, media) are highly concentrated in a few areas. The result is that contemporary England has very large regional differences in employment and wage patterns.
Tables 2 and 3 provide some concrete illustration of their scale, using data from before the current recession. Table 2 shows the differences, among English regions, in the relationship between private sector wage distributions, which are decided through myriad individual decisions and negotiations, and those for public sector workers. The latter still allow for some local flexibilities, and there are also some differences between regions in the composition and nature of public sector employment. But the importance of both of these is relatively small.
As Table 2 shows, in only one region (South East) is median pay higher in the private than the public sector. Even at the 80th percentile of the wage distribution, only three of the nine regions have higher wages in the private than the public sector.39 Moreover, this represents gross wages, with no account taken of the real value of differential pension rights. Eighty five per cent of public sector employees are members of an employer-sponsored pension scheme, compared to 40 per cent of private sector employees, and most of them have a Defined Benefit scheme, compared to only 15 per cent of private sector employees. Public sector scheme values are also, on average, higher than in the private sector.40
39 At the 90th percentile, good estimates are available only for 6 regions. Private wages are substantially higher than public, at this percentile, in the South East, London and the East of England; and much the same in the North West, South West and West Midlands.
40 Pensions Policy Institute, ‘An assessment of the government reforms to public sector pensions’, 2008. Among the lower paid, 70 per cent of public sector and 20 per cent of private sector employees are members of an employer sponsored scheme.
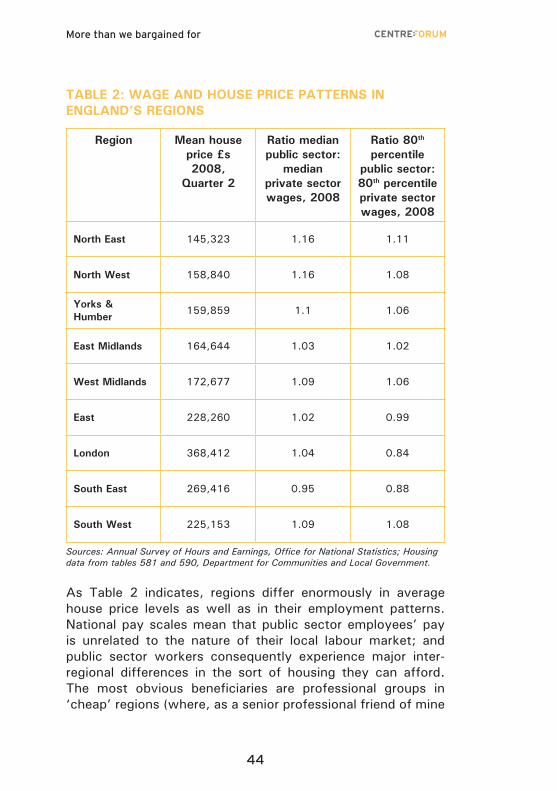
More than we bargained for
��
tAble 2: wAge And house PrIce PAtterns In englAnd’s regIons
region mean house price £s 2008,
quarter 2
ratio median public sector:
median private sector wages, 2008
ratio 80th percentile
public sector: 80th percentile private sector wages, 2008
north east 145,323 1.16 1.11
north west 158,840 1.16 1.08
yorks & humber 159,859 1.1 1.06
east midlands 164,644 1.03 1.02
west midlands 172,677 1.09 1.06
east 228,260 1.02 0.99
london 368,412 1.04 0.84
south east 269,416 0.95 0.88
south west 225,153 1.09 1.08
Sources: Annual Survey of Hours and Earnings, Office for National Statistics; Housing data from tables 581 and 590, Department for Communities and Local Government.
As Table 2 indicates, regions differ enormously in average house price levels as well as in their employment patterns. National pay scales mean that public sector employees’ pay is unrelated to the nature of their local labour market; and public sector workers consequently experience major inter-regional differences in the sort of housing they can afford. The most obvious beneficiaries are professional groups in ‘cheap’ regions (where, as a senior professional friend of mine
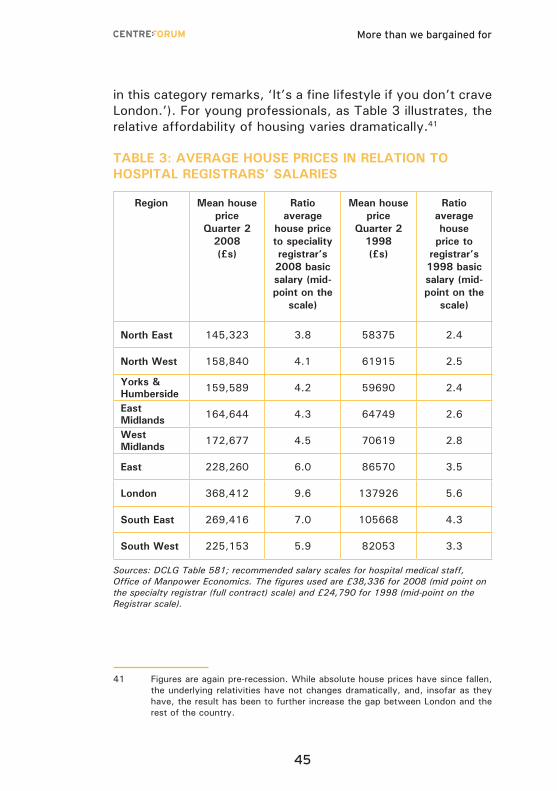
More than we bargained for
��
in this category remarks, ‘It’s a fine lifestyle if you don’t crave London.’). For young professionals, as Table 3 illustrates, the relative affordability of housing varies dramatically.41
tAble 3: AverAge house PrIces In relAtIon to hosPItAl regIstrArs’ sAlArIes
region mean house price
quarter 2 2008 (£s)
ratio average
house price to speciality registrar’s 2008 basic salary (mid-point on the
scale)
mean house price
quarter 2 1998 (£s)
ratio average house
price to registrar’s 1998 basic salary (mid-point on the
scale)
north east 145,323 3.8 58375 2.4
north west 158,840 4.1 61915 2.5
yorks & humberside 159,589 4.2 59690 2.4
east midlands 164,644 4.3 64749 2.6
west midlands 172,677 4.5 70619 2.8
east 228,260 6.0 86570 3.5
london 368,412 9.6 137926 5.6
south east 269,416 7.0 105668 4.3
south west 225,153 5.9 82053 3.3
Sources: DCLG Table 581; recommended salary scales for hospital medical staff, Office of Manpower Economics. The figures used are £38,336 for 2008 (mid point on the specialty registrar (full contract) scale) and £24,790 for 1998 (mid-point on the Registrar scale).
41 Figures are again pre-recession. While absolute house prices have since fallen, the underlying relativities have not changes dramatically, and, insofar as they have, the result has been to further increase the gap between London and the rest of the country.
More than we bargained for
��
In public policy terms, this matters a great deal. Uniform pay scales make it much harder to target assistance to highly deprived localities, and to use price mechanisms generally to address shortages. As we have seen, even in regions where public sector pay is relatively very high, deprived localities find it very hard to attract good professionals. Money is not the only thing that matters to public sector employees (or indeed almost anyone); and there are genuine differences in people’s motivations which translate into career choices. But money certainly does matter; and if we want to improve the quality of services for deprived communities, then one obvious and powerful thing to do is to pay people more to work in them.42
Nickell and Quintini have demonstrated how a relative fall in public sector pay, compared to private, between the late 1970s and the late 1980s is clearly associated with a sharp fall in the academic attainment level of men entering the public sector.43 Conversely, severe recessions – such as the current one – increase the attraction of public sector jobs, including teaching. And we know that targeted financial incentives work. They may attract specific groups of people into teaching (for example, through ‘golden hellos’ for shortage-subject entrants) but also change their job choices within the profession. When California ran a competitively allocated programme to attract high-quality entrants into low-performing schools, evaluators established that the ‘Teaching Fellowship’ recipients were indeed significantly different demographically and better qualified than they otherwise would have been.44
Further evidence comes from the behaviour of private-sector providers of education, who are not constrained by national settlements, and can therefore respond directly to both labour
42 There will certainly be major differences within the public services in the degree to which recruitment responds to a given level of pay differential. For example, for ambitious teachers, it is far less important to be in a big city, let alone London specifically, than for young doctors who are aiming for a consultant appointment in one of the country’s pre-eminent teaching hospitals. But that does not alter the basic point: at the margin, supply will respond to price.
43 S Nickell and G Quintini, ‘The consequences of the decline in public sector pay in Britain: a little bit of evidence’, Economic Journal, February 2002.
44 J Steele, R Murrane and J Willett, ‘Do financial incentives help low-performing schools attract and keep academically talented teachers?’, National Bureau of Economic Research, 2009.

More than we bargained for
��
market conditions and demand levels. The data show that the average mean pay of teachers in the UK state and independent schools sectors is roughly equal. This seems surprising at first, and might seem to undermine the current argument. However, working conditions are generally much better in the private sector where, for example, pupil-teacher ratios are much lower; in fact, other things being equal, one might expect lower salaries in independent schools. Moreover, in the one area where there are major, long-standing teacher shortages – namely teachers of maths and science – teachers in the independent sector are paid significantly more than their state school colleagues.45 In other words, the independent sector has used – and been able to use – the price mechanism when it needed to.
the consequences for PrIvAte enterPrIseUp to now, the discussion has concentrated on the public sector itself, and the consequences of uniform pay scales for public service provision. However, in contemporary England, the uniform treatment of large public sector workforces creates an additional serious problem. As argued above, it undermines one of the few advantages that relatively deprived and unsuccessful localities possess and makes it harder for them to catch up economically. In doing so, it perpetuates inequalities that impact hardest on those who are lower paid or out of work.
This is not normally how governments think about what they are doing. On the contrary, they tend to see public spending as a generally equalising force – a way of helping less favoured localities and propping up declining regions. Devolving central government functions and departments is a favoured strategy for ‘helping’ parts of the country that are struggling economically. Take, for example, the decision, in the 1980s, to relocate large parts of what is currently BIS – the Department of Business, Innovation and Skills. (This part of BIS has also been, in recent memory, DIUS, DfES,
45 R Murphy, ‘Going private: the competition for independent and state school teachers’, Centrepiece, London School of Economics Centre for Economic Performance, 2009.
More than we bargained for
��
DfEE, ED, TA, MSC and no doubt other things as well.) The choice fell – obviously – not on Reading, or Birmingham, or York, or Norwich but on Sheffield. The DVLA went to South Wales (as did the Office of National Statistics); parts of ODI to the concrete fastnesses of East Kilbride near Glasgow.
From the government’s viewpoint (and the taxpayer’s) this has major potential advantages in terms of both land costs and access to a less tight labour market. How far such gains are realised depends on the nature of the jobs concerned. If they are fairly routine (as for the DVLA), the move may be highly successful and economically efficient. If, however, the policy involves trying to move specialised professionals away from a locality with multiple job opportunities to a sort of ‘company town’ where there is little professional infrastructure, and few available jobs for professional spouses and partners, then it will be very difficult to maintain quality recruitment. As Leunig and Swaffield have demonstrated, attempts to create new ‘high tech’ centres in low income areas through a combination of government fiat and subsidy consistently fail.46
Most public sector jobs in the UK are, however, not of this type – only around 10 per cent of public sector employment involves central government departments (wherever situated). Instead, most public employees work in health, education, law and order and for local government.
Table 4 provides some key employment indicators for the English regions. The percentage of public sector workers currently varies between 17 and 22.9 per cent. This is not an enormous spread, but still larger than one might expect, a priori, given that everywhere needs medical care, education, policing and local government; and, as discussed below, the spread has been increasing.47 Employment rates vary from 71.5 to 82.8 per cent of the working age population; and disability rates (which can include substantial amounts of concealed unemployment)
46 T Leunig and J Swaffield, ‘Cities unlimited: making urban regeneration work’, Policy Exchange, 2007.
47 It is substantially higher in Northern Ireland, and higher in Wales than in any English region; the gap between Northern Ireland and London or the South East/East is more than ten percentage points.

More than we bargained for
��
range from 4.7 to 9.6 per cent. Leaving aside London, public sector employment, as a percentage of employment, tends to be generally somewhat higher – as one might predict – in English regions with relatively high non-employment and disability levels. It is also important to note that regions are all internally diverse, and will contain some areas with very high, and some with very low, employment rates.
During the 1990s, there was a substantial fall in the dispersion of unemployment rates between regions. However, it is now well recognised that official unemployment is only a partial
tAble 4: economIc ActIvIty by regIon
Public sector employment rate as per
cent employed population quarter 4,
2007
employment rate (as
per cent of population
16-64) quarter 3,
2009
Percentage of working age population on esA or disability benefits 2009
North East 22.9 67.7 9.6
North West 21 70.9 9.2
Yorks & Humberside 20.2 70.9 7.1
East Midlands 17 74.8 6.5
West Midlands 20.2 70.3 7.3
East 17.1 76.7 5.2
London 18.5 69.1 6
South East 17.3 77 4.7
South West 19.4 75.1 6.2
Source: Labour Force Survey; ONS Statistical Bulletins (Labour Market Statistics); Department of Work and Pensions Information Directorate/Work and Pensions Longitudinal Study (Note: economic activity rates are typically 4 to 5 percentage points higher than employment rates).
More than we bargained for
�0
measure of joblessness.48 Economic inactivity – in which people stop looking for jobs – also needs to be examined. Inactivity plus unemployment create what Erdem and Glyn call the ‘non-employment rate’ – and here, regional differences are far greater.49 The disability rates quoted in Table 4 illustrate this clearly: the rate in the North East is more than twice as high as in the South East.
Under successive Labour governments, the primary policy response to regional inequalities has been a very particular sort of ‘supply side’ remedy – namely assuming that if people in economically depressed areas became more skilled, with more formal qualifications, and/or looked harder for jobs, regional differences would shrink.50 Not only has this failed to occur: the policy also mis-specifies the problem, implying that the primary reason some regions are less successful is because of their lack of skills. In fact, employment prospects for people in different regions are very different for a given level of education and qualification. In other words, it is not simply that economically unsuccessful regions have lower average levels of attainment among their school pupils and in their population, though they do that too. It is, critically, that people in these regions find it harder to find a job, for any given level of qualification, than they would in an economically more successful region.
In 1999, Erdem and Glyn calculated that this regional disadvantage was especially severe for the bottom quartile, in terms of qualification levels; that the regional ‘penalty’ had actually increased during the 1990s, in spite of general economic recovery following the 1993 recession; and that
48 D Webster, ‘Long-term unemployment, the invention of “hysteresis” and the misdiagnosis of the UK’s problem of structural unemployment’, Cambridge Journal of Economics, 2005; E Erdem and A Glyn, ‘Job deficits in UK regions’, Oxford Bulletin of Economics and Statistics, 2001.
49 Ibid, p. 740.50 There are, certainly, some ‘supply side’ issues in the labour market, particularly
related to the way in which the structure of benefits creates incentives/disincentives to seek and take work, although it is not clear whether and how far these contribute to regional inequalities. To the degree that benefits are fixed nationally, they will provide more of a disincentive to work in areas where available wages are low; but benefit structures are complex, and housing benefit, in particular, is both very important and intended to be neutral between high and low wage areas.

More than we bargained for
�1
when one looked at this group, and at non-employment rather than unemployment, regional dispersion had actually increased substantially. Moreover, this was not just because of a legacy of older, unqualified workers. The regional dispersion was virtually as great for lowest quartile 15-24 year olds and 25-34 year olds as for older workers even though far more of them had some formal qualifications.
As Erdem and Glyn note: “The severity of regional employment problems…hardly suggest a highly flexible labour market in the UK…It is quite shocking that the gap in employment rates for the least qualified” between the South East and the North, notably Merseyside and Tyne and Wear “are (sic) just as great as that between the regions of the old GDR and the most prosperous regions of south Germany.”51
Not only does the government’s current emphasis on ‘skill supply’ fail to recognise the nature of the regional problem. There is also no empirical evidence to suggest that pumping up qualification levels can have any direct impact at all on the regional economy.52 As one might therefore expect, there is nothing to suggest improvement in the decade since Erdem and Glyn reported.
Reports on poverty and unemployment rates, and other measures of social deprivation, almost always report at a national (all-England) level. In spite of the Labour government’s aspirations and policies, the results have been disappointing, as noted above, and indeed some measures indicate recent declines that pre-date the recession.��
This is bad enough: but the focus on national figures obscures the shocking fact that, overall, there is greater regional dispersion today, in terms of unemployment rates, poverty,
51 E Erdem and A Glyn, ‘Job deficits in UK regions’, 2001, p. 749.52 For critiques of the policy and reviews of the empirical evidence – showing,
for example, no financial returns for adults who acquire additional vocational qualifications – see E Keep, K Mayhew, & J Payne, ‘From skills revolution to productivity miracle—not as easy as it sounds?’, Oxford Review of Economic Policy, 2006. A Wolf, A Jenkins and A Vignoles, ‘Certifying the workforce: economic imperative or failed social policy?’ Journal of Education Policy, 2006.
�� See, for example, the valuable annual reports on poverty and social exclusion published by the Joseph Rowntree Foundation.
More than we bargained for
��
and life expectancy, than there was in the period between 1977 and 1997. We have what Danny Dorling of Sheffield University has characterised as a ‘pear-shaped’ country, with a large number of underperforming regions and a few productive winners, pulling ever further away.54 One of the great failures of the last twelve years is to be found in these statistics.
Men have been particularly badly hit by the secular trend, in the last few decades, towards fewer skilled manual jobs; and men in the old industrial regions and localities have faced a rapid and ongoing decline in manufacturing jobs.�� In the two recessions before the current one, the falls in male employment rates were much greater than for women and, again unlike women’s, failed to recover entirely afterwards, let alone continue on upward. (This is another area where the relative importance of public versus private sector job growth, for a given locality, is important. As discussed earlier, the public sector workforce is more heavily professional than the private sector; and is also more female. In 2006, 65 per cent of the public sector workforce was female compared to 41 per cent in the private sector.)56
Figures 2 and 3 show that, in the economically least successful regions of the country, the public sector has become more important in the local economy as other sectors decline. Figure 2 shows that, with the exception of the South West, the regions where the public sector already accounted for an above average proportion of openings have also seen it become more important in the last decade. And Figure 3 shows that, over the same period, the absolute increases in private sector jobs have also been low in these regions.
This means that it is very hard, in some parts of the country, for people to find jobs. We should surely consider, seriously, the possibility that nationally determined public sector pay scales
54 D Dorling, ‘Inequalities in Britain 1997-2006: the dream that turned pear-shaped’, Local Economy, 2006.
�� David Webster is among those who have argued strongly that ‘much of the problem is indeed a lack of jobs’. D. Webster, ‘Welfare reform: facing up to the geography of worklessness’, Local Economy, 2006. New Deal programmes aimed at getting young people into work have been much less effective in high unemployment areas.
56 A Machin and B Millard, ‘Characteristics of public sector workers’, May 2007.
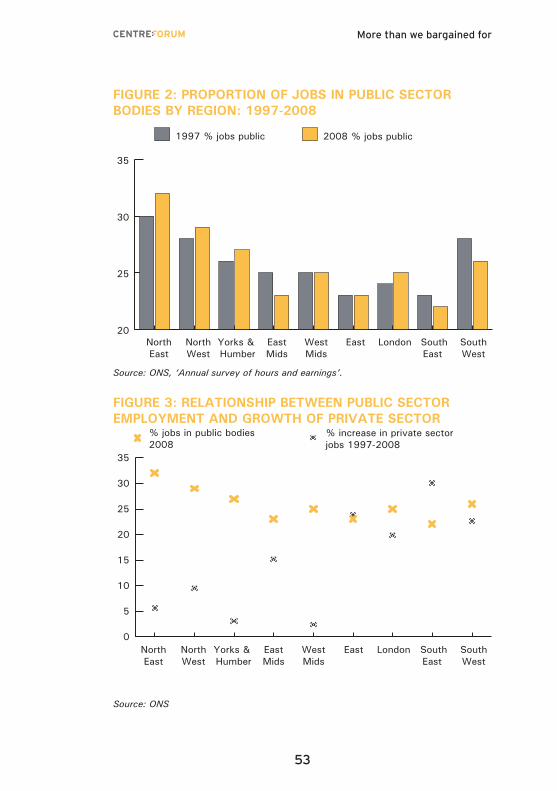
More than we bargained for
��
fIgure 2: ProPortIon of jobs In PublIc sector bodIes by regIon: 1997-2008
20
25
30
35
2008 % jobs public1997 % jobs public
SouthWest
SouthEast
LondonEastWestMids
EastMids
Yorks & Humber
NorthWest
NorthEast
Source: ONS, ‘Annual survey of hours and earnings’.
fIgure 3: relAtIonshIP between PublIc sector emPloyment And growth of PrIvAte sector
0
5
10
15
20
25
30
35
% increase in private sector jobs 1997-2008
% jobs in public bodies 2008
SouthWest
SouthEast
LondonEastWestMids
EastMids
Yorks & Humber
NorthWest
NorthEast
Source: ONS
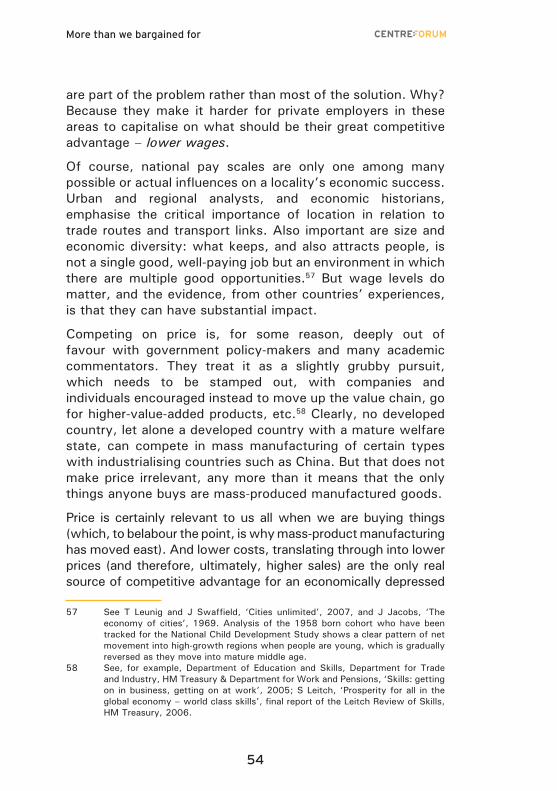
More than we bargained for
��
are part of the problem rather than most of the solution. Why? Because they make it harder for private employers in these areas to capitalise on what should be their great competitive advantage – lower wages.
Of course, national pay scales are only one among many possible or actual influences on a locality’s economic success. Urban and regional analysts, and economic historians, emphasise the critical importance of location in relation to trade routes and transport links. Also important are size and economic diversity: what keeps, and also attracts people, is not a single good, well-paying job but an environment in which there are multiple good opportunities.57 But wage levels do matter, and the evidence, from other countries’ experiences, is that they can have substantial impact.
Competing on price is, for some reason, deeply out of favour with government policy-makers and many academic commentators. They treat it as a slightly grubby pursuit, which needs to be stamped out, with companies and individuals encouraged instead to move up the value chain, go for higher-value-added products, etc.58 Clearly, no developed country, let alone a developed country with a mature welfare state, can compete in mass manufacturing of certain types with industrialising countries such as China. But that does not make price irrelevant, any more than it means that the only things anyone buys are mass-produced manufactured goods.
Price is certainly relevant to us all when we are buying things (which, to belabour the point, is why mass-product manufacturing has moved east). And lower costs, translating through into lower prices (and therefore, ultimately, higher sales) are the only real source of competitive advantage for an economically depressed
57 See T Leunig and J Swaffield, ‘Cities unlimited’, 2007, and J Jacobs, ‘The economy of cities’, 1969. Analysis of the 1958 born cohort who have been tracked for the National Child Development Study shows a clear pattern of net movement into high-growth regions when people are young, which is gradually reversed as they move into mature middle age.
58 See, for example, Department of Education and Skills, Department for Trade and Industry, HM Treasury & Department for Work and Pensions, ‘Skills: getting on in business, getting on at work’, 2005; S Leitch, ‘Prosperity for all in the global economy – world class skills’, final report of the Leitch Review of Skills, HM Treasury, 2006.
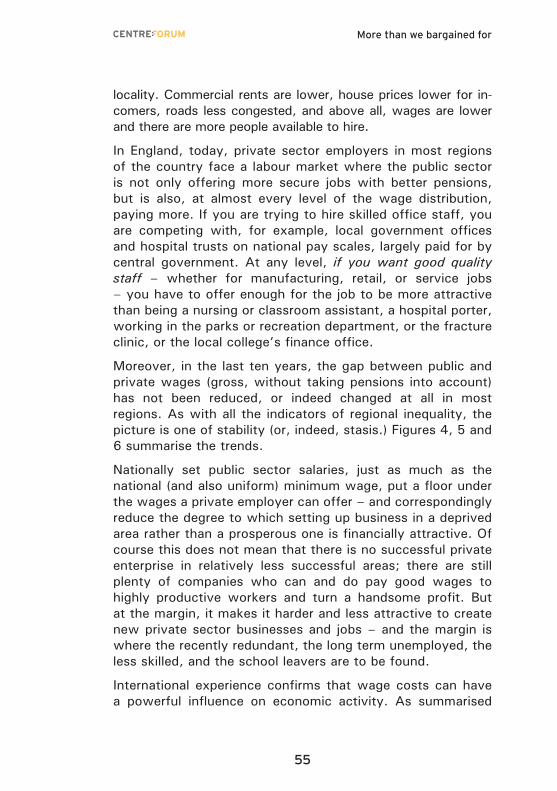
More than we bargained for
��
locality. Commercial rents are lower, house prices lower for in-comers, roads less congested, and above all, wages are lower and there are more people available to hire.
In England, today, private sector employers in most regions of the country face a labour market where the public sector is not only offering more secure jobs with better pensions, but is also, at almost every level of the wage distribution, paying more. If you are trying to hire skilled office staff, you are competing with, for example, local government offices and hospital trusts on national pay scales, largely paid for by central government. At any level, if you want good quality staff – whether for manufacturing, retail, or service jobs – you have to offer enough for the job to be more attractive than being a nursing or classroom assistant, a hospital porter, working in the parks or recreation department, or the fracture clinic, or the local college’s finance office.
Moreover, in the last ten years, the gap between public and private wages (gross, without taking pensions into account) has not been reduced, or indeed changed at all in most regions. As with all the indicators of regional inequality, the picture is one of stability (or, indeed, stasis.) Figures 4, 5 and 6 summarise the trends.
Nationally set public sector salaries, just as much as the national (and also uniform) minimum wage, put a floor under the wages a private employer can offer – and correspondingly reduce the degree to which setting up business in a deprived area rather than a prosperous one is financially attractive. Of course this does not mean that there is no successful private enterprise in relatively less successful areas; there are still plenty of companies who can and do pay good wages to highly productive workers and turn a handsome profit. But at the margin, it makes it harder and less attractive to create new private sector businesses and jobs – and the margin is where the recently redundant, the long term unemployed, the less skilled, and the school leavers are to be found.
International experience confirms that wage costs can have a powerful influence on economic activity. As summarised
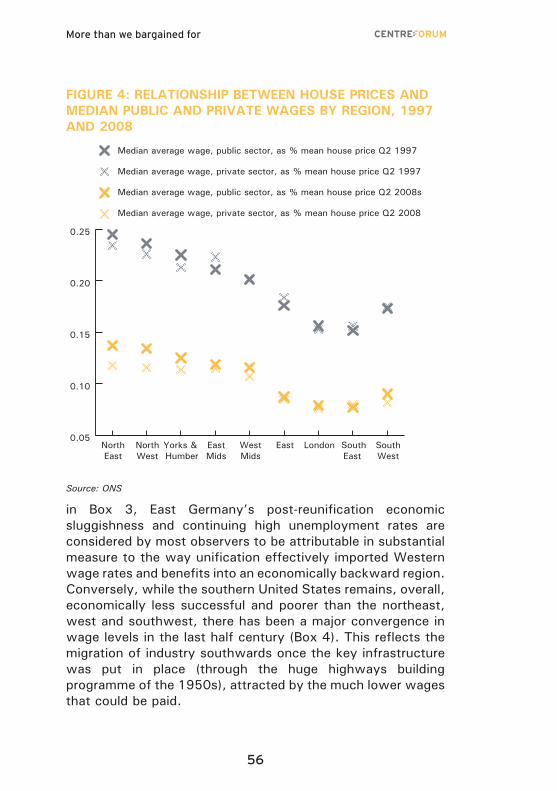
More than we bargained for
��
fIgure 4: relAtIonshIP between house PrIces And medIAn PublIc And PrIvAte wAges by regIon, 1997 And 2008
0.05
0.10
0.15
0.20
0.25
SouthWest
SouthEast
LondonEastWestMids
EastMids
Yorks & Humber
NorthWest
NorthEast
Median average wage, private sector, as % mean house price Q2 2008
Median average wage, public sector, as % mean house price Q2 2008s
Median average wage, private sector, as % mean house price Q2 1997
Median average wage, public sector, as % mean house price Q2 1997
Source: ONS
in Box 3, East Germany’s post-reunification economic sluggishness and continuing high unemployment rates are considered by most observers to be attributable in substantial measure to the way unification effectively imported Western wage rates and benefits into an economically backward region. Conversely, while the southern United States remains, overall, economically less successful and poorer than the northeast, west and southwest, there has been a major convergence in wage levels in the last half century (Box 4). This reflects the migration of industry southwards once the key infrastructure was put in place (through the huge highways building programme of the 1950s), attracted by the much lower wages that could be paid.
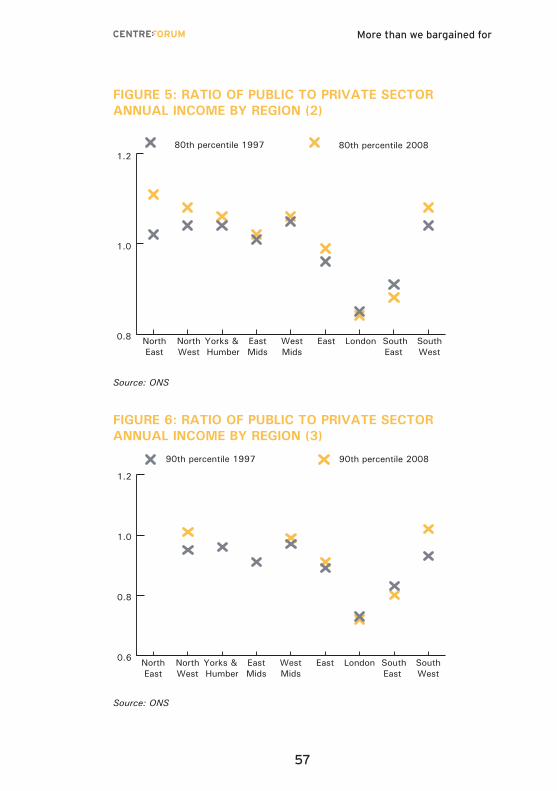
More than we bargained for
��
fIgure 5: rAtIo of PublIc to PrIvAte sector AnnuAl Income by regIon (2)
0.8
1.0
1.280th percentile 200880th percentile 1997
SouthWest
SouthEast
LondonEastWestMids
EastMids
Yorks & Humber
NorthWest
NorthEast
Source: ONS
fIgure 6: rAtIo of PublIc to PrIvAte sector AnnuAl Income by regIon (3)
SouthWest
SouthEast
LondonEastWestMids
EastMids
Yorks & Humber
NorthWest
NorthEast
0.6
0.8
1.0
1.2
90th percentile 200890th percentile 1997
Source: ONS

More than we bargained for
��
Box 3: International experience – Europe
The best-known regional disparities in Europe exist in Italy (between the North and the South or Mezzogiorno), Spain (where Andalucia in the south remains very poor) and Germany (where the states of the old East Germany/DDR remain much less economically successful than those of the West). Germany’s experience is more obviously relevant to the British case, since in Italy and Spain, the poorest regions have never been rich or fully industrialised, whereas East Germany was the most economically successful part of the old eastern bloc and contains some of the wealthiest parts of pre-war Germany. Similarly, in England, the least successful regions are largely ‘old’ industrial ones which were once the source of national wealth.
After reunification, East German unemployment leaped upwards. So, for those still in employment, did wages. The consensus explanation is summarised by Merkl and Snower: “Immediately after German reunification, East German wage bargaining was conducted primarily by West German unions and employers and these had strong incentives to push East German wages up, in order to reduce migration of East German workers to West Germany and of West German firms to the East…The upward wage pressure was reinforced through generous unemployment benefits and associated welfare entitlements. The resulting East German wage hike led to a sharp fall in East German employment.”i
More recently, labour costs in the East have fallen relative to productivity, and productivity has climbed though it is still well below West German levels. However, unemployment remains much higher than in the West and there has been continued and steady out-migration, especially by 18-29 year olds.ii
i C Merkl and D Snower, ‘Escaping the unemployment trap: the case of East Germany’, Journal of Comparative Economics, 2008.
ii H Uhlig, ‘The slow decline of East Germany’, Journal of Comparative Economics, 2008. East German wages at reunification showed a particularly large rise in relation to productivity.
More than we bargained for
��
Box 4: International experience – USA
American experience suggests that regional convergence can occur, while underlining that it is a very slow process. As recently as 1940, per capita income in the overwhelmingly agricultural South Atlantic and West South Central states was only about 60 per cent of the US average. But by 1980, it had reached 90 per cent. In between, there was a large inflow of industry, plus the creation of local companies; the mechanisation of agriculture (with fast-rising productivity), and also the outflow of very large numbers of people, mostly black.i
One cannot separate the history of the South from racism, segregation, and the legacy of slavery any more than one can separate recent German history from the legacy of Communism. In the case of the ‘new South’ the major puzzle is that it took so long, and that wages, in a single country with a generally flexible labour market and business-friendly policies, took so long to converge.ii The answer lies in large part in politics and the ability of powerful southern interests to resist competitive inflows, and to restrain for many years the growth of wages in their low-skill, labour-intense industries. Once the southern states opened up, and moved from very high corporate taxes to below average rates, the absence of unions and availability of labour made the region highly attractive to employers. Southern history also provides a clear example of the impact of a minimum wage that is pitched much higher than the prevailing wage. Significant expansions of the national minimum wage, in the 1950s and 1960s, had almost no effect outside the South, because of the prevailing wage levels in non-southern states, but had a major impact on unskilled employment in the South. The most affected were black teenage males, for whom employment rates in the southern states fell from 55 per cent to 27 per cent between 1950 and 1970.iii
i Mechanisation was a necessary part of survival for Southern agriculture but led to a dramatic fall in the number of farm owners and tenants, both black and white. See G Wright, ‘Old South, New South: revolutions in the southern economy since the Civil War’, 1986. For example, there were 699,000 black tenant farmers and 183,000 black farm owners in 1930. By 1969 the numbers were 72,000 and 18,000. (Wright 1986: 245.) New jobs were twice as likely to go to whites as blacks (who formed 43 per cent of the population in the Deep South in 1950, but secured 21 per cent of new non-agricultural jobs). (Ibid: 255).
ii Public sector wages are overwhelmingly determined at state and local level.
iii J Cogan, ‘The decline in black teenage employment 1950-1970’, American Economic Review, 1982.

More than we bargained for
�0
In recent decades, as described above, UK public sector pay negotiations have increasingly involved special ‘pay review bodies’, one of whose tasks is to take account of general labour market conditions, and supply and demand for different groups of employees. Regional history suggests that they have done a very poor job of recognising regional differences.
That said, there is in fact no evidence, as Dolton et al have demonstrated, that having a pay review body has any impact on what workers receive, as compared to other parts of the public sector without such bodies.59 Perhaps inevitably, the realities of government power and central appropriations bear out Harding’s conclusion, quoted earlier, that pay in the public sector is best described not as a response to market conditions but ‘as a bargain between trade unions and the relevant secretary of state, with a pay review body to act as a referee.’ 60
In summary, current policy and practice serve to perpetuate the unbalanced state of England’s economy. They undermine service quality in high-wage regions, to the particular detriment of disadvantaged communities within such regions. Finally, while disadvantaged communities in low-wage regions may enjoy somewhat better service quality than those in high-wage ones, they still lose out compared to their better-off neighbours. As the next section illustrates, these are not minor problems, but central to the future direction of public policy.
59 P Dolton, G Makepeace & O Marcenaro-Gutierrez, ‘The impact of the public sector pay review bodies in the UK’, Institut zur Zukunft der Arbeit (IZA), 2008.
60 R Harding, ‘Poverty pay: How public sector pay fails deprived areas’, Social Market Foundation, 2007.
More than we bargained for
�1
6. Policy implications: pupil premia, junior doctors and the university sector
This section illustrates, in concrete terms, how our current pay bargaining system undermines public service delivery in a variety of ways. It looks first at the proposed pupil premium, a key educational reform for which there is strong cross-party consensus, and then, more briefly, at the ongoing ‘junior doctors crisis’, and the future of our universities. In each case, the rigidities of our centralised system militate against productivity, quality, and equity for both users and employees of the sectors concerned.
A. educAtIon reform And PuPIl PremIAThe idea of a ‘pupil premium’ to support and improve the education of disadvantaged pupils is supported by both the Conservatives and the Liberal Democrats.61 The policy would ensure that additional funds are allocated for and follow individual pupils with disadvantages, so that, if they move schools, the extra money moves too.
The overall rationale is very clear. A considerable body of empirical research has now demonstrated that if used appropriately, additional funds can make a significant
61 J Astle, ‘A liberal education policy’, CentreForum, 2007; P Marshall, with S Rabindrakumar and L Wilkins, ‘Tackling educational inequality’, CentreForum, 2007; S Freedman, S Horner, ‘School funding and social justice’, Policy Exchange, 2007; P Booth ed, ‘Symposium on the pupil premium’, Economic Affairs, June 2008.
:

More than we bargained for
��
difference to pupils’ performance. It is also clear that teachers matter – that high quality teaching can make a substantial difference to pupil attainment.62 So if we are serious about improving disadvantaged students’ educational attainment, we have to ensure that they are well taught.
A pupil premium has the enormous advantage of making such pupils attractive to schools (because they bring extra funding with them), whereas at present the opposite is true.63 It also avoids the endemic problem with the special, self-contained initiatives that have rained down on schools in recent years: namely that no one dares make permanent changes, or undertake long-term commitments with the money because they are very well aware that such initiatives are intrinsically short-term and subject to sudden change.64 In other words, the premium has the enormous potential advantage of working with, rather than against, the incentives schools face. However, if it is introduced without any changes to current national wage bargaining practices, it is likely to have very little impact.
As discussed above, we know that teachers are influenced both by financial incentives and by working conditions in their choice of jobs. Hence, if we want to make it possible for schools with disadvantaged pupils to attract better quality teachers, they need to pay them more and/or offer them more attractive working conditions. If we give such schools more money, but tie them into current national pay scales and conditions, we make this virtually impossible. The additional money will be just like the additional funds that come in under special initiatives – money that can be spent on non-core activities, but not on improving the quality of the permanent teaching staff who actually make a difference. It will, in other words, be largely wasted, and the policy labelled a failure.
62 There is no simple relationship between spending per pupil and educational attainment, but this is because the impact of spending depends on how the money is spent.
63 Although there are complex funding allowances which are supposed to direct money to disadvantaged areas, these do not follow the individual child: meanwhile, schools are judged on their examination results, labelled accordingly (in league tables) and funded largely on a standard per capita basis by how many pupils they attract.
64 A Wolf, ‘Education’ in V Uberoi et al eds, ‘Options for a new Britain’, 2009.
More than we bargained for
��
In high-wage areas, schools serving deprived communities have two obstacles to overcome: not only are teaching conditions difficult, but teachers’ salaries are relatively low and house prices very high (see Figure 1 and Tables 2 and 3). In low-wage areas, it is only the difficult working conditions that need to be offset by higher salaries. But in both cases, we have schools which really need high-quality teachers, and are competing with other schools which offer the same salaries and better working conditions. If the pupil premium is to have any serious impact on attainment levels, it is absolutely vital that schools be allowed to use the money freely.
One possible counter-argument is that the same result could be achieved, without changing the national pay bargaining machinery, simply by allowing schools with additional funds to operate a performance-related pay scheme with substantial rewards and bonuses attached. Unfortunately, a growing body of empirical evidence gives the lie to this.
The Blair government introduced the still-current performance-related payment system to allow higher rewards for higher performing teachers, and encourage the best teachers to remain in the classroom. The system has become, instead, highly bureaucratic, rule-driven and undiscriminating (as is inevitable in something which is itself nationally-agreed, standardised and centrally-administered). Any teacher who ‘ticks the boxes’ and provides the relevant bits of paper as evidence is virtually guaranteed the relevant ‘performance’ bonus. Its impact on the system overall, and the structure of teacher careers and promotion, has been minimal.65 A few
65 There is some evidence that in some schools and for some subject areas there may have been initial improvements in pupil performance. See A Atkinson et al, ‘Evaluating the impact of performance-related pay’, Centre for Market and Public Organisation, 2004; D. Marsden and R. Belfield, ‘Pay for performance where output is hard to measure: the case for performance pay for school teachers’, London School of Economics Centre for Economic Performance, 2006. However, the proportion of teachers meeting the performance thresholds and gaining their increments has been enormous (at, or close to, a hundred per cent of those eligible in many schools). And following the national roll-out, there have been no general increases in attainment across the system with which it could be associated. It seems likely that, as teachers have become familiar with what is actually required to secure payment, any initial impact on teaching effort will have vanished.

More than we bargained for
��
determined heads may be able or willing to use its complexities to reward staff or encourage others to resign; but it has failed to generate systemic change.
Performance related pay, outside a centralised and nationally uniform system, might be more effective; as, indeed, might be far greater freedom to award one-off bonuses. But just as a formal PRP system has had no significant impact within a national, centrally administered pay system, so it is likely to be far less important, outside one, than is the abolition of the national pay system itself. What schools (and notably schools with pupil premia) require is the freedom to offer higher salaries when advertising and when someone is hired, in order to attract the right staff, in the right subjects. They also need freedom from constricting and uniform national conditions of service, and the ability to create more flexible job descriptions, working hours etc, and to then reward staff accordingly.
It is worth noting that while UK independent schools make full use of their ability to set a salary freely at the point when someone is appointed, and, as we saw above, to pay more to teachers in ‘shortage’ subjects, they almost never (and possibly never) use formal performance-related pay systems thereafter. The same is true of the Swedish ‘free schools’ (the independent schools, supported by state funds, which have inspired current Conservative party policy).66 Both groups do, however, operate with working hours and conditions which are often very different from the state sector, including expectations of teachers’ involvement in extra-curricular activities and administration.67
There are two reasons why independent schools may be resistant to performance-related pay. The first is that it is actually very difficult to judge teachers’ performance, and especially how much difference they have made to pupils’
66 www.conservatives.com/Policy/Where_we_stand/Schools.aspx67 Source: personal communications from school organisations and unions in both
countries. This greater freedom may be one explanation for the ability of many Swedish private-sector/for-profit free schools to make substantial profits with exactly the same funding levels per student as state schools.

More than we bargained for
��
achievement.68 The second, which is partly but not entirely a function of the first, is that such systems are difficult to use successfully in an institution where teamwork is critical. Schools – and that certainly includes schools in deprived areas – need to encourage staff to work over and above the minimum level required, and not only on those tasks which ‘count’ for appraisal and bonus-setting.69
While managers may show little appetite for formal PRP schemes, they certainly value and strive to maintain flexibility in job descriptions and demarcations. Studies of the NHS have shown how managers there, faced with combinations of tight budgets, powerful unions, high-stakes targets and nationally set pay scales, have sought to develop new posts which fall outside existing demarcation arrangements. For example, in the early 1990s, the NHS Management Executive was insistent that the new grade of ‘health care assistant’ should be excluded from national pay arrangements.70 (They failed, in the medium term: as noted earlier, all NHS jobs other than doctors, dentists and senior managers are now incorporated into the ‘Agenda for Change’ system, with standardised terms and conditions and a single pay scale for all.)
One of the most under-researched and dramatic changes in English education, over the last decade, reflects some of the same pressures and responses. The change in question is the enormous growth in the number of teaching assistants employed (see Box 1 above). This has been partly a response to new national conditions for teachers, freeing them from some administrative tasks. It is also, I would suggest, a
68 The state system operates on the basis of numerous forms detailing and describing activities carried out by the applicant which, in principle, possibly, might be good for pupil learning. In the United States, many state systems pay teachers more if they take Masters degrees in education, even though repeated studies have found no relationship whatsoever between this and pupil performance. (Heckman op cit)
69 A considerable number of private sector organisations which use some form of performance-related bonus do so on a team basis rather than an individual one because, according to their CEOs, this brings peer pressure into play, and enlists the efforts of people who actually know what is going on. Source: Personal communications.
70 S Bach and D Winchester, ‘Opting out of pay devolution? The prospects for local pay bargaining in UK public services’, British Journal of Industrial Relations, 1994.

More than we bargained for
��
rational managerial response to sudden increases in budget allocations whose long-term stability is unclear; and the fact that, until this year, assistants’ salaries were not part of a national structure, whereas teachers’ salaries and conditions were tightly defined.
Spending spare cash on assistants was, in other words, a managerially rational response. But is also illustrates the dangers of increasing spending while severely constraining spending patterns. The use of huge numbers of teaching assistants is a purely British phenomenon; and while ministers have announced that they contribute significantly to classroom efficiency, and to raising standards, they have done so on the basis of no robust evidence whatsoever.71 There have, in fact, been only two properly constituted studies of assistants’ impact that I have been able to identify, both conducted by Professor Peter Blatchford. In a large-scale study of primary classes, and the impact of class size, Blatchford et al found: “No evidence…that either the presence of Teaching Assistants or their characteristics affected pupil progress.”72 More recently, a large longitudinal study involving more than 8,000 pupils and 20,000 staff found no evidence that teaching assistants were improving pupils’ academic performance: indeed, on the contrary, pupils who received assistance from them made less progress than other pupils of similar background and attainment levels.73
Pupil premia are a well-thought out and promising approach to equalising opportunities and attainment for disadvantaged children, in a society where formal school attainments are increasingly important. But the experiences of the past decade underline the limitations of increasing spending while
71 Ofsted published a report claiming that teaching assistants were making a major contribution to classroom efficiency, but this was, as usual, simply a digest of various individual Ofsted inspectors’ qualitative, unstandardised and uncorroborated reports. For critiques of the Ofsted methodology, and the reliability of its conclusions, see C Fitzgibbon, ‘Is Ofsted helpful?’, in C Cullingford ed, ‘An inspector calls: Ofsted and its effect on school standards’, 1999; F Coffield, ‘Ofsted inspected’, Adults Learning, December 2009.
72 P Blatchford, A Russell, P Bassett, P Brown, and C Martin, ‘The role and effects of Teaching Assistants in English primary schools (Years 4-6) 2000-2003’, Department for Education and Skills, 2004.
73 P Blatchford, P Bassett, P Brown, C Martin, A Russell and A Webster, ‘Deployment and impact of support staff project’, DCSF, 2009.
More than we bargained for
��
preventing innovative and flexible ‘supply’ responses. Huge increases in expenditure have been used to a large extent on capital expenditures and support staff, with falling productivity across education as a whole.74 Under current conditions, the introduction of pupil premia risks a repeat of these mistakes.
b: creAtIng A medIcAl crIsIs – ‘over suPPly’ In A system of rIgId sAlArIes And condItIonsA second example of the serious problems caused by central wage bargaining is to be found in the NHS. It affects junior medical staff, and, more precisely, junior doctors in hospitals, up to and including Registrar grade; in other words, the doctors who provide the front-line care for both in- and out-patients.75
In 2007, a breakdown in a newly launched national appointment system for junior doctors gradually became national news. The affair culminated in a large march through the streets of London by young doctors faced with unemployment, a rally addressed by leading Tory politicians, and a hurried remaking, on the hoof, of procedures for finding junior doctors a job and of the government’s policy on hiring overseas doctors.76 At the time, much of the blame for the fiasco was placed on a classically over-ambitious, centralised, IT-based appointments system, and this was indeed a major reason why the problems became not merely visible but a topic for prime time news broadcasts. Underlying them, however, was a problem which has not been solved, but merely hidden: the over-supply of junior doctors.
74 A Wolf, ‘Education’, in V Uberoi et al eds, ‘Options for a new Britain’, 2009; ONS, ‘Public service output, input and productivity: extended analysis of output’, 2009; ONS, ‘Public service output, input and productivity: education triangulation’, 2009. See also the website of the UK Centre for Measuring Government Activity: www.ons.gov.uk/about-statistics/ukcemga/index.html.
75 Registrar grade is now officially known as ST3 but I have retained the familiar designation.
76 A Wolf, ‘What’s up Doc?’, Prospect Magazine, June 2008; Sir J Tooke, ‘Aspiring to excellence: findings and final recommendations of the independent inquiry into modernising medical careers’, Modernising Medical Careers Inquiry, 2008.
More than we bargained for
��
Since 1997, the number of medical school places in British universities has been expanded enormously, so that it is now almost half as large again as it was in that year. Although further expansion is not planned, current intake levels will continue. This means that, year upon year, a far larger number of junior doctors than in the past are graduating from university. They all move on into a long period of combined apprenticeship and practice that leads to either hospital-based specialism or general practice. Because partners in general practice are self-employed, this part of the National Health Service is relatively flexible in terms of pay and conditions (although recent changes to GPs’ contracts, designed to give central government greater control over the profession, have in fact produced a combination of far higher expenditure and less flexibility than before).
Hospital-based medicine, however, is very different. The number of positions in different hospitals, for different specialities, is, in theory, the result of careful central planning, taking account of local ‘need’. (So too, for that matter, is the number of medical students – which did not prevent Alan Milburn, when Secretary of State, from doubling the number of new places in expanding medical schools overnight, for no apparent or explained reason.)
In practice, the NHS’s attempts at detailed manpower planning for hospitals have been about as effective as any other manpower plan in history, as indicated by the panic-stricken recruiting of overseas doctors (and nurses) which was undertaken by NHS recruiters in response to shortages in the 1990s, and also by the current situation with junior doctors. What we now have is a far larger stream of entrants into the profession, year on year, than ever before, and a health system which is in no position to hire and integrate them all. That is because the NHS is committed to a system of pay and conditions which is national, rigid and increasingly and unsustainably expensive.
In a market – and it need not be a particularly ‘perfect’ market either – supply and demand are reconciled via the price mechanism. If a large number of people are very keen to do a

More than we bargained for
��
particular job, this will tend to reduce the price they are paid, as discussed above. Salary adjustments can also allow employers to respond to changing market conditions: for example, in the 2009 recession, a good number of private companies reached agreement with their employees that everyone would take a (temporary) pay-cut in order to preserve jobs.
Public sector employers who are subject to centralised wage bargaining are completely unable to use the price mechanism in this way. They can make people redundant if there is simply not enough money to pay them at the ‘agreed’ rate; they can fail to hire; and they can cut services. But they cannot re-negotiate agreed salaries in the face of emergencies, and, even more importantly, cannot make offers to staff with given skills, for given and demarcated roles, which differ in any way from the national scales.
The NHS is currently subject to even more rigidity than in the past because of a series of decisions at both national and European level. Many people know of the European Working Time Directive, which severely limits the number of hours junior doctors can work, and which is making it increasingly difficult for them to obtain satisfactory training (since training periods count as ‘work’) alongside their current duties.77 But there have also been national agreements which laid down working time limitations, mandatory overtime rates etc, and which have also made it increasingly expensive for hospitals to employ junior doctors, and given them decreasing flexibility in how they deploy them.
The result is that, at a time of unprecedented expenditure, the NHS is experiencing a combination of hidden unemployment among junior doctors, an acute shortage of long-term contracts (since trusts are nervous about offering anything but short-term contracts), a looming crisis in the quality and availability of training, and every indication that the situation will worsen as expenditure cuts impact on the continuing flow of young graduates.
77 Some senior doctors consider that the situation is especially bad in the UK. See, for example, the August 2009 newsletter from the President of the Royal College of Surgeons, John Black: Annals of the Royal College of Surgeons, England (Supplement) 2009, p. 258–259.
More than we bargained for
�0
Abolition of national bargaining is obviously not a cure-all. But it would certainly help – and certainly be opposed, bitterly, by the doctors’ union, the British Medical Association (BMA). Like all unions, the BMA is committed to protecting the conditions and pay of its core working members. (Representing their members is what membership organisations do.) And medical unions are extremely powerful. The result, for hospital doctors, is likely to be exactly the sort of ‘dual labour market’ familiar to students of the high-unemployment economies of France, Italy, or Spain: good pay, security, pensions, and working conditions for the inner core of permanent job-holders, insecurity, low pay, and low conditions for large numbers of others on the periphery, where the young are heavily over-represented.
c: shAcklIng comPetItIon – the cAse of unIversItIesThe third and final example discussed here is also, at first sight, the most puzzling. Unlike hospitals, or local governments, the police, or, indeed, the Royal Mail, universities are both independent institutions and highly competitive ones. They vary greatly in the levels of research income they attract, and in the fees they are able to charge. (Only home undergraduate fees are set and controlled by government.) Their incomes, status, teaching and research profiles differ enormously. Yet all but two of our mainstream universities subscribe to a central wage bargaining process for both academic and non-academic staff; and they have, as noted above, recently implemented the same sort of tightly defined single salary spine for almost all employees, tying remuneration to the nature of the post held, as has the NHS (see Box 2).
This system has three profound (and, one might think, predictable) consequences. The first is that universities with relatively low income levels per student are denied the obvious cost-based strategies for competing with their more successful and wealthier rivals. They cannot, for example, decide to offer better staff-student ratios, achieved by offering lower salaries and hiring younger/less research-oriented staff. And they
More than we bargained for
�1
cannot undercut their rivals when bidding for research grants and consultancy contracts, in all of which salary costs make up far and away the largest cost component. The second, and related result, is that the sector as a whole cannot respond to the differences among areas and regions in general wage costs. There is a very small London allowance built into the national scale, and salaries at the top (including for professors) are unregulated, so institutions can and do compete for talent at that level. But universities in very high-wage areas have enormous difficulty attracting and retaining staff in a number of subject areas78 while, conversely, institutions in low-wage areas are unable to take full advantage of this fact to keep overall wage bills down, increase staff numbers, or improve laboratories and facilities (or some mixture of the three).
The third consequence is the one we are experiencing today: an inability to respond flexibly to sudden cuts in income, and, more specifically and predictably, to sudden cuts in government income. Although a large part of universities’ income comes from fees – especially from overseas students’ fees – and some from charities and contracts with industry, a great deal also comes from the government, directly or indirectly. Universities receive large payments for the teaching of home undergraduate students (with government payments per student that are in many cases considerably higher than current fee levels), from research income allocated to institutions through the competitive ‘Research Assessment Exercise’ (soon to become the ‘Research Excellence Framework’) and from research income secured by individuals from the government-funded Research Councils.79
The history of the last forty years has been one of expansion in total student numbers, accompanied by an ongoing reduction in the level of government funding per student, and punctuated by sudden cuts when government finances are in crisis.
78 The obvious ones are those where talented staff are highly mobile internationally and those where they have multiple alternative job opportunities outside academe. Oxford and Cambridge are unusual in having endowments large enough to provide ‘in-kind’ benefits which add substantially to the value of salaries.
79 ‘Home students’ are defined as students from any member state of the EU.
More than we bargained for
��
Higher education and research funding are always high on the list of ‘easy’ targets for short-term savings, and the current crisis is no exception. Universities thus find themselves facing a large budgetary shortfall, one which is greatly exacerbated by the current unaffordable wage settlement. This was reached – nationally – after industrial action, on the basis of what have turned out to be seriously inaccurate projections of inflation.80
Although the extent of the financial crisis varies between institutions, they are alike in being shackled by national wage bargaining in their response. In major economic down-turns, private sector organisations typically freeze or cut wages. Indeed, as we have seen recently, workers are often willing to accept temporary wage cuts explicitly in order to protect their and their colleagues’ jobs. Governmental organisations generally maintain wage and salary payments to their employees by either increasing taxes and government borrowing, or cutting non-wage spending (including frontline services). Universities have little ability to do either of these things, and have little confidence that they can increase income in a recession, either. So instead they are being forced into the most indiscriminate and short-term hiring freezes, forced retirements, and redundancies.81 Central bargaining, in other words, undermines the sector’s ability to respond to changing financial circumstances, and, as a result, is causing both immediate and long-term damage to its quality.
80 Even if they had been accurate, the settlement would still have imposed major burdens on some of the sector’s less prosperous institutions, as was known and noted at the time.
81 Individual universities are a little like the smaller members of the eurozone. Its countries cannot devalue and the smaller ones also have little influence on overall monetary policy.
More than we bargained for
��
7. How did we get to this point?
In contemporary England, we have a system of wage bargaining in the public services which is highly unusual in its scale and specificity, and which is generating a number of major obstacles to service reform and economic regeneration. Yet there seems extraordinarily little appetite for change. How did we arrive at this situation, and why does it appear so stable?
National wage bargaining is generally preferred and actively promoted by trade union leaders. Hall et al, in the analysis of the impact of local labour markets on health care, and death rates, quoted at length above, observe that ‘The desire for nominal wage equality across workers in different geographical areas has long been a mainstay of union activity. It is not obvious why this should be the case...’82 However, while the first of these points is true, the second is a somewhat puzzling statement. It is surely not in the least mysterious that national union organisations want exactly this.
Unions will generally have much greater leverage in negotiations, and their central offices will wield more power, if they can speak for a huge national workforce. The ever-greater dominance of the union movement as a whole by public sector workers and their unions is surely inextricably linked to the continuation of national wage bargaining in the public sector and its near-total absence in the private. Moreover, if, as a union with national membership, you are involved in national bargaining, then the obvious strategy to adopt is one of uniformity across all regions. Anything which appears to
82 E Hall, C Propper and J Van Reenan, ‘Can pay regulation kill? Panel data evidence on the effect of labor markets on hospital performance’, 2008, p. 8.
:
More than we bargained for
��
favour one region over another will be highly unpopular with those currently in work (and the workless who might one day get jobs are invisible, anonymous and mute); and attempts to find some ‘fair’ formula are bound to be highly contentious and divisive.
The ‘devil in the detail’ is presumably one reason why regional variations in the minimum wage – a policy floated on occasion by the government – have come to nothing. They have met solid opposition from the unions even though Gordon Brown, while Chancellor, was highly aware of regional variations in costs of living and actually announced (in his Mansion House speech of June 2006) the need for “more local and regional pay flexibility”. However, the main reason why such flexibility never materialised is surely to be found in the most basic political rule: avoid policies in which there are substantial and visible numbers of immediate losers among your voters, or members. Anyone who doubts this should look back at the history of the poll tax, which destroyed Margaret Thatcher.
While unions are often active in pushing for national negotiations, they are nonetheless often pushing on an open door. Governments, and employers such as NHS chief executives, or university vice-chancellors, are also happy to sign up to central agreements. Given the problems discussed above, why might this be?
One obvious reason is the cumulative centralisation of power within England, which we have remarked upon above. As authors of varying political persuasions have observed, the Tory governments of Thatcher and Major, and the Labour governments that succeeded them, have been alike in their centralising tendencies.83 Both parties have systematically reduced the administrative autonomy, and removed the revenue-raising powers, of local governments.84 Under both parties, moves to give individual schools autonomy have been
83 See, for example, S Jenkins, ‘Thatcher and sons’, 2007; C Foster, ‘British government in crisis’, 2005.
84 Business rates in England are set directly by central government. Council taxes are set locally, but have frequently been capped by central government in recent years.
More than we bargained for
��
genuine but sporadic, mostly emphasising demand/parent choice rather than supply changes; while the cost, and the political sensitivity, of any policies involving the NHS militate against any genuine reduction in central control.85
When key decisions about workforces are taken at national level, by national governments, this both elicits and requires a nationally organised interlocutor. Governments look for national union representatives across the table; just as they look for organisations representing local government, hospital managers, university vice-chancellors/rectors, and ‘social housing’ chief executives. It is therefore not surprising that British governments have tended, consistently, to bargain at national level.
Moreover, the prevalence of national negotiations is not entirely a matter of union pressure and central governmental agreement. In a number of sectors, there is no formal obligation at all to engage in national bargaining, or to observe national pay scales. Yet here, too, there has been a tendency for chief executives to operate within a national system.
CentreForum researchers recently surveyed all current Foundation Trust hospitals, which are not obliged to adopt standard national scales and conditions. They discovered that, of the 116 who had Foundation status at the time of the survey, just one hospital set its own rates: all the others used national scales.
This is, on the face of it, very curious. However, there is no real price competition between hospitals, so nothing much to be gained from pay (and cost) flexibility, while the real pressures on managers are very short term, and involve meeting immediate quantitative targets. Spending a large amount of energy arguing with unions, developing new procedures, and renegotiating contracts might offer pay-offs in the long term; but that is way beyond any senior manager’s time horizon. In any case, central government will always, in the last resort, find the money to pay consultants and doctors at the level
85 The Conservative government also gave schools (as opposed to LEAs) far more control over their own budgets and this change has been retained under Labour.
More than we bargained for
��
agreed with their union; nurses turn over fast enough that it relatively easy to adjust by changing the numbers employed; wards can, in extremis, be closed.86
Higher education shows a similar affection for central bargaining even though universities are independent institutions (receiving, in 2007-8, an average of just 36 per cent of their revenues through the Higher Education Funding Councils and Teacher Development Agency). Like Foundation Trusts, universities are at liberty to conduct their own individual pay negotiations. Again, almost without exception, they decline to do so. At present only two mainstream universities – Imperial College and Birmingham City – have opted out of national wage bargaining.
Yet, universities have recent and painful experience of declines in the real value of central government contributions.87 As noted earlier, they are one of the few areas in which the current Labour government has been willing to announce budget cuts, ahead of the 2010 election. They know that, when cuts are made, they are unable to generate the front-page human-interest stories which make the health sector so adept at protecting its budget. At the same time, they operate in a highly competitive environment. While students will pay for quality and reputation, this does not make price, or internal costs and efficiency, any more irrelevant than in the market for cars, stereo equipment, or software.
So why do universities overwhelmingly prefer to bargain collectively, even when – as with the 2007 negotiations – the final agreement was bound to leave many institutions highly stretched, and even when they know that sudden changes in government funding are completely certain, in a few years if not tomorrow? The answer is to be found in the motives and circumstances of their senior managers and their chief executives, the vice chancellors.
86 S Bach and D Winchester, ‘Opting out of pay devolution? Prospects for local pay bargaining in UK public services’, 1994.
87 The real value of support per student has declined enormously since the 1970s, although the total budget has increased over time – usually quite steadily – because of rising enrolments.
More than we bargained for
��
First, vice chancellors generally hold their position on quite short (though renewable) contracts. Their salaries are high, by academic standards, but normally without any income-related (or surplus-related) bonuses.88 Most are ex-academics, and they are running institutions which, in important respects, incorporate large numbers of small businesses. Their research groups and departments are quasi-autonomous, generate research income and student applications to a significant extent on the basis of their individual reputations rather than that of the university as a whole, and their personnel are highly mobile. Anything which makes all these groups very unhappy at once will damage most vice-chancellors irretrievably; and a head-on attack on existing salary arrangements is bound to generate institution-wide suspicion at best, and, very likely, outright opposition.
Second, a vice-chancellor operates in a long established system to which more than 100 other vice-chancellors (and their institutions) are signed up. To persuade all, or even most, of these people to institute a major change in the bargaining system would be an enormous challenge. Why should any individual take on this role, for the greater good, and at the expense of looking after their own institution?89 Third, as some very experienced vice-chancellors have pointed out to me, in the short term moving salary negotiations to institutional level imposes major costs. A whole new machinery would need to be established, and new powers and responsibilities given to HR departments with no relevant experience or, indeed, expertise. It would also mean dealing with local union branches which are, in my informants’ view, of generally low quality compared to the national officers.
Given the irrelevance of local union branches in a system of national negotiations, it would not be surprising if this latter judgement were correct. And the point is not specific to universities, but rather helps explain an apparent paradox, remarked on by Stephen Bach, a leading expert on public sector
88 As charities, universities do not make ‘profits’, but whether or not they run a surplus is critically important to their ability to expand, improve facilities etc.
89 This is a classic example of a collective action problem: see especially M Olson, ‘The logic of collective action’, 1965.
More than we bargained for
��
employment relations. At national level, under successive Labour administrations, unions have enjoyed genuine influence. But, at local and workplace level, there is “limited union influence reinforced by a lack of effective workplace organisation…There is a worrying decline in union density alongside an inability to recruit sufficient young workers.”90 Although union membership is far more common in the public than the private sector (see Table 1) it has nonetheless fallen from 84 per cent in 1980 to 59.5 per cent in 2006, and in the health sector, from 85 per cent to 48 per cent.91
It seems very likely that this reflects the greatly increased importance of central bargaining, the whittling away of local allowances, pay scales and personnel procedures, and the commensurate decline in the importance of local bargaining. In such a situation, fewer and fewer people will see any reason to be involved with workplace union activity, or to pay for the national activities which (depending on their view point) they benefit from, whether they pay or not, or have imposed upon them, will it or no. For anyone who is basically antagonistic to the existence of unions, this local decline may seem perfectly acceptable. But for anyone who sees unions as an invaluable and irreplaceable source of support, representation and protection for employees, it is another argument against our current over-centralised, sclerotic, and dysfunctional system of public sector wage bargaining.
90 S Bach, ‘Public sector employment relations; the challenge of modernisation’, 2010 (in press).
91 S Bach, K. Givan and J. Forth, ‘The public sector in transition’, 2009.
More than we bargained for
��
8. Paddling back
The dominance of central bargaining in our public services is a product, in part, of history. But it is also, critically, the result of recent British governments’ confidence that they could create far better, and more ‘rational’, centrally designed procedures than would emerge from local negotiations and decision making. As a result, the use of national negotiating machinery is entrenched in both government practice, and in legislation; while classic ‘collective action’ problems sustain the practice even in sectors, such as higher education and foundation trust hospitals, where it is not required.
Can anything be done? Fortunately, yes.
The simplest, best and most feasible path to reform would be to end all forms of collective bargaining which determine the precise wages paid to individual employees. This is not the same as removing all forms of collective bargaining, or, indeed, all national collective bargaining. But it would mean the end of national pay spines. Instead, each individual employee would have an individual contract, which would be reviewed – individually – each year.
This sweeps away all the pseudo-rationality of systems in which the demands of a post are supposedly evaluated (and re-evaluated) with the salary of the post-holder then dependent on, and determined by, this cumbersome and politicised process. It makes it possible for salaries and wages to reflect local circumstances and it allows managers genuine flexibility in the creation of new posts, and in the redefinition of what individuals’ jobs involve.
:
More than we bargained for
�0
And it can be done. We know this because it has been done. It has been done, moreover, by a country in the OECD which still enjoys both extremely high union membership in both public and private sectors, and higher public sector unionisation than our own: namely Sweden.
Most people think of Sweden as having the most all-embracing system of wage bargaining in the Western world. They may also be aware of the historic role of this system in maintaining high levels of wage equality. In some ways, both these statements still hold true; and there are still national negotiations between employers and unions, and, as we have seen, unusually high levels of union membership among the population. But since the early 1990s, Sweden has operated without any national pay spines, and without national determination of individuals’ wages or salaries.
Substantive decentralisation is even more marked in the public than in the private sector. As Nils Henrik Schager of Arbetsgivarverket, one of Sweden’s most experienced employer negotiators explains: “If I want to hire a new person, I can agree any salary I like.” Today, every individual employee has an individual contract; and every year, is awarded a pay increase (or not), on an individual basis. Schager states that, as an employer, “Of course, you’re not going to disrupt the whole place.” In practice, as employers and unions agree, most people go on getting the same deal, annually, but not all – either by occupation or by region. For example, kindergarten teachers were poorly paid and in very short supply before the change; today, they are paid more, there is no longer a shortage, and they also more productive.92
Even more remarkably, to an overseas visitor, there is no desire to revert to the old system on the part of employers, government, or unions. On the contrary. Peter Steiner, of ST – the big Swedish union representing white-collar (non-professional) civil servants93 – explained that, when the reforms were first introduced, the central offices were cautious. But local branches embraced them immediately. “We said we’d
92 Information from Staffan Löwenborg and Martina Gustaffson of SKL.93 As a rule, every public authority, utility or state company has an ST section.
More than we bargained for
�1
go slowly but within a year the whole central structure went – the locals, given the chance to negotiate, grabbed it, and there’s no way we could go back.”
Of course, he agrees, under the old central system, local employers and union sections didn’t know how to negotiate. “But now they do.” People at the centre “can’t know what is the right wage, what someone is actually doing, and as for new jobs – well, you very rarely have a totally new job. So you look at one that’s like it.” And to help them, employers can call on a national data base, run by employers’ organisations, showing what people are getting for similar jobs elsewhere in the country.
No two countries are alike, of course. Our current system is different, in many respects, from the national system of Sweden before or after these reforms, not least in the way Swedish local authorities are allowed to raise significant additional funds through local taxation. But the problem which persuaded Swedes of the need for change was similar in one sense: namely, the inability of the old system to respond to changing economic realities. In their case, the catalyst was a globalising economy. The old pay spines, accompanied by a determination to maintain very low differentials within and across sectors, meant that in an open economy, private companies found it hard to recruit and retain skilled blue-collar labour, and the same was true for public sector employers of particular, mobile professional groups. In ours, the glaring imbalance is between high and low-wage regions. But the underlying problem is the same – wage rigidity because of centrally fixed wages – and the solution is therefore the same as well.
There is one other similarity: the arrival of a national crisis. Sweden’s changes were made in the early 1990s, when the economy seemed on the brink of collapse and vast cuts had to be made in public expenditure. We now face a similar crisis. But no government will happily undertake head-on fights with every part of the public sector over every part of a wage structure, any more than individual vice-chancellors or hospital chief executives flock to abandon current pay spines.
More than we bargained for
��
What I propose simply by-passes the bureaucratic maze created by our current system. It does not try to re-reform our ‘modernisation agendas’ and pay review body structures, thereby creating new rigidities for the future. It walks on by, leaving them behind. A system built round individual contracts sets up a very different dynamic from one built round all-encompassing, centrally determined pay scales, and would transform the disliked and pointless annual appraisals that public service workers currently undergo.
None of this, of course, will change pay relativities, or revolutionise institutional autonomy, overnight.94 That has to be a gradual process. In Sweden, shifts have been genuine but slow. For example, in the tax authority, inspectors in the Stockholm region are now paid significantly more than those in more rural areas with fewer job opportunities – but we are talking about 10 per cent differences, not double. Agencies and municipalities also differ in the details of how they organise pay awards. Among public sector professionals, represented by the SACO cartel, large numbers negotiate on an entirely individual basis; elsewhere, local unions have delegated powers. In schools, the head typically deals with all teachers, which the teachers’ union feels is far from ideal: that is too many people for one person to deal with properly. In other sectors, negotiations may go down to units of 10 or so people.
Obviously, the degree to which employers and managers are able to respond to local conditions, and develop competitive strategies, depends on their total budget as well as on the conditions imposed on them through bargaining. In Sweden, some conditions (holiday entitlements, grievance procedures for example) are still nationally agreed. And a good many (though not all) national agreements still set guidelines for the total amount by which total wage bills will increase. For example, it may be agreed that a sum equivalent to 3 per cent of the total wage bill of those currently employed will
94 Pay structures are not the only things which push sectors into central bargaining. See T Leunig, ‘How the Tories can curb public sector strikes’, Financial Times, 27 October 2009.
More than we bargained for
��
be spent on pay increases; but not that each individual will receive 3 per cent.95 And any increase they do receive is on their personally agreed salary, not an addition to their ‘point’ on a national scale.
To repeat: contracts are individual and therefore no-one, anywhere, is tied to the standardised spines that once characterised Sweden as they do England today. Performance-related components on one’s salary are awarded on the basis of local management’s decisions, using procedures that are locally agreed: not on the basis of the sort of bureaucratic box-ticking that inevitably characterises national systems such as ours.96 Employers can and do respond to local conditions, and Swedish public services have not collapsed.
Moving to a Swedish system of individual contracts is not, of course, a solution to all our problems. For example, in the health service, a totally centralised funding system makes it almost impossible for England to address the impact of major differences in regional wage levels. So we need to look at other changes (including changes to local financing) as well.97
But a shift away from central wage bargaining could, and I believe, would make a major difference, over time, to the efficiency of public sector organisations, their ability to compete with each other, and the incentives they would have to innovate productively in their staffing patterns. We could expect a higher education sector in which Newcastle or Lancaster were able to capitalise on their location in competing with London or Cambridge. We could introduce a pupil premium confident that it could be used to improve education, rather than largely and inevitably wasted. At the
95 In the private sector, agreements with the blue collar unions sometimes – though not always – include the expectation that everyone will get at least a certain baseline percentage increase.
96 Swedish local government – which runs schools and hospitals as well – differs from ours in the large proportion of income raised from local taxes, notably a local income tax. This is feasible because of the country’s lack of huge regional disparities. The local tax base gives public sector employers freedom, if they wish, to go beyond the national benchmarks for average increases in the total wage bill.
97 If hospitals were able to engage in more genuine, and price-based, competition, we would surely find elective surgery moving to low-wage parts of England, rather than people taking themselves to India.

More than we bargained for
��
same time, we would be helping our most deprived regions to develop what they most need: new, private-sector jobs.
England, today, has a simple choice. We can continue with our current dysfunctional bargaining structures, and accept that, as a consequence, it will be near-impossible to encourage major changes on the ‘supply’ side of key public services. Or, we can reform these structures, free up supply, and also, in the process, contribute to the economic prospects of low-wage regions. Swedish experience shows that wholesale reform is entirely possible. What is needed is the political will.
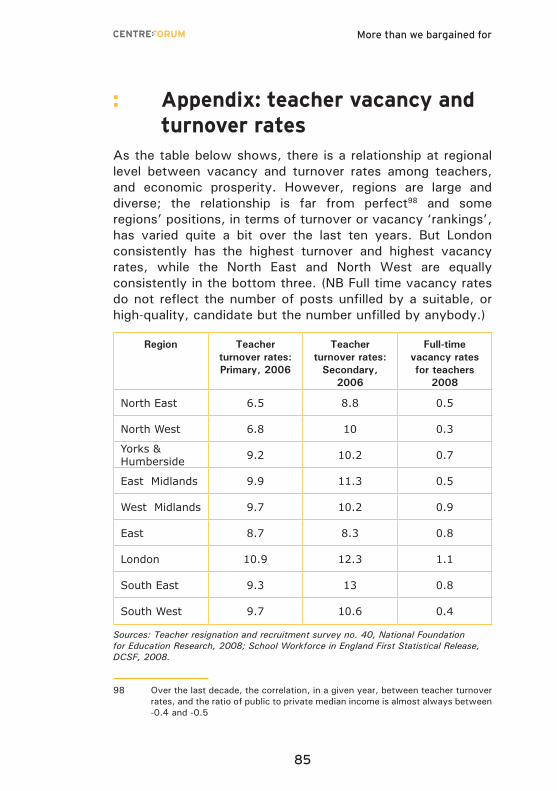
More than we bargained for
��
Appendix: teacher vacancy and turnover rates
As the table below shows, there is a relationship at regional level between vacancy and turnover rates among teachers, and economic prosperity. However, regions are large and diverse; the relationship is far from perfect98 and some regions’ positions, in terms of turnover or vacancy ‘rankings’, has varied quite a bit over the last ten years. But London consistently has the highest turnover and highest vacancy rates, while the North East and North West are equally consistently in the bottom three. (NB Full time vacancy rates do not reflect the number of posts unfilled by a suitable, or high-quality, candidate but the number unfilled by anybody.)
region teacher turnover rates: Primary, 2006
teacher turnover rates:
secondary, 2006
full-time vacancy rates for teachers
2008
North East 6.5 8.8 0.5
North West 6.8 10 0.3
Yorks & Humberside 9.2 10.2 0.7
East Midlands 9.9 11.3 0.5
West Midlands 9.7 10.2 0.9
East 8.7 8.3 0.8
London 10.9 12.3 1.1
South East 9.3 13 0.8
South West 9.7 10.6 0.4
Sources: Teacher resignation and recruitment survey no. 40, National Foundation for Education Research, 2008; School Workforce in England First Statistical Release, DCSF, 2008.
98 Over the last decade, the correlation, in a given year, between teacher turnover rates, and the ratio of public to private median income is almost always between -0.4 and -0.5
: