mori/14388dta - drivers technology findings 5 ... radar detectors conducted by mori in great britain...
TRANSCRIPT
MORI/14388DTA.RAC

MORI/14388DTA.RAC
Contents
Introduction 1 Summary 3 Main Findings 5 Marked-up Questionnaire 8
MORI/14388DTA.RAC
Introduction This document presents the summary findings for a survey of users and non-users of radar detectors conducted by MORI in Great Britain on behalf the Drivers’ Technology Association. The purpose of this research is to provide accurate information on driving behaviour and attitudes towards in-car radar detectors among users and non-users of these devices. The survey results will be included in forthcoming consultation by the DETR into future Government legislation on the use of radar detectors. Specifically the study focused on the following areas: - Car ownership - Total and business mileage - Number of accidents - Contributory factors to previous accidents - Attitudes towards speed and the use of speed cameras - Use of radar detectors - Driving behaviour since purchasing a radar detector Sample Design A sample of 501 users and 512 non-users were interviewed by telephone between 5 and 19 March 2001. The interview lasted approximately 10 minutes. The sample of 501 radar detector users was randomly drawn from three sets of leads provided by the Diver’s Technology Association of individuals who had bought a radar detector in the last eighteen months. No quotas were set among this group. Among the 512 non-users of radar detectors quotas were set on age, gender and social class. These quotas reflected the known profile of GB drivers.
MORI/14388DTA.RAC
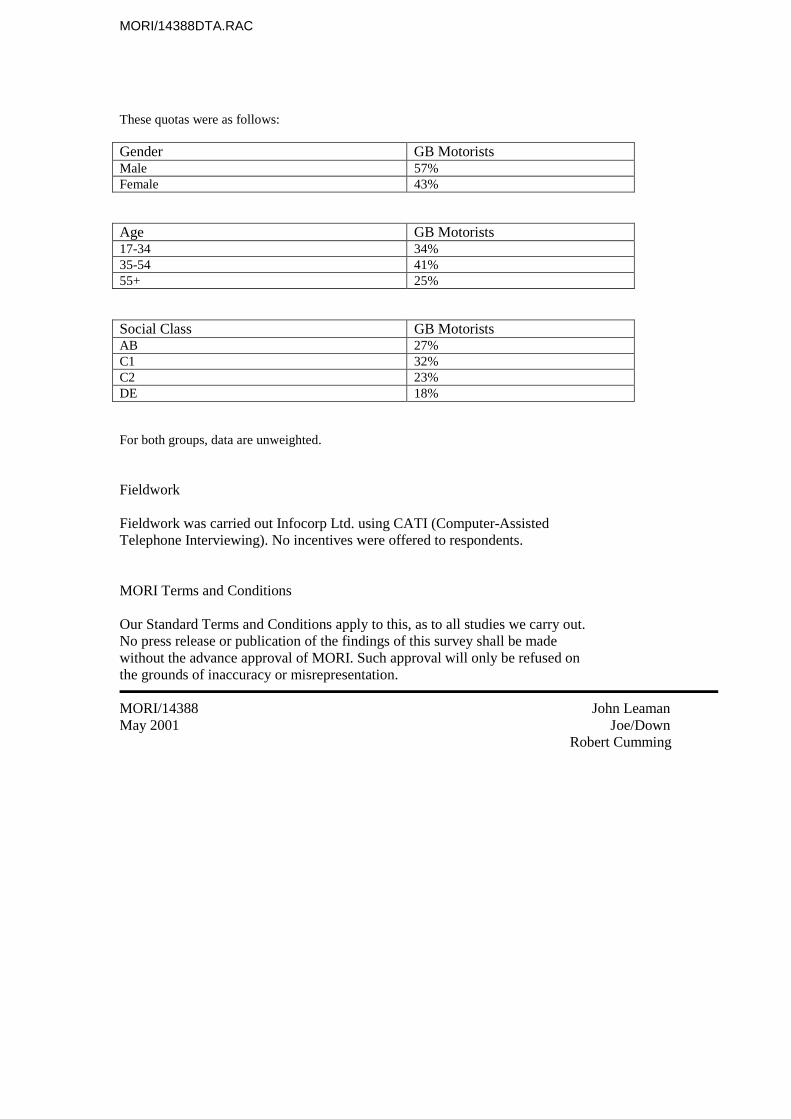
These quotas were as follows: Gender GB Motorists Male 57% Female 43% Age GB Motorists 17-34 34% 35-54 41% 55+ 25% Social Class GB Motorists AB 27% C1 32% C2 23% DE 18% For both groups, data are unweighted. Fieldwork Fieldwork was carried out Infocorp Ltd. using CATI (Computer-Assisted Telephone Interviewing). No incentives were offered to respondents. MORI Terms and Conditions Our Standard Terms and Conditions apply to this, as to all studies we carry out. No press release or publication of the findings of this survey shall be made without the advance approval of MORI. Such approval will only be refused on the grounds of inaccuracy or misrepresentation.
MORI/14388 John Leaman May 2001 Joe/Down Robert Cumming
MORI/14388DTA.RAC
Summary
Radar detector users are a very different type of driver to non-users by average mileage, income and type of car driven. Users are heavy drivers averaging almost twice the annual mileage (both total and business) of non-users of radar detectors interviewed in this survey. Perhaps reflecting the higher average business mileage, a higher proportion of users tend to be in full-time employment (79% compared to 60% of non-users). Furthermore, users have a far higher average income (averaging £54,100 per year compared to £17,300 among non-users interviewed). They are also more likely to drive a higher performance car such as an Audi/Volkswagen, BMW or Mercedes and describe the area in which they live as the countryside rather than the town or city or a suburb. Users appear to travel 50% further between accidents than non-users. In this survey the users interviewed travelling on average 217,353 miles between accidents compared to 143,401 miles between accidents of those non-users drawn randomly from the general public. A similar proportion of users and non-users suggest speed (either their own or that of other drivers) was a contributory factor in their last accident, although a marginally higher proportion of users indicate that speed was a ‘significant’ factor. Three in five users and non-users express that another driver was at fault in their last accident. A slightly higher proportion of users (29% vs. 24%) indicates that they were responsible for their last accident — although this is only just a significant statistical difference. Half of users (compared to 43% of non-users) agree they are not always aware of the speed limit, although three-quarters indicate that they are more aware of the speed Limit in the areas in which they are driving since purchasing a radar detector. Users appear to be more cynical about the purpose of speed cameras. Three quarters agree with the statement ‘speed cameras are only used to raise revenue and less than one in five agree that speed cameras are only positioned at accident black spots. This contrasts with non-users, among whom, just over a third agree cameras are only used to raise revenue and over a quarter who agree cameras are only positioned at accident black spots.

MORI/14388DTA.RAC
In addition, while three in five non-users feel people in general drive too fast, under half of users feel the same. Almost all users agree the motorway speed limit should be raised to 80 miles per hour compared to only half of non-users. Despite attitudes towards speed limits, radar detector users feel that purchasing a detector has had a positive effect on their driving behaviour. Three-quarters agree, perhaps unsurprisingly, that since purchasing a radar detector they have become more conscious about keeping to the speed limit and that they have become more speed aware generally. Three in five radar detector users claim to have become a safer driver since purchasing a detector.
MORI/14388DTA.RAC
Main Findings
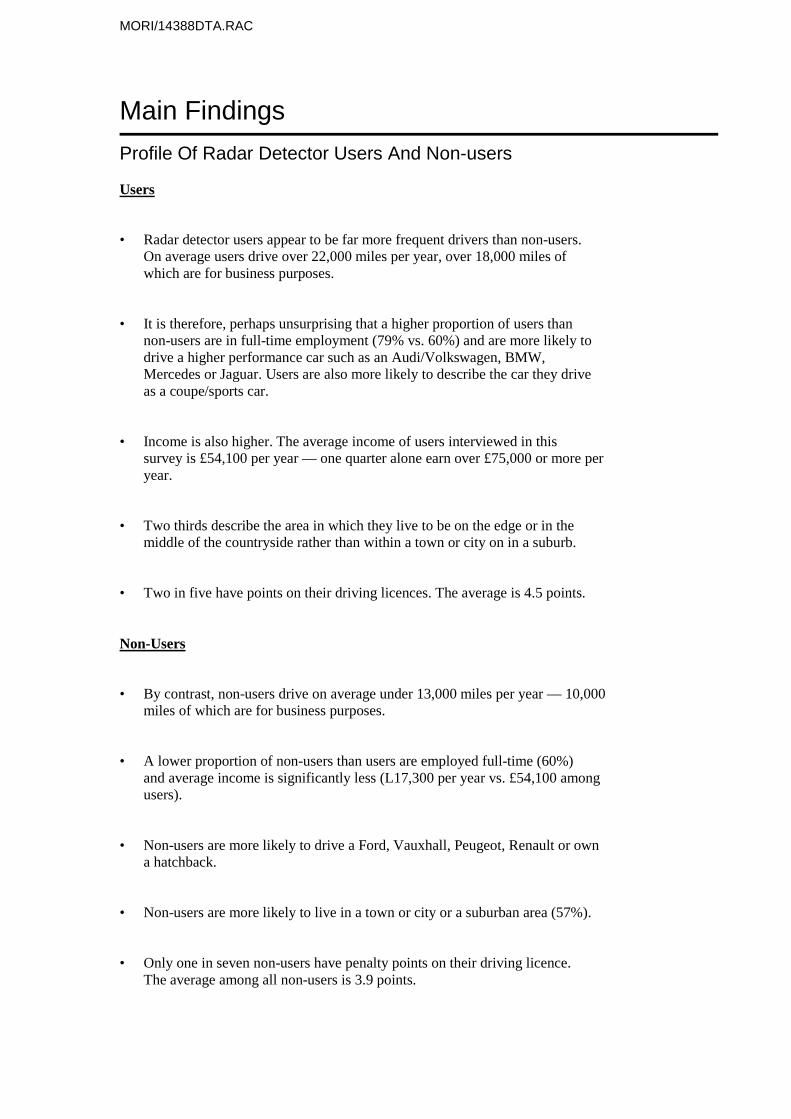
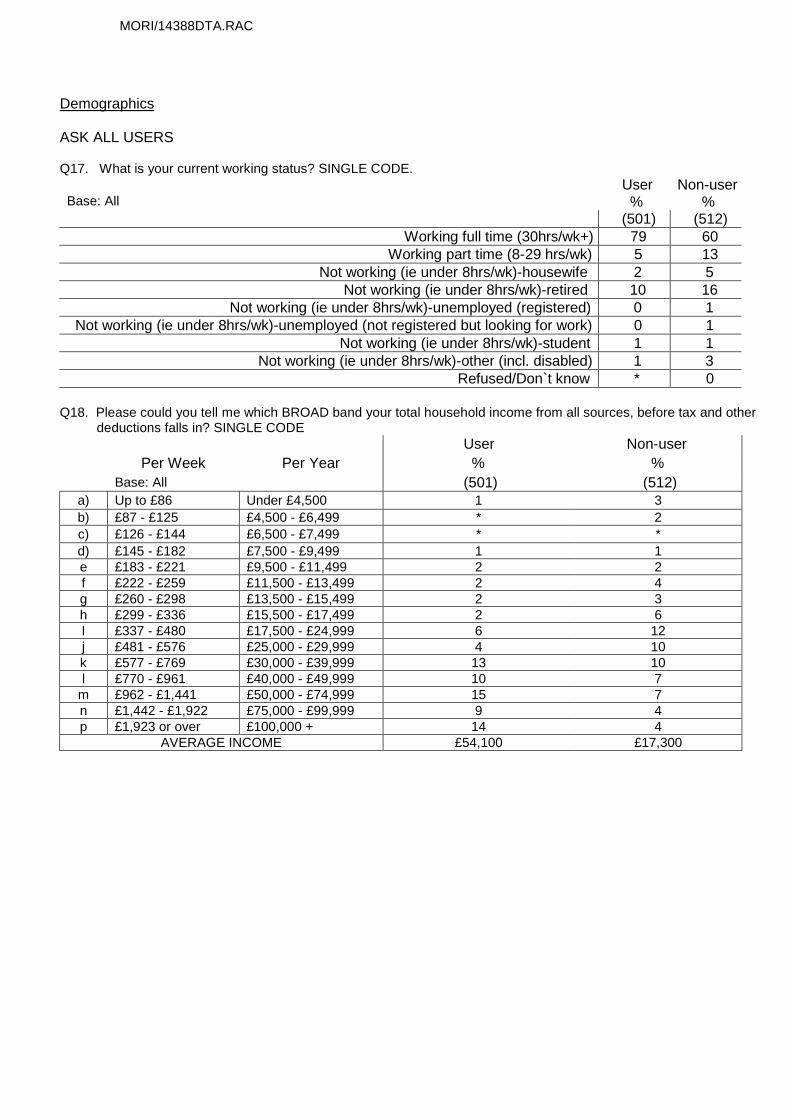
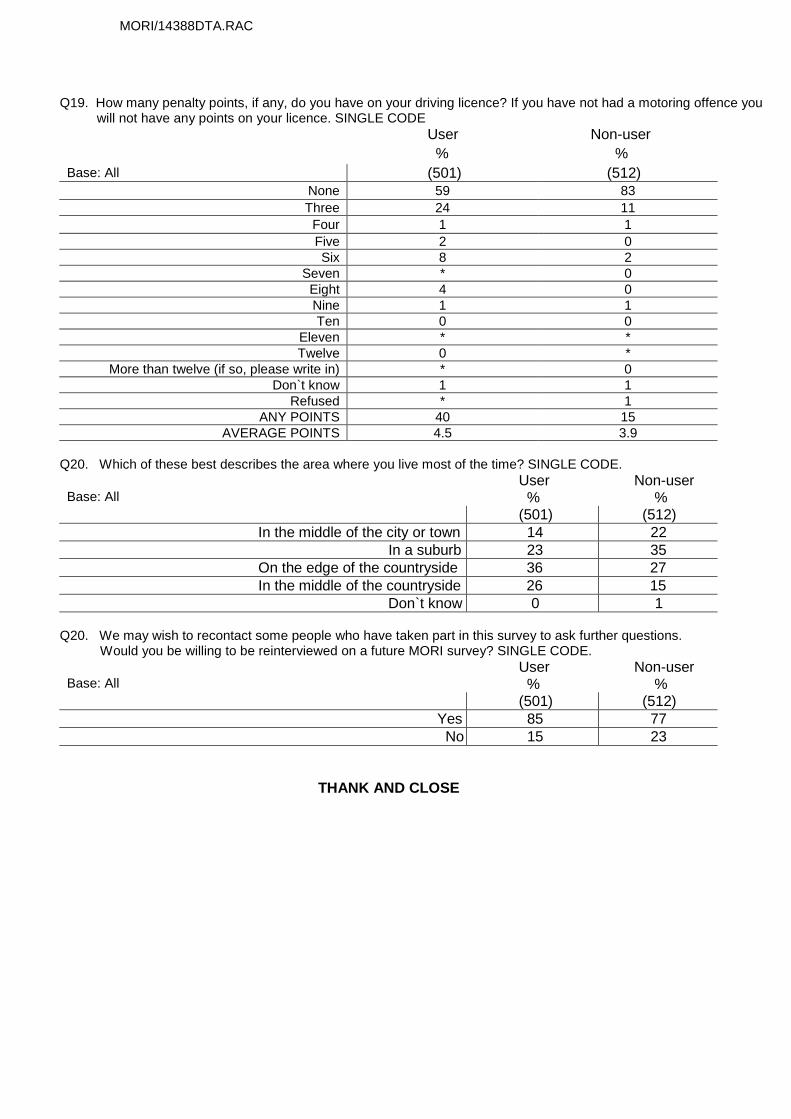
Profile Of Radar Detector Users And Non-users Users • Radar detector users appear to be far more frequent drivers than non-users. On average users drive over 22,000 miles per year, over 18,000 miles of which are for business purposes. • It is therefore, perhaps unsurprising that a higher proportion of users than non-users are in full-time employment (79% vs. 60%) and are more likely to drive a higher performance car such as an Audi/Volkswagen, BMW, Mercedes or Jaguar. Users are also more likely to describe the car they drive as a coupe/sports car. • Income is also higher. The average income of users interviewed in this survey is £54,100 per year — one quarter alone earn over £75,000 or more per year. • Two thirds describe the area in which they live to be on the edge or in the middle of the countryside rather than within a town or city on in a suburb. • Two in five have points on their driving licences. The average is 4.5 points. Non-Users • By contrast, non-users drive on average under 13,000 miles per year — 10,000 miles of which are for business purposes. • A lower proportion of non-users than users are employed full-time (60%) and average income is significantly less (L17,300 per year vs. £54,100 among users). • Non-users are more likely to drive a Ford, Vauxhall, Peugeot, Renault or own a hatchback. • Non-users are more likely to live in a town or city or a suburban area (57%). • Only one in seven non-users have penalty points on their driving licence. The average among all non-users is 3.9 points.

MORI/14388DTA.RAC
No. Of Accidents • One in ten (9%) radar detector users have had an accident in the last year. This compares to one in twenty (5%) non-users. However, this is just a statistically significant difference. In the last three years, one in five (20%) of users have had an accident compared to one in eight (13%) of non-users. • This reflects a higher mileage among users. The average distance between accidents among this group is 217,353 miles. The corresponding distance among non-users is 143,401 miles. • This distance is calculated as follows: Average number of Miles = Total Miles Driven in Driven per Accident Past Year
Total number of Accidents in Past Year
Source: Yanklovich, Skelly and White/Clancy, Shulman — US, 1998 ‘Total Miles Driven’ = average miles driven during the previous year and number of respondents. ‘Total number of Accidents’ = the total number of accidents reported in the previous year. • Drivers cite a wide range of contributory factors to their last accident. Those who have had an recent accident most commonly mention the speed of others as a contributory factor (26% of users and 33% of non-users), followed by weather conditions/poor visibility (24% of each) and distractions outside the car (18% and 21% respectively). • Around one in ten accept their own speed was a contributory factor in their last accident. • In general, non-users are more likely to suggest that speed was a contributory factor in their last accident (27% of users and 37% of non-users). While three in five blame another driver, marginally more radar detector users take responsibility than non-users (29% of users and 24%of non-users).
MORI/14388DTA.RAC
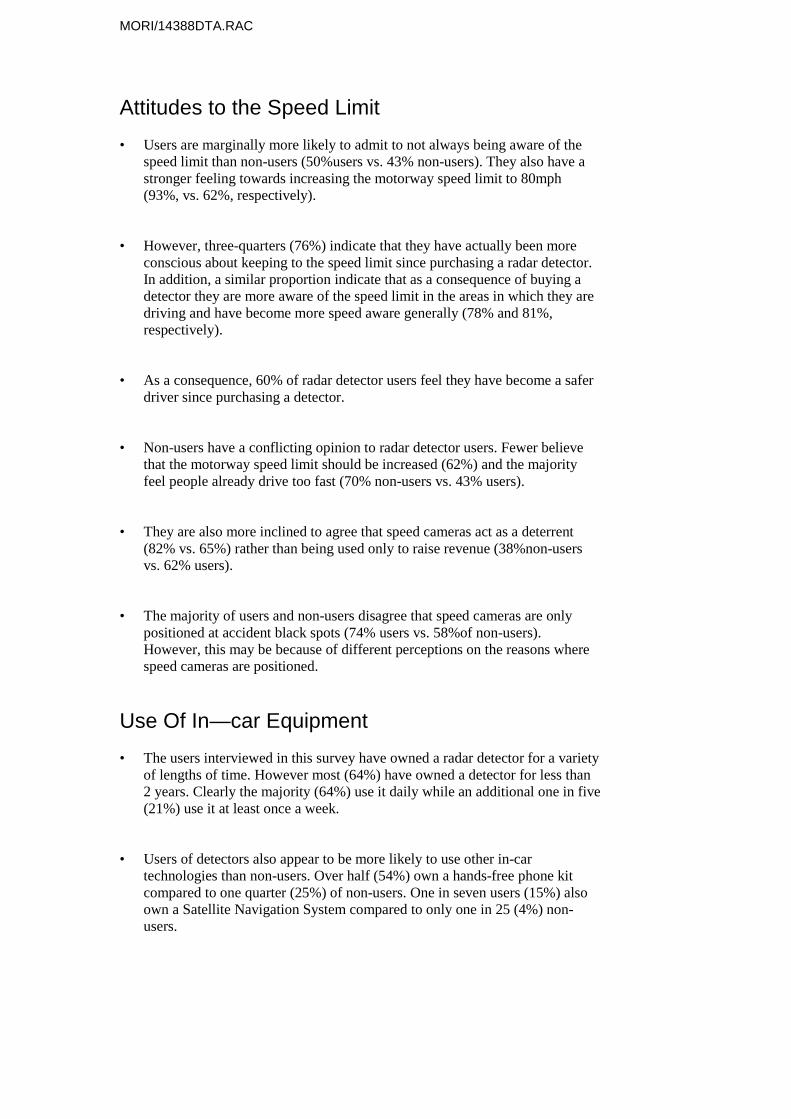
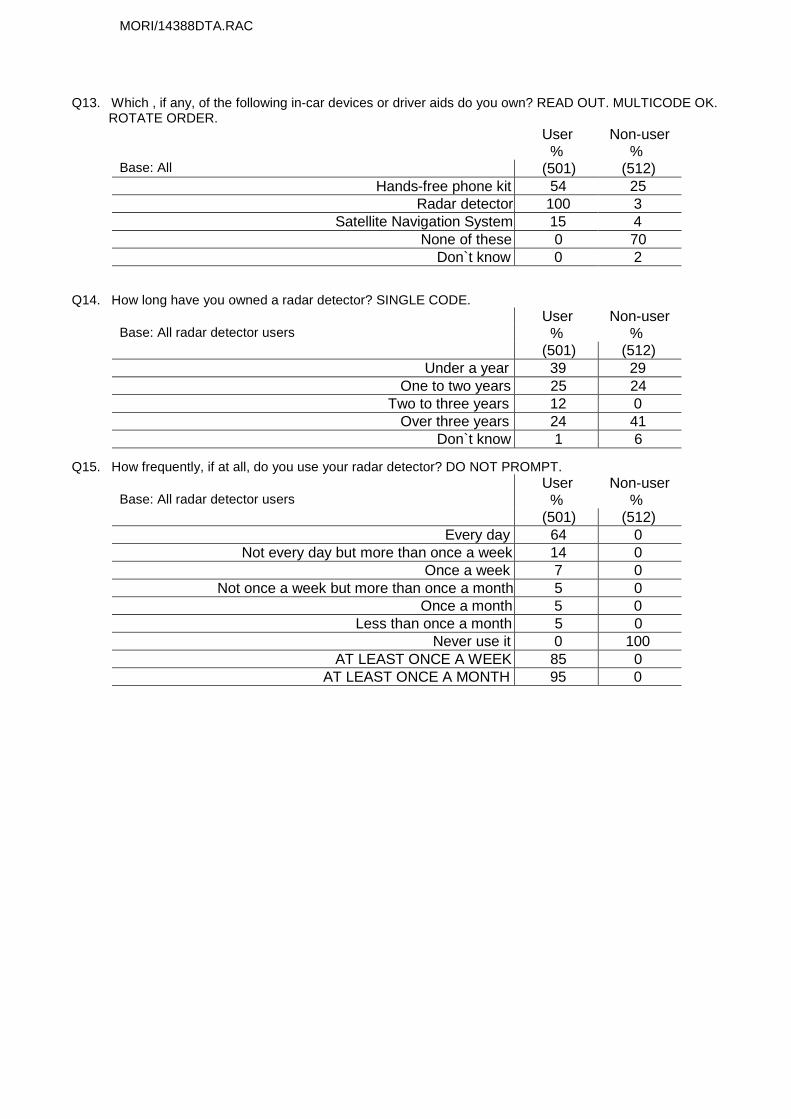
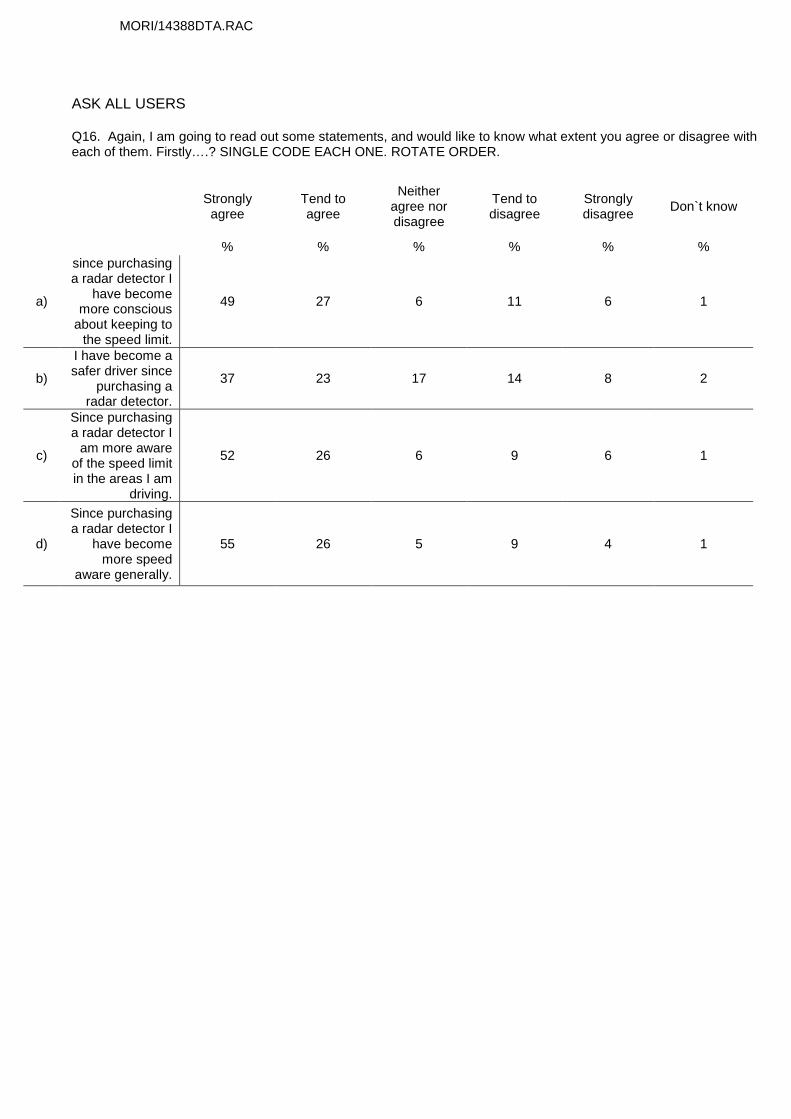
Attitudes to the Speed Limit • Users are marginally more likely to admit to not always being aware of the speed limit than non-users (50%users vs. 43% non-users). They also have a stronger feeling towards increasing the motorway speed limit to 80mph (93%, vs. 62%, respectively). • However, three-quarters (76%) indicate that they have actually been more conscious about keeping to the speed limit since purchasing a radar detector. In addition, a similar proportion indicate that as a consequence of buying a detector they are more aware of the speed limit in the areas in which they are driving and have become more speed aware generally (78% and 81%, respectively). • As a consequence, 60% of radar detector users feel they have become a safer driver since purchasing a detector. • Non-users have a conflicting opinion to radar detector users. Fewer believe that the motorway speed limit should be increased (62%) and the majority feel people already drive too fast (70% non-users vs. 43% users). • They are also more inclined to agree that speed cameras act as a deterrent (82% vs. 65%) rather than being used only to raise revenue (38%non-users vs. 62% users). • The majority of users and non-users disagree that speed cameras are only positioned at accident black spots (74% users vs. 58%of non-users). However, this may be because of different perceptions on the reasons where speed cameras are positioned. Use Of In—car Equipment • The users interviewed in this survey have owned a radar detector for a variety of lengths of time. However most (64%) have owned a detector for less than 2 years. Clearly the majority (64%) use it daily while an additional one in five (21%) use it at least once a week. • Users of detectors also appear to be more likely to use other in-car technologies than non-users. Over half (54%) own a hands-free phone kit compared to one quarter (25%) of non-users. One in seven users (15%) also own a Satellite Navigation System compared to only one in 25 (4%) non- users.

MORI/14388DTA.RAC
Marked-up Questionnaire
MORI/14388DTA.RAC
Radar Detection Survey
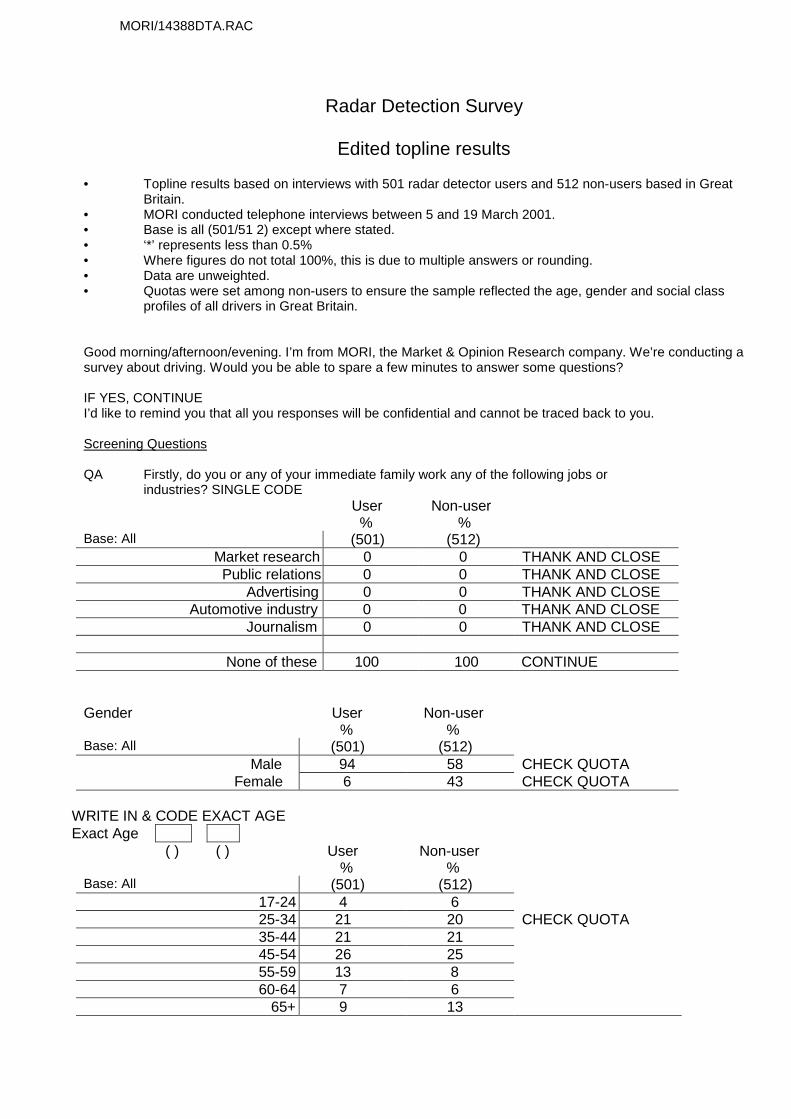
Edited topline results • Topline results based on interviews with 501 radar detector users and 512 non-users based in Great
Britain. • MORI conducted telephone interviews between 5 and 19 March 2001. • Base is all (501/51 2) except where stated. • ‘*’ represents less than 0.5% • Where figures do not total 100%, this is due to multiple answers or rounding. • Data are unweighted. • Quotas were set among non-users to ensure the sample reflected the age, gender and social class
profiles of all drivers in Great Britain. Good morning/afternoon/evening. I’m from MORI, the Market & Opinion Research company. We’re conducting a survey about driving. Would you be able to spare a few minutes to answer some questions? IF YES, CONTINUE I’d like to remind you that all you responses will be confidential and cannot be traced back to you. Screening Questions QA Firstly, do you or any of your immediate family work any of the following jobs or industries? SINGLE CODE
User Non-user % %
Base: All (501) (512) Market research 0 0 THANK AND CLOSE Public relations 0 0 THANK AND CLOSE Advertising 0 0 THANK AND CLOSE Automotive industry 0 0 THANK AND CLOSE Journalism 0 0 THANK AND CLOSE None of these 100 100 CONTINUE
Gender User Non-user % % Base: All (501) (512) Male 94 58 CHECK QUOTA Female 6 43 CHECK QUOTA
WRITE IN & CODE EXACT AGE Exact Age ( ) ( ) User Non-user
% % Base: All (501) (512) 17-24 4 6 25-34 21 20 CHECK QUOTA 35-44 21 21 45-54 26 25 55-59 13 8 60-64 7 6 65+ 9 13
MORI/14388DTA.RAC
Occupation of Chief Income Earner Position/rank/grade
Industry/type of company
Quals/ degree/apprenticeship
Number of staff responsible for
REMEMBER TO PROBE FULLY FOR PENSION AND CODE FROM ABOVE
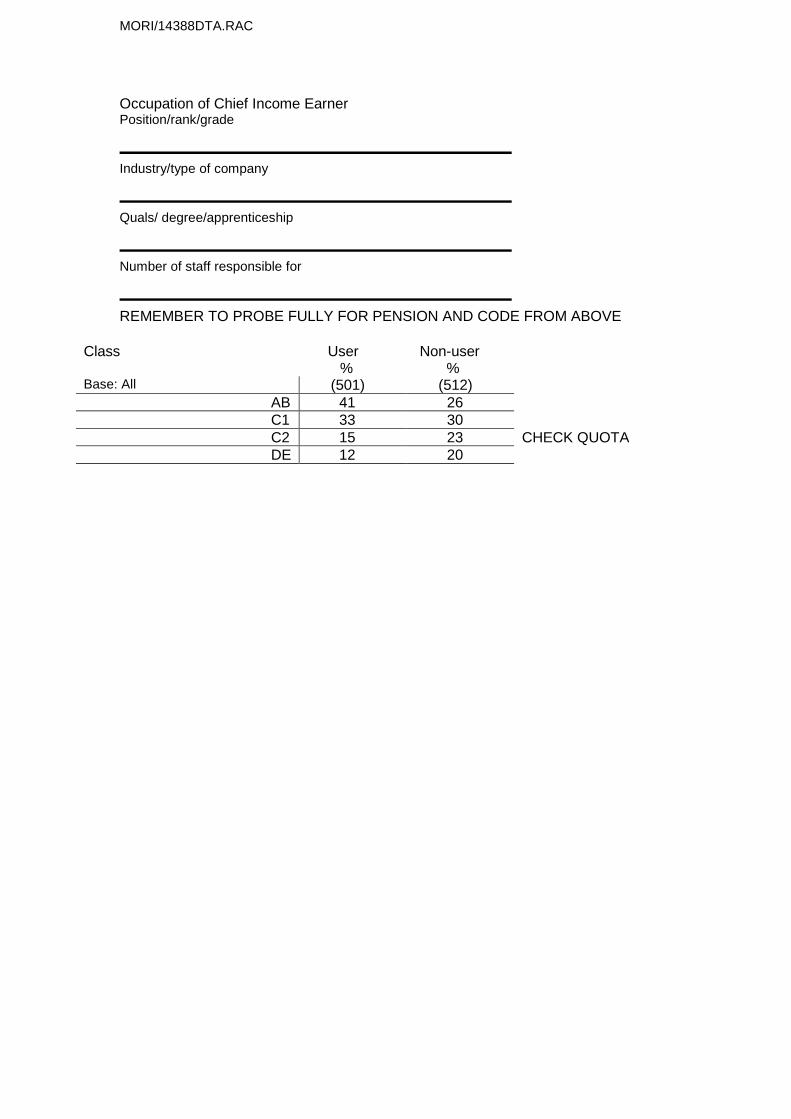
Class User Non-user % % Base: All (501) (512) AB 41 26 C1 33 30 C2 15 23 CHECK QUOTA DE 12 20
MORI/14388DTA.RAC
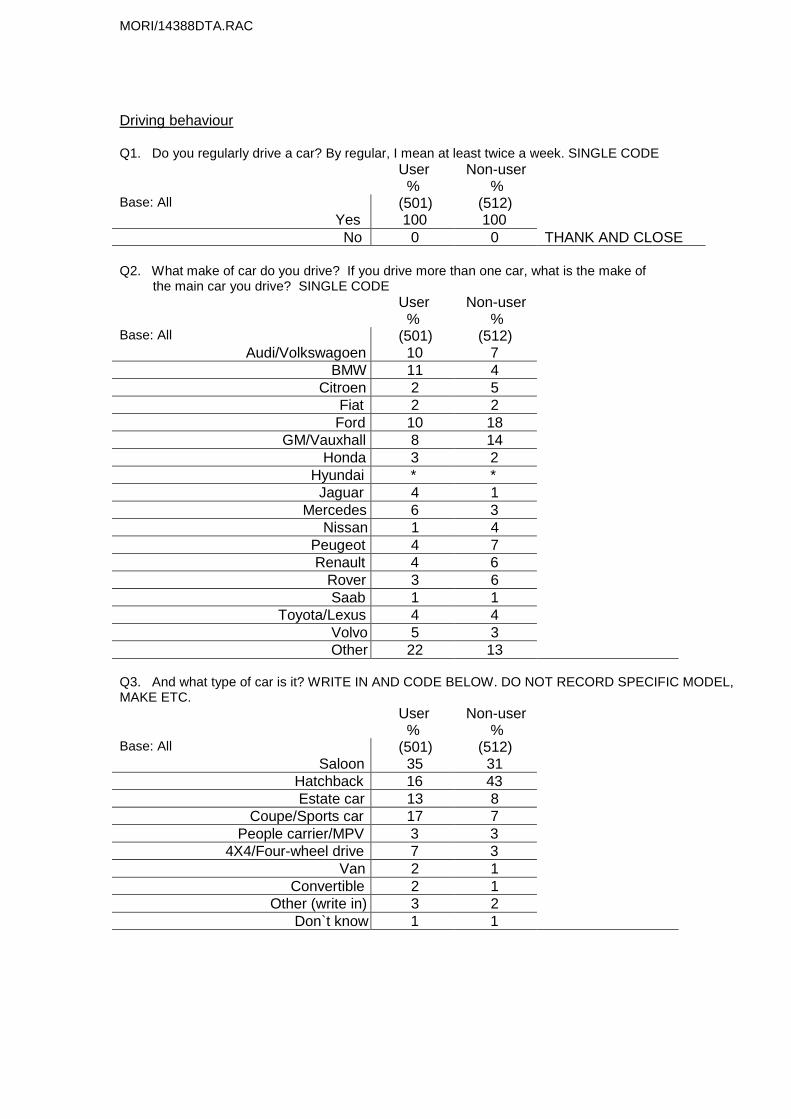
Driving behaviour Q1. Do you regularly drive a car? By regular, I mean at least twice a week. SINGLE CODE User Non-user % % Base: All (501) (512) Yes 100 100 No 0 0 THANK AND CLOSE Q2. What make of car do you drive? If you drive more than one car, what is the make of the main car you drive? SINGLE CODE User Non-user % % Base: All (501) (512) Audi/Volkswagoen 10 7 BMW 11 4 Citroen 2 5 Fiat 2 2 Ford 10 18 GM/Vauxhall 8 14 Honda 3 2 Hyundai * * Jaguar 4 1 Mercedes 6 3 Nissan 1 4 Peugeot 4 7 Renault 4 6 Rover 3 6 Saab 1 1 Toyota/Lexus 4 4 Volvo 5 3 Other 22 13 Q3. And what type of car is it? WRITE IN AND CODE BELOW. DO NOT RECORD SPECIFIC MODEL, MAKE ETC. User Non-user % % Base: All (501) (512) Saloon 35 31 Hatchback 16 43 Estate car 13 8 Coupe/Sports car 17 7 People carrier/MPV 3 3 4X4/Four-wheel drive 7 3 Van 2 1 Convertible 2 1 Other (write in) 3 2 Don`t know 1 1
MORI/14388DTA.RAC
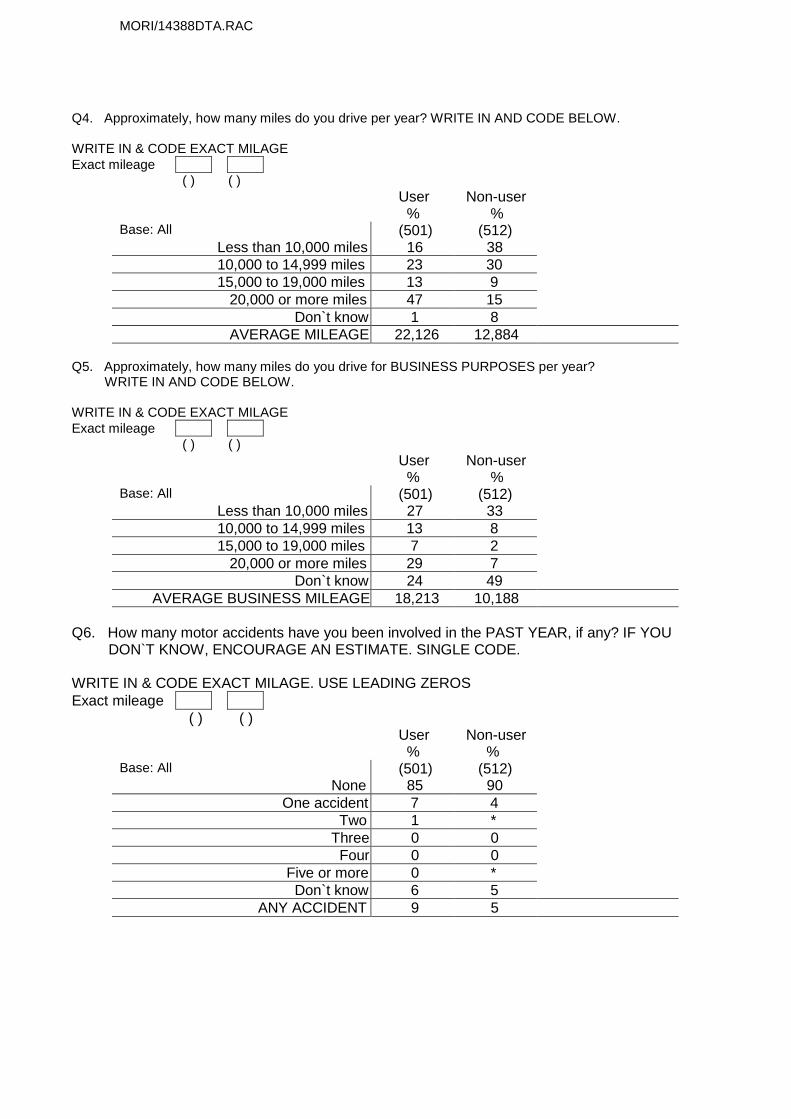
Q4. Approximately, how many miles do you drive per year? WRITE IN AND CODE BELOW. WRITE IN & CODE EXACT MILAGE Exact mileage
( ) ( ) User Non-user % % Base: All (501) (512) Less than 10,000 miles 16 38 10,000 to 14,999 miles 23 30 15,000 to 19,000 miles 13 9 20,000 or more miles 47 15 Don`t know 1 8 AVERAGE MILEAGE 22,126 12,884
Q5. Approximately, how many miles do you drive for BUSINESS PURPOSES per year? WRITE IN AND CODE BELOW. WRITE IN & CODE EXACT MILAGE Exact mileage
( ) ( ) User Non-user % % Base: All (501) (512) Less than 10,000 miles 27 33 10,000 to 14,999 miles 13 8 15,000 to 19,000 miles 7 2 20,000 or more miles 29 7 Don`t know 24 49 AVERAGE BUSINESS MILEAGE 18,213 10,188
Q6. How many motor accidents have you been involved in the PAST YEAR, if any? IF YOU DON`T KNOW, ENCOURAGE AN ESTIMATE. SINGLE CODE. WRITE IN & CODE EXACT MILAGE. USE LEADING ZEROS Exact mileage
( ) ( ) User Non-user % % Base: All (501) (512) None 85 90 One accident 7 4 Two 1 * Three 0 0 Four 0 0 Five or more 0 * Don`t know 6 5 ANY ACCIDENT 9 5
MORI/14388DTA.RAC
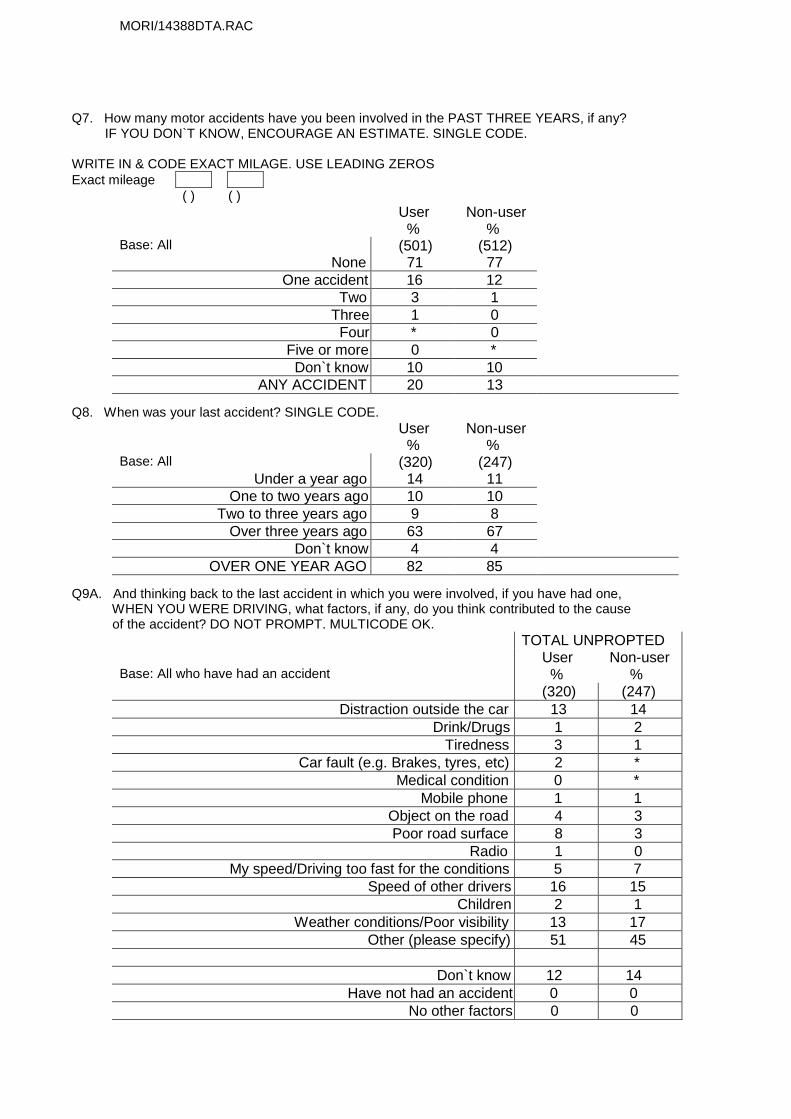
Q7. How many motor accidents have you been involved in the PAST THREE YEARS, if any? IF YOU DON`T KNOW, ENCOURAGE AN ESTIMATE. SINGLE CODE. WRITE IN & CODE EXACT MILAGE. USE LEADING ZEROS Exact mileage
( ) ( ) User Non-user % % Base: All (501) (512) None 71 77 One accident 16 12 Two 3 1 Three 1 0 Four * 0 Five or more 0 * Don`t know 10 10 ANY ACCIDENT 20 13
Q8. When was your last accident? SINGLE CODE.
User Non-user % % Base: All (320) (247) Under a year ago 14 11 One to two years ago 10 10 Two to three years ago 9 8 Over three years ago 63 67 Don`t know 4 4 OVER ONE YEAR AGO 82 85
Q9A. And thinking back to the last accident in which you were involved, if you have had one, WHEN YOU WERE DRIVING, what factors, if any, do you think contributed to the cause of the accident? DO NOT PROMPT. MULTICODE OK.
TOTAL UNPROPTED User Non-user Base: All who have had an accident % % (320) (247) Distraction outside the car 13 14 Drink/Drugs 1 2 Tiredness 3 1 Car fault (e.g. Brakes, tyres, etc) 2 * Medical condition 0 * Mobile phone 1 1 Object on the road 4 3 Poor road surface 8 3 Radio 1 0 My speed/Driving too fast for the conditions 5 7 Speed of other drivers 16 15 Children 2 1 Weather conditions/Poor visibility 13 17 Other (please specify) 51 45 Don`t know 12 14 Have not had an accident 0 0 No other factors 0 0

MORI/14388DTA.RAC
MENTIONED PROMPTED PLUS UNPROMPTED Q9A/B. And which of the following factors that I am about to read out,if any, do you think contributed to your last accident? READ OUT AND CODE BELOW. MULTICODE OK. ROTATE ORDER.
TOTAL UNPROPTED User Non-user Base: All who have had an accident % % (501) (512) Distraction outside the car 18 21 Drink/Drugs 2 2 Tiredness 6 6 Car fault (e.g. Brakes, tyres, etc) 3 1 Medical condition 1 * Mobile phone 1 1 Object on the road 8 4 Poor road surface 12 7 Radio 2 * My speed/Driving too fast for the conditions 12 9 Speed of other drivers 26 33 Children 3 3 Weather conditions/Poor visibility 24 24 Other (please specify) 53 49 Don`t know 14 16
Q10. Who do you think was at fault in your most recent accident? DO NOT PROMPT. SINGLE CODE.
User Non-user Base: All who have had an accident % % (501) (512) Me (respondent) 29 20 Other driver 61 60 Joint responsibility 4 6 Other (type in) 4 5 Don`t know 2 4
Q11. How significant do you think your speed or the speed of the other driver was in contributing to your accident? SINGLE CODE.
User Non-user Base: All who have had an accident % % (501) (512) Very significant 16 20 Fairly significant 11 17 Not Very significant 14 10 Not at all significant 49 45 Don`t know 6 6
MORI/14388DTA.RAC
Speed Cameras
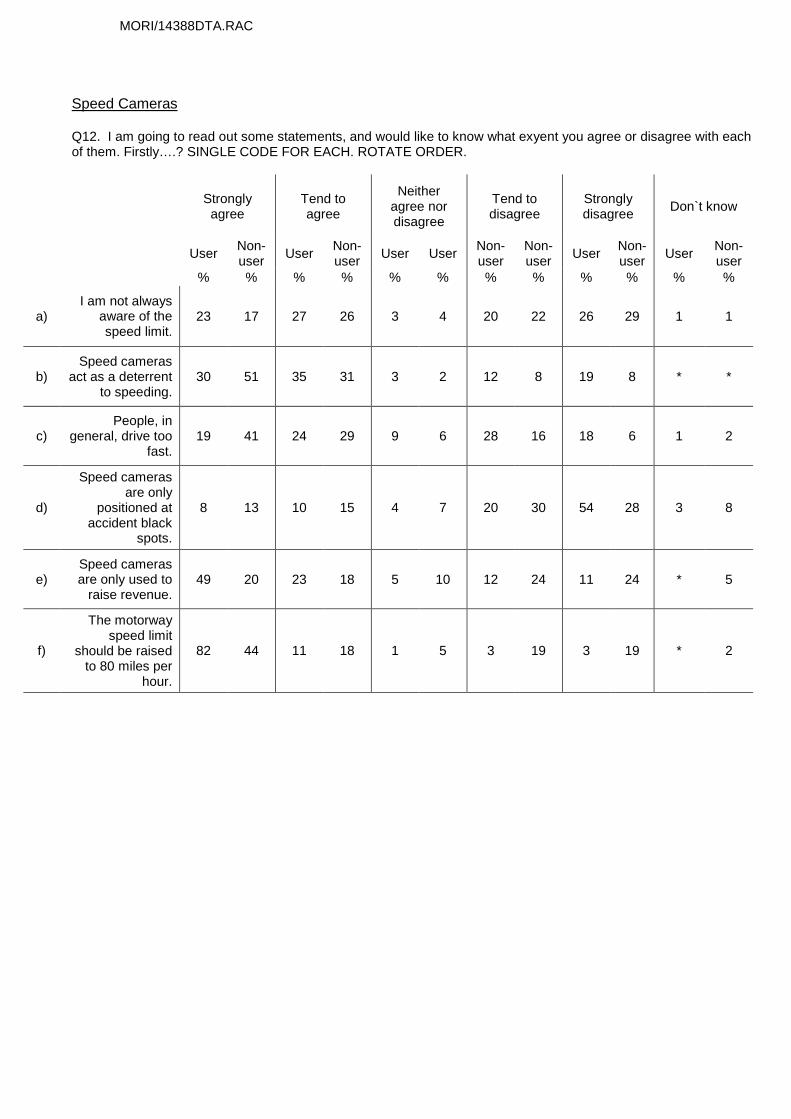
Q12. I am going to read out some statements, and would like to know what exyent you agree or disagree with each of them. Firstly….? SINGLE CODE FOR EACH. ROTATE ORDER.
Strongly agree
Tend to agree
Neither agree nor disagree
Tend to disagree
Strongly disagree Don`t know
User Non-user User Non-
user User User Non-user
Non-user User Non-
user User Non-user
% % % % % % % % % % % %
a) I am not always
aware of the speed limit.
23 17 27 26 3 4 20 22 26 29 1 1
b) Speed cameras
act as a deterrent to speeding.
30 51 35 31 3 2 12 8 19 8 * *
c) People, in
general, drive too fast.
19 41 24 29 9 6 28 16 18 6 1 2
d)
Speed cameras are only
positioned at accident black
spots.
8 13 10 15 4 7 20 30 54 28 3 8
e) Speed cameras are only used to
raise revenue. 49 20 23 18 5 10 12 24 11 24 * 5
f)
The motorway speed limit
should be raised to 80 miles per
hour.
82 44 11 18 1 5 3 19 3 19 * 2
MORI/14388DTA.RAC
Q13. Which , if any, of the following in-car devices or driver aids do you own? READ OUT. MULTICODE OK. ROTATE ORDER.
User Non-user % % Base: All (501) (512) Hands-free phone kit 54 25 Radar detector 100 3 Satellite Navigation System 15 4 None of these 0 70 Don`t know 0 2
Q14. How long have you owned a radar detector? SINGLE CODE.
User Non-user Base: All radar detector users % % (501) (512) Under a year 39 29 One to two years 25 24 Two to three years 12 0 Over three years 24 41 Don`t know 1 6
Q15. How frequently, if at all, do you use your radar detector? DO NOT PROMPT.
User Non-user Base: All radar detector users % % (501) (512) Every day 64 0 Not every day but more than once a week 14 0 Once a week 7 0 Not once a week but more than once a month 5 0 Once a month 5 0 Less than once a month 5 0 Never use it 0 100 AT LEAST ONCE A WEEK 85 0 AT LEAST ONCE A MONTH 95 0
MORI/14388DTA.RAC
ASK ALL USERS
Q16. Again, I am going to read out some statements, and would like to know what extent you agree or disagree with each of them. Firstly….? SINGLE CODE EACH ONE. ROTATE ORDER.
Strongly agree
Tend to agree
Neither agree nor disagree
Tend to disagree
Strongly disagree Don`t know
% % % % % %
a)
since purchasing a radar detector I
have become more conscious
about keeping to the speed limit.
49 27 6 11 6 1
b)
I have become a safer driver since
purchasing a radar detector.
37 23 17 14 8 2
c)
Since purchasing a radar detector I
am more aware of the speed limit in the areas I am
driving.
52 26 6 9 6 1
d)
Since purchasing a radar detector I
have become more speed
aware generally.
55 26 5 9 4 1
MORI/14388DTA.RAC
Demographics ASK ALL USERS Q17. What is your current working status? SINGLE CODE. User Non-user Base: All % % (501) (512) Working full time (30hrs/wk+) 79 60 Working part time (8-29 hrs/wk) 5 13 Not working (ie under 8hrs/wk)-housewife 2 5 Not working (ie under 8hrs/wk)-retired 10 16 Not working (ie under 8hrs/wk)-unemployed (registered) 0 1 Not working (ie under 8hrs/wk)-unemployed (not registered but looking for work) 0 1 Not working (ie under 8hrs/wk)-student 1 1 Not working (ie under 8hrs/wk)-other (incl. disabled) 1 3 Refused/Don`t know * 0
Q18. Please could you tell me which BROAD band your total household income from all sources, before tax and other deductions falls in? SINGLE CODE
User Non-user Per Week Per Year % % Base: All (501) (512)
a) Up to £86 Under £4,500 1 3 b) £87 - £125 £4,500 - £6,499 * 2 c) £126 - £144 £6,500 - £7,499 * * d) £145 - £182 £7,500 - £9,499 1 1 e £183 - £221 £9,500 - £11,499 2 2 f £222 - £259 £11,500 - £13,499 2 4 g £260 - £298 £13,500 - £15,499 2 3 h £299 - £336 £15,500 - £17,499 2 6 I £337 - £480 £17,500 - £24,999 6 12 j £481 - £576 £25,000 - £29,999 4 10 k £577 - £769 £30,000 - £39,999 13 10 l £770 - £961 £40,000 - £49,999 10 7
m £962 - £1,441 £50,000 - £74,999 15 7 n £1,442 - £1,922 £75,000 - £99,999 9 4 p £1,923 or over £100,000 + 14 4
AVERAGE INCOME £54,100 £17,300
MORI/14388DTA.RAC
Q19. How many penalty points, if any, do you have on your driving licence? If you have not had a motoring offence you will not have any points on your licence. SINGLE CODE
User Non-user % %
Base: All (501) (512) None 59 83 Three 24 11
Four 1 1 Five 2 0 Six 8 2
Seven * 0 Eight 4 0 Nine 1 1 Ten 0 0
Eleven * * Twelve 0 *
More than twelve (if so, please write in) * 0 Don`t know 1 1
Refused * 1 ANY POINTS 40 15
AVERAGE POINTS 4.5 3.9 Q20. Which of these best describes the area where you live most of the time? SINGLE CODE. User Non-user Base: All % % (501) (512) In the middle of the city or town 14 22 In a suburb 23 35 On the edge of the countryside 36 27 In the middle of the countryside 26 15 Don`t know 0 1
Q20. We may wish to recontact some people who have taken part in this survey to ask further questions. Would you be willing to be reinterviewed on a future MORI survey? SINGLE CODE. User Non-user Base: All % % (501) (512) Yes 85 77 No 15 23
THANK AND CLOSE
MORI/14388DTA.RAC
MORI House 79-81 Borough Road London SEI 1FY Tel: +44(0)20 7347 3000 Fax: +44(0)20 7347 3800 e mail: [email protected] Internet: www.mori.com MORI 32 old Queen Street London SWIH 9HP Tel: +44(0)20 7222 0232 Fax: +44(0)20 7222 1653 e mail: [email protected] Internet: www.morl.com MORI 18 Dublin Street Edinburgh EH1 3PP Tel: +44(0)13 1 558 1515 Fax: +44(0)131 558 1717 e mail: [email protected] Internet: www.morl.com Associates in Europe and North America and offices in London, Edinburgh, Sydney, Melbourne, Mexico City, Santiago, Sao Paulo, Buenos Aires, Lima, Montevideo, Caracas Istanbul, Bombay, New Delhi.