morningstar directsm presentation...
TRANSCRIPT

Morningstar® DirectSM Presentation Studio
© 2013 Morningstar, Inc. All rights reserved.
1
Presentation Studio is Morningstar Direct’s platform for creating custom presentations. With access to Morningstar Direct’s databases and flexible charting and reporting capabilities, Presentation Studio helps you better communicate the data behind your investment recommendations. You have control over both the content and format of your presentations, enabling you to tell your story using professionally designed data tables and charts. Outline Landing Page Create a Factsheet Customize Chart and Table Components Create a Custom Workbook Apply Logos, Images, and Text Landing Page 1. Go to the Presentation Studio folder to activate the landing page. At the bottom of the page, in the Morningstar Templates tab, you can select from various workbook and factsheet templates to jump start your report building process. In the My Templates tab, you can retrieve your own templates. In the Reports tab, you can open any previously saved reports to start your process.

Morningstar® DirectSM Presentation Studio
© 2013 Morningstar, Inc. All rights reserved.
2
2. At any point, you can click Launch Chart to create the chart.
3. Go to the action bar at the top of your screen where you can select a New Workbook, New Factsheet, or New Chart to build a presentation from scratch. Click on Global Settings to set your default settings for new reports.

Morningstar® DirectSM Presentation Studio
© 2013 Morningstar, Inc. All rights reserved.
3
4. The Application Settings window appears. Use the Data tab to create your default benchmarks, return series, and time periods.
5. Use the Attribution tab to set up your Equity Attribution default settings such as time period, security classification and investment process.

Morningstar® DirectSM Presentation Studio
© 2013 Morningstar, Inc. All rights reserved.
4
6. Use the Layout tab to set up your default Font, Colors, Component Title Settings, and more.
7. Use the Peer Group tab to set your default color scheme for the floating bar charts. Here, you can also set the Peer Group Range.

Morningstar® DirectSM Presentation Studio
© 2013 Morningstar, Inc. All rights reserved.
5
8. Use the Display tab to set your color and marker designations for investments, benchmarks, and category averages.
9. You can also customize your colors by inputting the specific RGB value.

Morningstar® DirectSM Presentation Studio
© 2013 Morningstar, Inc. All rights reserved.
6
10. Use the Grouping tab to create default groupings for applicable tables and charts.
11. Use the Index Group tab to create default indexes for tables and charts in Report Portal (add-on feature).

Morningstar® DirectSM Presentation Studio
© 2013 Morningstar, Inc. All rights reserved.
7
Create a Factsheet 1. Morningstar Factsheet templates are designed for one investment compared to one/two benchmarks and the Morningstar Category Average. Go to the Morningstar Template tab and double click Equity Manager Factsheet 1.
2. In the Investment Settings window, click the magnifying glass to select an investment.

Morningstar® DirectSM Presentation Studio
© 2013 Morningstar, Inc. All rights reserved.
8
3. In the Find Investment window, locate Fidelity Contrafund and click OK.
4. You can use the drop down to alter the benchmark or the magnifying glass to search for specific index. Use the drop down and select Analyst Assigned Benchmark.

Morningstar® DirectSM Presentation Studio
© 2013 Morningstar, Inc. All rights reserved.
9
5. The Category Average will automatically populate based on the chosen investment. Check the Show box to include the Category Average in your factsheet. When complete, click OK to generate the factsheet.
6. You have successfully generated the factsheet using a Morningstar Template. Click on the star icon at the top left corner and select Save As to save the report. It will be stored in the Reports folder in the landing page. Notice that you can also save a report as your own template by selecting Save as Template.

Morningstar® DirectSM Presentation Studio
© 2013 Morningstar, Inc. All rights reserved.
10
7. You can also save your factsheet as a PDF, PowerPoint, or XPS.
Customize Chart and Table Components 1. Once you have created a factsheet, it is very easy to customize any of the charts and tables. For this example, zoom in to 125% to focus on specific chart or table in the factsheet.

Morningstar® DirectSM Presentation Studio
© 2013 Morningstar, Inc. All rights reserved.
11
2. Notice the icons at the bottom of the screen. The blue icons represent charts and orange icons represent tables. As you roll over the icons, you will activate the chart and table previews. Drag the Stacked Bar Chart into the existing chart or table view.
3. The light blue border signifies that the component is activated and settings can be customized. Since the component selected is a chart, the Chart tab at the top of your screen is automatically activated. At any point, you can customize settings such as start/end dates, font sizes, and more. Modify the Start Date and select 3 Years ago.

Morningstar® DirectSM Presentation Studio
© 2013 Morningstar, Inc. All rights reserved.
12
4. Next, click on Chart Settings at the bottom left corner to customize more advanced settings.
5. You will be taken to the Chart Settings window. Click the Data Set drop down to select another choice to override the default. For example, select Equity Sectors (GICS).

Morningstar® DirectSM Presentation Studio
© 2013 Morningstar, Inc. All rights reserved.
13
6. The GICS sectors have now replaced the previous Asset Allocation data.
7. Within chart settings, you can also alter the display name or change the colors. Note that these changes only apply to the selected component.

Morningstar® DirectSM Presentation Studio
© 2013 Morningstar, Inc. All rights reserved.
14
8. In the above examples, we modified the chart by using the Chart Tab at the top and the Chart Settings at the bottom. To modify additional settings, do a right click to activate the many choices for further customization.
Create a Custom Workbook 1. In the previous example, we generated a factsheet using a Morningstar Template. In this example, we will create a new workbook from scratch and explore additional features of Presentation Studio. Go to the landing page, and click New Workbook.

Morningstar® DirectSM Presentation Studio
© 2013 Morningstar, Inc. All rights reserved.
15
2. In the, you can create a New Workbook, select from the Morningstar Template choices, or select a template that you have already created. For this example, select New Blank Workbook and click OK.
3. In the Investments: Settings window, you can either add specific investments to your report by clicking on the +Add button or select from an existing investment list. Go to Saved Lists and retrieve one of your existing investment lists.

Morningstar® DirectSM Presentation Studio
© 2013 Morningstar, Inc. All rights reserved.
16
4. Once your investment list is chosen, the screen will populate the names of your investments. Notice that the first five names are checked but you can select up to 50 investments to display in your report. If you would like to change the order of the investments, click and drag the investment into its place.
5. In the same view, scroll to the right where you can customize display names, colors, and markers. Once you have customized your settings, click OK.
Morningstar® DirectSM Presentation Studio
© 2013 Morningstar, Inc. All rights reserved.
17
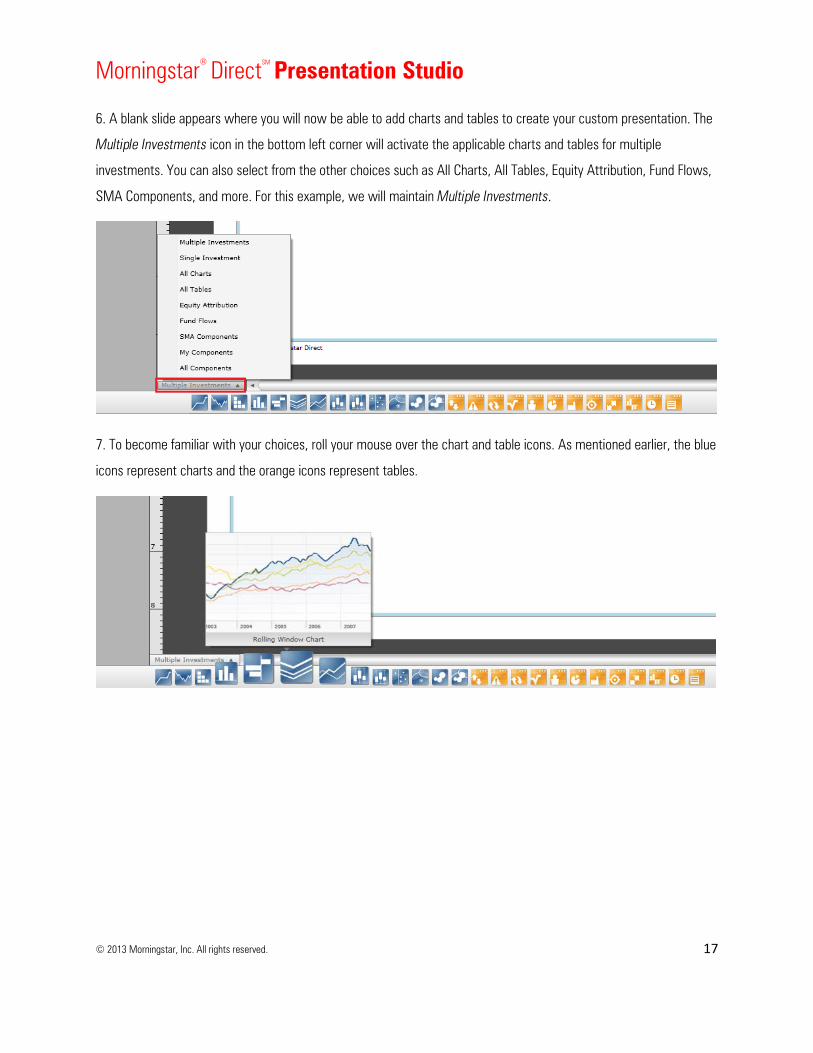
6. A blank slide appears where you will now be able to add charts and tables to create your custom presentation. The Multiple Investments icon in the bottom left corner will activate the applicable charts and tables for multiple investments. You can also select from the other choices such as All Charts, All Tables, Equity Attribution, Fund Flows, SMA Components, and more. For this example, we will maintain Multiple Investments.
7. To become familiar with your choices, roll your mouse over the chart and table icons. As mentioned earlier, the blue icons represent charts and the orange icons represent tables.

Morningstar® DirectSM Presentation Studio
© 2013 Morningstar, Inc. All rights reserved.
18
8. You can also click on Chart, at the top, to preview the various types of charts available. As you create your charts, tables, text, you can save these components under My Components and apply to future presentations.
9. Let’s begin creating a custom workbook. Drag and drop any chart or table components onto the page. For example, drag and drop the Holdings-Based Style Map onto the blank slide.

Morningstar® DirectSM Presentation Studio
© 2013 Morningstar, Inc. All rights reserved.
19
10. Go to Chart Settings to select the Portfolio Date from the drop down.
11. Go to Detailed Holdings to display the holdings in the chart(s).

Morningstar® DirectSM Presentation Studio
© 2013 Morningstar, Inc. All rights reserved.
20
12. To split the page to add additional components, click on the Divide Page and select from the various page configurations. Select the Five Cell layout.
13. Let’s continue and add another chart to the page.
Morningstar® DirectSM Presentation Studio
© 2013 Morningstar, Inc. All rights reserved.
21
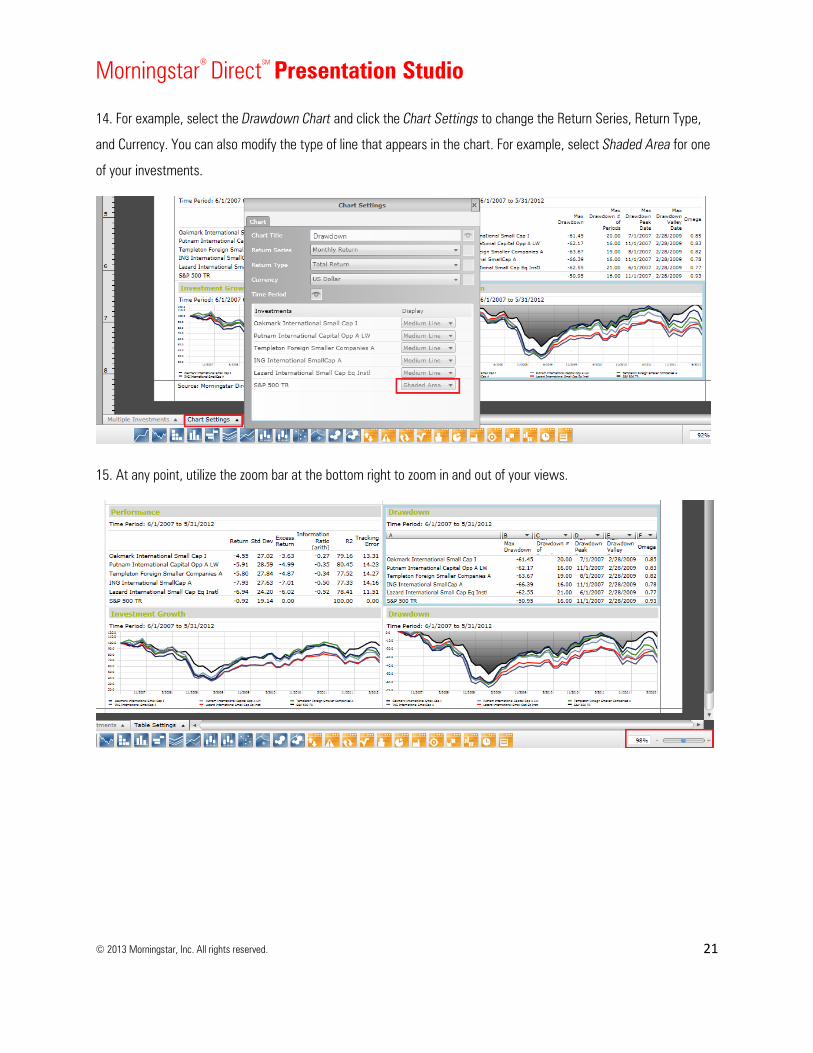
14. For example, select the Drawdown Chart and click the Chart Settings to change the Return Series, Return Type, and Currency. You can also modify the type of line that appears in the chart. For example, select Shaded Area for one of your investments.
15. At any point, utilize the zoom bar at the bottom right to zoom in and out of your views.

Morningstar® DirectSM Presentation Studio
© 2013 Morningstar, Inc. All rights reserved.
22
16. Let’s continue and select one of your tables (i.e. Performance) to activate the Data Table settings. Go to the column drop downs to select any custom calculation data point. For example, select Beta.
17. As we demonstrated in the chart component earlier, right click the table view to activate the many choices to customize your view further.

Morningstar® DirectSM Presentation Studio
© 2013 Morningstar, Inc. All rights reserved.
23
18. Let’s continue and demonstrate more examples as to customizing your views. For example, replace one of your components with the Rolling Window Chart. Proceed to select “Peer Group Rank (descending)” from the Display Mode drop down to display how the managers ranked in their category.
19. While customizing your workbook, you can always choose to hide or show specific investments. Go to Investments at the top left of your screen and uncheck or add investments. This change only applies to the chart you have highlighted.

Morningstar® DirectSM Presentation Studio
© 2013 Morningstar, Inc. All rights reserved.
24
20. To change the list of investments for all charts, tables and other components in your workbook, then simply go to Home, click on Investments, and then decide what investments you want to display. Once complete, click OK.
21. Once you have completed your workbook, you can save it as a report or template. Click on Save as Template to apply it to future reports.

Morningstar® DirectSM Presentation Studio
© 2013 Morningstar, Inc. All rights reserved.
25
22. You can also export your workbook at a PDF, PPT, or XPS.
Apply Logos, Images, and Text
1. In the previous sections, we covered customization of charts and tables. Now, let’s discuss how to apply headers, logos, and text. From your workbook, go to the Home tab, click on Page, and select New. A new slide will appear.
Morningstar® DirectSM Presentation Studio
© 2013 Morningstar, Inc. All rights reserved.
26
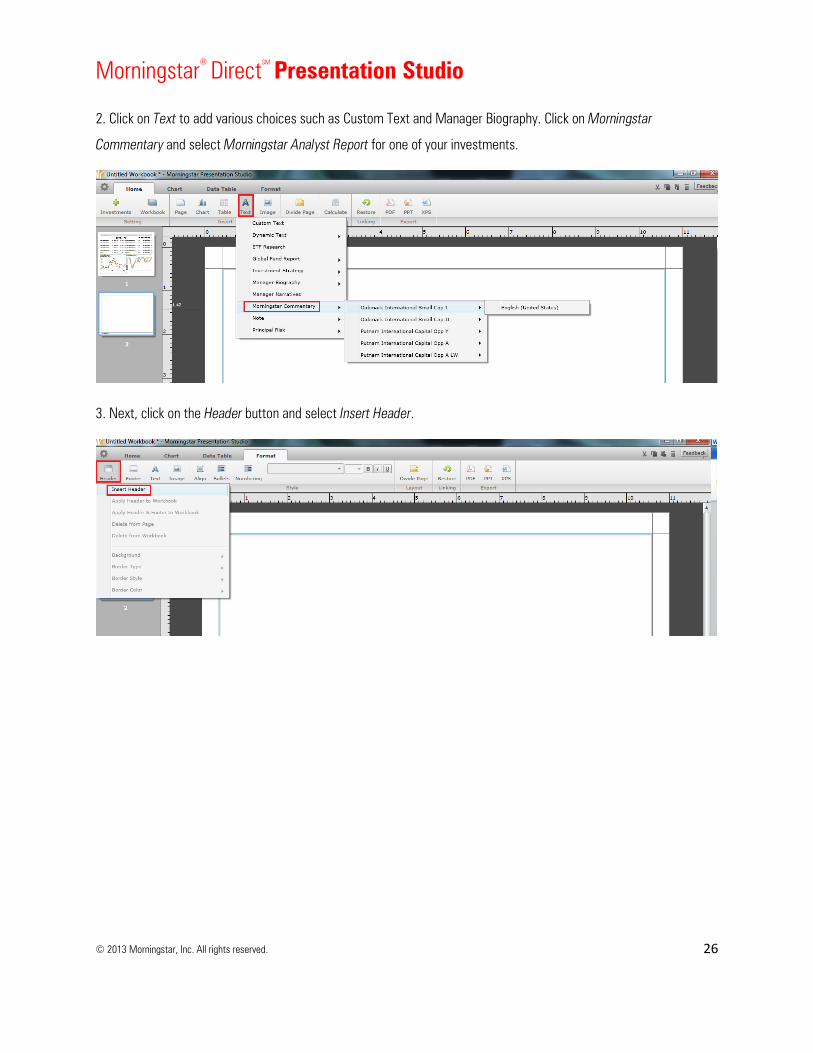
2. Click on Text to add various choices such as Custom Text and Manager Biography. Click on Morningstar Commentary and select Morningstar Analyst Report for one of your investments.
3. Next, click on the Header button and select Insert Header.

Morningstar® DirectSM Presentation Studio
© 2013 Morningstar, Inc. All rights reserved.
27
4. You can then add text or an image. For this example, click Image and select Insert Image. Browse for a header image.
5. Click on the header and select Apply Header to Workbook. The header will now be applied to every slide in the workbook.