morphine-induced locomotion and dopamine efflux in … · receptor antagonist atropine ... memphis...
TRANSCRIPT
Morphine-induced Locomotion and Dopamine Efflux in Mice: Role of M5 Muscarinic Receptors
and Cholinergic Inputs to the Ventral Tegmental Area
by
Stephan Steidl
A thesis submitted in conformity with the requirements for the degree of Doctor of Philosophy
Graduate Department of Psychology
University of Toronto
© Copyright by Stephan Steidl (2008)
iiAbstract
Morphine-induced Locomotion and Dopamine Efflux in Mice: Role of M5 Muscarinic Receptors
and Cholinergic Inputs to the Ventral Tegmental Area
Stephan Steidl
Doctor of Philosophy
Department of Psychology
University of Toronto, 2008
M5 muscarinic receptors are associated with dopamine neurons of the ventral tegmental area
(VTA) and substantia nigra, and provide an important excitatory input to the mesolimbic
dopamine system. Here, I studied locomotion induced by systemic morphine (3, 10, 30 mg/kg,
i.p.) in M5 knockout mice of the C57Bl/6 (B6) and CD1 x 129SvJ (129) background strains. M5
knockout mice of both strains showed reduced locomotion in response to 30 mg/kg morphine,
while only B6 M5 knockout mice showed reduced locomotion in response to 10 mg/kg
morphine. In B6 wild-type mice VTA pre-treatment with the non subtype-selective muscarinic
receptor antagonist atropine (3 μg per side), but not the non subtype-selective nicotinic receptor
antagonist mecamylamine (5 μg per side), reduced locomotion in response to 30 mg/kg (i.p.)
morphine to a similar extent as systemic M5 knockout, suggesting that the reduced morphine-
induced locomotion in M5 knockout mice was due to the loss of M5 receptors on VTA dopamine
neurons. By contrast, in M5 knockout mice, either intra-VTA atropine or mecamylamine alone
increased locomotion by almost 3 times relative to saline, and potentiated morphine-induced
locomotion. Therefore, in M5 knockout mice, more clearly than in wild-type mice, blockade of
either VTA muscarinic or nicotinic receptors activated locomotion.
Infusions of morphine (50 ng) into the VTA increased nucleus accumbens dopamine efflux in
urethane-anesthetized wild-type mice. Either M5 knockout or pre-treatment with VTA
scopolamine (50 ug) in wild-type mice blocked accumbal dopamine efflux in response to VTA
iiimorphine. Therefore, M5 receptors are critical for excitation of dopamine neurons by intra-VTA
morphine, suggesting that the reduced locomotion produced by systemic morphine in M5
knockout mice was, in part, due to loss of M5-mediated excitation of VTA dopamine neurons by
opiates. The locomotion data also show that in the absence of M5 receptors, cholinergic afferents
to mesolimbic dopamine neurons are inhibitory. This supports and extends the conclusions from
many studies that non-M5 muscarinic receptors inhibit, and M5 receptors excite, dopamine
neurons. Loss of M5-mediated excitation results in reduced acute effects of opiates.
ivAcknowledgements
I would first like to thank my advisor, Dr. John Yeomans, for all his support during my
Ph.D. years as well as the years I worked in his laboratory as an undergraduate student. His
boundless and unconditional enthusiasm for Science has been, and continues to be, a true source
of inspiration. I am also very grateful to Dr. Yeomans for his willingness to take a chance on me,
a middle of the road sort of student, when I first approached him about trying my hand at
research many years ago.
I thank my thesis committee members, Dr. Derek van der Kooy and Dr. Suzanne Erb, for
their many suggestions for improvements over the years that really helped make this dissertation
better. Both were sensitive to the time pressure I was under and very promptly commented on
my thesis, which made things much easier for me. I thank Dr. Paul Vezina for serving as the
external appraiser and making the trip from Chicago to be present at my defense, undoubtedly
one of the most significant days in my life thus far. Finally, I thank Dr. Paul Fletcher for also
reading the many pages of this thesis and serving as an examiner.
I am also indebted to Dr. Charles Blaha and Dr. Tony Miller at the University of
Memphis for teaching me Electrochemistry and allowing me to bring the technique back to
Toronto, and thus answer some the questions I was asking in this thesis.
I am fortunate to come from a very supportive family, both immediate and extended, and
for this I am, and always will be, very grateful. In particular I want to thank my mother and
father who never stopped supporting and believing in me, even during that long period of
“difficult years” that included most of my adolescent and early adult years. You taught me the
value of hard work and that it pays off in the end.
Above all, I want to thank my beautiful wife Ann, without whom I am not really sure
what I would do. You are everything to me, my partner, confidant and best friend. You stuck
with me unconditionally over my years in graduate school, both through the good and the

vfrequent bad times. No matter how down and frustrated I felt you always made me see the
brighter side of things and for this I thank you. You never stopped believing in my ability to
succeed and this, more than anything else in my life, allowed me to keep believing in myself.
Table of Contents
Abstract …………………………………………………… ii
Acknowledgements …………………………………………………… iv
Table of Contents …………………………………………………… vi
List of Figures …………………………………………………… xi
List of Tables ……………………………………………………. xvi
List of Abbreviations …………………………………………………… xvii
General Introduction …………………………………………………… 1
1. Overview …………………………………………………… 1
2. Drug-induced Locomotion …………………………………… 6
3. Dopamine …………………………………………………… 8
4. Afferent Control of the Mesencephalic Dopamine System …… 9
4.1. GABA ……………………………………………. 9
4.2. Glutamate ……………………………………………. 10
5. Acetylcholine …………………………………………….. 10
5.1. Anatomy of Cholinergic Systems …………………… 10
5.2. Cholinergic Receptors ………………………………. 17
6. PPT and LDT projections: Functional Considerations …………. 25
6.1. Ascending cholinergic control of mesencephalic dopamine
systems ……………………………………………. 25
6.2. Arousal ……………………………………………… 32
6.3. Superior Colliculus Activation ………………………. 32
7. Muscarinic Receptors and Reward ………………………………. 33
8. Opiate Reward and Dopamine ………………………………. 33
vii 8.1. Opiate-induced Locomotion in Rats …………………… 36
8.2. Opiate-induced Locomotion in Mice …………………. 43
9. Objectives of the current thesis ………………………………… 44
References …………………………………………………………. 46
General Methods for Chapter 1-4 Experiments ……………………………….. 72
Chapter 1: Morphine-induced locomotion is reduced in M5 receptor knockout
mice or by VTA atropine in wild-type mice …………………………………… 75
Introduction ….……………………………………………………… 76
Experiment 1: Morphine-induced locomotion in M5 muscarinic receptor
knockout mice ………………………………………………………… 77
Materials and Methods …………………………………………. 77
Results ………………………………………………………… 79
Experiment 2: Effects of naltrexone pre-treatment on morphine-induced
locomotion in B6 wild-type and M5 knockout mice …………………… 107
Introduction …………………………………………………… 107
Materials and Methods ………………………………………….. 107
Results ………………………………………………………….. 108
Chapter 1 Discussion ……………………………………………………. 115
Chapter 1 References …………………………………………………… 128
Chapter 2: Role of cholinergic input to the ventral tegmental area in systemic
morphine-induced locomotion ……………………………………………….. 134
Introduction ………………………………………………………….. 135
Materials and Methods ………………………………………………… 137
Results ………………………………………………………………….. 141
Histology ………………………………………………….. 141
viiiEffects of VTA pre-treatment with atropine in B6 wild-type and
M5 knockout mice …. …………………………………………... 141
Effects of VTA pre-treatment with mecamylamine in B6 wild-type
and M5 knockout mice …………….…………………………… 156
Effects of combined VTA pre-treatment with atropine and
mecamylamine in M5 knockout mice …………………………… 165
Chapter 2 Discussion ……………………………………………………. 171
Chapter 2 References ……………………………………………………. 192
Chapter 3: Electrochemical measurement of dopamine in M5 knockout mice ….. 197
Introduction …………………………………………………………….. 198
Experiment 4: Striatal dopamine efflux in response to electrical stimulation
of the pedunculopontine tegmental nucleus is M5 knockout mice …….. 200
Materials and Methods ………………………………………… 200
Results …………………………………………………………. 204
Discussion ……………………………………………………… 216
Experiment 5: Accumbal dopamine efflux in response to intra-VTA
morphine in M5 knockout mice ……………………………………… 223
Materials and Methods ……………………………………… 223
Results ………………………………………………………. 224
Discussion …………………………………………………… 237
Chapter 3 References ………………………………………………… 245
Chapter 4: Morphine conditioned-place preference in M5 knockout mice …… 251
Introduction …………………………………………………………… 252
Experiment 6: Morphine Conditioned Place Perference in 129 and B6
Wild-type and M5 knockout mice ……………………………………. 255
ixMaterials and Methods ………………………………………….. 255
Results ………………………………………………………….. 257
Discussion ………………………………………………………. 271
Chapter 4 References ……………………………………………………. 280
General Discussion ……………………………………………………………. 283
Summary of Chapter 1-4 Findings ……………………………………. 284
Implications of Current Findings …………………………………….. 285
Morphine-induced Locomotion and Dopamine Dependence ……………. 286
VTA morphine may affect accumbens dopamine efflux via a cholinergic
feedback loop involving the PPT and M5 muscarinic receptors …………. 289
The absence of VTA M5 receptors may affect the excitability of dopamine
neurons ………………………………………………………………….. 293
M5 and Reward …………………………………………………….. 295
Conclusions and Future Directions ………………………………………. 295
References ……………………………………………………………….. 299
Appendix A: In vivo measurement of dopamine ………………………………… 306
1. In vivo Microdialysis ………………………………………………….. 307
1.1. Advantages of Microdialysis ……………………………….. 308
1.2. Limitations of Microdialysis ………………………………... 309
2. In vivo Electrochemistry ………………………………………………. 310
2.1. Basic Principles of in vivo Electrochemistry ………………… 313
2.2. Types of Electrodes ………………………………………….. 314
2.3. Selectivity for Dopamine …………………………………….. 317
3. Electrochemistry Methods ………………………………………………. 318
3.1. Voltammetry ………………………………………………….. 319

x 3.2. Amperometry …………………………………………………. 320
Appendix A References …………………………………………………… 323
xiList of Figures
General Introduction
Figure 1: The central projections of cholinergic cells …………………. 14
Figure 2: Localization of muscarinic receptor sub-types in the
mesopontine tegmental nuclei, the midbrain tegmentum, and the
striatum/accumbens …………………………………………………… 21
Figure 3: Nucleus accumbens dopamine efflux measured by
chronoamperometry in rats and mice after electrical stimulation
of the LDT ……….…………………………………………………… 28
Figure 4: Pharmacological dissociation of three phases of nucleus
accumbens or striatum dopamine efflux following electrical stimulation of
the laterodorsal tegmental nucleus or pedunculopontine tegmental
nucleus ……………...……………………………………………. 30
Figure 5: Dopamine-dependent and dopamine-independent pathways
involved in opiate –reward ……………………………………………… 38
Chapter 1:
Figure 1.1.: Spontaneous exploration in B6 and 129 wild-type mice …… 82
Figure 1.2.: Spontaneous exploration in 129 and B6 wild-type and M5
knockout mice …………….………………………………………………. 83
Figure 1.3.: Saline-induced locomotion in 129 and B6 wild-type and M5
knockout mice …………….………………………………………………. 86
Figure 1.4.: Total morphine-induced locomotion across two hours
following three doses (3, 10, and 30 mg/kg, i.p.) of morphine in 129
and B6 wild-type and M5 knockout mice ………………………………..... 88
Figure 1.5.: Dose response curves for 3, 10, and 30 mg/kg (i.p.)
xiimorphine-induced locomotion in 129 and B6 wild-type mice …………….. 91
Figure 1.6.: Locomotion time course in 5-min time bins in 129 and B6
wild-type mice following saline or 3, 10, or 30 mg/kg (i.p.) morphine …. 94
Figure 1.7.: 30 mg/kg (i.p) morphine-induced locomotion in 129 and
B6 wild-type and M5 knockout mice …………………………………….. 97
Figure 1.8.: 10 mg/kg (i.p) morphine-induced locomotion in 129 and
B6 wild-type and M5 knockout mice …………………………………….. 101
Figure 1.9.: 3 mg/kg (i.p) morphine-induced locomotion in 129 and
B6 wild-type and M5 knockout mice …………………………………….. 104
Figure 1.10.: Peak locomotion in 129 and B6 wild-type and M5
knockout mice ……………………………………………………………. 106
Figure 1.11.: Effects of naltrexone pre-treatment (1 or 10 mg/kg, i.p.) on
30 mg/kg (i.p.) total morphine-induced locomotion over two hours in
B6 wild-type and M5 knockout mice …………..………………………….. 110
Figure 1.12. Time course of 30 mg/kg (i.p.) morphine-induced locomotion
following pre-treatment with 1 mg/kg (i.p.) or 10 mg/kg (i.p.) naltrexone
in B6 wild-type and B6 M5 knockout mice ………………………………. 114
Chapter 2:
Figure 2.1.: VTA injection sites in B6 wild-type and M5 knockout mice
used in Experiments 3-5 ………………………………………………… 143
Figure 2.2.: Total locomotion following 3 μg bilateral VTA atropine or
0.3 μl VTA saline prior to systemic morphine (30 mg/kg, i.p.) or
saline in B6 mice and B6 M5 knockout mice ……………………………. 146
Figure 2.3.: Time course of locomotion following 3 μg bilateral VTA
atropine or VTA saline prior to systemic morphine (30 mg/kg, i.p.)
xiiior saline in B6 and M5 knockout mice …………………………………… 150
Figure 2.4.: Effects of 3μg bilateral atropine in B6 mice that had
cannulae placements dorsal to the VTA ………..………………………… 152
Figure 2.5.: Effects of VTA treatment with 3 μg bilateral atropine in B6
and M5 knockout mice ……………………………………………………. 155
Figure 2.6.: Total locomotion following 5 μg bilateral VTA mecamylamine
or VTA saline with systemic morphine (30 mg/kg, i.p.) and/or saline in
B6 mice and M5 knockout mice ………………………………….………. 158
Figure 2.7.: Time course of morphine-induced (30 mg/kg, i.p.)
locomotion in B6 and M5 knockout mice following 5 μg mecamylamine
bilateral VTA treatment with or saline …….…………………………… 161
Figure 2.8.: Effects of VTA treatment with 5 μg bilateral mecamylamine
in B6 and M5 knockout mice …………………………………………… 164
Figure 2.9. Total locomotion following bilateral VTA saline, atropine
(3 μg), mecamylamine (5 μg), or combined atropine (3 μg) and
mecamylamine (5 μg) treatment in M5 knockout mice ………………… 167
Figure 2.10. Locomotion time course following bilateral VTA saline,
atropine (3 μg), mecamylamine (5 μg), or combined atropine (3 μg)
and mecamylamine (5 μg) treatment in M5 knockout mice …………….. 170
Figure 2.11.: A comparison of 30 mg/kg (i.p.) morphine-induced
locomotion in B6 M5 knockout and B6 wild-type mice following 3 μg
bilateral VTA pre-treatment with atropine ……………………………… 175
Figure 2.12. Stimulant effects of VTA atropine in B6 M5 knockout
mice ……………………………………………………………………… 182
xivFigure 2.13. Stimulant effects of VTA mecamylamine in B6 M5 knockout
mice ……………………………………………………………………… 186
Chapter 3:
Figure 3.1.: Representative examples of an in-vitro calibration and in-vivo
test of a stearate-modified carbon paste electrode ……………………… 206
Figure 3.2.: Sagittal sections of the mouse brain showing placements of
PPT stimulating electrodes in 129 wild-type and M5 knockout mice …… 209
Figure 3.3.: Coronal sections of the mouse brain showing placements of
striatal recording electrodes in 129 wild-type and M5 knockout mice …… 211
Figure 3.4.: Striatal dopamine efflux following electrical stimulation of the
PPT in wild-type and M5 knockout mice ………………………………… 214
Figure 3.5.: M5 receptor contribution to PPT-evoked striatal dopamine efflux
in 129 mice ……………………………………………………………… 219
Figure 3.6.: VTA injection sites (A) and corresponding nucleus accumbens
recording sites (B)use in Experiment 7 ..…………………………………. 227
Figure 3.7.: Changes in nucleus accumbens dopamine efflux produced by 50 ng
intra-VTA morphine in 129 wild-type mice………………………………. 230
Figure 3.8. Effects of pre-treatment with naltrexone (1 mg/kg, i.p.) 5 min prior
to 50 ng intra-VTA morphine in 129 wild-type mice …………………….. 233
Figure 3.9. Effects of pre-treatment with 50 μg intra-VTA scopolamine on
accumbal dopamine efflux produced by 50 ng intra-VTA morphine
in 129 wild-type mice …………………………………………………… 236
Chapter 4:
Figure 4.1.: Morphine conditioned place preference in B6 wild-type
and M5 knockout mice at 1, 3, and 10 mg/kg (i.p.) morphine using
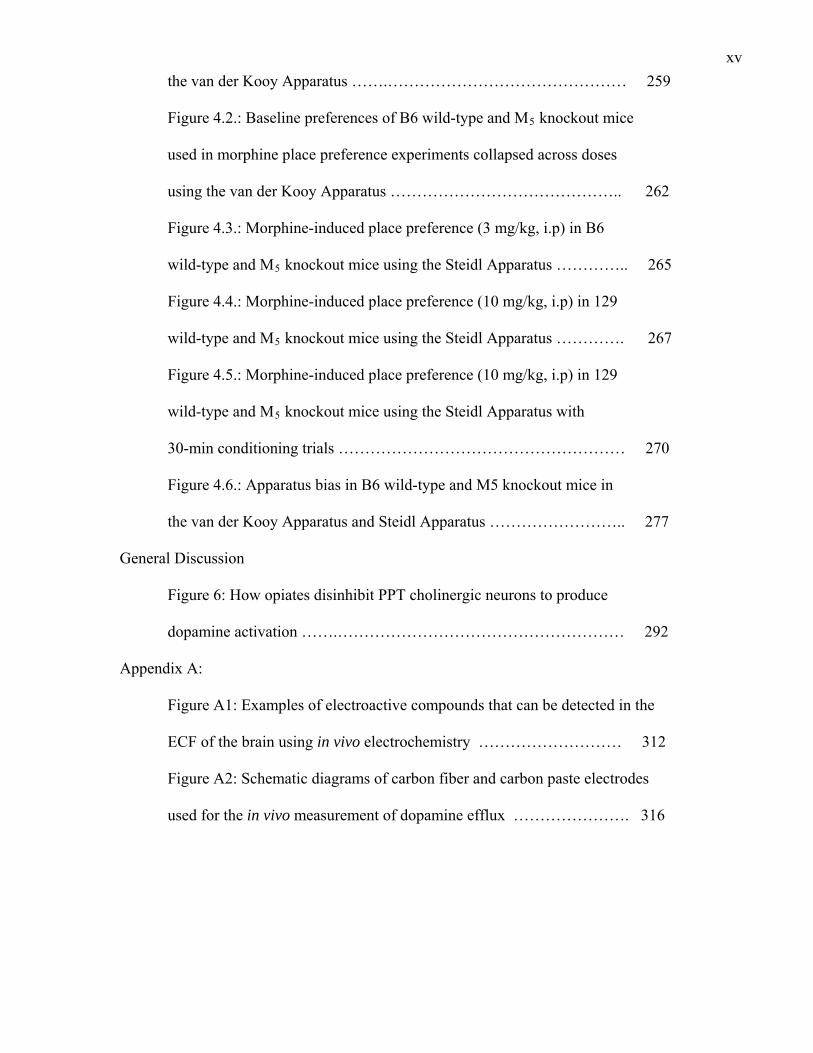
xvthe van der Kooy Apparatus …….……………………………………… 259
Figure 4.2.: Baseline preferences of B6 wild-type and M5 knockout mice
used in morphine place preference experiments collapsed across doses
using the van der Kooy Apparatus …………………………………….. 262
Figure 4.3.: Morphine-induced place preference (3 mg/kg, i.p) in B6
wild-type and M5 knockout mice using the Steidl Apparatus ………….. 265
Figure 4.4.: Morphine-induced place preference (10 mg/kg, i.p) in 129
wild-type and M5 knockout mice using the Steidl Apparatus …………. 267
Figure 4.5.: Morphine-induced place preference (10 mg/kg, i.p) in 129
wild-type and M5 knockout mice using the Steidl Apparatus with
30-min conditioning trials ……………………………………………… 270
Figure 4.6.: Apparatus bias in B6 wild-type and M5 knockout mice in
the van der Kooy Apparatus and Steidl Apparatus …………………….. 277
General Discussion
Figure 6: How opiates disinhibit PPT cholinergic neurons to produce
dopamine activation …….……………………………………………… 292
Appendix A:
Figure A1: Examples of electroactive compounds that can be detected in the
ECF of the brain using in vivo electrochemistry ……………………… 312
Figure A2: Schematic diagrams of carbon fiber and carbon paste electrodes
used for the in vivo measurement of dopamine efflux …………………. 316
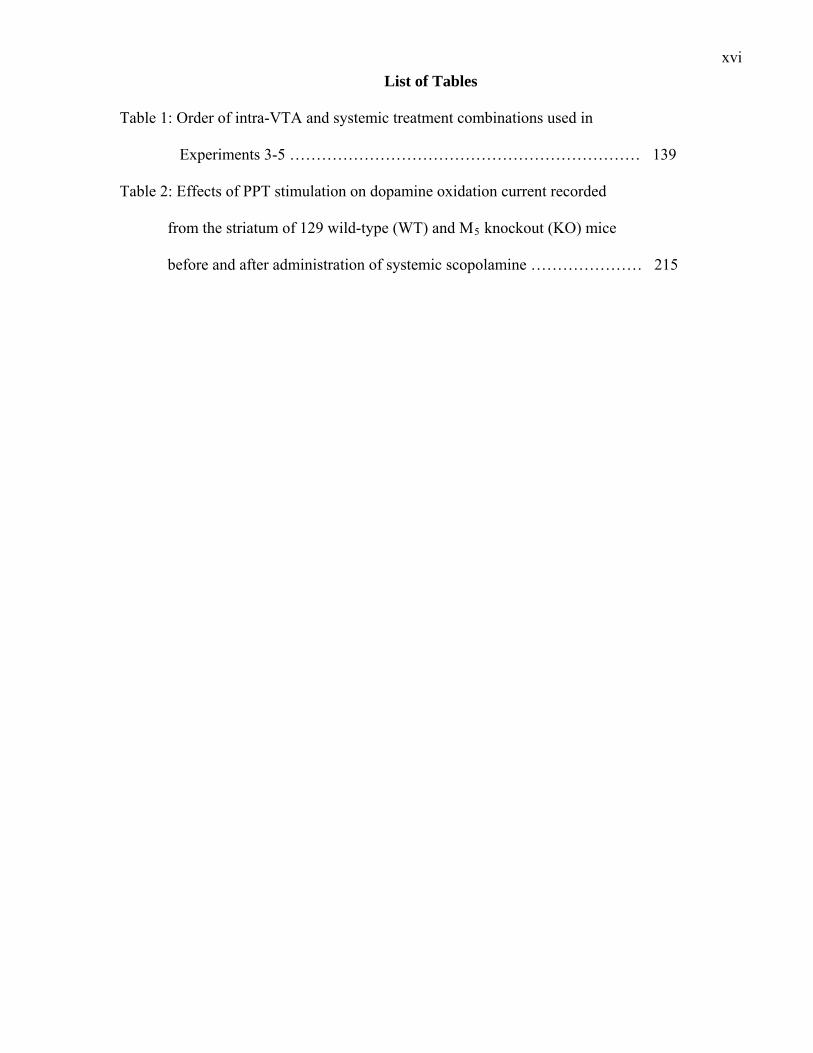
xviList of Tables
Table 1: Order of intra-VTA and systemic treatment combinations used in
Experiments 3-5 ………………………………………………………… 139
Table 2: Effects of PPT stimulation on dopamine oxidation current recorded
from the striatum of 129 wild-type (WT) and M5 knockout (KO) mice
before and after administration of systemic scopolamine ………………… 215
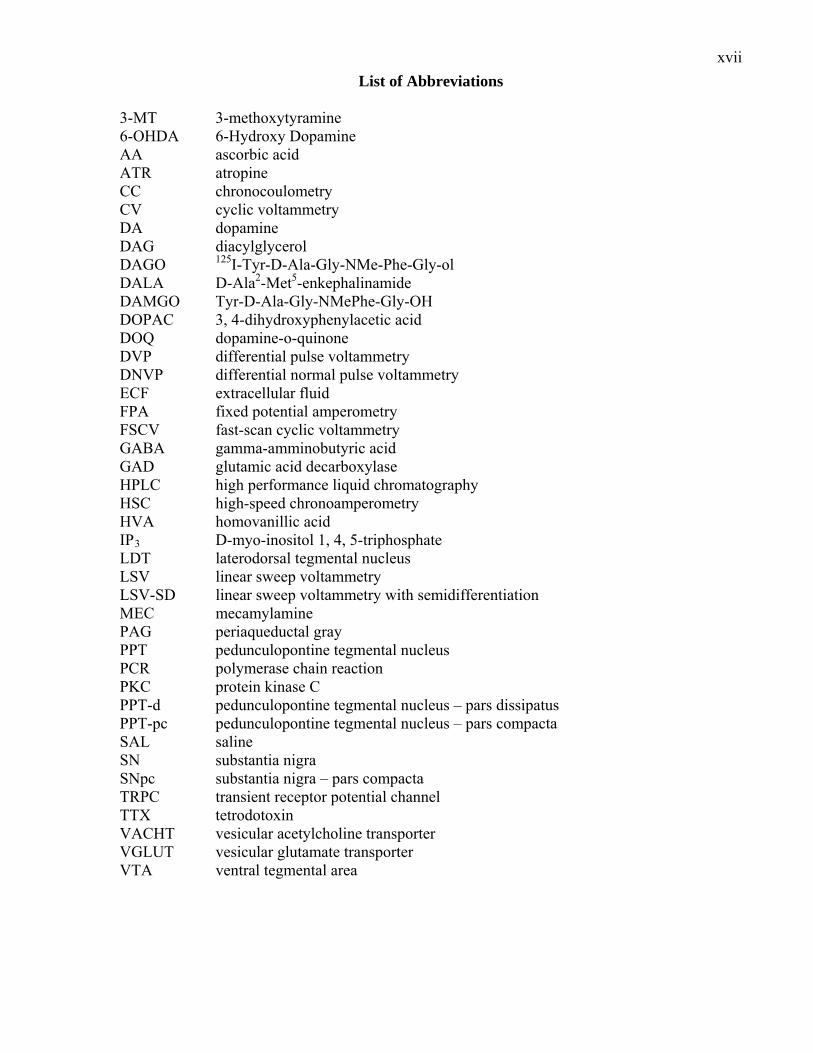
xviiList of Abbreviations
3-MT 3-methoxytyramine 6-OHDA 6-Hydroxy Dopamine AA ascorbic acid ATR atropine CC chronocoulometry CV cyclic voltammetry DA dopamine DAG diacylglycerol DAGO 125I-Tyr-D-Ala-Gly-NMe-Phe-Gly-ol DALA D-Ala2-Met5-enkephalinamide DAMGO Tyr-D-Ala-Gly-NMePhe-Gly-OH DOPAC 3, 4-dihydroxyphenylacetic acid DOQ dopamine-o-quinone DVP differential pulse voltammetry DNVP differential normal pulse voltammetry ECF extracellular fluid FPA fixed potential amperometry FSCV fast-scan cyclic voltammetry GABA gamma-amminobutyric acid GAD glutamic acid decarboxylase HPLC high performance liquid chromatography HSC high-speed chronoamperometry HVA homovanillic acid IP3 D-myo-inositol 1, 4, 5-triphosphate LDT laterodorsal tegmental nucleus LSV linear sweep voltammetry LSV-SD linear sweep voltammetry with semidifferentiation MEC mecamylamine PAG periaqueductal gray PPT pedunculopontine tegmental nucleus PCR polymerase chain reaction PKC protein kinase C PPT-d pedunculopontine tegmental nucleus – pars dissipatus PPT-pc pedunculopontine tegmental nucleus – pars compacta SAL saline SN substantia nigra SNpc substantia nigra – pars compacta TRPC transient receptor potential channel TTX tetrodotoxin VACHT vesicular acetylcholine transporter VGLUT vesicular glutamate transporter VTA ventral tegmental area
1General Introduction
1. Overview
Opiates, like morphine and heroin, comprise a class of drugs known as narcotic
analgesics, and are defined by their common pharmacological action on opiate receptors. Opiates
produce many psychological, behavioral, and physiological effects, but their principle action is
pain reduction.
Although opiates serve as powerful analgesics they are also highly addictive, and this
may be the most detrimental effect associated with long-term use. Here, the drug becomes the
users’ primary objective in life, with the affected individuals spending most of their time and
energy on obtaining and using the drug. This leads to devastating disruptions in the workplace,
family, and schools. The high demand for illegally supplied opiates leads to crime and violence,
both from addicts seeking to procure more of an expensive drug, and criminal organizations
battling to dominate supply. Together, these have impacts on society that cost billions of dollars
every year.
Opiates produce two notable acute psychological effects, analgesia and euphoria.
Although very effective as pain killers, continued use of opiates is undesirable due to the rapid
development of tolerance. The euphoria produced by opiates is a powerful reinforcer of drug-
taking behavior, and is intimately linked to the development of addiction. Thus, an understanding
of the brain mechanisms through which opiates produce their acute effects is critical.
Opiate Receptors
Several major breakthroughs occurred during the 1970s, including the discovery of opiate
receptors in brain tissue in 1973 (Pert & Snyder, 1973), and the discovery of endorphins (Hughes
et al., 1975), endogenous peptides that act as ligands for opioid receptors. To date four subtypes
of opioid receptors have been isolated and their genes cloned. These include the μ (mu), κ
(kappa), δ (delta), and, more recently, nociceptin/orphanin FQ receptor. (Evans, Keith, Morrison,
2Magdenzo, & Edwards 1992; Meunier et al., 1995; Pert & Snyder, 1973; Yasuda et al., 1993).
These receptors can be activated either by endorphins (e.g. enkephalins in the case of δ,
dynorphins in the case of κ, and endomorphins in the case of μ), or by exogenously administered
opiate drugs, such as morphine and heroin. Generally, agonists selective for μ and δ receptors are
rewarding, while those selective for the κ receptor induce dysphoria (Bals-Kubik, Herz, &
Shippenberg, 1989; Bals-Kubik, Shippenberg, & Herz, 1990).
The μ, and to a lesser extent the δ and κ, receptors are widely spread throughout the brain
(Mansour, Khachaturian, Lewis, Akil, & Watson, 1987; Mansour et al., 1994; Mansour, Fox,
Akil, & Watson, 1995). The μ receptor is of particular functional relevance in that many of the
behavioral consequences of opiates, including analgesia, hyperlocomotion, respiratory
depression and constipation, are eliminated in μ receptor knockout mice (Matthes et al., 1996;
Sora et al., 1997; Loh et al., 1998). The widespread distribution of receptors also means that
opioids can affect the brain in many different places. This is well illustrated in the study of
opioid analgesia, which can be produced at multiple levels, including the spinal cord, midbrain
periaqueductal gray (PAG) descending pain modulating systems (Fields, 1993), as well as the
forebrain (Khachaturian, Schaefer, & Lewis, 1993).
Dopamine, Opiates and Reward
The discovery of endogenous opioid receptors paved the way for studying the site of
opiate reward in the brain starting in the 1980s. During this time, the predominant view was that
the rewarding effects of natural reinforcers (e.g. food, water, and sex) and drugs of abuse are due
to their ability to increase the activity of the mesolimbic dopamine system (Wise, 1982). Opioid
receptors in the ventral tegmental area (VTA) were shown to be particularly important, as intra-
VTA morphine produced conditioned place preference in rats (Bals-Kubik, Ableitner, Herz, &
Shippenberg, 1993; Nader & van der Kooy, 1997; Olmstead & Franklin, 1997; Phillips &
3LePiane, 1980) and supported self-administration (Bozarth & Wise, 1981; David & Cazala,
1994). However, opiates could also produce rewarding effects in other brain areas, notably the
nucleus accumbens, where opiates supported self-administration through their action on opioid
receptors independent of dopamine (Goeders, Lane, & Smith, 1984; Olds, 1982). On the other
hand, place preference data suggested that opiates in the nucleus accumbens were not rewarding
(Bals-Kubik et al., 1993; Olmstead & Franklin, 1997; Schildein, Agmo, Huston, Schwarting,
1998; Zangen, Ikemoto, Zadina, & Wise, 2002).
Early studies used mainly the conditioned place preference paradigm to measure the
rewarding properties of opiates (van der Kooy, Mucha, O’Shaughnessy, & Bucenieks, 1982). In
this paradigm morphine (the primary reinforcer) is repeatedly paired with a particular
environmental context. The contextual stimuli acquire secondary reinforcing properties and
when the animal is subsequently exposed to the contextual stimuli in a drug-free state, they elicit
approach responses. When this occurs the animal has, by definition, acquired a conditioned place
preference (see Chapter 4 for a more detailed discussion). Place preference for VTA morphine
infusion could be blocked by systemic dopamine antagonists (Bozarth & Wise, 1981). With
systemic injections of morphine (Acquas & Di Chiara, 1994; Leone & Di Chiara, 1987) or
heroin (Spyraki, Fibiger, & Philips, 1983), which can affect many brain areas simultaneously,
place preference was also blocked by systemic dopamine antagonists, indicating a dependence
on dopamine neurotransmission. More recently however, systemic morphine place preference
has been demonstrated despite pre-treatment with systemic (Bechara, Harrington, Nader, & van
der Kooy, 1992; Nader & van der Kooy, 1997) or nucleus accumbens (Laviolette, Nader, & van
der Kooy, 2002) dopamine antagonists. Furthermore kainic acid lesions of the entire ventral
striatal area attenuated, but did not block, systemic morphine place preference (Olmstead &
Franklin, 1996).
4One factor that distinguishes early studies that showed a dependence of morphine CPP on
dopamine from those of Bechara and colleagues is side preferences associated with CPP
apparatus (see Chapter 4 for a detailed discussion). For example, in the study by Leone and Di
Chiara (1987) baseline preferences for the two chambers of the CPP apparatus were not equal.
Their conditioning procedure involved pairing of morphine with the initially less preferred side,
so that morphine may have alleviated the initial aversion to the drug-paired side, rather than
inducing a preference for the drug-paired side. When baseline preferences are found, it is
difficult to determine whether dopamine blockade interfered with opiate place preference or
attenuated aversion to the non-preferred environment. By contrast, Bechara and colleagues
established equal side preferences in pre-testing, and in their case dopamine antagonists did not
affect morphine CPP.
Dopamine neurotransmission is not necessary for opiate self-administration either, as pre-
treatment with systemic dopamine antagonist (Ettenberg, Pettit, Bloom & Koob, 1982) or
destruction of nucleus accumbens dopamine terminals (Pettit, Ettenberg, Bloom, & Koob, 1984)
did not affect heroin self-administration, but did affect cocaine self-administration.
Thus, the relationship between the rewarding effects of opiates and dopamine is complex
and remains controversial.
Cholinergic Effects on Dopamine and Opiate Reward
Cholinergic neurons of the pedunculopontine tegmental nuclei (PPT) and laterodorsal
tegmental nuclei (LDT) provide a major source of afferent input to the VTA (Oakman, Farris,
Kerr, Cozzari, & Hartman, 1995; Omelchenko & Sesack, 2006). In rats, accumbal and striatal
increases in dopamine produced by systemic morphine critically depend on the PPT (Miller,
Forster, Metcalf, & Blaha, 2002) and the LDT (Foster, Falcon, Miller, Heruc, & Blaha 2002),
and on muscarinic receptors in the VTA and substantia nigra (SN) (Miller, Forster, Yeomans, &
5Blaha, 2005). Thus, it appears that cholinergic mechanisms also contribute to opiate-induced
dopamine activation.
The PPT is also critical for the rewarding effects of opiates in drug-naïve animals, as
lesions of the PPT block morphine place preference (Bechara et al., 1992). By contrast, in drug
dependent/withdrawn animals, opiate reward is dopamine, but not PPT, dependent (Bechara et
al., 1992; Dockstader, Rubinstein, Grandy, Low, & van der Kooy, 2001; Laviolette et al., 2002;
Nader & van der Kooy, 1997).
The pathways through which the PPT mediates the acute rewarding effects of opiates and
dopamine activation (i.e. via descending or ascending projections) are not clear, but cholinergic
mechanisms are important. For example the cholinergic antagonists atropine and mecamylamine
in the VTA dose-dependently reduced morphine place preference in drug-naïve rats (Rezayof,
Nazari-Serenjeh, Zarrindast, Sepehri, & Delphi, 2007). In drug-naïve rats, the acute rewarding
effects of morphine do not, however, depend on dopamine (Nader & van der Kooy, 1997).
Together, the data suggest that ascending cholinergic inputs from the PPT to the VTA and SN
are important in mediating dopamine activation, and contribute to, but are not necessary for, the
rewarding effects of opiates.
My dissertation is designed to understand the role of muscarinic acetylcholine receptors
in the VTA on opiate-induced locomotion and dopamine activation in mice. Basile and
colleagues (2002) previously demonstrated that drug-naïve M5 muscarinic receptor knockout
mice showed strongly reduced morphine place preference. In the VTA, M5 muscarinic receptors
are associated with (Vilaro, Palacios, & Mengod, 1990; Weiner, Levey, & Brann, 1990), and
excite dopamine neurons (Forster et al., 2001), so are hypothesized to also be involved in
mediating cholinergic inputs important for the effects of opiates on dopamine.
62. Drug-induced locomotion
In a rat or a mouse, acute administration of a low dose of a stimulant drug (e.g. cocaine
and amphetamine) induces behavioral activation upon first exposure. Stimulant drugs generally
increase locomotion in rodents at short latencies (3-10 min). At higher doses of stimulants
animals show stereotypy, characterized by more narrowly focused, repetitive movements (e.g.
head bobbing, circling, sniffing, and licking in rats). Essentially, stereotypy consists of
movements that are part of the animals’ normal behavioral repertoire, but occur at frequencies
that are not normal. When drug-induced stereotypy dominates the animal’s behaviour, there is a
concurrent decrease in forward locomotion, as the two are not compatible.
In the case of opiates, however, locomotion in rats has been reported as bi-phasic
(Babbini & Davis, 1972). After drug administration the rat shows hypolocomotion for a few
minutes, which is followed by a delayed-onset period of hyperlocomotion. The locomotor effect
of opiates in mice have been described as a dose-dependent “running fit”, usually around the
perimeter of the cage, accompanied by an elevated, i.e. “Straub” tail (Lee & Fennessy, 1976;
Oliverio, 1975).
Drug-induced hyperlocomotion is reliable and easy to quantify in rodents, and has been
viewed as the “common denominator” of different drugs of abuse, including psychostimulants,
opiates, ethanol, and nicotine. Drug-induced locomotion is generally thought to reflect the
activation of neural circuits mediating approach behaviors, a necessary aspect of drug-seeking or
more generally goal-directed behavior (Wise & Bozarth, 1987). Indeed, forward locomotion is a
critical part of adaptive behaviors. A hungry or thirsty animal foraging for food or water must
move forward to arrive at the desired goal object. Similarly, a rat that has been trained to self-
administer a drug by bar-pressing or nose-poking also has to engage in some forward locomotion
to obtain more of the desired drug.
7Measurement of locomotor activation is generally thought to reflect activation of the
mesolimbic dopamine system. Accordingly, Tzschentke (2001) suggests that drug-induced
locomotor activity can be used as an index of the integrity and functioning of the dopamine
system. As such, locomotion produced by drugs of abuse can serve as a behavioural index that is
reflective of dopamine activation.
Perhaps more importantly, locomotor activation is also used as a means of assessing
whether past experiences (e.g. prior drug intake) can alter the mesolimbic dopamine system, as
reflected in locomotor sensitization, and increase in responsiveness to the locomotor effects of
drugs over time (for a review see Vezina, 2007; Vanderschuren & Kalivas, 2000).
Stimulant drugs produce their effects through interactions with biogenic amine
transporters. Cocaine blocks the activity of dopamine, norepinephrine and serotonin transporters,
while amphetamine also promotes the release of these biogenic amines by reverse transport
(Johnson, Contrary, & Nichols, 1991; Ritz, Cone, & Kuhar, 1990; Seiden, Sabol, & Ricuarte,
1993; Sulzer, Maidment, & Rayport, 1993). In the case of stimulant drugs in rats, nucleus
accumbens dopamine has been found necessary for both the locomotor activating and reward
associated with cocaine and amphetamine (Caine & Koob, 1994a; 1994b; Ettenberg et al., 1982;
Kelly, Seviour, & Iversen, 1975; Lyness, Friedle, & Moore, 1979; Pettit et al., 1984; Roberts,
Corcoran, & Fibiger, 1977; Sharp, Zetterstrom, Ljungberg, & Ungerstedt, 1987; Vaccarino,
Amalric, Swerdlow, & Koob, 1986). To what extent increased dopamine levels in the nucleus
accumbens are necessary for the rewarding and locomotor activating effects of opiates in rats is
less clear. Both dopamine-dependent and dopamine-independent mechanisms mediating both
opiate reward and locomotion exist, and so an understanding of the mechanisms that contribute
to dopamine-dependent and independent effects is important.
83. Dopamine
The mesencephalic dopaminergic cell groups are divided into the substantia nigra pars
compacta (SNpc; A9) and ventral tegmental area (VTA; A10). These cell groups give rise to the
nigrostriatal and mesolimbic systems, respectively (Fallon & Moore, 1978). The nigrostriatal
system projects from the SNpc to the caudate-putamen (called striatum in rodents), and plays an
important role in motor function. For example, degeneration of these SNpc neurons is one the
neuropathological hallmarks of Parkinson’s disease. Similar to patients with Parkinson’s disease,
animals with selective lesions of the nigrostriatal dopamine system also show deficits in the
initiation of movement (Carli, Evenden, & Robbins, 1985). The nigrostriatal system is also
important for the expression of drug-induced stereotypy, the display of repetitive (stereotyped)
movements following high doses of stimulant drugs (see below).
Medial to the SNpc is the VTA which gives rise to mesolimbic and mesocortical
projections. The mesolimbic system projects to the nucleus accumbens, olfactory tubercle,
septum, amygdala, and hippocampus. The mesocortical system projects to cortical areas,
including prefrontal, cingulate, and perirhinal cortex.
The mesolimbic system, in particular, is implicated in emotional functions and motivated
behaviour (Wise, 2004). Lesions of the mesolimbic dopamine systems with 6-hydroxydopamine
induce a state of anhedonia, where animals lose interest in appetitive stimuli, such as food and
other rewards (Wise, 1982). Dopamine receptor blockade in the nucleus accumbens leads to an
attenuation of food reward (Wise & Schwartz, 1981), brain-stimulation reward (Fouriezos,
Hansson, & Wise, 1978; Fouriezos & Wise, 1976; Gallistel, Boytim, Gomita, & Klebanoff,
1982), and cocaine and amphetamine reward (Caine & Koob, 1994a; Ettenberg et al., 1982;
Pettit et al., 1984).
94. Afferent control of the dopamine system
The activity of the mesolimbic and nigrostriatal dopamine systems is under afferent
control of other neurotransmitter systems that affect the cell bodies in the VTA and SNpc. As a
complete discussion of all afferent inputs is beyond the scope of this paper (for a review see
Kalivas, 1993), only acetylcholine, GABA, and glutamate will be discussed. In particular, as the
current dissertation focuses on the role of M5 muscarinic acetylcholine receptors, an
understanding of the cholinergic control of dopamine neurotransmission is of primary
importance. Thus the details of the cholinergic control of mesencephalic dopamine systems will
be discussed in a separate section.
4.1. GABA
Besides dopamine neurons, the neurons studied most extensively in the VTA are
GABAergic. Immunoreactivity for glutamic acid decarboxylase (GAD) has shown the presence
of GABA cell populations in both the VTA and SN. In VTA approximately 20% of neurons
express messenger RNA (mRNA) for GAD. Tyrosine hydroxylase- and GAD-positive neuron
populations are intermixed. By contrast, in the SN greater than 60% of the neurons express GAD
mRNA and are found predominantly in the reticulata portion (Kalivas et al., 1992).
Many GABA neurons in the VTA and SN synapse onto dopamine neurons (van den Pol,
Smith, & Powell, 1985; Bayer & Pickel, 1991), but many also project outside the ventral
mesencephalon to forebrain areas including nucleus accumbens and prefrontal cortex
(Steffensen, Svingos, Pickel, & Henriksen, 1998; Van Bockstaele & Pickel, 1995), as well as to
the mesopontine regions including PPT and LDT (Semba & Fibiger, 1992; Steininger, Rye, &
Wainer, 1992). GABA neurons in the reticulata portion of the SN also give rise to the nigrotectal
pathway innervating the intermediate layers of the superior colliculus (Hikosaka & Wurtz, 1983;
Rinvik, Grofova, & Otterson, 1976). GABA neurons are thought to provide a tonic inhibitory
input to VTA dopamine neurons (Johnson & North, 1992; Westerink, Kwint, & deVries, 1996).
10Opiate receptors in the VTA are predominantly associated with GABA neurons (Dilts & Kalivas,
1989; Garzon & Pickel, 2001) and GABA neurons are thought to be critical in the effects of
VTA opiates, by disinhibition of the mesolimbic dopamine system.
4.2. Glutamate
VTA dopamine cells receive glutamate afferents from the medial prefrontal cortex
(Sesack & Pickel, 1992; Smith, Charara, & Parent, 1996), the amygdala, the bed nucleus of the
stria terminalis (Hopkins & Holstege, 1978; Phillipson, 1979), and the pedunculopontine
tegmental nucleus (Charara, Smith, & Parent, 1996). Recently, neurons expressing the vesicular
glutamate transporter (vGluT) have also been identified in the VTA. Thus, in addition to
dopamine and GABA, there may also exist a population of glutamate neurons in the VTA
(Yamaguchi, Harvey, Liu, & Morales, 2007).
Dopamine neurons recorded in vivo typically show a distinct firing pattern characterized
by an irregular rate of single-spike firing at a frequency of 1-10 Hz (4 Hz on average), with
intermittent, brief periods of burst firing (Grace & Bunney, 1983). Functionally, extrasynaptic,
‘tonic’ levels of dopamine are mediated by the basal activity of dopamine neurons. The transient,
but large, ‘phasic’ increases in dopamine, which are generally considered functionally most
important, are mediated by burst firing of dopamine neurons (Grace, 1991). The transition from
low-frequency, irregular to burst-firing modes depends on glutamate, as activation of glutamate
afferents (Floresco, West, Ash, Moore, & Grace, 2003) or direct application of glutamate (Grace
& Bunney, 1984) induces burst firing.
5. Acetylcholine
5.1 Anatomy of Cholinergic Systems
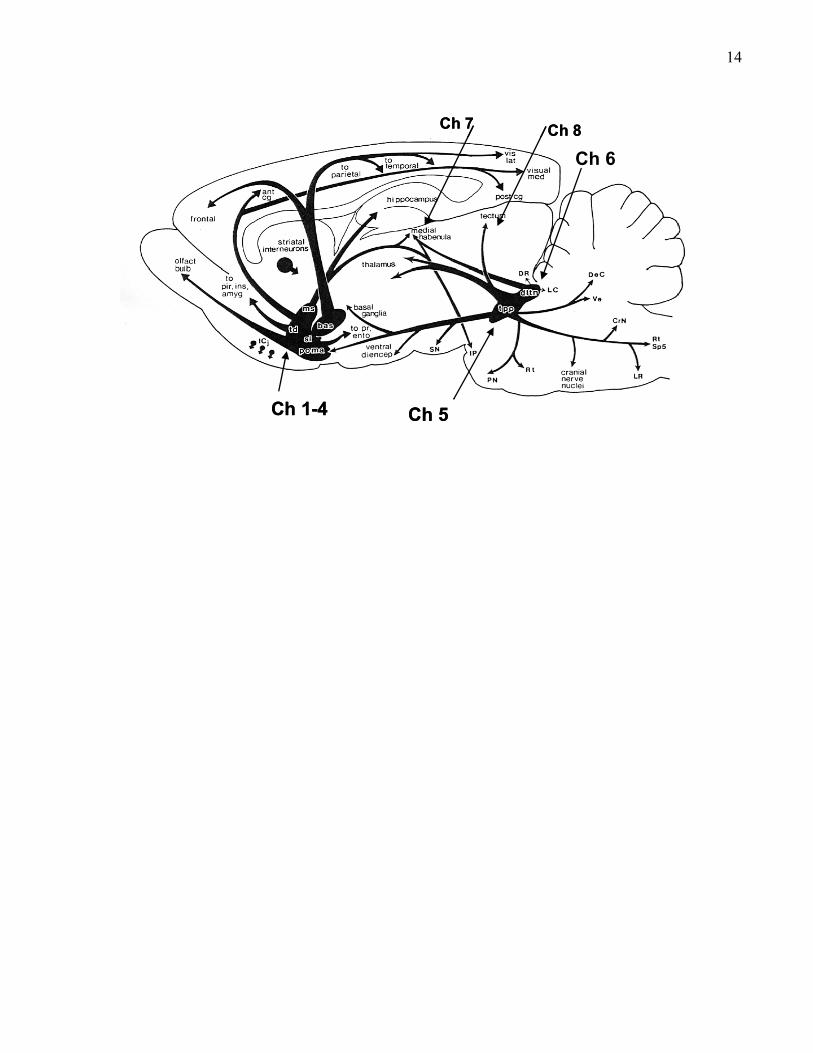
Mesulam and colleagues (1983) have proposed a system where the clusters of cholinergic
projection neurons are named by the designation “Ch” followed by an identifying number. Using
11choline acetyltranferase (ChAT) as the marker for cholinergic neurons, eight cell groups, named
Ch1-8, have been identified (see Figure 1) as well as a population of large, aspiny, cholinergic
neurons found in all parts of the striatal complex (e.g. caudate-putamen, nucleus accumbens,
olfactory tubercle, and islands of Calleja). The striatal cholinergic interneurons make most of
their synapses onto medium-sized, spiny GABAergic striatal output neurons (Phelps, Houser, &
Vaughn, 1985; Izzo & Bolam, 1988) and receive dopaminergic input from the midbrain (Chang,
1988; Kubota et al., 1987). Furthermore, these neurons have large and widespread dendritic
trees, making them capable of integrating synaptic inputs over large regions.
Four of these clusters, Ch1-4, are collectively referred to as the basal forebrain system.
These cell clusters are found in the ventral forebrain, and include, in rostro-caudal order, the cell
groups of the medial septal nucleus (Ch1), the vertical limb of the diagonal band (Ch2), the
horizontal limb of the diagonal band (Ch3), and the nucleus basalis, substantia inominata, and
nucleus reticularis (Ch4). These neurons have widespread ascending projections, innervating
hippocampus and limbic cortex (Ch1-3), olfactory bulbs and amygdala (Ch3), and virtually all of
the neocortex (Ch4). Basal forebrain cholinergic projections excite the cortex and hippocampus
(Woolf, 1991).
The Ch5 and Ch6 cluster are found more caudally in the brain at the midbrain/pons
border. These are the cell groups of the pedunculopontine tegmental nuclei (PPT, Ch5) and the
laterodorsal tegmental nuclei (LDT, Ch6). PPT and LDT are of particular relevance to the
current work, so their anatomy, afferent inputs, and efferent projections will be discussed in
greater detail in the following sections. Finally, two additional cholinergic clusters are found in
the medial habenula (Ch7) and the parabigeminal nucleus (Ch8).
Pedunculopontine and Laterodorsal Tegmental Nuclei
In the rat, the PPT is closely associated with the ascending limb of the superior cerebellar
peduncle as it passes through the rostral pons and midbrain. It extends caudally from the
12posterior pole of the substantia nigra to the lateral tip of the superior cerebellar peduncle, and
rostral parabrachial nucleus (Rye, Saper, Lee, & Wainer, 1987; Steininger et al., 1992). Dorsally
it is bordered by cuneiform nucleus and deep mesencephalic nuclei, and ventrally by the pontine
reticular nucleus (Inglis & Winn, 1995; Paxinos & Watson, 1998). With some variation this is
the position occupied by the PPT in all species studied to date, including human and non-human
primates (Winn, 2006).
Relative to the caudal PPT, the cells of the LDT are located more medially, largely within
the pontine central gray, and are bound anteriorally by the dorsal raphe. In terms of rostro-caudal
extent, the posterior portions of PPT correspond to the anterior portions of the LDT (Paxinos &
Watson, 1998).
Neurochemical characterization of PPT and LDT neurons
The PPT has been divided into pars dissipatus (PPT-d) and pars compacta (PPT-pc) subnuclei
(Steininger, Wainer, & Rye, 1997). The PPT-pc describes that portion of PPT that lies within the
caudal two-thirds of the PPT, characterized by densely clustered neurons lateral to the ascending
limb of the superior cerebellar peduncle, while the PPT-d describes an area that is more medial
and rostral, where neurons are relatively more diffuse (Steininger et al., 1997). The PPT-pc
contains approximately 40% of all PPT neurons, and approximately 90% of these neurons are
cholinergic. In the PPT-d, neurons are largely glutamatergic, with only 25-50% of neurons
cholinergic.
The cholinergic neurons (Ch5) of the pars compacta portion are larger than non-
cholinergic neurons in the area (Steininger et al., 1997) and receive a greater number of synaptic
inputs (Honda & Semba, 1995). Among the non-cholinergic neurons at least some contain
GABA (Ford, Holmes, Mainville, & Jones, 1995).
It is believed that some cholinergic neurons in PPT are co-localized with other
neurotransmitters. Virtually all cholinergic neurons in the PPT also synthesize nitric oxide

13Figure 1. The central projections of cholinergic cells schematically represented on a parasagittal
section from rat brain. Cholinergic cell groups Ch1-8 are added (see text). This figure is adapted
from Woolf (1991).
14
Ch 1-4 Ch 5
Ch 6
Ch 7 Ch 8
Ch 1-4 Ch 5
Ch 6
Ch 7 Ch 8
15(Vincent & Kimura, 1992; Vincent et al., 1986), and some also contain glutamate (Bevan &
Bolam, 1995) or GABA (Charara et al., 1996). Furthermore, substance P (Vincent et al., 1986)
and arterial natriuretic peptide (Moga and Saper, 1994; Ryan & Grundlach, 1994) have been
detected in these neurons as well. The co-localization of acetylcholine with other transmitters
suggests that cholinergic neurons may co-release these various other transmitters along with
acetylcholine, complicating a clear understanding of post-synaptic effects. However, at this point
there is no systematic understanding of how the colocalization of cholinergic neurons with other
transmitters is organized and functions in the PPT (Winn, 2006).
In-situ hybridization shows that less than 1% of LDT neurons expressing ChAT also
express mRNA for the vesicular glutamate transporter or GAD. Thus, at least in the case of LDT,
this argues for separate populations of cholinergic, glutamatergic, and GABAergic neurons.
Estimates of the relative proportion of each population are 20% cholinergic, 22% glutamatergic,
and 58% GABAergic neurons (Wang, Tagliferro, & Morales, 2007).
Ascending Projections of PPT and LDT Cholinergic Neurons
Thalamic and Basal Forebrain Projections.
Cholinergic cells of the PPT and LDT heavily innervate the thalamus. Injections of
retrograde tracer into the thalamus resulted in labeling of close to 100% of ipsilateral cholinergic
neurons in the PPT, and 50% contralaterally, with the contralateral projecting cells evenly
distributed through PPT and LDT (Oakman, Farris, Cozzari, & Hartman, 1999). In addition the
PPT provides weaker innervation of the basal forebrain, but the majority of these inputs arise
from non-cholinergic neurons (Jones & Cuello, 1989).
Cholinergic Innervation of the VTA and SN.
Injections of retrograde tracers into either the SN (including both compacta and
reticulata) or the VTA showed labeling of ChAT-positive cells in both PPT and LDT. In the case
of VTA injections, most projection neurons originated from areas where ChAT-positive cells
16were most numerous, namely the LDT and PPT-pars compacta. VTA projections from PPT and
LDT were approximately equally distributed ipsi- and contra-lateral to the injection. In the case
of SN injections ChAT-positive projection neurons originated predominantly from the PPT, with
the densest areas of cholinergic projection neurons found in the rostroventral and medial portions
of the PPT (i.e. the dissipata region). In contrast to the VTA, SN-projecting neurons were
predominantly ipsilateral to the injection site, and there were only very few neurons originating
from the ChAT-positive LDT neurons (Oakman, Farris, Kerr, Cozzari, & Hartman, 1995). Thus,
the LDT and the caudal portions of PPT (i.e. the regions densest in cholinergic neurons) provide
bilateral cholinergic innervations to the VTA, and the anterior portions of the PPT, but not the
LDT, provide primarily ipsilateral cholinergic innervations to the SN.
Double-labeling studies have shown that cholinergic terminals are in close apposition to
dopaminergic neurons in the SNpc, forming asymmetric synapses predominantly with dendrites,
but also cell bodies (Bolam, Francis, & Henderson, 1991). Functionally, inputs from the PPT to
the SNpc have been shown to monosynaptically excite dopamine neurons through both nicotinic
(Clarke, Hommer, Pert, & Skirboll, 1987; Futami, Takakusaki, & Kitai, 1995) and muscarinic
cholinergic, as well as glutamatergic receptors (Futami et al., 1995).
Cholinergic terminals in the VTA terminate on cells that label positive for the dopamine
transporter as well as on cells that do not. This suggests that cholinergic inputs innervate both
dopamine and GABA neurons in the VTA, and is consistent with data showing that nicotinic
(Yin & French, 2000) and muscarinic (Grillner, Berretta, Bernardi, Svensson, & Mercuri, 2000)
receptors affect the activity of GABA neurons.
Approximately 50% of LDT inputs to the VTA form asymmetric synapses (Omelchenko
& Sesack, 2005). Additionally, VTA terminals that label positive for the vesicular acetylcholine
transporter (VAchT) asymmetrically synapse onto neurons immuno-positive for tyrosine
hydroxylase giving rise to mesoaccumbens projections approximately four times more than
17neurons giving rise to mesocortical projections. Furthermore, supporting cholinergic innervation
of both dopamine and non-dopamine VTA neurons, VAchT terminals in the VTA also synapsed
onto neurons immuno-positive for GABA, albeit to a lesser extent (Omelchenko & Sesack
2006).
5.2. Cholinergic Receptors
The effects of acetylcholine on mesolimbic and nigrostriatal dopamine neurons are
mediated through fast, ionotropic nicotinic and slow, metabotropic muscarinic receptors.
Muscarinic Acetylcholine Receptors and Genes
Five different muscarinic acetylcholine receptor subtype genes have been cloned to date
(Bonner, Young, Brann, & Buckley, 1988; Bonner, Buckley, Young, & Brann, 1987). They all
belong to the super-family of seven-transmembrane receptors, and activate signal transduction
through coupling to G proteins. The M1, M3, and M5 subtypes are coupled to pertussis toxin-
insensitive G proteins (Gq/G11 family). Activation of these receptors by an agonist causes the
activation of phospholipase C. This in turn leads to the activation of diacylglycerol (DAG) and
D-myo-inositol 1,4,5-triphosphate (IP3). DAG activates protein kinase C (PKC), an enzyme
which can then regulate the function of other intracellular proteins, while IP3 releases
intracellular calcium stores by acting on IP3 receptors on the smooth endoplasmic reticulum
(Eglen & Nahorski, 2000). In addition, M3 and M5 receptors can also activate so-called transient
receptor potential channels (TRPCs) which are transmembrane cation channels (Harteneck,
Plant, & Schultz, 2000). Both the effect of IP3 on calcium and TRPCs leads to an increase in
intracellular cation levels and thus an increase in cell excitability.
M2 and M4 receptors preferentially couple to pertussis toxin-sensitive G proteins
(Gi/Go). Activation of these receptors by an agonist leads to the inhibition of adenylyl cyclase,
the enzyme that synthesizes cyclic AMP. These receptors decrease cell excitability.
18Muscarinic Receptor Distribution
The five muscarinic receptor subtypes have been localized through the use of in-situ
hybridization for mRNA and/or antibody labeling for receptor protein, depending on the receptor
sub-type investigated. Yasuda et al. (1992) provided estimates of the relative proportion of
muscarinic receptor sub-types in the brain, based on immunoprecipitation, indicating 30-40%
M1, 20-40% M2, 5% M3, 20-30% M4, <2% M5.
M1 Muscarinic Receptors.
The highest levels of M1 receptors are found in the cerebral cortex, hippocampus, and
striatum as shown by mRNA (Buckley, Bonner, & Brann, 1988; Wei, Walton, Milici, &
Buccafusco, 1994; Weiner & Brann, 1989; Weiner et al., 1990), protein immunoprecipitation,
and protein immunocytochemistry (Levey, Kitt, Simonds, Price, & Brann, 1991). Moderate
levels are found in the amygdala, and low levels in the thalamus. By contrast very low levels of
M1 protein are found in the brainstem (around 2-5%, Levey, 1993).
The absence of M1 mRNA in the SN and VTA (Weiner et al., 1990) suggests that this
muscarinic receptor sub-type does not play a significant role in mediating cholinergic inputs to
the ventral mesencephalon. On the other hand, in the striatum, where high levels of mRNA are
observed, M1 receptors are associated with several different neuron populations, including
medium spiny neurons and cholinergic interneurons (Figure 2) (Bernard, Norman, & Bloch,
1992; Hersch, Gutekunst, Rees, Heilman, & Levey, 1994). M1 receptor knockout mice showed
elevated striatal dopamine levels and an increased dopaminergic response to amphetamine,
suggesting that M1 receptors may be involved in a mechanism that inhibits dopamine release in
the striatum (Gerber et al., 2001).
M2 Muscarinic Receptors.
The highest levels of M2 receptors are found in the basal forebrain, the thalamus, the
mesopontine tegmentum (including PPT and LDT) and motor nuclei of cranial nerves, as shown
19by mRNA (Buckley et al., 1988; Wei et al., 1994), protein immunoprecipitation, and protein
immunocytochemistry (Levey et al., 1991). Moderate levels of M2 mRNA and receptor
proteinare found in the striatum and cortex, while low levels are found in the substantia nigra,
amygdala, and hippocampus (Figure 2). Based on the similarity between the distribution of M2
receptor protein and cholinergic neurons, Levey and colleagues (1991) suggest that M2 receptors
function as somatodendritic autoreceptors in these areas, inhibiting acetylcholine neurons. In the
striatum, M2 receptor protein is associated mainly with cholinergic interneurons (Hersch et al.,
1994). However, oxotremorine-enhanced striatal dopamine release in M2 knockout mice was not
significantly different relative to wild-type mice (Zhang, Yamada, Gomeza, Basile, & Wess,
2002). In the PPT and LDT, M2-like receptors mediate acetylcholine-mediated inhibition of
cholinergic neurons (Leonard & Llinás, 1994). However, M2 knockout mouse data indicate that
M2 receptors have little effect on basal VTA acetylcholine levels, basal nucleus accumbens
dopamine levels, or psychostimulant-induced increases in dopamine (Tzavara et al., 2004).
M3 Muscarinic Receptors.
Levey an colleagues (1991) showed the highest levels of M3 mRNA in cortex, hippocampus, and
the thalamus, but detected no mRNA in either the striatum or ventral midbrain. Wei et al. (1994)
did detect mRNA in the pons-medulla and striatum, where M3 mRNA was associated mainly
with axon terminals, but a small number was also associated with medium spiny cells (Hersch et
al., 1994). Binding studies indicated the presence of M3 receptors in the substantia nigra (Frey &
Howland, 1992; Zubieta and Frey, 1990). Finally, Michel, Robillard, and Trudeau (2004) have
shown the expression of M3 receptor protein in cultured mesencephalic GABA neurons.
Oxotremorine-enhanced striatal dopamine release in M3 knockout mice was increased relative to
wild-type mice, suggesting that in wild-type mice M3 receptors are involved in a mechanism that
inhibits striatal dopamine release (Zhang et al., 2002). In mesencephalic cell cultures cholinergic
agonists increased the firing rates of GABA neurons, and the excitation could be blocked by pre-
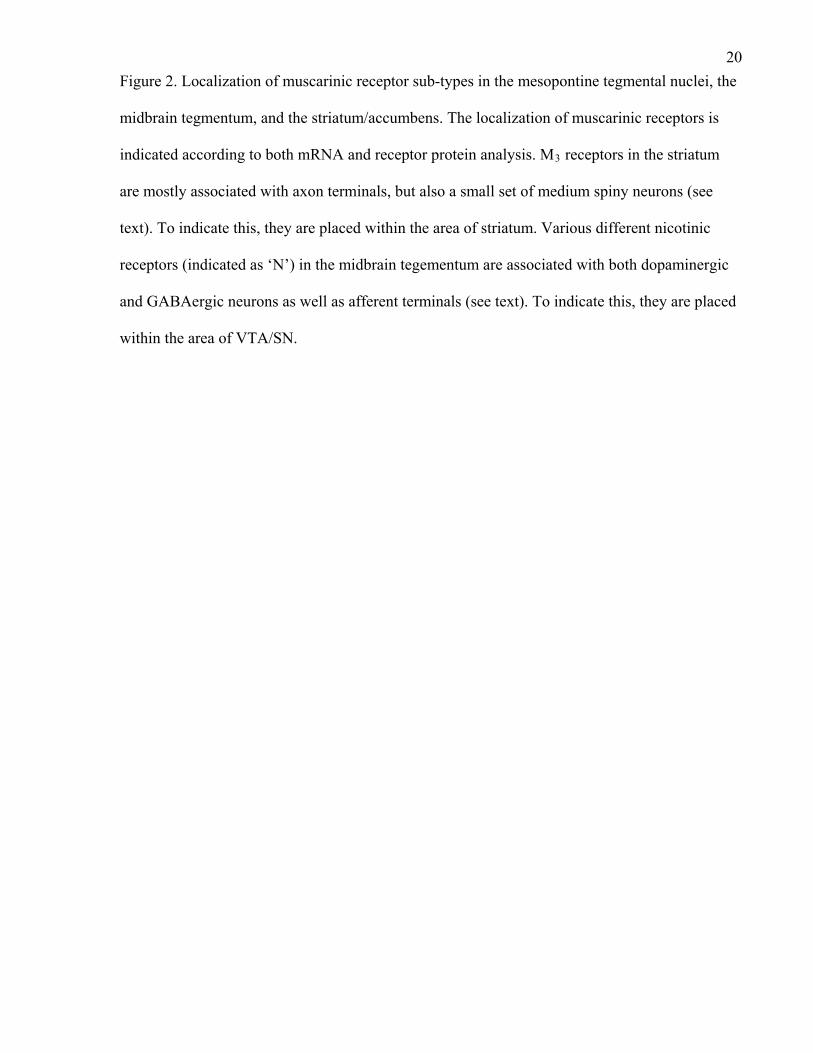
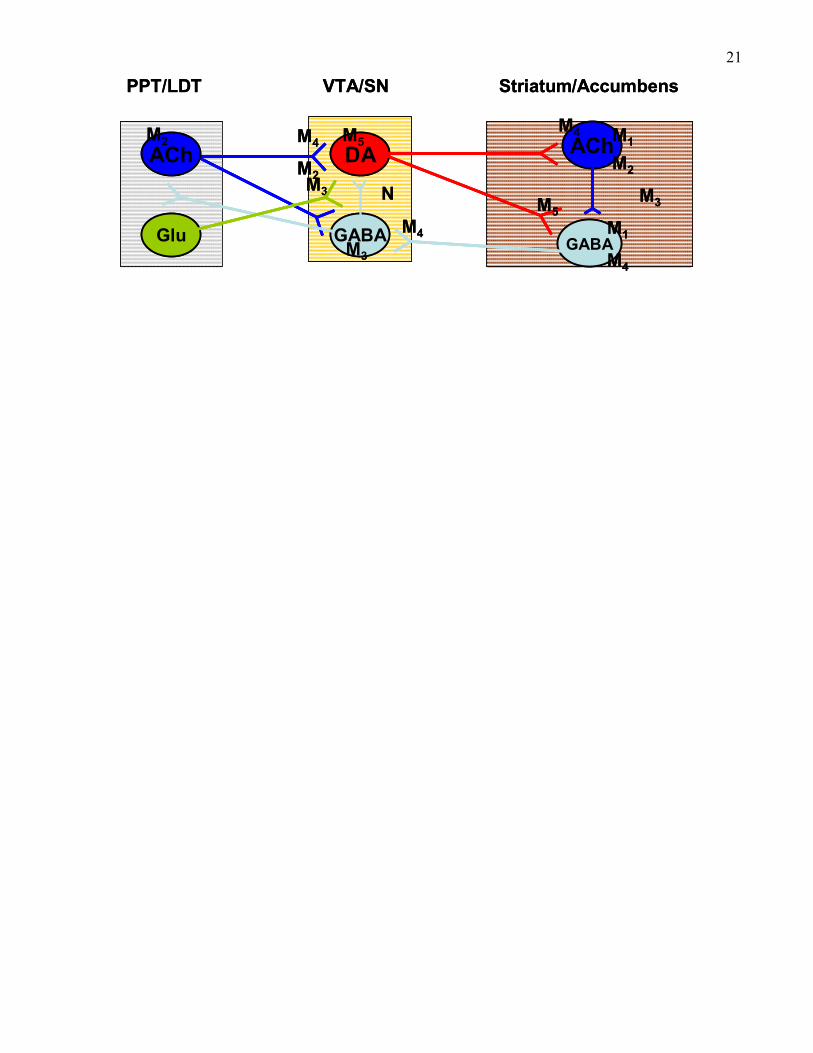
20Figure 2. Localization of muscarinic receptor sub-types in the mesopontine tegmental nuclei, the
midbrain tegmentum, and the striatum/accumbens. The localization of muscarinic receptors is
indicated according to both mRNA and receptor protein analysis. M3 receptors in the striatum
are mostly associated with axon terminals, but also a small set of medium spiny neurons (see
text). To indicate this, they are placed within the area of striatum. Various different nicotinic
receptors (indicated as ‘N’) in the midbrain tegementum are associated with both dopaminergic
and GABAergic neurons as well as afferent terminals (see text). To indicate this, they are placed
within the area of VTA/SN.
21
Glu
DA
GABA
ACh
GABAM3
M5
M4
M4
M1
PPT/LDT VTA/SN Striatum/Accumbens
M4
M2
M1
M3
ACh
M5
M2
M3
M4
N
M2
Glu
DA
GABA
ACh
GABAM3
M5
M4
M4
M1
PPT/LDT VTA/SN Striatum/Accumbens
M4
M2
M1
M3
ACh
M5
M2
M3
M4
N
M2
22treatment with 4-DAMP, a preferential M3 receptor antagonist (Michel et al., 2004). Thus, the
M3-mediated increase in GABA neuron activity may, consequently, inhibit the activity of
neighbouring dopamine neurons.
M4 Muscarinic Receptors.
The highest levels of M4 receptors are found in the striatum, as assessed by mRNA (Wei
et al., 1994; Weiner et al., 1990) and protein immunoprecipitation and immunocytochemistry
(Levey et al., 1991), while lower levels are found in cortex, hippocampus, and thalamus. Others
have found M4 mRNA in PPT and LDT cholinergic cells (Sugaya, Clamp, Bryan, & McKinney,
1997). However, analysis of M4 receptor protein expression shows low levels in pons/medulla,
but moderate levels in the midbrain (Yasuda et al., 1992), suggesting that receptors are
associated with cholinergic terminals that excite dopamine neurons in VTA and SN. In the
striatum, M4 receptor protein is associated with medium spiny projection neurons, axon
terminals, and cholinergic intereneurons (Hersch et al., 1994; Sugaya et al., 1997).
Oxotremorine- enhanced striatal dopamine release in M4 knockout mice was completely absent
relative to wild-type mice, suggesting that M4 receptors play a key role in meditaing muscarinic
receptor-mediated increases in striatal dopamine release (Zhang et al., 2002). A role for VTA M4
receptors is suggested by the fact that M4 knockout mice have increased basal levels of VTA
acetylcholine, nucleus accumbens dopamine, and an enhanced dopaminergic response to
psychostimulants (Tzavara et al., 2004).
M5 Muscarinic Receptors.
Localization of M5 receptors in the mammalian brain has been more challenging than the
other receptor sub-types. This, in part, has been due to methodological limitations associated
with detecting very low levels of mRNA or protein. For example, immunoprecipitation of M5
protein in different brain areas estimates the proportion of M5 receptors as less than 2% overall
in the brain (Yasuda et al., 1992). Also, lack of available antibodies has made
23immunocytochemistry difficult, and the lack of selective pharmacological ligands has precluded
binding assays. To illustrate, several investigation of M5 mRNA distribution in the rat brain
show presence in only a limited number of brain areas. Notably, detection in the SN and VTA
has been consistent across studies (Levey et al., 1991; Vilaro et al., 1990; Wang et al., 2004; Wei
et al., 1994; Weiner et al., 1990), but most investigations do not report the presence of M5
mRNA in striatum, and cortex. However, maximizing the low levels of mRNA to facilitate
detection through the use of reverse transcriptase PCR, shows that mRNA can in fact be
detected, albeit at low levels, in all major brain regions, including cortex and forebrain areas (e.g.
striatum), midbrain, hindbrain and spinal cord (Wang et al., 2004; Wei et al., 1994). There is
only one published immunoprecipitation study on the distribution of M5 protein, and it shows
significant levels in the midbrain, striatum and hippocampus (Yasuda et al., 1992). In both
striatum and midbrain the localization of M5 receptors by immunocytcochemistry is yet to be
determined. However, in situ hybridization showed an enrichement of autoradiographic grains
over dopaminergic cell bodies in the SNpc and 6-OHDA lesions completely abolished the
autoradiographic signal (Vilaro et al., 1990). Furthermore, in both VTA and SNpc, cells
expressing M5 mRNA and D2 mRNA are co-localized (Wang et al., 2004; Weiner et al., 1990),
further suggesting expression on dopamine neurons. A role for M5 receptors on striatal terminals
is suggested by the fact that oxotremorine-enhanced striatal dopamine release in M5 knockout
mice was reduced by 50% relative to wild-type mice (Yamada et al., 2001). A strong, excitatory
role for M5 receptors on dopamine cell bodies is shown by the fact that the third phase of
prolonged dopamine release evoked by electrical stimulation of the VTA is absent in M5
knockout mice (Figure 3b; Forster et al., 2001). This will be discussed in more detail later.
Nicotinic Acetylcholine Receptors and Genes
Nicotinic receptors are pentametric ion channels composed of various subunit
combinations that allow the passage of cations when activated, resulting in depolarizing post-
24synaptic currents. To date, 12 neuronal nicotinic acetylcholine receptor subunits have been
identified, α2-α10, and β2-β4 (Gotti, Fornasari, & Clementi, 1997; Jones, Sudweeks, & Yakel,
1999; McGehee & Role; 1995; Role & Berg, 1996; Salamone & Zhou, 2000). Dopamine
neurons in the VTA and SN express the α2-α7 and β2-β4 subunits which combine to form either
α4β2 heteromeric receptors (e.g. α4α6α5(β2)2 or α4α5(β2)2) or homomeric (e.g. α7) receptors.
GABA neurons express less of the α3, α5, α6, and β4 subunits. and so likely also form α4β2
hetermomeric receptors as well as homomeric α7 receptors (Charpantier, Barnéoud, Moser,
Besnard, & Sgard, 1998; Klink, de Kerchove d’Exaerde, Zoli, & Changeux, 2001). However,
for both dopamine and GABA neurons, less than half express α7 mRNA (Klink et al., 2001),
indicating that receptors containing this subunit are less common than α4β2. Data from knockout
mouse studies indicate that receptors including the β2 subunit (Picciotto et al., 1998; Maskos et
al. 2005) or α4 subunits (Tapper et al., 2004) and are particularly important for nicotine-induced
increases in dopamine and nicotine reward.
α7 receptors have been localized to both somatodendritic areas (dopaminergic and non-
dopaminergic) and afferent terminals (both glutamatergic and non-glutamatergic). Among the
terminal α7 receptors, approximately 75% are associated with glutamate terminals, and not with
cholinergic terminals (Jones & Wonnacott, 2004). α7 receptors on glutamatergic terminals in the
VTA are in a prime position to affect excitatory glutamate transmission in the VTA.
Accordingly, Schilstrom and colleagues (1998) showed that VTA administration of the α7
receptor antagonist methyllycaconitine (MLA) reduced accumbal dopamine release by systemic
nicotine, suggesting that antagonism of pre-synaptic glutamate release resulted in less nicotine-
induced excitation of the mesolimbic dopamine system. Similarly, antagonism of α7 receptors
on dopamine neurons also leads to reduced nicotine-induced dopamine release. Nicotinic and
25glutametergic receptors together can activate dopamine neurons and nucleus accumbens
dopamine release quickly (Figure 3a).
6. PPT and LDT projections: Functional Considerations
The focus of this dissertation is on the cholinergic control of mesencephalic dopamine
neurons and the nature of this control will be discussed in detail first (section 6.1). However,
given the strong innervation of thalamic nuclei (see section 5.1), leading to activation of
thalamus and cortex, the role of the PPT as a cortical arousal system will also be briefly
discussed (sections 6.2 and 6.3).
6.1. Ascending cholinergic control of mesencephalic dopamine systems
Ascending PPT and LDT cholinergic inputs activate nigrostriatal and mesolimbic dopamine
systems, as illustrated by the work of Blaha and colleagues (Blaha & Winn, 1993; Blaha et al.,
1997; Forster & Blaha, 2000; 2003). They have utilized chronoamperometry (see Appendix A)
to detect changes in accumbens or striatum dopamine efflux following nicotine or carbachol in
the VTA or SN, or electrical stimulation of the LDT or PPT in rats. In rats, electrical stimulation
of either PPT or LDT produces a characteristic tri-phasic pattern of dopamine efflux (see Figure
3a), and each of the three phases can be pharmacologically dissociated. The first phase has an
onset that is time-locked to the stimulation with a duration of 2-3 min in both PPT-evoked
striatal and LDT-evoked accumbal dopamine efflux in rats. The first phase (Figure 4 left) could
be selectively blocked by infusion of either nicotinic or ionotropic glutamate receptor antagonist
into the VTA (Forster & Blaha, 2000), or the SN (Forster & Blaha, 2003). The second phase
(Figure 4 middle) is characterized by a decline in oxidation current to below baseline levels, and
has a duration of 8-9 minutes in both PPT-evoked striatal and LDT-evoked accumbal dopamine
efflux. This phase is mediated by muscarinic receptors in LDT (Forster & Blaha, 2000) and PPT
(Forster & Blaha, 2003). Injections of scopolamine into the PPT and LDT attenuated the second
26phase of striatal and accumbal dopamine efflux, respectively. Furthermore, in each case, infusion
of the M2 selective antagonist methoctramine completely blocked the second phase, suggesting
that this second phase is due to activation of inhibitory M2 receptors expressed by cholinergic
cells of PPT and LDT (Buckley et al., 1988; Levey et al., 1991; Vilaro et al., 1990, 1994). The
third phase (Figure 4 right) is characterized by increases in dopamine oxidation current with a
slow onset at around 8-9 min, and a longer duration lasting between 36 min (LDT; Forster &
Blaha, 2000) and 46 min (PPT Forster & Blaha, 2003). This phase could be selectively blocked
by scopolamine infusion into the VTA (Forster & Blaha, 2000) and SN (Forster & Blaha, 2003),
suggesting mediation through muscarinic receptors in VTA and SN.
In 129 wild-type mice (Figure 3b) the duration of the first phase following LDT-evoked
accumbal dopamine efflux is on the order of 2-3 minutes. The duration of the second, inhibitory
phase is shorter than in rats, with oxidation currents returning to baseline within 4-5 min.
Furthermore, in mice, where the second inhibitory phase of LDT-evoked accumbems dopamine
efflux is found to be shorter, the subsequent third, excitatory phase, was found to have a faster
onset of about 8 min and a duration of approximately 40 min (Foster et al., 2001). The third
phase could be selectively blocked by systemic pre-treatment with scopolamine. Most
importantly, the third phase of accumbal dopamine efflux following electrical stimulation of the
LDT was absent in M5 knockout mice, while the first and second phases of dopamine release
were unaffected (Figure 3b). This suggests that specifically the M5 sub-type, associated with
dopamine neurons in the VTA, mediates the slow activation of dopamine neurons resulting in the
prolonged, third phase of accumbal dopamine efflux (Yeomans et al., 2001).
Electrophysiological recordings from dopamine neurons show that both LDT and PPT
importantly contribute to the control of VTA dopamine neuron activity. LDT activation by local
infusion of scopolamine produced an increase in the number of spontaneously active VTA
dopamine neurons (Lodge & Grace, 2006). Presumably, this effect was due to the blockade of
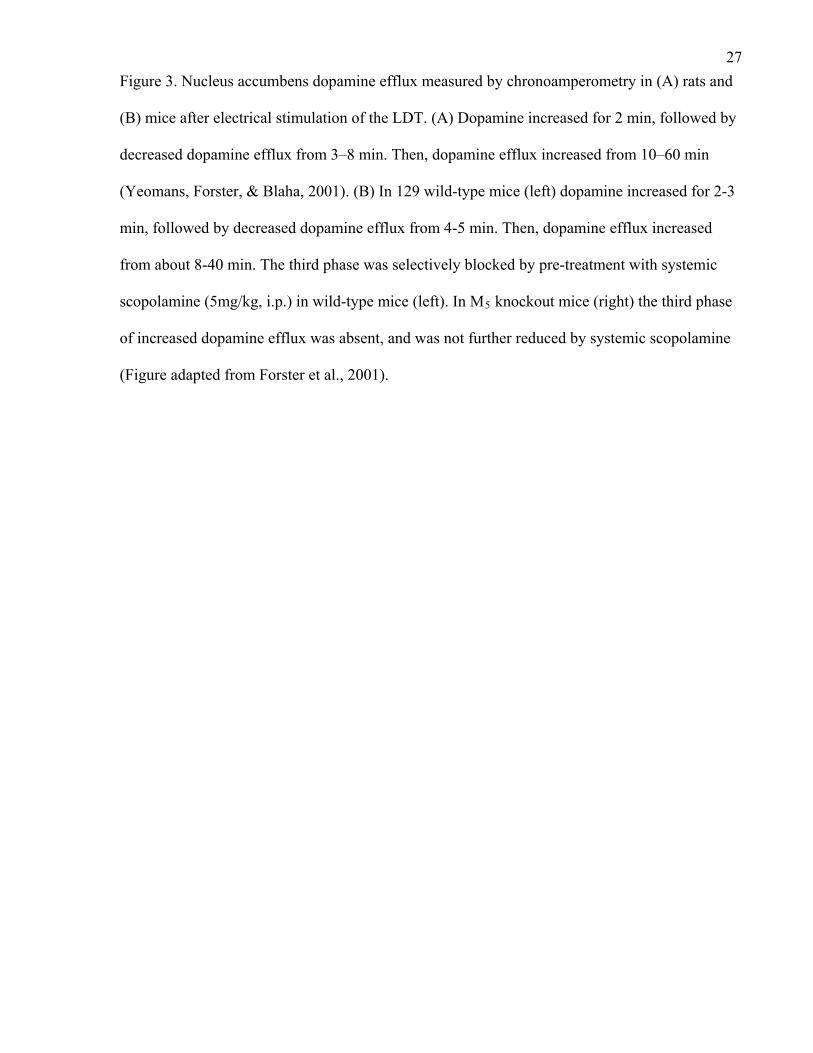
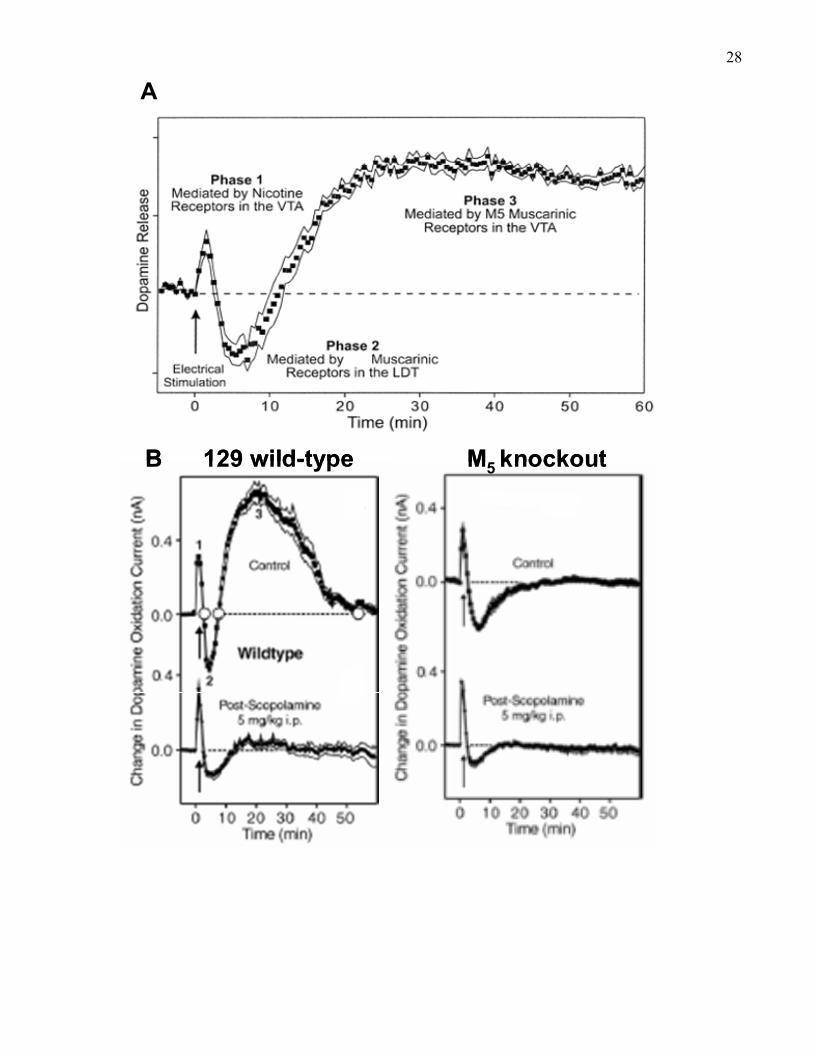
27Figure 3. Nucleus accumbens dopamine efflux measured by chronoamperometry in (A) rats and
(B) mice after electrical stimulation of the LDT. (A) Dopamine increased for 2 min, followed by
decreased dopamine efflux from 3–8 min. Then, dopamine efflux increased from 10–60 min
(Yeomans, Forster, & Blaha, 2001). (B) In 129 wild-type mice (left) dopamine increased for 2-3
min, followed by decreased dopamine efflux from 4-5 min. Then, dopamine efflux increased
from about 8-40 min. The third phase was selectively blocked by pre-treatment with systemic
scopolamine (5mg/kg, i.p.) in wild-type mice (left). In M5 knockout mice (right) the third phase
of increased dopamine efflux was absent, and was not further reduced by systemic scopolamine
(Figure adapted from Forster et al., 2001).
28
A
B 129 wild-type M5 knockoutB 129 wild-type M5 knockout
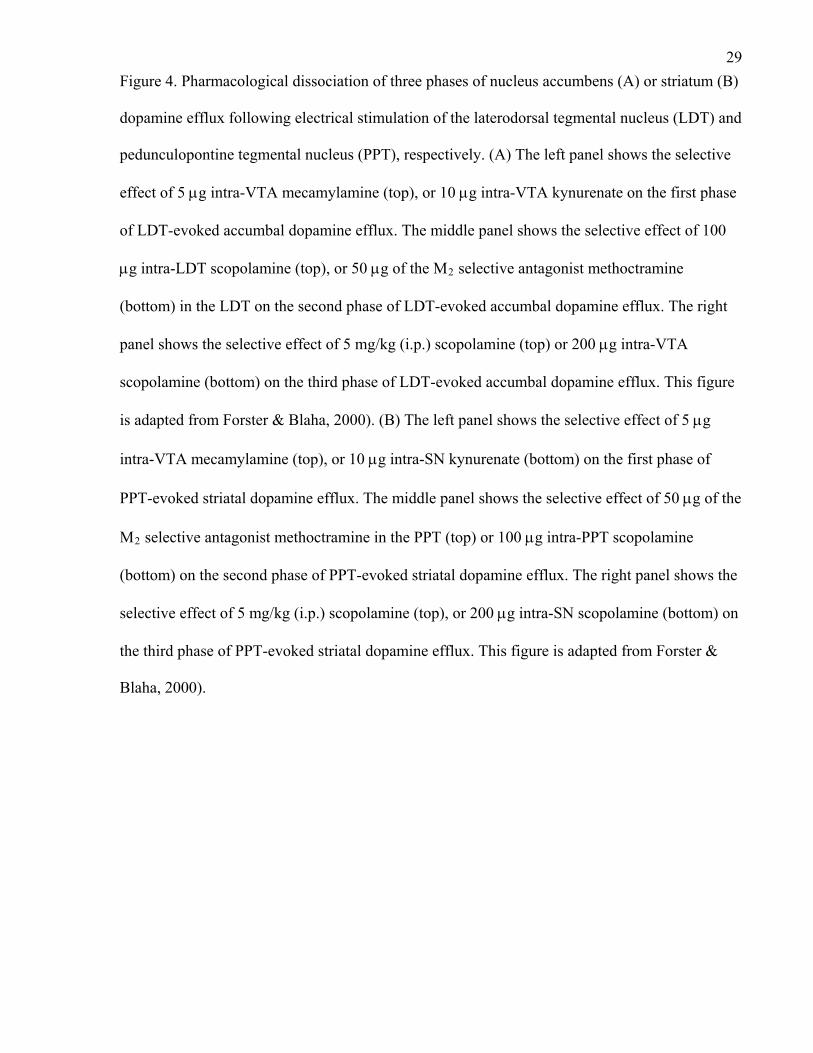
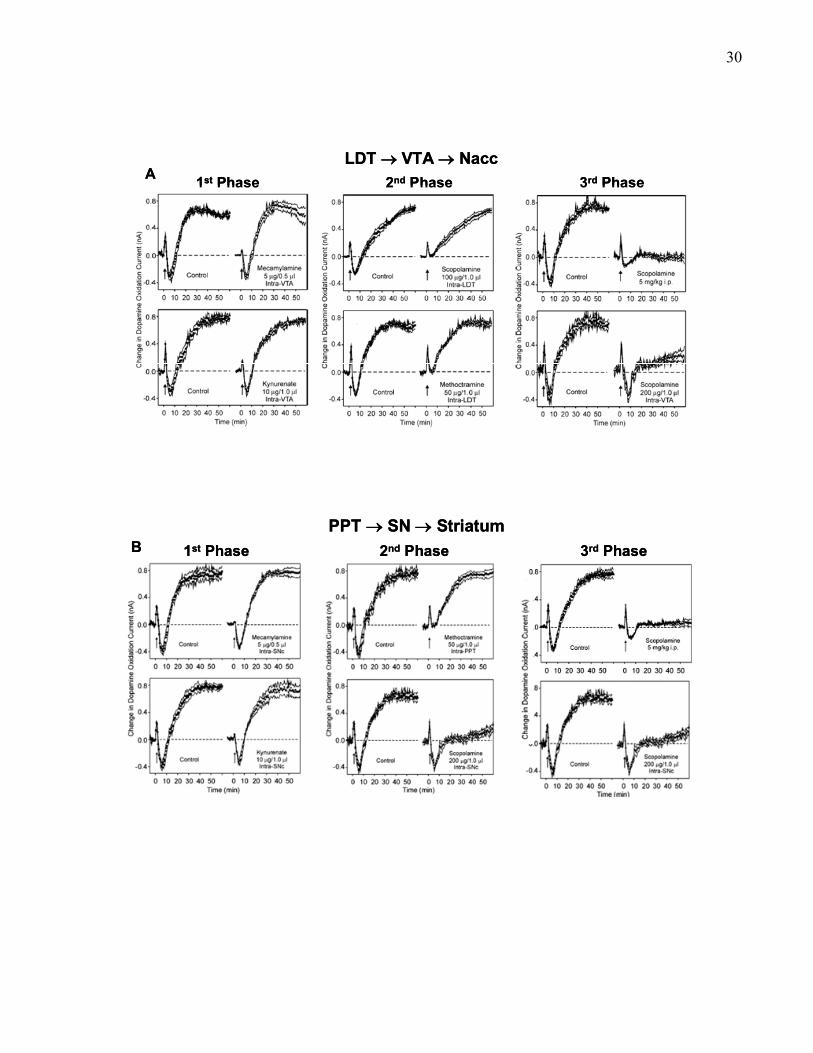
29Figure 4. Pharmacological dissociation of three phases of nucleus accumbens (A) or striatum (B)
dopamine efflux following electrical stimulation of the laterodorsal tegmental nucleus (LDT) and
pedunculopontine tegmental nucleus (PPT), respectively. (A) The left panel shows the selective
effect of 5 μg intra-VTA mecamylamine (top), or 10 μg intra-VTA kynurenate on the first phase
of LDT-evoked accumbal dopamine efflux. The middle panel shows the selective effect of 100
μg intra-LDT scopolamine (top), or 50 μg of the M2 selective antagonist methoctramine
(bottom) in the LDT on the second phase of LDT-evoked accumbal dopamine efflux. The right
panel shows the selective effect of 5 mg/kg (i.p.) scopolamine (top) or 200 μg intra-VTA
scopolamine (bottom) on the third phase of LDT-evoked accumbal dopamine efflux. This figure
is adapted from Forster & Blaha, 2000). (B) The left panel shows the selective effect of 5 μg
intra-VTA mecamylamine (top), or 10 μg intra-SN kynurenate (bottom) on the first phase of
PPT-evoked striatal dopamine efflux. The middle panel shows the selective effect of 50 μg of the
M2 selective antagonist methoctramine in the PPT (top) or 100 μg intra-PPT scopolamine
(bottom) on the second phase of PPT-evoked striatal dopamine efflux. The right panel shows the
selective effect of 5 mg/kg (i.p.) scopolamine (top), or 200 μg intra-SN scopolamine (bottom) on
the third phase of PPT-evoked striatal dopamine efflux. This figure is adapted from Forster &
Blaha, 2000).
30
A 1st Phase 2nd Phase 3rd PhaseLDT → VTA → Nacc
A 1st Phase 2nd Phase 3rd PhaseLDT → VTA → Nacc
B 1st Phase 2nd Phase 3rd PhasePPT → SN → Striatum
B 1st Phase 2nd Phase 3rd PhasePPT → SN → Striatum
31inhibitory M2-like autoreceptors in the LDT (Leonard & Llinás, 1994). Consistent with this,
LDT infusions of carbachol eliminated spontaneous activity of VTA dopamine neurons (Lodge
& Grace, 2006). Together these data suggest that tonic cholinergic input to the VTA is important
in maintaining the spontaneous baseline activity of dopamine neurons, and emphasize the
importance of understanding the receptors through which tonic cholinergic input is mediated.
PPT inputs are also important in the control of burst firing of VTA dopamine neurons.
Specifically, inactivation of the PPT by combined infusions of the GABAA agonist muscimol
and GABAB antagonist baclofen decreased dopamine neuron burst firing while having no effect
on the number or activity of spontaneously active dopamine neurons. Conversely activation of
the PPT by infusion of the GABAA antagonist bicuculline increased the burst firing of VTA
dopamine neurons (Floresco et al., 2003). This suggests that PPT inputs to the VTA, cholinergic
and/or glutamatergic, are necessary for the transition of dopamine neurons from spontaneous to
burst firing. Behaviourally this is supported by the evidence that the responses of dopamine
neurons to reward-predictive cues are suppressed following reversible PPT inactivation with
lidocaine (Pan & Hyland, 2005).
Finally, electrical stimulation of mesopontine areas elicits treadmill locomotion in
midbrain transected animals (Skinner & Garcia-Rill, 1984). This suggests that mesopontine areas
can activate treadmill locomotion, presumably via their innervation of neurons in the medial
medulla, which in turn innervate spinal cord central pattern generators (Steeves & Jordan, 1980).
Open-field locomotion produced by dopamine activation in nucleus accumbens may in part be
mediated through efferent connections to the PPT. For example, amphetamine-induced
locomotion was blocked by either reversible inactivation of the PPT with procaine (Brudzynski
& Mogenson, 1985) or irreversible ibotenate lesions (Bechara & van der Kooy, 1992). However,
others have since found that PPT ibotenate lesions did not affect locomotion by either systemic
amphetamine (Inglis et al., 1994a; Olmstead & Franklin, 1994) or intra-accumbens injection of
32amphetamine (Inglis, Dunbar, & Winn, 1994b), so on the whole the evidence is mixed, and the
pathways involved are not clearly understood.
A role for the LDT in open-field locomotion is suggested by the fact that lesions reduced
scopolamine- and, albeit only slightly, amphetamine-induced locomotion (Laviolette, Priebe, &
Yeomans, 2000). Furthermore, LDT lesions also blunted the locomotor response to nicotine and
reduced sensitization to nicotine (Alderson, Latimer, & Winn, 2005).
6.2. Arousal
Virtually all PPT, and most LDT, cholinergic neurons innervate the thalamus (Oakman et
al., 1992), which can activate thalamic neurons, particularly those that give rise to
thalamocortical projections, involved in arousing the cortex. For example, application of
acetylcholine to the cat dorsal lateral genicuclate nucleus shift cells from rhythmic burst-firing to
tonic, single-spike firing mode (McCormick, 1992), and the cells are consequently more
responsive to afferent senory input. Ascending cholinergic inputs also critically influence cortical
activation via both their effects on thalamocortical systems and the basal forebrain (Dringenberg
& Olmstead, 2003; Steriade, Datta, Pare, Oakson, & Curro Dossi, 1990). Descending projections
from the PPT and LDT to pontine areas where carbachol induces REM sleep (Baghdoyan,
Rodrigo-Angulo, McCarley, & Hobson, 1984) are thought to be important in the initiation of
REM sleep.
6.3. Superior Colliculus Activation
The intermediate layers of the superior colliculus receive cholinergic input from the PPT.
Analysis of single unit activity in monkey PPT has revealed a population of PPT neurons that
increased their firing rate preceding saccades, suggesting that PPT neurons may be involved in
the execution and preparation of saccades (Kobayashi, Saito, & Isa, 2001). Furthermore, the
cholinergic effects on saccades appear to be mediated through fast nicotinic acetylcholine
receptors in the superior colliculus (Aizawa, Kobayashi, Yamamoto, & Isa, 1999).
337. Muscarinic Receptors and Reward
Several lines of evidence support an important role for muscarinic receptors in reward in
rats. First, local infusion of carbachol infused into the VTA produced conditioned place
preference (Yeomans, Kofman, & McFarlane, 1985). Second, carbachol infusion, particularly in
the posterior VTA supports self-administration in rats, which could be blocked by the muscarinic
antagonist scopolamine and was dopamine-dependent (Ikemoto & Wise, 2002). Third, brain-
stimulation reward (BSR) was attenuated by the cholinergic agonist carbachol in the PPT
(Yeomans, Mathur, & Tampakeras, 1993), produced increases in VTA acetylcholine (Rada,
Mark, Yeomans, & Hoebel, 2000), and was reduced by muscarinic, and to a lesser extent
nicotinic, antagonists in the VTA (Yeomans & Baptista, 1997).
M5 receptors are particularly important in mediating muscarinic effects in BSR. Down-
regulation of M5 receptors by local infusion of M5 DNA antisense oilgonucleotides produced
right-ward shifts in BSR rate-frequency curves over days which returned to baseline upon
removal of the antisense (Yeomans et al., 2000). M5 receptor knockout mice also show reduced
sensitivity to several drugs of abuse including cocaine (Fink-Jensen et al., 2003; Thomsen et al.,
2005), amphetamine (Wang et al., 2004), and morphine (Basile et al., 2002) .
8. Opiate Reward and Dopamine
It is unclear to what extent dopamine output in the nucleus accumbens is necessary for
either the rewarding or locomotor-activating effects of opiates.
Intra-VTA morphine produced conditioned place preference in rats (Bals-Kubik et al.,
1993; Nader & van der Kooy, 1997; Olmstead & Franklin, 1997; Phillips & LePiane, 1980) that
was dependent on VTA opiate receptors (Phillips & LePiane, 1980). Intra-VTA morphine also
supported self-administration (Bozarth & Wise, 1981; David & Cazala, 1994), and caused
circling in rats indicating activation of the mesolimbic dopamine system (Holmes, Bozarth, &
34Wise, 1983). The long-term, continuous infusion of morphine into the VTA, unlike similar
infusion into the periacqueductal gray, did not lead to physical dependence (Bozarth & Wise,
1984). Furthermore, both μ and δ agonists were self-administered into the VTA (Devine & Wise,
1994), as was endomorphin-1, an endogenous ligand with high selectivity for the μ opioid
receptor (Zangen et al., 2002).
These data suggest that opiate receptors in the VTA are a sufficient brain substrate for
mediating the rewarding/reinforcing properties of opiates. Local VTA administration of opiates
increases the firing rate of dopamine neurons (Gysling & Wang, 1983; Matthews & German,
1984). In the VTA both μ, and to a lesser extent κ, opiate receptors are found (Mansour et al.,
1995; 1994; 1987), and infusion of μ-specific, but not κ-specific agonists, produced dose-
dependent increases in nucleus accumbens dopamine (Spanagel et al., 1992). Furthermore, μ
opioid receptor knockout mice show reduced increases in accumbens dopamine produced by
systemic morphine (Chefer, Kieffer, & Shippenberg, 2003). These data suggest that opiates
excite dopamine transmission in the VTA primarily through their action on μ opioid receptors,
which are predominantly associated with non-dopaminergic neurons (Dilts & Kalivas, 1989;
Garzon & Pickel, 2001). A small number of VTA dopamine neurons do, however, express μ
opiate receptors, and μ opioid receptors are also associated with terminals synapsing with both
dopaminergic and GABAergic neurons (Garzon & Pickel, 2001; Svingos, Garzon, Colago, &
Pickel, 2001) suggesting that opiates can also have a direct effect on dopamine neurons or
indirect effects via afferent terminals.
The excitatory effect of opiates on dopamine neurotransmission is attributed to the
disinhibition produced by inhibition of neighboring GABA neurons (Johnson & North, 1992).
Intra-VTA morphine decreases VTA levels of GABA but increases somatodendritic release of
35dopamine (Klitenick, De Witte, & Kalivas, 1992), and non dopaminergic neurons in the VTA are
hyperpolarized by μ-selective agonists (Johnson & North, 1992).
In mice a functional dopamine system is not necessary for the rewarding effects of
morphine. Zhou and Palmiter (1995) created a dopamine-deficient mouse incapable of producing
tyrosin hydroxylase due to two inactive alleles of the tyrosine hydroxylase gene. This mutation
resulted in almost a complete absence of dopamine in the brain, and these mice are severely
hypoactive and hypophagic. In fact, they require daily administration of L-hydroxyphenylalanine
(L-DOPA) to feed and remain alive. Hnasko, Sotak, and Palmiter (2005) showed that these mice
were able to acquire morphine place preference across a range of doses, only requiring dopamine
for the expression of place preference at the lowest dose tested (0.25, 2.5, 2.5, and 25 mg/kg,
i.p.).
According to one theory, the role of mesolimbic dopamine in opiate reward depends on
the animals’ prior experience with the drug (Bechara, Nader, & van der Kooy, 1998).
Specifically, opiate reward is independent of dopamine in drug naïve animals, but dependent on
dopamine in withdrawn/dependent animals (Bechara et al., 1992). Accordingly, systemic
dopamine antagonists blocked the rewarding effects of systemic morphine (Bechara et al., 1992)
as well as intra-VTA morphine (Nader & van der Kooy, 1997) in opiate-dependent, but not
opiate-naïve rats. Similarly, intra-nucleus accumbens dopamine antagonism blocked systemic
morphine place preference in opiate-dependent rats (Laviolette et al., 2002). Consistent with a
dissociation in the role of dopamine according to motivational state, D2 receptor knockout mice
showed normal acquisition of morphine place preference when trained drug-naïve, but did not
acquire morphine place preference when trained in a deprived/withdrawn state (Dockstader et al.,
2001). In opiate naïve animals, on the other hand, the rewarding aspects of opiates are mediated
through the PPT, as lesions of the PPT blocked morphine place preference in drug-naïve, but not
drug-dependent, rats (Bechara et al., 1992). Excitotoxic lesions of the PPT also blocked the
36acquisition of heroin self-administration, while similar lesions in rats already trained to self-
administer heroin had no effect (Olmstead, Munn, Franklin, & Wise, 1998). How the PPT
mediates the rewarding effects of opiates (i.e., via descending or ascending projections) is not
clear. In this regard it has been shown that cholinergic antagonists in the VTA reduced morphine
place preference in drug-naïve rats (Rezayof et al., 2007) and that drug-naïve M5 knockout mice
(Basile et al., 2002) showed strongly reduced morphine place preference. This suggests that
ascending cholinergic activation of dopamine neurons from the PPT may contribute to the
rewarding effects of opiates in drug-naïve animals (see Figure 5).
8.1. Opiate-induced Locomotion in Rats
The hyperlocomotion and stereotypy induced by amphetamine can to some extent be
distinguished in terms of underlying neurobiology. Kelly and colleagues (1975) used 6-
hydroxydopamine lesions of the nucleus accumbens or caudate nucleus in rats to show that the
mesolimbic and nigrostriatal dopamine systems are involved in mediating amphetamine-induced
locomotion and stereotypy, respectively. Accumbens-lesioned rats, but not caudate-lesioned rat,
failed to show the hyperlocomotion normally observed following low doses of amphetamine (1
mg/kg). On the other hand, caudate-lesioned, but not accumbens-lesioned rats, failed to show the
stereotypy normally following high doses of amphetamine (5 mg/kg). Consistent with this
dissociation, Sharp and colleagues (1987) used microdialysis to monitor dopamine release in
striatum and nucleus accumbens following administration of a range of amphetamine doses.
While amphetamine increased dopamine in both brain areas, the intensity of stereotypic behavior
at high doses correlated with the amount of striatal, but not accumbal, dopamine increases, while
increased locomotion at lower doses correlated with the amount and time-course of accumbal,
but not striatal, dopamine increases. Thus, amphetamine-induced locomotion depends on activity
of the mesolimbic dopamine system.
Dopamine dependence of opiate-induced locomotion in rats is, however, more
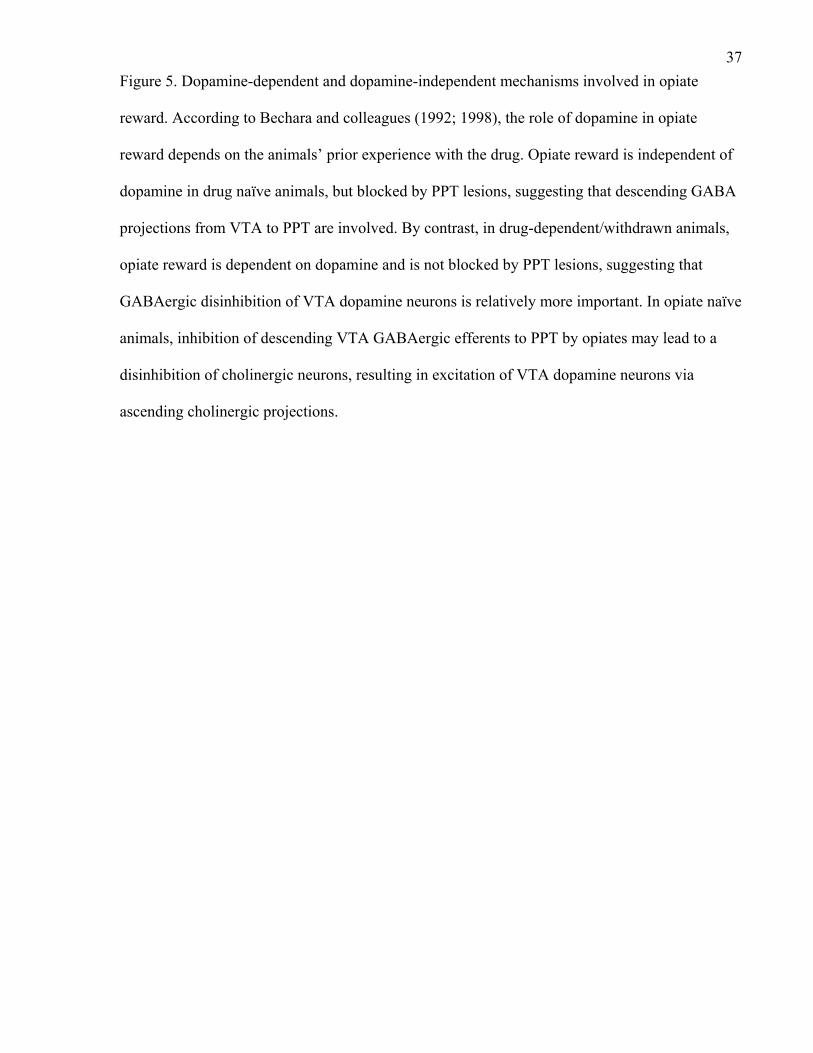
37Figure 5. Dopamine-dependent and dopamine-independent mechanisms involved in opiate
reward. According to Bechara and colleagues (1992; 1998), the role of dopamine in opiate
reward depends on the animals’ prior experience with the drug. Opiate reward is independent of
dopamine in drug naïve animals, but blocked by PPT lesions, suggesting that descending GABA
projections from VTA to PPT are involved. By contrast, in drug-dependent/withdrawn animals,
opiate reward is dependent on dopamine and is not blocked by PPT lesions, suggesting that
GABAergic disinhibition of VTA dopamine neurons is relatively more important. In opiate naïve
animals, inhibition of descending VTA GABAergic efferents to PPT by opiates may lead to a
disinhibition of cholinergic neurons, resulting in excitation of VTA dopamine neurons via
ascending cholinergic projections.
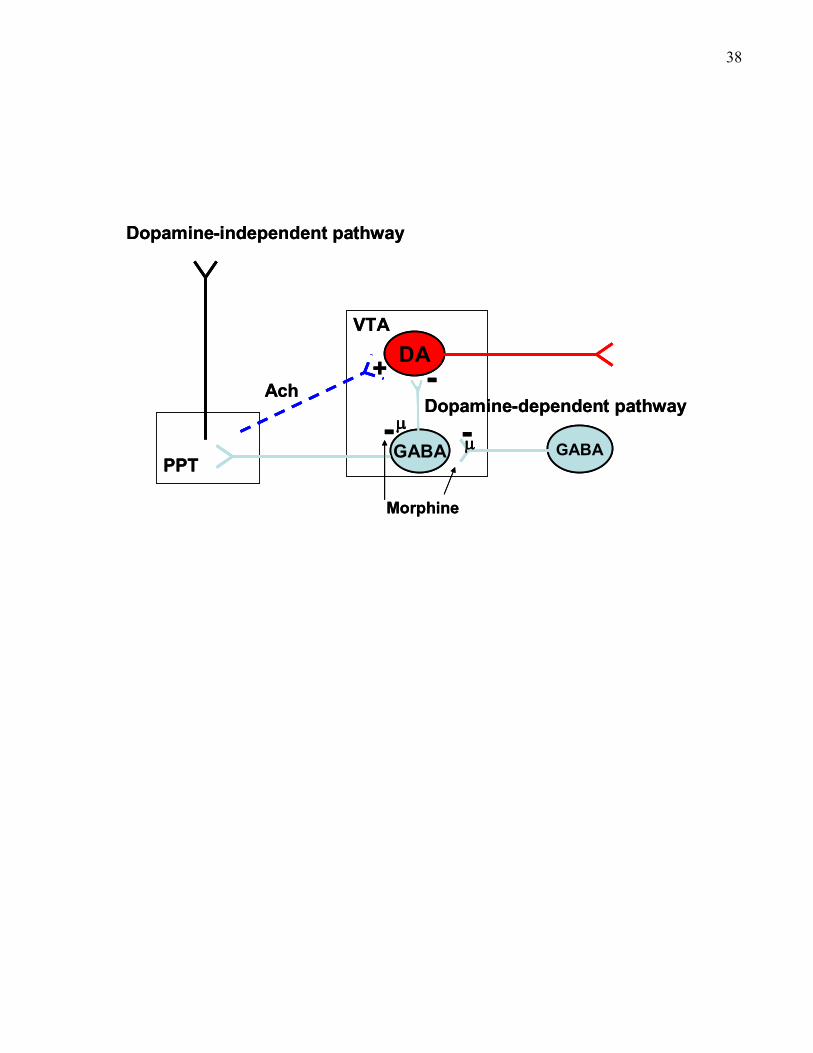
38
DA
GABA GABAPPT
VTA
μμ
Dopamine-independent pathway
- -Dopamine-dependent pathway
Ach
Morphine
-+ DA
GABA GABAPPT
VTA
μμ
Dopamine-independent pathway
- -Dopamine-dependent pathway
Ach -+
Morphine
39controversial. Kalivas and colleagues (1983) proposed the existence of dopamine-dependent and
dopamine-independent neural mechanisms in mediating the stimulant effects of opiates.
Injections of D-Ala2-Met5-enkephalinamide (DALA) into either the ventral tegmental or, to a
lesser extent, the nucleus accumbens induced locomotion. VTA injections increased DOPAC/DA
ratios and locomotion was reduced by nucleus accumbens pre-treatment with the dopamine
antagonist fluphenazine. On the other hand, locomotion induced by DALA injection into the
nucleus accumbens did not change accumbal dopamine levels, and was not reduced by either 6-
OHDA lesions or accumbens pre-treatment with a dopamine antagonist. These data are
consistent with the work by Kelley, Stinus, & Iversen (1980) showing similar VTA effects of
DALA. Therefore, the locomotor response to DALA applied locally in the VTA, but not the
nucleus accumbens, is dependent on mesolimbic dopamine activity.
Arguing for a complete independence from dopamine for systemic opiate-induced
locomotion in rats, Vaccarrino and colleagues (1986) showed that 6-OHDA lesions of the
mesolimbic dopamine system did not affect locomotion induced by systemic heroin, while
strongly attenuating locomotion induced by systemic amphetamine. Moreover, in non-lesioned
rats systemic, pre-treatment with a range of α-flupenthixol doses blocked systemic
amphetamine-induced locomotion, but hardly affected systemic heroin-induced locomotion.
The dopamine-independent component of morphine-induced locomotion involves the
nucleus accumbens, but postsynaptic to dopaminergic terminals, the ventral pallidum, and the
mediodorsal thalamus. A high density of μ, δ, and κ opioid receptors are expressed in the
nucleus accumbens of rats, as assessed by autoradiographic binding of radioactively labeled sub-
type specific ligands in rats and mice (Kitchen, Slowe, Matthes, & Kieffer, 1997; Mansour et al.,
1987). Amalric and Koob (1985) suggest that these forebrain opioid receptors are particularly
critical to the locomotion induced by systemic heroin in rats. Injections of the opioid antagonist
methylnaloxonium into the VTA, where moderate and low levels of μ and κ opioid receptors, are
40found (Mansour et al., 1987), slightly attenuated heroin-induced locomotion. Similar injections
into the nucleus accumbens blocked locomotion induced by systemic heroin.
In the nucleus accumbens, μ opioid receptors are expressed post-synaptically, as 6-
OHDA lesions did not reduce autoradiographic binding of 125I-Tyr-D-Ala-Gly-NMe-Phe-Gly-ol
(DAGO) (Dilts & Kalivas, 1989). Striatal GABAergic medium spiny neurons that project to
pallidal areas use enkephalin as a co-transmitter (Kawaguchi, Wilson, Augood, & Emson, 1995),
suggesting that both GABAergic and enkephalergic inputs from the nucleus accumbens to the
ventral pallidum could be involved in mediating the locomotor activating effects of opioids in the
nucleus accumbens. In support of this, the GABAA antagonist picrotoxin and μ-opioid agonist
DALA in the ventral pallidum both induce locomotion in rats (Austin & Kalivas, 1990). Thus,
opiate effects on μ opioid receptors in the nucleus accumbens could conceivably inhibit
GABAergic projection neurons, which in turn would result in decreased inhibitory GABAergic
input to the ventral pallidum, and thus disinhibition of downstream brainstem targets, inducing
locomotion independent of dopamine. However, while dopamine is not necessary for opiate-
induced locomotion in rats, chronic blockade of dopaminergic transmission by either mesolimbic
6-OHDA lesions (Stinus, Winnock, & Kelley, 1985) or prolonged systemic neuroleptic drugs
(Stinus, Nadaud, Jauregui, & Kelley, 1986) results in supersentivity to locomotion induced by
nucleus accumbens injections of morphine, DALA, or β-endorphin. This suggests that a
functional dopamine system in fact reduces sensivity to nucleus accumbens opiate-induced
locomotion.
While nucleus accumbens injections of opiates induce locomotion that is dopamine
independent and involves the ventral pallidum, locomotion induced by opiate injections locally
into the ventral pallidum is not, strictly speaking, dopamine independent. Autoradiographic
mapping of opioid receptor subtypes has revealed low, but significant, levels of μ, δ, and κ
41subtypes in the globus pallidus of rats (Mansour et al., 1987). Injections of the μ opioid agonists
DAGO or Tyr-D-Ala-Gly-NMePhe-Gly-OH (DAMGO) into the ventral pallidum induced
locomotion (Austin & Kalivas, 1991; Churchill, Austin, & Kalivas, 1992). Interestingly,
systemic haloperidol or nucleus accumbens fluphenazine, which did not significantly disrupt
saline-induced locomotion by themselves (i.e., no debiliatating motor impairments), attenuated
locomotion produced by DAGO injections in the ventral pallidum (Austin & Kalivas, 1991).
DAGO still induced locomotion following pre-treatment with either dopamine antagonist relative
to saline, but was reduced between 30 and 50 %. Furthermore, injections of DAGO into the
ventral pallidum increased levels of dopamine and its metabolites DOPAC and HVA in the
nucleus accumbens, as well as HVA in the prefrontal cortex. This suggests that ventral pallidum
opioid-induced locomotion can, at the least, be modified by dopaminergic manipulations. The
authors provided two possibilities through which this could occur, including the involvement of
direct ventral pallidum projections to either the ventral tegmental area or dopaminergic terminals
in the nucleus accumbens, or most interestingly from the perspective taken in this dissertation,
indirect ventral tegmental area projections via the pedunculopontine tegmental nucleus (Austin
& Kalivas, 1991). They argued in favour of pallidal to accumbens afferents, as feedback
activation of VTA dopamine cell bodies, direct or indirect, should have produced some
somatodendritic dopamine release, which was not observed. Regardless of the mechanism, taken
together the data suggest some role for dopamine in locomotion evoked by ventral pallidal
manipulations, but the fact that complete destruction of dopaminergic terminals in the nucleus
accumbens failed to antagonize locomotion induced by ventral pallidum injections of DAMGO
(Churchill et al., 1992) argues that dopamine is certainly not necessary.
Injections of the μ opioid receptor agonist DAMGO into the mediodorsal thalamus, a
major efferent target of the ventral pallidum (Vives & Mogenson, 1985; Young, Alheid, &
Heimer, 1984), also induced locomotion (Klitenick & Kalivas, 1994) that appeared to be
42independent from dopamine. First, DAMGO injections in the mediodorsal thalamus did not
increase nucleus accumbens dopamine, as assessed by measurement of DOPAC and HVA
metabolites. Second, systemic pre-treatment with haloperidol only very slightly reduced
locomotion induced by intra-mediodorsal thalamus DAMGO. Third, directly inhibiting ventral
tegmental area dopamine cell bodies by local injection of the GABAB agonist baclofen (Lacey et
al., 1988) did not significantly reduce locomotion (Klitenick and Kalivas, 1994).
With regards to dopamine-dependent opioid-induced locomotion, Kalivas and colleagues
have shown that injections of DALA and DAMGO into either the ventral tegmental area
(Kalivas et al., 1983) or the pedunculopontine tegmental nucleus (Klitenick & Kalivas, 1994)
induced dopamine-dependent locomotion. In the case of the VTA, DALA injections dose-
dependently induced locomotion that was blocked by pre-treatment with naloxone. Furthermore,
DALA injections in the VTA increased nucleus accumbens and striatum levels of DOPAC, as
well as the DA/DOPAC ratio. Finally, the locomotion induced by VTA DALA injection was
antagonized by nucleus accumbens pre-treatment with fluphenazine (Kalivas et al., 1983).
In the case of the PPT, local DAMGO administration also dose-dependently induced
locomotion that was blocked by systemic naloxone pre-treatment. PPT DAMGO injections also
increased extracellular dopamine concentrations in the nucleus accumbens, and locomotion was
antagonized by systemic haloperidol pre-treatment. Furthermore, inhibition of VTA dopamine
neurons by baclofen (Lacey, Mercuri, & North, 1988) antagonized locomotion, albeit to a lesser
extent (approximately 80% and 40% for haloperidol and baclofen, respectively). Thus,
locomotion induced by PPT injections of DAMGO appeared to require the mesolimbic dopamine
system (Klitenick & Kalivas, 1994). The most interesting question then is how μ opioid
injections in the PPT or VTA activate the mesolimbic dopamine system. As discussed earlier, in
the rat the PPT sends a strong ipsilateral projection to the substantia nigra pars compacta and the
more caudal portions of this nucleus bilaterally project to the VTA (Oakman et al., 1995). In the
43study by Klitenick and Kalivas (1994), the majority of DAMGO injection sites were on the
posteriolateral border of the superior cerebellar peduncle, a region roughly corresponding to the
PPT pars compacta, the lateral portion of the caudal two-thirds of the PPT (Steininger et al.,
1997). This suggests that the activation of the mesolimbic dopamine system and the locomotion
due to PPT DAMGO injections may have been due to cholinergic activation of VTA dopamine
neurons. The relative contribution of muscarinic and nicotinic in mediating cholinergic input to
systemic morphine-induced locomotion in mice will be assessed in Chapter 2.
8.2. Opiate-induced Locomotion in Mice
In mice, the relation between opiate-induced locomotion and accumbal dopamine levels
was recently addressed by Murphy, Lam, and Maidment (2001). In their study, microdialysis
was used to measure nucleus accumbens dopamine in response to systemic morphine (3 mg/kg,
s.c.) concurrently with locomotion. C57Bl/6 mice were more responsive than 129Sv mice and
DBA2 mice to the locomotor effects of morphine. In fact, DBA2 mice showed hardly any
locomotion in response to morphine. While all three strains show significant morphine-induced
elevations in ventral striatal dopamine levels relative to saline, C57Bl/6 mice show the largest
increases in ventral striatal dopamine levels. Furthermore, a comparison of the two temporal
profiles showed very clearly that variations in each of the parameters were related to one another,
and this was particularly clear in the more responsive C57Bl/6 mice. While this tentatively
suggested some relation between morphine-induced locomotion and accumbal dopamine levels,
a correlational analysis comparing peak and/or absolute locomotor levels across the three hour
testing period to peak and or/absolute dopamine levels was not significant.
Hnasko et al. (2005) tested systemic morphine-induced locomotion in dopamine deficient
mice across a range of doses (0.25, 2.5, 12.5, and 25 mg/kg, i.p.), showing that only the highest
dose tested (25 mg/kg) induced a little locomotion, reaching approximately 5% of controls, while
the other doses induced no locomotion. Pre-treating the dopamine deficient mice with a single
44dose of L-DOPA (30 mg/kg, i.p.) one hour prior to testing morphine-induced locomotion
restored locomotor responses to both the 12.5 and 25 mg/kg dose of morphine. Amphetamine
pre-treatment (3 mg/kg, i.p.), which should have purged any residual dopamine from terminals in
the dopamine-deficient mice, did not affect the small residual morphine locomotion that
remained. These data make a strong argument for dopamine dependence of morphine-induced
locomotion in mice, revealing that the non-dopamine component is smaller. However, these mice
are dopamine-deficient in their entire brains (Zhou & Palmiter, 1995), so it is unclear whether
the rescue of morphine-induced locomotion by L-DOPA pre-treatment was due to restoration of
dopamine somewhere other than the mesolimbic terminals in the nucleus accumbens.
9. Objectives of the current thesis
The PPT is important for morphine-reward in drug-naïve rats, but accomplishes this role
through non-dopaminergic means (Bechara et al., 1998). At the same time, increases in
dopamine produced by systemic opiates in drug-naïve rats critically depend on the PPT and
LDT. Lesions of the PPT (Miller et al., 2002) or LDT (Forster et al., 2002) in rats reduced
striatal and accumbal dopamine increases, respectively, in response to intravenous morphine by
approximately 80%. A role for muscarinic receptors in VTA and SN is suggested by the fact that
pre-treatment with scopolamine reduced accumbal dopamine increases by approximately 60%,
while completely blocking striatal dopamine increases in rats (Miller et al., 2005). Injection of μ-
opioid agonists in the PPT also produced dopamine-dependent locomotion (Klitenick & Kalivas,
1994) in rats, suggesting that cholinergic activation of the mesolimbic dopamine system may be
important in mediating locomotion produced by systemic opiates. M5 receptors have already
been shown to play an important role in activating the mesolimbic dopamine system in mice
(Forster et al., 2001), and M5 receptor knockout mice showed reduced accumbens dopamine
release in reponse to systemic morphine (Basile et al., 2002).
45 The goal of this thesis was to provide a better understanding of the role of M5 receptors
in morphine-induced locomotion and dopamine activation. The first objective was to test the role
of M5 muscarinic receptors in systemic morphine-induced locomotion through a combination of
gene knockout mice and pharmacology. Here it was hypothesized that if cholinergic input to the
VTA is important for the acute effects of morphine on dopamine, then M5 knockout mice should
show a reduction in morphine-induced locomotion. Further, pharmacological blockade of VTA
muscarinic receptors in wild-type mice should similarly reduce morphine-induced locomotion.
Second, to relate the hypothesized reduction in morphine-induced locomotion to dopamine,
morphine-induced dopamine release in response to intra-VTA morphine administration was
compared between wild-type and M5 knockout mice using chronoamperometry. Third, to test
whether changes in opiate-induced dopamine release due to M5 were functionally related to
morphine-induced reward, as suggested by Basile et al. (2002), morphine conditioned place
preference was tested in M5 knockout mice .
46References
Amalric, M. & Koob, G.F. (1985). Low doses of methylnaloxonium in the nucleus accumbens
antagonize hyperactivity induced by heroin in the rat. Pharmacology Biochemistry and
Behavior, 23, 411-415.
Acquas, E., & Di Chiara, G. (1994). D1 receptor blockade stereospecifically impairs the
acquisition of drug-conditioned place preference and place aversion. Behavioral
Pharmacology, 5, 555-569.
Aizawa, H., Kobayashi, Y., Yamamoto, M., & Isa, T. (1999). Injection of nicotine into the
superior colliculus facilitates occurrence of express saccades in monkeys. Journal of
Neurophysiology, 82, 1642-2646.
Alderson, H. L., Latimer, M. P., & Winn, P. (2005). Involvement of the laterodorsal tegmental
nucleus in the locomotor response to repeated nicotine administration. Neuroscience
Letters, 380, 335-339.
Austin, M.C., & Kalivas, P.W. (1990). Dopaminergic involvement in locomotion elicited from
the ventral pallidum/substantia innominata. Brain Research, 542, 123-131.
Babbini, M., & Davis, W. M. (1972). Time-dose relationships for locomotor activity effects of
morphine after acute or repeated treatment. British Journal of Pharmacology, 46, 213-
224.
Baghdoyan, H.A., Rodrigo-Angulo, M.L., McCarley, R.W., & Hobson, J.A. (1984). Site-specific
enhancement and suppression of desynchronized sleep signs following cholinergic
stimulation of three brainstem regions. Brain Research, 306, 39-52.
Bals-Kubik, R., Ableitner, A., Herz, A., & Shippenberg, T. S. (1993). Neuroanatomical sites
mediating the motivational effects of opioids as mapped by the conditioned place
preference paradigm in rats. Journal of Pharmacology and Experimental Therapeutics,
264, 489-495.
47Bals-Kubik, R., Herz, A., & Shippenberg, T. (1989). Evidence that the aversive effects of opioid
antagonists and kappa-agonists are centrally mediated. Psychopharmacology, 98, 203-
206.
Bals-Kubik, R., Shippenberg, T., & Herz, A. (1990). Involvement of central mu and delta opioid
receptors in mediating the reinforcing effects of beta-endorphin in the rat. European
Journal of Pharmacology, 175, 63-69.
Basile, A. S., Fedorova, I., Zapata, A., Liu, X., Shippenberg, T., Duttaroy, A., Yamada, M., &
Wess, J. (2002). Deletion of the M5 muscarinic acetylcholine receptor attenuates
morphine reinforcement and withdrawal but not morphine analgesia. Proceedings of the
National Academy of Sciences U S A, 99, 11452-11457.
Bayer, V.E., & Pickel, V.M. (1991). GABA-labeled terminals form proportionally more
synapses with dopaminergic neurons containing low densities of tyrosine hydroxylase-
immunoreactivity in rat ventral tegmental area. Brain Research, 559, 44-55.
Bechara, A., Harrington, F., Nader, K., & van der Kooy, D. (1992). Neurobiology of motivation:
Double dissociation of two motivational mechanisms mediating opiate reward in drug-
naive versus drug-dependent animals. Behavioural Neuroscience, 106, 798-807.
Bechara, A., Nader, K., & van der Kooy, D. (1998). A two-separate-motivational-systems
hypothesis of opioid addiction. Pharmacology Biochemistry and Behavior, 59, 1-17.
Bechara, A., & van der Kooy, D. (1992). Lesions of the tegmental pedunculopontine nucleus:
Effects on the locomotor activity induced by morphine and amphetamine. Pharmacology
Biochemistry and Behavior, 42, 9-18.
Bernard, V., Normand, E., & Bloch, B. (1992). Phenotypical characterization of the rat striatal
neurons expressing muscarinic receptor genes. Journal of Neuroscience, 12, 3591-3600.
48Bevan, M. D., & Bolam, J. P. (1995). Cholinergic, GABAergic, and glutamate-enriched inputs
from the mesopontine tegmentum to the subthalamic nucleus in the rat. Journal of
Neuroscience, 15, 7105-7120.
Bolam, J.P., Francis, C.M., Henderson, Z. (1991). Cholinergic input to dopaminergic neurons in
the substantia nigra: a double immunocytochemical study. Neuroscience, 41, 483-494.
Bonner, T.I., Young, A.C., Brann, M.R., & Buckley, N.J. (1989). Identification of a family of
muscarinic acetylcholine receptor genes. Science, 237, 527-532.
Bonner, T.I., Young, A.C., Brann, M.R., & Buckley, N.J. (1988). Cloning and expression of the
human and rat m5 muscarinic acetylcholine receptor genes. Neuron, 1, 403-410.
Bozarth, M. A., & Wise, R. A. (1981). Intracranial self-administration of morphine into the
ventral tegmental area in rats. Life Sciences, 28, 551-555.
Bozarth, M. A., & Wise, R. A. (1984). Anatomically distinct opiate receptor fields mediate
reward and physical dependence. Science, 224, 516-517.
Brudzynski, S. M., & Mogenson, G. J. (1985). Association of the mesencephalic locomotor
region with locomotor activity induced by injections of amphetamine into the nucleus
accumbens. Brain Research, 334, 77-84.
Buckley, N. J., Bonner, T. I., & Brann, M. R. (1988). Localization of a family of muscarinic
receptor mrnas in rat brain. Journal of Neuroscience, 8, 4646-4652.
Caine, S.B., & Koob, G.F. (1994a). Effects of mesolimbic dopamine depletion on responding
maintained by cocaine and food. Journal of Experimental Analysis of Behavior, 61, 213-
221.
Caine. S.B., & Koob, G.F. (1994b). Effects of dopamine D-1 and D-2 antagonists on cocaine
self-administration under different schedules of reinforcement in the rat. Journal of
Pharmacology and Experimental Therapeutics, 270, 209-218.
49Carlezon, W. A., Jr., & Wise, R. A. (1993). Phencyclidine-induced potentiation of brain
stimulation reward: Acute effects are not altered by repeated administration.
Psychopharmacology, 111, 402-408.
Carli, M., Evenden, J. L., & Robbins, T. W. (1985). Depletion of unilateral striatal dopamine
impairs initiation of contralateral actions and not sensory attention. Nature, 313, 679-682.
Chang, H. T. (1988). Dopamine-acetylcholine interaction in the rat striatum: A dual-labeling
immunocytochemical study. Brain Research Bulletin, 21, 295-304.
Charara, A., Smith, Y., & Parent, A. (1996). Glutamatergic inputs from the pedunculopontine
tegmental nucleus to midbrain dopaminergic neurons in primates: phaseolus vulgaris-
leucoagglutinin anterograde labeling combined with postembedding glutamate and
GABA immunohistochemistry. Journal of Comparative Neurology, 364, 254-266
Charpantier, E., Barneoud, P., Moser, P., Besnard, F., & Sgard, F. (1998). Nicotinic
acetylcholine subunit mRNA expression in dopaminergic neurons of the rat substantia
nigra and ventral tegmental area. Neuroreport, 9, 3097-3101.
Chefer, V. I., Kieffer, B. L., & Shippenberg, T. S. (2003). Basal and morphine-evoked
dopaminergic neurotransmission in the nucleus accumbens of mor- and dor-knockout
mice. European Journal of Neuroscience, 18, 1915-1922.
Churchill, L., Austin, M. C., & Kalivas, P. W. (1992). Dopamine and endogenous opioid
regulation of picrotoxin-induced locomotion in the ventral pallidum after dopamine
depletion in the nucleus accumbens. Psychopharmacology, 108, 141-146.
Clarke, P.B.S., Hommer, D.W., Pert, A., & Skirboll, L.R., (1987). Innervation of substantia nigra
neurons by cholinergic afferents from pedunculopontine nucleus in the rat:
neuroanatomical and electrophysiological evidence. Neuroscience, 23, 1011-1019.
David, V., & Cazala, P. (1994). A comparative study of self-administration of morphine into the
50amygdala and the ventral tegmental area in mice. Behavioral Brain Research, 65, 205-
211.
Devine, D. P., & Wise, R. A. (1994). Self-administration of morphine, DAMGO, and DPDPE
into the ventral tegmental area of rats. Journal of Neuroscience, 14, 1978-1984.
Dilts, R. P., & Kalivas, P. W. (1989). Autoradiographic localization of mu-opioid and
neurotensin receptors within the mesolimbic dopamine system. Brain Research, 488,
311-327.
Dockstader, C. L., Rubinstein, M., Grandy, D. K., Low, M. J., & van der Kooy, D. (2001). The
D2 receptor is critical in mediating opiate motivation only in opiate-dependent and
withdrawn mice. European Journal of Neuroscience, 13, 995-1001.
Dringenberg, H.C., & Olmstead, H.C. (2003). Integrated contributions of basal forebrain and
thalamus to neocortical activation elicited by pedunculopontine tegmental stimulation in
urethane-anesthetized rats. Neuroscience, 119, 839-853.
Eglen, R. M., & Nahorski, S. R. (2000). The muscarinic m(5) receptor: A silent or emerging
subtype? British Journal of Pharmacology, 130, 13-21.
Ettenberg, A., Pettit, H. O., Bloom, F. E., & Koob, G. F. (1982). Heroin and cocaine intravenous
self-administration in rats: Mediation by separate neural systems. Psychopharmacology,
78, 204-209.
Evans, C. J., Keith, D. E., Jr., Morrison, H., Magendzo, K., & Edwards, R. H. (1992). Cloning of
a delta opioid receptor by functional expression. Science, 258, 1952-1955.
Fallon, J. H., & Moore, R. Y. (1978). Catecholamine innervation of the basal forebrain. IV.
Topography of the dopamine projection to the basal forebrain and neostriatum. Journal of
Comparative Neurology, 180, 545-580.
Fields, H.L. (1993). Brainstem mechanism of pain modulation. In A. Herz (Ed.) Opioids II,
Handbook of Experimental Pharmacology, Vol. 104. New York: Springer.
51Fink-Jensen, A., Fedorova, I., Wortwein, G., Woldbye, D. P., Rasmussen, T., Thomsen, M.,
Bolwig, T.G., Knitowski, K.M., McKinzie, D.L., Yamada, M., Wess, J., & Basile, A.
(2003). Role for M5 muscarinic acetylcholine receptors in cocaine addiction. Journal of
Neuroscience Research, 74, 91-96.
Floresco, S. B., West, A. R., Ash, B., Moore, H., & Grace, A. A. (2003). Afferent modulation of
dopamine neuron firing differentially regulates tonic and phasic dopamine transmission.
Nature Neuroscience, 6, 968-973.
Ford, B., Holmes, C.J., Mainville, L., & Jones, B.E. (1995). GABAergic neurons in the rat
pontomesencephalic tegmentum: codistribution with cholinergic and other tegmental
neurons projecting to the posterior lateral hypothalamus. Journal of Comparative
Neurology, 36, 177-196.
Forster, G. L., & Blaha, C. D. (2000). Laterodorsal tegmental stimulation elicits dopamine efflux
in the rat nucleus accumbens by activation of acetylcholine and glutamate receptors in the
ventral tegmental area. European Journal of Neuroscience, 12, 3596-3604.
Forster, G. L., & Blaha, C. D. (2003). Pedunculopontine tegmental stimulation evokes striatal
dopamine efflux by activation of acetylcholine and glutamate receptors in the midbrain
and pons of the rat. European Journal of Neuroscience, 17, 751-762.
Forster, G.L., Falcon, A.J., Miller, A.D., Heruc, G.A., & Blaha, C.D. (2002). Effects of
laterodorsal tegmentum lesions on behavioral and dopamine responses evoked by
morphine and d-amphetamine. Neuroscience, 114, 817-823.
Forster, G.L. Yeomans, J.S., Takeuchi, J., & Blaha, C.D. (2001). M5 muscarinic receptors are
required for prolonged accumbal dopamine release after electrical stimulation of the pons
in mice. Journal of Neuroscience, 22, RC190.
52Fouriezos, G., Hansson, P., & Wise, R. A. (1978). Neuroleptic-induced attenuation of brain
stimulation reward in rats. Journal of Comparative and Physiological Psychology, 92,
661-671.
Fouriezos, G., & Wise, R. A. (1976). Pimozide-induced extinction of intracranial self-
stimulation: Response patterns rule out motor or performance deficits. Brain Research,
103, 377-380.
Frey, K. A., & Howland, M. M. (1992). Quantitative autoradiography of muscarinic cholinergic
receptor binding in the rat brain: Distinction of receptor subtypes in antagonist
competition assays. Journal of Pharmacology and Experimental Therapeutics, 263,
1391-1400.
Futami, T., Takakusaki, K., & Tikai, S.T. (1995). Glutamatergic and cholinergic inputs from
pedunculopontine tegmental nucleus to dopamine neurons in the substantia nigra pars
compacta. Neuroscience Research, 21, 331-342.
Gallistel, C. R., Boytim, M., Gomita, Y., & Klebanoff, L. (1982). Does pimozide block the
reinforcing effect of brain stimulation? Pharmacology Biochemistry and Behavior, 17,
769-781.
Garzon, M., & Pickel, V. M. (2001). Plasmalemmal mu-opioid receptor distribution mainly in
nondopaminergic neurons in the rat ventral tegmental area. Synapse, 41, 311-328.
Gerber, D. J., Sotnikova, T. D., Gainetdinov, R. R., Huang, S. Y., Caron, M. G., & Tonegawa, S.
(2001). Hyperactivity, elevated dopaminergic transmission, and response to amphetamine
in m1 muscarinic acetylcholine receptor-deficient mice. Proceedings of the National
Academy of Sciences U S A, 98, 15312-15317.
Goeders, N. E., Lane, J. D., & Smith, J. E. (1984). Self-administration of methionine enkephalin
into the nucleus accumbens. Pharmacology Biochemistry and Behavior, 20, 451-455.
53Gotti, C., Fornasari, D., & Clementi, F. (1997). Human neuronal nicotinic receptors. Progress in
Neurobiology, 53, 199-237.
Grace, A. A. (1991). Phasic versus tonic dopamine release and the modulation of dopamine
system responsivity: A hypothesis for the etiology of schizophrenia. Neuroscience, 41, 1-
24.
Grace, A. A., & Bunney, B. S. (1983). Intracellular and extracellular electrophysiology of nigral
dopaminergic neurons--II. Action potential generating mechanisms and morphological
correlates. Neuroscience, 10, 317-331.
Grace, A. A., & Bunney, B. S. (1984). The control of firing pattern in nigral dopamine neurons:
Burst firing. Journal of Neuroscience, 4, 2877-2890.
Grillner, P., Berretta, N., Bernardi, G., Svensson, T. H., & Mercuri, N. B. (2000). Muscarinic
receptors depress GABAergic synaptic transmission in rat midbrain dopamine neurons.
Neuroscience, 96, 299-307.
Gysling, K., & Wang, R. Y. (1983). Morphine-induced activation of A10 dopamine neurons in
the rat. Brain Research, 277, 119-127.
Harteneck, C., Plant, T. D., & Schultz, G. (2000). From worm to man: Three subfamilies of trp
channels. Trends in Neuroscience, 23, 159-166.
Hersch, S. M., Gutekunst, C. A., Rees, H. D., Heilman, C. J., & Levey, A. I. (1994). Distribution
of m1-m4 muscarinic receptor proteins in the rat striatum: Light and electron microscopic
immunocytochemistry using subtype-specific antibodies. Journal of Neuroscience, 14,
3351-3363.
Hikosaka, O., & Wurtz, R.H. (1983). Visual and oculomotor functions of monkey substantia
nigra pars reticulata. IV. Relation of substantia nigra to superior colliculus. Journal of
Neurophysiology, 49, 1285-1301.
54Hnasko, T.S., Sotak, B.N. & Palmiter, R.D. (2005). Morphine reward in dopamine-deficient
mice. Nature, 43, 854-857.
Holmes, L. J., Bozarth, M. A., & Wise, R. A. (1983). Circling from intracranial morphine
applied to the ventral tegmental area in rats. Brain Research Bulletin, 11, 295-298.
Honda, T., & Semba, K. (1995). An ultrastructural study of cholinergic and non-cholinergic
neurons in the laterodorsal and pedunculopontine tegmental nuclei in the rat.
Neuroscience, 68, 837-853.
Hopkins, D.A., & Holstege, G. (1978). Amygdaloid projections to the mesencephalon, pons, and
medulla oblongata in the cat. Experimental Brain Research, 32, 529-547.
Hughes, J., Smith, T.W., Kosterlitz, H.W., Fothergill, L.A., Morgan, B.A., & Morris, H.R.
(1975). Identification of two related pentapeptides from the brain with potent opiate
agonist activity. Nature, 258, 577-580.
Ikemoto, S., & Wise, R. A. (2002). Rewarding effects of the cholinergic agents carbachol and
neostigmine in the posterior ventral tegmental area. Journal of Neuroscience, 22, 9895-
9904.
Izzo, P.N., & Bolam. J.P. (1988). Cholinergic synaptic input to different parts of spiny
striatonigral neurons in the rat. Journal of Comparative Neurology, 269, 219-234.
Inglis, W. L., Allen, L. F., Whitelaw, R. B., Latimer, M. P., Brace, H. M., & Winn, P. (1994a).
An investigation into the role of the pedunculopontine tegmental nucleus in the mediation
of locomotion and orofacial stereotypy induced by d-amphetamine and apomorphine in
the rat. Neuroscience, 58, 817-833.
Inglis, W. L., Dunbar, J. S., & Winn, P. (1994b). Outflow from the nucleus accumbens to the
pedunculopontine tegmental nucleus: A dissociation between locomotor activity and the
acquisition of responding for conditioned reinforcement stimulated by d-amphetamine.
Neuroscience, 62, 51-64.
55Inglis, W. L., & Winn, P. (1995). The pedunculopontine tegmental nucleus: Where the striatum
meets the reticular formation. Progress in Neurobiology, 47, 1-29.
Johnson, M.P., Conarty, P.E., & Nichols, D.E. (1991). 3[H]monoamine releasing and uptake
inhibition properties of 3,4-methylenedioxymethamphetamine and p-chloroamphetamine
analogues. European Journal of Pharmacology, 200, 9–16.
Johnson, S. W., & North, R. A. (1992). Opioids excite dopamine neurons by hyperpolarization of
local interneurons. Journal of Neuroscience, 12, 483-488.
Jones, B.E., & Cuello, A.C. (1989). Afferents to the basal forebrain cholinergic cell area from
pontomesencephalic catecholamine, serotonin, and acetylcholine neurons. Neuroscience,
31, 37-61.
Jones, S., Sudweeks, S., & Yakel, J.L. (1999). Nicotinic receptors in the brain: correlating
physiology with function. Trends in Neuroscience, 22, 555-561.
Jones, I. W., & Wonnacott, S. (2004). Precise localization of alpha7 nicotinic acetylcholine
receptors on glutamatergic axon terminals in the rat ventral tegmental area. Journal of
Neuroscience, 24, 11244-11252.
Kalivas, P.W. (1993). Neurotransmitter regulation of dopamine neurons in the ventral tegmental
area. Brain Research Reviews, 18, 75-113.
Kalivas, P.W., Widerlöv. E., Stanley, D., Breese, G., & Prange, A.J. Jr. (1983). Enkephalin
action on the mesolimbic dopamine system: a dopamine-dependent and dopamine-
independent increase in locomotor activity. Journal of Pharmacology and Experimental
Therapeutics, 227, 229-237.
Kawaguchi, Y., Wilson, C. J., Augood, S. J., & Emson, P. C. (1995). Striatal interneurones:
Chemical, physiological and morphological characterization. Trends in Neuroscience, 18,
527-535.
56Khachaturian, H., Schaefer, M.K.H., Lewis, M.E. (1993). Anatomy and function of the
endogenous opioid systems. In A. Herz (Ed.) Opioids I, Handbook of Experimental
Pharmacology, Vol 104. New York: Springer.
Kelley, A.E., Stinus, L., & Iversen, S.D. (1980). Interactions between D-Ala-Met-enkephalin,
A10 dopaminergic neurons, and spontaneous behavior in the rat. Behavioral Brain
Research, 1, 3-24.
Kelly, P. H., Seviour, P. W., & Iversen, S. D. (1975). Amphetamine and apomorphine responses
in the rat following 6-OHDA lesions of the nucleus accumbens septi and corpus striatum.
Brain Research, 94, 507-522.
Kitchen, I., Slowe, S. J., Matthes, H. W., & Kieffer, B. (1997). Quantitative autoradiographic
mapping of mu-, delta- and kappa-opioid receptors in knockout mice lacking the mu-
opioid receptor gene. Brain Research, 778, 73-88.
Klink, R., de Kerchove d'Exaerde, A., Zoli, M., & Changeux, J. P. (2001). Molecular and
physiological diversity of nicotinic acetylcholine receptors in the midbrain dopaminergic
nuclei. Journal of Neuroscience, 21, 1452-1463.
Klitenick, M.A., & Kalivas, P.W. (1994). Behavioral and neurochemical studies of opioid effects
in the pedunculopontine nucleus and mediodorsal thalamus. Journal of Pharmacology
and Experimental Therapeutics, 269, 437-448.
Klitenick, M. A., DeWitte, P., & Kalivas, P. W. (1992). Regulation of somatodendritic dopamine
release in the ventral tegmental area by opioids and GABA: An in vivo microdialysis
study. Journal of Neuroscience, 12, 2623-2632.
Kobayashi, Y., Saito, Y., & Isa, T. (2001). Facilitation of saccade initiation by brainstem
cholinergic system. Brain Development, 23, S24-S27.
57Kubota, Y., Inagaki, S., Shimada, S., Kito, S., Eckenstein, F., & Tohyama, M. (1987).
Neostriatal cholinergic neurons receive direct synaptic inputs from dopaminergic axons.
Brain Research, 413, 179-184.
Lacey, M. G., Mercuri, N. B., & North, R. A. (1988). On the potassium conductance increase
activated by GABAb and dopamine D2 receptors in rat substantia nigra neurones.
Journal of Physiology, 401, 437-453.
Laviolette, S. R., Nader, K., & van der Kooy, D. (2002). Motivational state determines the
functional role of the mesolimbic dopamine system in the mediation of opiate reward
processes. Behavioral Brain Research, 129, 17-29.
Laviolette, S. R., Priebe, R. P., & Yeomans, J. S. (2000). Role of the laterodorsal tegmental
nucleus in scopolamine- and amphetamine-induced locomotion and stereotypy.
Pharmacology Biochemistry and Behavior, 65, 163-174.
Laviolette, S. R., & van der Kooy, D. (2003). Blockade of mesolimbic dopamine transmission
dramatically increases sensitivity to the rewarding effects of nicotine in the ventral
tegmental area. Molecular Psychiatry, 8, 50-59.
Lee, J. R. and M. R. Fennessy (1976). Effects of morphine on brain histamine, antinociception
and activity in mice. Clinical and Experimental Pharmacology and Physiology, 3, 179-
189.
Leone, P., & Di Chiara, G. (1987). Blockade of D-1 receptors by SCH 23390 antagonizes
morphine- and amphetamine-induced place preference conditioning. European Journal of
Pharmacology, 135, 251-254.
Leonard, C.S., & Llinás (1994). Serotonergic and cholinergic inhibition of mesopontine
cholinergic neurons controlling REM sleep: an in vitro electrophysiological study.
Neuroscience, 59, 309-330.
58Levey, A.I. (1993). Immunological localization of m1-m5 muscarinic acetylcholine receptors in
peripheral tissues and brain. Life Sciences, 52, 441-448.
Levey, A. I., Kitt, C. A., Simonds, W. F., Price, D. L., & Brann, M. R. (1991). Identification and
localization of muscarinic acetylcholine receptor proteins in brain with subtype-specific
antibodies. Journal of Neuroscience, 11, 3218-3226.
Lodge, D. J., & Grace, A. A. (2006). The laterodorsal tegmentum is essential for burst firing of
ventral tegmental area dopamine neurons. Proceedings of the National Academy of
Science U S A, 103, 5167-5172.
Loh, H.H., Liu. H.C., Cavalli, A., Yang, W., Chen, Y.F., & Wei. L.N. (1998). Mu opioid
receptor knockout in mice: effects on ligand-induced analgesia and morphine lethality.
Molecular Brain Research, 54, 321-326.
Lyness, W. H., Friedle, N. M., & Moore, K. E. (1979). Destruction of dopaminergic nerve
terminals in nucleus accumbens: Effect on d-amphetamine self-administration.
Pharmacology Biochemistry and Behavior, 11, 553-556.
Mansour, A., Fox, C. A., Akil, H., & Watson, S. J. (1995). Opioid-receptor mRNA expression in
the rat CNS: Anatomical and functional implications. Trends in Neuroscience, 18, 22-29.
Mansour, A., Fox, C. A., Burke, S., Meng, F., Thompson, R. C., Akil, H., et al. (1994). Mu,
delta, and kappa opioid receptor mRNA expression in the rat CNS: An in situ
hybridization study. Journal of Comparative Neurology, 350, 412-438.
Mansour, A., Khachaturian, H., Lewis, M. E., Akil, H., & Watson, S. J. (1987).
Autoradiographic differentiation of mu, delta, and kappa opioid receptors in the rat
forebrain and midbrain. Journal of Neuroscience, 7, 2445-2464.
Maskos, U., Molles, B.E., Pons, S., Besson, M., Guiard, B.P., Guilloux, J.P., Evrard, A., Cazala.
P., Cormier, A., Mameli-Engvall, M., Dufour, N., Cloez-Tayarani, I., Bemelmans, A.P.,
Mallet, J., Gardier, A.M., David, V., Faure, P., Granon, S., Changeux, J.P. (2005).
59Nicotine reinforcement and cognition restored by targeted expression of nicotinic
receptors. Nature, 436, 103-107.
Matthes, H.W., Maldonado, R., Simonin, F., Valverde, O., Slowe, S., Kitchen, I., Befort, K.,
Dierich, A., Le Meur, M., Dollé, P., Tzavara, E., Hanoune, J., Roques, B.P., & Kieffer,
B.L. (1996). Loss of morphine-induced analgesia, reward effect and withdrawal
symptoms in mice lacking the mu-opioid-receptor gene. Nature, 383, 819-823.
Matthews, R. T., & German, D. C. (1984). Electrophysiological evidence for excitation of rat
ventral tegmental area dopamine neurons by morphine. Neuroscience, 11, 617-625.
McCormick, D.A. (1992). Neurotransmitter actions in the thalamus and cerebral cortex and their
role in neuromodulation of thalamocortical activity. Progress in Neurobiology, 39, 337-
388.
McGehee, D.S., & Role, L.W. (1995). Physiological diversity of nicotinic acetylcholine
receptors expressed in vertebrate neurons. Annual Review of Physiology, 57, 521-546.
Mesulam M.M., Mufson, E. J., Wainer, B. H., & Levey, A. I. (1983) Central cholinergic
pathways in the rat: an overview based on an alternative nomenclature (Chl-Ch6).
Neuroscience, 10, 1185-1201.
Meunier, J. C., Mollereau, C., Toll, L., Suaudeau, C., Moisand, C., Alvinerie, P., Butour, J.L.,
Guillemot, J.C., Ferrar, P., Monsarrot, B. (1995). Isolation and structure of the
endogenous agonist of opioid receptor-like orl1 receptor. Nature, 377, 532-535.
Michel, F. J., Robillard, J. M., & Trudeau, L. E. (2004). Regulation of rat mesencephalic
GABAergic neurones through muscarinic receptors. Journal of Physiology, 556, 429-
445.
Miller, A. D., Forster, G. L., Metcalf, K. M., & Blaha, C. D. (2002). Excitotoxic lesions of the
pedunculopontine nucleus differentially mediate morphine- and d-amphetamine-evoked
striatal dopamine efflux and behaviors. Neuroscience, 111, 351-362.
60Miller, A. D., Forster, G. L., Yeomans, J. S., & Blaha, C. D. (2005). Midbrain muscarinic
receptors modulate morphine-induced accumbal and striatal dopamine efflux in the rat.
Neuroscience, 136, 531-538.
Moga, M. M., & Saper, C. B. (1994). Neuropeptide-immunoreactive neurons projecting to the
paraventricular hypothalamic nucleus in the rat. Journal of Comparative Neurology, 346,
137-150.
Murphy, N.P., Lam, H.A., & Maidment, N.T. (2001). A comparison of morphine-induced
locomotor activity and mesolimbic dopamine release in C57BL6, 129Sv and DBA2 mice.
Journal of Neurochemistry, 79, 626-635.
Nader, K., & van der Kooy, D. (1997). Deprivation state switches the neurobiological substrates
mediating opiate reward in the ventral tegmental area. Journal of Neuroscience, 17, 383-
390.
Oakman, S.A., Faris, P.L., Cozzari, C., & Hartman, B.K. (1999). Characterization of the extent
of pontomesencephalic cholinergic neurons’ projections to the thalamus: a comparison
with projections to midbrain dopaminergic neurons. Neuroscience, 94, 529-547.
Oakman, S. A., Faris, P. L., Kerr, P. E., Cozzari, C., & Hartman, B. K. (1995). Distribution of
pontomesencephalic cholinergic neurons projecting to substantia nigra differs
significantly from those projecting to ventral tegmental area. Journal of Neuroscience,
15, 5859-5869.
Olds, M.E. (1982). Reinforcing effects of morphine in the nucleus accumbens. Brain Research,
237, 429-440.
Oliverio, A. (1976). Genotype-dependent electroencephalographic, behavioral and analgesic
correlates of morphine: An analysis in normal mice and mice with septal lesions. Brain
Research, 83, 135-141.
61Olmstead, M. C., & Franklin, K. B.J. (1994). Lesions of the pedunculopontine tegmental nucleus
block drug-induced reinforcement but not amphetamine-induced locomotion. Brain
Research, 638, 29-35.
Olmstead, M.C., & Franklin, K.B.J. (1996). Differential effects of ventral striatal lesions on the
conditioned place preference induced by morphine or amphetamine. Neuroscience, 71,
701-708.
Olmstead, M. C., & Franklin, K. B.J. (1997). The development of a conditioned place preference
to morphine: Effects of microinjections into various CNS sites. Behavioural
Neuroscience, 111, 1324-1334.
Olmstead, M. C., Munn, E. M., Franklin, K. B., & Wise, R. A. (1998). Effects of
pedunculopontine tegmental nucleus lesions on responding for intravenous heroin under
different schedules of reinforcement. Journal of Neuroscience, 18, 5035-5044.
Omelchenko, N., & Sesack, S.R. (2005). Laterodorsal tegmental projections to identified cell
populations in the rat ventral tegmental area. Journal of Comparative Neurology, 483,
217-235.
Omelchenko, N., & Sesack, S.R. (2006). Cholinergic axons in the rat ventral tegmental area
synapse preferentially onto mesoaccumbens dopamine neurons. Journal of Comparative
Neurology, 494, 863-875.
Pan, W. X., & Hyland, B. I. (2005). Pedunculopontine tegmental nucleus controls conditioned
responses of midbrain dopamine neurons in behaving rats. Journal of Neuroscience, 25,
4725-4732.
Paxinos, G., & Watson, C. (1998). The rat brain in stereotaxic coordinates. San Diego: Academic
Press.
Pert, C. B., & Snyder, S. H. (1973). Opiate receptor: Demonstration in nervous tissue. Science,
179, 1011-1014.
62Pettit, H. O., Ettenberg, A., Bloom, F. E., & Koob, G. F. (1984). Destruction of dopamine in the
nucleus accumbens selectively attenuates cocaine but not heroin self-administration in
rats. Psychopharmacology, 84, 167-173.
Phelps, P.E., Houser, C.R., & Vaughn, J.E. (1985). Immunocytochemical localization of choline
acetyltransferase within the rat neostriatum: a correlated light and electron microscopic
study of cholinergic neurons and synapses. Journal of Comparative Neurology, 238, 286-
307.
Phillips, A. G., & LePiane, F. G. (1980). Reinforcing effects of morphine microinjection into the
ventral tegmental area. Pharmacology Biochemistry and Behavior, 12, 965-968.
Phillipson, O.T. (1979). Afferent projections to the ventral tegmental area of Tsai and
intrafasicular nucleus: a horseradish peroxidase study in the rat. Journal of Comparative
Neurology, 187, 117-143.
Picciotto, M.R., Zoli, M., Rimondini, R., Léna, C., Marubio, L.M., Pich, E.M., Fuxe, K., &
Changeux, J.P. (1998). Acetylcholine receptors containing the beta2 subunit are involved
in the reinforcing properties of nicotine. Nature, 391, 173-177.
Rada, P. V., Mark, G. P., Yeomans, J. S., & Hoebel, B. G. (2000). Acetylcholine release in
ventral tegmental area by hypothalamic self-stimulation, eating, and drinking.
Pharmacology Biochemistry and Behavior, 65, 375-379.
Rezayof, A., Nazari-Serenjeh, F., Zarrindast, M. R., Sepehri, H., & Delphi, L. (2007). Morphine-
induced place preference: Involvement of cholinergic receptors of the ventral tegmental
area. European Journal of Pharmacology, 562, 92-102.
Rinvik, E., Grofova, I., & Otterson, O.P. (1976). Demonstration of nigrotectal and nigroreticular
projections in the cat by axonal transport of proteins. Brain Research, 112, 388-394.
Ritz, M.C., Cone, E.J., & Kuhar, M.J. (1990). Cocaine inhibition of ligand binding at dopamine,
63norepinephrine and serotonin transporters: a structure-activity study. Life Sciences, 46,
635–645.
Roberts, D. C., Corcoran, M. E., & Fibiger, H. C. (1977). On the role of ascending
catecholaminergic systems in intravenous self-administration of cocaine. Pharmacology
Biochemistry and Behavior, 6, 615-620.
Robinson, T. E., & Berridge, K. C. (1993). The neural basis of drug craving: An incentive-
sensitization theory of addiction. Brain Research Reviews, 18, 247-291.
Role, L., & Berg, D.K. (1996). Nicotinic receptors in the development and modulation of CNS
synapses. Neuron, 16, 1077-1085.
Romo, R., & Schultz, W. (1990). Dopamine neurons of the monkey midbrain: Contingencies of
responses to active touch during self-initiated arm movements. Journal of
Neurophysiology, 63, 592-606.
Ryan, M.C., & Grundlach, A.L. (1995). Anatomical localization by preproatrial natriuretic
peptide messenger RNA in the rat brain by in situ hybridization histochemistry – novel
identification in olfactory regions. Journal of Comparative Neurology, 356, 168-182.
Rye, D. B., Saper, C. B., Lee, H. J., & Wainer, B. H. (1987). Pedunculopontine tegmental
nucleus of the rat: Cytoarchitecture, cytochemistry, and some extrapyramidal connections
of the mesopontine tegmentum. Journal of Comparative Neurology, 259, 483-528.
Salamone, F., & Zhou, M. (2000). Aberrations in nicotinic acetylcholine receptor structure,
function and expression: implications in disease. McGill Journal of Medicine, 5, 90-97.
Schildein, S., Agmo, A., Huston, J. P., & Schwarting, R. K. (1998). Intraaccumbens injections of
substance P, morphine and amphetamine: Effects on conditioned place preference and
behavioral activity. Brain Research, 790, 185-194.
64Schilstrom, B., Svensson, H.M., Svensson, T.H., & Nomikos, G.G. (1998). Nicotine and food-
induced dopamine release in the nucleus accumbens of the rat: putative role of α7
nicotinic receptors in the ventral tegmental area. Neuroscience, 85, 1005-1009.
Schultz, W., Apicella, P., Scarnati, E., & Ljungberg, T. (1992). Neuronal activity in monkey
ventral striatum related to the expectation of reward. Journal of Neuroscience, 12, 4595-
4610.
Seiden, L.S., Sabol, K.E., Ricuarte, G.A., 1993. Amphetamine: effects on catecholamine systems
and behavior. Annual Review of Pharmacology and Toxicology, 33, 639–677.
Semba, K., & Fibiger, H. C. (1992). Afferent connections of the laterodorsal and the
pedunculopontine tegmental nuclei in the rat: A retro- and antero-grade transport and
immunohistochemical study. Journal of Comparative Neurology, 323, 387-410.
Sesack, S.R., & Pickel, R. (1992). Prefrontal cortical efferents in the rat synapse on unlabeled
neuronal targets of catecholamine terminals in the nucleus accumbens septi and on
dopamine neurons in the ventral tegmental area. Journal of Comparative Neurology, 320,
145-160.
Sharp, T., Zetterstrom, T., Ljungberg, T., & Ungerstedt, U. (1987). A direct comparison of
amphetamine-induced behaviours and regional brain dopamine release in the rat using
intracerebral dialysis. Brain Research, 401, 322-330.
Skinner, R. D., & Garcia-Rill, E. (1984). The mesencephalic locomotor region (MLR) in the rat.
Brain Research, 323, 385-389.
Smith, Y., Charara, A., & Parent, A. (1996). Synaptic innervation of midbrain dopaminergic
neurons by glutamate-enriched terminals in the squirrel monkey. Journal of Comparative
Neurology, 364, 231-253.
Sora, I., Funada, M., & Uhl, G.R. (1997). The mu-opioid receptor is necessary for [D-Pen2,D-
Pen5]enkephalin-induced analgesia. European Journal of Pharamcology, 324, R1-2.
65Spyraki, C., Fibiger, H. C., & Phillips, A. G. (1983). Attenuation of heroin reward in rats by
disruption of the mesolimbic dopamine system. Psychopharmacology, 79, 278-283.
Steeves, J.D., & Jordan, L.M. (1980). Localization of a descending pathway in the spinal cord
which is necessary for controlled treadmill locomotion. Neuroscience Letters, 20, 283-
290.
Steffensen, S.C., Svingos, A.L., Pickel, V.M., & Henriksen, S.J. (1998). Electrophysiological
characterization of GABAergic neurons in the ventral tegmental area. Journal of
Neuroscience, 18, 8003-8015.
Steininger, T. L., Rye, D. B., & Wainer, B. H. (1992). Afferent projections to the cholinergic
pedunculopontine tegmental nucleus and adjacent midbrain extrapyramidal area in the
albino rat. I. Retrograde tracing studies. Journal of Comparative Neurology, 321, 515-
543.
Steininger, T. L., Wainer, B. H., & Rye, D. B. (1997). Ultrastructural study of cholinergic and
noncholinergic neurons in the pars compacta of the rat pedunculopontine tegmental
nucleus. Journal of Comparative Neurology, 382, 285-301.
Steriade, M., Datta, S., Pare, D., Oakson, G., Curro Dossi, R. (1990). Neuronal activities in
brain-stem cholinergic nuclei related to tonic activation processes in thalamocortical
systems. Journal of Neuroscience, 10, 2541-2559.
Stinus, L., Nadaud, D., Jauregui, J., & Kelley, A.E. (1986). Chronic treatment with five different
neuroleptics elicits behavioral supersensitivity to opiate infusion into the nucleus
accumbens. Biological Psychiatry, 21, 34-48.
Stinus, L., Winnock, M., & Kelley, A.E. (1985). Chronic neuroleptic treatment and mesolimbic
dopamine denervatiob induce behavioural supersensitivity to opiates.
Psychopharmacology, 85, 323-328.
66Sugaya, K., Clamp, C., Bryan, D., & McKinney, M. (1997). mRNA for the m4 muscarinic
receptor subtype is expressed in adult rat brain cholinergic neurons. Molecular Brain
Research, 50, 305-313.
Sulzer, D., Maidment, N.T., Rayport, S., 1993. Amphetamine and other weak bases act to
promote reverse transport of dopamine in ventral midbrain neurons. Journal of
Neurochemistry, 60, 527–535.
Svingos, A. L., Garzon, M., Colago, E. E., & Pickel, V. M. (2001). Mu-opioid receptors in the
ventral tegmental area are targeted to presynaptically and directly modulate mesocortical
projection neurons. Synapse, 41, 221-229.
Tapper, A.R., McKinney, S.L., Nashmi, R., Schwarz, J., Deshpande, P., Labarca, C., Whiteaker,
P., Marks, M.J., Collins, A.C., & Lester, H.A. (2004). Nicotine activation of alpha4*
receptors: sufficient for reward, tolerance, and sensitization. Science, 306, 1029-1032.
Thomsen, M., Woldbye, D. P., Wortwein, G., Fink-Jensen, A., Wess, J., & Caine, S. B. (2005).
Reduced cocaine self-administration in muscarinic M5 acetylcholine receptor-deficient
mice. Journal of Neuroscience, 25, 8141-8149.
Tzavara, E. T., Bymaster, F. P., Davis, R. J., Wade, M. R., Perry, K. W., Wess, J., McKinzie,
D.L., Felder, C., & Nomikos, G.G. (2004). M4 muscarinic receptors regulate the
dynamics of cholinergic and dopaminergic neurotransmission: Relevance to the
pathophysiology and treatment of related CNS pathologies. Faseb Journal, 18, 1410-
1412.
Tzschentke, T. M. (2001). Pharmacology and behavioral pharmacology of the mesocortical
dopamine system. Progress in Neurobiology, 63, 241-320.
Vaccarino, F. J., Amalric, M., Swerdlow, N. R., & Koob, G. F. (1986). Blockade of
amphetamine but not opiate-induced locomotion following antagonism of dopamine
function in the rat. Pharmacology Biochemistry and Behavior, 24, 61-65.
67van Bockstaele, E.J., & Pickel, V.M. (1995). GABA-containing neurons in the ventral tegmental
area project to the nucleus accumbens in rat brain. Brain Research, 682, 215-221.
van den Pol, A.N., Smith, A.D., & Powell, J.F. (1985). GABA axons in synaptic contact with
dopamine neurons in the substantia nigra: double immunocytochemistry with biotin-
peroxidase and protein A-colloidal gold. Brain Research, 348, 146-154.
van der Kooy, D., Mucha, R.F., O’Shaughnessy, M., & Bucenieks, P. (1982). Reinforcing
effects of brain microinjections of morphine revealed by conditioned place preference.
Brain Research, 243, 107-117.
Vanderschurren, L.J.M.J., & Kalivas, P.W. (2000). Alterations in dopaminergic and
gluatamatergic transmission in the induction and expression of behavioral sensitization: a
critical review of preclinical studies. Psychopharmacology, 151, 99-120.
Vezina, P. (2007). Sensitization, drug addiction and psychopathology in animals and humans.
Progress in Neuropsychopharmacology and Biological Psychiatry, 31, 1553-1555.
Vilaro, M. T., Palacios, J. M., & Mengod, G. (1990). Localization of m5 muscarinic receptor
mRNA in rat brain examined by in situ hybridization histochemistry. Neuroscience
Letters, 114, 154-159.
Vilaro, M. T., Palacios, J. M., & Mengod, G. (1994). Multiplicity of muscarinic autoreceptor
subtypes? Comparison of the distribution of cholinergic cells and cells containing mRNA
for five subtypes of muscarinic receptors in the rat brain. Molecular Brain Research, 21,
30-46.
Vincent, S.R., & Kimura, H. (1992). Histochemical mapping of nitric oxide synthase in the rat
brain. Neuroscience, 46, 755-784.
Vincent, S.R., Satoh, K., Armstrong, D.M., Pannula, P., Vale, W., & Fibiger, H.C. (1986).
Neuropeptides and NADPH-diphorase activity in the ascending cholinergic reticular
system of the rat. Neuroscience, 17, 167-182.
68Vives, F., & Mogenson, G. J. (1985). Electrophysiological evidence that the mediodorsal nucleus
of the thalamus is a relay between the ventral pallidum and the medial prefrontal cortex
in the rat. Brain Research, 344, 329-337.
Wang, H., Ng, K., Hayes, D., Gao, X., Forster, G., Blaha, C., & Yeomans, J.S. (2004).
Decreased amphetamine-induced locomotion and improved latent inhibition in mice
mutant for the M5 muscarinic receptor gene found in the human 15q schizophrenia
region. Neuropsychopharmacology, 29, 2126-2139.
Wang, H., Tagliferro, P., & Morales, M. The laterodorsal tegmental nucleus have three distinct
subpopulations of neurons: cholinergic, glutamatergic, and GABAergic. Program No.
916.5. 2007 Neuroscience Meeting Planner. San Diego, CA: Society for Neuroscience,
2007. Online.
Wei, J., Walton, E. A., Milici, A., & Buccafusco, J. J. (1994). m1-m5 muscarinic receptor
distribution in rat CNS by RT-PCR and HPLC. Journal of Neurochemistry, 63, 815-821.
Weiner, D. M., & Brann, M. R. (1989). The distribution of a dopamine D2 receptor mRNA in rat
brain. FEBS Letters, 253, 207-213.
Weiner, D. M., Levey, A. I., & Brann, M. R. (1990). Expression of muscarinic acetylcholine and
dopamine receptor mRNAs in rat basal ganglia. Proceedings of the National Academy of
Sciences U S A, 87, 7050-7054.
Westerink, B.H.C., Kwint, H.F., & deVries, J.B. (1996). The pharmacology of mesolimbic
dopamine neurons: a dual-probe microdialysis study in the ventral tegmental area and
nucleus accumbens of the rat brain. Journal of Neuroscience, 16, 2606-2611.
Winn, P. (2006). How best to consider the structure and function of the pedunculopontine
tegmental nucleus: Evidence from animal studies. Journal of Neurological Sciences, 248,
234-250.
69Wise, R. A. (2004). Dopamine, learning and motivation. Nature Reviews Neuroscience, 5, 483-
494.
Wise, R.A. (1982). Neurleptics and operant behavior: the anhedonia hypothesis. Behavioral
Brain Science, 5, 39-87.
Wise, R. A., & Bozarth, M. A. (1987). A psychomotor stimulant theory of addiction.
Psychological Review, 94, 469-492.
Wise, R. A., & Schwartz, H. V. (1981). Pimozide attenuates acquisition of lever-pressing for
food in rats. Pharmacology Biochemistry and Behavior, 15, 655-656.
Woolf, N. J. (1991). Cholinergic systems in mammalian brain and spinal cord. Progress in
Neurobiology, 37, 475-524.
Yamada, M., Lamping, K. G., Duttaroy, A., Zhang, W., Cui, Y., Bymaster, F. P., McKinzie,
D.L., Felder, C.C., Deng, C.X., Faraci, F.M., & Wess, J. (2001). Cholinergic dilation of
cerebral blood vessels is abolished in m(5) muscarinic acetylcholine receptor knockout
mice. Proceedings of the National Academy of Sciences U S A, 98, 14096-14101.
Yamaguchi, T., Harvey, B., Liu, B., & Morales, M.. Morphology of ventral tegmental area
(VTA) glutamatergic neurons. Program No. 916.6. 2007 Meeting Planner. San Diego,
CA: Society for Neuroscience, 2007. Online.
Yasuda, K., Raynor, K., Kong, H., Breder, C. D., Takeda, J., Reisine, T., & Bell, G.I. (1993).
Cloning and functional comparison of kappa and delta opioid receptors from mouse
brain. Proceedings of the National Academy of Sciences U S A, 90, 6736-6740.
Yasuda, R.P. Ciesla, W., Flores, L.R., Wall, S.J., Li, M., Satkus, S.A., Weisstein, J.S., Spagnola,
B.V., Wolfe, B.B. (1992). Development of antisera selective for m4 and m5 musacrinic
cholinergic receptors: Distribution of m4 and m5 receptors in rat brain. Journal of
Pharmacology and Experimental Therapeutics, 43, 149-157.
70Yeomans, J.S., & Baptista, M. (1997). Both nicotinic and muscarinic receptors in ventral
tegmental area contribute to brain-stimulation reward. Pharmacology Biochemistry and
Behavior, 57, 915-921.
Yeomans, J.S., Forster, G.L., & Blaha, C.D. (2001). M5 muscarinic receptors are needed for
slow activation of dopamine neurons and for rewarding brain stimulation. Life Sciences,
68, 2449-2456.
Yeomans, J. S., Kofman, O., & McFarlane, V. (1985). Cholinergic involvement in lateral
hypothalamic rewarding brain stimulation. Brain Research, 329, 19-26.
Yeomans, J. S., Mathur, A., & Tampakeras, M. (1993). Rewarding brain stimulation: Role of
tegmental cholinergic neurons that activate dopamine neurons. Behavioural
Neuroscience, 107, 1077-1087.
Yeomans, J. S., Takeuchi, J., Baptista, M., Flynn, D. D., Lepik, K., Nobrega, J., Fulton, J., &
Ralph, M.R. (2000). Brain-stimulation reward thresholds raised by an antisense
oligonucleotide for the m5 muscarinic receptor infused near dopamine cells. Journal of
Neuroscience, 20, 8861-8867.
Yin, R., & French, E. D. (2000). A comparison of the effects of nicotine on dopamine and non-
dopamine neurons in the rat ventral tegmental area: An in vitro electrophysiological
study. Brain Research Bulletin, 51, 507-514.
Young, W. S., 3rd, Alheid, G. F., & Heimer, L. (1984). The ventral pallidal projection to the
mediodorsal thalamus: A study with fluorescent retrograde tracers and
immunohistofluorescence. Journal of Neuroscience, 4, 1626-1638.
Zangen, A., Ikemoto, S., Zadina, J. E., & Wise, R. A. (2002). Rewarding and psychomotor
stimulant effects of endomorphin-1: Anteroposterior differences within the ventral
tegmental area and lack of effect in nucleus accumbens. Journal of Neuroscience, 22,
7225-7233.
71Zhang, W., Yamada, M., Gomeza, J., Basile, A. S., & Wess, J. (2002). Multiple muscarinic
acetylcholine receptor subtypes modulate striatal dopamine release, as studied with m1-
m5 muscarinic receptor knock-out mice. Journal of Neuroscience, 22, 6347-6352.
Zhou, Q. Y., & Palmiter, R. D. (1995). Dopamine-deficient mice are severely hypoactive,
adipsic, and aphagic. Cell, 83, 1197-1209.
Zubieta, J.K., & Frey, K.A. (1993). Autoradiographic mapping of M3 muscarinic receptors in the
rat brain. Journal of Pharmacology and Experimental Therapeutics, 264, 415-422.
72General Methods for Chapter 1-4 Experiments
Mice
M5 knockout mice were created by Takeuchi et al. (2002) using recombinant DNA
methods. Briefly, a large portion (0.5 kb) of the region encoding the mouse M5 gene was deleted.
Specifically, a region of 503 base pairs in the area of the gene encoding the third intracellular
loop of the M5 receptor was removed and replaced by insertion of a neomycin resistant gene
using restriction enzymes. The targeting vector (17 kb) was inserted by electroporation into
embryonic stem cells of a 129 SvJ mouse. The resulting embryonic stem cells were then
screened and selected for homologous recombination using both positive (neomycin resistance)
and negative (thymidine kinase) markers to ensure appropriate replacement of the wild-type M5
gene. ES cells showing the M5 mutation (tested by Southern blot analysis) were inserted into the
blastocyst from a CD1 mouse and then placed into a pseudopregnant CD1 mouse. Resulting
male chimeric offspring were bred to produce heterozygous F1 offspring. Subsequent F2 mice
(homozygous and wild-type) were used to maintain a breeding colony based on homozygous
breeding. Thus only homozygous M5 knockout and wild-type mice were used in all experiments,
precluding the use of littermates in all experiments. Instead litters of homozygous M5 knockout
and wild-type mice were age-matched (2-4 months at the time of testing) for individual
experiments.
Subsequent to obtaining M5 knockout mice on a mixed 129 SvJ x CD1 background,
homozygous knockouts were backcrossed to C57Bl/6 mice over 6 generations in order to
achieve a C57Bl/6 background (Silva et al., 1997). Subsequent to backcrossing, a colony of these
mice was maintained through breeding of homozygous M5 knockout and wild-type controls.
Genotyping
The experiments described in this dissertation were conducted over 4 years. While
breeding pairs for individual groups of mice were initially genotyped using DNA extracted from
73tail snips (see below), periodically wild-type and M5 knockout mice were also randomly selected
for genotyping.
PCR method.
Genomic DNA was isolated from 8-10 mm pieces of mouse tail, cut under isoflurane
anesthesia. Mouse tails were then digested in lysis buffer (Tris-HCL 100 mM, EDTA 5 mM,
SDS 0.2%, NaCl 200 mM, proteinase K 0.1 mg/ml) at 50 °C for approximately 18 hours.
Solutions containing the digested tails were then treated with equal volumes of
phenol/chloroform and manually shaken for 3 minutes, before being centrifuged at room
temperature for 5 min at 12000 rpm. The top layer (containing genomic DNA) was removed and
about 10% the volume of 7M NH4Cl and twice the volume of 100% ethanol were added. Vials
were shaken until a DNA “pellet” was clearly visible. Following centrifugation (2 min at 4000
rpm), the supernatant was discarded and 1ml of 70% ethanol added. Following another
centrifugation (2 min at 4000 rpm), the supernatant was discarded and the DNA “pellet” left to
dry at room temperature for a few minutes. Finally, genomic DNA was dissolved with TE buffer
and stored at 4 °C. Primers used for PCR genotyping were: Primer 1 neoR-U and Primer 2 neoR-
D to amplify a 492 base pair fragment of the neomycin resistant gene, and Primer 3 MR-M5-U4
and Primer 4 MR-M5-D4 to amplify a 732 base pair fragment of the mouse M5 gene. These
primers were added to samples of gDNA (200 ng) before PCR amplification. Ten μl of the final
product were then resolved on 1% agarose gels containing 0.5 ug/ml ethidium bromide,
visualized under UV light, and then photographed (Polaroid, Cambridge, MA, USA).
Housing
Mice were housed in groups of 2-5 in opaque cages, with food and water available ad
libitum on a 12:12 LD cycle (lights on at 7 am). Testing always took place between the hours of
9am to 6pm (i.e. the inactive period of the cycle). A minimum of one week prior to initiation of
the experiment, mice were removed from the breeding colony and brought to a small housing
74room adjacent to the testing room. Both rooms had controlled temperature (20 ± 1 °C) and
humidity (approximately 55-60%).
In all subsequent Results and Discussion sections CD1x129SvJ mice will be referred to
as 129 mice, while C57Bl/6 mice will be referred to as B6.
Cautionary note on the use of gene knockout mice
M5 knockout mice do not show any apparent deficits in health, motor function or
behavioral vigor. Furthermore, there are no gross anatomical abnormalities in Nissl-stained brain
sections of M5 knockout mice (Takeuchi et al., 2002). However, as is the case for most systemic
gene knockout mice, these mice are missing functional M5 receptors throughout development.
Therefore, developmental changes in knockout mice may compensate for the missing gene and
its functions. In this regard, Basile and colleagues (2002) found no secondary changes in M4, D1,
or D2 receptor densities in the striatum or midbrain as a result of M5 deletion in 129 svEv x Cf1
mice. On the other hand, Wang and colleagues (2004) found increased levels of D2 mRNA in the
striatum, hindbrain, hypothalamus and tectum of 129SvJ x CD1 M5 knockout mice. Other
muscarinic receptor sub-types (e.g., M1, M2, and M3) or nicotinic acetylcholine receptors in M5
knockout mice have not been systemcatically investigated.
75
Chapter 1: Morphine-induced locomotion is reduced in M5 receptor knockout mice or by
VTA atropine in wild-type mice
76Introduction
Hnasko et al. (2005) showed that systemic morphine-induced locomotion was reduced in
dopamine-deficient mice to 5% of wild-type control levels. This is in contrast to rats where 6-
OHDA lesions did not significantly affect heroin-induced locomotion (Vaccarino et al., 1986).
Furthermore, while α-flupenthixol did not significantly reduce heroin-induced locomotion in rats
(Vaccarino et al., 1986), morphine-induced locomotion in ddY mice was dose-dependently
reduced by systemic haloperidol (Ito, Mori & Sawaguchi, 2008). Taken together, this indicates
that morphine-induced locomotion in mice may be more dependent on dopamine.
In rats, lesions of the PPT or LDT strongly reduced striatal (Miller et al., 2002) or
accumbal (Forster et al., 2002) dopamine efflux, respectively. Muscarinic receptors in VTA and
SN were critical for dopamine activation induced by systemic morphine (Miller et al., 2005),
suggesting that cholinergic input to the VTA is important in mediating morphine-induced
dopamine activation.
In mice, sustained activation of the mesolimbic dopamine system by electrical
stimulation of the LDT critically depends on M5 receptors (Forster et al., 2001). Thus, M5
muscarinic receptors may also be important in mediating morphine-induced excitation of
dopamine neurons, resulting in increased locomotion. To assess the contribution of M5,
Experiment 1 tested morphine-induced locomotion in wild-type and M5 knockout mice of both
129 and B6 background strains across a range of doses (3, 10, and 30 mg/kg; i.p.). Morphine-
induced locomotion, and particularly its underlying neurobiology, has been more extensively
investigated in rats than in mice, so these experiments 1) tested how 129 and B6 mice respond to
the stimulant effects of morphine, and 2) tested the contribution of M5 receptors in both
background strains. Experiment 2 tested whether the morphine-induced locomotion in B6 wild-
type and M5 knockout mice is mediated through opioid receptors. Locomotion produced by
systemic morphine in wild-type mice was challenged by pre-treatment with the non-specific
77opioid receptor antagonist naltrexone. Naltrexone also provided a test of the contribution of
endogenous opioids to locomotion in M5 knockout and wild-type mice.
Experiment 1: Morphine-induced locomotion in M5 muscarinic receptor knockout mice
Materials and Methods
Mice
A total of 114 mice were used in Experiment 1 (21 129 wild-type, 21 129 M5 knockout,
36 B6 wild-types, and 36 B6 M5 knockout mice).
Locomotion Testing Apparatus
Mice were tested individually in nine black chambers (31cm x 31cm x 31 cm)
constructed of Melamine-laminated plywood (University of Toronto, Department of Cell and
Systems Biology Workshop). In all experiments wild-type and M5 knockout mice were run
together in groups consisting of 4-5 wild-type and 4-5 M5 knockout mice, each randomly
assigned to a testing chamber. Mice were videotaped by a camera (Panasonic, Model # WV-
CP484, Osaka, Japan) mounted approximately 7 feet above the testing chambers. The testing
room was illuminated by two 40-watt red lightbulbs (approximately 2.5 lux) mounted on the
ceiling approximately 9 feet above the testing chambers.
Locomotion Testing Procedure
Locomotion testing took place across 3 consecutive days. Each day, mice were taken in
their home cages from the housing room, immediately adjacent to the testing room, weighed, and
then placed into the testing room 20 min prior to initiation of locomotion testing to allow for
acclimatization to the testing environment. On the first day, spontaneous locomotion was tested
in all mice over the course of 2 hours. For this, mice were individually removed from their cages
and placed in the center of their assigned testing chamber without receiving any injection. In 129
mice tested at the 3 or 10 mg/kg (i.p.) dose of morphine, saline was given on day 2 and the
78respective morphine dose on day 3, while saline and morphine administration was
counterbalanced for 129 mice tested at the 30 mg/kg (i.p.) dose of morphine. In B6 mice saline
and morphine administration was counterbalanced at all doses tested (3, 10, or 30 mg/kg, i.p.),
such that half the mice received morphine on day 2, and then received saline on day 3, while the
other half received saline on day 2 and then morphine on day 3.
Drugs
Morphine sulfate pentahydrate and naltrexone hydrochloride were obtained from Sigma
(St. Louis, MO). All drugs were dissolved in sterile saline and injected at a volume of 10 ml/kg
body weight. Morphine doses were always calculated according to free base weight.
Data Acquisition and Analysis
Video records were analyzed using Noldus Ethovision (Groningen, Netherlands), which
provided a measure of total forward locomotion and was also able to quantify the amount of
vertical rearing. Data obtained for each dose of morphine were separately analyzed.
For total locomotion across the 2-hr period, data was analyzed using a mixed-measures
analysis of variance (ANOVA), with distance travelled as the dependent variable, genotype as
the between-subjects factor, and treatment (saline or morphine) as the within-subjects factor.
Unless otherwise stated, significant genotype x treatment interactions were further analyzed
comparing groups using Fisher’s least significant differences test (LSD).
Locomotion time course was analyzed using a mixed measures ANOVA, with distance
moved as the dependent variable, genotype as the between-subjects factor, and treatment (saline
or morphine) and time (time blocks: 0-10 min, 10-20 min, 20-30 min, 30-40 min, 40-50 min, 50-
60 min, 60-70 min, 70-80 min, 80-90 min, 90-100 min, 100-110 min, and 110-120 min) as
within-subjects factors. For each analysis, the sphericity assumption of a repeated-measures
ANOVA model was tested and when violated, the degrees of freedom for tests on the within-
subjects factors and those involving interactions with the within-subjects factor were corrected
79using Greenhouse-Geyser adjustment. Unless otherwise stated, significant three-way interactions
were further analyzed using Fisher’s LSD test to compare groups of mice at individual time
points.
Results
Spontaneous Exploration
Spontaneous exploration, as reflected by the distance travelled during first exposure to
the testing chambers, was higher in B6 than in 129 mice across the two-hour testing period
(Figure 1.1a). As there was an unequal number of mice in the two groups and significantly
different variances between groups (p<0.001), a Welch’s t-test was employed in place of a
standard independent samples t-test. B6 mice showed significantly greater overall locomotion
than 129 mice (t′(48) = 15.84, p<0.001). Throughout the two-hour period locomotion levels were
lower in 129 mice relative to B6 mice (Figure 1.1b). The strain difference was most evident in
the second hour of testing. While 129 mice showed a steady decline in locomotion over the first
90 min and then reached low asymptotic levels, B6 mice showed a decline in locomotion over
only the first 40 min, after which their asymptotic response levels were on average 3.1 (± 0.34)
times higher relative to 129 mice. Analysis of total locomotion in the first and second hours was
consistent with this conclusion. In 129 mice most of the total locomotion across 2 hrs occurred
during the first hour, while in B6 mice almost as much locomotion occurred in the second hour
as during the first (Figure 1.1a). In fact, B6 mice showed as much locomotion in the first hour as
129 mice during the entire two-hour period (13123.42 ± 954.43 cm vs 12507.73 ± 934.90 cm,
t(54) = 0.42, p>0.1). This suggests that habituation to the locomotion chamber did not occur at
the same rate and to the same extent in B6 mice as it did in 129 mice.
Figures 1.2a and 1.2b show total locomotion for wild-type and M5 knockout mice of each
strain. In neither case were there significant differences in total spontaneous exploration due to
genotype (t(39) = 1.41, p>0.1, and t(70) = 0.23, p>0.1 for 129 and B6 strains, respectively).

80Figure 1.1. Spontaneous exploration in B6 (n=36) and 129 (n=20) wild-type mice. (A)
Comparison of total spontaneous exploration in B6 and 129 wild-type mice between the first and
second hour of testing. ∗ p<0.001 total locomotion in B6 vs 129 mice. (B) Time course of
spontaneous exploration across the 2-hr testing period.
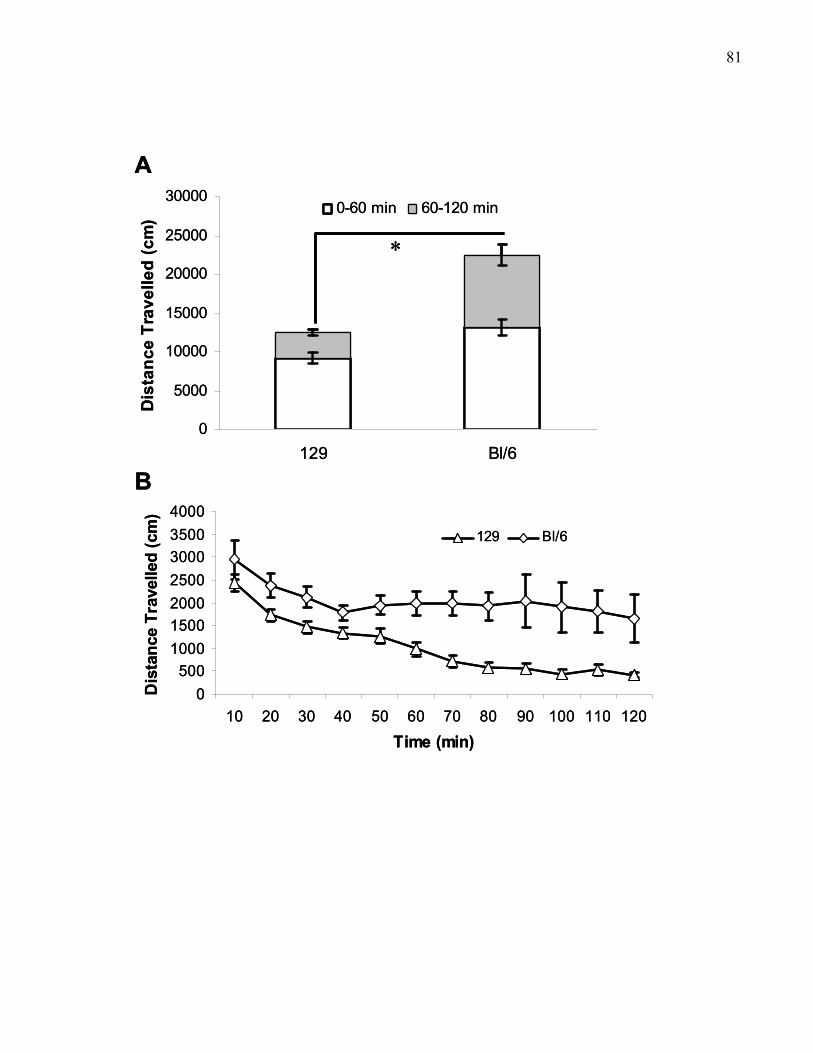
81
0500
1000150020002500300035004000
10 20 30 40 50 60 70 80 90 100 110 120
Time (min)
Dis
tanc
e Tr
avel
led
(cm
)
129 Bl/6
0
5000
10000
15000
20000
25000
30000
129 Bl/6
Dis
tanc
e Tr
avel
led
(cm
)
0-60 min 60-120 min
A
B
∗
0500
1000150020002500300035004000
10 20 30 40 50 60 70 80 90 100 110 120
Time (min)
Dis
tanc
e Tr
avel
led
(cm
)
129 Bl/6
0
5000
10000
15000
20000
25000
30000
129 Bl/6
Dis
tanc
e Tr
avel
led
(cm
)
0-60 min 60-120 min
A
B
∗

82Figure 1.2. Spontaneous exploration in 129 and B6 wild-type (+/+) and M5 knockout (-/-) mice.
Total locomotion across two hours (A) and locomotion time course across two hours (C) in 129
wild-type (n=20) and M5 knockout mice (n=23), and total locomotion across two hours (B) and
locomotion time course across two hours (D) in B6 wild-type (n=36) and M5 knockout mice
(n=36).
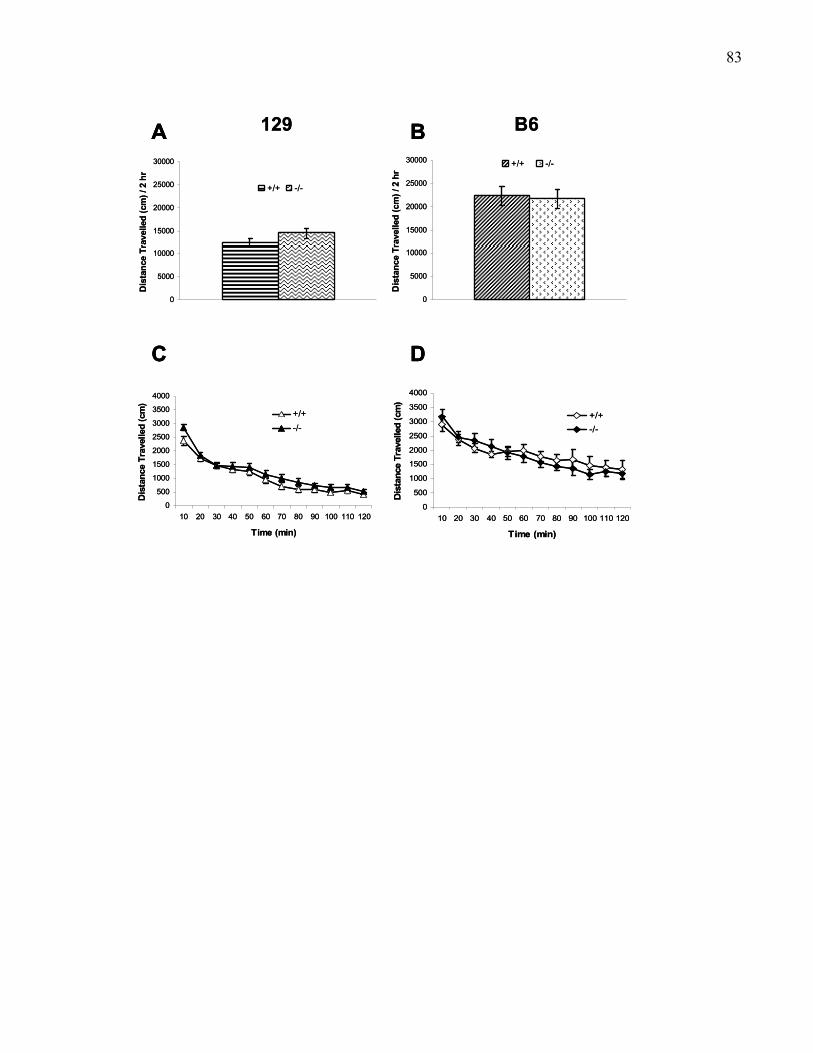
83
0
5000
10000
15000
20000
25000
30000
Dis
tanc
e Tr
avel
led
(cm
) / 2
hr
+/+ -/-
0
500
1000
1500
2000
2500
3000
3500
4000
10 20 30 40 50 60 70 80 90 100 110 120
Time (min)
Dis
tanc
e Tr
avel
led
(cm
)
+/+-/-
0
5000
10000
15000
20000
25000
30000
Dis
tanc
e Tr
avel
led
(cm
) / 2
hr
+/+ -/-
0
500
1000
1500
2000
2500
3000
3500
4000
10 20 30 40 50 60 70 80 90 100 110 120
Time (min)
Dis
tanc
e Tr
avel
led
(cm
)
+/+-/-
A
C D
B129 B6
0
5000
10000
15000
20000
25000
30000
Dis
tanc
e Tr
avel
led
(cm
) / 2
hr
+/+ -/-
0
500
1000
1500
2000
2500
3000
3500
4000
10 20 30 40 50 60 70 80 90 100 110 120
Time (min)
Dis
tanc
e Tr
avel
led
(cm
)
+/+-/-
0
5000
10000
15000
20000
25000
30000
Dis
tanc
e Tr
avel
led
(cm
) / 2
hr
+/+ -/-
0
500
1000
1500
2000
2500
3000
3500
4000
10 20 30 40 50 60 70 80 90 100 110 120
Time (min)
Dis
tanc
e Tr
avel
led
(cm
)
+/+-/-
A
C D
BA
C D
B129 B6
84Furthermore, Figures 1.2c and 1.2d show that for each background strain, the time course of
locomotion was very similar between wild-type and M5 knockout mice. Thus, there were no
differences in spontaneous exploration due to genotype.
Saline-induced Locomotion
Figures 1.3a and 1.3c show total saline-induced (10 ml/kg, i.p.) locomotion collapsed
across groups of different morphine doses for wild-type and M5 knockout mice of each
background strain. There were no significant differences in the total amount of locomotion as a
function of genotype for either strain (t(41) = 0.63, p>0.1, and t(70) = 0.73, p>0.1 for 129 and B6
mice, respectively). Thus, there was no difference in how genotypes of either strain responded to
the handling and injection associated with drug administration. Figures 1.3b and 1.3d further
show the time-course of saline-induced locomotion and illustrate that wild-type and M5
knockout mice of each strain showed similar saline-induced locomotion across the two-hour
testing period.
Morphine-induced Locomotion
Total Locomotion.
Figures 1.4a and 1.4b show total locomotion at all three morphine doses tested across the two-
hour testing period in 129 and B6 wild-type and knockout mice strains, respectively. In 129
wild-type and M5 knockout mice (Figure 1.4a), only the highest dose of morphine tested (30
mg/kg, i.p.) produced a significant increase in total locomotion relative to saline. More
importantly, at this dose total locomotion in M5 knockout mice was significantly lower relative
to wild-type mice. This was supported by a significant interaction between treatment (saline vs
morphine) and genotype (129 wild-type vs 129 M5 knockout), F (1, 17) = 13.15, p < 0.01. Post-
hoc analysis using Tukey’s HSD test for unequal sample sizes, confirmed that both 129 wild-
type (p < 0.001) and M5 knockout (p < 0.001) mice showed significantly greater total
locomotion in response to 30 mg/kg morphine relative to saline, and that total morphine-induced
85locomotion at this dose was significantly reduced in M5 knockout mice relative to wild-type
controls (p <
Figure 1.3. Saline-induced locomotion in 129 and B6 wild-type (+/+) and M5 knockout (-/-)
mice. Total locomotion across two hours (A) and locomotion time course across two hours (B) in
129 wild-type (n=20) and M5 knockout mice (n=23), and total locomotion across two hours (C)
and locomotion time course across two hours (D) in B6 wild-type (n=36) and M5 knockout mice
(n=36).

86
0
2000
4000
6000
8000
10000
12000
14000
16000Di
stan
ce T
rave
lled
(cm
) / 2
hr
+/+ -/-
0200400600800
100012001400160018002000
10 20 30 40 50 60 70 80 90 100 110 120
Time (min)
Dis
tanc
e Tr
avel
led
(cm
)
+/+ -/-
0
2000
4000
6000
8000
10000
12000
14000
16000
Dis
tanc
e Tr
avel
led
(cm
) / 2
hr
+/+ -/-
0200400600800
100012001400160018002000
10 20 30 40 50 60 70 80 90 100 110 120
Time (min)
Dis
tanc
e Tr
avel
led
(cm
)
+/+ -/-
A
DB
C129 B6
0
2000
4000
6000
8000
10000
12000
14000
16000Di
stan
ce T
rave
lled
(cm
) / 2
hr
+/+ -/-
0200400600800
100012001400160018002000
10 20 30 40 50 60 70 80 90 100 110 120
Time (min)
Dis
tanc
e Tr
avel
led
(cm
)
+/+ -/-
0
2000
4000
6000
8000
10000
12000
14000
16000
Dis
tanc
e Tr
avel
led
(cm
) / 2
hr
+/+ -/-
0200400600800
100012001400160018002000
10 20 30 40 50 60 70 80 90 100 110 120
Time (min)
Dis
tanc
e Tr
avel
led
(cm
)
+/+ -/-
A
DB
C
0
2000
4000
6000
8000
10000
12000
14000
16000Di
stan
ce T
rave
lled
(cm
) / 2
hr
+/+ -/-
0200400600800
100012001400160018002000
10 20 30 40 50 60 70 80 90 100 110 120
Time (min)
Dis
tanc
e Tr
avel
led
(cm
)
+/+ -/-
0
2000
4000
6000
8000
10000
12000
14000
16000
Dis
tanc
e Tr
avel
led
(cm
) / 2
hr
+/+ -/-
0200400600800
100012001400160018002000
10 20 30 40 50 60 70 80 90 100 110 120
Time (min)
Dis
tanc
e Tr
avel
led
(cm
)
+/+ -/-
A
DB
C129 B6

87Figure 1.4. Total morphine-induced locomotion across two hours following three doses (3, 10,
and 30 mg/kg, i.p.) of morphine in 129 (A) and B6 (B) wild-type (+/+) and M5 knockout (-/-)
mice. A: ∗ p<0.05, ∗∗ p<0.01. B: ∗ p<0.05, ∗∗ p<0.01, ∗∗∗ p<0.000001.
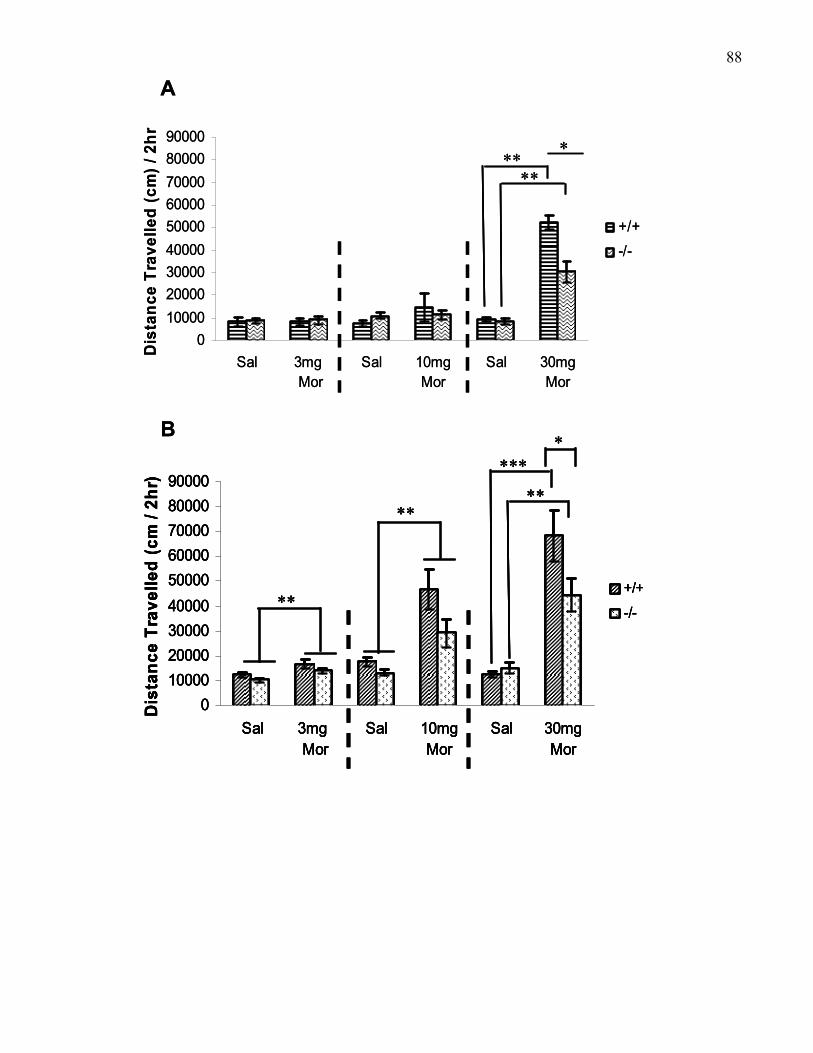
88
A
B
0100002000030000400005000060000700008000090000
Sal 3mg Mor
Sal 10mgMor
Sal 30mgMor
Dis
tanc
e Tr
avel
led
(cm
) / 2
hr
+/+-/-
∗∗∗∗
∗
0100002000030000400005000060000700008000090000
Sal 3mg Mor
Sal 10mgMor
Sal 30mgMor
Dis
tanc
e Tr
avel
led
(cm
/ 2h
r)
+/+
-/-
∗∗∗∗
∗∗∗∗
∗∗
A
B
0100002000030000400005000060000700008000090000
Sal 3mg Mor
Sal 10mgMor
Sal 30mgMor
Dis
tanc
e Tr
avel
led
(cm
) / 2
hr
+/+-/-
∗∗∗∗
∗
0100002000030000400005000060000700008000090000
Sal 3mg Mor
Sal 10mgMor
Sal 30mgMor
Dis
tanc
e Tr
avel
led
(cm
/ 2h
r)
+/+
-/-
∗∗∗∗
∗∗∗∗
∗∗
0100002000030000400005000060000700008000090000
Sal 3mg Mor
Sal 10mgMor
Sal 30mgMor
Dis
tanc
e Tr
avel
led
(cm
/ 2h
r)
+/+
-/-
0100002000030000400005000060000700008000090000
Sal 3mg Mor
Sal 10mgMor
Sal 30mgMor
Dis
tanc
e Tr
avel
led
(cm
/ 2h
r)
+/+
-/-
∗∗∗∗
∗∗∗∗
∗∗
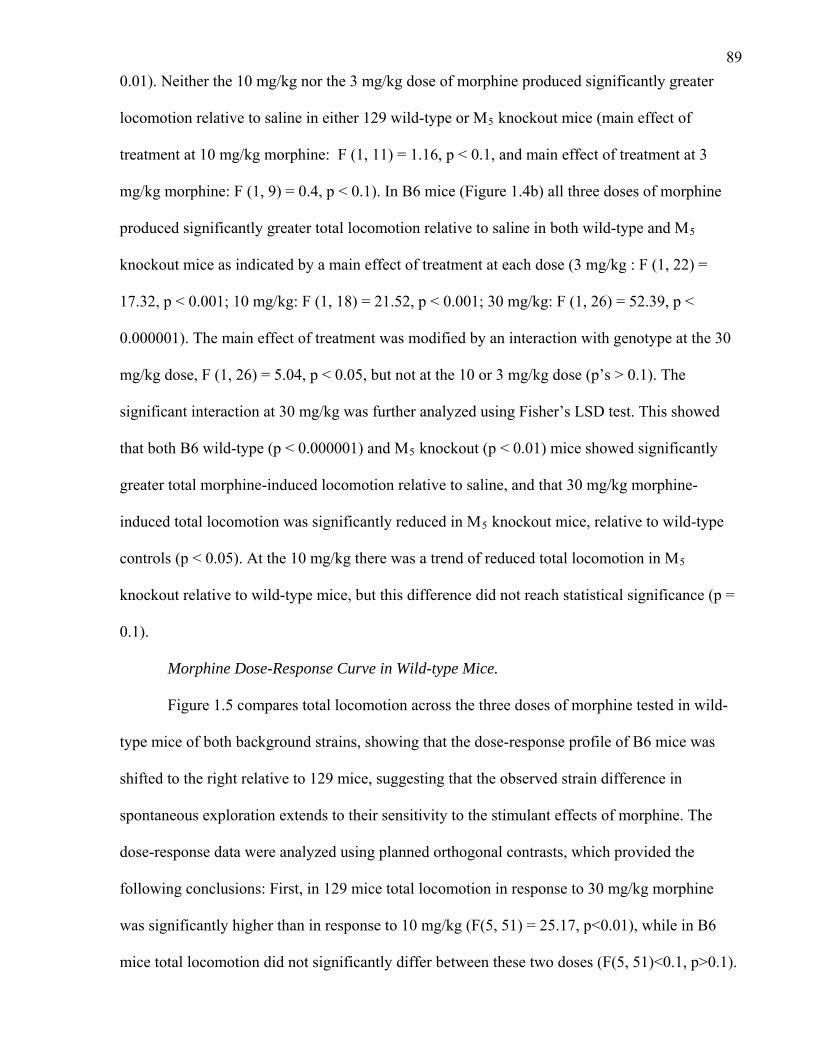
890.01). Neither the 10 mg/kg nor the 3 mg/kg dose of morphine produced significantly greater
locomotion relative to saline in either 129 wild-type or M5 knockout mice (main effect of
treatment at 10 mg/kg morphine: F (1, 11) = 1.16, p < 0.1, and main effect of treatment at 3
mg/kg morphine: F (1, 9) = 0.4, p < 0.1). In B6 mice (Figure 1.4b) all three doses of morphine
produced significantly greater total locomotion relative to saline in both wild-type and M5
knockout mice as indicated by a main effect of treatment at each dose (3 mg/kg : F (1, 22) =
17.32, p < 0.001; 10 mg/kg: F (1, 18) = 21.52, p < 0.001; 30 mg/kg: F (1, 26) = 52.39, p <
0.000001). The main effect of treatment was modified by an interaction with genotype at the 30
mg/kg dose, F (1, 26) = 5.04, p < 0.05, but not at the 10 or 3 mg/kg dose (p’s > 0.1). The
significant interaction at 30 mg/kg was further analyzed using Fisher’s LSD test. This showed
that both B6 wild-type (p < 0.000001) and M5 knockout (p < 0.01) mice showed significantly
greater total morphine-induced locomotion relative to saline, and that 30 mg/kg morphine-
induced total locomotion was significantly reduced in M5 knockout mice, relative to wild-type
controls (p < 0.05). At the 10 mg/kg there was a trend of reduced total locomotion in M5
knockout relative to wild-type mice, but this difference did not reach statistical significance (p =
0.1).
Morphine Dose-Response Curve in Wild-type Mice.
Figure 1.5 compares total locomotion across the three doses of morphine tested in wild-
type mice of both background strains, showing that the dose-response profile of B6 mice was
shifted to the right relative to 129 mice, suggesting that the observed strain difference in
spontaneous exploration extends to their sensitivity to the stimulant effects of morphine. The
dose-response data were analyzed using planned orthogonal contrasts, which provided the
following conclusions: First, in 129 mice total locomotion in response to 30 mg/kg morphine
was significantly higher than in response to 10 mg/kg (F(5, 51) = 25.17, p<0.01), while in B6
mice total locomotion did not significantly differ between these two doses (F(5, 51)<0.1, p>0.1).

90Figure 1.5. Dose response curves for 3, 10, and 30 mg/kg (i.p.) morphine-induced locomotion in
129 and B6 wild-type mice.
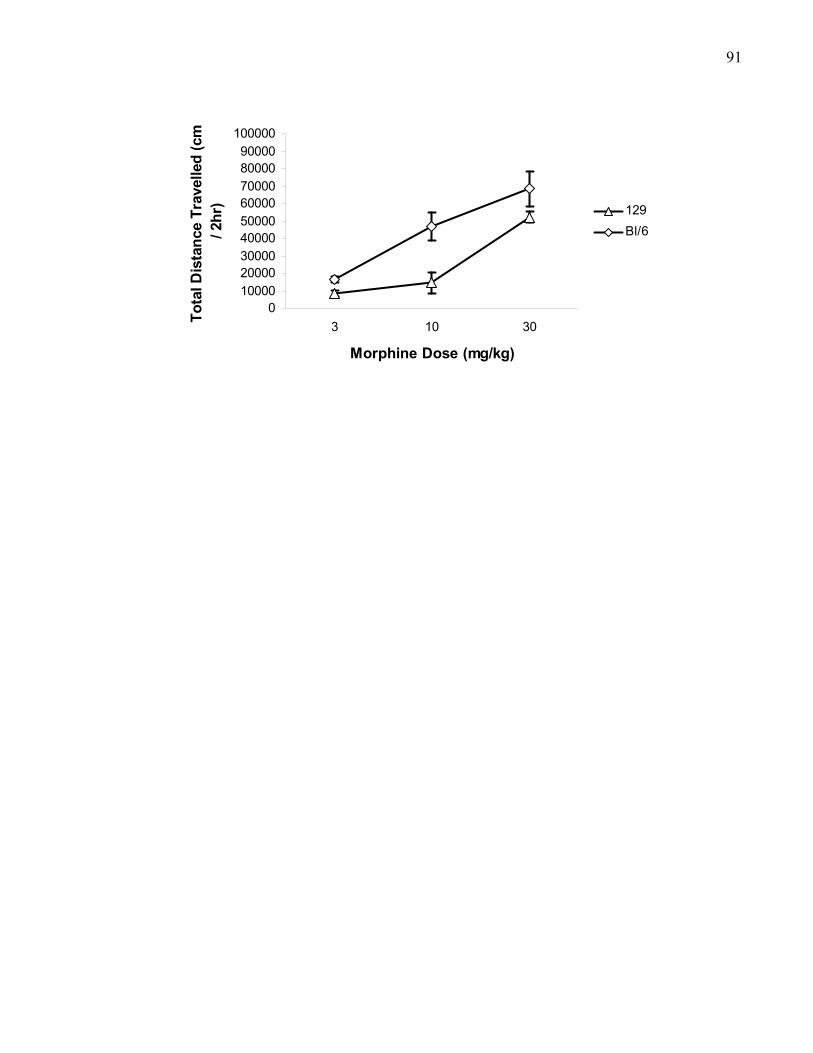
91
0100002000030000400005000060000700008000090000
100000
3 10 30
Morphine Dose (mg/kg)
Tota
l Dis
tanc
e Tr
avel
led
(cm
/ 2
hr) 129
Bl/6
92This indicates that maximal locomotion levels were not achieved in 129 mice with the doses
used in this experiment. Second, total locomotion in response to 10 mg/kg morphine in B6 mice
was not significantly different from total locomotion in response to 30 mg/kg morphine in 129
mice. This last comparison provides the strongest support for a difference in sensitivity to
morphine locomotion between B6 and 129 mice.
Locomotion Time Course.
To qualitatively describe the time course of locomotion prior to detailed statistical
analysis, Figure 1.6 shows locomotion data grouped in 5-min bins. On average, across doses
locomotion gradually increased over the first half hour of testing, peaked around 40 to 60
minutes and then declined over the course of the second hour of testing.
30 mg/kg Morphine Locomotion.
While 30 mg/kg (i.p.) morphine produced robust locomotion relative to saline in all mice
tested, B6 wild-type mice showed slightly greater locomotion compared to 129 mice. Therefore,
the B6 strain not only showed greater spontaneous exploration but was also more sensitive to the
stimulant effect of morphine than the 129 strain.
Figures 1.7a and 1.7b show the time course of locomotion across the 2-hr testing period
in wild-type and M5 knockout mice of the 129 and B6 background strains, respectively. For each
strain, data were separately analyzed using a 3-way between-within repeated measures ANOVA,
with genotype as the between-subjects factor and treatment (saline vs 30 mg/kg morphine) and
time (10 min blocks) as the within-subjects factors.
For B6 mice a significant three-way interaction between genotype, treatment, and time
was found, F (2.75, 71.65) = 2.90, p < 0.05 (with Greenhouse-Geyser corrected degrees of
freedom). This indicates that the temporal profile of morphine-induced locomotion was not equal
across the 2-hr period in wild-type and M5 knockout mice. Indeed, while locomotion in wild-

93type mice peaked at approximately 40 min and then began declining (Figure 1.7b), M5 knockout
mice
Figure 1.6. Locomotion time course in 5-min time bins in 129 (left) and B6 (right) wild-type
mice following saline (open squares) or 3, 10, or 30 mg/kg (i.p.) morphine (solid squares).
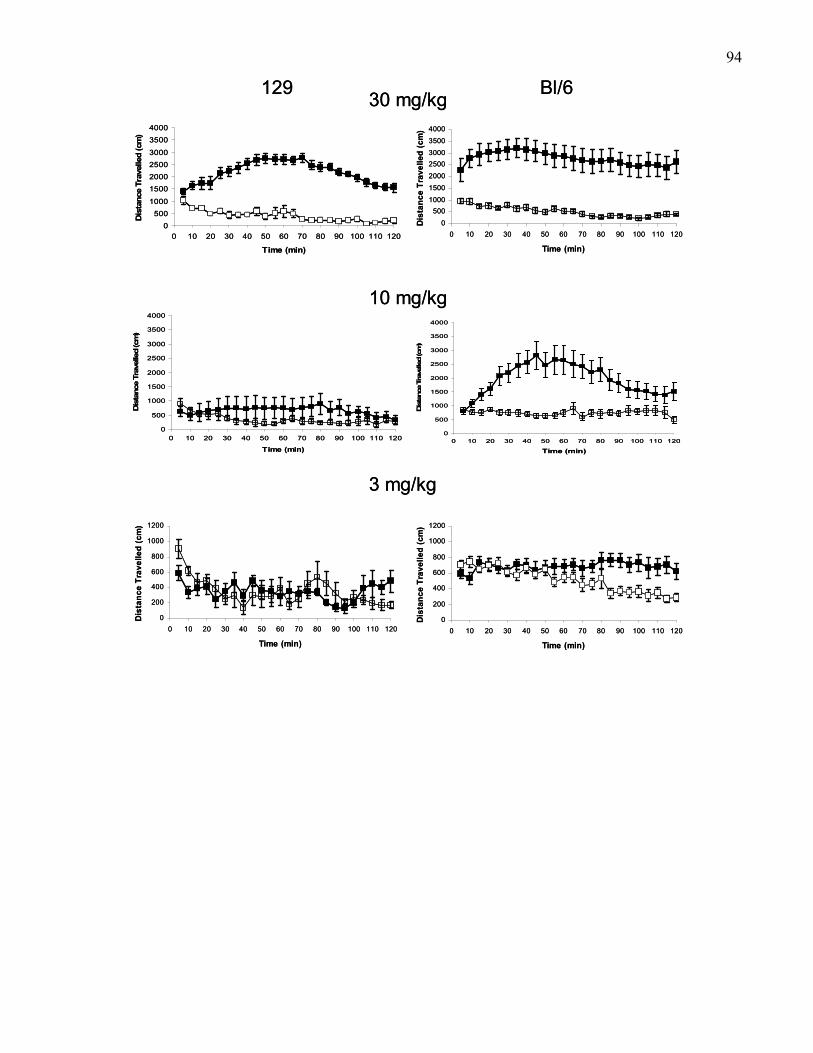
94
129 Bl/630 mg/kg
3 mg/kg
10 mg/kg
0
500
1000
1500
2000
2500
3000
3500
4000
0 10 20 30 40 50 60 70 80 90 100 110 120
Time (min)
Dis
tanc
e Tr
avel
led
(cm
)
0
5001000
1500
2000
25003000
3500
4000
0 10 20 30 40 50 60 70 80 90 100 110 120
Time (min)
Dis
tanc
e Tr
avel
led
(cm
)
0
200
400
600
800
1000
1200
0 10 20 30 40 50 60 70 80 90 100 110 120
Time (min)
Dis
tanc
e Tr
avel
led
(cm
)
0
200
400
600
800
1000
1200
0 10 20 30 40 50 60 70 80 90 100 110 120
Time (min)
Dis
tanc
e Tr
avel
led
(cm
)
0
500
1000
1500
2000
2500
3000
3500
4000
0 10 20 30 40 50 60 70 80 90 100 110 120
Time (min)
Dis
tanc
e Tr
avel
led
(cm
)
0500
1000
1500200025003000
35004000
0 10 20 30 40 50 60 70 80 90 100 110 120
Time (min)
Dis
tanc
e Tr
avel
led
(cm
)
129 Bl/630 mg/kg
3 mg/kg
10 mg/kg
0
500
1000
1500
2000
2500
3000
3500
4000
0 10 20 30 40 50 60 70 80 90 100 110 120
Time (min)
Dis
tanc
e Tr
avel
led
(cm
)
0
5001000
150020002500300035004000
0 10 20 30 40 50 60 70 80 90 100 110 120
Time (min)
Dis
tanc
e Tr
avel
led
(cm
)
0
200
400
600
800
1000
1200
0 10 20 30 40 50 60 70 80 90 100 110 120
Time (min)
Dis
tanc
e Tr
avel
led
(cm
)
0
200
400
600
800
1000
1200
0 10 20 30 40 50 60 70 80 90 100 110 120
Time (min)
Dis
tanc
e Tr
avel
led
(cm
)
0
500
1000
1500
2000
2500
3000
3500
4000
0 10 20 30 40 50 60 70 80 90 100 110 120
Time (min)
Dis
tanc
e Tr
avel
led
(cm
)
0500
1000
1500200025003000
35004000
0 10 20 30 40 50 60 70 80 90 100 110 120
Time (min)
Dis
tanc
e Tr
avel
led
(cm
)
95showed a more gradual locomotion onset that never reached a clear peak across the two-hour
period. In fact, locomotor levels were not decreasing even at the end of the 2-hr period.
Subsequent post-hoc comparisons of groups at individual time points showed that at each time
time point, 30 mg/kg (i.p) morphine produced significant locomotion relative to saline in both
wild-type and M5 knockout mice (WT and KO all p’s<0.000001). Most importantly, morphine-
induced locomotion was significantly lower in M5 knockout mice compared to wild-type mice
(p<0.05 at 10, 70-90 min, p<0.001 at 20-40 min, and p<0.01 at 50-60 min).
In 129 wild-type and M5 knockout mice (Figure 1.7a) the data looked similar to what was
seen in B6 mice. However, the three-way interaction between time, treatment, and genotype did
not reach statistical significance (F (2.5, 42.7) = 2.1, p > 0.1, with Greenhouse-Geyser corrected
degrees of freedom). Indeed, while morphine-induced locomotion was consistently lower in M5
knockout mice compared to wild-type mice, the temporal profiles (i.e. onset of locomotion and
peak locomotion) were similar (Figure 1.7a). In support of this there was a significant main
effect of genotype, F (1, 17) = 10.08, p < 0.01, which was modified by an interaction between
genotype and treatment, F (1, 17) = 13.15, p < 0.01. Finally there was a significant main effect of
time, F (3.8, 65.6) = 17.37, p < 0.00001, that was modified by an interaction between time and
treatment, F (2.5, 42.7) = 20.99, p < 0.000001. The time-by-treatment interaction simply
indicates that the overall effect of drug treatment overall varied in all groups of mice tested
across the 2-hr period, so this interaction was not further analyzed. The significant treatment-by-
genotype interaction was of more interest, and was subjected to post-hoc analysis. This analysis
showed that at all time points (i.e. across the entire two-hour period) locomotion in response to
saline did not differ according to genotype (all p’s > 0.8), but, as expected, morphine increased
locomotion relative to saline in both genotypes (p<0.00001 in WT and p<0.0001 in KO).
Critically, morphine-induced locomotion was significantly lower in M5 knockout mice compared
to wild-type mice at all time points (p<0.001).
96Figure 1.7. 30 mg/kg (i.p) morphine-induced locomotion in 129 (A) and B6 (B) wild-type and
M5 knockout mice. Symbols for (A) and (B): open squares show saline locomotion (10 ml/kg,
i.p.) in wild-type mice, open circles show saline locomotion in M5 knockout mice, closed
squares show morphine locomotion (30 mg/kg, i.p.) in wild-type mice, closed circles show
morphine locomotion in M5 knockout mice. (A) Morphine-induced locomotion in 129 wild-type
(n=9) and M5 knockout mice (n=11); ∗ p < 0.00001 wild-type morphine vs. saline, † p < 0.0001
M5 knockout morphine vs. saline, # p < 0.001 wild-type morphine vs. M5 knockout morphine.
(B) Morphine-induced locomotion in B6 wild-type (n=14) and M5 knockout mice (n=14); ∗ p <
0.000001 wild-type morphine vs. saline, † p < 0.000001 M5 knockout morphine vs. saline, # p <
0.05 at 10, 70, 80, 90 min, and p<0.001 at 20, 30, 40 min, and p<0.01 at 50 and 60 min wild-type
morphine vs. M5 knockout morphine.
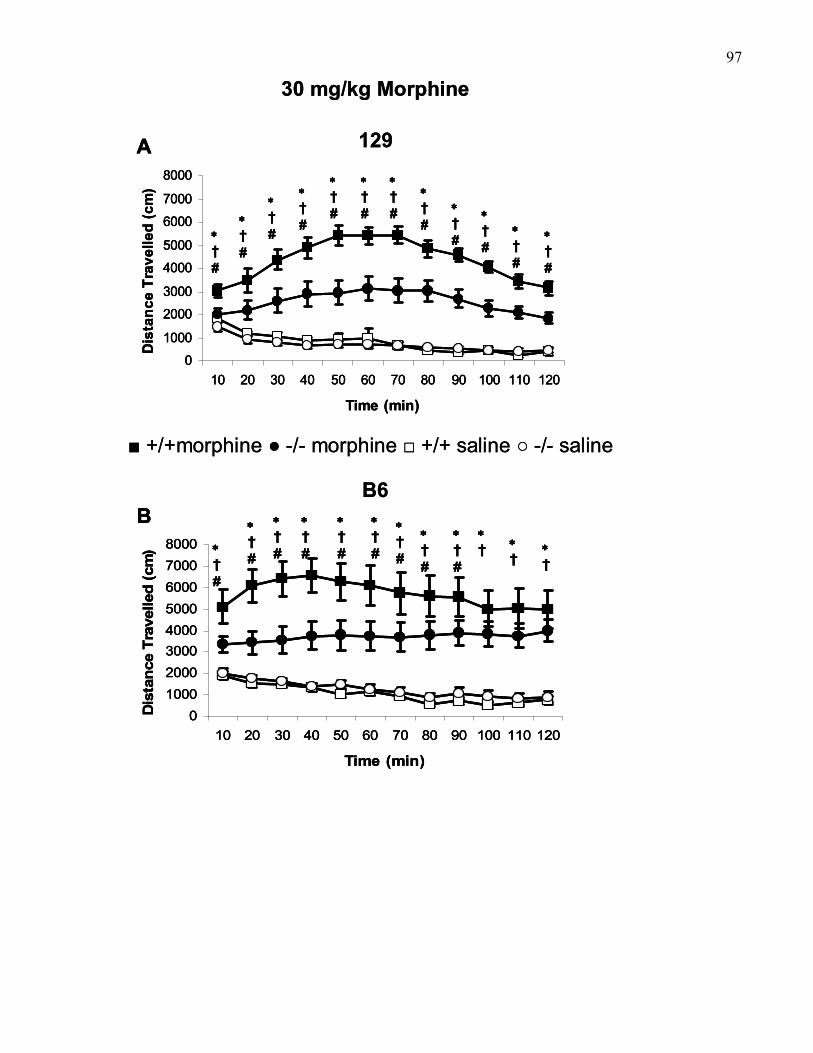
97
0
1000
2000
3000
4000
5000
6000
7000
8000
10 20 30 40 50 60 70 80 90 100 110 120
Time (min)
Dis
tanc
e Tr
avel
led
(cm
)
∗†#
∗†#
∗†#
∗†#
∗†#
∗†#
∗†#
∗†#
∗†#
∗†#
∗†#
∗†#
A
010002000300040005000600070008000
10 20 30 40 50 60 70 80 90 100 110 120
Time (min)
Dis
tanc
e Tr
avel
led
(cm
) ∗†#
∗†#
∗†#
∗†#
∗†#
∗†#
∗†#
∗†#
∗†#
∗† ∗
†∗†
B
30 mg/kg Morphine
129
B6
■ +/+morphine ● -/- morphine □ +/+ saline ○ -/- saline
0
1000
2000
3000
4000
5000
6000
7000
8000
10 20 30 40 50 60 70 80 90 100 110 120
Time (min)
Dis
tanc
e Tr
avel
led
(cm
)
∗†#
∗†#
∗†#
∗†#
∗†#
∗†#
∗†#
∗†#
∗†#
∗†#
∗†#
∗†#
A
0
1000
2000
3000
4000
5000
6000
7000
8000
10 20 30 40 50 60 70 80 90 100 110 120
Time (min)
Dis
tanc
e Tr
avel
led
(cm
)
∗†#
∗†#
∗†#
∗†#
∗†#
∗†#
∗†#
∗†#
∗†#
∗†#
∗†#
∗†#
A
010002000300040005000600070008000
10 20 30 40 50 60 70 80 90 100 110 120
Time (min)
Dis
tanc
e Tr
avel
led
(cm
) ∗†#
∗†#
∗†#
∗†#
∗†#
∗†#
∗†#
∗†#
∗†#
∗† ∗
†∗†
B
010002000300040005000600070008000
10 20 30 40 50 60 70 80 90 100 110 120
Time (min)
Dis
tanc
e Tr
avel
led
(cm
) ∗†#
∗†#
∗†#
∗†#
∗†#
∗†#
∗†#
∗†#
∗†#
∗† ∗
†∗†
B
30 mg/kg Morphine
129
B6
■ +/+morphine ● -/- morphine □ +/+ saline ○ -/- saline
9810 mg/kg Morphine Locomotion.
The two wild-type strains of mice responded differently to the stimulant effect of
morphine most clearly at the 10 mg/kg dose. While this dose of morphine produced some
locomotion in both 129 and B6 wild-type mice, B6 mice showed much greater locomotion in
response to this dose than 129 mice (Figure 1.8a and 1.8b).
Figures 1.8a and 1.8b show the time course of locomotion across the two-hour testing
period in wild-type and M5 knockout mice of the 129 and B6 background strains, respectively.
For each strain, data were separately analyzed using a 3-way between-within repeated measures
ANOVA with genotype as the between-subjects factor and treatment (saline vs 10 mg/kg
morphine) and time (10 min blocks) as the within-subjects factors.
For B6 mice (Figure 1.8b) this revealed a significant three-way interaction between
genotype, treatment, and time, F (2.5, 45. 5) = 3.31, p < 0.05 (with Greenhouse-Geyser corrected
degrees of freedom). Subsequent post-hoc comparisons of groups at individual time points
showed significantly greater locomotion following morphine compared to saline in both wild-
type and M5 knockout mice (WT p<0.01 at 20 min, and 90-120 min, and p<0.001 at 30-80 min;
KO p < 0.05 at 70-110 min). Thus, in M5 knockout mice 10 mg/kg morphine produced no
significant locomotion in the first hour of testing compared to saline. For most of the second
hour there were significant differences compared to saline, but the amount of locomotion in
knockouts within 10 min bins was similar across most of the testing period. At the time points
where significant differences were obtained, saline-induced locomotion decreased (i.e. declining
in knockouts across the second hour) rather than morphine-induced locomotion increasing. Most
importantly, morphine-induced locomotion was significantly lower in M5 knockout mice
compared to wild-type mice (p<0.05 at 30 min, 40 min, 70 min, 80 min, p<0.01 at 50 min, and
60 min, with a non-significant trend at 90 min, p=0.052).
99In 129 mice (Figure 1.8a), 10 mg/kg morphine did not add much locomotion relative to
saline. Statistical analysis revealed only a main effect of time, (F (2.5, 29.5) = 4.39, p < 0.05 with
Greenhouse-Geyser corrected degrees of freedom), that was modified by a significant interaction
between time and treatment, (F (3.1, 34.1) = 4.29, p < 0.05 with Greenhouse-Geyser corrected
degrees of freedom). The time-by-treatment interaction indicates that the effect of drug treatment
overall varied in all groups tested across the 2-hr period. To determine at what time points 10
mg/kg morphine produced significant locomotion relative to saline, post-hoc analyses showed
that morphine overall (across both genotypes) produced significantly greater locomotion
compared to saline at the following time points: p<0.05 at 30 min, 60 min, 110 min, p<0.01 at 50
min, 90 min, 100 min and p<0.001 at 40 min, 70 min, 80 min.
3 mg/kg Morphine Locomotion.
As at the 10 mg/kg dose, differences in the locomotor responses of the two strains to the
stimulant effect of morphine were evident at the 3 mg/kg dose. In this case, 3 mg/kg morphine
induced no locomotion compared to saline in 129 mice, but did add locomotion in B6 wild-type
mice relative to saline, especially in the second hour.
For B6 mice (Figure 1.9b) statistical analysis revealed a significant main effect of time, F
(5.1, 112.3) = 12.3, p<0.00001 (with Greenhouse-Geyser corrected degrees of freedom), that was
modified by a significant interaction with treatment, F (5.1, 111.4) = 13.8, p<0.00001 (with
Greenhouse-Geyser corrected degrees of freedom). The time-by-treatment interaction indicates
that the effect of drug treatment overall varied in all groups tested across the 2-hr period. To
determine the time points at which 3 mg/kg morphine produced significant locomotion relative
to saline, post-hoc analyses showed that morphine overall (across both genotypes) produced
significantly greater locomotion compared to saline at the following time points: p<0.01 at 50
min, and 70 min, p<0.001 at 80 min, and p<0.00001 at 90-120 min.
100Figure 1.8. 10 mg/kg (i.p) morphine-induced locomotion in 129 (A) and B6 (B) wild-type and
M5 knockout mice. Symbols for both (A) and (B): open squares show saline locomotion (10
ml/kg, i.p.) in wild-type mice, open circles show saline locomotion in M5 knockout mice, closed
squares show morphine locomotion (10 mg/kg, i.p.) in wild-type mice, closed circles show
morphine locomotion in M5 knockout mice. (A) Morphine-induced locomotion in 129 wild-type
(n=7) and M5 knockout mice (n=6); • p < 0.05 •• p < 0.01 ••• p < 0.001 overall morphine
response (collapsed across wild-type and M5 knockout) vs. overall saline response (collapsed
across wild-type and M5 knockout). (B) Morphine-induced locomotion in B6 wild-type (n=10)
and M5 knockout mice (n=10); ∗ p < 0.01 ∗∗ p < 0.001 wild-type morphine vs. saline, † p < 0.05
M5 knockout morphine vs. saline, # p < 0.05 ## p < 0.01 wild-type morphine vs. M5 knockout
morphine.
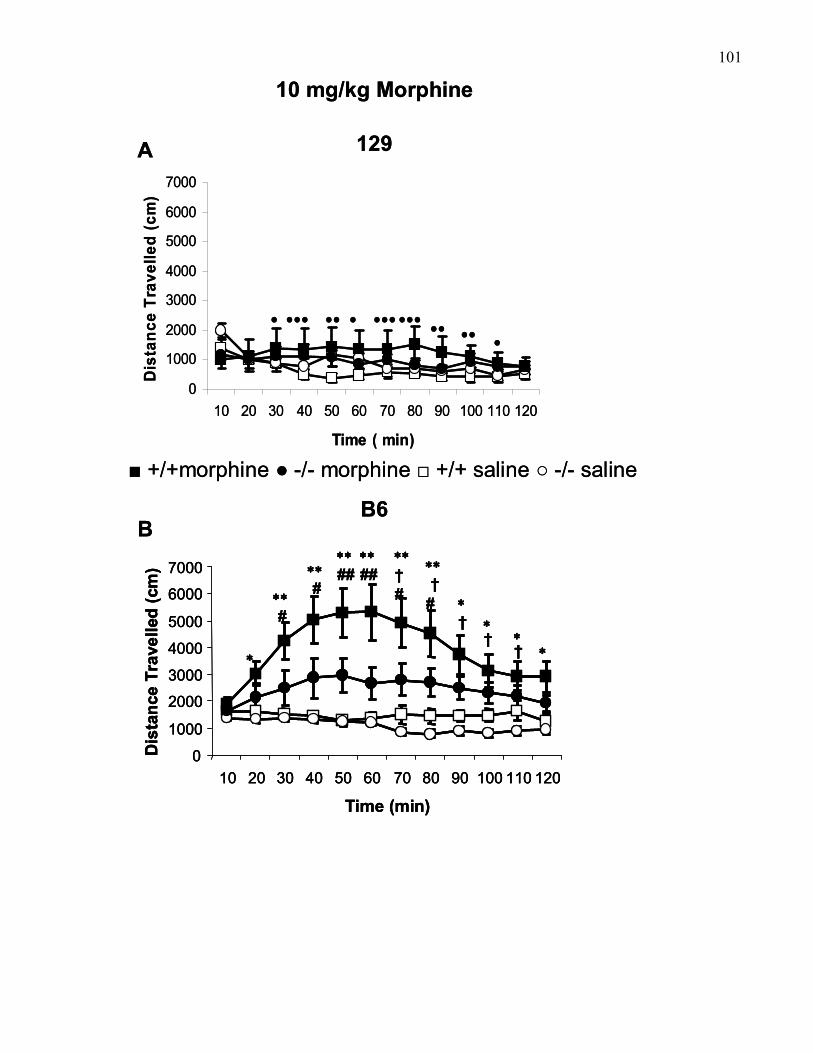
101
0
1000
2000
3000
4000
5000
6000
7000
10 20 30 40 50 60 70 80 90 100 110 120
Time ( min)
Dis
tanc
e Tr
avel
led
(cm
)
• •
•
•• •• ••••• ••• •••
A
B
10 mg/kg Morphine
129
B6
0
1000
2000
3000
4000
5000
6000
7000
10 20 30 40 50 60 70 80 90 100 110 120
Time (min)
Dis
tanc
e Tr
avel
led
(cm
)
∗
∗∗#
∗∗#
∗∗##
∗∗##
∗∗†#
∗∗†
# ∗† ∗
† ∗† ∗
■ +/+morphine ● -/- morphine □ +/+ saline ○ -/- saline
0
1000
2000
3000
4000
5000
6000
7000
10 20 30 40 50 60 70 80 90 100 110 120
Time ( min)
Dis
tanc
e Tr
avel
led
(cm
)
• •
•
•• •• ••••• ••• •••
A
B
10 mg/kg Morphine
129
B6
0
1000
2000
3000
4000
5000
6000
7000
10 20 30 40 50 60 70 80 90 100 110 120
Time (min)
Dis
tanc
e Tr
avel
led
(cm
)
∗
∗∗#
∗∗#
∗∗##
∗∗##
∗∗†#
∗∗†
# ∗† ∗
† ∗† ∗
0
1000
2000
3000
4000
5000
6000
7000
10 20 30 40 50 60 70 80 90 100 110 120
Time (min)
Dis
tanc
e Tr
avel
led
(cm
)
∗
∗∗#
∗∗#
∗∗##
∗∗##
∗∗†#
∗∗†
# ∗† ∗
† ∗† ∗
■ +/+morphine ● -/- morphine □ +/+ saline ○ -/- saline
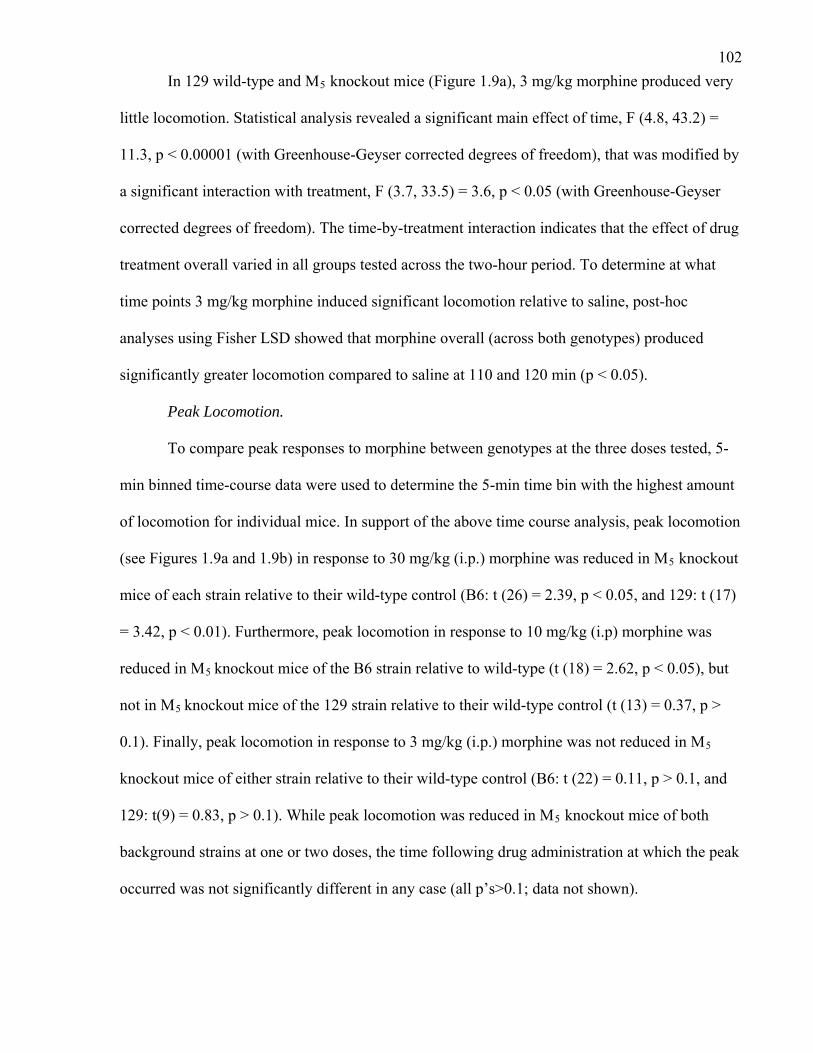
102In 129 wild-type and M5 knockout mice (Figure 1.9a), 3 mg/kg morphine produced very
little locomotion. Statistical analysis revealed a significant main effect of time, F (4.8, 43.2) =
11.3, p < 0.00001 (with Greenhouse-Geyser corrected degrees of freedom), that was modified by
a significant interaction with treatment, F (3.7, 33.5) = 3.6, p < 0.05 (with Greenhouse-Geyser
corrected degrees of freedom). The time-by-treatment interaction indicates that the effect of drug
treatment overall varied in all groups tested across the two-hour period. To determine at what
time points 3 mg/kg morphine induced significant locomotion relative to saline, post-hoc
analyses using Fisher LSD showed that morphine overall (across both genotypes) produced
significantly greater locomotion compared to saline at 110 and 120 min (p < 0.05).
Peak Locomotion.
To compare peak responses to morphine between genotypes at the three doses tested, 5-
min binned time-course data were used to determine the 5-min time bin with the highest amount
of locomotion for individual mice. In support of the above time course analysis, peak locomotion
(see Figures 1.9a and 1.9b) in response to 30 mg/kg (i.p.) morphine was reduced in M5 knockout
mice of each strain relative to their wild-type control (B6: t (26) = 2.39, p < 0.05, and 129: t (17)
= 3.42, p < 0.01). Furthermore, peak locomotion in response to 10 mg/kg (i.p) morphine was
reduced in M5 knockout mice of the B6 strain relative to wild-type (t (18) = 2.62, p < 0.05), but
not in M5 knockout mice of the 129 strain relative to their wild-type control (t (13) = 0.37, p >
0.1). Finally, peak locomotion in response to 3 mg/kg (i.p.) morphine was not reduced in M5
knockout mice of either strain relative to their wild-type control (B6: t (22) = 0.11, p > 0.1, and
129: t(9) = 0.83, p > 0.1). While peak locomotion was reduced in M5 knockout mice of both
background strains at one or two doses, the time following drug administration at which the peak
occurred was not significantly different in any case (all p’s>0.1; data not shown).
103Figure 1.9. 3 mg/kg (i.p) morphine-induced locomotion in 129 (A) and B6 (B) wild-type and M5
knockout mice. Symbols for both (A) and (B): open squares show saline locomotion (10 ml/kg,
i.p.) in wild-type mice, open circles show saline locomotion in M5 knockout mice, closed
squares show morphine locomotion (10 mg/kg, i.p.) in wild-type mice, closed circles show
morphine locomotion in M5 knockout (A) Morphine-induced locomotion in 129 wild-type (n=5)
and M5 knockout mice (n=6) • p < 0.05 overall morphine response (collapsed across wild-type
and M5 knockout) vs. overall saline response (collapsed across wild-type and M5 knockout). (B)
Morphine-induced locomotion in B6 wild-type (n=12) and M5 knockout mice (n=12); •• p <
0.01 ••• p < 0.001 •••• p < 0.00001 overall morphine response (collapsed across wild-type and
M5 knockout) vs. overall saline response (collapsed across wild-type and M5 knockout).
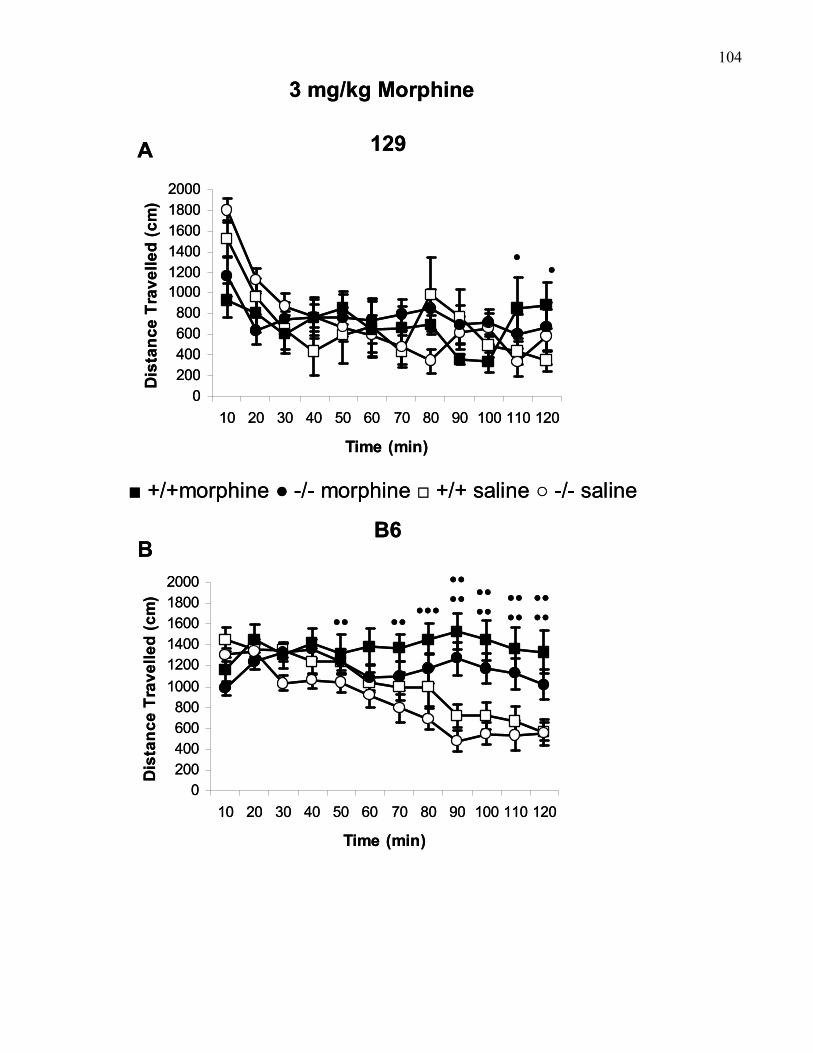
104
A
B
3 mg/kg Morphine
129
B6
0200400600800
100012001400160018002000
10 20 30 40 50 60 70 80 90 100 110 120
Time (min)
Dis
tanc
e Tr
avel
led
(cm
)
••
0200400600800
100012001400160018002000
10 20 30 40 50 60 70 80 90 100 110 120
Time (min)
Dis
tanc
e Tr
avel
led
(cm
)
••••
•••••
••
••••
••••
••••
■ +/+morphine ● -/- morphine □ +/+ saline ○ -/- saline

105Figure 1.10. Peak locomotion in (A) 129 and (B) B6 wild-type (+/+) and M5 knockout (-/-) mice.
Peak locomotion was determined by grouping locomotion data in 5-min bins and then
determining for each mouse individually the 5-min bin with the highest level of locomotion.∗
p<0.05.
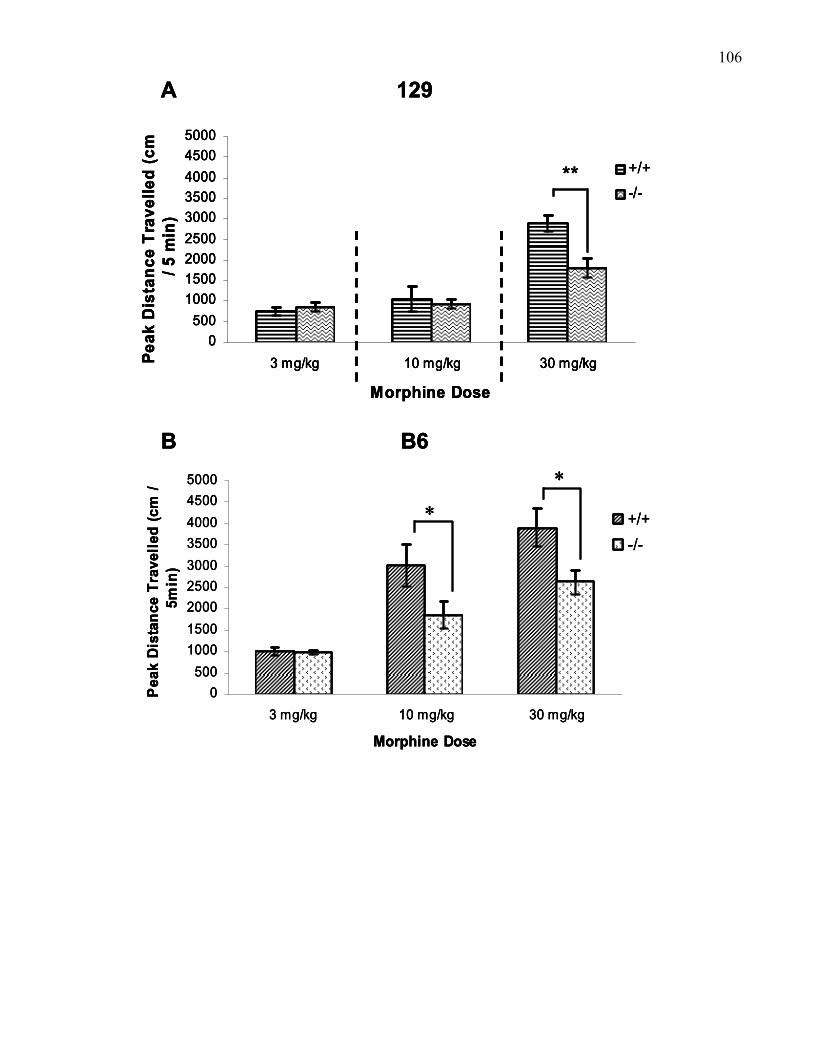
106
0500
100015002000250030003500400045005000
3 mg/kg 10 mg/kg 30 mg/kg
Morphine Dose
Peak
Dis
tanc
e Tr
avel
led
(cm
/ 5
min
) +/+-/-
**
A 129
B B6
0500
100015002000250030003500400045005000
3 mg/kg 10 mg/kg 30 mg/kg
Morphine Dose
Peak
Dis
tanc
e Tr
avel
led
(cm
/ 5m
in)
+/+-/-
∗
∗
0500
100015002000250030003500400045005000
3 mg/kg 10 mg/kg 30 mg/kg
Morphine Dose
Peak
Dis
tanc
e Tr
avel
led
(cm
/ 5
min
) +/+-/-
**
A 129
0500
100015002000250030003500400045005000
3 mg/kg 10 mg/kg 30 mg/kg
Morphine Dose
Peak
Dis
tanc
e Tr
avel
led
(cm
/ 5
min
) +/+-/-
**
0500
100015002000250030003500400045005000
3 mg/kg 10 mg/kg 30 mg/kg
Morphine Dose
Peak
Dis
tanc
e Tr
avel
led
(cm
/ 5
min
) +/+-/-
**
A 129
B B6
0500
100015002000250030003500400045005000
3 mg/kg 10 mg/kg 30 mg/kg
Morphine Dose
Peak
Dis
tanc
e Tr
avel
led
(cm
/ 5m
in)
+/+-/-
∗
∗
B B6
0500
100015002000250030003500400045005000
3 mg/kg 10 mg/kg 30 mg/kg
Morphine Dose
Peak
Dis
tanc
e Tr
avel
led
(cm
/ 5m
in)
+/+-/-
∗
∗
107Experiment 2: Effects of naltrexone pre-treatment on morphine-induced locomotion in B6
wild-type and M5 knockout mice
Introduction
The morphine dose that induced the most locomotion in Experiment 1 was 30 mg/kg
(i.p.). Is the locomotion observed at this dose due to the action of morphine on opioid receptors?
Compared to morphine-induced locomotion in rats, 30 mg/kg is a high dose and so it is possible
that opioid receptor binding is saturated and secondary binding to a non-opioid receptor may
occur, contributing to the overall effect observed in mice. To test this possibility the non-
selective opioid receptor antagonist naltrexone was administered prior to systemic morphine in
B6 wild-type and M5 knockout mice.
Materials and Methods
Procedure
Locomotion testing took place across 2 consecutive days. Each day, mice were taken
from their housing area in their home cages, weighed, and then placed in the testing room 20 min
prior to initiation of locomotion testing to allow for acclimatization to the testing environment.
On the first day, spontaneous locomotion was tested in all mice over the course of 2 hrs as
described for Experiment 1. On day 2, each group of B6 wild-type and M5 knockout mice was
given 2 consecutive injections that involved combinations of the non-competitive opioid receptor
antagonist naltrexone (1 or 10 mg/kg, i.p.), saline (10 ml/kg, i.p.) or morphine (30 mg/kg, i.p.).
Wild-type and M5 knockout mice were randomly assigned to the following groups (n=6 per
group): 1) saline then saline, 2) 1 mg/kg naltrexone then saline, 3) 1mg/kg naltrexone then 30
mg/kg morphine, 4) 10mg/kg naltrexone then saline, 5) 10 mg/kg naltrexone then 30 mg/kg
morphine, 5) saline then 30 mg/kg morphine. The 2 injections were given 5 min apart, during
which mice were returned to their home cages. In an effort to minimize the potential confound
associated with interference between drugs given at the same injection site, the two injections
108were made on opposite sides of the intraperitoneal cavity. Following the second injection, mice
were immediately placed into the testing chambers and locomotion was measured for a period of
2 hours.
Results
Total Locomotion
Figure 1.11 compares total locomotion across the two-hour testing period following pre-
treatment with either 1 or 10 mg/kg (i.p.) naltrexone. The data were analyzed using a two-way
between-subjects ANOVA, with genotype, and treatment (i.e. the combination of
saline/naltrexone pre-treatment with saline/morphine treatment) as factors. Results showed a
significant interaction between genotype and treatment, F (5, 60) = 2.89, p < 0.05. Post-hoc
analysis revealed several effects. First, consistent with the previous locomotion experiment,
overall locomotion induced by 30 mg/kg (i.p.) morphine in M5 knockout mice was reduced
compared to wild-type mice (p < 0.001). Second, in both wild-type and M5 knockout mice both
doses of naltrexone (1 and 10 mg/kg) significantly reduced total morphine-induced locomotion
(p < 0.0001 for both doses and both genotypes). Third, in wild-type mice 10 mg/kg naltrexone on
its own did not reduce total locomotion relative to saline (p > 0.1), while 1 mg/kg naltrexone
reduced locomotion slightly relative to saline, approaching statistical significance (p = 0.066).
Fourth, in M5 knockout mice neither dose of naltrexone significantly reduced total locomotion
relative to saline (p > 0.1). Finally, while it appeared that total locomotion induced by 30 mg/kg
morphine was not blocked as strongly by pre-treatment with 1 mg/kg naltrexone in M5 knockout
mice relative to wild-type mice, this comparison was not statistically significant (p > 0.1).
Locomotion Time Course
In the previous experiment comparing locomotion across a range of morphine doses in
wild-type and M5 knockout mice, analysis of locomotion time course revealed differences in
sensitivity to the stimulant effect of morphine that were not necessarily reflected in the analysis
109Figure 1.11. Effects of naltrexone pre-treatment (1 or 10 mg/kg, i.p.) on 30 mg/kg (i.p.) total
morphine-induced locomotion over two hours in B6 wild-type (+/+) and M5 knockout (-/-) mice
(n=6 per group). Injection combinations S/M = saline followed by morphine, N1/M = 1mg/kg
naltrexone followed by morphine, N10/M = 10mg/kg naltrexone followed by morphine, N1/S =
1 mg/kg naltrexone followed by saline, N10/S = 10 mg/kg naltrexone followed by saline, S/S =
saline followed by saline. ∗ p < 0.001 ∗∗ 0.00001.
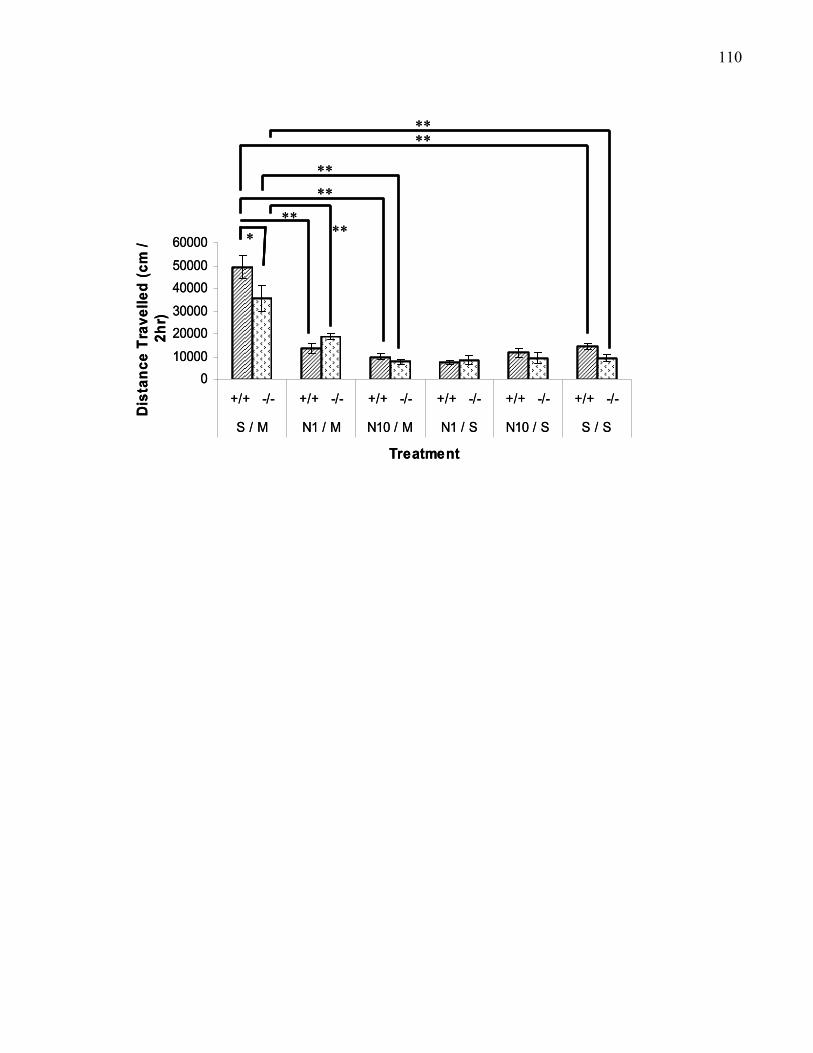
110
010000
2000030000
4000050000
60000
+/+ -/- +/+ -/- +/+ -/- +/+ -/- +/+ -/- +/+ -/-
S / M N1 / M N10 / M N1 / S N10 / S S / S
Treatment
Dis
tanc
e Tr
avel
led
(cm
/ 2h
r)
∗ ∗∗
∗∗∗∗
∗∗
∗∗∗∗
010000
2000030000
4000050000
60000
+/+ -/- +/+ -/- +/+ -/- +/+ -/- +/+ -/- +/+ -/-
S / M N1 / M N10 / M N1 / S N10 / S S / S
Treatment
Dis
tanc
e Tr
avel
led
(cm
/ 2h
r)
∗ ∗∗
∗∗∗∗
∗∗
∗∗∗∗
111of total locomotion. Thus, naltrexone data were also analyzed by looking at changes in
locomotion across the 2-hr test period to assess whether the effect of naltrexone changed
over time (Figures 1.12a and 1.12b). Data were analyzed separately in wild-type and M5
knockout mice using two-way between-within ANOVA, with treatment (i.e. the combination of
saline/naltrexone pre-treatment with saline/morphine treatment) as the between-subjects factor
and time (i.e. 10-min intervals) as the within-subjects factor.
In wild-type mice, a significant interaction between treatment and time was obtained, F
(19.5, 117) = 4.85, p < 0.000001 (with Greenhouse-Geyser corrected degrees of freedom). Post-
hoc analyses was used to compare the 6 treatment groups at each 10-min time point. As
expected, 30 mg/kg morphine produced significant locomotion relative to saline at every time
point (all p’s < 0.01). In wild-type mice, both 1 and 10 mg/kg naltrexone pre-treatment
significantly reduced morphine-induced locomotion relative to saline pre-treatment at all time
points tested (all p’s<0.000001 for both doses). In fact, pre-treatment with both doses of
naltrexone reduced morphine-induced locomotion to below saline levels over roughly the first
hour of testing (1 mg/kg naltrexone: p < 0.05 at 10 min, and p < 0.01 at 20, 30, 40, and 50 min;
10 mg/kg naltrexone: p < 0.05 at 20 min, and p < 0.01 at 30, 40, 50, and 60 min).
Furthermore, in B6 wild-type mice, 1 mg/kg naltrexone on its own significantly reduced
locomotion to below saline levels at several time points (p < 0.05 at 10, and 30 min, and p < 0.01
at 60, 70, 80, 90, and 110 minutes), and 10 mg/kg naltrexone reduced locomotion to below saline
levels early on during testing (p < 0.05 at 20 and 30 min, and p < 0.01 at 40 min).
In M5 knockout mice, 30 mg/kg morphine increased locomotion relative to saline at all
time points (all p’s < 0.01). As in wild-type mice pre-treatment with 10 mg/kg naltrexone
significantly reduced morphine-induced locomotion at all time points (all p’s < 0.000001), and to
below saline levels at 20, 30, and 40 min (p<0.01). Unlike wild-type mice, 10 mg/kg naltrexone
on its own did not significantly change locomotion relative to saline at any time point tested. Pre-
112treatment with 1 mg/kg naltrexone also reduced morphine-induced locomotion, but not to the
same extent as in wild-types, with significantly lower locomotion over the first 90 min (all p’s <
0.05) but not during the final 30 minutes of testing, and to below saline levels at only 20 minutes
(p<0.05). Unlike wild-types, and similar to the 10 mg/kg dose in M5 knockout mice, 1 mg/kg
naltrexone on its own did not reduce locomotion to below saline levels at any time point tested.
This suggests that M5 knockout mice are less sensitive to the effects of 1 mg/kg
naltrexone than wild-type mice. In fact, in wild-type mice morphine-induced locomotion
following pre-treatment with 1 mg/kg naltrexone was effectively reduced to below saline levels
for the first 50 minutes and then gradually increased until reaching above saline levels at 100,
110, and 120 minutes (p<0.01). By comparison, in M5 knockout mice morphine-induced
locomotion was reduced by pre-treatment with 1 mg/kg naltrexone to below saline levels at only
20 minutes, and then was above saline levels by sixty minutes (p < 0.01), no longer differing
from morphine-induced locomotion after 90 min.
113Figure 1.12. Time course of 30 mg/kg (i.p.) morphine-induced locomotion following pre-
treatment with 1 mg/kg (i.p.) or 10 mg/kg (i.p.) naltrexone in (A) B6 wild-type and (B) B6 M5
knockout mice (n=6 per group). ∗ saline vs saline/morphine p<0.000001; † 1 mg/kg
naltrexone/morphine vs saline/morphine p<0.05; †† 1mgkg naltrexone/morphine vs
saline/morphine p<0.000001; # 10 mg/kg naltrexone/morphine vs saline/morphine p<0.000001;
§ 1mg/kg naltrexone/saline vs saline/saline p<0.05; §§ 1 mg/kg naltrexone/saline vs saline/saline
p<0.01; ◊ 10 mg/kg naltrexone/saline vs saline/saline p<0.05; ◊◊ 10 mg/kg naltrexone/saline vs
saline/saline p<0.01; ƒ 10 mg/kg naltrexone/morphine vs saline/saline p<0.05; ƒƒ 10 mg/kg
naltrexone/morphine vs saline/saline p<0.01; • 1 mg/kg naltrexone/morphine vs saline/saline
p<0.05; •• 1mg/kg naltrexone/morphine vs saline/saline p<0.01.
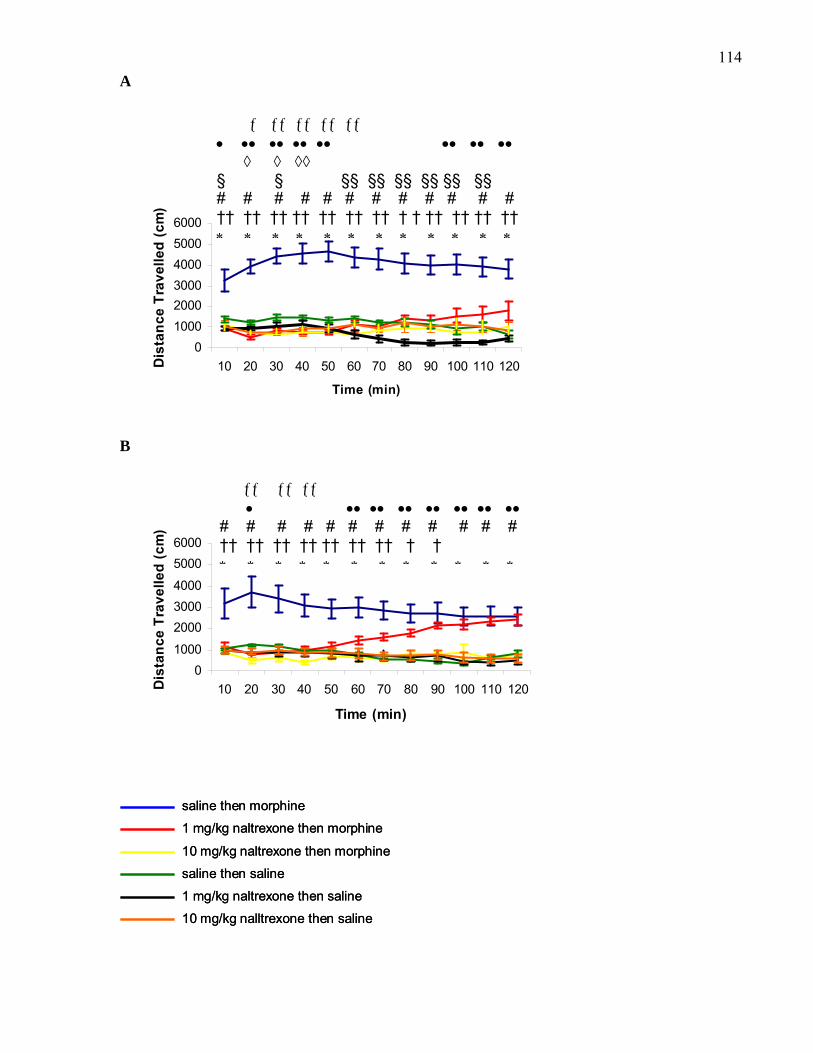
114A
B
0100020003000400050006000
10 20 30 40 50 60 70 80 90 100 110 120
Time (min)
Dis
tanc
e Tr
avel
led
(cm
)
ƒ ƒƒ ƒƒ ƒƒ ƒƒ • •• •• •• •• •• •• •• ◊ ◊ ◊◊ § § §§ §§ §§ §§ §§ §§ # # # # # # # # # # # # †† †† †† †† †† †† †† † † †† †† †† †† ∗ ∗ ∗ ∗ ∗ ∗ ∗ ∗ ∗ ∗ ∗ ∗
01000
200030004000
50006000
10 20 30 40 50 60 70 80 90 100 110 120
Time (min)
Dis
tanc
e Tr
avel
led
(cm
)
ƒƒ ƒƒ ƒƒ • •• •• •• •• •• •• •• # # # # # # # # # # # # †† †† †† †† †† †† †† † † ∗ ∗ ∗ ∗ ∗ ∗ ∗ ∗ ∗ ∗ ∗ ∗
saline then morphine
1 mg/kg naltrexone then morphine
10 mg/kg naltrexone then morphine
saline then saline
1 mg/kg naltrexone then saline
10 mg/kg nalltrexone then saline
saline then morphine
1 mg/kg naltrexone then morphine
10 mg/kg naltrexone then morphine
saline then saline
1 mg/kg naltrexone then saline
10 mg/kg nalltrexone then saline
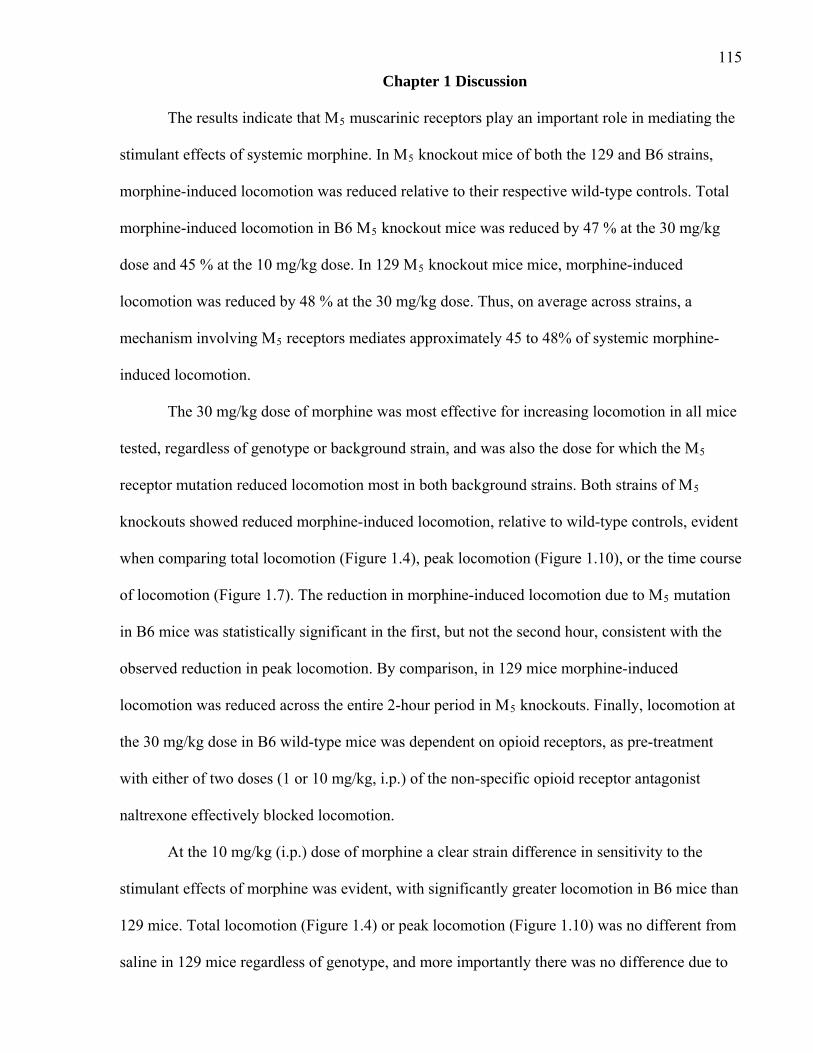
115Chapter 1 Discussion
The results indicate that M5 muscarinic receptors play an important role in mediating the
stimulant effects of systemic morphine. In M5 knockout mice of both the 129 and B6 strains,
morphine-induced locomotion was reduced relative to their respective wild-type controls. Total
morphine-induced locomotion in B6 M5 knockout mice was reduced by 47 % at the 30 mg/kg
dose and 45 % at the 10 mg/kg dose. In 129 M5 knockout mice mice, morphine-induced
locomotion was reduced by 48 % at the 30 mg/kg dose. Thus, on average across strains, a
mechanism involving M5 receptors mediates approximately 45 to 48% of systemic morphine-
induced locomotion.
The 30 mg/kg dose of morphine was most effective for increasing locomotion in all mice
tested, regardless of genotype or background strain, and was also the dose for which the M5
receptor mutation reduced locomotion most in both background strains. Both strains of M5
knockouts showed reduced morphine-induced locomotion, relative to wild-type controls, evident
when comparing total locomotion (Figure 1.4), peak locomotion (Figure 1.10), or the time course
of locomotion (Figure 1.7). The reduction in morphine-induced locomotion due to M5 mutation
in B6 mice was statistically significant in the first, but not the second hour, consistent with the
observed reduction in peak locomotion. By comparison, in 129 mice morphine-induced
locomotion was reduced across the entire 2-hour period in M5 knockouts. Finally, locomotion at
the 30 mg/kg dose in B6 wild-type mice was dependent on opioid receptors, as pre-treatment
with either of two doses (1 or 10 mg/kg, i.p.) of the non-specific opioid receptor antagonist
naltrexone effectively blocked locomotion.
At the 10 mg/kg (i.p.) dose of morphine a clear strain difference in sensitivity to the
stimulant effects of morphine was evident, with significantly greater locomotion in B6 mice than
129 mice. Total locomotion (Figure 1.4) or peak locomotion (Figure 1.10) was no different from
saline in 129 mice regardless of genotype, and more importantly there was no difference due to
116genotype. However, time course analysis (Figure 1.8) showed that more than 2/3 of 10-min time
bins were in fact characterized by overall greater locomotion across wild-type and mutant mice
relative to saline. In B6 mice, total locomotion was increased relative to saline, with a non-
significant reduction in M5 knockout mice. M5 knockout mice showed reduced locomotion
compared to wild-type mice across most of the first hour of testing and, consistent with this, peak
locomotion was also reduced.
Finally, 3 mg/kg morphine produced no significant locomotion in 129 mice. This was
evident when analyzing total locomotion (Figure 1.4), peak locomotion (Figure 1.10), and the
time course of locomotion (Figure 1.9). In B6 mice, total locomotion was greater relative to
saline, but there was no reduction in M5 knockout mice. Most of the difference in total
locomotion was due to greater locomotion relative to saline in the second hour of testing. In both
genotypes, saline treatment was characterized by a reduction in activity in the second hour of
testing, while morphine treatment sustained levels of activity over the second hour at levels
comparable to the first hour. M5 knockout mice did not show a reduction in locomotion at this
dose.
The failure to observe significantly reduced locomotion in 129 M5 knockouts at 10
mg/kg was most likely due to a floor effect. That is, locomotion was already so low in wild-type
mice that a reduction due to gene mutation (M5 or otherwise) could not be seen. At 30 mg/kg, a
higher dose that did produce significant locomotion in wild-type mice, the reduction in M5
knockouts of the 129 strain was clear. The dose-response curve for 129 mice was shifted to the
right, suggesting that reduced morphine-induced locomotion may further become apparent in this
strain when comparing activity at even higher doses (e.g., 50 mg/kg, i.p.). Similarly, at the
lowest dose, 3 mg/kg, where only very slight locomotion was elicited in B6 wild-type, and no
locomotion in 129 wild-type mice, no significant reduction to M5 knockout was observed. Thus,
the contribution of M5 to morphine-induced locomotion was most clear when looking at high
117doses (30 mg/kg or perhaps higher in 129 mice, and 10 mg/kg or higher in B6 mice) as this
provided the necessary levels of wild-type locomotion for hypolocomotion due to gene loss to
become apparent.
B6 mice show greater spontaneous exploration than 129 mice
The first exposure to the open-field chamber provides the mouse with a novel
environment, and thus provides a measure of exploration. Here, 129 wild-type mice showed
significantly less exploration than B6 wild-type mice. Specifically, B6 mice showed sustained
levels of high activity throughout the two hours of testing relative to their 129 counterparts, who
showed a steady decline in exploration across the same period. A survey of the literature reveals
differences in open-field locomotion between various commonly used inbred strains of mice
(e.g., Crawley et al., 1997). In general, C57 inbred mouse strains, which include the C57Bl/6
mice used here, show higher levels of open-field locomotion. One previous report directly
compared spontaneous locomotion in B6 and 129/SvJ mice, and is completely consistent with
the difference in basal locomotion observed in the current studies (Miner, 1997). The current
data in B6 wild-type mice provide additional support for this.
Several explanations could account for the strain difference in spontaneous exploration.
First, dysfunction in physical movement could underlie lower levels of exploration in 129 mice.
This is unlikely however, as 129 mice exhibit no obvious physical disability and perform
normally on a rotarod test (Wang et al., 2004).
Second, as anxiogenic factors decrease forward locomotion in an open field, it may be
that low levels of spontaneous locomotion are related to higher levels of anxiety in 129, relative
to B6, mice. In the current studies, efforts were made to minimize external anxiogenic factors.
To avoid a brightly lit testing apparatus and room, all testing was conducted under red-light
illumination, and the testing chambers had opaque, as opposed to the more commonly used
transparent walls. Nonetheless, there are behaviours that could be indicative of anxiety levels,
118such as rearing, defecation/urination, and thigmotaxis. Of these rearing is a common and easily
obtainable measure, with rearing frequency decreasing in an anxiogenic environment (Crawley et
al., 1997). Accordingly, a comparison of rearing frequency in 129 and B6 mice suggested there
may be an underlying difference in anxiety levels, with roughly a 2.5-fold increase in rearing
frequency in B6 compared to 129 mice (892.71 ± 85.2 in B6 and 323.2 ± 47.5 in 129, p < 0.001).
This is consistent with data showing less time spent and fewer entries into the open arms of an
elevated plus maze in 129 mice (Homanics, Quinlan, & Firestone, 1999). It is also consistent
with generally low levels of anxiety in B6 mice (Crawley et al., 1997). For example, in a
comparison of several strains of mice, Crawley and Davis (1982) showed that C57B6J mice
exhibit the largest number of transitions into the light compartment of a light-dark shuttle box. It
is interesting to note that anxiety has been shown to be important as a determinant of expressed
behaviour in 129 mice in other behavioural testing paradigms. Dockstader and van der Kooy
(2001) compared morphine conditioned place preference in B6 and 129 mice, showing that the
expression of place preference learning was masked by anxiety in 129 mice and could be
revealed by a variety of anxiolytic pre-treatments.
Finally, differences in the genetic make-up of the two mouse strains should also
contribute to the observed difference in spontaneous exploration. However, it is difficult to
determine whether the observed difference is due to different alleles of a gene(s) affecting open
field locomotion, anxiety, or a combination of both. Flint and colleagues (1995) have mapped
three quantitative trait loci (QTLs) on mouse chromosomes 1, 12, and 15 that impact both open
field activity and measures of ‘emotionality’ (e.g. defecation in an open field, open arms entries
in an elevated plus maze), such that QTLs that increased open field activity also decreased
‘emotionality’. This then suggests that a common set of genes is controlling open field activity
and anxiety levels, and is consistent with fewer open arm entries in an elevated plus maze in 129
mice (Homanics et al., 1999).
119B6 mice are more sensitive to the stimulant effects of morphine than 129 mice
Sensitivity to the stimulant effects of morphine was also different in the two mouse
strains, with the dose-response curve shifted rightward in 129 compared to B6 mice (Figure 1.5).
At all three doses tested, morphine-induced locomotion was higher in B6 than 129 mice. 129
mice required a dose of 30 mg/kg to achieve a level of total locomotion comparable to that seen
in B6 mice at 10 mg/kg.
Inbred mouse strains differ in their activity respones to morphine (Belknap, Noordewier,
& Lame, 1989; Cunningham, Niehus, Malott, & Prather, 1992). In particular, and consistent with
the current data, the C57Bl/6 strain stands out as a “runner” following morphine administration
in an open field (Crawley et al., 1997). The strain difference in morphine sensitivity seen in the
current study is consistent with a previous study, comparing 3 mg/kg (s.c) morphine-induced
locomotion in C57Bl/6 and 129Sv mice, showing approximately three-fold greater locomotion in
C57Bl/6 mice (Murphy et al., 2001).
What might account for this strain difference? First, there may be differences in the
bioavailability of morphine at the μ opioid receptor between the two strains. A comparison of
brain concentrations of morphine following systemic morphine (16 or 32 mg/kg, i.p.) showed no
difference between C57B6J and 129/J mice 30 minutes after injection (Belknap et al., 1998).
While differences in bioavailability of systemically administered morphine between 129 sub-
strains (i.e. 129/J vs the 129/SvJ used in the current study) cannot be ruled out, these data suggest
that differences in bioavailability of morphine are an unlikely explanation.
Second, as suggested by Murphy et al. (2001), differences in locomotor responses to
morphine may be related to differences in responsiveness of the mesolimbic dopamine system to
morphine. Murphy et al.’s (2001) microdialysis study was unique in that it measured accumbal
dopamine simultaneously with locomotion in different mouse strains. Basal dopamine levels did
not differ between mouse strains, but morphine-induced changes (3 mg/kg, s.c.) in dopamine
120were different between strains. C57Bl/6 mice showed the greatest increases with a clear peak
followed by a return of levels towards baseline, while 129Sv mice showed much smaller
increases and a less clearly defined peak.
Third, there may be qualitative and/or quantitative differences between 129 and B6 mice
in the μ opioid receptor, or other opioid receptor subtypes, that could affect their binding affinity
for morphine. In this regard, sequencing and comparing genomic regions surrounding the μ
opioid receptor gene in C57Bl/6 and 129/Sv mice have shown that while exons are conserved, a
2.3 % divergence in intronic regions surrounding exons 2 and 3 exists (Zhou et al., 2001). The
authors suggest that this difference in the intrionic sequence may lead to alternative splicing, in
turn leading to changes in either μ opioid receptor activity or distribution.
While the reason(s) for the strain difference in sensitivity to morphine locomotion cannot
be determined from the current data, it does illustrate a more general issue about the choice of
background strain when studying the effect of gene mutation on behaviour. As suggested by
Crawley and colleagues (1997), in the case of drug-induced activity, if the predicted effect of
gene knockout is to decrease activity then a background strain showing high levels of basal and
drug-induced activity is more appropriate. Conversely, if the predicted effect of gene knockout is
to increase locomotion, then a background strain with low basal and drug-induced activity is
more appropriate. Accordingly, as M5 knockout mice were expected to be less responsive to the
stimulant effects of morphine, the wild-type strain with the higher basal and drug-induced
locomotion, B6, would be the more appropriate choice. Indeed, the current data show that the
effect of M5 knockout on morphine-induced locomotion was more evident across a wider dose
range when testing knockouts of this strain.
Time Course of Morphine-induced Locomotion
Despite differences in the strength of responding due to strain, morphine-induced
locomotion, when it was observed in wild-type mice of both strains, followed a characteristic
121time course characterized by a gradual increase in locomotion over the first 30 min, a peak
between 30 and 60 min, and a gradual decline approaching pre-injection levels over the second
hour. There was no systematic relationship between dose of morphine and the time taken to
reach peak locomotion in wild-type mice, except perhaps a trend toward being slightly faster for
the highest dose. The magnitude of the peak response on the other hand clearly increased across
doses in wild-type and M5 knockout mice of both strains (main effects of dose p < 0.05 for wild-
types and knockouts of both strains). The temporal profile of morphine-induced locomotion has
been well described in rats, where higher morphine doses (≥ 10 mg/kg, i.p.) initially produce
hypolocomotion followed by delayed hyperlocomotion (Babbini & Davis, 1972). With repeated
morphine administration in rats, tolerance to the hypolocomotion develops, resulting in a net
increase of locomotion. With the current mouse data there was no indication of initial
hypolocomotion at either 10 or 30 mg/kg morphine. At the 3 mg/kg dose there appeared to be
some depression of locomotion relative to saline for the first few minutes, but these differences
were not statistically significant. At 10 and 30 mg/kg the more fine-grained analysis of
locomotion time course, with activity binned in 5-min rather than 10-min intervals, showed that
locomotion levels tended to begin rising immediately following the injection. Thus, the current
data are more consistent with the description of mouse morphine locomotion provided by Lee
and Fennessy (1976) and Oliverio (1975). Specifically, the mice tested in the current studies
showed what they describe as a “running fit” around the perimeter of the cage accompanied by
an elevated Straub tail.
Pharmacokinetics of Morphine.
In mice a 20 μmol/kg (approx 7.5 mg/kg) subcutaneous injection of morphine led to peak
whole-brain morphine levels at 45 min (Handal, Ripel, Aasmundstad, Skurtveit, & Morland,
2007). The locomotion observed in the current experiments showed a peak between 30 and 60
122minutes, so peak locomotor levels were consistent with peak brain morphine levels measured
previously.
Similarly, in rats intraperitoneal morphine administration (10 mg/kg), led to peak
morphine concentrations in hypothalamus and striatum extracellular fluid between 45 and 60 min
(Matos, Rollema, & Basbaum, 1992). Furthermore, following a subcutaneous injection of
morphine (10 mg/kg), morphine levels in brain extracellular fluid peak at 45 minutes, followed
by an exponential decay (Barjavel, Scherrman, & Bhargava, 1995).
In the experiments cited above, the peak in brain morphine was followed by a rapid
decline, accompanied by a rise in morphine metabolites. The main metabolic pathway for
morphine is glucuronidation resulting in the formation of morphine-3-glucuronide (M3G) and
morphine-6-glucorinide (M6G). In mice, morphine is metabolized into M3G only, as there are no
detectable levels of either plasma or brain extracellular levels of M6G following morphine
administration (Handal et al., 2002). Levels of M3G in blood serum and brain rise quickly
following intraperitoneal morphine in mice, peaking at approximately 30 min, followed by a
decline over the next 2 hrs, indicating that morphine must be rapidly metabolized upon entering
the body. Most interestingly, pre-treating mice with M3G prior to morphine, effectively
increasing the M3G to morphine ratio, dose-dependently antagonized the locomotor activating
effects of both 20 and 60 μmol/kg morphine (approx. 7.5 and 11.3 mg/kg, respectively) (Handal
et al., 2007). Consistent with a rapid rise in M3G levels, the effect of M3G was most pronounced
in the first hour of locomotion testing. M3G pre-treatment did not alter brain levels of morphine,
suggesting that M3G was not antagonizing the central effects of morphine by affecting its
transport across the blood-brain barrier, but rather may be competing with morphine for access to
receptors. Although, M3G is said to have a low affinity for the μ opioid receptor, it has been
shown that the effects of M3G can be reduced by a μ selective antagonist (Halliday, Bartlett,
Colditz, & Smith, 1999). Thus, the decline that is observed in morphine-induced locomotion
123following the peak at 30-60 minutes in the present data was likely related to an accumulation of
the morphine metabolite M3G, and a concurrent increase in the M3G/morphine ratio.
The locomotor time course in B6 M5 knockout mice at 30 mg/kg morphine (the strain
and dose that will be used in Experiments 3-5, see Chapter 2) was different than for wild-type
mice at that dose or either B6 knockout or wild-type mice at the 10 mg/kg dose. Locomotion did
not decline over the testing period and still had not peaked by two hours. It is possible that
morphine metabolism is different in M5 knockout mice and that the M3G/morphine ratio is
consequently affected. Specifically, if M3G accumulates at a slower rate in the knockout, then
locomotion would not be antagonized to the same extent by rising metabolite concentration. In
this regard, it would have been of great benefit to measure 30 mg/kg morphine-induced
locomotion up to 3 or even 4 hrs, as this may have revealed an eventual, delayed decline in
locomotion relative to wild-type mice. However, even if this were true, it only would apply to
the 30 mg/kg dose, as the temporal profile of locomotion in B6 M5 knockout mice at 10 mg/kg
and 129 M5 knockout mice at 30 mg/kg, though reduced overall, was not obviously different
from wild-types.
Second, differences in pharmacokinetics of morphine between wild-type and M5
knockout mice cannot be ruled out. M5 muscarinic receptors are expressed in cerebral blood
vessels, specifically the endothelial cells of the circle of Willis (Tayebati, Di Tullio, Tomassoni,
& Amenta, 2003), and acetylcholine-mediated dilation of cerebral blood vessels is absent in M5
knockout mice (Yamada et al., 2001). In fact, M5 knockout mice show a constriction of cerebral
arteries and reduced blood flow in hippocampus, cortex, basal ganglia, and thalamus (Araya et
al., 2006). It is unclear to what extent constriction of blood vessels could affect transport of
molecules across the blood-brain barrier, but the differences in cerebral blood flow could affect
the bioavailability of morphine at its various target sites related to locomotion (e.g. VTA, PPT,
ventral pallidum, and nucleus accumbens) in M5 knockout mice. To assess this possibility future
124work needs to study the pharmacokinetics of morphine in wild-type and M5 knockout mice,
comparing plasma and brain levels following systemic administration.
Morphine-induced locomotion in B6 wild-type mice is dependent on opioid receptors
Pre-treatment with both the 1 mg/kg and the 10 mg/kg dose of the non-selective opioid
receptor antagonist naltrexone reduced 30 mg/kg morphine-induced locomotion in B6 wild-type
mice, indicating a dependence on opioid receptors. The complete block of locomotion resulting
from systemic pre-treatment with 10 mg/kg naltrexone in wild-types indicates that both
dopamine-dependent and independent mechanisms were blocked. To assess dopamine-dependent
and independent contributions, nucleus accumbens and VTA naltrexone pre-treatment could be
compared. The 1 or 10mg/kg dose of naltrexone reduced morphine-induced locomotion to below
saline levels over much of the first hour of testing, followed by a gradual rise to above saline
levels for the last 30 min of testing. Thus, the inhibitory effect of naltrexone on morphine-
induced locomotion was reduced in the final 30 min. The slight increase in morphine locomotion
during this same time may reflect residual morphine levels in the brain extracellular fluid now
able to access opioid receptors. Two points argue against this however. First, at this time in the
2-hr testing period the M3G/morphine ratio should be at its highest, and the bioavailability of
morphine should be low. Second, the 1mg/kg dose of naltrexone on its own reduced locomotion
to below saline levels, but to a much greater extent in the second than the first hour of testing,
suggesting that naltrexone was still active at this time.
Morphine locomotion in B6 M5 knockout mice is less sensitive to naltrexone antagonism
M5 knockout mice were less sensitive to the antagonism of morphine locomotion by
naltrexone. While the 10 mg/kg dose completely blocked morphine-induced locomotion as in
wild-types, it reduced locomotion to below saline levels at only three time points during the first
hour of testing. More strikingly, while 1 mg/kg naltrexone effectively blocked morphine-induced
locomotion during the first hour in M5 knockout mice, unlike wild-type mice, locomotion
125increased over the second hour and 1mg/kg naltrexone was in fact not blocking morphine-
induced locomotion in the last half hour of testing.
Changes in μ-opioid receptor number in M5 knockout mice are an unlikely explanation
for this difference. Basile et al. (2002) reported that 129 SvEv x CF1 M5 knockout mice do not
show changes in μ-opioid receptor levels in cortex, hippocampus, striatum, cerebellum,
hypothalamus, spinal cord, or the entire brainstem. Alternatively, the possible changes in
bioavailability of centrally administered morphine could affect the bioavailability of naltrexone
in the brains of M5 knockout mice. Or, there may also be changes in the binding characteristics
of antagonists, or agonists, to opioid receptors in M5 knockout mice, or changes in the relative
numbers of opioid receptor sub-types.
Another way to interpret the difference in naltrexone antagonism gets back to the
different temporal pattern of morphine-induced locomotion in B6 M5 knockout mice seen at the
30 mg/kg dose. This is more apparent when looking at Figure 1.7b which shows the average of
14 B6 M5 knockout mice than it is from looking at Figure 1.12b which shows the average of 6
mice. Locomotion induced by 30 mg/kg in B6 M5 knockout was slightly different, as mice did
not show a clear peak across the two hour period, but rather showed locomotion that gradually
but continuously increased across the 2-hr testing period. By comparison, in wild-type mice
tested at this dose, activity declined across the second hour. Whatever may account for the
continuous rise in locomotion over the entire two hours, it was clearly not dependent on M5
muscarinic receptors. On the contrary, the process was only revealed by the complete absence of
M5 receptors. In other words, in the M5 knockout an alternate locomotor activating process may
be revealed that has a very slow onset between 60 and 120 minutes, causing a gradual but
significant increase in locomotion. Extending the measurement duration beyond two hours would
have been helpful in revealing the entire time course of this process. The fact that this process
was less sensitive to naltrexone antagonism between 60 and 120 minutes (i.e. locomotion during
126the first hour was blocked by both 1 and 10 mg/kg naltrexone, while locomotion during the
second hour was only blocked by the higher dose) suggests that it is only partially dependent on
opioid receptors.
M5 knockout mice are less sensitive to natrexone
In wild-type mice, unlike M5 knockout mice, 1mg/kg naltrexone on its own reduced
locomotion to below saline levels, particularly during the second hour of testing. Similarly, 10
mg/kg naltrexone on its own reduced locomotion to below saline levels between 20 and 40 min
in wild-type, but not in M5 knockout, mice.
Thus, both 1 and 10 mg/kg naltrexone on their own were sufficient to reduce basal open-
field locomotion in wild-type mice. This finding is consistent with previous data in mice
showing that systemic administration of the irreversible opioid antagonist β-chlornaltrexamine
reduced activity (Kozak, Conn, & Kluger, 1995). Conversely, systemic administration of RB 101
in mice, which reduces enzymatic degredation of endogenous enkephalin peptides, served to
increase open-field locomotion (Mas Nieto, Guen, Kieffer, Roques, & Noble, 2005). Similarly,
in rats central administration of μ, δ, or κ antagonists reduced total activity (Leventhal, Cole, &
Bodnar, 1996). Together, these data suggest that endogenous opioid activity contributes to
maintaining open-field locomotion. The reduction by naltrexone observed in wild-type mice may
have been due to the blockade of endogenous opioid input to the VTA, resulting in reduced
nucleus accumbens dopamine. Spanagel, Herz, & Shippenberg (1992) showed that μ opioid
receptor antagonists infused in the VTA, but not the nucleus accumbens, reduced nucleus
accumbens dopamine levels.
As M5 knockout mice were not only less sensitive to naltrexone antagonism of morphine-
induced locomotion, but also less sensitive to naltrexone antagonism of endogenous opioid
activity, the data suggest that M5 receptors are important in mediating the effects of both
exogenous morphine and endogenous opioids on locomotion.
127Conclusions
First, total morphine-induced locomotion in M5 knockout mice was reduced between by
45-48%, depending on the strain and dose used. Thus, a mechanism involving M5 receptors
mediates approximately 45 to 48% of systemic morphine-induced locomotion.
The role of dopamine in systemic opiate-induced locomotion is controversial, with rat
studies showing a complete independence from dopamine (Vaccarino et al., 1986), and mouse
studies almost a complete dependence on dopamine (Hnasko et al., 2005). Given the association
between M5 receptors and midbrain dopamine neurons (Vilaro et al., 1990) and their critical role
in sustained activation of the mesolimbic dopamine system (Forster et al., 2001), it is most likely
that the observed reduction in morphine-induced locomotion in M5 knockout mice was due to
reduction of a dopamine-dependent mechanism. In dopamine-deficient mice, morphine
locomotion at 25 mg/kg was reduced to 5% of wild-type control levels suggesting that greater
than 90% of systemic morphine-induced locomotion in mice is dopamine-dependent in some
way (Hnasko et al., 2005). The mice used in those studies were of the B6 strain and so are
similar to the B6 strain used in the current study at the 30 mg/kg dose. By comparison then, this
suggests that the 47% reduction in locomotion seen in B6 M5 knockout mice at the 30 mg/kg
dose represent roughly one half of dopamine-dependent systemic morphine-induced locomotion
in mice.
Second, Experiment 2 showed that B6 M5 knockout mice were less sensitive to
naltrexone antagonism of morphine-induced locomotion as well as to natrexone blockade of
endogenous opioids. Together, this suggests that M5 receptors are important for mediating the
effects of both exogenous and endogenous opiates on locomotion.
128Chapter 1 References
Araya, R., Noguchi, T., Yuhki, M., Kitamura, N., Higuchi, M., Saido, T. C., Seki, K., Itohara, S.,
Kawano, M., Tanemura, K., Takashima, A., Yamada, K., Kondoh, Y., Kanno, I., Wess,
J., & Yamada, M. (2006). Loss of M5 muscarinic acetylcholine receptors leads to
cerebrovascular and neuronal abnormalities and cognitive deficits in mice. Neurobiology
of Disease, 24, 334-344.
Austin, M. C., & Kalivas, P. W. (1990). Enkephalinergic and GABAergic modulation of motor
activity in the ventral pallidum. Journal of Pharmacology Experimental Therapeutics,
252, 1370-1377.
Babbini, M., & Davis, W. M. (1972). Time-dose relationships for locomotor activity effects of
morphine after acute or repeated treatment. British Journal of Pharmacology, 46, 213-
224.
Barjavel, M. J., Scherrmann, J. M., & Bhargava, H. N. (1995). Relationship between morphine
analgesia and cortical extracellular fluid levels of morphine and its metabolites in the rat:
A microdialysis study. British Journal of Pharmacology, 116, 3205-3210.
Basile, A. S., Fedorova, I., Zapata, A., Liu, X., Shippenberg, T., Duttaroy, A., Yamada, M., &
Wess, J. (2002). Deletion of the M5 muscarinic acetylcholine receptor attenuates
morphine reinforcement and withdrawal but not morphine analgesia. Proceedings of
National Academy of Sciences U S A, 99, 11452-11457.
Belknap, J. K., Noordewier, B., & Lame, M. (1989). Genetic dissociation of multiple morphine
effects among C57Bl/6J, DBA/2J and C3H/HEJ inbred mouse strains. Physiology and
Behavior, 46, 69-74.
Belknap, J. K., Riggan, J., Cross, S., Young, E. R., Gallaher, E. J., & Crabbe, J. C. (1998).
Genetic determinants of morphine activity and thermal responses in 15 inbred mouse
strains. Pharmacology Biochemistry Behavior, 59, 353-360.
129Crawley, J.N., & Davis, L.G. (1982). Baseline exploratory activity predicts anxiolytic
responsiveness to diazepam in five mouse strains. Brain Research Bulletin, 8, 609-612.
Crawley, J. N., Belknap, J. K., Collins, A., Crabbe, J. C., Frankel, W., Henderson, N., Hitzeman,
R.J., Maxson, S.C., Miner, L.L., Silva, A.J., Wehner, J.M., Wynshaw-Boris, A., &
Paylor, R. (1997). Behavioral phenotypes of inbred mouse strains: Implications and
recommendations for molecular studies. Psychopharmacology, 132, 107-124.
Cunningham, C. L., Niehus, D. R., Malott, D. H., & Prather, L. K. (1992). Genetic differences in
the rewarding and activating effects of morphine and ethanol. Psychopharmacology, 107,
385-393.
Dockstader, C.L., & van der Kooy, D. (2001). Mouse strain differences in opiate reward learning
are explained by differences in anxiety, not reward or learning. Journal of Neuroscience,
21, 9077-9081.
Forster, G. L., Falcon, A. J., Miller, A. D., Heruc, G. A., & Blaha, C. D. (2002). Effects of
laterodorsal tegmentum excitotoxic lesions on behavioral and dopamine responses
evoked by morphine and d-amphetamine. Neuroscience, 114, 817-823.
Forster, G.L. Yeomans, J.S., Takeuchi, J., & Blaha, C.D. (2001). M5 muscarinic receptors are
required for prolonged accumbal dopamine release after electrical stimulation of the pons
in mice. Journal of Neuroscience, 22, RC190.
Flint, J., Corley, R., DeFries, J.C., Fulker, D.W., Gray, J.A., Miller, S., & Collins, A.C. (1995).
A simple genetic basis for a complex psychological trait in laboratory mice. Science, 269,
1432-1435.
Halliday, A. J., Bartlett, S. E., Colditz, P., & Smith, M. T. (1999). Brain region-specific studies
of the excitatory behavioral effects of morphine-3-glucuronide. Life Sciences, 65, 225-
236.
130Handal, M., Grung, M., Skurtveit, S., Ripel, A., & Morland, J. (2002). Pharmacokinetic
differences of morphine and morphine-glucuronides are reflected in locomotor activity.
Pharmacology Biochemistry and Behavior, 73, 883-892.
Handal, M., Ripel, A., Aasmundstad, T., Skurtveit, S., & Morland, J. (2007). Morphine-3-
glucuronide inhibits morphine induced, but enhances morphine-6-glucuronide induced
locomotor activity in mice. Pharmacology Biochemistry and Behavior, 86, 576-586.
Hnasko, T. S., Sotak, B. N., & Palmiter, R. D. (2005). Morphine reward in dopamine-deficient
mice. Nature, 438, 854-857.
Homanics, G. E., Quinlan, J. J., & Firestone, L. L. (1999). Pharmacologic and behavioral
responses of inbred C57Bl/6J and strain 129/SvJ mouse lines. Pharmacology
Biochemistry Behavior, 63, 21-26.
Ito, S., Mori, T., & Sawaguchi, T. (2008). Dopamine-independent psycho-stimulant activity of a
delta-agonist. Behavioral Pharmacology, 19, 113-119.
Kalivas, P.W., Striplin, C., Steketer, J.D.. Klitenick, M.A., & Duffy, P. (1992). Cellular
mechanisms of behavioral sensitization to drugs of abuse. Annals of the New York
Academy of Sciences, 654, 128-135.
Kalivas, P. W., Widerlov, E., Stanley, D., Breese, G., & Prange, A. J., Jr. (1983). Enkephalin
action on the mesolimbic system: A dopamine-dependent and a dopamine-independent
increase in locomotor activity. Journal of Pharmacology and Experimental Therapeutics,
227, 229-237.
Klitenick, M.A., & Kalivas, P.W. (1994). Behavioral and neurochemical studies of opioid effects
in the pedunculopontine nucleus and mediodorsal thalamus. Journal of Pharmacology
and Experimental Therapeutics, 269, 437-448.
131Kozak, W., Conn, C.A., & Kluger, M.J. (1995). Body Temperature, motor activity, and feeding
behavior of mice treated with β-chlornaltrexamine. Physiology and Behavior, 58, 353-
362.
Lee, J. R. and M. R. Fennessy (1976). Effects of morphine on brain histamine, antinociception
and activity in mice. Clinical and Experimental Pharmacology and Physiology, 3, 179-
189.
Leventhal, L., Cole, J.L., & Bodnar, R.J. (1996). Reductions in locomotor activity following
central opioid receptor subtype antagonists in rats. Physiology and Behavior, 60, 833-
836.
Mas Nieto, M., Guen, S.L.E., Kieffer, B.L., Roques, B.P., & Noble, F. (2005). Physiological
control of emotion-related behaviors by endogenous enkephalins involves essentially the
delta opioid receptor. Neuroscience, 135, 305-313.
Matos, F. F., Rollema, H., & Basbaum, A. I. (1992). Simultaneous measurement of extracellular
morphine and serotonin in brain tissue and csf by microdialysis in awake rats. Journal of
Neurochemistry, 58, 1773-1781.
Miller, A. D., Forster, G. L., Metcalf, K. M., & Blaha, C. D. (2002). Excitotoxic lesions of the
pedunculopontine differentially mediate morphine- and d-amphetamine-evoked striatal
dopamine efflux and behaviors. Neuroscience, 111, 351-362.
Miller, A. D., Forster, G. L., Yeomans, J. S., & Blaha, C. D. (2005). Midbrain muscarinic
receptors modulate morphine-induced accumbal and striatal dopamine efflux in the rat.
Neuroscience, 136, 531-538.
Miner, L. L. (1997). Cocaine reward and locomotor activity in C57Bl/6J and 129/SvJ inbred
mice and their F1 cross. Pharmacology Biochemistry and Behavior, 58, 25-30.
132Murphy, N. P., Lam, H. A., & Maidment, N. T. (2001). A comparison of morphine-induced
locomotor activity and mesolimbic dopamine release in C57Bl6, 129Sv and DBA2 mice.
Journal of Neurochemistry, 79, 626-635.
Oliverio, A. (1976). Genotype-dependent electroencephalographic, behavioral and analgesic
correlates of morphine: An analysis in normal mice and mice with septal lesions. Brain
Research, 83, 135-141.
Spanagel, R., Herz, A., & Shippenberg, T. S. (1992). Opposing tonically active endogenous
opioid systems modulate the mesolimbic dopaminergic pathway. Proceedings of the
National Academy of Sciences U S A, 89, 2046-2050.
Takeuchi, J., Fulton, J., Jia, Z.P., Abramov-Newerly, W., Jamot, L., Sud, M., Coward, D., Ralph,
M., Roder, J., & Yeomans, J. (2002). Increased drinking in mutant mice with truncated
M5 muscarinic receptor genes. Pharmacology Biochemistry and Behavior, 72, 117-123.
Tayebati, S. K., Di Tullio, M. A., Tomassoni, D., & Amenta, F. (2003). Localization of the M5
muscarinic cholinergic receptor in rat circle of willis and pial arteries. Neuroscience, 122,
205-211.
Vaccarino, F. J., Amalric, M., Swerdlow, N. R., & Koob, G. F. (1986). Blockade of
amphetamine but not opiate-induced locomotion following antagonism of dopamine
function in the rat. Pharmacology Biochemistry and Behavior, 24, 61-65.
Vilaro, M. T., Palacios, J. M., & Mengod, G. (1990). Localization of m5 muscarinic receptor
mrna in rat brain examined by in situ hybridization histochemistry. Neuroscience Letters,
114, 154-159.
Wang, H., Ng, K., Hayes, D., Gao, X., Forster, G., Blaha, C., & Yeomans, J.S. (2004).
Decreased amphetamine-induced locomotion and improved latent inhibition in mice
mutant for the M5 muscarinic receptor gene found in the human 15q schizophrenia
region. Neuropsychopharmacology, 29, 2126-2139.
133Yamada, M., Lamping, K. G., Duttaroy, A., Zhang, W., Cui, Y., Bymaster, F. P., McKinzie,
D.L., Felder, C.C., Deng, X.C., Faracci, F.M., & Wess, J. (2001). Cholinergic dilation of
cerebral blood vessels is abolished in m(5) muscarinic acetylcholine receptor knockout
mice. Proceedings of the National Academy of Sciences U S A, 98, 14096-14101.
Zhou, L., Rowley, D. L., Mi, Q. S., Sefcovic, N., Matthes, H. W., Kieffer, B. L., & Donovan,
D.M. (2001). Murine inter-strain polymorphisms alter gene targeting frequencies at the
mu opioid receptor locus in embryonic stem cells. Mammalian Genome, 12, 772-778.
134
Chapter 2: Role of cholinergic input to the ventral tegmental area in systemic morphine-
induced locomotion.
135Introduction
Experiment 1 showed that morphine-induced locomotion was reduced by 45 to 48 % in
M5 knockout mice, depending on the strain and dose being studied. This reduction suggests that
M5 activation of dopamine neurons is somehow important for morphine-induced locomotion. M5
is the only muscarinic receptor sub-type for which mRNA is found in midbrain dopamine
neurons (Vilaro et al., 1990). M5 receptor loss has a powerful effect on dopamine release, as
evidenced by the fact that activation of the mesolimbic dopamine system by electrical
stimulation of LDT inputs is strongly reduced in M5 knockout mice (Forster et al., 2001). In rats,
a similar reduction in prolonged dopamine activation can be achieved by pharmacological
blockade of muscarinic receptors in VTA (Forster & Blaha, 2000). In combination, this suggests
that M5 receptors found on VTA dopamine cell bodies are mediating the excitation of dopamine
neurons. However, because the M5 knockout is systemic it is difficult to determine where in the
animal the loss of M5 receptors impacts behavior. M5 receptors are found, albeit at very low
levels, throughout the brain (Wang et al., 2004; Wei et al., 1994) and could affect dopamine-
dependent locomotion produced by systemic morphine via pathways not involving the VTA. For
example, Yamada et al. (2001) have shown that loss of M5 receptors can affect dopamine release
through their action on striatal terminals as well. In their experiment, KCl-induced dopamine
release was measured in striatal slices before or after incubation with the muscarinic agonist
oxotremorine, which in wild-type slices led to an increase in dopamine release. This facilitation
was reduced by approximately 50% in M5 knockout mice, suggesting that M5 receptors can
facilitate dopamine release at both cell bodies and terminals.
In either case, the observed reduction in morphine-induced locomotion is due a reduction
in a dopamine-dependent mechanism, but the study of locomotion in a systemic knockout does
not distinguish between the relative contributions of each site. Thus, how much M5 related
differences in morphine-induced locomotion are due to loss of the M5 receptor on dopamine
136neuron cell bodies, terminals, or a combination of the two is not clear from Experiment 1. To
address this question, I studied the effects of muscarinic antagonism in the VTA on morphine-
induced locomotion and then compared these data to data obtained from M5 knockout mice.
Unfortunately, there are no selective pharmacological agents for M5 muscarinic receptors, so the
non-selective muscarinic receptor antagonist atropine was chosen instead.
Dopamine neurons also express different sub-types of nicotinic receptors (Charpantier et
al., 1998; Klink et al., 2001), and activation of these receptors produces locomotion and
forebrain dopamine release. Both systemic nicotine (Goshima et al., 1996) and intra-VTA
nicotine (Goshima et al., 1996; Panagis, Nisell, Nomikos, Chergui, & Svensson, 1996) increased
locomotion, and in both cases increases in locomotion were blocked by intra-VTA pre-treatment
with the non-selective nicotinic receptor antagonist mecamylamine. Furthermore, systemic
(Sziraki, Sershen, Hashim, & Lajtha, 2002) or intra-VTA (Nisell, Nomikos, & Svensson, 1994)
nicotine increased nucleus accumbens dopamine, and these increases were blocked by VTA
mecamylamine pre-treatment. Also, increases in nucleus accumbens and striatum dopamine
efflux following electrical stimulation of the LDT and PPT, respectively, are in part mediated by
nicotinic receptors in the VTA and SN (Forster & Blaha, 2000; 2003).
These data show that cholinergic excitation of mesolimbic (and nigrostriatal) dopamine
systems is mediated through both muscarinic and nicotinic cholinergic receptors. In brain-
stimulation reward, mecamylamine pre-treatment in the VTA increased current threshold
required to elicit bar-pressing for lateral hypothalamus stimulation, albeit to a lesser extent than
muscarinic receptor blockade (Yeomans & Baptista, 1997). So, I first tested the effect of VTA
atropine on morphine-induced locomotion. Are VTA nicotinic receptors, important for nicotine-
induced locomotion, accumbal/striatal dopamine efflux, and brain-stimulation reward, also
important in mediating morphine-induced locomotion? To test this, I studied the effects of the
nicotinic receptor antagonist mecamylamine in the VTA on morphine-induced locomotion.
137Materials and Methods
Surgery
Eight B6 wild-type and 6 B6 M5 knockout mice were anesthetized with isoflurane (3%
for induction and 1.5-2% for maintenance, O2 flow rate 1 L/min) and placed in a stereotaxic
device. Mice were treated locally with lidocaine prior to scalp incisions. Each mouse was
implanted with 26 gauge bilateral guide cannulae (Plastics One, Roanoke, VA) with the tip of the
guide cannula aimed 1mm above the ventral tegmental area. To avoid puncture of the sagittal
sinus, cannulae were angled 10° in the mediolateral plane. The stereotaxic coordinates used were
(relative to interaural zero): A/P +0.50, M/L ± 0.3, D/V +1.5 (Paxinos & Franklin, 2004). Guide
cannulae were fixed to the skull with dental acrylic cement anchored to three stainless steel skull
screws. Patency of guide cannulae was maintained by insertion of a dummy cannula. Mice were
allowed 10 days recovery before initiation of the experiment.
Intracranial Injections and Morphine Locomotion
Wild-type and M5 knockout mice were tested at different times. On the first day of the
experiment, spontaneous exploration was measured for a period of 2 hours, according to the
methods described for Experiments 1 and 2. On the following days, mice were given
combinations of intra-VTA muscarinic and/or nicotinic antagonists and systemic morphine (30
mg/kg) or saline (10 ml/kg).
Mice were gently restrained and the dummy cannulae were removed. Injector cannulae
(33 gauge, Plastics One, Richmond, VA) were bilaterally inserted and protruded 1 mm beyond
the tip of the guide cannulae. Injections were made using a 2 μl Hamilton microsyringe
connected to Tygon tubing (0.0075 in i.d., 0.080 in o.d., Cole-Palmer), and a syringe pump
(Harvard Apparatus Model 975, South Natick, MA). All injections were made at a volume of 0.3
μl and a rate of 0.5 μl/min. The success of each intracranial injection was always verified by
confirming that an air bubble in the Tygon tubing had moved an appropriate distance, as
138previously determined by calibration. Injectors were left in place for 45 sec before being gently
removed. Dummy cannulae were replaced, and the mouse was immediately given a systemic
(i.p.) injection (i.e., 10 ml/kg saline or 30 mg/kg morphine), and placed in the locomotor testing
box for a period of 2 hours.
As the role of muscarinic receptors was of primary interest, the effects of intra-VTA
atropine were tested first (Table 1). Mice were tested over 4 consecutive days. On each day one
of four possible combinations of intracranial and intraperitoneal injection was administered: 1)
VTA atropine then systemic saline, 2) VTA atropine then systemic morphine, 3) VTA saline
then systemic saline, 4) VTA saline then systemic morphine. To minimize order effects with
repeated treatment in the same animal the order of treatment combination across animals was
determined using a Latin Square design, resulting in four orders of treatment combination (Table
1). Atropine was given at a dose of 3 μg per side.
After a 2-day wash-out period, the effects of intra-VTA mecamylamine were tested in the
same mice over 2 days. As each testing day involved an intra-VTA injection of mecamylamine,
another day was added between tests. On each of the 2 days, mice were given one of two
possible combinations of intracranial and intraperitoneal injection: 1) VTA mecamylamine then
systemic saline, 2) VTA mecamylamine then systemic morphine. Order of presentation was
counterbalanced across mice, so that half the mice received VTA mecamylamine/systemic
saline on day 1 and the other half on day 2 (Table 1). Mecamylamine was given at a dose of 5 μg
per side. As the two control conditions (i.e. VTA saline then systemic morphine, and VTA saline
then systemic saline) were the same as for the atropine study, these were not run again. Instead,
the same control data obtained for each mouse during the course of atropine treatment was used
to compare to the effects of intra-VTA mecamylamine treatment. One B6 wild-type mouse died
during the period separating atropine and mecamylamine tests. Finally, after a 2-day washout
period the effects of combined intra-VTA atropine and mecamylamine (3 and 5 μg per side,
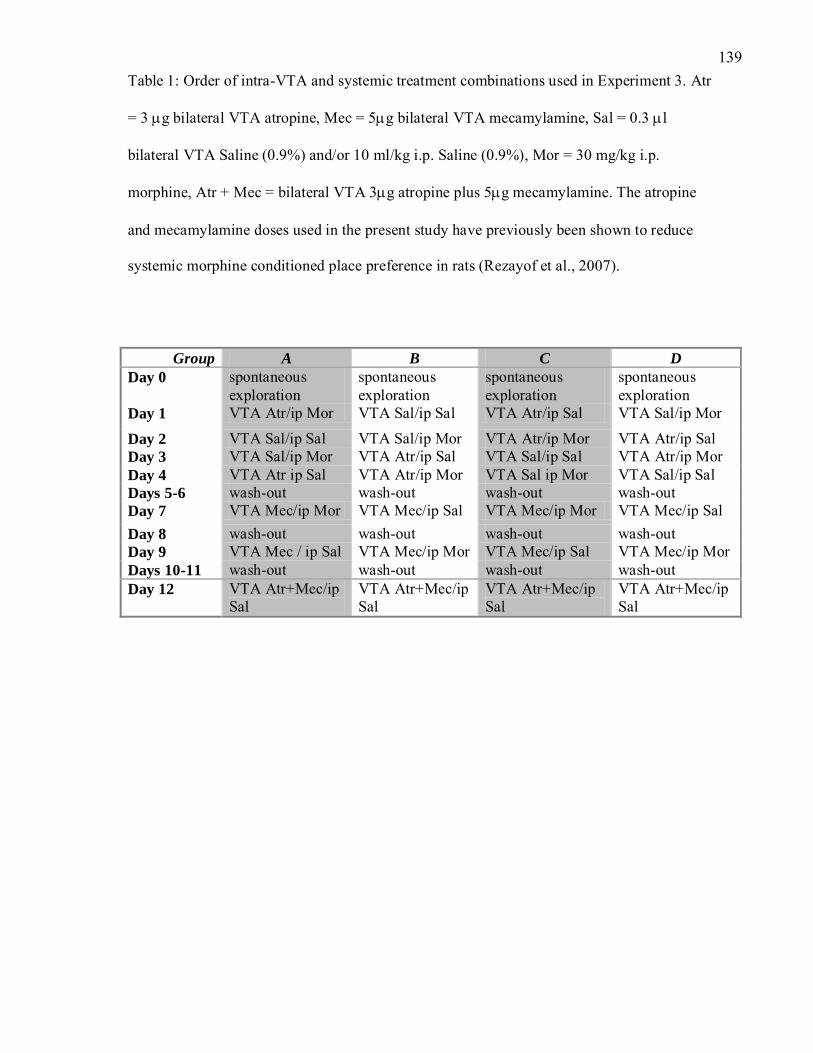
139Table 1: Order of intra-VTA and systemic treatment combinations used in Experiment 3. Atr
= 3 μg bilateral VTA atropine, Mec = 5μg bilateral VTA mecamylamine, Sal = 0.3 μl
bilateral VTA Saline (0.9%) and/or 10 ml/kg i.p. Saline (0.9%), Mor = 30 mg/kg i.p.
morphine, Atr + Mec = bilateral VTA 3μg atropine plus 5μg mecamylamine. The atropine
and mecamylamine doses used in the present study have previously been shown to reduce
systemic morphine conditioned place preference in rats (Rezayof et al., 2007).
Group A B C D Day 0 spontaneous
exploration spontaneous exploration
spontaneous exploration
spontaneous exploration
Day 1 VTA Atr/ip Mor VTA Sal/ip Sal VTA Atr/ip Sal VTA Sal/ip Mor
Day 2 VTA Sal/ip Sal VTA Sal/ip Mor VTA Atr/ip Mor VTA Atr/ip Sal Day 3 VTA Sal/ip Mor VTA Atr/ip Sal VTA Sal/ip Sal VTA Atr/ip Mor Day 4 VTA Atr ip Sal VTA Atr/ip Mor VTA Sal ip Mor VTA Sal/ip Sal Days 5-6 wash-out wash-out wash-out wash-out Day 7 VTA Mec/ip Mor VTA Mec/ip Sal VTA Mec/ip Mor VTA Mec/ip Sal Day 8 wash-out wash-out wash-out wash-out Day 9 VTA Mec / ip Sal VTA Mec/ip Mor VTA Mec/ip Sal VTA Mec/ip Mor Days 10-11 wash-out wash-out wash-out wash-out Day 12 VTA Atr+Mec/ip
Sal VTA Atr+Mec/ip Sal
VTA Atr+Mec/ip Sal
VTA Atr+Mec/ip Sal
140respectively) were tested in 5 M5 knockout mice.
Histology
At the completion of behavioural testing, mice were bilaterally injected with 0.3 μl of a
0.1 % safranin-O solution. This was done in attempt to better determine the injection site, as well
as to get an idea of the extent to which the injected fluid volume spread into tissue surrounding
the injection site. Mice were deeply anesthetized with sodium pentobarbital (60 mg/kg, i.p.) prior
to decapitation. Brains were removed and kept in a 10% formalin solution for several days prior
to sectioning on a Vibratome. Mounted sections were stained with cresyl violet using standard
procedures.
Statistical Analysis
Data from wild-type and M5 knockout mice were separately analyzed. For each of the
two genotypes, total locomotion following atropine and mecamylamine pre-treatment was
analyzed using a one-way repeated-measures ANOVA, with treatment combinations (i.e. the
combination of intracranial pre-treatment and systemic treatment: sal/sal, sal/mor, atr/sal,
atr/mor, or sal/sal, sal/mor, mec/sal, mec/mor) as the within-subjects factor. Significant main
effects were followed up with multiple comparisons between treatment conditions at individual
time points using Fisher’s LSD test.
The time course of locomotion was also analyzed for each genotype using a two-way
repeated measures analysis of ANOVA with treatment combination (as above) and time (10 min
bins) as within-subjects factors. Significant interactions were followed up with multiple
comparisons between treatment conditions at individual time points using Fisher’s LSD test.
Finally, in a sub-set of M5 knockout mice the effect of combined VTA atropine and
mecamylamine was assessed. For this experiment the effect of combined VTA atropine and
mecamylamine was compared to the effects of VTA saline and VTA atropine or mecamylamine
alone. Total locomotion was analyzed using a one-way repeated-measures ANOVA with
141treatment as the within-subjects factor (sal/sal, atr/sal, mec/sal, or atr + mec/sal). The time course
of locomotion was analyzed using a two-way repeated-measures ANOVA with treatment (as
above) and time as within-subject factors. In both cases a significant interaction was followed by
multiple comparisons between treatment conditions at each time point using Fisher’s LSD.
Results
Histology
Figure 2.1A shows VTA injection sites in B6 wild-type and M5 knockout mice. Injector
cannulae tips were determined to be within the anatomical boundaries of VTA, and only mice
that met this criterion were used for subsequent data analysis. Injection sites in both wild-type
and M5 knockout mice were spread along the rostro-caudal extent of the VTA, with a slight
tendency for the injection sites to be more caudal in knockout mice. In two wild-type mice, the
injection sites were dorsal to the VTA within the red nucleus. The entire rostro-caudal extent of
the VTA in mice is only 0.9 mm. As a 0.3 μl injection volume produces a fluid sphere with a ~
0.68 mm diameter, it encompasses most of the VTA, even for injection sites in the most rostral
or most caudal portions of the VTA. Indeed, there were no apparent differences between data
from mice in which muscarinic and/or nicotinic antagonists were injected in more rostral or more
caudal portions of the VTA. Up to 7 VTA injections were made in these mice. The damage
induced by repeated injections is illustrated in Figures 2.1 B and C. from a representative wild-
type and M5 knockout mouse, respectively.
Effects of VTA pre-treatment with atropine in B6 wild-type and M5 knockout mice
Total Locomotion
Figure 2.2 shows mean distance travelled across the 2-hr testing period in B6 wild-type
and M5 knockout mice. First, the mean distance travelled in response to 30 mg/kg (i.p.)
morphine in the B6 wild-type mice used in this experiment was similar to that observed in B6
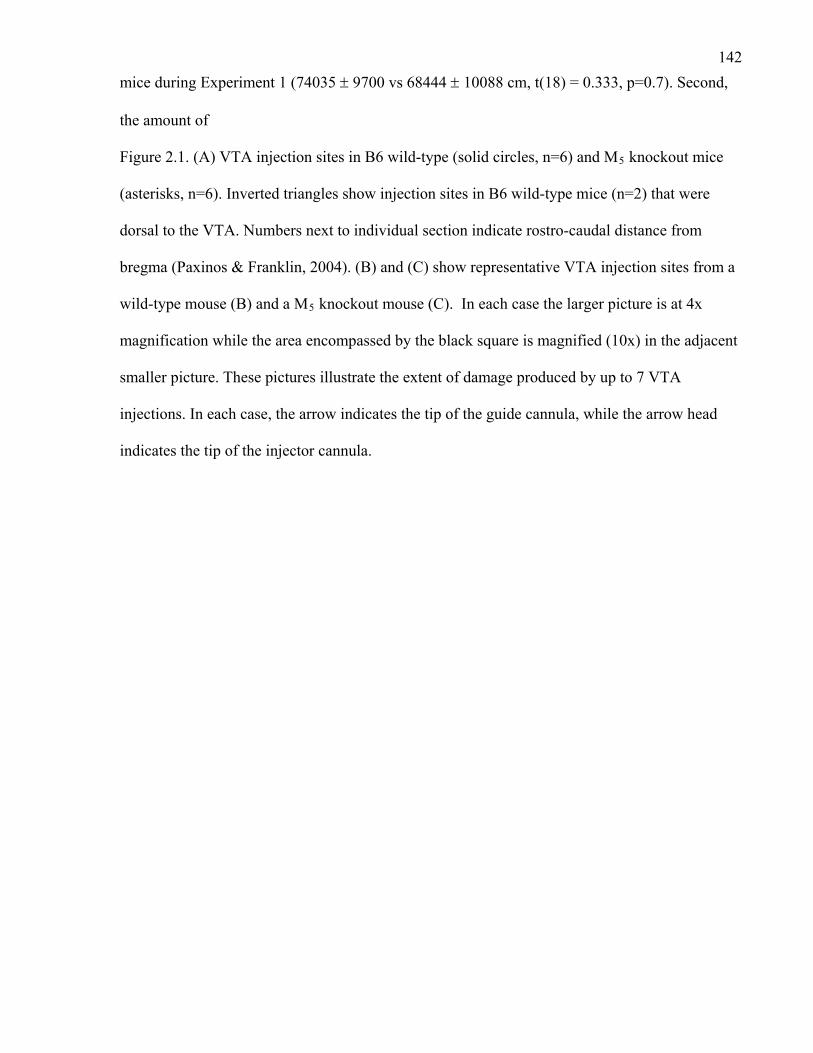
142mice during Experiment 1 (74035 ± 9700 vs 68444 ± 10088 cm, t(18) = 0.333, p=0.7). Second,
the amount of
Figure 2.1. (A) VTA injection sites in B6 wild-type (solid circles, n=6) and M5 knockout mice
(asterisks, n=6). Inverted triangles show injection sites in B6 wild-type mice (n=2) that were
dorsal to the VTA. Numbers next to individual section indicate rostro-caudal distance from
bregma (Paxinos & Franklin, 2004). (B) and (C) show representative VTA injection sites from a
wild-type mouse (B) and a M5 knockout mouse (C). In each case the larger picture is at 4x
magnification while the area encompassed by the black square is magnified (10x) in the adjacent
smaller picture. These pictures illustrate the extent of damage produced by up to 7 VTA
injections. In each case, the arrow indicates the tip of the guide cannula, while the arrow head
indicates the tip of the injector cannula.
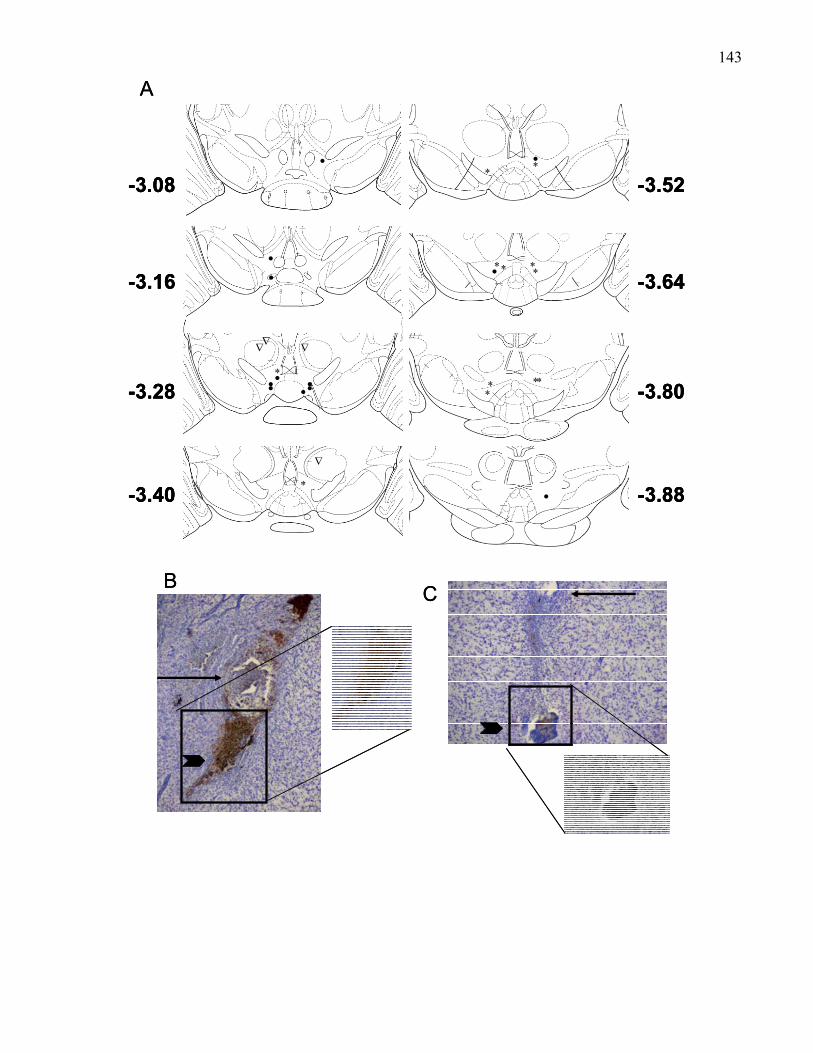
143
•
∗ ∗∗
∗
•∗ ∗∗ ∗
-3.08 -3.52
-3.64
-3.80
-3.88
-3.28
-3.40
-3.16
∗
∇
•••• ••∗
∇ ∇∇
•
•
• ∗∗•
A
B C
•
∗ ∗∗
∗
•∗ ∗∗ ∗
-3.08 -3.52
-3.64
-3.80
-3.88
-3.28
-3.40
-3.16
∗
∇
•••• ••∗
∇ ∇∇
•
•
• ∗∗•
••
∗ ∗∗
∗∗ ∗∗
∗
•∗ ∗∗ ∗•∗ ∗∗ ∗
-3.08 -3.52
-3.64
-3.80
-3.88
-3.28
-3.40
-3.16
∗
∇
∗
∇
•••• ••∗
∇ ∇∇
•••• ••∗
∇ ∇∇
•
•
•
•
•• ∗∗•∗∗ ∗∗•
A
B C
144locomotion in response to 30 mg/kg (i.p.) morphine in M5 knockout mice was similar to the
amount of locomotion observed in M5 knockout mice during Experiment 1 (48582 ±4175 and
44487 ± 6736 cm respectively, t(18) = 0.379, p=0.7). Third, consistent with the data collected in
the previous experiments, total locomotion in M5 knockout mice was significantly lower
compared to wild-type mice (t(10) = 2.41, p<0.05).
Repeated-measures ANOVA on total locomotion data revealed a significant main effect
of treatment condition in both B6 wild-type (F (3, 15) = 23.53, p < 0.0001) and M5 knockout (F
(3, 15) = 9.75, p < 0.001) mice. Post-hoc analyses compared the four treatment conditions for
each genotype separately. This showed first, consistent with the data from previous experiments,
that the saline/morphine treatment produced significantly higher total locomotion than the
saline/saline treatment in both wild-type (p < 0.00001) and M5 knockout mice (p<0.01), and
second that pre-treatment with atropine (3μg bilateral in VTA) significantly reduced the
locomotion produced by 30 mg/kg morphine (p<0.001) in wild-type mice, but did not
significantly affect morphine-induced locomotion in M5 knockout mice (p>0.1). In both wild-
type and M5 knockout mice, atropine pre-treatment did not completely block morphine-induced
locomotion, as levels were still above those for the saline/saline condition (p<0.01 in wild-type
and p<0.001 in M5 knockouts). Most strikingly, atropine pre-treatment by itself did not change
total locomotion relative to saline in wild-type mice (p>0.05), but significantly increased
locomotion relative to saline in M5 knockout mice (p<0.001).
Locomotion Time Course
Separate analysis of the time course in wild-type and M5 knockout mice provided results
consistent with the above analysis of total locomotion. Figure 2.3a shows the time course of
locomotion in B6 wild-type mice. Repeated-measured ANOVA revealed a significant main
effect of treatment, F (3, 12) = 20.59, p < 0.0001, that was modified by a significant interaction
with time, F (33, 132) = 5.38, p < 0.000001. Post-hoc analyses comparing the 4 treatment

145Figure 2.2. Total locomotion following 3 μg bilateral VTA atropine or 0.3 μl VTA saline prior to
systemic morphine (30 mg/kg, i.p.) or saline in (A) B6 mice (+/+, n=6) and (B) B6 M5 knockout
mice (-/-, n=6). ∗ p<0.01
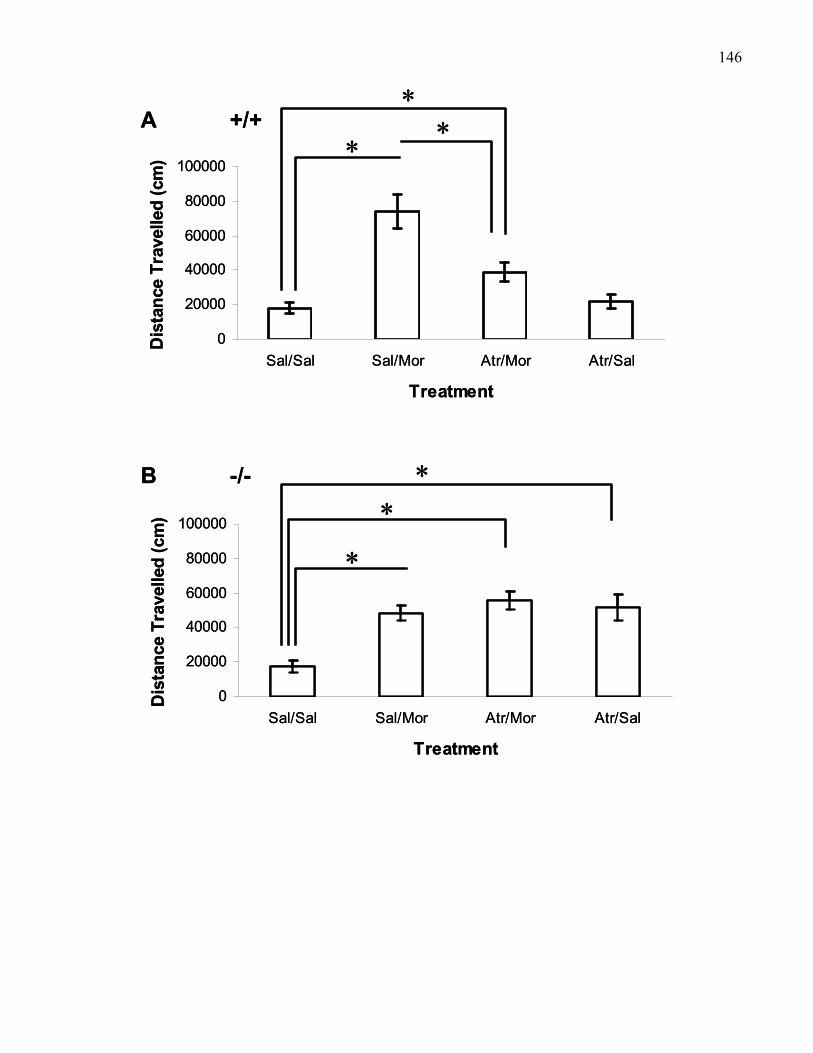
146
0
20000
40000
60000
80000
100000
Sal/Sal Sal/Mor Atr/Mor Atr/Sal
Treatment
Dis
tanc
e Tr
avel
led
(cm
)
0
20000
40000
60000
80000
100000
Sal/Sal Sal/Mor Atr/Mor Atr/Sal
Treatment
Dis
tanc
e Tr
avel
led
(cm
)
A +/+
B -/-
∗∗
∗
∗∗
∗
0
20000
40000
60000
80000
100000
Sal/Sal Sal/Mor Atr/Mor Atr/Sal
Treatment
Dis
tanc
e Tr
avel
led
(cm
)
0
20000
40000
60000
80000
100000
Sal/Sal Sal/Mor Atr/Mor Atr/Sal
Treatment
Dis
tanc
e Tr
avel
led
(cm
)
A +/+
B -/-
∗∗
∗
∗∗
∗
147conditions separately at each time point showed that locomotion following the saline/morphine
treatment was significantly higher relative to the saline/saline treatment (all p’s<0.00001) at all
time points. Further, the atropine/morphine treatment significantly reduced locomotion relative
to the saline/morphine condition at all time points (p<0.01 at 10, 40, 50, 60, 80, 90, and 100 min,
and p<0.00001 at 20, 30, 70, 110, and 120 min). The analysis of time course revealed, over and
above the analysis of total locomotion, that VTA atropine completely blocked morphine-induced
locomotion for the first 40 minutes. During this time locomotion was not significantly different
from saline levels (p>0.05). However, subsequently locomotion gradually increased over the
next 70 minutes and remained above saline levels for the rest of the testing session (p<0.05 at 50,
60, and 70 min, and p<0.00001 at 80-120 min).
VTA atropine on its own slightly increased locomotion above saline levels between 50
and 70 min in wild-type mice. However, statistically the two conditions differed significantly
only at 60 min (p<0.05), and approached significance at 50 min (p=0.079) and 70 min (p=0.085).
Thus, in agreement with the analysis of total locomotion, the time course data showed that the
effect of intra-VTA atropine on its own in B6 mice was very slight. Finally, the atropine effect
observed in wild-type mice was anatomically specific to the VTA. Injection sites that were
outside the VTA (dorsal in both cases) produced no reduction of morphine-induced locomotion
(Figure 2.4). As this group contained only two mice a statistical analysis of the data is not
warranted.
Figure 2.3b shows the time course of locomotion in M5 knockout mice. Repeated-
measures ANOVA revealed a significant main effect of treatment, F (3, 15) = 9.75, p < 0.001,
that was modified by a significant interaction with time, F (33, 165) = 7.67, p < 0.000001. Post-
hoc analyses comparing the 4 treatment conditions separately at each time point showed that at
most time points, locomotion following the saline/morphine treatment was significantly higher
relative to the saline/saline treatment (p<0.05 at 10, 20, 50, 60, and 70 min and p<0.0001
148between 80 and 120 min). Further, the atropine/morphine treatment reduced locomotion relative
to the saline/morphine condition for only the first 20 min of testing (p<0.05 at 10, and 20 min).
In fact, the atropine/morphine treatment increased locomotion relative to saline/morphine
condition thereafter up to 70 min (p<0.05 at 40, 50, 60, and 70 min). Atropine/morphine
locomotion was significantly higher relative to saline/saline at most time points tested (p<0.05 at
40 min, and p<0.00001 between 50 and 120 min). Consistent with the above analysis of total
locomotion, VTA atropine increased locomotion significantly in M5 knockout mice, with
locomotion at all time points, except for 10 min, significantly higher than the saline/saline
treatment (p<0.05 at 20, 30, and 110 min, and p<0.00001 between 40 and 100 min, and at 120
min).
VTA atropine in wild-type and M5 knockout mice
B6 wild-type and M5 knockout mice responded differently to VTA treatment with
atropine relative to saline. Locomotion following either VTA saline/saline treatment or
atropine/saline treatment are reproduced in Figure 2.5 from Figure 2.3. A separate analysis of
this data using a two-way repeated measures ANOVA with treatment (VTA saline vs atropine)
and time (10-120 min) as within-subject factors revealed a significant interaction of treatment
with time for both wild-type, F(11,44) = 2.96, p<0.01, and M5 knockout mice, F (2.11, 10.56) =
5.38, p<0.05 (with Greenhouse-Geyser corrected degrees of freedom).
In wild-type mice, follow-up analysis using Fisher’s LSD test showed that this interaction
was due to significantly higher locomotion following VTA atropine relative to saline between 50
and 70 min (p<0.01). Also, immediately before and after this period, i.e. at 40 and 80 min, there
were trends of higher locomotion following VTA atropine (p= 0.048 and p=0.046, respectively).
Thus, atropine increased locomotion slightly in B6 wild-type mice between 40 and 80 min after
the injection, with a reliable peak effect at 50-70 min.
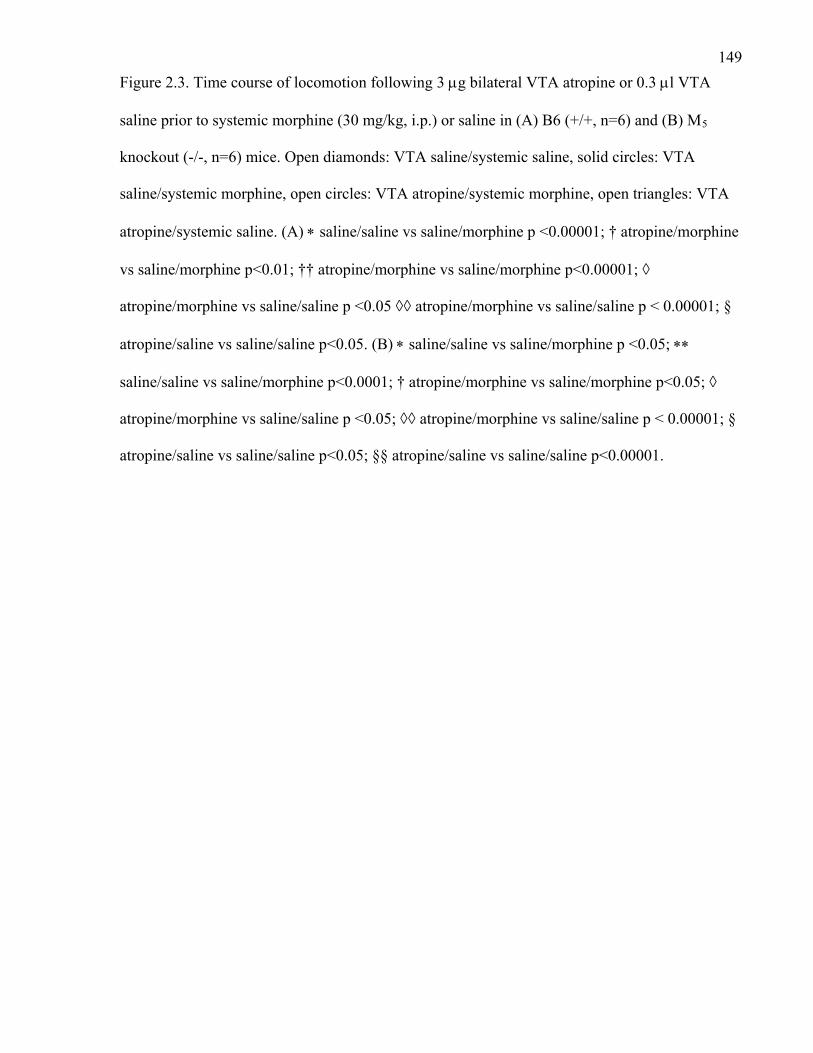
149Figure 2.3. Time course of locomotion following 3 μg bilateral VTA atropine or 0.3 μl VTA
saline prior to systemic morphine (30 mg/kg, i.p.) or saline in (A) B6 (+/+, n=6) and (B) M5
knockout (-/-, n=6) mice. Open diamonds: VTA saline/systemic saline, solid circles: VTA
saline/systemic morphine, open circles: VTA atropine/systemic morphine, open triangles: VTA
atropine/systemic saline. (A) ∗ saline/saline vs saline/morphine p <0.00001; † atropine/morphine
vs saline/morphine p<0.01; †† atropine/morphine vs saline/morphine p<0.00001; ◊
atropine/morphine vs saline/saline p <0.05 ◊◊ atropine/morphine vs saline/saline p < 0.00001; §
atropine/saline vs saline/saline p<0.05. (B) ∗ saline/saline vs saline/morphine p <0.05; ∗∗
saline/saline vs saline/morphine p<0.0001; † atropine/morphine vs saline/morphine p<0.05; ◊
atropine/morphine vs saline/saline p <0.05; ◊◊ atropine/morphine vs saline/saline p < 0.00001; §
atropine/saline vs saline/saline p<0.05; §§ atropine/saline vs saline/saline p<0.00001.
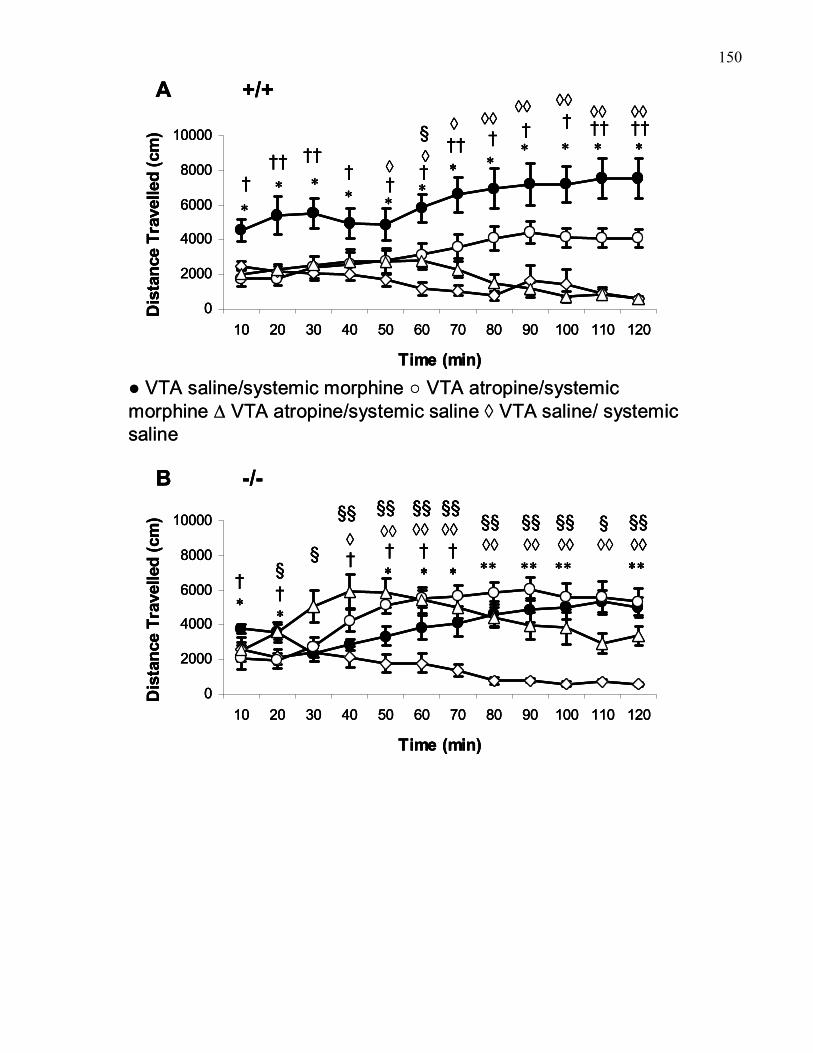
150
A +/+
0
2000
4000
6000
8000
10000
10 20 30 40 50 60 70 80 90 100 110 120
Time (min)
Dis
tanc
e Tr
avel
led
(cm
)
∗†
∗†◊
∗
††
∗†† †
∗
††∗
◊
∗†◊◊ ††
∗
◊◊
∗†◊§
∗†◊◊
∗
†◊◊
††∗
◊◊
B -/-
0
2000
4000
6000
8000
10000
10 20 30 40 50 60 70 80 90 100 110 120
Time (min)
Dis
tanc
e Tr
avel
led
(cm
)
§†∗
נ
§§
∗∗
§§◊◊
◊◊
∗†
§§◊◊
∗†
§§◊◊
∗†
§§
◊◊§§
∗∗◊◊
∗∗
§§◊◊
∗∗
§§◊◊
†§
∗
§
● VTA saline/systemic morphine ○ VTA atropine/systemic morphine ∆ VTA atropine/systemic saline ◊ VTA saline/ systemic saline
A +/+
0
2000
4000
6000
8000
10000
10 20 30 40 50 60 70 80 90 100 110 120
Time (min)
Dis
tanc
e Tr
avel
led
(cm
)
∗†
∗†◊
∗
††
∗†† †
∗
††∗
◊
∗†◊◊ ††
∗
◊◊
∗†◊§
∗†◊◊
∗
†◊◊
††∗
◊◊
B -/-
0
2000
4000
6000
8000
10000
10 20 30 40 50 60 70 80 90 100 110 120
Time (min)
Dis
tanc
e Tr
avel
led
(cm
)
§†∗
נ
§§
∗∗
§§◊◊
◊◊
∗†
§§◊◊
∗†
§§◊◊
∗†
§§
◊◊§§
∗∗◊◊
∗∗
§§◊◊
∗∗
§§◊◊
†§
∗
§
A +/+
0
2000
4000
6000
8000
10000
10 20 30 40 50 60 70 80 90 100 110 120
Time (min)
Dis
tanc
e Tr
avel
led
(cm
)
∗†∗†
∗†◊
∗†◊
∗
††∗
††
∗††∗
†† †∗†∗
††∗
◊††∗
◊
∗†◊◊
∗†◊◊ ††
∗
◊◊
∗
◊◊
∗†◊§
∗†◊§
∗†◊◊
∗†◊◊
∗
†◊◊
∗
†◊◊
††∗
◊◊
∗
◊◊
B -/-
0
2000
4000
6000
8000
10000
10 20 30 40 50 60 70 80 90 100 110 120
Time (min)
Dis
tanc
e Tr
avel
led
(cm
)
§§†∗†∗
נ
§§◊†
§§
∗∗
§§◊◊∗∗
§§◊◊
◊◊
∗†
§§◊◊
∗†
§§
∗†
§§◊◊
∗†
§§◊◊
∗†
§§
∗†
§§◊◊
∗†
§§
∗†
§§
◊◊§§
∗∗◊◊§§
∗∗◊◊∗∗◊◊
∗∗
§§◊◊∗∗
§§◊◊
∗∗
§§◊◊∗∗
§§◊◊
†§
∗†§
∗
§§
● VTA saline/systemic morphine ○ VTA atropine/systemic morphine ∆ VTA atropine/systemic saline ◊ VTA saline/ systemic saline

151Figure 2.4. Effects of bilateral treatment with 3μg atropine in B6 mice (n=2) that had cannulae
placements dorsal to the VTA. Open diamonds: VTA saline/systemic saline, open triangles:
VTA atropine/systemic saline, solid circles: VTA saline/systemic morphine, open circles: VTA
atropine/systemic morphine.
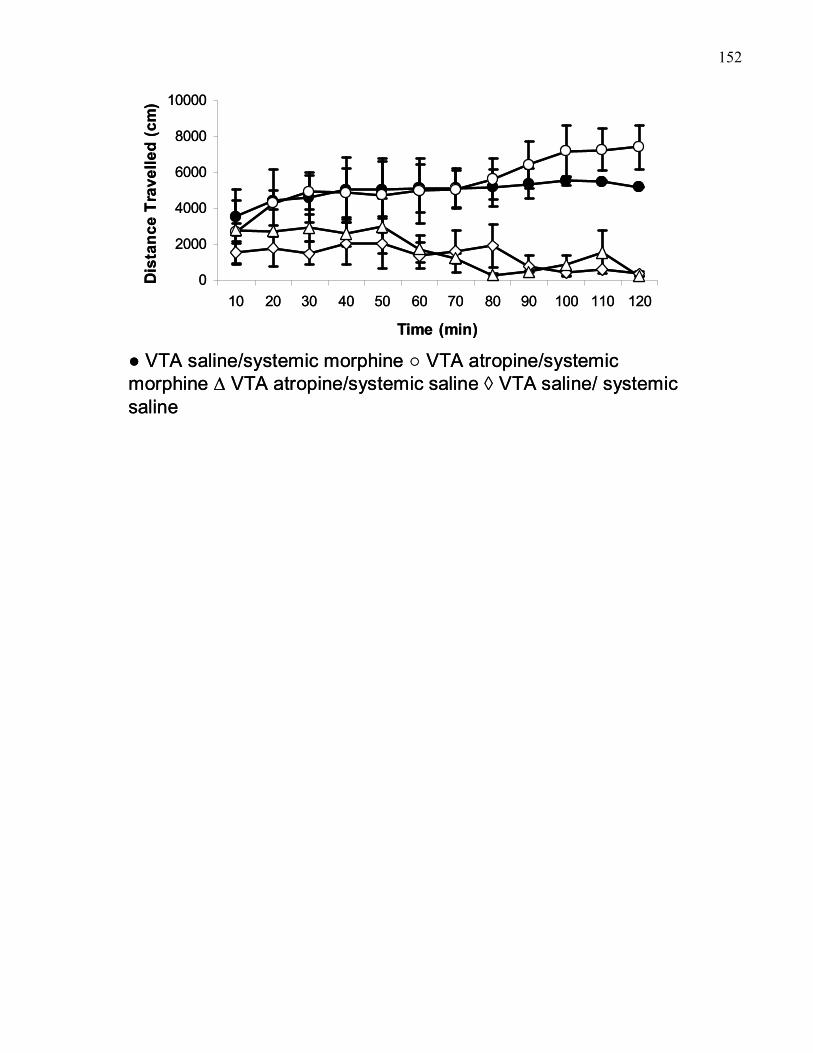
152
0
2000
4000
6000
8000
10000
10 20 30 40 50 60 70 80 90 100 110 120
Time (min)
Dis
tanc
e Tr
avel
led
(cm
)
● VTA saline/systemic morphine ○ VTA atropine/systemic morphine ∆ VTA atropine/systemic saline ◊ VTA saline/ systemic saline
0
2000
4000
6000
8000
10000
10 20 30 40 50 60 70 80 90 100 110 120
Time (min)
Dis
tanc
e Tr
avel
led
(cm
)
● VTA saline/systemic morphine ○ VTA atropine/systemic morphine ∆ VTA atropine/systemic saline ◊ VTA saline/ systemic saline
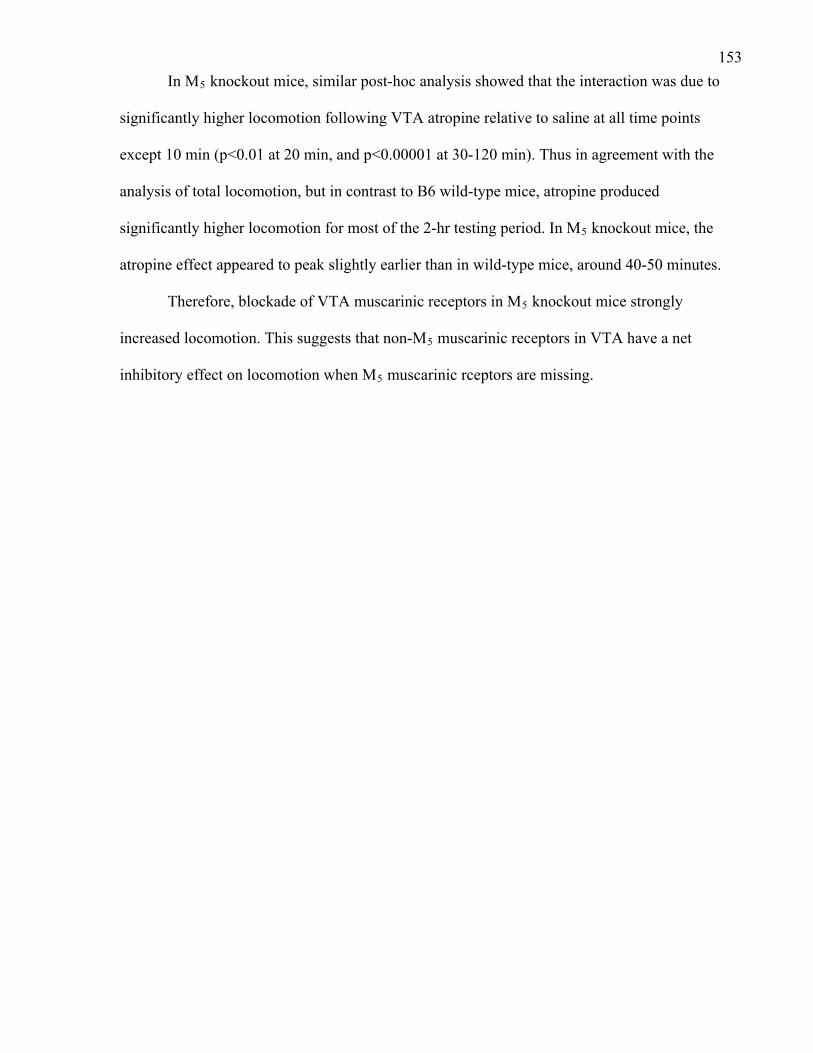
153In M5 knockout mice, similar post-hoc analysis showed that the interaction was due to
significantly higher locomotion following VTA atropine relative to saline at all time points
except 10 min (p<0.01 at 20 min, and p<0.00001 at 30-120 min). Thus in agreement with the
analysis of total locomotion, but in contrast to B6 wild-type mice, atropine produced
significantly higher locomotion for most of the 2-hr testing period. In M5 knockout mice, the
atropine effect appeared to peak slightly earlier than in wild-type mice, around 40-50 minutes.
Therefore, blockade of VTA muscarinic receptors in M5 knockout mice strongly
increased locomotion. This suggests that non-M5 muscarinic receptors in VTA have a net
inhibitory effect on locomotion when M5 muscarinic rceptors are missing.

154Figure 2.5. Effects of VTA treatment with 3 μg bilateral atropine in (A) B6 (+/+, n=6) and (B)
M5 knockout (-/-, n=6) mice. The green line shows locomotion following VTA saline/systemic
saline, while the blue line shows locomotion following VTA atropine/systemic saline. * p< 0.01
** p < 0.00001.
155
0
2000
4000
6000
8000
10000
10 20 30 40 50 60 70 80 90 100 110 120
Time (min)
Dis
tanc
e Tr
avel
led
(cm
)
∗ ∗∗
0
2000
4000
6000
8000
10000
10 20 30 40 50 60 70 80 90 100 110 120Time (min)
Dis
tanc
e Tr
avel
led
(cm
)
∗
∗∗∗∗
∗∗∗∗
∗∗
∗∗
∗∗
∗∗
∗∗
∗∗
A +/+
B -/-
VTA atropine/systemic saline
VTA saline/systemic saline
VTA atropine/systemic saline
VTA saline/systemic saline
0
2000
4000
6000
8000
10000
10 20 30 40 50 60 70 80 90 100 110 120
Time (min)
Dis
tanc
e Tr
avel
led
(cm
)
∗ ∗∗
0
2000
4000
6000
8000
10000
10 20 30 40 50 60 70 80 90 100 110 120Time (min)
Dis
tanc
e Tr
avel
led
(cm
)
∗
∗∗∗∗
∗∗∗∗
∗∗
∗∗
∗∗
∗∗
∗∗
∗∗
A +/+
B -/-
0
2000
4000
6000
8000
10000
10 20 30 40 50 60 70 80 90 100 110 120
Time (min)
Dis
tanc
e Tr
avel
led
(cm
)
∗ ∗∗
0
2000
4000
6000
8000
10000
10 20 30 40 50 60 70 80 90 100 110 120
Time (min)
Dis
tanc
e Tr
avel
led
(cm
)
∗ ∗∗ ∗ ∗∗
0
2000
4000
6000
8000
10000
10 20 30 40 50 60 70 80 90 100 110 120Time (min)
Dis
tanc
e Tr
avel
led
(cm
)
∗
∗∗∗∗
∗∗∗∗
∗∗
∗∗
∗∗
∗∗
∗∗
∗∗
0
2000
4000
6000
8000
10000
10 20 30 40 50 60 70 80 90 100 110 120Time (min)
Dis
tanc
e Tr
avel
led
(cm
)
∗
∗∗∗∗
∗∗∗∗
∗∗
∗∗
∗∗
∗∗
∗∗
∗∗
A +/+
B -/-
VTA atropine/systemic saline
VTA saline/systemic saline
VTA atropine/systemic saline
VTA saline/systemic saline
156Effects of VTA pre-treatment with mecamylamine in B6 wild-type and M5 knockout mice
Total Locomotion
Figure 2.6 shows total locomotion across the two-hour testing period in B6 wild-type and
M5 knockout mice. The saline/saline and saline/morphine data for both wild-type and M5
knockout mice are the same as for the atropine experiment. Repeated-measures ANOVA on total
locomotion data revealed a significant main effect of treatment condition in both B6 wild-type (F
(3, 12) = 5.24, p < 0.05) and M5 knockout (F (3, 15) = 16.63, p < 0.0001) mice. Pre-treatment
with 5 μg bilateral VTA mecamylamine did not significantly reduce the locomotion produced by
30 mg/kg morphine in wild-type mice (p>0.9), while increasing it in M5 knockout mice
(p<0.01).
In wild-type mice mecamylamine pre-treatment in combination with morphine induced
locomotion that was significantly above saline levels (p<0.01). In M5 knockout mice, where
mecamylamine pre-treatment potentiated morphine-induced locomotion, levels were, of course,
also higher than saline (p<0.001). Similar to what was observed following atropine pre-
treatment, mecamylamine pre-treatment by itself did not change total locomotion relative to
saline in wild-type mice (p>0.5), but significantly increased locomotion relative to saline in M5
knockout mice (p<0.0001).
Locomotion Time Course
Separate analysis of locomotor time course in wild-type and M5 knockout mice provided
results consistent with the above analysis of total locomotion. Figure 2.7a shows the time course
of locomotion in B6 wild-type mice. Repeated-measured ANOVA revealed a significant main
effect of treatment, F (3, 12) = 15.53, p < 0.001, that was modified by a significant interaction
with time, F (33, 132) = 1.84, p < 0.01. Post-hoc analyses comparing the 4 treatment groups
separately at each time point showed that at all points locomotion following the saline/morphine
157treatment was significantly higher relative to the saline/saline treatment (all p’s<0.00001).
Further, the mecamylamine/morphine treatment significantly reduced locomotion relative to
Figure 2.6. Total Locomotion following VTA mecamylamine (5 μg bilateral) or VTA saline (0.3
μl) with systemic morphine (30 mg/kg, i.p.) and/or saline in (A) B6 mice (+/+, n=5) and (B) M5
knockout mice (-/-, n=6). For both wild-type and knockout mice, the saline/saline and
saline/morphine data are the same as shown in Figure 2.2. A: ∗∗ p<0.01. B: ∗ p<0.01 ∗∗
p<0.001.
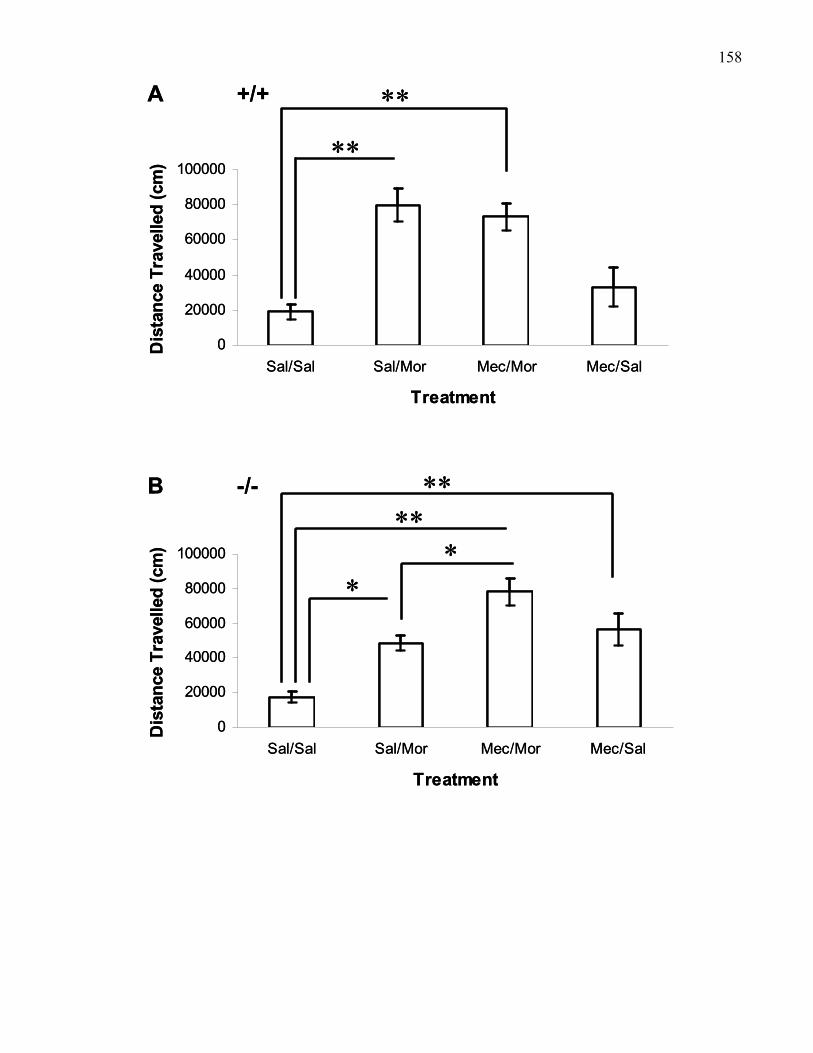
158
0
20000
40000
60000
80000
100000
Sal/Sal Sal/Mor Mec/Mor Mec/Sal
Treatment
Dis
tanc
e Tr
avel
led
(cm
) ∗
∗∗
∗
∗∗
0
20000
40000
60000
80000
100000
Sal/Sal Sal/Mor Mec/Mor Mec/Sal
Treatment
Dis
tanc
e Tr
avel
led
(cm
)
∗∗
∗∗
A +/+
B -/-
0
20000
40000
60000
80000
100000
Sal/Sal Sal/Mor Mec/Mor Mec/Sal
Treatment
Dis
tanc
e Tr
avel
led
(cm
) ∗
∗∗
∗
∗∗
0
20000
40000
60000
80000
100000
Sal/Sal Sal/Mor Mec/Mor Mec/Sal
Treatment
Dis
tanc
e Tr
avel
led
(cm
)
∗∗
∗∗
A +/+
B -/-
159saline/morphine only at 110 and 120 minutes (p<0.05), and thus was essentially ineffective in
blocking morphine-induced locomotion. Consistent with this, morphine-induced locomotion
following VTA pre-treatment with mecamylamine was increased relative to saline at all time
points (p<0.01 at 10 and 40 min, and p<0.00001 at 20, 30, and 50-120 min). VTA
mecamylamine also slightly increased locomotion above saline levels. However, statistically the
two conditions differed significantly only at 30 min (p<0.05), while showing only non-
significant trends at 60 min (p=0.058) and 70 min (p=0.056) and 80 min (p=0.069).
Figure 2.7b shows the time course of locomotion in M5 knockout mice. Repeated-
measured ANOVA revealed a significant main effect of treatment, F (3, 15) = 16.63, p < 0.0001,
that was modified by a significant interaction with time, F (3.89, 19.46) = 3.99, p < 0.05 (with
Greenhouse-Geyser corrected degrees of freedom). Post-hoc analysis comparing the 4 treatment
groups separately at each time point showed that at most time points locomotion was
significantly higher following the saline/morphine treatment, relative to the saline/saline
treatment (p<0.05 at 10, 20, 50, and 60 min, and p<0.0001 between 70 and 120 min). Further,
VTA pre-treatment with mecamylamine increased morphine-induced locomotion in M5
knockout mice (p<0.05 at 20 min, and between 60 and 120 min, and p<0.00001 between 30 and
50 min). Consistent with the above analysis of total locomotion, VTA mecamylamine on its own
produced significant locomotion relative to saline across the entire two-hour testing period
(p<0.01 at 10, 30, 40, 50, 110, and 120 min, and p<0.00001 at 20 and between 60 and 100 min).
VTA mecamylamine in wild-type and M5 knockout mice
Similar to atropine, M5 knockout mice responded differently to VTA treatment with
mecamylamine relative to wild-type controls. To show this more clearly, Figure 2.8 reproduces
locomotion data following either VTA saline/saline treatment or mecamylamine/saline treatment
from Figure 2.7. Two-way repeated-measures ANOVA with treatment (VTA saline vs
mecamylamine) and time (10-120 min) as within-subjects factors revealed only a significant
160Figure 2.7. Time course of morphine-induced (30 mg/kg, i.p.) locomotion in (A) B6 (+/+, n=5)
and (B) M5 knockout (-/-, n=6) mice following bilateral VTA treatment with 5 μg
mecamylamine or saline. Open diamonds: VTA saline/systemic saline, solid circles: VTA
saline/systemic morphine, open circles: VTA mecamylamine/systemic morphine, open triangles:
VTA mecamylamine/systemic saline. Saline/saline and saline/morphine data are the same as
shown in Figure 2.3 (A) * saline/saline vs saline/morphine p<0.00001, †
mecamyalmine/morphine vs saline/morphine p<0.05; ◊ mecamylamine/morphine vs saline/saline
p<0.01; ◊◊ mecamylamine/morphine vs saline/saline p<0.00001; § mecamylamine/saline vs
saline/saline p<0.05 (B) * saline/saline vs saline/morphine p<0.05, ∗∗ saline/saline vs
saline/morphine p<0.0001, † mecamylamine/morphine vs saline/morphine p<0.05, ††
mecamylamine/morphine vs saline/morphine p<0.00001; ◊ mecamylamine/morphine vs
saline/saline p<0.0001; ◊◊ mecamylamine/morphine vs saline/saline p<0.000001; §
mecamylamine/saline vs saline/saline p<0.01; §§mecamylamine/saline vs saline/saline p
<0.00001.
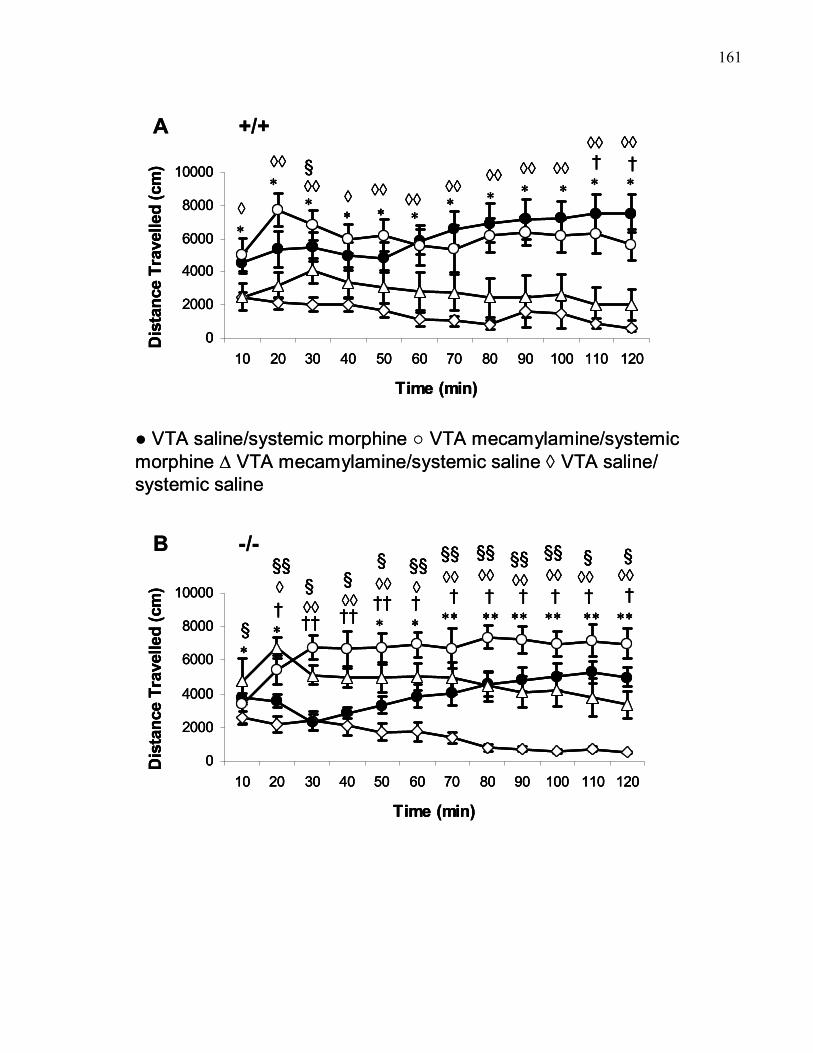
161
0
2000
4000
6000
8000
10000
10 20 30 40 50 60 70 80 90 100 110 120
Time (min)
Dis
tanc
e Tr
avel
led
(cm
)
∗◊ ◊◊
∗∗◊ ◊◊
∗
◊◊∗
◊◊∗
◊◊∗
◊◊∗
§◊◊∗
◊◊∗
†∗
◊◊†∗
◊◊
0
2000
4000
6000
8000
10000
10 20 30 40 50 60 70 80 90 100 110 120
Time (min)
Dis
tanc
e Tr
avel
led
(cm
)
††◊◊§
∗†◊§§
††◊◊§
∗††◊◊§
∗†◊§§
∗∗†◊◊§§
∗∗†◊◊§§
∗∗†◊◊§§
∗∗†◊◊§§
∗∗†◊◊§
∗∗†◊◊§
∗§
A +/+
B -/-
● VTA saline/systemic morphine ○ VTA mecamylamine/systemic morphine ∆ VTA mecamylamine/systemic saline ◊ VTA saline/ systemic saline
0
2000
4000
6000
8000
10000
10 20 30 40 50 60 70 80 90 100 110 120
Time (min)
Dis
tanc
e Tr
avel
led
(cm
)
∗◊ ◊◊
∗∗◊ ◊◊
∗
◊◊∗
◊◊∗
◊◊∗
◊◊∗
§◊◊∗
◊◊∗
†∗
◊◊†∗
◊◊
0
2000
4000
6000
8000
10000
10 20 30 40 50 60 70 80 90 100 110 120
Time (min)
Dis
tanc
e Tr
avel
led
(cm
)
∗◊∗◊ ◊◊
∗◊◊∗
∗◊∗◊ ◊◊
∗◊◊∗
◊◊∗◊◊∗
◊◊∗◊◊∗
◊◊∗◊◊∗
◊◊∗◊◊∗
§◊◊∗
§◊◊∗
◊◊∗◊◊∗
†∗
◊◊†∗
◊◊†∗
◊◊†∗
◊◊
0
2000
4000
6000
8000
10000
10 20 30 40 50 60 70 80 90 100 110 120
Time (min)
Dis
tanc
e Tr
avel
led
(cm
)
††◊◊§
∗†◊§§
††◊◊§
∗††◊◊§
∗†◊§§
∗∗†◊◊§§
∗∗†◊◊§§
∗∗†◊◊§§
∗∗†◊◊§§
∗∗†◊◊§
∗∗†◊◊§
∗§
0
2000
4000
6000
8000
10000
10 20 30 40 50 60 70 80 90 100 110 120
Time (min)
Dis
tanc
e Tr
avel
led
(cm
)
††◊◊§
††◊◊§
∗†◊§§
∗†◊§§
††◊◊§
††◊◊§
∗††◊◊§
∗††◊◊§
∗†◊§§
∗†◊§§
∗∗†◊◊§§
∗∗†◊◊§§
∗∗†◊◊§§
∗∗†◊◊§§
∗∗†◊◊§§
∗∗†◊◊§§
∗∗†◊◊§§
∗∗†◊◊§§
∗∗†◊◊§
∗∗†◊◊§
∗∗†◊◊§
∗∗†◊◊§
∗§∗§
A +/+
B -/-
● VTA saline/systemic morphine ○ VTA mecamylamine/systemic morphine ∆ VTA mecamylamine/systemic saline ◊ VTA saline/ systemic saline
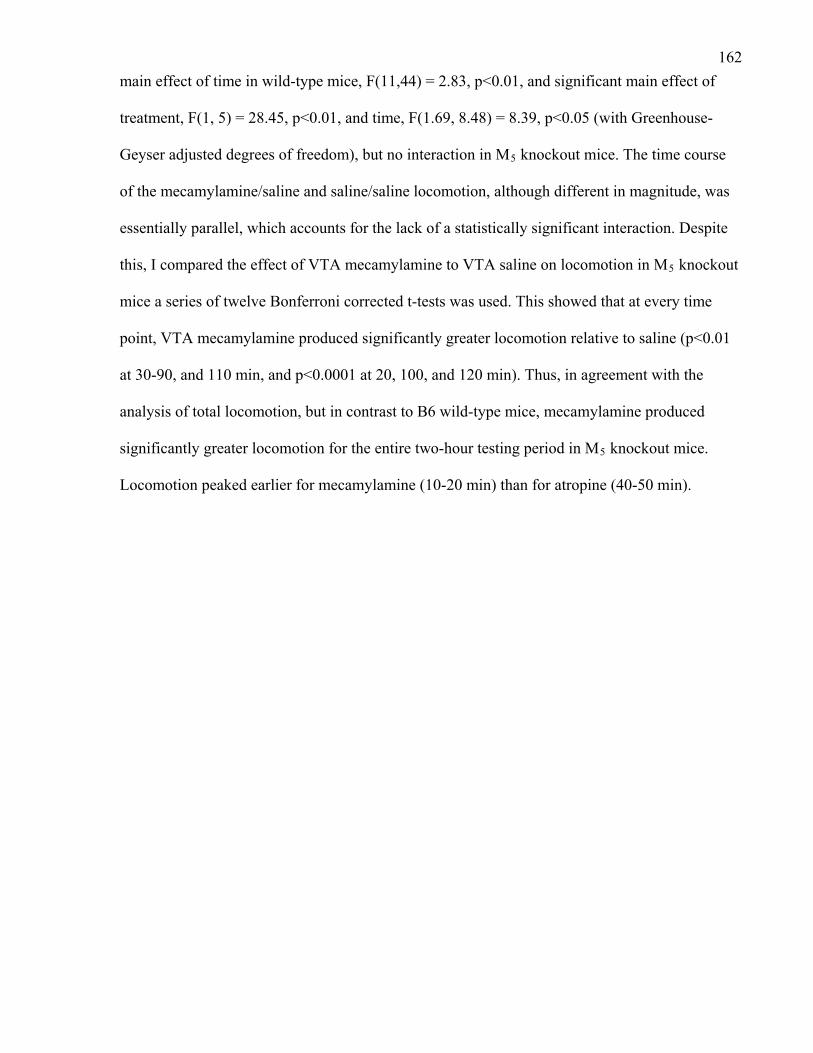
162main effect of time in wild-type mice, F(11,44) = 2.83, p<0.01, and significant main effect of
treatment, F(1, 5) = 28.45, p<0.01, and time, F(1.69, 8.48) = 8.39, p<0.05 (with Greenhouse-
Geyser adjusted degrees of freedom), but no interaction in M5 knockout mice. The time course
of the mecamylamine/saline and saline/saline locomotion, although different in magnitude, was
essentially parallel, which accounts for the lack of a statistically significant interaction. Despite
this, I compared the effect of VTA mecamylamine to VTA saline on locomotion in M5 knockout
mice a series of twelve Bonferroni corrected t-tests was used. This showed that at every time
point, VTA mecamylamine produced significantly greater locomotion relative to saline (p<0.01
at 30-90, and 110 min, and p<0.0001 at 20, 100, and 120 min). Thus, in agreement with the
analysis of total locomotion, but in contrast to B6 wild-type mice, mecamylamine produced
significantly greater locomotion for the entire two-hour testing period in M5 knockout mice.
Locomotion peaked earlier for mecamylamine (10-20 min) than for atropine (40-50 min).
163Figure 2.8. Effects of VTA treatment with 5 μg bilateral mecamylamine in (A) B6 (+/+, n=5)
and (B) M5 knockout (-/-, n=6) mice (reproduced from Figure 2.7). The green line shows
locomotion following VTA saline/systemic saline, while the red line shows locomotion
following VTA mecamylamine/systemic saline. * p<0.01 ** p<0.0001.
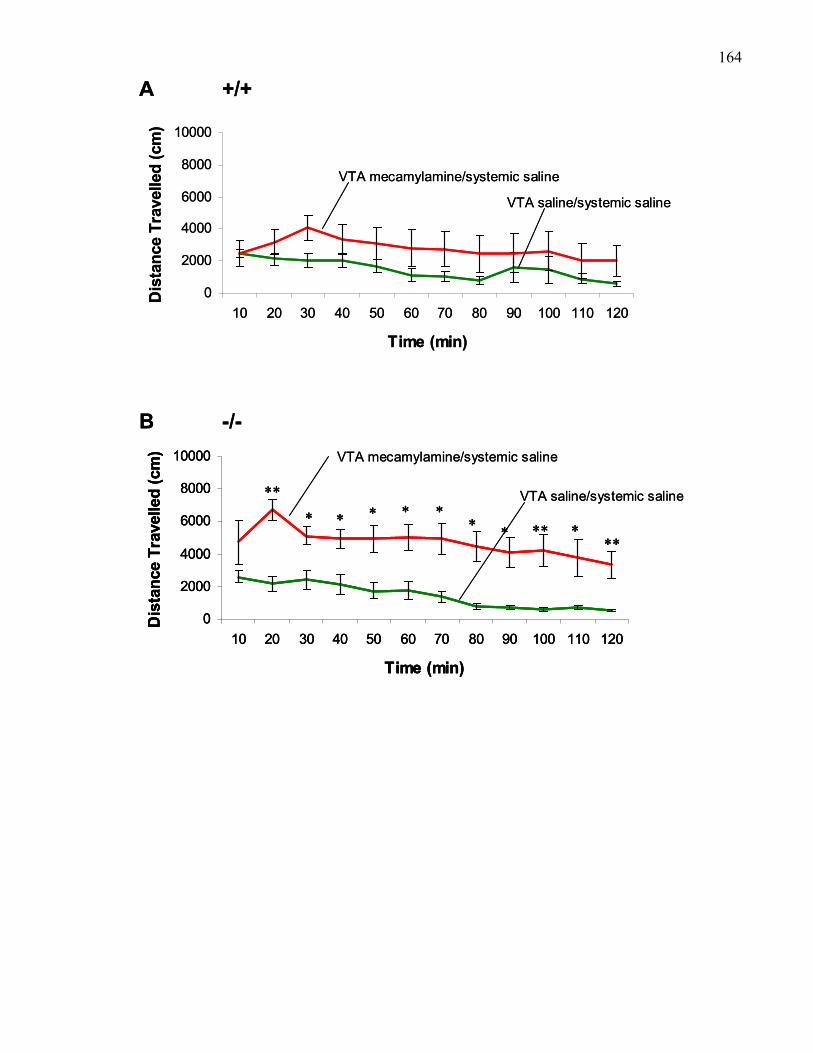
164
0
2000
4000
6000
8000
10000
10 20 30 40 50 60 70 80 90 100 110 120
Time (min)
Dis
tanc
e Tr
avel
led
(cm
)
0
2000
4000
6000
8000
10000
10 20 30 40 50 60 70 80 90 100 110 120
Time (min)
Dis
tanc
e Tr
avel
led
(cm
)
∗∗∗∗ ∗∗ ∗
∗
∗∗∗∗∗ ∗
A +/+
B -/-
VTA mecamylamine/systemic saline
VTA saline/systemic saline
VTA mecamylamine/systemic saline
VTA saline/systemic saline
0
2000
4000
6000
8000
10000
10 20 30 40 50 60 70 80 90 100 110 120
Time (min)
Dis
tanc
e Tr
avel
led
(cm
)
0
2000
4000
6000
8000
10000
10 20 30 40 50 60 70 80 90 100 110 120
Time (min)
Dis
tanc
e Tr
avel
led
(cm
)
∗∗∗∗ ∗∗ ∗
∗
∗∗∗∗∗ ∗
0
2000
4000
6000
8000
10000
10 20 30 40 50 60 70 80 90 100 110 120
Time (min)
Dis
tanc
e Tr
avel
led
(cm
)
∗∗∗∗ ∗∗ ∗
∗
∗∗∗∗∗ ∗
A +/+
B -/-
VTA mecamylamine/systemic saline
VTA saline/systemic saline
VTA mecamylamine/systemic saline
VTA saline/systemic saline
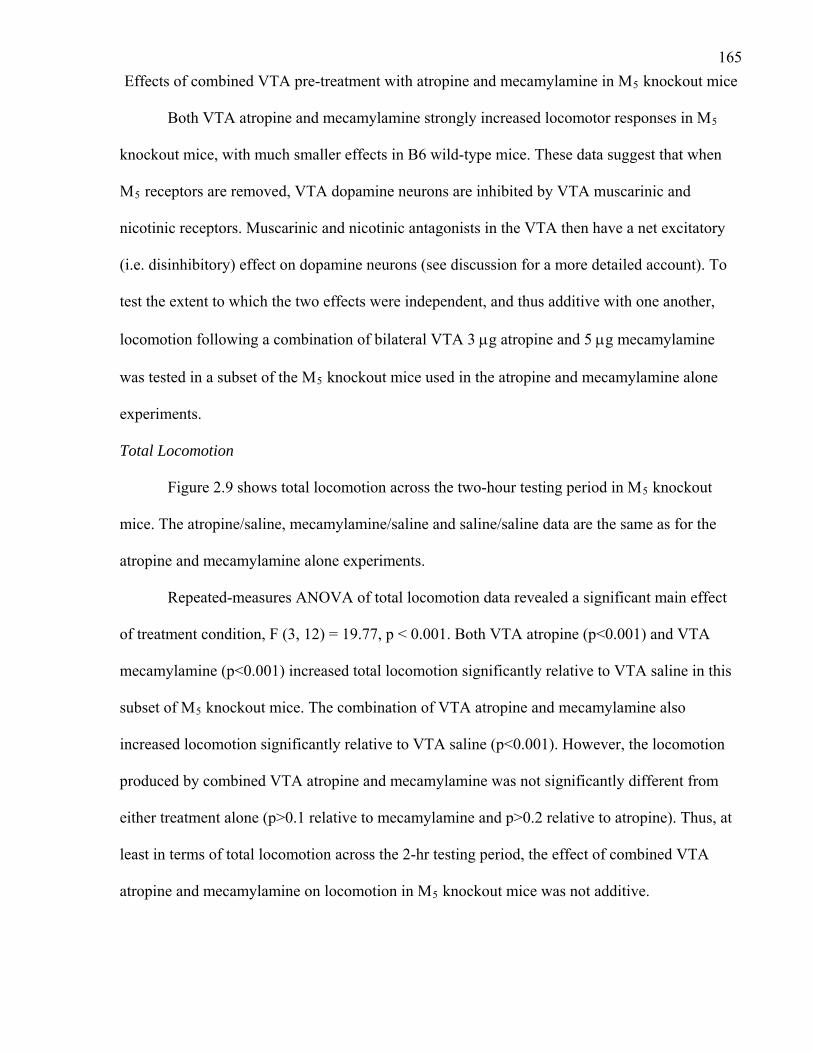
165Effects of combined VTA pre-treatment with atropine and mecamylamine in M5 knockout mice
Both VTA atropine and mecamylamine strongly increased locomotor responses in M5
knockout mice, with much smaller effects in B6 wild-type mice. These data suggest that when
M5 receptors are removed, VTA dopamine neurons are inhibited by VTA muscarinic and
nicotinic receptors. Muscarinic and nicotinic antagonists in the VTA then have a net excitatory
(i.e. disinhibitory) effect on dopamine neurons (see discussion for a more detailed account). To
test the extent to which the two effects were independent, and thus additive with one another,
locomotion following a combination of bilateral VTA 3 μg atropine and 5 μg mecamylamine
was tested in a subset of the M5 knockout mice used in the atropine and mecamylamine alone
experiments.
Total Locomotion
Figure 2.9 shows total locomotion across the two-hour testing period in M5 knockout
mice. The atropine/saline, mecamylamine/saline and saline/saline data are the same as for the
atropine and mecamylamine alone experiments.
Repeated-measures ANOVA of total locomotion data revealed a significant main effect
of treatment condition, F (3, 12) = 19.77, p < 0.001. Both VTA atropine (p<0.001) and VTA
mecamylamine (p<0.001) increased total locomotion significantly relative to VTA saline in this
subset of M5 knockout mice. The combination of VTA atropine and mecamylamine also
increased locomotion significantly relative to VTA saline (p<0.001). However, the locomotion
produced by combined VTA atropine and mecamylamine was not significantly different from
either treatment alone (p>0.1 relative to mecamylamine and p>0.2 relative to atropine). Thus, at
least in terms of total locomotion across the 2-hr testing period, the effect of combined VTA
atropine and mecamylamine on locomotion in M5 knockout mice was not additive.

166Figure 2.9. Total locomotion following bilateral VTA saline (0.3 μl), atropine (3 μg),
mecamylamine (5 μg), or combined atropine (3 μg) and mecamylamine (5 μg) treatment in M5
knockout mice (n=5). The saline/saline, atropine/saline, and mecamylamine/saline data are the
same as shown in Figures 2.2. and 2.6. ∗∗ p<0.001
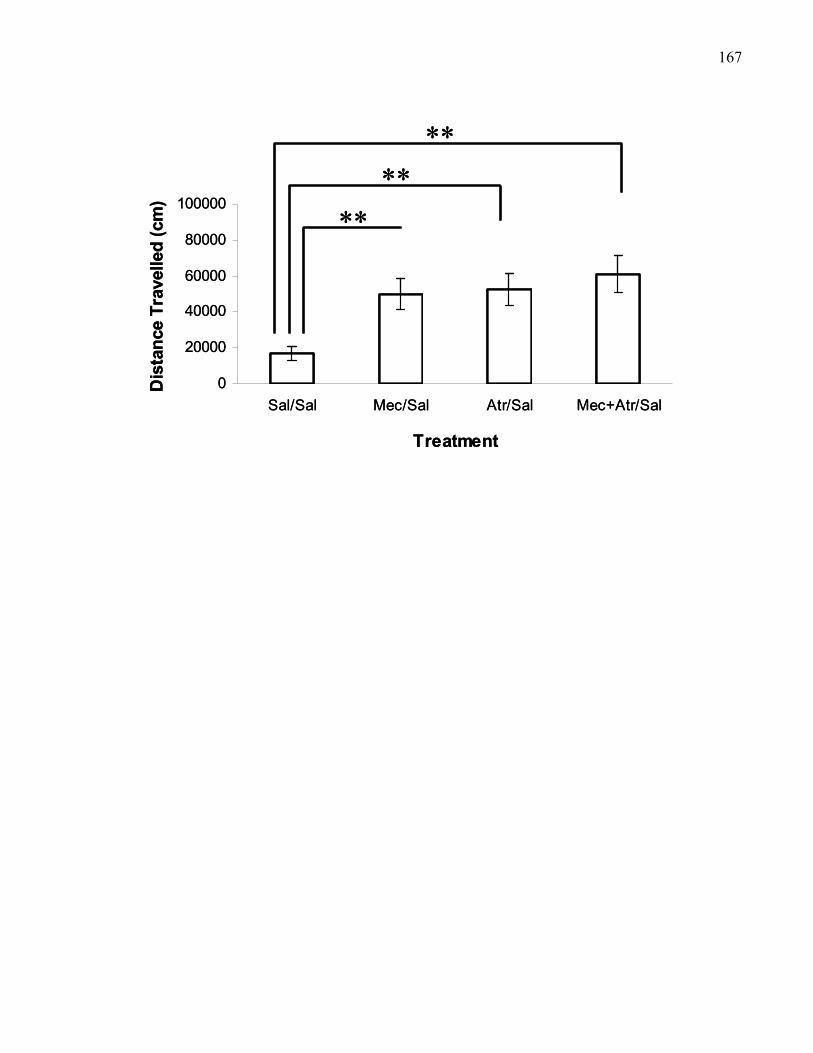
167
0
20000
40000
60000
80000
100000
Sal/Sal Mec/Sal Atr/Sal Mec+Atr/Sal
Treatment
Dis
tanc
e Tr
avel
led
(cm
)∗∗
∗∗∗∗
0
20000
40000
60000
80000
100000
Sal/Sal Mec/Sal Atr/Sal Mec+Atr/Sal
Treatment
Dis
tanc
e Tr
avel
led
(cm
)∗∗
∗∗∗∗
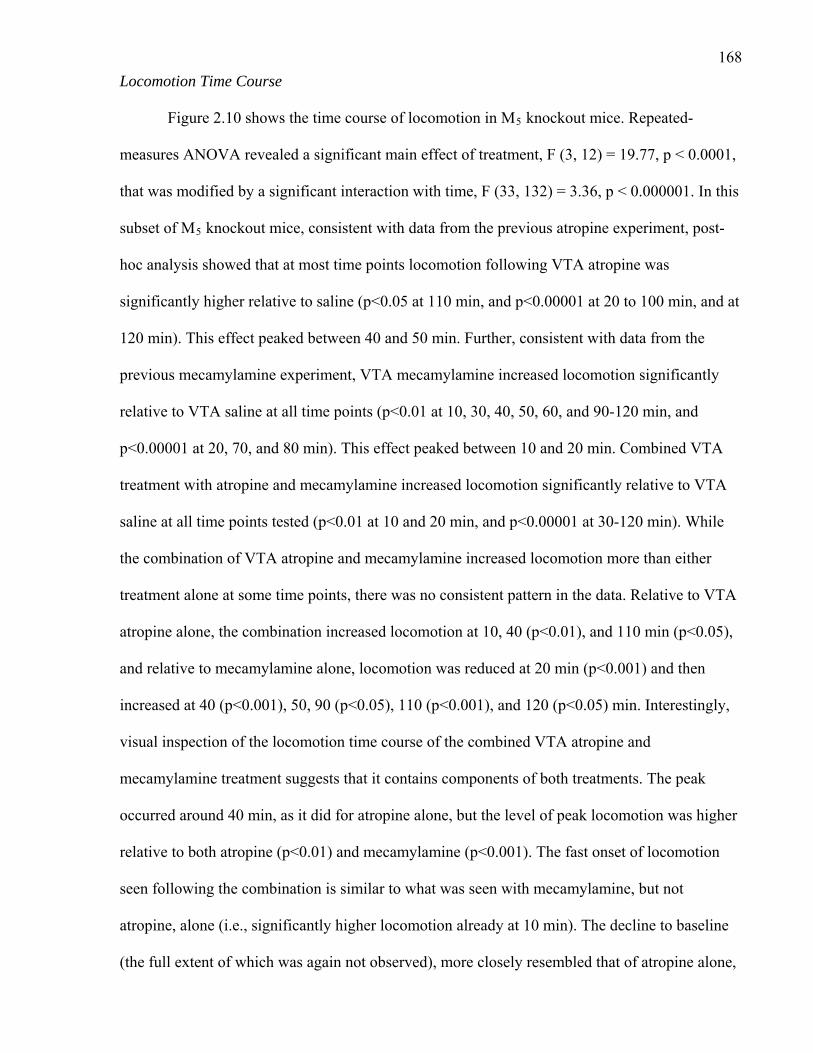
168Locomotion Time Course
Figure 2.10 shows the time course of locomotion in M5 knockout mice. Repeated-
measures ANOVA revealed a significant main effect of treatment, F (3, 12) = 19.77, p < 0.0001,
that was modified by a significant interaction with time, F (33, 132) = 3.36, p < 0.000001. In this
subset of M5 knockout mice, consistent with data from the previous atropine experiment, post-
hoc analysis showed that at most time points locomotion following VTA atropine was
significantly higher relative to saline (p<0.05 at 110 min, and p<0.00001 at 20 to 100 min, and at
120 min). This effect peaked between 40 and 50 min. Further, consistent with data from the
previous mecamylamine experiment, VTA mecamylamine increased locomotion significantly
relative to VTA saline at all time points (p<0.01 at 10, 30, 40, 50, 60, and 90-120 min, and
p<0.00001 at 20, 70, and 80 min). This effect peaked between 10 and 20 min. Combined VTA
treatment with atropine and mecamylamine increased locomotion significantly relative to VTA
saline at all time points tested (p<0.01 at 10 and 20 min, and p<0.00001 at 30-120 min). While
the combination of VTA atropine and mecamylamine increased locomotion more than either
treatment alone at some time points, there was no consistent pattern in the data. Relative to VTA
atropine alone, the combination increased locomotion at 10, 40 (p<0.01), and 110 min (p<0.05),
and relative to mecamylamine alone, locomotion was reduced at 20 min (p<0.001) and then
increased at 40 (p<0.001), 50, 90 (p<0.05), 110 (p<0.001), and 120 (p<0.05) min. Interestingly,
visual inspection of the locomotion time course of the combined VTA atropine and
mecamylamine treatment suggests that it contains components of both treatments. The peak
occurred around 40 min, as it did for atropine alone, but the level of peak locomotion was higher
relative to both atropine (p<0.01) and mecamylamine (p<0.001). The fast onset of locomotion
seen following the combination is similar to what was seen with mecamylamine, but not
atropine, alone (i.e., significantly higher locomotion already at 10 min). The decline to baseline
(the full extent of which was again not observed), more closely resembled that of atropine alone,
169Figure 2.10. Locomotion time course following bilateral VTA saline (0.3 μl; green line), atropine
(3 μg; blue line), mecamylamine (5 μg; red line), or combined atropine (3 μg) and
mecamylamine (5 μg; black line) treatment in M5 knockout mice (n=5). The saline/saline,
atropine/saline, and mecamylamine/saline data are the same as shown in Figures 2.3 and 2.7.
∗ atropine/saline vs saline/saline p<0.05; ∗∗ atropine/saline vs saline/saline p<0.00001; †
mecamylamine/saline vs saline/saline p<0.01; †† mecamylamine/saline vs saline/saline
p<0.00001; ◊ atropine + mecamylamine/saline vs saline/saline p <0.01; ◊◊ atropine +
mecamylamine/saline vs saline/saline p<0.00001; § atropine + mecamylamine/saline vs
atropine/saline p<0.05; §§ atropine + mecamylamine/saline vs atropine/saline p<0.01; ƒ atropine
+ mecamylamine/saline vs mecamylamine/saline p<0.05; ƒƒ atropine + mecamylamine/saline vs
mecamylamine/saline p<0.001.
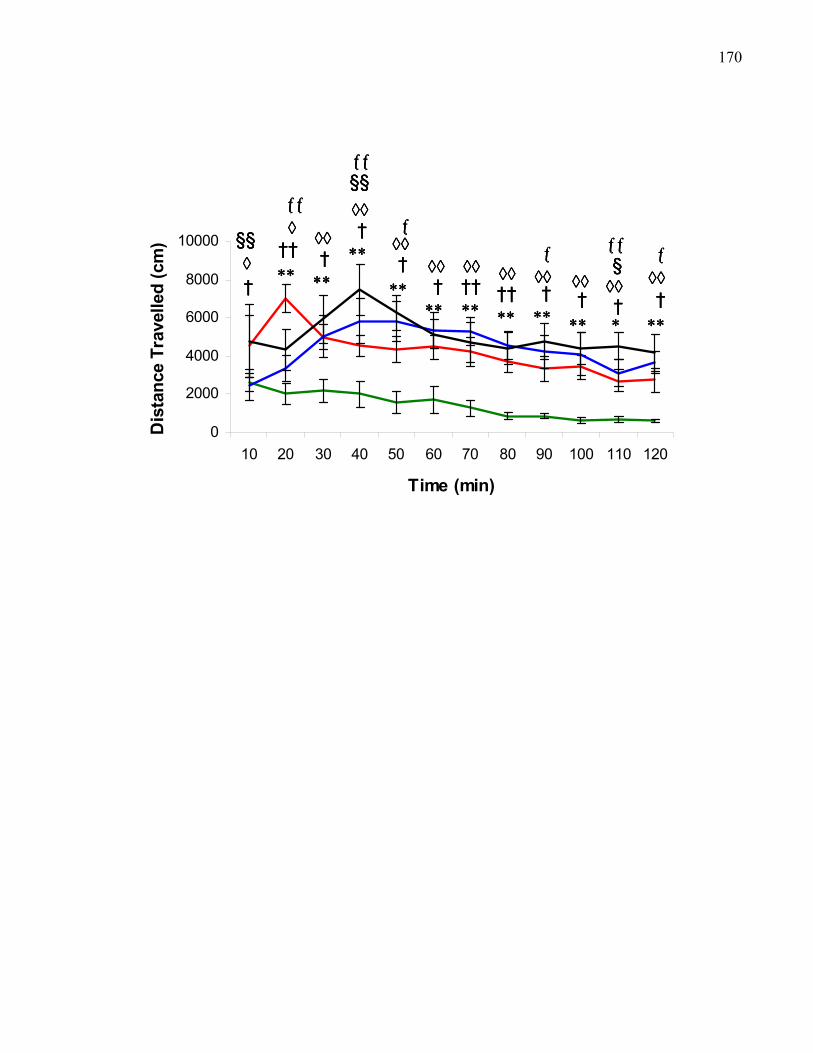
170
0
2000
4000
6000
8000
10000
10 20 30 40 50 60 70 80 90 100 110 120
Time (min)
Dis
tanc
e Tr
avel
led
(cm
) ††◊ƒƒ
∗∗
†◊◊§
ƒƒ
∗
§§
†◊
∗∗
◊◊† ∗∗
†◊◊§§ƒƒ
∗∗†◊◊ƒ
††∗∗
◊◊
∗∗†◊◊
∗∗†◊◊
ƒ
∗∗†◊◊††
∗∗
◊◊ƒ
∗∗†◊◊
††◊ƒƒ
∗∗††◊ƒƒ
∗∗
†◊◊§
ƒƒ
∗†◊◊§
ƒƒ
∗
§§
†◊
§§
†◊
∗∗
◊◊†
∗∗
◊◊† ∗∗
†◊◊§§ƒƒ
∗∗†◊◊§§ƒƒ
∗∗†◊◊ƒ
∗∗†◊◊ƒ
††∗∗
◊◊††∗∗
◊◊
∗∗†◊◊
∗∗†◊◊
∗∗†◊◊
∗∗†◊◊
ƒ
∗∗†◊◊ƒ
∗∗†◊◊††
∗∗
◊◊††∗∗
◊◊ƒ
∗∗†◊◊ƒ
∗∗†◊◊
171with several time points during the second hour different from mecamylamine, but not atropine,
alone.
Chapter 2 Discussion
The data from Experiment 3 show first, that bilateral VTA pre-treatment with 3 μg
atropine reduced locomotion induced by 30 mg/kg (i.p.) morphine in B6 wild-type, but not in M5
knockout mice. Second, bilateral VTA pre-treatment with 5 μg mecamylamine did not alter the
locomotion induced by 30 mg/kg (i.p.) morphine in B6 wild-type mice, while significantly
potentiating morphine-induced locomotion in M5 knockout mice. Third, in M5 knockout mice
either intra-VTA atropine or mecamylamine strongly increased locomotion, while only slightly
increasing locomotion in wild-type mice.
Morphine-induced locomotion is blocked by intra-VTA atropine in wild-type but not M5
knockout mice
The time course of morphine-induced locomotion following VTA pre-treatment with
atropine showed that nonspecific muscarinic receptor antagonism in the VTA in B6 wild-type
mice was most effective in blocking the onset of morphine-induced locomotion. Morphine-
induced locomotion was reduced to saline levels for the first 40 min of testing, and thus
completely blocked. Thereafter, locomotion gradually increased to above saline levels, but
consistently remained below saline/morphine levels. Thus, as predicted, pharmacological
blockade of all VTA muscarinic receptors, including M5, blocked most morphine-induced
locomotion in wild-type mice. On the other hand, VTA mecamylamine did not reduce total
morphine-induced locomotion across two hours. In fact, VTA mecamylamine may have slightly
increased morphine-induced locomotion, particularly early on during testing, but this was not
supported statistically. Together, these data show that in B6 wild-type mice excitatory
cholinergic input to the VTA, thought to be important in mediating the acute locomotor effects of
morphine, is critically mediated by muscarinic, but not nicotinic receptors in VTA.
172The effects of VTA atropine (3-60 μg) treatment have been studied previously in the
context of brain-stimulation reward in rats (Kofman et al., 1990; Singh, Desiraju, & Raju, 1997;
Yeomans & Baptista, 1997). Kofman et al. (1990) reported that the effects of atropine on current
thresholds were evident within 5 min after the injection. Similarly, with a much higher dose of
atropine (100 ug), Singh et al. (2006) showed that relative to saline VTA atropine pre-treatment
reduced bar-pressing rates immediately. Both these studies are consistent with the complete
blockade of morphine-induced locomotion in the first 20 min observed here. Further, an
immediate onset effect is also what would be expected if the pharmacological agent is
administered directly into the site of action (i.e. a histologically verified VTA injection site). In
support of this, atropine injection sites dorsal to the VTA had no effect on morphine-induced
locomotion.
Forty min post-injection, locomotion induced by morphine started increasing to above
saline levels, suggesting that the blockade of VTA muscarinic receptors was becoming less
effective. This is again consistent with the work of Kofman et al. (1990) who reported peak
effects of atropine on current threshold within 15-50 minutes, depending on the injection site,
followed by a gradual decline over the course of the next two hours. In the current study it is
difficult to determine where exactly the peak inhibition of morphine-induced locomotion
occurred, as locomotion was equally inhibited over the first 40 min. However, the complete
blockade of morphine-induced locomotion for the entire time period is nonetheless consistent
with what Kofman et al. (1990) report.
Behaviour experiments utilizing VTA atropine in rats have previously been criticized
based on the fact that high doses of intracranial atropine may have local anesthetic effects
(discussed by Kofman & Yeomans, 1989). In these rat studies (summarized by Yeomans &
Baptista, 1997), considerably higher doses of atropine were used than in the current study (i.e.
10, 30 or 60 μg in rats vs 3 μg used here in mice), making local anesthetic effects less likely to
173account for the current results. A more convincing argument is that in wild-type mice, VTA
atropine on its own had no appreciable effect relative to saline. In fact, if anything there was a
trend of higher, albeit statistically non-significant, total locomotion following VTA atropine.
Perhaps the most convincing argument against this possibility is that in M5 knockout mice, the
same dose of VTA atropine induced very significant levels of locomotion.
Several pieces of evidence, previous to the current experiment, suggest an important role
for cholinergic inputs to the VTA in mediating the effects of morphine on dopamine. Lesions of
either the LDT (Forster et al., 2002) or PPT (Miller et al., 2002) reduced either accumbal and
striatal dopamine efflux in response to intravenous morphine in rats, and VTA scopolamine
strongly reduced accumbal dopamine efflux in response to systemic morphine (Miller et al.,
2005). Furthermore, PPT lesions blocked the expression of morphine conditioned place
preference in drug-naïve rats (Bechara et al., 1992; Nader & van der Kooy, 1997), and VTA
atropine, and to a lesser extent mecamylamine, dose-dependently reduced conditioned place
preference by systemic morphine in rats (Rezayof et al., 2007). In Experiment 1, M5 receptor
knockout mice showed significantly reduced morphine-induced locomotion suggesting that a
significant part of cholinergic input to the VTA is mediated through M5 receptors. Accordingly,
blocking VTA M5 muscarinic receptors in wild-type mice, which unfortunately can only be
accomplished with drugs like atropine or scopolamine, was expected to reduce morphine-
induced locomotion to a similar extent as systemic knockout of the M5 receptor. Indeed, this
prediction holds true when comparing the results from Experiments 1 and 3. To facilitate this
comparison, Figure 2.11 reproduces M5 knockout mouse data (Experiment 1) and morphine-
induced locomotion following VTA atropine pre-treatment in wild-type mice (Experiment 3).
This illustrates how similar the two effects are, both in terms of total locomotion (a) and in terms
of the time course of locomotion (b). The time course suggests that VTA atropine in wild-type

174Figure 2.11. A comparison on 30 mg/kg (i.p.) morphine-induced locomotion in B6 M5 knockout
(-/-) (n=14) and B6 wild-type (+/+) mice (n=6) following bilateral VTA pre-treatment with 3 μg
atropine. (A) Total locomotion across two hours. (B) Locomotion time course across 2 hrs. Solid
circles show B6 M5 knockout mice and open circles B6 wild-type mice with VTA atropine pre-
treatment.
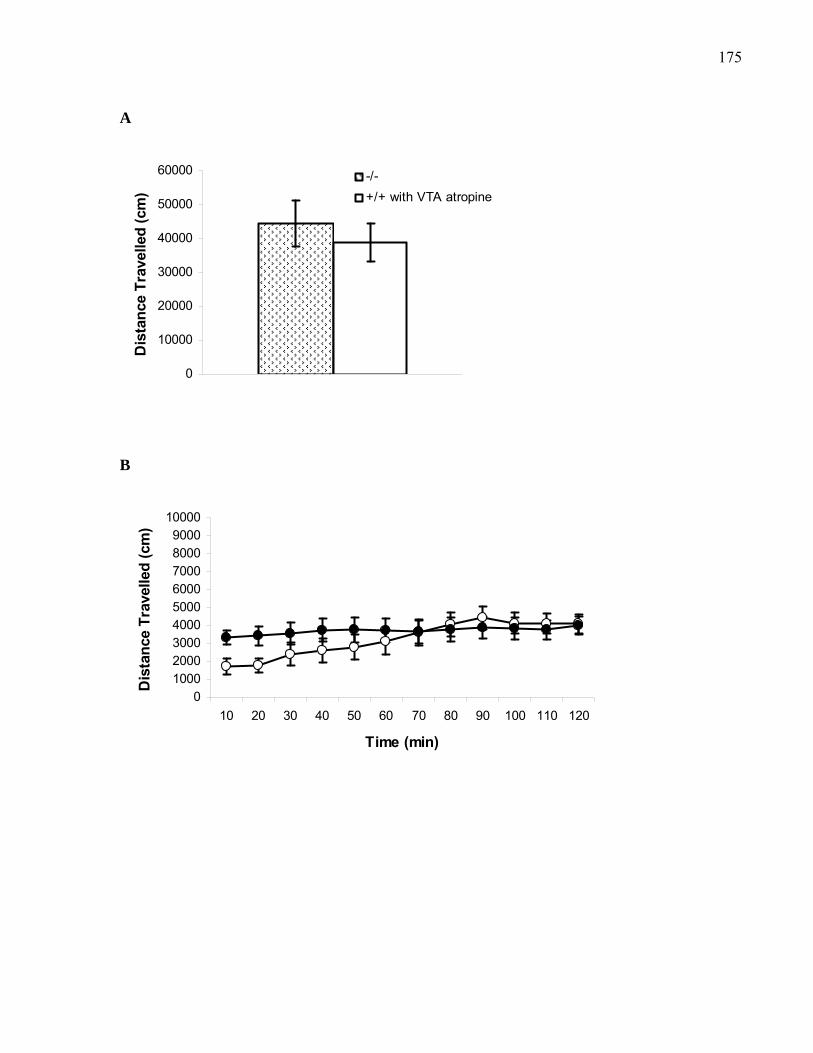
175
A
0
10000
20000
30000
40000
50000
60000
Dis
tanc
e Tr
avel
led
(cm
)
-/-+/+ with VTA atropine
B
0100020003000400050006000700080009000
10000
10 20 30 40 50 60 70 80 90 100 110 120
Time (min)
Dis
tanc
e Tr
avel
led
(cm
)
176mice reduced morphine-induced locomotion in the first 20 min more extensively than systemic
knockout of M5 receptors. This would indicate that atropine through its action on another
muscarinic receptor sub-type was further decreasing the onset of morphine-induced locomotion.
To confirm this statistically, the data were analyzed with a two-way between- (pharmacology in
wildtypes vs M5 knockouts) within-subjects (time block) ANOVA. This revealed a significant
main effect of time (F(2.89, 52) = 7.25, p<0.001, with Greenhouse-Geyser corrected degrees of
freedom) that was modified by an interaction with the group of mice (F(2.89, 52) = 3.74,
p<0.05). This interaction is not very revealing however, as it is likely due to the fact that the two
graphs cross over around 70 min. Follow-up analysis using Tukey’s HSD for unequal sample
size showed that the two groups did not differ at any of the individual time points. Therefore,
muscarinic mediation of excitatory cholinergic input to the VTA, thought to be important in
mediating the acute locomotor effects of morphine, is critically mediated by M5 muscarinic
receptors in the VTA.
Intra-VTA atropine does not reduce morphine-induced locomotion in M5 knockout mice
If cholinergic excitatory input to the VTA, involved in the acute stimulant effect of
morphine, is largely mediated by M5 receptors, then the locomotion shown by M5 knockout
mice should not be affected by VTA atropine pre-treatment, as the target receptor is absent in
these mice. Indeed, Figure 2.2b supported this conclusion, showing no attenuation of total
locomotion in M5 knockout mice. The time course of morphine-induced locomotion following
VTA atropine showed a biphasic effect of VTA atropine on morphine-induced locomotion in M5
knockout mice. For the first 20 min, atropine reduced morphine-induced locomotion just as in
wild-type mice. Thereafter, atropine increased morphine-induced locomotion for up to 70 min
post-injection, while in wild-type mice morphine-induced locomotion following atropine was
significantly reduced during the same time. Thus, VTA atropine was clearly more effective at
blocking the stimulant effect of morphine in wild-type than in M5 knockout mice. The initial
177depressant effect cannot be related to M5 as it was present regardless of whether the M5 receptor
was present or not. This may then reflect a transitory local anesthetic effect of atropine.
However, the fact that locomotion was not reduced below saline levels and that the same dose of
atropine on its own produced significant locomotion in knockout mice during the same time
period would argue against this possibility.
It is also difficult to explain the initial non-M5 mediated depression of locomotion in
terms of the action of atropine on other muscarinic receptor sub-types in the VTA. Atropine
blockade of GABAergic M3 receptors should disinhibit dopamine neurons. Blockade of terminal
M2 and/or M4 receptors should increase VTA acetylcholine levels, which in the M5 knockout
could either directly or indirectly excite dopamine neurons via somatic or terminal nicotinic
receptors, respectively. Increased VTA acetylcholine could also excite GABAergic M3 receptors,
so that GABA neurons could inhibit dopamine neurons. However, this is unlikely, as VTA
atropine should block all muscarinic receptors simultaneously. So even if there were increased
VTA acetylcholine levels due to the action of atropine on M2/M4 receptors, atropine should have
antagonized the effect of increased acetylcholine on GABAergic M3 receptors.
Intra-VTA mecamylamine increases morphine-induced locomotion in M5 knockout mice
Intra-VTA mecamylamine potentiated morphine-induced locomotion in M5 knockout
mice, but not in wild-type mice. The potentiation of morphine-induced locomotion was stronger
following mecamylamine than atropine. Morphine-induced locomotion was potentiated by VTA
mecamylamine between 20-120 min post-injection, while it was potentiated by VTA atropine
between 40-70 minutes.
Pre-treatment with VTA mecamylamine in M5 knockout mice increased morphine-
induced locomotion to levels seen in wild-type mice, suggesting that nicotinic antagonism in the
VTA produced a net excitation of dopamine neurons that was additive with the residual
178morphine-induced locomotion. Possible mechanisms by which this might occur are discussed
below in the context of the stimulant effects of VTA mecamylamine.
Atropine in the VTA: stimulant effects on locomotion
VTA atropine had only a slight effect on locomotion in wild-type mice, but greatly
increased locomotion in M5 knockout mice. The onset of the VTA atropine stimulant effect was
relatively slow with significant increases in locomotion not evident before 10-20 minutes, a peak
effect between 40-50 minutes, and a gradual decrease to pre-injection levels. Clearly an
extension of the testing time would have been beneficial in revealing the entire time course of the
atropine effect.
The present pharmacology experiments provided the unique opportunity to study the role
of non-M5 VTA muscarinic receptors in locomotion. The differences between wild-type and
knockout mice suggest that the inhibitory effects of other non-M5 muscarinic receptor sub-types
on locomotion only become apparent when the M5 receptor is removed. Accordingly, in the M5
knockout mouse VTA atropine inhibited what under normal circumstances would be a
muscarinic receptor-mediated inhibition of dopamine neurons (i.e., disinhibition led to increased
locomotion). In wild-type mice, on the other hand, the direct excitation of dopamine neurons
through M5 receptors overrides the indirect non-M5 mechanisms.
Which of the other VTA muscarinic receptor sub-types (M2, M3, and M4) may contribute
to the disinhibiting effect of atropine? M2 receptors are associated with the terminals of VTA
cholinergic efferents where they are thought to act as autoreceptors (see Figure 2, General
Introduction, pg. 18) (Buckley et al., 1988; Levey et al., 1991; Wei et al., 1994). Blockade of
these receptors would result in increased levels of VTA acetylcholine that may excite dopamine
neurons indirectly or directly via nicotinic receptors. However, Tzavara and colleagues (2004)
showed that neither basal levels of VTA acetylcholine nor basal levels of nucleus accumbens
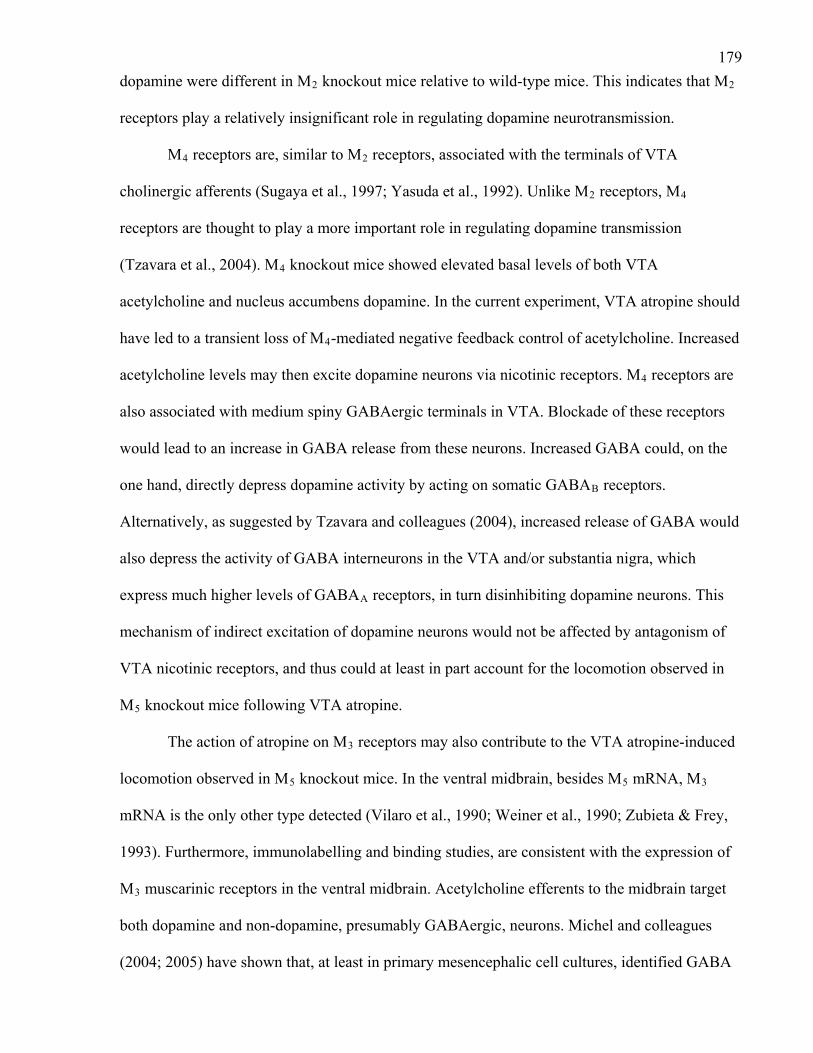
179dopamine were different in M2 knockout mice relative to wild-type mice. This indicates that M2
receptors play a relatively insignificant role in regulating dopamine neurotransmission.
M4 receptors are, similar to M2 receptors, associated with the terminals of VTA
cholinergic afferents (Sugaya et al., 1997; Yasuda et al., 1992). Unlike M2 receptors, M4
receptors are thought to play a more important role in regulating dopamine transmission
(Tzavara et al., 2004). M4 knockout mice showed elevated basal levels of both VTA
acetylcholine and nucleus accumbens dopamine. In the current experiment, VTA atropine should
have led to a transient loss of M4-mediated negative feedback control of acetylcholine. Increased
acetylcholine levels may then excite dopamine neurons via nicotinic receptors. M4 receptors are
also associated with medium spiny GABAergic terminals in VTA. Blockade of these receptors
would lead to an increase in GABA release from these neurons. Increased GABA could, on the
one hand, directly depress dopamine activity by acting on somatic GABAB receptors.
Alternatively, as suggested by Tzavara and colleagues (2004), increased release of GABA would
also depress the activity of GABA interneurons in the VTA and/or substantia nigra, which
express much higher levels of GABAA receptors, in turn disinhibiting dopamine neurons. This
mechanism of indirect excitation of dopamine neurons would not be affected by antagonism of
VTA nicotinic receptors, and thus could at least in part account for the locomotion observed in
M5 knockout mice following VTA atropine.
The action of atropine on M3 receptors may also contribute to the VTA atropine-induced
locomotion observed in M5 knockout mice. In the ventral midbrain, besides M5 mRNA, M3
mRNA is the only other type detected (Vilaro et al., 1990; Weiner et al., 1990; Zubieta & Frey,
1993). Furthermore, immunolabelling and binding studies, are consistent with the expression of
M3 muscarinic receptors in the ventral midbrain. Acetylcholine efferents to the midbrain target
both dopamine and non-dopamine, presumably GABAergic, neurons. Michel and colleagues
(2004; 2005) have shown that, at least in primary mesencephalic cell cultures, identified GABA
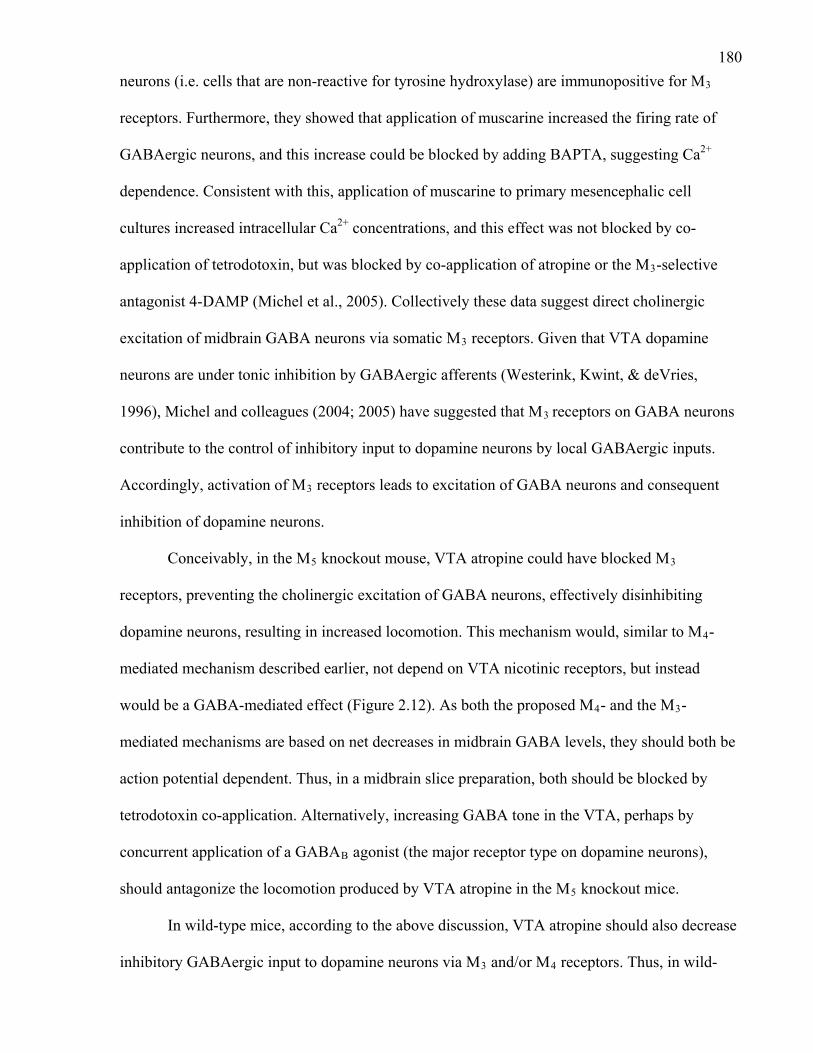
180neurons (i.e. cells that are non-reactive for tyrosine hydroxylase) are immunopositive for M3
receptors. Furthermore, they showed that application of muscarine increased the firing rate of
GABAergic neurons, and this increase could be blocked by adding BAPTA, suggesting Ca2+
dependence. Consistent with this, application of muscarine to primary mesencephalic cell
cultures increased intracellular Ca2+ concentrations, and this effect was not blocked by co-
application of tetrodotoxin, but was blocked by co-application of atropine or the M3-selective
antagonist 4-DAMP (Michel et al., 2005). Collectively these data suggest direct cholinergic
excitation of midbrain GABA neurons via somatic M3 receptors. Given that VTA dopamine
neurons are under tonic inhibition by GABAergic afferents (Westerink, Kwint, & deVries,
1996), Michel and colleagues (2004; 2005) have suggested that M3 receptors on GABA neurons
contribute to the control of inhibitory input to dopamine neurons by local GABAergic inputs.
Accordingly, activation of M3 receptors leads to excitation of GABA neurons and consequent
inhibition of dopamine neurons.
Conceivably, in the M5 knockout mouse, VTA atropine could have blocked M3
receptors, preventing the cholinergic excitation of GABA neurons, effectively disinhibiting
dopamine neurons, resulting in increased locomotion. This mechanism would, similar to M4-
mediated mechanism described earlier, not depend on VTA nicotinic receptors, but instead
would be a GABA-mediated effect (Figure 2.12). As both the proposed M4- and the M3-
mediated mechanisms are based on net decreases in midbrain GABA levels, they should both be
action potential dependent. Thus, in a midbrain slice preparation, both should be blocked by
tetrodotoxin co-application. Alternatively, increasing GABA tone in the VTA, perhaps by
concurrent application of a GABAB agonist (the major receptor type on dopamine neurons),
should antagonize the locomotion produced by VTA atropine in the M5 knockout mice.
In wild-type mice, according to the above discussion, VTA atropine should also decrease
inhibitory GABAergic input to dopamine neurons via M3 and/or M4 receptors. Thus, in wild-

181Figure 2.12. Stimulant effects of VTA atropine in B6 M5 knockout mice. VTA atropine may
decrease GABAergic inhibition of dopamine neurons via its action on M3 and or M4 muscarinic
receptors, inducing an increase in locomotion.
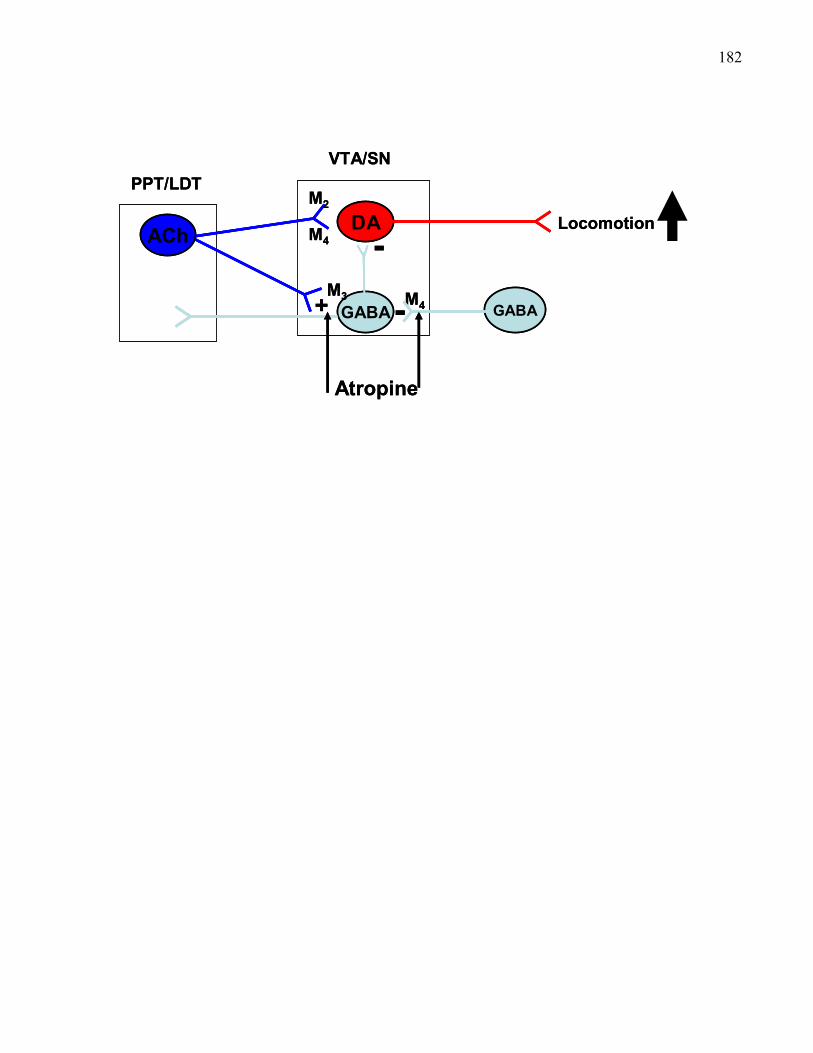
182
DA
GABA GABAM3 M4
PPT/LDTVTA/SN
LocomotionACh
Atropine
-+
M4
M2
-
DA
GABA GABAM3 M4
PPT/LDTVTA/SN
LocomotionACh
Atropine
-+
M4
M2
-
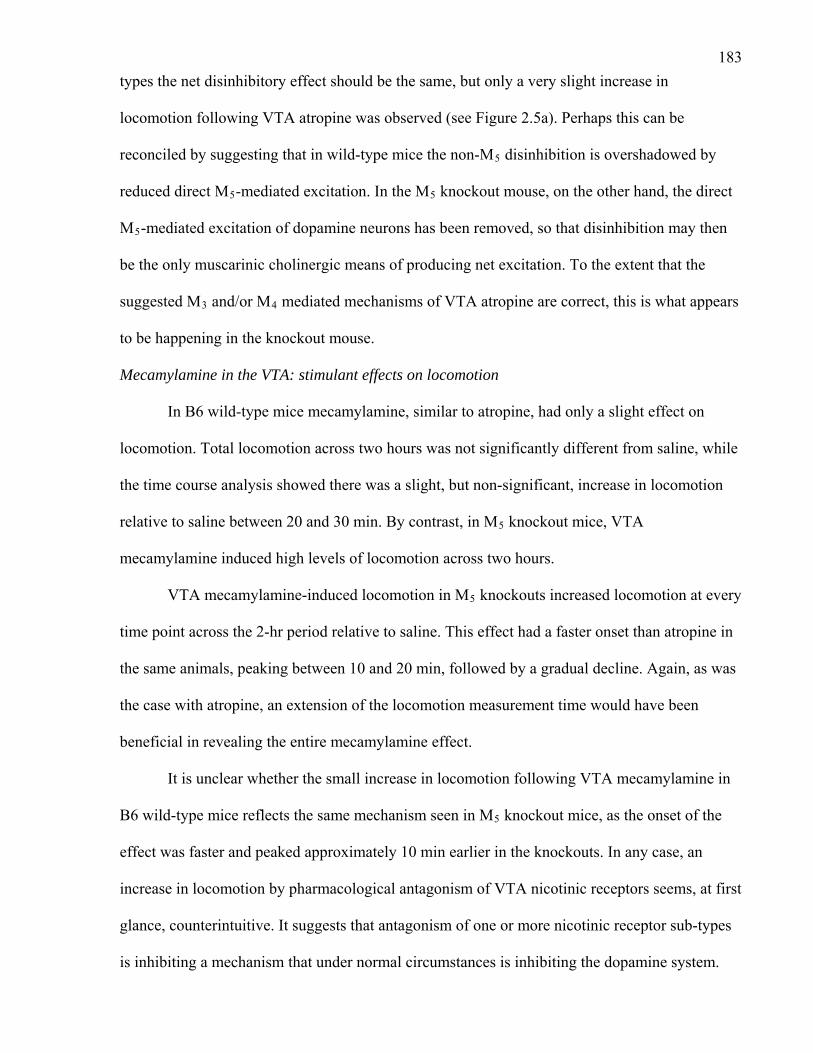
183types the net disinhibitory effect should be the same, but only a very slight increase in
locomotion following VTA atropine was observed (see Figure 2.5a). Perhaps this can be
reconciled by suggesting that in wild-type mice the non-M5 disinhibition is overshadowed by
reduced direct M5-mediated excitation. In the M5 knockout mouse, on the other hand, the direct
M5-mediated excitation of dopamine neurons has been removed, so that disinhibition may then
be the only muscarinic cholinergic means of producing net excitation. To the extent that the
suggested M3 and/or M4 mediated mechanisms of VTA atropine are correct, this is what appears
to be happening in the knockout mouse.
Mecamylamine in the VTA: stimulant effects on locomotion
In B6 wild-type mice mecamylamine, similar to atropine, had only a slight effect on
locomotion. Total locomotion across two hours was not significantly different from saline, while
the time course analysis showed there was a slight, but non-significant, increase in locomotion
relative to saline between 20 and 30 min. By contrast, in M5 knockout mice, VTA
mecamylamine induced high levels of locomotion across two hours.
VTA mecamylamine-induced locomotion in M5 knockouts increased locomotion at every
time point across the 2-hr period relative to saline. This effect had a faster onset than atropine in
the same animals, peaking between 10 and 20 min, followed by a gradual decline. Again, as was
the case with atropine, an extension of the locomotion measurement time would have been
beneficial in revealing the entire mecamylamine effect.
It is unclear whether the small increase in locomotion following VTA mecamylamine in
B6 wild-type mice reflects the same mechanism seen in M5 knockout mice, as the onset of the
effect was faster and peaked approximately 10 min earlier in the knockouts. In any case, an
increase in locomotion by pharmacological antagonism of VTA nicotinic receptors seems, at first
glance, counterintuitive. It suggests that antagonism of one or more nicotinic receptor sub-types
is inhibiting a mechanism that under normal circumstances is inhibiting the dopamine system.
184A direct effect on α4β2 or α7 receptors on dopamine cell bodies is unlikely. In the VTA
α7 receptors have been localized to both somatodendritic areas (dopaminergic and non-
dopaminergic) and efferent terminals (both glutamatergic and non-glutamatergic). Among the
terminal α7 receptors, approximately 75% are associated with glutamate terminals, as indicated
by double-labelling for either VGluT1 or VGluT2 (vesicular glutamate transporter 1 and 2,
respectively). The remaining 25% are not however associated with cholinergic terminals as
indicated by an absence of double-labelling with VachT (vesicular acetylcholine transporter)
(Jones & Wonnacott, 2004). The remaining terminal α7 receptors may be associated with
GABAergic terminals, as single-cell PCR shows that approximately 40% of GABA neurons
contain α7 mRNA. The most attention has been paid to α7 receptors on glutamatergic terminals
in the VTA as these are in a prime position to affect excitatory glutamate transmission in the
VTA. Accordingly, Schilstrom and colleagues (1997) have shown that VTA administration of
the α7 receptor antagonist methyllycaconitine (MLA) reduces accumbal dopamine release by
systemic nicotine, suggesting that antagonism of pre-synaptic glutamate release results in less
nicotine-induced excitation of the mesolimbic dopamine system. Similarly, antagonism of α7
receptors on dopamine neurons could also lead to reduced nicotine-induced dopamine release.
This evidence makes it unlikely that the effect of VTA mecamylamine seen here in M5 knockout
mice is due to effects on terminal α7 receptors, as this should lead to a reduction in accumbal
dopamine and no enhancement of locomotion.
α4 and β2 subunit mRNA are also found in VTA and substantia nigra GABA neurons, so
it is likely that these neurons also express functional α4β2 nicotinic receptors (Klink et al., 2001;
Charpantier et al., 1998). The VTA mecamylamine effect in M5 knockout mice, similar to the
atropine effect, could be explained by disinhibition of dopamine neurons through antagonist
blockade of tonic excitatory cholinergic input to GABA neurons (Figure 2.13). However, unlike
185Figure 2.13. Stimulant effects of VTA mecamylamine in B6 M5 knockout mice. VTA
mecamylamine may decrease GABAergic inhibition of dopamine neurons by blocking α4β2
receptors on GABA neurons.
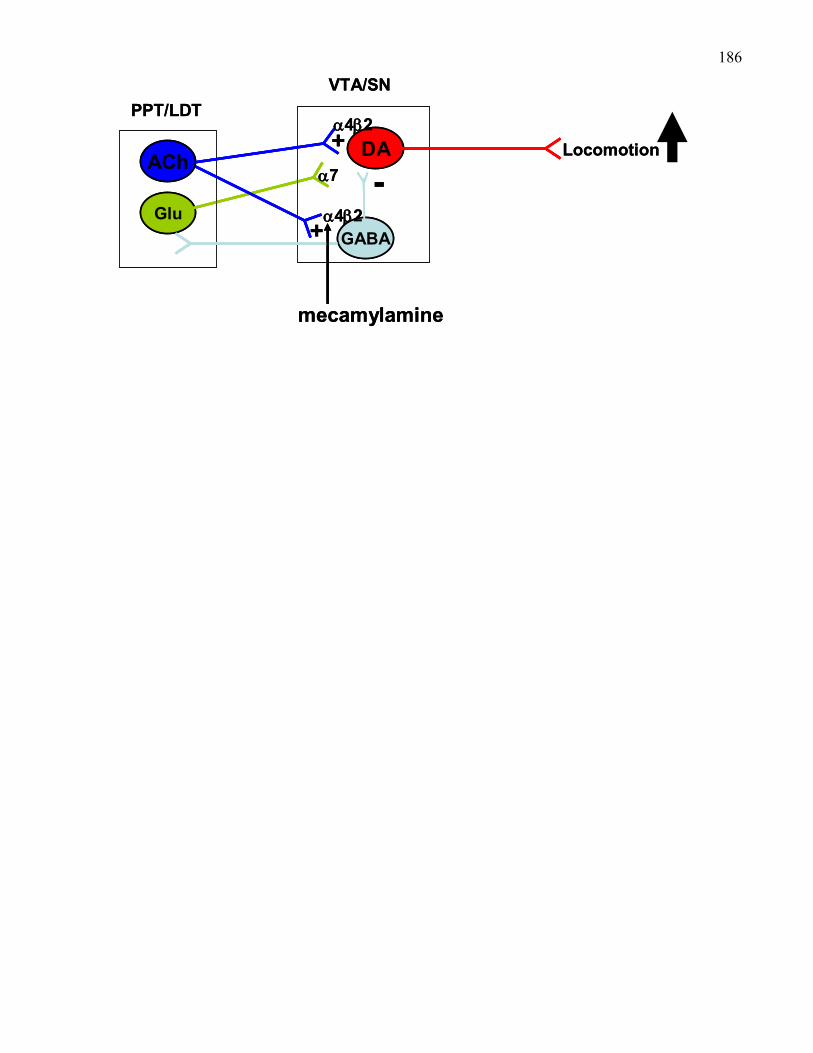
186
Glu
DA
GABA
PPT/LDTVTA/SN
LocomotionACh
mecamylamine
-
α4β2
α7
α4β2+
+
Glu
DA
GABA
PPT/LDTVTA/SN
LocomotionACh
mecamylamine
-
α4β2
α7
α4β2+
+
187the atropine effect, in this case there should still be a direct effect on α4β2 receptors on
dopamine cell bodies. Perhaps that direct effect is somehow overridden by GABAergic
disinhibition, or in other words the mecamylamine somehow preferentially affects α4β2
receptors on GABA neurons over dopamine neurons. If a preferential action on GABA neurons
leads to a reduction in GABA levels, then it should be action potential dependent (i.e.
tetrodotoxin should block it) and an increase in GABAergic tone should reduce the effect. It is
interesting to note that nicotine, when given acutely, is thought to act on VTA GABA neurons,
but the receptors on these neurons rapidly desensitize. What follows is a long lasting
disinhibition of VTA dopamine neurons, as desensitized nicotinic receptors on GABA neurons
are now no longer sensitive to tonic excitatory cholinergic input (Mansvelder, Keath, &
McGehee, 2002). Microdialysis data in mice showed that acute injection of nicotine (0.8 mg/kg,
s.c.) in mice increased nucleus accumbens dopamine levels for 2 and 3 hours (Zocchi et al.,
2003). In some sense the desensitization of α4β2 receptors on GABA neurons by nicotine and
their direct blockade by mecamylamine both result in an inability to respond to endogenous
cholinergic input, and in the current experiment the presumed disinhibition of dopamine neurons
elevated locomotion for at least two hours.
The stimulant effects of VTA atropine and mecamylamine are not additive in M5 knockout mice
As both the VTA atropine and mecamylamine effects are ascribed to disinhibition of
VTA dopamine neurons via two separate cholinergic receptor sub-types, it was of interest to test
whether the two effects were additive. In other words would simultaneous antagonism produce
twice as much disinhibition, resulting in even greater locomotion? The data did not really
support this. While total locomotion following a combination of atropine and mecamylamine
induced slightly greater locomotion than either antagonist alone, the difference was far from
statistically significant, and inspection of the timecourse also argues against a straight-forward
additive effect. While there were a few time points were the combination of VTA atropine and
188mecamylamine produced statistically greater locomotion than either treatment alone, no
systematic pattern was found in the data. Instead, the combination of antagonists induced a
pattern of locomotion which reflected aspects of the time course of each on its own. For
example, between 0-20 min the combination of antagonists resulted in a faster onset of
locomotion relative to atropine, virtually identical to mecamylamine. Second, over the course of
the second hour the combination was sustaining a higher level of locomotion relative to
mecamylamine (with three statistically significant time points) that was more similar to atropine.
Interstingly, the peak effect was more like that of atropine than mecamylamine in terms of when
it occurred, but greater in magnitude than either on its own.
As both mechanisms of disinhibition are thought to converge on the same target (i.e.
GABA neurons), it is unclear to what extent they should be additive. There may be a ceiling on
how much GABA neurons can be inhibited by simultaneous muscarinic and nicotinic cholinergic
antagonism, and dopamine neurons consequently disinhibted. Low doses of both atropine and
mecamylamine were chosen for these experiments. The 3 μg dose of atropine was clearly very
effective in completely blocking the onset of morphine-induced locomotion in B6 wild-type
mice, and the 5 μg mecamylamine dose in potentiating morphine-induced locomotion in M5
knockout mice. In this regard more work testing the dose-dependency of both effects would be
useful. It would also provide a means of assessing threshold doses which when used in
combination may better reveal any additive effect.
The presumed disinhibition of dopamine neurons via nicotinic, and to a lesser extent
muscarinic, receptor antagonism on GABA neurons potentiated morphine-induced locomotion in
M5 knockout mice. The two effects are in some ways similar. Systemic morphine acts on μ
opioid receptors located on GABA neurons, disinhibiting dopamine neurons. Perhaps the
combination of the two in M5 knockouts, disinhibits dopamine neurons to a greater extent,
189inducing more locomotion. This argument falters, however, when considering the lack of such an
effect in wild-type mice.
Cautionary Notes
First, this entire discussion section assumes that the locomotion observed following VTA
atropine and/or mecamylamine in M5 knockout mice is dopamine-mediated locomotion, which
was not explicitly tested, for example, by assessing whether systemic or accumbens pre-
treatment with dopamine receptor antagonists attenuates or blocks the locomotion. Importantly
this must be addressed in future experiments. However, previous evidence (e.g., Tzavara et al.,
2004) suggests that the pharmacological manipulation of cholinergic receptors in Experiment 3
works via dopamine neurons in one way or another.
Second, the pharmacology experiments, particularly those involving the muscarinic
antagonist atropine and nicotinic antagonist mecamylamine, only involved VTA manipulations.
Experiment 3 tested whether VTA M5 receptors contributed to the overall reduction in
morphine-induced locomotion observed in M5 knockout mice. While, the similarity between the
effects of VTA atropine and systemic M5 knockout on morphine-induced locomotion indicate
that the M5 receptors on dopamine cell bodies are critical, it does not rule out a role for terminal
M5 receptors. Furthermore, the presence of other muscarinic receptors sub-types produces many
complex interactions (Yamada et al., 2001; Zhang et al., 2002). A parallel experiment involving
atropine administration in the accumbens was not conducted. By contrast, in the VTA the effects
are easier to interpret. Here, a role for M1 and M2 can be ruled out (Tzavara et al., 2004), leaving
M3, M4, and M5 as potential mediators. The anatomical separation of these remaining subtypes
in the VTA (e.g. M3 on GABA neurons, M4 on terminals, and M5 on dopamine cellbodies)
makes interpretation a little easier.
Third, the design of Experiment 3 was not counterbalanced with respect to the order of
antagonist administration. The primary purpose of Experiment 3 was to test the effects of the
190muscarinic receptor antagonist atropine in the VTA on systemic morphine-induced locomotion
to provide a comparison for data obtained in M5 knockout mice. In order to minimize order
effects, the order of intracranial and systemic drug combinations was given according to a Latin
Square design for the atropine experiment. Ideally, the order of atropine and mecamylamine
infusions should have been counterbalanced across mice. Instead, a 2-day wash-out period was
given between atropine and mecamylamine experiments. Thus, it is possible that repeated VTA
injections (e.g., atropine and saline) prior to the mecamylamine experiment affected how mice
responded to intra-VTA mecamylamine and the combination of intra-VTA atropine and
mecamylamine.
Conclusions
The results from Experiments 1-3 show that excitatory muscarinic input to the VTA is
important in mediating the acute stimulant effects of morphine. In wild-type mice, the onset of
morphine-induced locomotion can be blocked and the overall extent attenuated by
pharmacological antagonism of VTA muscarinic receptors. VTA nicotinic receptors do not
appear to play a significant role in mediating cholinergic input, as pharmacological antagonism
by mecamylamine was largely ineffective in affecting morphine-induced locomotion. The strong
similarity between morphine-induced locomotion in M5 knockout and wild-type mice pre-treated
with VTA atropine, suggests that M5 receptors on VTA dopamine neurons are critical for
mediating excitatory and disinhibitory cholinergic input, important for the acute stimulant effects
of morphine. In support of this, atropine pre-treatment did not attenuate already reduced
morphine-induced locomotion in M5 knockout mice.
The absence of VTA M5 receptors in knockout mice revealed the role of other VTA
acetylcholine receptors on locomotion, showing that both non-M5 muscarinic and nicotinic
antagonists have a net excitatory effect on locomotion. In wild-type mice the effects of these

191other receptors appear to be overshadowed by direct excitation of dopamine neurons via M5
receptors, and consequently atropine and mecamylamine have only slight effects on locomotion.
192Chapter 2 References
Bechara, A., Harrington, F., Nader, K., & van der Kooy, D. (1992). Neurobiology of motivation:
Double dissociation of two motivational mechanisms mediating opiate reward in drug-
naïve versus drug-dependent animals. Behavioural Neuroscience, 106, 798-807.
Bernard, V., Normand, E., & Bloch, B. (1992). Phenotypical characterization of the rat striatal
neurons expressing muscarinic receptor genes. Journal of Neuroscience, 12, 3591-3600.
Buckley, N. J., Bonner, T. I., & Brann, M. R. (1988). Localization of a family of muscarinic
receptor mRNAs in rat brain. Journal of Neuroscience, 8, 4646-4652.
Charpantier, E., Barneoud, P., Moser, P., Besnard, F., & Sgard, F. (1998). Nicotinic
acetylcholine subunit mRNA expression in dopaminergic neurons of the rat substantia
nigra and ventral tegmental area. Neuroreport, 9, 3097-3101.
Forster, G. L., & Blaha, C. D. (2000). Laterodorsal tegmental stimulation elicits dopamine efflux
in the rat nucleus accumbens by activation of acetylcholine and glutamate receptors in the
ventral tegmental area. European Journal of Neuroscience, 12, 3596-3604.
Forster, G. L., & Blaha, C. D. (2003). Pedunculopontine tegmental stimulation evokes striatal
dopamine efflux by activation of acetylcholine and glutamate receptors in the midbrain
and pons of the rat. European Journal of Neuroscience, 17, 751-762.
Forster, G. L., Falcon, A. J., Miller, A. D., Heruc, G. A., & Blaha, C. D. (2002). Effects of
laterodorsal tegmentum excitotoxic lesions on behavioral and dopamine responses
evoked by morphine and d-amphetamine. Neuroscience, 114, 817-823.
Forster, G.L. Yeomans, J.S., Takeuchi, J., & Blaha, C.D. (2001). M5 muscarinic receptors are
required for prolonged accumbal dopamine release after electrical stimulation of the pons
in mice. Journal of Neuroscience, 22, RC190.
Gerber, D. J., Sotnikova, T. D., Gainetdinov, R. R., Huang, S. Y., Caron, M. G., & Tonegawa, S.
(2001). Hyperactivity, elevated dopaminergic transmission, and response to amphetamine
193in m1 muscarinic acetylcholine receptor-deficient mice. Proceedings of the National
Academy of Sciences U S A, 98, 15312-15317.
Goshima, Y., Miyamae, T., Nakamura, S., Miki, K., Kosaka, K., & Misu, Y. (1996). Ventral
tegmental injection of nicotine induces locomotor activity and L-dopa release from
nucleus accumbens. European Journal of Pharmacology, 309, 229-233.
Klink, R., de Kerchove d'Exaerde, A., Zoli, M., & Changeux, J. P. (2001). Molecular and
physiological diversity of nicotinic acetylcholine receptors in the midbrain dopaminergic
nuclei. Journal of Neuroscience, 21, 1452-1463.
Kofman, O., & Yeomans, J.S. (1989). Cholinergic antagonists in the ventral tegmentum elevate
thresholds for lateral hypothalamic and brainstem self-stimulation. Pharmacology
Biochemistry and Behavior, 31, 547-559.
Kofman, O., McGlynn, S. M., Olmstead, M. C., & Yeomans, J. S. (1990). Differential effects of
atropine, procaine and dopamine in the rat ventral tegmentum on lateral hypothalamic
rewarding brain stimulation. Behavioral Brain Research, 38, 55-68.
Laviolette, S. R., & van der Kooy, D. (2004). The neurobiology of nicotine addiction: Bridging
the gap from molecules to behaviour. Nature Reviews Neuroscience, 5, 55-65.
Levey, A. I., Kitt, C. A., Simonds, W. F., Price, D. L., & Brann, M. R. (1991). Identification and
localization of muscarinic acetylcholine receptor proteins in brain with subtype-specific
antibodies. Journal of Neuroscience, 11, 3218-3226.
Mansvelder, H. D., Keath, J. R., & McGehee, D. S. (2002). Synaptic mechanisms underlie
nicotine-induced excitability of brain reward areas. Neuron, 33, 905-919.
Michel, F. J., Fortin, G. D., Martel, P., Yeomans, J., & Trudeau, L. E. (2005). M3-like
muscarinic receptors mediate Ca2+ influx in rat mesencephalic gabaergic neurones
through a protein kinase c-dependent mechanism. Neuropharmacology, 48, 796-809.
Michel, F. J., Robillard, J. M., & Trudeau, L. E. (2004). Regulation of rat mesencephalic
194GABAergic neurones through muscarinic receptors. Journal of Physiology, 556, 429-
445.
Miller, A. D., Forster, G. L., Metcalf, K. M., & Blaha, C. D. (2002). Excitotoxic lesions of the
pedunculopontine nucleus differentially mediate morphine- and d-amphetamine-evoked
striatal dopamine efflux and behaviors. Neuroscience, 111, 351-362.
Miller, A. D., Forster, G. L., Yeomans, J. S., & Blaha, C. D. (2005). Midbrain muscarinic
receptors modulate morphine-induced accumbal and striatal dopamine efflux in the rat.
Neuroscience, 136, 531-538.
Nader, K., & van der Kooy, D. (1997). Deprivation state switches the neurobiological substrates
mediating opiate reward in the ventral tegmental area. Journal of Neuroscience, 17, 383-
390.
Nisell, M., Nomikos, G. G., & Svensson, T. H. (1994). Systemic nicotine-induced dopamine
release in the rat nucleus accumbens is regulated by nicotinic receptors in the ventral
tegmental area. Synapse, 16, 36-44.
Panagis, G., Nisell, M., Nomikos, G. G., Chergui, K., & Svensson, T. H. (1996). Nicotine
injections into the ventral tegmental area increase locomotion and fos-like
immunoreactivity in the nucleus accumbens of the rat. Brain Research, 730, 133-142.
Paxinos, G., & Franklin, K.B.J. (2004). The mouse brain in stereotaxic coordinates. San Diego:
Academic Press.
Rezayof, A., Nazari-Serenjeh, F., Zarrindast, M. R., Sepehri, H., & Delphi, L. (2007). Morphine-
induced place preference: Involvement of cholinergic receptors of the ventral tegmental
area. European Journal of Pharmacology, 562, 92-102.
Schilstrom, B., Svensson, H.M., Svensson, T.H., & Nomikos, G.G. (1997). Nicotine and food-
induced dopamine release in the nucleus accumbens of the rat: putative role of α7
nicotinic receptors in the ventral tegmental area. Neuroscience, 85, 1005-1009.
195Singh, J., Desiraju, T., & Raju, T.R. (1997). Cholinergic and GABAergic modulation of self-
stimulation of lateral hypothalamus and ventral tegmentum: effects of carbachol,
atropine, bicuculline, and picrotoxin. Physiology and Behavior, 61, 411-418.
Sugaya, K., Clamp, C., Bryan, D., & McKinney, M. (1997). mRNA for the m4 muscarinic
receptor subtype is expressed in adult rat brain cholinergic neurons. Molecular Brain
Research, 50, 305-313.
Sziraki, I., Sershen, H., Hashim, A., & Lajtha, A. (2002). Receptors in the ventral tegmental area
mediating nicotine-induced dopamine release in the nucleus accumbens. Neurochemical
Research, 27, 253-261.
Tzavara, E. T., Bymaster, F. P., Davis, R. J., Wade, M. R., Perry, K. W., Wess, J., McKinzie,
D.L., Felder, C., & Nomikos, G.G. (2004). M4 muscarinic receptors regulate the
dynamics of cholinergic and dopaminergic neurotransmission: Relevance to the
pathophysiology and treatment of related CNS pathologies. Faseb Journal, 18, 1410-
1412.
Vilaro, M. T., Palacios, J. M., & Mengod, G. (1990). Localization of m5 muscarinic receptor
mRNA in rat brain examined by in situ hybridization histochemistry. Neuroscience
Letters, 114, 154-159.
Wang, H., Ng, K., Hayes, D., Gao, X., Forster, G., Blaha, C., & Yeomans, J.S. (2004).
Decreased amphetamine-induced locomotion and improved latent inhibition in mice
mutant for the M5 muscarinic receptor gene found in the human 15q schizophrenia
region. Neuropsychopharmacology, 29, 2126-2139.
Wei, J., Walton, E. A., Milici, A., & Buccafusco, J. J. (1994). M1-m5 muscarinic receptor
distribution in rat CNS by RT-PCR and HPLC. Journal of Neurochemistry, 63, 815-821.
196Weiner, D. M., Levey, A. I., & Brann, M. R. (1990). Expression of muscarinic acetylcholine and
dopamine receptor mRNAs in rat basal ganglia. Proceedings of the National Academy of
Sciences U S A, 87, 7050-7054.
Westerink, B. H., Kwint, H. F., & deVries, J. B. (1996). The pharmacology of mesolimbic
dopamine neurons: A dual-probe microdialysis study in the ventral tegmental area and
nucleus accumbens of the rat brain. Journal of Neuroscience, 16, 2605-2611.
Yamada, M., Lamping, K. G., Duttaroy, A., Zhang, W., Cui, Y., Bymaster, F. P., McKinzie,
D.L., Felder, C.C., Deng, C.X., Faraci, F.M., & Wess, J. (2001). Cholinergic dilation of
cerebral blood vessels is abolished in m(5) muscarinic acetylcholine receptor knockout
mice. Proceedings of the National Academy of Sciences U S A, 98, 14096-14101.
Yasuda, R.P. Ciesla, W., Flores, L.R., Wall, S.J., Li, M., Satkus, S.A., Weisstein, J.S., Spagnola,
B.V., Wolfe, B.B. (1992). Development of antisera selective for m4 and m5 musacrinic
cholinergic receptors: Distribution of m4 and m5 receptors in rat brain. Journal of
Pharmacology and Experimental Therapeutics, 43, 149-157.
Yeomans, J., & Baptista, M. (1997). Both nicotinic and muscarinic receptors in ventral tegmental
area contribute to brain-stimulation reward. Pharmacology Biochemistry and Behavior,
57, 915-921.
Zhang, W., Yamada, M., Gomeza, J., Basile, A. S., & Wess, J. (2002). Multiple muscarinic
acetylcholine receptor subtypes modulate striatal dopamine release, as studied with m1-
m5 muscarinic receptor knock-out mice. Journal of Neuroscience, 22, 6347-6352.
Zocchi, A., Girlanda, E., Varnier, G., Sartori, I., Zanetti, L., Wildish, G.A., Lennon, M.,
Mugnaini, M., & Heidbreder, C.A. (2005). Dopamine responsiveness to drugs of abuse: a
shell-core investigation in the nucleus accumbens of the mouse. Synapse, 50, 293-302.
Zubieta, J.K., & Frey, K.A. (1993). Autoradiographic mapping of M3 muscarinic receptors in the
rat brain. Journal of Pharmacology and Experimental Therapeutics, 264, 415-422.
197
Chapter 3: Electrochemical measurement of dopamine in M5 knockout mice
198Introduction
PPT-evoked striatal dopamine efflux has not been studied in mice. LDT-evoked
accumbal dopamine efflux in mice shows 3 phases, with the largest 3rd phase blocked in M5
knockout mice (Forster et al., 2001). Because both VTA and SN dopamine neurons express M5
mRNA (Vilaro et al., 1990; Weiner et al., 1990), I hypothesized that the third phase of PPT-
evoked striatal dopamine efflux would similarly depend on substantia nigra M5 receptors. Thus,
the first goal of the present work was to characterize PPT-evoked striatal dopamine efflux in
wild-type mice and second to characterize the effects of M5 deletion. These questions were
investigated in 129 wild-type and M5 knockout mice, as this was the strain chosen by Forster et
al. (2001) in their investigation of LDT-evoked accumbal dopamine efflux.
In rats, systemic morphine strongly increases both accumbal and striatal dopamine
(Forster et al., 2002; Miller et al., 2002; Pontieri, Tanda, & Di Chiara, 1995; Zocchi et al., 2005).
Excitotoxic lesions of the PPT (Miller et al., 2002) or the LDT (Forster et al., 2002) reduced
striatal or accumbal dopamine increases, respectively, by approximately 80%. These data show
that PPT and LDT neurons are critically involved in mediating the effects of systemic morphine
on forebrain dopamine levels. A role for cholinergic inputs to midbrain dopamine neurons,
mediated through muscarinic receptors, is suggested by the fact that prior infusion of
scopolamine into the VTA reduced accumbal dopamine efflux produced by systemic morphine
(1.5 mg/kg, i.v.) by approximately 60 %, and that prior infusion of the non-selective muscarinic
receptor antagonist scopolamine into the SN completely blocked striatal dopamine efflux
produced by morphine (Miller et al., 2005). A role for M5 receptors is suggested by the fact that
systemic morphine (25 mg/kg, i.p.) increased accumbens dopamine release fact in 129SvEv x
CF1 M5 knockout mice less than in wild-type mice (Basile et al., 2002).
The VTA is most strongly implicated in the rewarding effects of opiates where they can
affect dopamine neurons via the disinhibition of local GABA neurons (Johnson & North, 1992)
199to increase the firing rate of dopamine neurons (Gysling & Wang, 1983; Matthews & German,
1984), and induce increases in nucleus accumbens dopamine (Spanagel et al., 1992). Opiates are
self-administered into the VTA (Bozarth & Wise, 1981; David & Cazala, 1994; Devine & Wise,
1994; Zangen et al., 2002) and produce place preference (Bals-Kubik et al., 1993; Nader & van
der Kooy, 1997; Olmstead & Franklin, 1997; Phillips & LePiane, 1980). Thus, to understand the
role of M5 receptors in opiate-induced dopamine activation, the effects of VTA morphine
infusion on accumbal dopamine efflux were studied in wild-type and M5 knockout mice.
In vivo Electrochemistry
Electrochemical techniques have been successfully used to measure dopamine in both
anesthetized (e.g., Forster & Blaha, 2000; 2003) and freely-moving (Di Ciano et al., 1995;
Kiyatkin et al., 1993) animals. The main advantage of in vivo electrochemistry over
microdialysis is improved temporal resolution. For example, in a rat that is bar-pressing for
intravenous heroin, electrochemical detection showed that on all but the first injection, there was
an initial decrease in dopamine that was followed by a subsequent increase. As the initial
decrease only lasted a few minutes, it would likely go undetected if measured by a microdialysis
sample collected over 20 min (Kiyatkin et al., 1993). Similarly, in the case of food reward,
electrochemical detection has revealed a more complex pattern of changes in dopamine
surrounding the act of lever pressing for food. Specifically, dopamine levels increased just before
execution of the lever press and then decreased during consumption of the food reward (Kiyatkin
& Gratton, 1994). When electrically stimulating the PPT or LDT (see General Introduction,
Figure 3, pg. 25), the first excitatory phase lasts 2-3 min and the second inhibitory phase another
3-8 minutes. The third excitatory phase has a slow onset at approximately 7-10 min (Forster &
Blaha, 2000; 2003). In a microdialysis experiment which samples every 15-20 min, the first,
second, and the onset of the third phase would all be included in a single sample.
200I used stearate-modified carbon paste electrodes in combination with two electrochemical
techniques in my experiments: voltammetry for validation of recording electrodes, and
chronoamperometry for in-vivo measurement of dopamine. Stearate-modified carbon paste
electrodes have been previously validated for their dopamine selectivity. Using side-by-side
dialysis and stearate-modified carbon-paste electrodes implanted in the striatum of awake rats,
Blaha (1996) has shown selectivity for dopamine over ascorbic acid and DOPAC. In these
experiments reverse dialysis of either ascorbic acid or DOPAC adjacent to the stearate-modified
carbon paste electrode failed to alter oxidation current while reverse dialysis of dopamine
increased the oxidation current. Furthermore, chronoamperometry has proven successful when
monitoring rapid changes in dopamine efflux over prolonged periods of time in both awake and
anesthetized animals (Blaha & Phillips, 1996; Blaha, Yang, Floresco, Barr, & Phillips, 1997;
Chapman, Yeomans, Blaha, & Blackburn, 1997; Di Ciano et al., 1995). Appendix A provides a
detailed discussion of electrochemical principles and techniques as well as microdialysis.
Experiment 4: Striatal dopamine efflux in response to electrical stimulation of the
pedunculopontine tegmental nucleus is M5 knockout mice
Materials and Methods
Mice
Eight male 129 wild-type and 8 male 129 M5 knockout mice were used in this
experiment. Mice were between 4 and 8 months of age at the time of testing.
Carbon paste electrodes
Stearate-modified carbon paste electrodes were constructed according to the methods of
Blaha and Jung (1991). Briefly, 75 mg of stearate (99.9 % purity, Sigma-Aldrich, St. Louis, MO)
was dissolved in 1 ml silicone oil (Sigma-Aldrich, St. Louis, MO) heated to 40 °C. To this
solution 1g of graphite powder (particle size < 20 μm, Sigma, St. Louis, MO) was added and
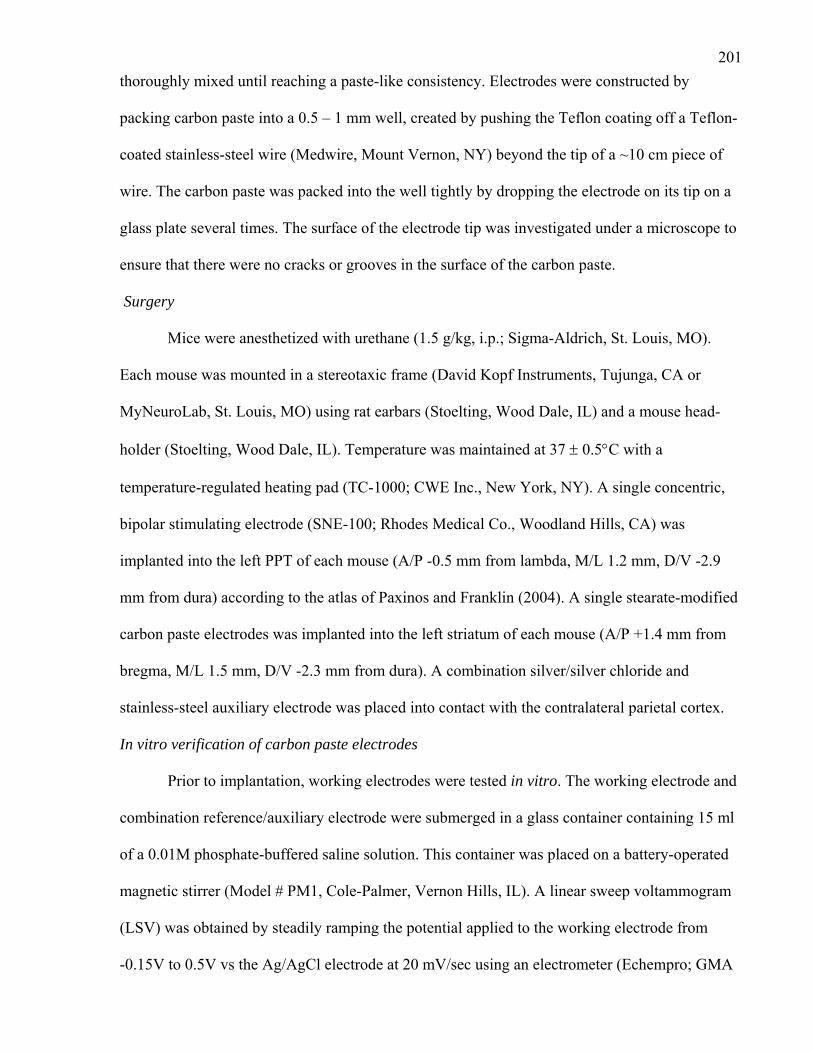
201thoroughly mixed until reaching a paste-like consistency. Electrodes were constructed by
packing carbon paste into a 0.5 – 1 mm well, created by pushing the Teflon coating off a Teflon-
coated stainless-steel wire (Medwire, Mount Vernon, NY) beyond the tip of a ~10 cm piece of
wire. The carbon paste was packed into the well tightly by dropping the electrode on its tip on a
glass plate several times. The surface of the electrode tip was investigated under a microscope to
ensure that there were no cracks or grooves in the surface of the carbon paste.
Surgery
Mice were anesthetized with urethane (1.5 g/kg, i.p.; Sigma-Aldrich, St. Louis, MO).
Each mouse was mounted in a stereotaxic frame (David Kopf Instruments, Tujunga, CA or
MyNeuroLab, St. Louis, MO) using rat earbars (Stoelting, Wood Dale, IL) and a mouse head-
holder (Stoelting, Wood Dale, IL). Temperature was maintained at 37 ± 0.5°C with a
temperature-regulated heating pad (TC-1000; CWE Inc., New York, NY). A single concentric,
bipolar stimulating electrode (SNE-100; Rhodes Medical Co., Woodland Hills, CA) was
implanted into the left PPT of each mouse (A/P -0.5 mm from lambda, M/L 1.2 mm, D/V -2.9
mm from dura) according to the atlas of Paxinos and Franklin (2004). A single stearate-modified
carbon paste electrodes was implanted into the left striatum of each mouse (A/P +1.4 mm from
bregma, M/L 1.5 mm, D/V -2.3 mm from dura). A combination silver/silver chloride and
stainless-steel auxiliary electrode was placed into contact with the contralateral parietal cortex.
In vitro verification of carbon paste electrodes
Prior to implantation, working electrodes were tested in vitro. The working electrode and
combination reference/auxiliary electrode were submerged in a glass container containing 15 ml
of a 0.01M phosphate-buffered saline solution. This container was placed on a battery-operated
magnetic stirrer (Model # PM1, Cole-Palmer, Vernon Hills, IL). A linear sweep voltammogram
(LSV) was obtained by steadily ramping the potential applied to the working electrode from
-0.15V to 0.5V vs the Ag/AgCl electrode at 20 mV/sec using an electrometer (Echempro; GMA
202Technologies, Inc., Vancouver, Canada). Subsequently, discrete quantities of a freshly-prepared
2mM solution of dopamine (Sigma-Aldrich, St. Louis, MO; 37.9 g dopamine hydrochloride
dissolved in 90 ml double distilled water and 10 ml 0.1M perchloric acid) were added to achieve
a 1 μM concentration of dopamine in the phosphate-buffered saline solution. The solution was
gently stirred and after a period of 5 sec, another LSV was obtained. This process was repeated
for between 3 to 5 additions of 1 μM dopamine to confirm, first, that peak current was always
obtained at the same potential and, second, that the relative increases in peak current were
consistent across consecutive 1 μM additions of dopamine.
Electrochemical recordings
After in vivo implantation of working and reference electrodes, the working
characteristics of the recording electrode were evaluated by applying 2-3 linear sweep
voltammetry sweeps with semidifferentiation (LSV-SD) (saw-tooth wave potential -0.15 to 0.45
V vs Ag-AgCl; ramp rate 10-20 mV/sec) to the recording electrode. After confirming the
presence of a dopamine peak in the voltammogram, repetitive chronoamperometric
measurements of oxidation current were made by applying a potential pulse from -0.15 V to
+0.25 V to the recording electrode for 1 sec at 30 sec intervals and monitoring the current for the
final 50 ms of each 1-sec pulse (Blaha & Philips, 1996). After at least 30 minutes of baseline
recordings, PPT stimulation was applied and changes in dopamine oxidation current were
monitored up to 80 minutes.
Electrical stimulation
A series of cathodal monophasic current (400 μA) pulses (0.5 ms duration) were
delivered to the concentric, bipolar stimulating electrode implanted in the PPT via a
programmable pulse generator (Master-8; A.M.P.I., Jerusalem, Israel) in combination with a
constant-current stimulus isolation unit (Iso-Flex; A.M.P.I., Jerusalem, Israel). Each stimulation
of the PPT consisted of a 1 sec, 35 Hz train of pulses (1 sec inter-train interval) applied over a 60
203sec period (1050 pulses in total). These parameters were designed to mimic spontaneous firing
patterns of LDT neurons in awake, naturally aroused animals (Steriade et al., 1990).
Furthermore, in urethane-anesthetized rats these parameters (at 800 μA) have been shown to
evoke a tri-phasic pattern of striatal dopamine efflux (Forster & Blaha, 2003).
Systemic scopolamine injections
Subsequent to monitoring the effect of PPT stimulation on striatal dopamine release, a
sub-set of mice (4 wild-type and 4 M5 knockout) was injected with the non-selective muscarinic
receptor antagonist scopolamine hydrobromide (5 mg/kg, i.p.; Sigma-Aldrich, St. Louis, MO).
Thirty minutes later, the PPT was again stimulated and changes in striatal dopamine oxidation
current were monitored for 80 minutes.
Data Analysis
Pre-stimulation baseline chronoamperometric currents were normalized to zero current
values, with stimulated change in oxidation current presented as absolute changes (increases as
positive and decreases as negative). The maximal PPT-evoked dopamine current for each of the
3 phases was obtained for individual wild-type and M5 knockout mice. In the case of the 8 mice
that were pre-treated with scopolamine, maximal PPT-evoked dopamine currents for each of the
3 phases after scopolamine were also obtained and compared to pre-stimulation values. Mean
peak current (in nanoamperes) and peak times (in minutes) for each phase were compared
between wild-type and M5 knockout mice (two-tailed unpaired t-test) and before and after
scopolamine in wild-type and knockout mice (two-tailed paired t-test). The peak time of the third
component, which was strongly reduced in M5 knockout mice, was not statistically analyzed.
Histology
On completion of the experiment, a PPT lesion was made by passing direct current (100
μA for 5 sec) through the concentric bipolar stimulating electrode. Mice were killed with a 0.25
ml intracardial injection of urethane. Brains were removed and put into a 10% formalin solution
204containing 0.1% potassium ferricyanide. Brains were then sectioned on a Vibratome, examined
under a light microscope, and compared to atlas sections (Paxinos & Franklin, 2004). The iron
deposit created by the DC lesion reacted with the potassium ferricyanide to form a Prussian blue
spot, clearly marking the PPT stimulation site.
Results
In-vitro verification of carbon paste electrodes
Figure 3.1 shows representative examples of a stearate-modified carbon paste electrode
used for all chronoamperomtery experiments (i.e., Experiments 4 and 5). Each successive 1 μM
addition of dopamine to the phosphate-buffered saline solution consistently produced a current
peak at approximately 150 mV. Furthermore, the relative increase in peak current for each
additional 1 μM addition of dopamine was consistent, with each addition producing a current
increase between 0.2 and 0.3 nA (Figure 3.1a).
For comparison, the responsiveness of a stearate-modified carbon paste electrode to 250
μM ascorbic acid is shown in Figure 3.1b. While dopamine and ascorbic acid share the same
oxidation potential (see Appendix A, Figure A1), the addition of stearate to the carbon paste
shifted the peak oxidation potential of ascorbic acid to a more positive value (Blaha, 1996). In
this example, the peak was not fully evident as the voltage sweep was run up to a value of 500
mV. This indicates that the peak oxidation potential for ascorbic acid with the stereate-modified
carbon paste electrodes used in the present experiments is ≥ 500 mV. In subsequent
chronoamperometry studies potential pulses were always stepped from -150 to 250 mV. Thus the
contribution of ascorbic acid to the recorded oxidation potential should be minimal.
In vivo verification of carbon paste electrodes
Figure 3.1c shows a representative example of two consecutive voltammograms obtained
in vivo in the dorsolateral striatum of a 129 wild-type mouse. The voltammogram shows a
current peak at around 150 mV, the same voltage potential at which peaks were obtained in vitro
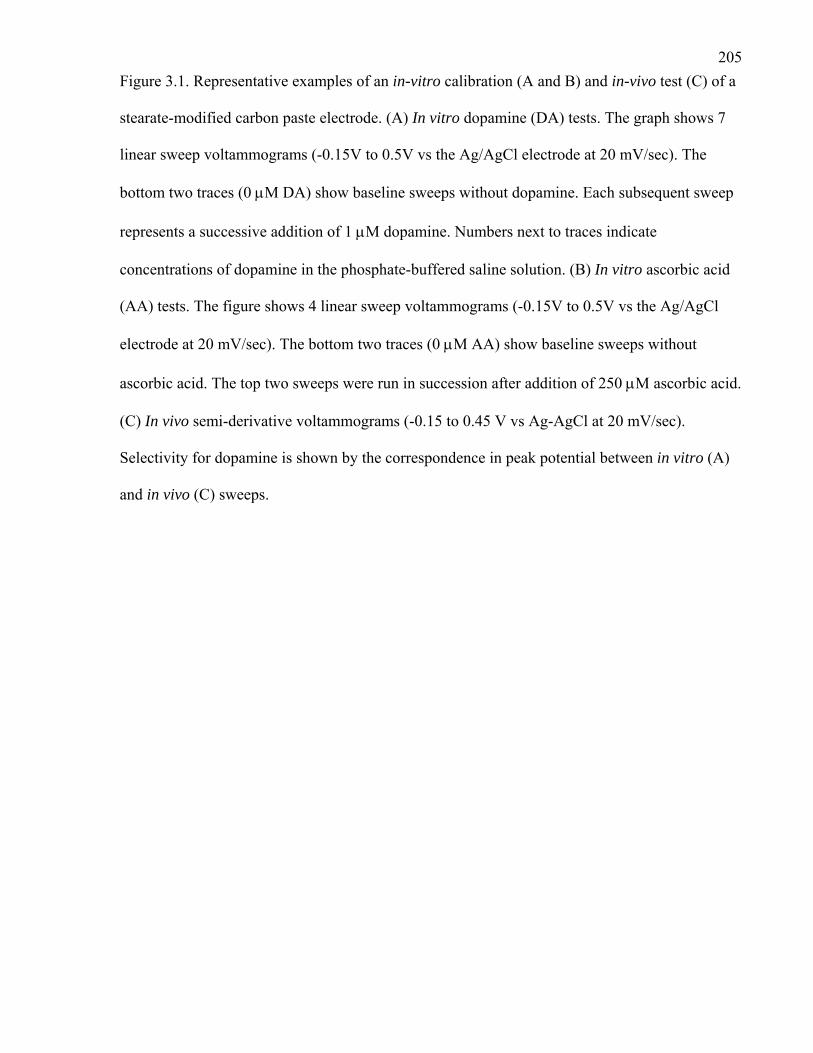
205Figure 3.1. Representative examples of an in-vitro calibration (A and B) and in-vivo test (C) of a
stearate-modified carbon paste electrode. (A) In vitro dopamine (DA) tests. The graph shows 7
linear sweep voltammograms (-0.15V to 0.5V vs the Ag/AgCl electrode at 20 mV/sec). The
bottom two traces (0 μM DA) show baseline sweeps without dopamine. Each subsequent sweep
represents a successive addition of 1 μM dopamine. Numbers next to traces indicate
concentrations of dopamine in the phosphate-buffered saline solution. (B) In vitro ascorbic acid
(AA) tests. The figure shows 4 linear sweep voltammograms (-0.15V to 0.5V vs the Ag/AgCl
electrode at 20 mV/sec). The bottom two traces (0 μM AA) show baseline sweeps without
ascorbic acid. The top two sweeps were run in succession after addition of 250 μM ascorbic acid.
(C) In vivo semi-derivative voltammograms (-0.15 to 0.45 V vs Ag-AgCl at 20 mV/sec).
Selectivity for dopamine is shown by the correspondence in peak potential between in vitro (A)
and in vivo (C) sweeps.
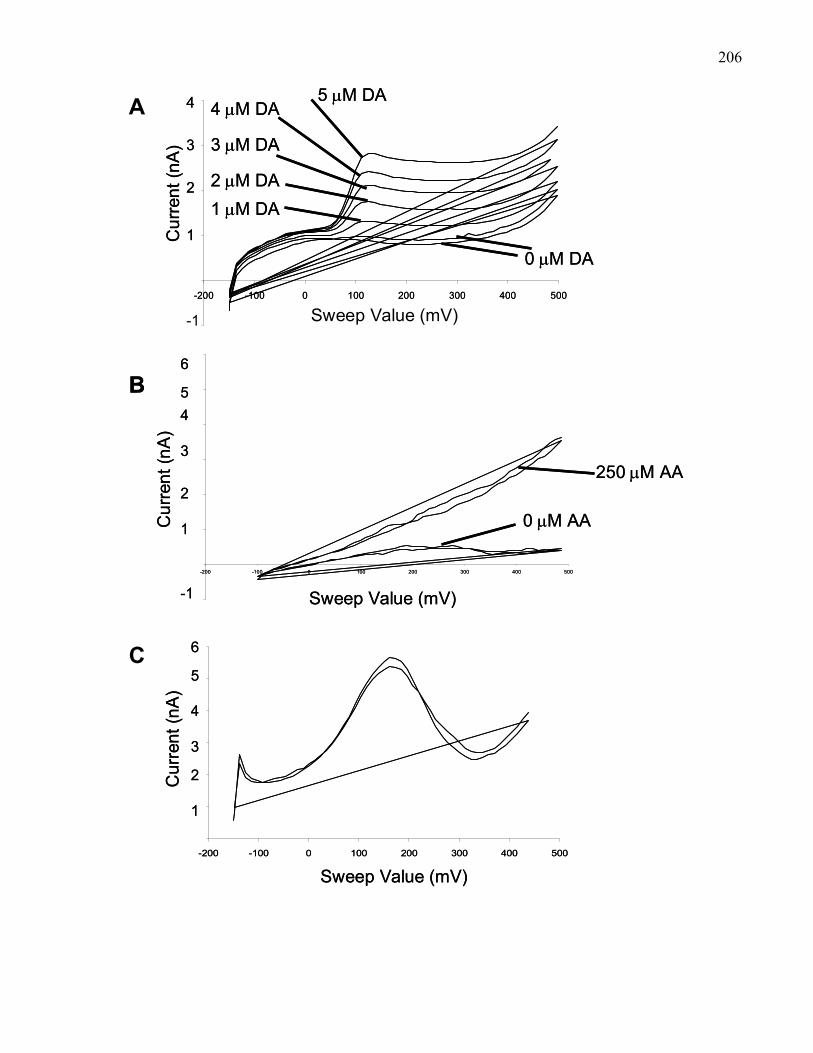
206
-1 Sweep Value (mV)-200 -100 0 100 200 300 400 500
4
3
2
1Cur
rent
(nA
)
0 μM DA
5 μM DA4 μM DA
3 μM DA
2 μM DA1 μM DA
-200 -100 0 100 200 300 400 500
4
3
2
1Cur
rent
(nA
)
0 μM DA
5 μM DA4 μM DA
3 μM DA
2 μM DA1 μM DA
-200 -100 0 100 200 300 400 500
6
5
4
3
2
1
Sweep Value (mV)
Cur
rent
(nA
)
-200 -100 0 100 200 300 400 500
6
5
4
3
2
1
Sweep Value (mV)
Cur
rent
(nA
)
A
C
-200 -100 0 100 200 300 400 500
4
3
2
1
-1 Sweep Value (mV)
Cur
rent
(nA
)
0 μM AA
250 μM AA
B6
5
-200 -100 0 100 200 300 400 500
4
3
2
1
-1 Sweep Value (mV)
Cur
rent
(nA
)
0 μM AA
250 μM AA
B6
5
207with addition of only dopamine (i.e., compare Figures 3.1a and 3.1c).
Histology
The locations of electrochemical recording electrodes and PPT stimulation electrodes are
shown in Figures 3.2 (stimulating) and 3.3 (recording). The recording electrodes were confined
within the boundaries of the striatum, between 0.98-1.70 mm anterior to bregma in both wild-
type and M5 knockout mice. PPT stimulating electrodes are shown on sagittal sections to better
illustrate placements along the rostro-caudal extent of the PPT. Stimulating electrodes in both
wild-type and M5 knockout mice were distributed along the rostro-caudal axis of the PPT.
Current spread around the electrode tips was estimated to be around 0.75 mm (Forster & Blaha,
2000; Yeomans, Maidment, & Bunney, 1988). Given that the entire rostro-caudal extent of the
PPT in the mouse brain is approximately 0.8 mm, it is likely that the current spread associated
with stimulation sites in the most caudal or most rostral portions of the PPT affected most Ch5
neurons. Indeed, data obtained from the more rostral and most caudal PPT sites did not differ
appreciably.
Striatal dopamine release
Electrical stimulation of the PPT in wild-type mice (Figure 3.4a black line) produced a
pattern of striatal dopamine efflux that was similar, but not identical, to what has been previously
observed following PPT-evoked striatal and LDT-evoked accumbal dopamine efflux in rats
(Forster & Blaha, 2000; 2003) and LDT-evoked accumbal dopamine efflux in 129 wild-type
mice (Forster et al., 2001). The main differences from previous data were that in the present data
the second phase was smaller and the third phase larger. Table 2 shows the mean peak magnitude
and peak time of each of the three phases in wild-type mice. PPT stimulation produced a fast-
onset (< 30 sec) first phase of increased dopamine oxidation current that was time-locked to the
PPT electrical stimulation, and peaked at 1.25 min (phase 1). This was followed by a decline in
dopamine oxidation current that peaked at 4.25 min (phase 2). However, unlike previous data

208Figure 3.2. Sagittal sections of the mouse brain showing placements of PPT stimulating
electrodes in 129 wild-type (open triangles, n=8) and M5 knockout mice (open circles, n=8).
Sections were adapted from the atlas of Paxinos and Watson (2004). Numbers above individual
sections show lateral distance in millimeters from the midline.
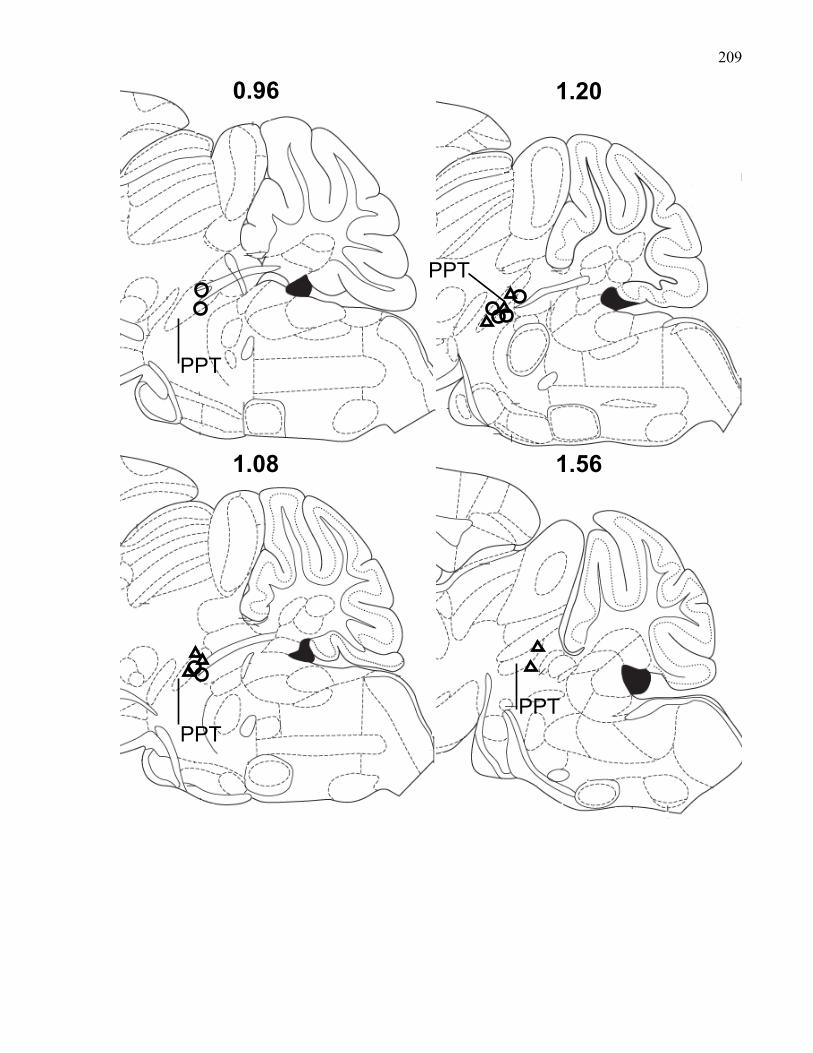
209
0.96
1.56
1.20
1.08
PPT
PPT
PPT PPT

210Figure 3.3. Coronal sections of the mouse brain showing placements of striatal recording
electrodes in 129 wild-type (open triangles, n=8) and M5 knockout mice (open circles, n=8).
Sections were adapted from the atlas of Paxinos and Watson (2004). Numbers next to individual
sections show distance in millimeters from bregma.
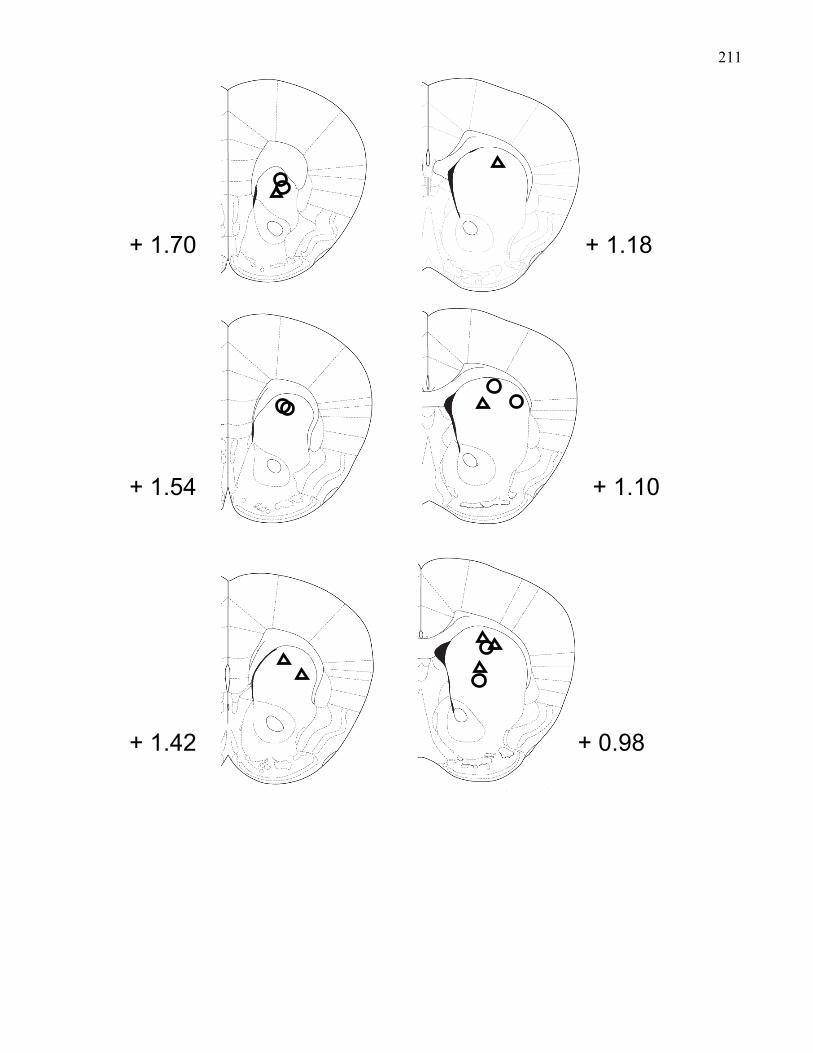
211
+ 0.98
+ 1.54
+ 1.42
+ 1.70
+ 1.10
+ 1.18
212characterizing PPT-induced striatal dopamine release in rats (Forster & Blaha, 2003) or LDT-
evoked accumbal dopamine in mice (Forster et al., 2001), dopamine oxidation current during the
second phase never declined to below baseline levels. Approximately 5-6 min after PPT
stimulation, dopamine oxidation currents began to increase (third phase). This third phase peaked
at 33 min and had a mean duration of 68.13 ± 3.68 min. Furthermore, the third excitatory
component was approximately 3.4 times as large as the first, and >30 times longer. By contrast,
LDT-evoked accumbal dopamine efflux in 129 wild-type mice produced a third phase that was
approximately twice the size of the first and >14 times longer (Forster et al., 2001).
PPT stimulation in M5 knockout mice also produced a tri-phasic pattern of striatal
dopamine efflux (Figure 3.4a gray line and Table 2). Neither the peak oxidation current nor the
peak time of the first or second phase differed significantly between M5 and wild-type mice (all
p’s>0.1). By contrast, the third excitatory phase was strongly reduced in M5 knockout mice, with
the peak oxidation current significantly lower compared to wild-type mice (t(14)=3.38, p<0.01).
Effects of systemic scopolamine pre-treatment on PPT-evoked dopamine efflux
In wild-type mice, systemic administration of scopolamine 30 min prior to PPT
stimulation did not alter the peak (t(3) = 1.00, p>0.3), or the peak time (t(3) = 0.39, p>0.7) of the
first phase. Contrary to expectation, the second phase was enhanced, with mean peak amplitude
now below baseline, resulting in a statistical difference relative to the pre-scopolamine baseline
peak (t(3)=3.94, p<0.05). Pre-treatment with scopolamine almost completely abolished the third
phase (t(3)=7.53, p<0.01) in wild-type mice (Figure 3.4b).
In M5 knockout mice (Figure 3.4c), systemic administration of scopolamine 30 min prior
to PPT stimulation did not affect the first phase in terms of either its peak (p>0.5) or peak time
(p>0.5). Unlike, wild-type mice, the second phase was not affected either in terms of peak
(p>0.4) or peak time (p>0.2). Scopolamine had no effect on the already strongly reduced third
phase in M5 knockout mice (p>0.9).
213Figure 3.4. Striatal dopamine efflux following electrical stimulation of the PPT in wild-type
(+/+) and M5 knockout (-/-) mice. In all cases solid, thick lines represent average dopamine
oxidation current across mice, and thin lines represent ± SEM. (A) phases of PPT-evoked striatal
dopamine efflux in 129 wild-type (black trace, n=8) and M5 knockout (gray trace, n=8).
Numbers indicate the first (1), second (2), and third (3) phases of the triphasic response. (B)
Effects of scopolamine (5 mg/kg, i.p.) pre-treatment on PPT-evoked striatal dopamine efflux in a
sub-set of 129 wild-type mice (n=4) shown in (A). The black trace shows baseline PPT-evoked
dopamine efflux and the gray trace PPT-evoked dopamine efflux following systemic
scopolamine. (C) Effects of scopolamine (5 mg/kg, i.p.) pre-treatment on PPT-evoked striatal
dopamine efflux in a sub-set of M5 knockout mice (n=4 per group) shown in (A). The black trace
shows baseline PPT-evoked dopamine effluxe and the gray trace PPT-evoked dopamine efflux
following systemic scopolamine.
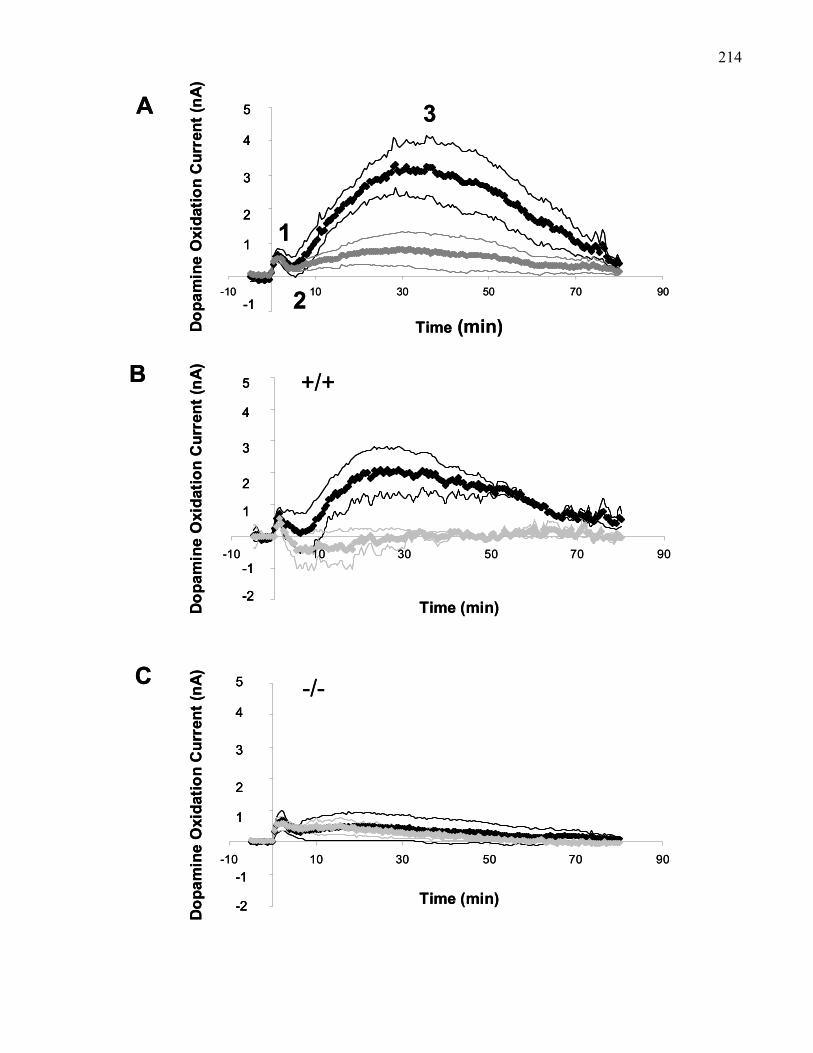
214
-10 10 30 50 70 90
1
2
-1
3
5
4
1
2
-1
3
5
4
-2
-10 10 30 50 70 90
Dop
amin
e O
xida
tion
Cur
rent
(nA
)
Time (min)
Dop
amin
e O
xida
tion
Cur
rent
(nA
)
Time (min)
-10 10 30 50 70 90
Dop
amin
e O
xida
tion
Cur
rent
(nA
)
Time (min)
1
2
-1
3
5
4
-2
A
B
C
1
2
3
+/+
-/-
-10 10 30 50 70 90
1
2
-1
3
5
4
1
2
-1
3
5
4
1
2
-1
3
5
4
-2
1
2
-1
3
5
4
-2
-10 10 30 50 70 90
Dop
amin
e O
xida
tion
Cur
rent
(nA
)
Time (min)
Dop
amin
e O
xida
tion
Cur
rent
(nA
)
Time (min)
-10 10 30 50 70 90
Dop
amin
e O
xida
tion
Cur
rent
(nA
)
Time (min)
1
2
-1
3
5
4
-2
1
2
-1
3
5
4
-2
A
B
C
1
2
3
+/+
-/-
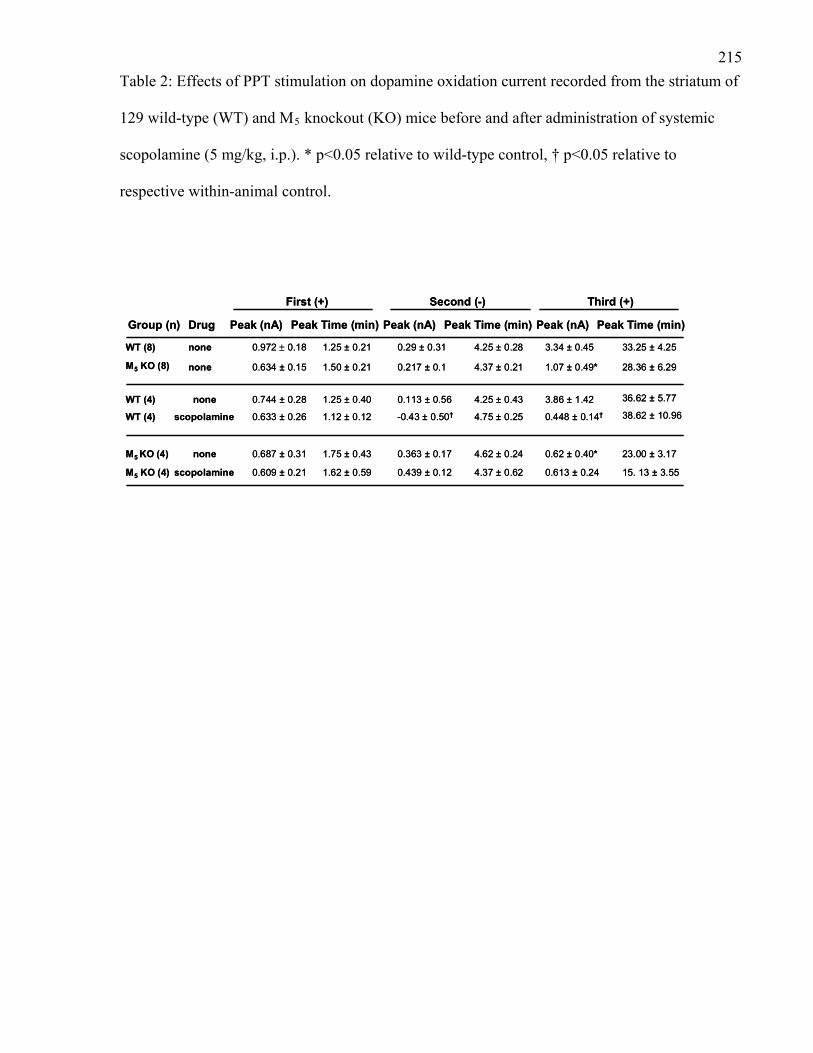
215Table 2: Effects of PPT stimulation on dopamine oxidation current recorded from the striatum of
129 wild-type (WT) and M5 knockout (KO) mice before and after administration of systemic
scopolamine (5 mg/kg, i.p.). * p<0.05 relative to wild-type control, † p<0.05 relative to
respective within-animal control.
Group (n)
M5 KO (8)
M5 KO (4)
M5 KO (4)
Drug Peak (nA) Peak Time (min) Peak (nA)Peak Time (min)Peak (nA)
WT (8) none
none
none
scopolamine
0.972 ± 0.18 1.25 ± 0.21 0.29 ± 0.31 4.25 ± 0.28 3.34 ± 0.45
0.634 ± 0.15 1.50 ± 0.21 0.217 ± 0.1 4.37 ± 0.21 1.07 ± 0.49*
WT (4)
WT (4)
none
scopolamine
0.744 ± 0.28 1.25 ± 0.40 0.113 ± 0.56 4.25 ± 0.43 3.86 ± 1.42
0.633 ± 0.26 1.12 ± 0.12 -0.43 ± 0.50† 4.75 ± 0.25 0.448 ± 0.14†
0.687 ± 0.31 1.75 ± 0.43 0.363 ± 0.17 4.62 ± 0.24 0.62 ± 0.40*
0.609 ± 0.21 1.62 ± 0.59 0.439 ± 0.12 4.37 ± 0.62 0.613 ± 0.24
First (+) Second (-) Third (+)
Peak Time (min)
33.25 ± 4.25
28.36 ± 6.29
36.62 ± 5.77
38.62 ± 10.96
23.00 ± 3.17
15. 13 ± 3.55
216Discussion
The present data provide further evidence that M5 muscarinic receptors are important in
mediating prolonged excitation of midbrain dopamine neurons. Electrical stimulation of the PPT
in 129 wild-type mice produced two phases of increased striatal dopamine efflux. Comparable to
what has previously been shown with PPT-evoked striatal dopamine efflux in rats (Forster &
Blaha, 2003), the first of the two excitatory phases had a fast onset and short duration (phase 1),
while the second had a slower onset and longer duration (phase 3). In contrast to PPT-evoked
striatal dopamine efflux in rats, there was only a small inhibitory, second phase, that did not
decrease below baseline levels (phase 2). The third, excitatory phase of prolonged striatal
dopamine efflux was strongly reduced in M5 knockout mice. Furthermore, in wild-type mice
systemic pre-treatment with the non-selective muscarinic receptor antagonist scopolamine
completely blocked the third, excitatory phase of striatal dopamine efflux. Previously, Forster &
Blaha (2003) have shown that in rats the third phase is similarly blocked by either systemic
scopolamine or substantia nigra administration of scopolamine. This is consistent with an
important role of midbrain muscarinic receptors in mediating prolonged excitatory activation of
the nigrostriatal dopamine system. The present data on striatal dopamine release extend previous
work in M5 knockout mice showing a similar reduction in the third phase of prolonged accumbal
dopamine efflux following electrical stimulation of the LDT (Forster et al., 2001), showing that
substantia nigra M5 receptors (Vilaro et al., 1990; Weiner et al., 1990) play a critical role in
mediating excitatory cholinergic input to the nigrostriatal dopamine system.
The present data also extend previous work in rats by showing that in mice PPT
stimulation facilitates striatal dopamine efflux in two excitatory phases. The first phase increase
was evident within 30 sec of electrical stimulation and peaked between 1 and 1.5 min. In rats,
this phase has been shown to be mediated by nicotinic cholinergic receptors and ionotropic
glutamatergic receptors in the substantia nigra (Forster & Blaha, 2003). Neither M5 receptor
217deletion nor systemic muscarinic receptor antagonism significantly affected this phase,
suggesting that it is independent of muscarinic receptors. Instead, similar to rats, it likely
depends on substantia nigra nicotinic cholinergic and/or ionotropic glutamatergic receptors. The
fact that the first phase was not affected by either muscarinic manipulation suggests that there
were no compensatory changes in either nicotinic or ionotropic glutamatergic receptors.
The third phase (i.e. the second excitatory phase) had a slow onset, beginning at about 5-
6 min after PPT stimulation and lasting approximately 70 minutes. It is interesting to note that
the longer duration of the third phase following PPT (~ 46 min; Forster & Blaha, 2003) relative
to LDT (~ 36 min; Forster & Blaha, 2000) stimulation observed in rats, also appears to be true
for mice, where the third phase of LDT-evoked accumbens dopamine efflux had an approximate
duration of 50 minutes (Forster et al., 2001). The slow onset of the third phase is consistent with
mediation through metabotropic M5 receptors.
To calculate the M5 contribution to overall PPT-evoked striatal dopamine efflux, average
oxidation current in M5 knockout mice was subtracted from that in wild-type mice (Figure 3.5).
This shows that following electrical stimulation of the PPT, M5 receptors mediate a gradual
increase in striatal dopamine release with the greatest rise occurring between 5 and 22 minutes,
and a peak around 30 min. Previously, M5 receptors have been shown to mediate prolonged
pilocarpine-induced salivation (15-60 min after i.p. injection) (Takeuchi et al., 2002). Also, N-
methyl-scopolamine binding to M5 receptors in cultured cells has been shown to be the slowest
of the sub-types, with an association half-life of 6 minutes and a dissociation half-life of 20.5
min (Ferrari-DiLeo, Waelbroeck, Mash, & Flynn, 1994). This evidence indicates that the M5-
dependent excitation of striatal dopamine efflux begins during the second phase, possibly
masking the inhibitory effect of the second phase.
In contrast to the data on accumbens dopamine efflux following LDT stimulation, in the
present data there was some indication that systemic scopolamine pre-treatment in wild-type

218Figure 3.5. M5 receptor contribution to PPT-evoked striatal dopamine efflux in 129 mice. The
graph shows the difference in mean oxidation current between 129 wild-type (n=8) and M5
knockout (n=8) mice.
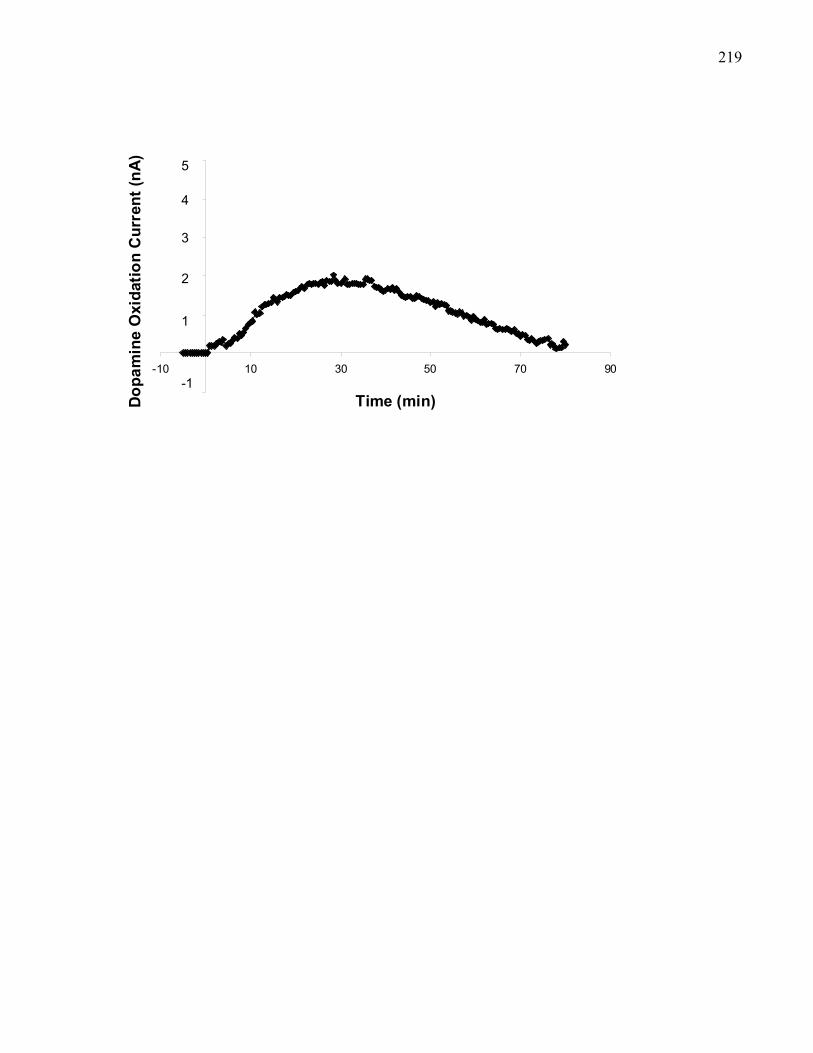
219
-10 10 30 50 70
1
2
-1
3
5
4
Dop
amin
e O
xida
tion
Cur
rent
(nA
)
Time (min)
90
220mice blocked the third phase more completely than systemic deletion of M5 receptors in
knockouts (compare Figures 3.4a and 3.4b). Although, statistical comparison of peak oxidation
currents between these two conditions did not provide significance (p>0.4), it is the case that
peak oxidation current of the third phase was still above baseline in M5 knockouts (unlike LDT-
evoked accumbal dopamine efflux, Forster et al., 2001), but was reduced to baseline in wild-type
mice by systemic scopolamine pre-treatment. This suggests that there may be a second non-M5
muscarinic receptor-mediated mechanism that makes a small contribution to prolonged striatal
dopamine efflux. In wild-type mice given systemic scopolamine this contributing muscarinic
mechanism would then be blocked along with the direct M5-mediated excitation of nigral
dopamine neurons, resulting in more complete blockade of the third phase.
Alternatively, systemic scopolamine could be affecting striatal dopamine efflux via its
effects on M1-M5 striatal muscarinic receptors. However, striatal effects should produce a mix of
dopamine excitation and inhibition (Yamada et al., 2001; Zhang et al., 2002), and so are hard to
interpret.
Another problem with interpreting the systemic scopolamine data, is that the drug
simultaneously acts in many places. In this regard, previous data suggest that scopolamine action
in the PPT, where M2 muscrinic receptors are found (Vilaro et al., 1990, 1994) should not have a
direct effect on the third phase, as PPT methoctramine infusion did not affect the third phase
(Forster & Blaha, 2003).
In rat studies, as well as the study of LDT-evoked accumbal dopamine efflux in 129
mice, systemic scopolamine prolonged the duration of the second phase (Forster & Blaha, 2000;
2003; Forster et al., 2001). In the current experiment, systemic scopolamine produced a second
phase that peaked below baseline levels with oxidation current remaining below baseline until 20
min. A prolonged second phase that extends into the time window of the ascending portion of the
third phase could result in a further reduction in third phase peak oxidation currents.
221It is also unlikely that scopolamine effects on substantia nigra GABA neuron M3
receptors played a major role, as this should have resulted in a disinhibition of the nigrostriatal
dopamine system and consequently an increase in striatal dopamine efflux. It is interesting to
consider, however, that the scenario may be somewhat different in the M5 knockout mouse. In
Chapter 2 intra-VTA infusions of atropine increased locomotion significantly in M5 knockout
mice but not in wild-type mice. One way to interpret this difference is that in the knockout
mouse muscarinic excitation of the dopamine system is shifted from direct excitation (through
M5 receptors) to indirect disinhibition via non-M5 muscarinic receptors (see Chapter 2
Discussion). Accordingly, it may be that in the knockout mouse, cholinergic input to the
substantia nigra produced by electrical stimulation of the PPT reveals the indirect contribution of
M3 receptors, resulting in a small increase in striatal dopamine efflux. If this were a major factor,
then systemic scopolamine should have blocked that M3-mediated component in the M5
knockout mouse. Clearly, the small third phase in M5 knockout mice was not additionally
reduced by scopolamine (Figure 3.4c).
One aspect of the present data is at odds with previous data investigating PPT-evoked
striatal (Forster & Blaha, 2003) and LDT-evoked accumbal (Forster & Blaha, 2000) dopamine
efflux in rats and LDT-evoked accumbal dopamine efflux in mice (Forster et al., 2001). In the
three previous studies the second, inhibitory phase of dopamine release was always characterized
by a decrease of either striatal or accumbal dopamine efflux to below baseline levels. This was
not the case in the present experiment, where the second phase was characterized by only a very
small decrease that did not go below baseline levels in either wild-type or M5 knockout mice. By
comparison to LDT-evoked accumbal dopamine efflux in the same mouse strain, the third
excitatory phase was also much larger relative to the first (~ 2 times for LDT and ~ 3.4 times for
PPT) and had a slightly faster onset (~ 8 min for LDT and 5-6 min for PPT). Thus it may be that
the third excitatory phase of striatal dopamine efflux in wild-type mice was more powerful
222relative to the third phase of accumbal dopamine efflux, and so overshadowed the full extent of
the second phase. This is consistent with Figure 3.5, which shows that the M5-mediated third
phase began at 5 min, thus overlapping with the second phase. Furthermore, in wild-type mice
pre-treatment with scopolamine, which blocked the third phase, increased the magnitude of the
second phase and extended its duration.
A consequence of a smaller second phase was that the extent of the first phase was better
revealed. In the present data the duration of the first phase was clearly longer than for LDT-
evoked accumbal dopamine efflux. It may be that in Forster et al.’s (2001) experiment the full
extent was overshadowed by the stronger second phase. In rats the second phase is mediated
through M2 autoreceptors in PPT and LDT, where, at least in the rat brain, high levels of M2
mRNA are detected (Buckley et al., 1988; Levey et al., 1991; Wei et al., 1994). The present data
in mice suggest that the M2-mediated inhibition of PPT-evoked striatal dopamine efflux in mice
is less than what is seen in rats. Whether this means that PPT M2 autoreceptors play a lesser role
in inhibiting cholinergic input to the substantia nigra or ventral tegmental area in mice than in
rats is unclear.
Functionally, this work further supports a role for M5 receptors in dopamine-mediated
behaviours. As previously suggested (Forster & Blaha, 2003; Forster et al., 2001) it is likely that
M5 receptors contribute more to the maintenance of dopamine-dependent behaviour rather than
the initiation, which would likely depend more on mediation through faster nicotinic cholinergic
or ionotropic glutamatergic mechanisms. This is consistent with evidence that M5 receptors in
VTA are necessary for the maintenance of brain-stimulation reward (Yeomans et al., 2000). This
is also consistent with evidence that nigral muscarinic receptors are necessary for the long-
lasting striatal dopamine release produced by systemic morphine (Miller et al., 2005) and that
rats with PPT lesions show lower break points for heroin self-administration (Olmstead et al.,
1998). Furthermore, reduced striatal dopamine efflux in response to morphine in PPT-lesioned
223rats is associated with significantly attenuated stereotypy induced by 2 mg/kg (i.p.) morphine
(Miller et al., 2002). This suggests that PPT input to the nigrostriatal dopamine system is
important for morphine-related stereotypic behaviour, for which the present data would predict
an important role for M5 receptors. In 129 wild-type and M5 knockout mice, morphine-induced
locomotion was studied across three doses (3, 10, and 30 mg/kg, i.p.; see Chapter 1), but in no
case was stereotypy ever observed. It may be of interest compare morphine-induced stereotypy,
possibly induced by higher (> 30 mg/kg) doses of morphine, between wild-type and M5
knockout mice.
Experiment 5: Accumbal dopamine efflux in response to intra-VTA morphine in M5
knockout mice
Materials and Methods
Mice
Fourteen male 129 wild-type and 4 male 129 M5 knockout mice were used in these
experiments. All mice were between 2 and 4 months of age at the time of testing.
Surgery
Mice were anesthetized with urethane (1.5 g/kg, i.p.; Sigma-Aldrich, St. Louis, MO).
Each mouse was mounted in a stereotaxic frame (David Kopf Instruments, Tujunga, CA or
MyNeuroLab, St. Louis, MO) using rat earbars (Stoelting, Wood Dale, IL) and a mouse head-
holder (Stoelting, Wood Dale, IL). Temperature was maintained at 37 ± 0.5°C with a
temperature-regulated heating pad (TC-1000; CWE Inc., New York, NY). A single 26 gauge
guide cannula (Plastics One, Roanoke, VA) was implanted 1mm dorsal to the left VTA of each
mouse (A/P +0.9 mm from lambda, M/L 0.4 mm D/V -4.4 mm from dura) according to the atlas
of Paxinos and Franklin (2004). For VTA injections, a 33 gauge injector cannula was inserted
that protruded 1 mm past the tip of the guide cannula, and was connected to a Hamilton
224microsyringe via Tygon tubing. A single stearate-modified carbon paste electrodes was
implanted into the left nucleus accumbens of each mouse (A/P +1.4 mm from bregma, M/L 0.8
mm, D/V -3.6 mm from dura) according to the atlas of Paxinos and Franklin (2004). A
combination silver/silver chloride and stainless-steel auxiliary electrode was placed into contact
with the contralateral parietal cortex.
VTA Injections
Following both in-vitro and in-vivo tests of the working electrode (see Experiment 6)
repetitive chronoamperometric measurements of oxidation current were performed as described
for Experiment 6. After at least 30 min of baseline recordings, VTA injections were applied and
changes in dopamine oxidation current were monitored for 2-3 hrs.
Changes in accumbal dopamine oxidation current following 50 ng intra-VTA morphine
(Sigma, St. Louis, MO) were tested in 4 wild-type and 4 M5 knockout mice. In an additional 4
wild-type mice, changes in accumbal dopamine oxidation current in response to 50 ng intra-VTA
morphine were measured following VTA pre-treatment with 50 μg scopolamine hydrobromide
(Sigma-Aldrich, St. Louis, MO) 10 min prior to the morphine injection. In an additional 6 wild-
type mice, changes in accumbal dopamine oxidation current in response to 50 ng intra-VTA
morphine were measured following systemic pre-treatment with naltrexone hydrochloride (1
mg/kg, i.p.; Sigma-Aldrich, St. Louis, MO) 5 min prior to VTA morphine injection.
Drugs
Morphine sulfate pentahydrate, scopolamine hydrobromide, and naltrexone
hydrochloride were all dissolved in sterile 0.9% saline. Intra-VTA injections were done at a
volume of 0.5 μl, and systemic naltrexone injections at a volume of 10 ml/kg.
Results
Histology
Figure 3.6 shows VTA injection sites of individual wild-type and M5 knockout mice.
225Injection sites of mice in the various treatment conditions were confined within the boundaries of
the VTA and were spread along its rostro-caudal extent. Recording sites in the nucleus
accumbens were confined to the core region between 0.98 and 1.54 mm anterior to bregma. Only
mice in which both the injection and recording sites were within the intended target structures
were used for subsequent analysis. Thus, two mice used in the naltrexone experiment in which
injection sites were dorsal to the VTA were not included. Data from these mice is separately
shown in Figure 3.8B.
VTA morphine injections in wild-type and M5 knockout mice
Injection of 50 ng morphine into the VTA of wild-type mice produced a delayed onset
increase in accumbens dopamine efflux starting between 10 and 20 minutes (16.5 ± 7.87 min),
that steadily increased over the course of the next two hours. Over the course of the final 50
minutes, dopamine oxidation currents started to level off, but in no case returned back to baseline
levels (Figure 3.7a). The extent to which dopamine efflux leveled off during this time varied
greatly between individual wild-type mice (see Figure 3.7b-i for individual animal data). By
contrast, in M5 knockout mice the same dose of intra-VTA morphine produced a decrease in
accumbens dopamine efflux, starting at about 5 minutes (5.87 ± 2.01 min), that returned to
baseline levels by approximately 90 minutes (92.0 ± 9.78 min), and subsequently showed a
comparatively slight increase above baseline over the final 80 minutes. A between-within
repeated-measures ANOVA with genotype as the between-subjects factor and time as the within-
subjects factor revealed a significant interaction between genotype and time (F (344, 1376)
=11.59, p<0.0001), confirming that the temporal profile of accumbal dopamine efflux produced
by intra-VTA morphine was different between wild-type and M5 knockout mice. Post- hoc
analysis using Fischer’s LSD test showed that starting at 32 minutes and all the way to 165 min,
individual comparisons between wild-type and M5 knockout mice showed significantly reduced
226Figure 3.6. VTA injection sites (A) and nucleus accumbens recording sites (B). Open circles
show placements from M5 knockout mice (n=4) injected with 50 ng intra-VTA morphine; open
triangles show placements from wild-type mice (n=4) injected with 50 ng intra-VTA morphine;
stars show placements from wild-type mice (n=4) pre-treated with 50 μg intra-VTA scopolamine
followed by 50 ng intra-VTA morphine (the red star in (B) indicates wild-type mouse 51 with the
most dorsal recording site, see text for discussion); open squares show placements from wild-
type mice (n=6) pre-treated with 1 mg/kg (i.p.) naltrexone followed by 50 ng intra-VTA
morphine (the two red squares in (A) show two mice in which the morphine injection was dorsal
to the VTA, see text for discussion). Numbers next to individual sections indicated the distance
from bregma in millimeters. Numbers next to placements identify individual mice (W = wild-
type, KO = M5 knockout).
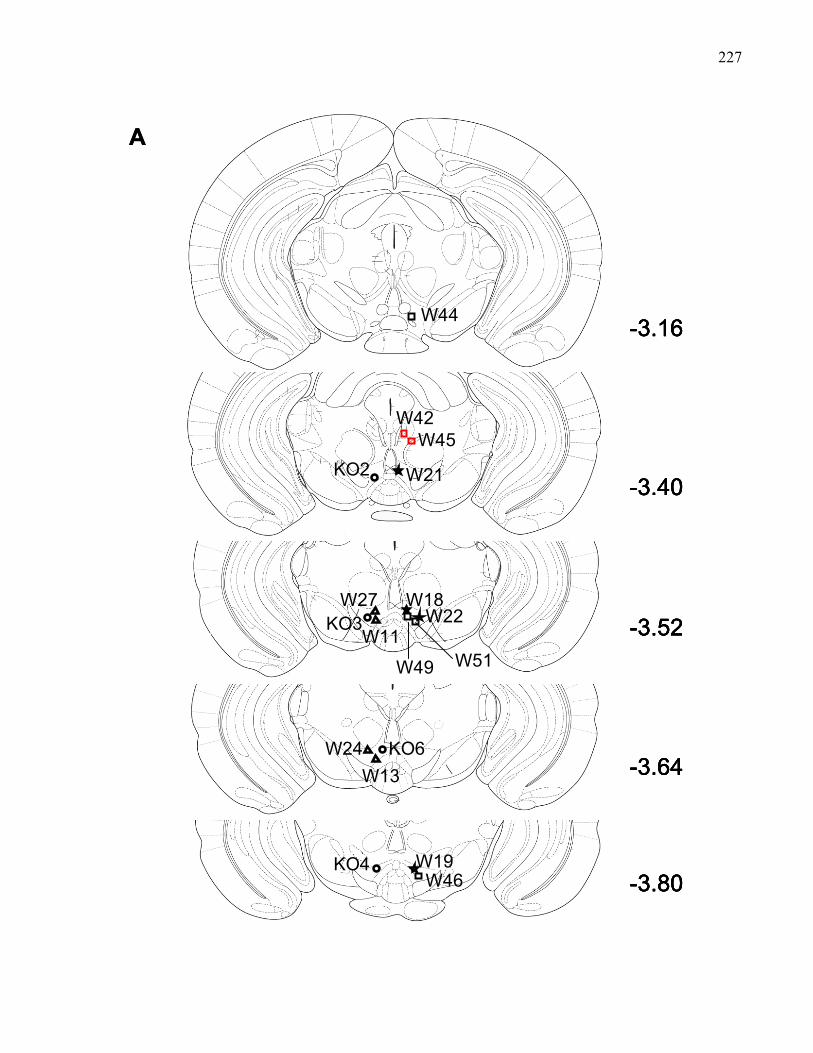
227
-3.80KO4 W19
W46
-3.64KO6W24
W13
-3.52W27
KO3W11
W18W22
W49 W51
-3.40
W42W45
KO2 W21
-3.16W44
A
-3.80KO4 W19
W46
-3.64KO6W24
W13
-3.52W27
KO3W11
W18W22
W49 W51
-3.16W44
-3.40
W42W45
KO2 W21
-3.80KO4 W19
W46 -3.80KO4 W19
W46
-3.64KO6W24
W13 -3.64KO6W24
W13
-3.52W27
KO3W11
W18W22
W49 W51
-3.52W27
KO3W11
W18W22
W49 W51
-3.40
W42W45
KO2 W21
-3.16W44 -3.16W44
A
-3.40
W42W45
KO2 W21
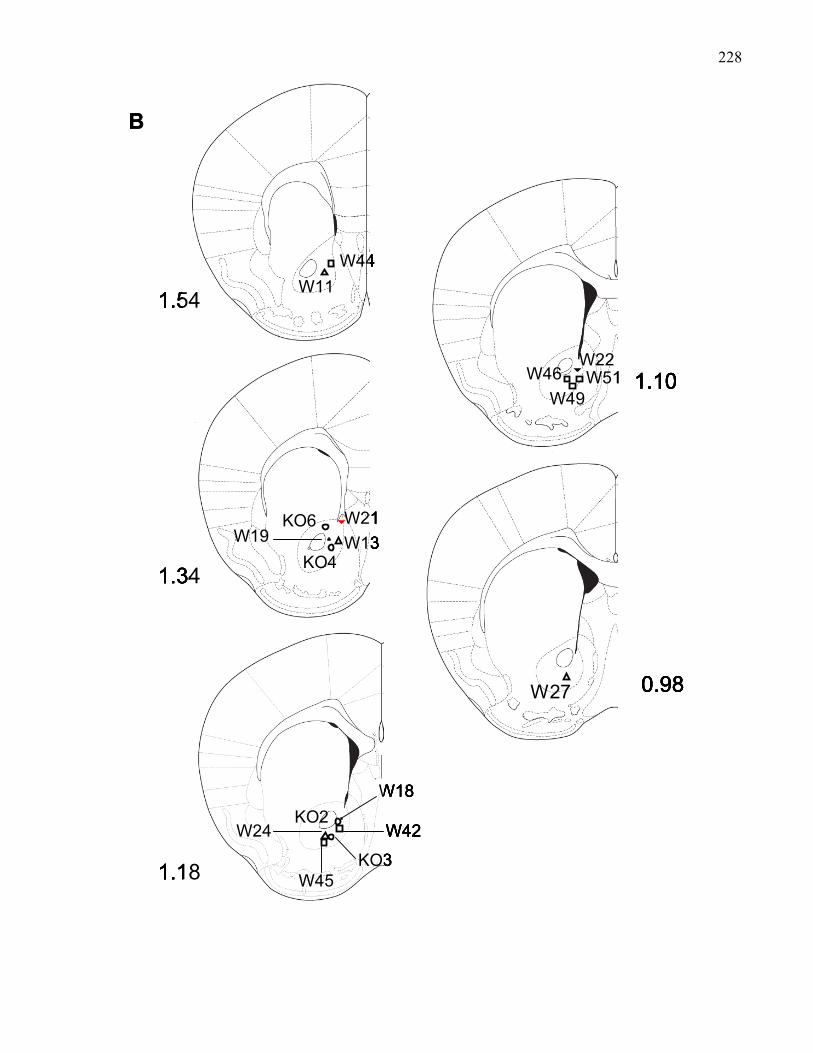
228
1.54
W44W11
1.34
KO6W19
KO4
W21W13
1.18
W18
W42
KO3W45
W24KO2
0.98W27
1.10W46W22W51
W49
B
1.54
W44W11
1.34
KO6W19
KO4
W21W13
1.18
W18
W42
KO3W45
W24KO2
0.98W27
1.10W46W22W51
W49
1.54
W44W11
1.54
W44W11
1.34
KO6W19
KO4
W21W13
1.34
KO6W19
KO4
W21W13
1.18
W18
W42
KO3W45
W24KO2
1.18
W18
W42
KO3W45
W24KO2
0.98W27 0.980.98W27
1.10W46W22W51
W491.101.10W46
W22W51
W49
B
229Figure 3.7. Changes in nucleus accumbens dopamine efflux produced by 50 ng intra-VTA
morphine. (A) Mean change in acumbal dopamine efflux in 129 wild-type (black line, n=4) and
M5 knockout (gray line, n=4) mice. Solid, thick lines represent average dopamine oxidation
current across mice, and thin lines represent ± SEM. (B-I) Changes in accumbal dopamine efflux
produced by 50 ng intra-VTA morphine in individual mice whose average is shown in (A). WT
= wild-type, KO = M5 knockout.
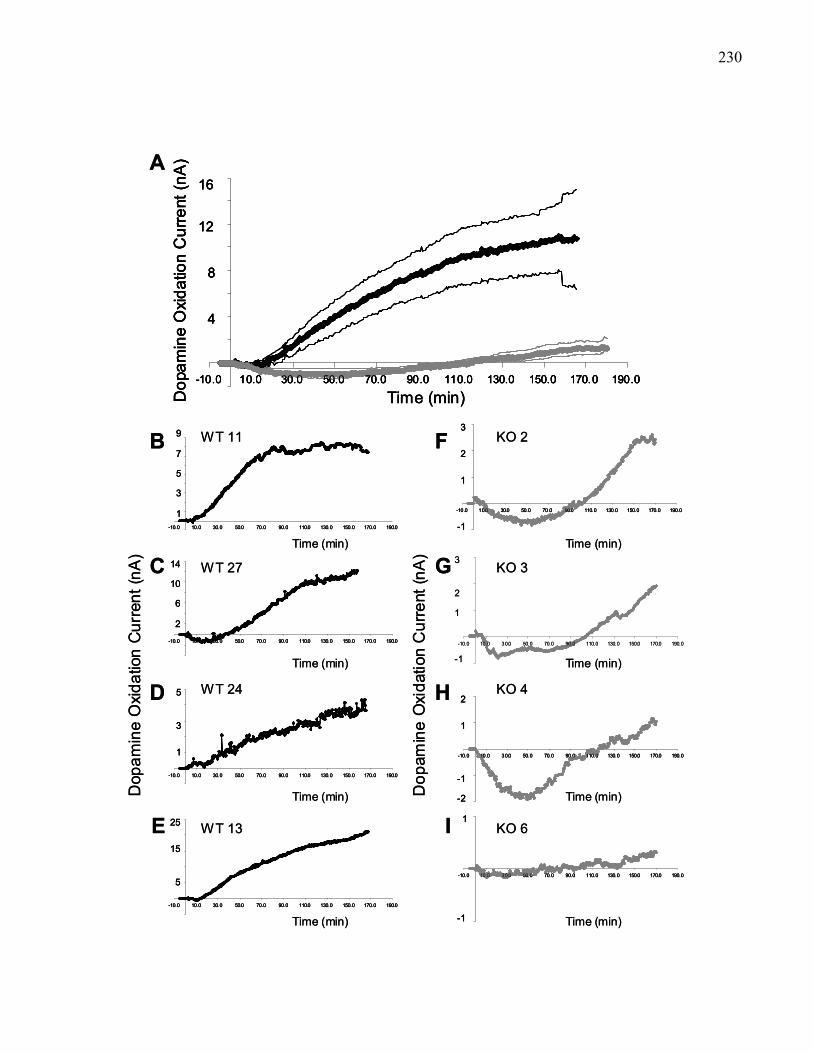
230
-10.0 10.0 30.0 50.0 70.0 90.0 110.0 130.0 150.0 170.0 190.0-10.0 10.0 30.0 50.0 70.0 90.0 110.0 130.0 150.0 170.0 190.0
14
10
6
2
A
-10.0 10.0 30.0 50.0 70.0 90.0 110.0 130.0 150.0 170.0 190.0
16
12
8
4
Dop
amin
e O
xida
tion
Cur
rent
(nA
)
Time (min)
-10.0 10.0 30.0 50.0 70.0 90.0 110.0 130.0 150.0 170.0 190.0
9
7
5
3
1
Time (min)
Time (min)
-10.0 10.0 30.0 50.0 70.0 90.0 110.0 130.0 150.0 170.0 190.0
5
3
1
-10.0 10.0 30.0 50.0 70.0 90.0 110.0 130.0 150.0 170.0 190.0
15
5
25
Time (min)
Time (min)
Time (min)3
2
1
Time (min)
-10.0 10.0 30.0 50.0 70.0 90.0 110.0 130.0 150.0 170.0 190.0
2
1
-1
-2
-1
-10.0 10.0 30.0 50.0 70.0 90.0 110.0 130.0 150.0 170.0 190.0
3
2
1
-1
Time (min)
-10.0 10.0 30.0 50.0 70.0 90.0 110.0 130.0 150.0 170.0 190.0
1
-1 Time (min)
Dop
amin
e O
xida
tion
Cur
rent
(nA
)
Dop
amin
e O
xida
tion
Cur
rent
(nA
)WT 11
WT 27
WT 24
WT 13
KO 2
KO 3
KO 4
KO 6
B
C
D
E
F
G
H
I
-10.0 10.0 30.0 50.0 70.0 90.0 110.0 130.0 150.0 170.0 190.0-10.0 10.0 30.0 50.0 70.0 90.0 110.0 130.0 150.0 170.0 190.0
14
10
6
2
-10.0 10.0 30.0 50.0 70.0 90.0 110.0 130.0 150.0 170.0 190.0
14
10
6
2
A
-10.0 10.0 30.0 50.0 70.0 90.0 110.0 130.0 150.0 170.0 190.0
16
12
8
4
Dop
amin
e O
xida
tion
Cur
rent
(nA
)
Time (min)-10.0 10.0 30.0 50.0 70.0 90.0 110.0 130.0 150.0 170.0 190.0
16
12
8
4
Dop
amin
e O
xida
tion
Cur
rent
(nA
)
-10.0 10.0 30.0 50.0 70.0 90.0 110.0 130.0 150.0 170.0 190.0
16
12
8
4
Dop
amin
e O
xida
tion
Cur
rent
(nA
)
Time (min)
-10.0 10.0 30.0 50.0 70.0 90.0 110.0 130.0 150.0 170.0 190.0
3
2
1
-1-10.0 10.0 30.0 50.0 70.0 90.0 110.0 130.0 150.0 170.0 190.0
9
7
5
3
1-10.0 10.0 30.0 50.0 70.0 90.0 110.0 130.0 150.0 170.0 190.0
9
7
5
3
1
Time (min)
Time (min)
-10.0 10.0 30.0 50.0 70.0 90.0 110.0 130.0 150.0 170.0 190.0
5
3
1
-10.0 10.0 30.0 50.0 70.0 90.0 110.0 130.0 150.0 170.0 190.0
5
3
1
-10.0 10.0 30.0 50.0 70.0 90.0 110.0 130.0 150.0 170.0 190.0
15
5
25
-10.0 10.0 30.0 50.0 70.0 90.0 110.0 130.0 150.0 170.0 190.0
15
5
25
Time (min)
Time (min)
Time (min)3
2
1
Time (min)
-10.0 10.0 30.0 50.0 70.0 90.0 110.0 130.0 150.0 170.0 190.0
2
1
-1
-2
-10.0 10.0 30.0 50.0 70.0 90.0 110.0 130.0 150.0 170.0 190.0
2
1
-1
-2
-1
-10.0 10.0 30.0 50.0 70.0 90.0 110.0 130.0 150.0 170.0 190.0
3
2
1
-1
Time (min)
-10.0 10.0 30.0 50.0 70.0 90.0 110.0 130.0 150.0 170.0 190.0
1
-1
-10.0 10.0 30.0 50.0 70.0 90.0 110.0 130.0 150.0 170.0 190.0
1
-1 Time (min)
Dop
amin
e O
xida
tion
Cur
rent
(nA
)
Dop
amin
e O
xida
tion
Cur
rent
(nA
)WT 11
WT 27
WT 24
WT 13
KO 2
KO 3
KO 4
KO 6
B
C
D
E
F
G
H
I
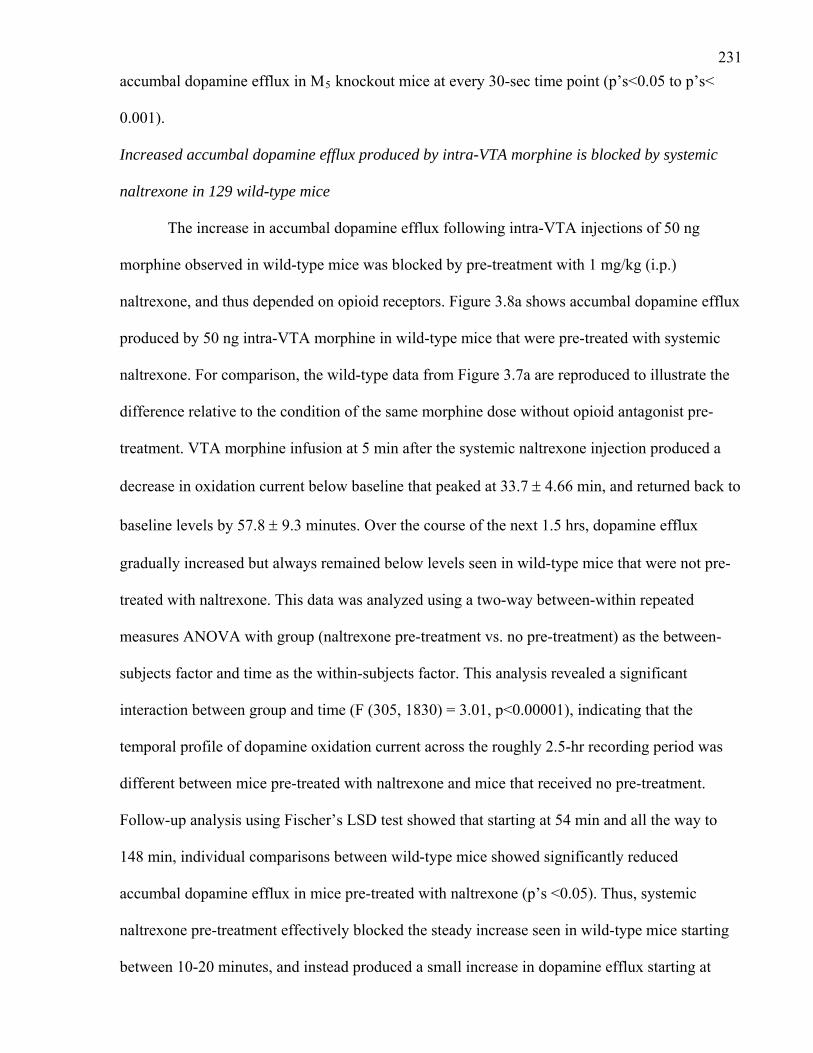
231accumbal dopamine efflux in M5 knockout mice at every 30-sec time point (p’s<0.05 to p’s<
0.001).
Increased accumbal dopamine efflux produced by intra-VTA morphine is blocked by systemic
naltrexone in 129 wild-type mice
The increase in accumbal dopamine efflux following intra-VTA injections of 50 ng
morphine observed in wild-type mice was blocked by pre-treatment with 1 mg/kg (i.p.)
naltrexone, and thus depended on opioid receptors. Figure 3.8a shows accumbal dopamine efflux
produced by 50 ng intra-VTA morphine in wild-type mice that were pre-treated with systemic
naltrexone. For comparison, the wild-type data from Figure 3.7a are reproduced to illustrate the
difference relative to the condition of the same morphine dose without opioid antagonist pre-
treatment. VTA morphine infusion at 5 min after the systemic naltrexone injection produced a
decrease in oxidation current below baseline that peaked at 33.7 ± 4.66 min, and returned back to
baseline levels by 57.8 ± 9.3 minutes. Over the course of the next 1.5 hrs, dopamine efflux
gradually increased but always remained below levels seen in wild-type mice that were not pre-
treated with naltrexone. This data was analyzed using a two-way between-within repeated
measures ANOVA with group (naltrexone pre-treatment vs. no pre-treatment) as the between-
subjects factor and time as the within-subjects factor. This analysis revealed a significant
interaction between group and time (F (305, 1830) = 3.01, p<0.00001), indicating that the
temporal profile of dopamine oxidation current across the roughly 2.5-hr recording period was
different between mice pre-treated with naltrexone and mice that received no pre-treatment.
Follow-up analysis using Fischer’s LSD test showed that starting at 54 min and all the way to
148 min, individual comparisons between wild-type mice showed significantly reduced
accumbal dopamine efflux in mice pre-treated with naltrexone (p’s <0.05). Thus, systemic
naltrexone pre-treatment effectively blocked the steady increase seen in wild-type mice starting
between 10-20 minutes, and instead produced a small increase in dopamine efflux starting at
232Figure 3.8. Effect of pre-treatment with naltrexone (1 mg/kg, i.p.) 5 min prior to 50 ng intra-
VTA morphine in 129 wild-type mice (black line, n=6). For comparison, wild-type data from
Figure 3.7 showing the effect of 50 ng intra-VTA morphine are reproduced (gray line, n=4).
Solid, thick lines represent average dopamine oxidation current across mice, and thin lines
represent ± SEM. (A) Mice with injections sites within the boundaries of the VTA (n=4). (B)
Mice with injection sites dorsal to the VTA (n=2). Arrows indicate times at which naltrexone and
morphine were administered.
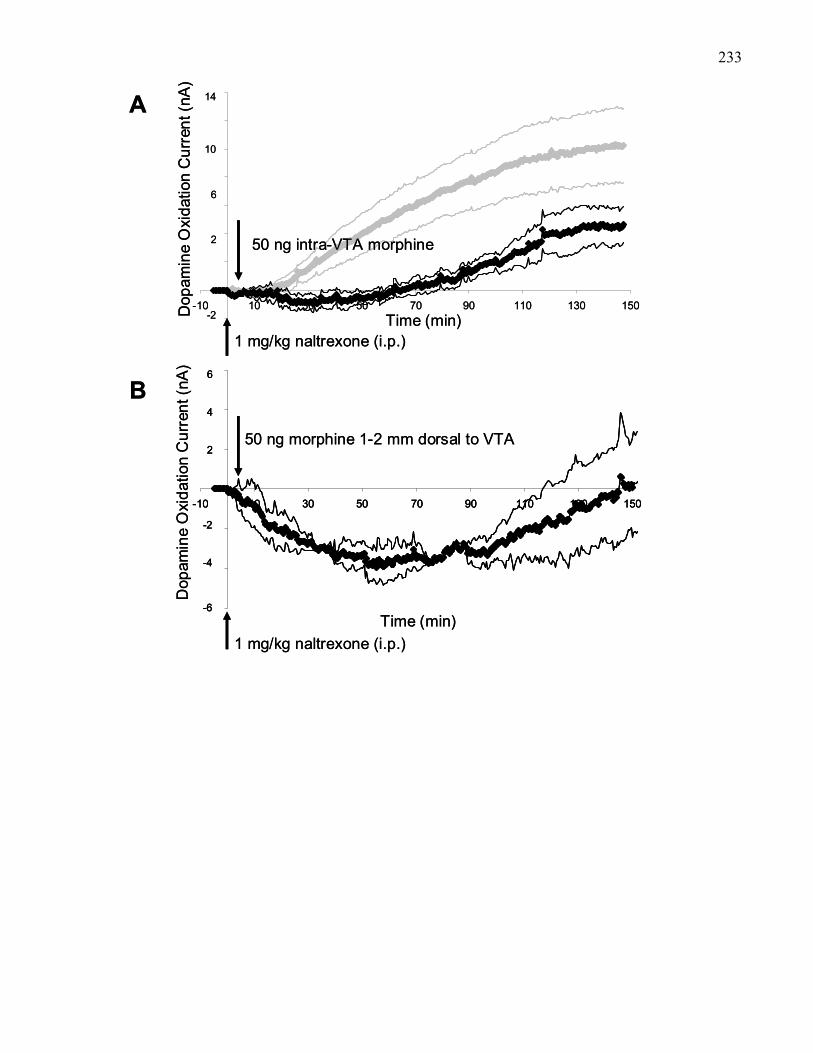
233
14
10
6
2
-2Dop
amin
e O
xida
tion
Cur
rent
(nA
)
Time (min)
-10 10 30 50 70 90 110 130 150
6
4
2
-2
-4
-6
Dop
amin
e O
xida
tion
Cur
rent
(nA
)
Time (min)
A
B
-10 10 30 50 70 90 110 130 150
1 mg/kg naltrexone (i.p.)
1 mg/kg naltrexone (i.p.)
50 ng intra-VTA morphine
50 ng morphine 1-2 mm dorsal to VTA
14
10
6
2
-2Dop
amin
e O
xida
tion
Cur
rent
(nA
)
Time (min)
-10 10 30 50 70 90 110 130 150
6
4
2
-2
-4
-6
-10 10 30 50 70 90 110 130 150
6
4
2
-2
-4
-6
Dop
amin
e O
xida
tion
Cur
rent
(nA
)
Time (min)
A
B
-10 10 30 50 70 90 110 130 150
1 mg/kg naltrexone (i.p.)
1 mg/kg naltrexone (i.p.)
50 ng intra-VTA morphine
50 ng morphine 1-2 mm dorsal to VTA
234approximately 1 hour. Figure 3.8b shows two mice in which the intra-cranial injection sites were
1-2 mm dorsal to the VTA (see red squares in Figure 3.5a). In these sites any effect of morphine
on dopamine neurons, even when considering the effect of diffusion through brain tissue would
be minimal and slower than in VTA sites. Thus, data from these mice provide an indication of
how 1 mg/kg systemic naltrexone alone affects dopamine efflux in the nucleus accumbens,
showing that it produced a decrease in oxidation current within 5 min of injection that peaked at
approximately 60 min and then recovered to baseline levels over the next 1.5 hours. These data
also provide a comparison group for those mice receiving naltrexone pre-treatment in
combination with successful VTA morphine injections.
Increased accumbal dopamine efflux produced by intra-VTA morphine is blocked by pre-
treatment with intra-VTA scopolamine in wild-type mice
In wild-type mice VTA pre-treatment with the non-specific muscarinic antagonist
scopolamine (50 μg) completely blocked the increase in accumbal dopamine efflux produced by
50 ng intra-VTA morphine (Figure 3.9a). Initially scopolamine injections produced an increase
in dopamine oxidation current that peaked at 8.67 ± 0.88 minutes, followed by a decrease back to
baseline. The morphine injection was always done at 10 min, so during the descending portion of
this effect. In no case did the morphine injection at 10 min reverse the decrease produced by
scopolamine. In fact, the combination of intra-VTA scopolamine with morphine produced a
decrease in accumbal dopamine oxidation current of approximately 3 nA. Repeated-measures
ANOVA with drug pre-treatment (VTA scopolamine vs no pre-treatment) as the between-
subjects factor and time as the within-subjects factor revealed a significant interaction between
pre-treatment and time, F (306, 1836) = 7.76, p<0.00001, indicating that the temporal profile of
dopamine efflux varied as a function of VTA pre-treatment. Post-hoc analysis using Fischer’s
LSD test showed that starting at 40 min and all the way to 148 min, individual comparisons
showed significantly reduced accumbens dopamine efflux in mice pre-treated with scopolamine
235Figure 3.9. Effect of pre-treatment with 50 μg intra-VTA scopolamine on accumbal dopamine
efflux produced by 50 ng intra-VTA morphine in 129 wild-type mice. Solid, thick lines represent
average dopamine oxidation current across mice, and thin lines represent ± SEM. (A) Mean
change in dopamine oxidation current produced by 50 ng intra-VTA morphine following pre-
treatment with 50 μg intra-VTA scopolamine in wild-type mice (black line, n=4). For
comparison data from Figure 3.7a showing mean changes in accumbens dopamine efflux
produced by 50 ng intra-VTA morphine without any pre-treatment are reproduced (gray, n=4).
(B-E) Data from individual wild-type mice, whose average is shown in (A).
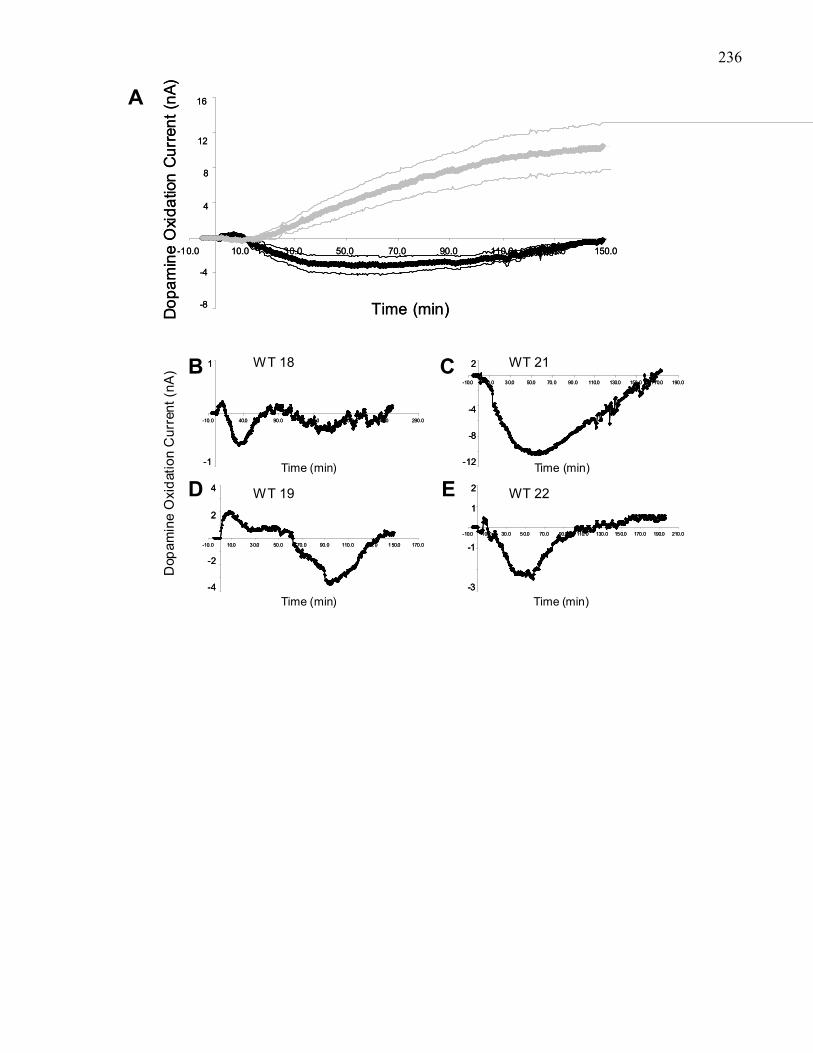
236
-10.0 40.0 90.0 140.0 190.0 240.0 290.0
1
-1
-10.0 40.0 90.0 140.0 190.0 240.0 290.0
1
-1
-10.0 10.0 30.0 50.0 70.0 90.0 110.0 130.0 150.0 170.0
2
4
-2
-4
-10.0 10.0 30.0 50.0 70.0 90.0 110.0 130.0 150.0 170.0
2
4
-2
-4
-10.0 10.0 30.0 50.0 70.0 90.0 110.0 130.0 150.0 170.0 190.0
-12
-8
-4
2
-10.0 10.0 30.0 50.0 70.0 90.0 110.0 130.0 150.0 170.0 190.0
-12
-8
-4
2
-10.0 10.0 30.0 50.0 70.0 90.0 110.0 130.0 150.0 170.0 190.0 210.0
-3
-1
2
1
-10.0 10.0 30.0 50.0 70.0 90.0 110.0 130.0 150.0 170.0 190.0 210.0
-3
-1
2
1
Dop
amin
e O
xida
tion
Cur
rent
(nA
)
Time (min)
Time (min)
Time (min)
Time (min)
A
B C
D E
WT 18
WT 19
WT 21
WT 22
Time (min)Dop
amin
e O
xida
tion
Cur
rent
(nA)
-10.0 10.0 30.0 50.0 70.0 90.0 110.0 130.0 150.0
16
12
8
4
-4
-8 Time (min)Dop
amin
e O
xida
tion
Cur
rent
(nA)
-10.0 10.0 30.0 50.0 70.0 90.0 110.0 130.0 150.0
16
12
8
4
-4
-8
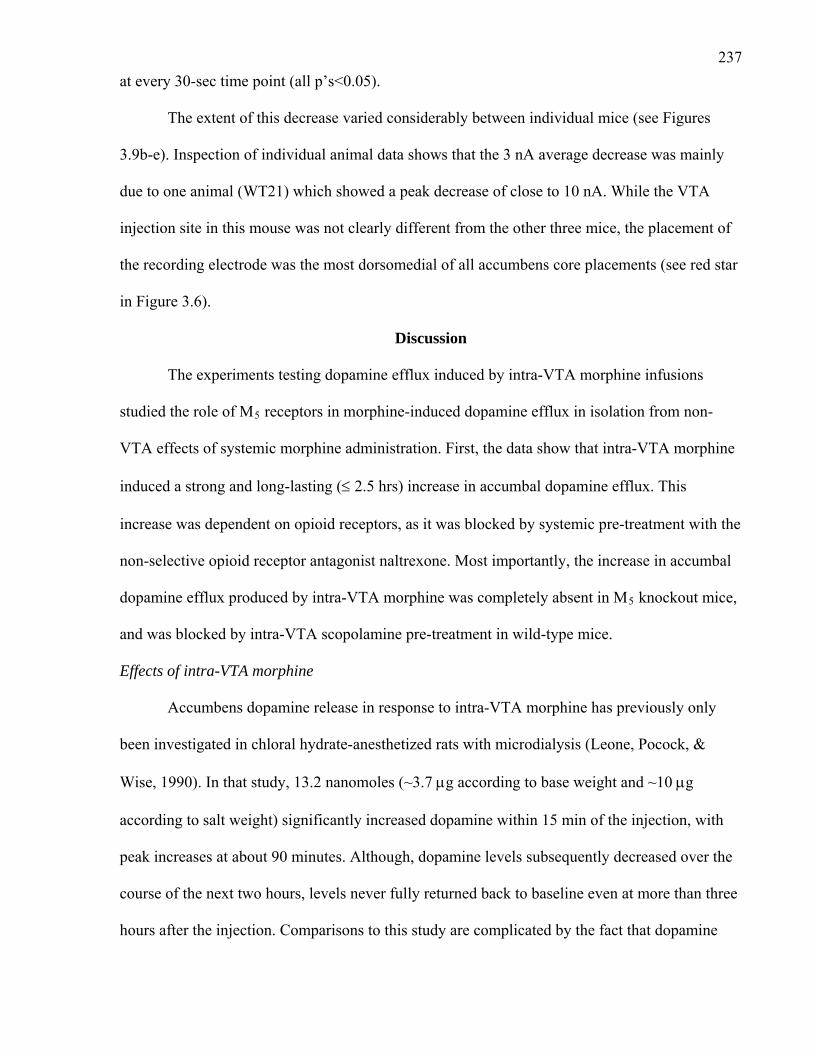
237at every 30-sec time point (all p’s<0.05).
The extent of this decrease varied considerably between individual mice (see Figures
3.9b-e). Inspection of individual animal data shows that the 3 nA average decrease was mainly
due to one animal (WT21) which showed a peak decrease of close to 10 nA. While the VTA
injection site in this mouse was not clearly different from the other three mice, the placement of
the recording electrode was the most dorsomedial of all accumbens core placements (see red star
in Figure 3.6).
Discussion
The experiments testing dopamine efflux induced by intra-VTA morphine infusions
studied the role of M5 receptors in morphine-induced dopamine efflux in isolation from non-
VTA effects of systemic morphine administration. First, the data show that intra-VTA morphine
induced a strong and long-lasting (≤ 2.5 hrs) increase in accumbal dopamine efflux. This
increase was dependent on opioid receptors, as it was blocked by systemic pre-treatment with the
non-selective opioid receptor antagonist naltrexone. Most importantly, the increase in accumbal
dopamine efflux produced by intra-VTA morphine was completely absent in M5 knockout mice,
and was blocked by intra-VTA scopolamine pre-treatment in wild-type mice.
Effects of intra-VTA morphine
Accumbens dopamine release in response to intra-VTA morphine has previously only
been investigated in chloral hydrate-anesthetized rats with microdialysis (Leone, Pocock, &
Wise, 1990). In that study, 13.2 nanomoles (~3.7 μg according to base weight and ~10 μg
according to salt weight) significantly increased dopamine within 15 min of the injection, with
peak increases at about 90 minutes. Although, dopamine levels subsequently decreased over the
course of the next two hours, levels never fully returned back to baseline even at more than three
hours after the injection. Comparisons to this study are complicated by the fact that dopamine
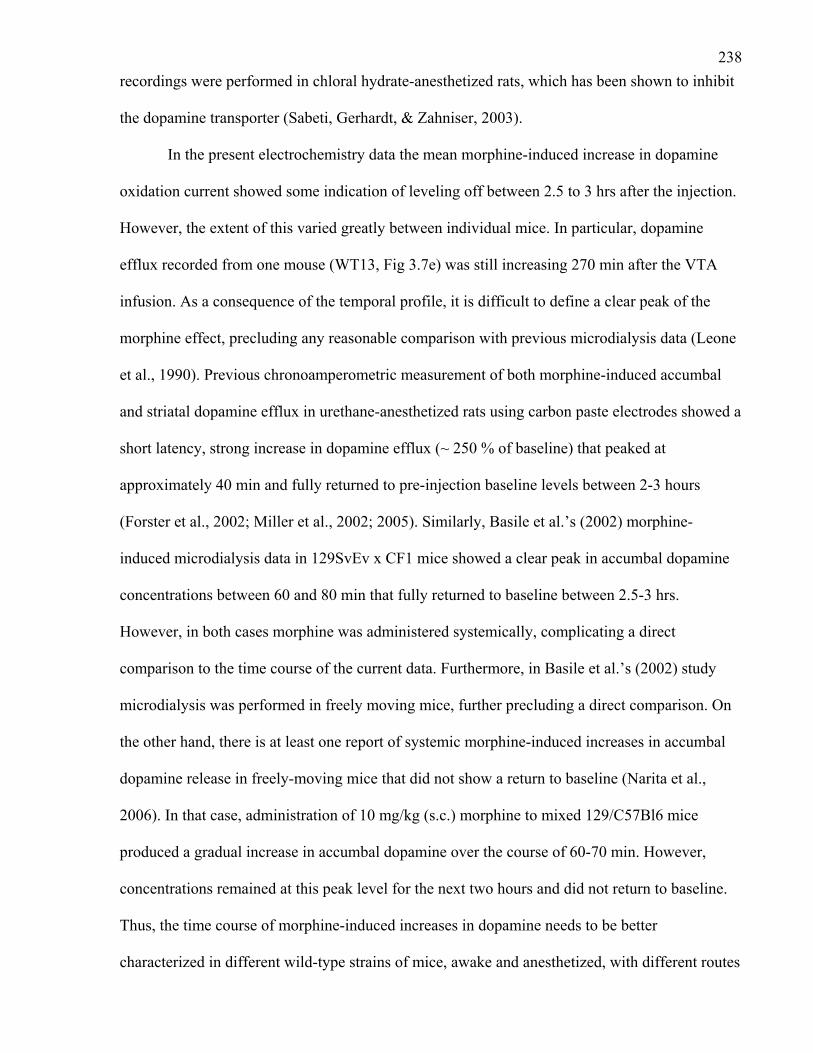
238recordings were performed in chloral hydrate-anesthetized rats, which has been shown to inhibit
the dopamine transporter (Sabeti, Gerhardt, & Zahniser, 2003).
In the present electrochemistry data the mean morphine-induced increase in dopamine
oxidation current showed some indication of leveling off between 2.5 to 3 hrs after the injection.
However, the extent of this varied greatly between individual mice. In particular, dopamine
efflux recorded from one mouse (WT13, Fig 3.7e) was still increasing 270 min after the VTA
infusion. As a consequence of the temporal profile, it is difficult to define a clear peak of the
morphine effect, precluding any reasonable comparison with previous microdialysis data (Leone
et al., 1990). Previous chronoamperometric measurement of both morphine-induced accumbal
and striatal dopamine efflux in urethane-anesthetized rats using carbon paste electrodes showed a
short latency, strong increase in dopamine efflux (~ 250 % of baseline) that peaked at
approximately 40 min and fully returned to pre-injection baseline levels between 2-3 hours
(Forster et al., 2002; Miller et al., 2002; 2005). Similarly, Basile et al.’s (2002) morphine-
induced microdialysis data in 129SvEv x CF1 mice showed a clear peak in accumbal dopamine
concentrations between 60 and 80 min that fully returned to baseline between 2.5-3 hrs.
However, in both cases morphine was administered systemically, complicating a direct
comparison to the time course of the current data. Furthermore, in Basile et al.’s (2002) study
microdialysis was performed in freely moving mice, further precluding a direct comparison. On
the other hand, there is at least one report of systemic morphine-induced increases in accumbal
dopamine release in freely-moving mice that did not show a return to baseline (Narita et al.,
2006). In that case, administration of 10 mg/kg (s.c.) morphine to mixed 129/C57Bl6 mice
produced a gradual increase in accumbal dopamine over the course of 60-70 min. However,
concentrations remained at this peak level for the next two hours and did not return to baseline.
Thus, the time course of morphine-induced increases in dopamine needs to be better
characterized in different wild-type strains of mice, awake and anesthetized, with different routes
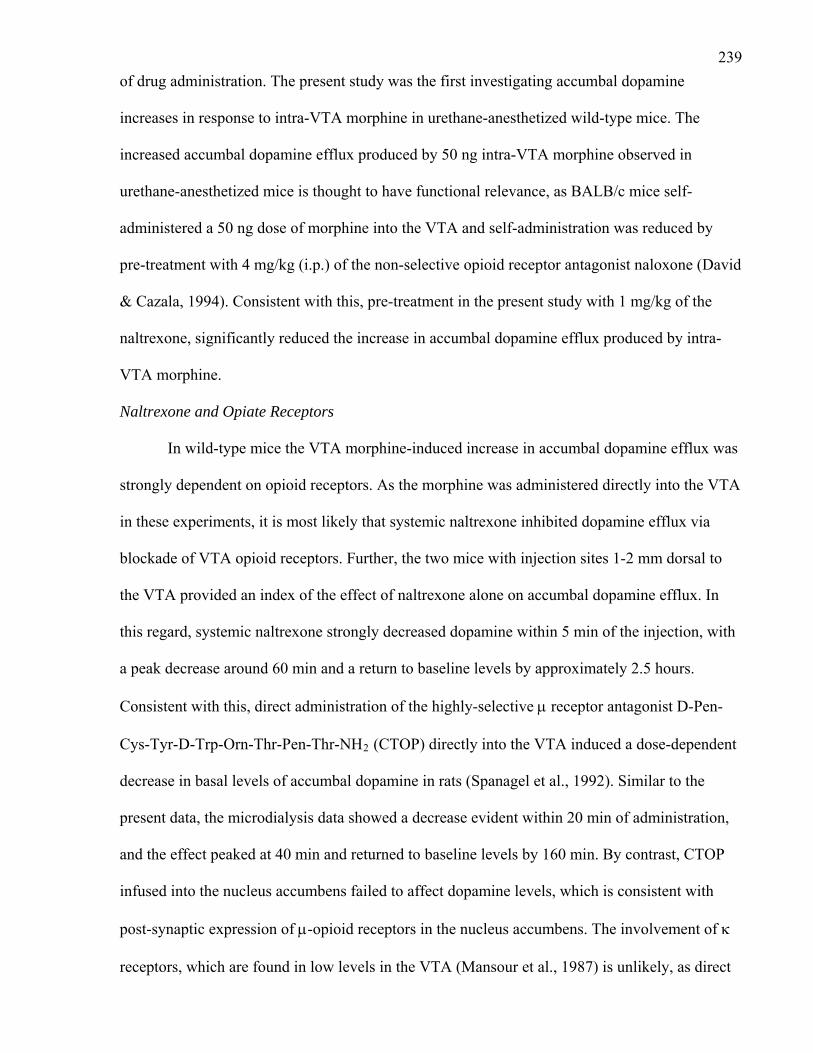
239of drug administration. The present study was the first investigating accumbal dopamine
increases in response to intra-VTA morphine in urethane-anesthetized wild-type mice. The
increased accumbal dopamine efflux produced by 50 ng intra-VTA morphine observed in
urethane-anesthetized mice is thought to have functional relevance, as BALB/c mice self-
administered a 50 ng dose of morphine into the VTA and self-administration was reduced by
pre-treatment with 4 mg/kg (i.p.) of the non-selective opioid receptor antagonist naloxone (David
& Cazala, 1994). Consistent with this, pre-treatment in the present study with 1 mg/kg of the
naltrexone, significantly reduced the increase in accumbal dopamine efflux produced by intra-
VTA morphine.
Naltrexone and Opiate Receptors
In wild-type mice the VTA morphine-induced increase in accumbal dopamine efflux was
strongly dependent on opioid receptors. As the morphine was administered directly into the VTA
in these experiments, it is most likely that systemic naltrexone inhibited dopamine efflux via
blockade of VTA opioid receptors. Further, the two mice with injection sites 1-2 mm dorsal to
the VTA provided an index of the effect of naltrexone alone on accumbal dopamine efflux. In
this regard, systemic naltrexone strongly decreased dopamine within 5 min of the injection, with
a peak decrease around 60 min and a return to baseline levels by approximately 2.5 hours.
Consistent with this, direct administration of the highly-selective μ receptor antagonist D-Pen-
Cys-Tyr-D-Trp-Orn-Thr-Pen-Thr-NH2 (CTOP) directly into the VTA induced a dose-dependent
decrease in basal levels of accumbal dopamine in rats (Spanagel et al., 1992). Similar to the
present data, the microdialysis data showed a decrease evident within 20 min of administration,
and the effect peaked at 40 min and returned to baseline levels by 160 min. By contrast, CTOP
infused into the nucleus accumbens failed to affect dopamine levels, which is consistent with
post-synaptic expression of μ-opioid receptors in the nucleus accumbens. The involvement of κ
receptors, which are found in low levels in the VTA (Mansour et al., 1987) is unlikely, as direct
240administration of the κ receptor antagonist norbinaltorphimine (nor-BNI) into the VTA did not
affect basal levels of accumbal dopamine, and administration of nor-BNI directly into the
nucleus accumbens served to dose-dependently increase accumbal dopamine levels (Spanagel et
al., 1992). Collectively, this suggests that the decrease in dopamine oxidation current produced
by systemic naltrexone, was most likely due to blockade of VTA μ opioid receptors, effectively
blocking tonically active endogenous opioid input (Spanagel et al., 1992). Remarkably, the same
dose of systemic naltrexone in a B6 wild-type mice decreased locomotion to below saline levels
between 60 and 120 min after the injection (see Experiment 2).
Therefore, naltrexone and intra-VTA morphine appeared to affect accumbal dopamine
via VTA opioid receptors. The combination of systemic naltrexone and intra-VTA morphine
produced a change in accumbal dopamine efflux that was intermediate to the two effects in
isolation. The VTA morphine injection prevented the full extent of the decrease in accumbal
dopamine oxidation current induced by naltrexone (i.e. 1 vs 4 nA, a 75% reduction), and the
naltrexone pre-treatment reduced the morphine-induced increase to below levels seen in mice
without any pre-treatment for the entire 2.5 hr testing period. This is what would be expected if
naltrexone and morphine were competing for access to the same VTA receptors.
With naltrexone pre-treatment, increases in accumbal dopamine efflux produced by
subsequent intra-VTA morphine infusion were completely blocked for the first 60 min and then
showed a gradual but significant increase above baseline levels over the course of the next 1.5
hrs. This result is consistent with the locomotion data obtained in Experiment 2, where pre-
treatment with 1mg/kg naltrexone in B6 wild-type mice completely blocked morphine-induced
locomotion for the first 90 min, but locomotion levels increased over the final 30 mins, a period
during which accumbal dopamine efflux was increasing. Thus, there is some suggestion that the
effect of intra-VTA morphine on accumbal dopamine efflux in urethane-anesthetized mice, and
241its dependence on opiate receptors, has functional significance for the effects of morphine on
locomotion in freely-moving mice.
M5 Knockout Mice
The increase in accumbal dopamine efflux produced by intra-VTA morphine in wild-type
mice was completely absent in M5 knockout mice, suggesting that the direct effects of VTA
morphine on the mesolimbic dopamine system are critically dependent on M5 receptors. In all
four M5 knockout mice tested, intra-VTA administration of morphine always decreased
accumbal dopamine efflux for 90 min, and then increased dopamine to above baseline levels for
the next 80 min. A direct comparison to the locomotion data obtained in 129 wild-type and M5
knockout mice is complicated, however. First, the relationship between accumbal dopamine
levels and locomotion produced by systemic morphine in 129 mice is weak (Murphy et al.,
2001). Second, locomotion obtained with 30 mg/kg (i.p.) morphine (the only dose to produce
effective locomotion in this strain) reflects the net effect of dopamine-dependent and dopamine-
independent mechanisms involved in morphine-induced locomotion, while intra-VTA opiate
administration produces dopamine-dependent locomotion (Kalivas et al., 1983). Nonetheless, the
chronoamperometry data suggests that the dopamine-dependent part of morphine-induced
locomotion, involving the action of opiates in the VTA on nucleus accumbens dopamine, is
strongly dependent on M5 muscarinic receptors. Accordingly, the residual morphine-induced
locomotion seen in M5 knockout mice should not involve dopamine-dependent effects in the
VTA. Ideally, accumbal dopamine efflux should be measured concurrently with locomotion, e.g.
using high-speed chronoamperometric (i.e. chronocoulometry) recordings in freely moving
animals (Kiyatkin et al., 1993). A better complement to the current experiments may be provided
by two additional experiments. First, to isolate the dopamine-dependent component of morphine-
induced locomotion, and to better understand the role of M5 receptors in this process, locomotion
in wild-type and M5 knockout mice should be measured in response to intra-VTA, rather than
242systemic, morphine. To the extent that accumbal dopamine levels are a predictor of morphine-
induced locomotion, the present chronoamperometry data suggest that morphine locomotion
produced by intra-VTA morphine would be strongly reduced, if not absent, in M5 knockout
mice. Second, the effects of dopamine receptor blockade in the nucleus accumbens on the
residual morphine-induced locomotion seen in M5 knockout mice need to be tested. Again, the
chronoamperometry data suggest that dopamine antagonism would be ineffective in further
reducing morphine-induced locomotion in M5 knockout mice.
VTA scopolamine
The effect of VTA scopolamine pre-treatment in blocking intra-VTA morphine-induced
increases in accumbal dopamine efflux in wild-type mice was similar to the reduced morphine-
induced increase in accumbal dopamine efflux observed in M5 knockout mice. On average,
scopolamine pre-treatment produced an initial increase in accumbens dopamine efflux that
peaked between 8-9 min and then decreased. Morphine infusion at 10 min, always on the
decreasing portion of the scopolamine effect, did not, by comparison to wild-type mice without
pre-treatment, significantly increase dopamine efflux. Thus, non-specific muscarinic antagonism
in the VTA blocked the increases in accumbal dopamine efflux associated with intra-VTA
administration of morphine. Although the magnitude of the decrease in accumbal dopamine
induced by the combination of VTA scopolamine and morphine varied, the decrease itself was
consistent across mice.
It is remarkable that the effects of pharmacological antagonism of VTA muscarinic
receptors and systemic deletion of M5 receptors were so similar. Both led to a decrease in
accumbal dopamine efflux in response to intra-VTA morphine of roughly the same magnitude,
suggesting that the VTA scopolamine effect in wild-type mice was primarily due to the blockade
of M5 muscarinic receptors. This supports the conclusion that the absence of accumbens
dopamine efflux in response to VTA morphine in M5 knockout mice is specifically due to a loss
243of M5 muscarinic receptors on midbrain dopamine neurons. What might then account for the
decrease in accumbal dopamine in each of these conditions? If, as suggested by the effects of
PPT lesions (Miller et al., 2002) and VTA scopolamine (Miller et al., 2005) in rats, cholinergic
input to the VTA is important in mediating accumbal dopamine increases, then the present data
suggest that cholinergic input to the VTA in M5 knockout mice result in an inhibition of the
mesolimbic dopamine system. This is consistent with the results from Experiment 3 where VTA
atropine and particularly mecamylamine potentiated locomotion produced by systemic morphine,
suggesting that each antagonist pre-treatment was removing an inhibitory cholinergic input to the
VTA in M5 knockout mice.
The VTA scopolamine effect in wild-type mice was interesting as well, but was not
studied in detail, as the combination of scopolamine with morphine was of primary interest.
Previous data on intra-VTA infusion of a much higher dose of scopolamine (200 μg) in rats
indicated that decreases in accumbal dopamine efflux occur within 5 min and return to baseline
by approximately 50 min. These data have been interpreted as reflecting blockade of direct M5-
mediated tonic excitatory cholinergic input to VTA dopamine neurons (Miller et al., 2005). At
the 200 μg dose of scopolamine, unlike the 50 μg dose used here, there was no indication of an
initial increase in accumbal dopamine efflux. Whether this discrepancy is reflective of a dose
effect or a species difference is not clear. Theoretically, the initial increase could be due to
pharmacological blockade of M4 receptors which would produce increased levels of VTA
acetylcholine that could, despite concurrent blockade of M5 receptors on dopamine neurons, still
increase accumbal dopamine through nicotinic receptors on VTA dopamine neurons.
Alternatively, blockade of M3 receptors located on GABA neurons, could indirectly increase
dopamine by blocking tonic excitatory cholinergic input to local GABA neurons. Accordingly,
the slower onset inhibition produced by the effect of scopolamine on M5 receptors would then
override the indirect M3-mediated excitation, resulting in a net decrease in dopamine efflux.
244Whether or not the initial increase induced by intra-VTA scopolamine in wild-type mice has any
functional significance is not clear. Infusion of the related muscarinic antagonist atropine into the
VTA of B6 wild-type mice induced only slight increases in locomotion, that were, if anything,
more evident at a time after the initial increase in accumbal dopamine efflux observed in 129
wild-type mice.
In conclusion, the present data show that increases in accumbal dopamine efflux induced
by intra-VTA morphine critically depend on functional M5 muscarinic receptors in the VTA. In
wild-type mice, intra-VTA morphine excites the mesolimbic dopamine system, resulting in
significant increases in accumbens dopamine efflux. On the other hand, inactivation of M5
receptors, either systemically via gene deletion or pharmacologically via scopolamine, resulted
in an inhibition of accumbal dopamine efflux in response to intra-VTA morphine via a non-M5
receptor-mediated mechanism.
245Chapter 3 References
Austin, M.C., & Kalivas, P.W. (1990). Dopaminergic involvement in locomotion elicited from
the ventral pallidum/substantia innominata. Brain Research, 542, 123-131.
Bals-Kubik, R., Ableitner, A., Herz, A., & Shippenberg, T. S. (1993). Neuroanatomical sites
mediating the motivational effects of opioids as mapped by the conditioned place
preference paradigm in rats. Journal of Pharmacology and Experimental Therapeutics,
264, 489-495.
Basile, A. S., Fedorova, I., Zapata, A., Liu, X., Shippenberg, T., Duttaroy, A., Yamada, M., &
Wess, J. (2002). Deletion of the M5 muscarinic acetylcholine receptor attenuates
morphine reinforcement and withdrawal but not morphine analgesia. Proceedings of the
National Academy of Sciences U S A, 99, 11452-11457.
Blaha, C. D. (1996). Evaluation of stearate-graphite paste electrodes for chronic measurement of
extracellular dopamine concentrations in the mammalian brain. Pharmacology
Biochemistry and Behavior, 55(3), 351-364.
Blaha, C.D., & Jung, M.E. (1991). Electrochemical evaluation of stearate-modified graphite
paste electrodes: selective detection of dopamine is maintained after exposure to brain
tissue. Journal of Electroanalytical Chemistry, 310, 317-334.
Blaha, C. D., & Phillips, A. G. (1996). A critical assessment of electrochemical procedures
applied to the measurement of dopamine and its metabolites during drug-induced and
species-typical behaviours. Behavioral Pharmacology, 7, 675-708.
Bozarth, M. A., & Wise, R. A. (1981). Intracranial self-administration of morphine into the
ventral tegmental area in rats. Life Sciences, 28, 551-555.
Buckley, N. J., Bonner, T. I., & Brann, M. R. (1988). Localization of a family of muscarinic
receptor mRNAs in rat brain. Journal of Neuroscience, 8, 4646-4652.
David, V., & Cazala, P. (1994). A comparative study of self-administration of morphine into the
246amygdala and the ventral tegmental area in mice. Behavioral Brain Research, 65, 205-
211.
Devine, D. P., & Wise, R. A. (1994). Self-administration of morphine, DAMGO, and DPDE into
the ventral tegmental area of rats. Journal of Neuroscience, 14, 1978-1984.
Di Ciano, P., Coury, A., Depoortere, R. Y., Egilmez, Y., Lane, J. D., Emmett-Oglesby, M. W.,
Lepiane, F., Phillips, A.G., & Blaha, C.D. (1995). Comparison of changes in extracellular
dopamine concentrations in the nucleus accumbens during intravenous self-
administration of cocaine or d-amphetamine. Behavioral Pharmacology, 6, 311-322.
Ferrari-DiLeo, G., Waelbroeck, M., Mash, D. C., & Flynn, D. D. (1994). Selective labeling and
localization of the m4 (m4) muscarinic receptor subtype. Molecular Pharmacology, 46,
1028-1035.
Forster, G. L., & Blaha, C. D. (2000). Laterodorsal tegmental stimulation elicits dopamine efflux
in the rat nucleus accumbens by activation of acetylcholine and glutamate receptors in the
ventral tegmental area. European Journal of Neuroscience, 12, 3596-3604.
Forster, G. L., & Blaha, C. D. (2003). Pedunculopontine tegmental stimulation evokes striatal
dopamine efflux by activation of acetylcholine and glutamate receptors in the midbrain
and pons of the rat. European Journal of Neuroscience, 17, 751-762.
Forster, G. L., Falcon, A. J., Miller, A. D., Heruc, G. A., & Blaha, C. D. (2002). Effects of
laterodorsal tegmentum excitotoxic lesions on behavioral and dopamine responses
evoked by morphine and d-amphetamine. Neuroscience, 114, 817-823.
Forster, G.L. Yeomans, J.S., Takeuchi, J., & Blaha, C.D. (2001). M5 muscarinic receptors are
required for prolonged accumbal dopamine release after electrical stimulation of the pons
in mice. Journal of Neuroscience, 22, RC190.
Gysling, K., & Wang, R. Y. (1983). Morphine-induced activation of A10 dopamine neurons in
the rat. Brain Research, 277, 119-127.
247Johnson, S. W., & North, R. A. (1992). Opioids excite dopamine neurons by hyperpolarization of
local interneurons. Journal of Neuroscience, 12, 483-488.
Kalivas, P. W., Widerlöv, E., Stanley, D., Breese, G., & Prange, A. J., Jr. (1983). Enkephalin
action on the mesolimbic system: A dopamine-dependent and a dopamine-independent
increase in locomotor activity. Journal of Pharmacology and Experimental Therapeutics,
227, 229-237.
Kiyatkin, E.A., & Gratton. A. (1994). Electrochemical monitoring of extracellular dopamine in
nucleus accumbens of rats lever-pressing for food. Brain Research, 652, 225-234.
Kiyatkin, E. A., Wise, R. A., & Gratton, A. (1993). Drug- and behavior-associated changes in
dopamine-related electrochemical signals during intravenous heroin self-administration
in rats. Synapse, 14, 60-72.
Klitenick, M.A., & Kalivas, P.W. (1994). Behavioral and neurochemical studies of opioid effects
in the pedunculopontine nucleus and mediodorsal thalamus. Journal of Pharmacology
and Experimental Therapeutics, 269, 437-448.
Leone, P., & Di Chiara, G. (1987). Blockade of D-1 receptors by SCH 23390 antagonizes
morphine- and amphetamine-induced place preference conditioning. European Journal of
Pharmacology, 135, 251-254.
Levey, A. I., Kitt, C. A., Simonds, W. F., Price, D. L., & Brann, M. R. (1991). Identification and
localization of muscarinic acetylcholine receptor proteins in brain with subtype-specific
antibodies. Journal of Neuroscience, 11, 3218-3226.
Mansour, A., Khachaturian, H., Lewis, M. E., Akil, H., & Watson, S. J. (1987).
Autoradiographic differentiation of mu, delta, and kappa opioid receptors in the rat
forebrain and midbrain. Journal of Neuroscience, 7, 2445-2464.
Matthews, R. T., & German, D. C. (1984). Electrophysiological evidence for excitation of rat
ventral tegmental area dopamine neurons by morphine. Neuroscience, 11, 617-625.
248Miller, A. D., Forster, G. L., Metcalf, K. M., & Blaha, C. D. (2002). Excitotoxic lesions of the
pedunculopontine nucleus differentially mediate morphine- and d-amphetamine-evoked
striatal dopamine efflux and behaviors. Neuroscience, 111, 351-362.
Miller, A. D., Forster, G. L., Yeomans, J. S., & Blaha, C. D. (2005). Midbrain muscarinic
receptors modulate morphine-induced accumbal and striatal dopamine efflux in the rat.
Neuroscience, 136, 531-538.
Murphy, N.P., Lam, H.A., & Maidment, N.T. (2001). A comparison of morphine-induced
locomotor activity and mesolimbic dopamine release in C57BL6, 129Sv and DBA2 mice.
Journal of Neurochemistry, 79, 626-635.
Nader, K., & van der Kooy, D. (1997). Deprivation state switches the neurobiological substrates
mediating opiate reward in the ventral tegmental area. Journal of Neuroscience, 17, 383-
390.
Narita, M., Nagumo, Y., Hashimoto, S., Narita, M., Khotib, J., Miyatake, M., Sakurai, T.,
Yanagisawa, M., Nakamachi, T., Shioda, S., & Suzuki, T. (2006). Direct involvement of
orexinergic systems in the activation of the mesolimbic dopamine pathway and related
behaviors induced by morphine. Journal of Neuroscience, 26, 398-405.
Olmstead, M. C., & Franklin, K. B. (1997). The development of a conditioned place preference
to morphine: Effects of microinjections into various CNS sites. Behavioural
Neuroscience, 111, 1324-1334.
Olmstead, M. C., Munn, E. M., Franklin, K. B., & Wise, R. A. (1998). Effects of
pedunculopontine tegmental nucleus lesions on responding for intravenous heroin under
different schedules of reinforcement. Journal of Neuroscience, 18, 5035-5044.
Paxinos, G., & Franklin, K.B.J. (2004). The mouse brain in stereotaxic coordinates. San Diego:
Academic Press.
249Pontieri, F.E., Tanda, G., & Di Chiara, G. (1995). Intravenous cocaine, morphine, and
amphetamine preferentially increase extracellular dopamine in the "shell" as compared
with the "core" of the rat nucleus accumbens. Proceedings of the National Academy of
Sciences U S A, 92, 12304-12308.
Phillips, A. G., & LePiane, F. G. (1980). Reinforcing effects of morphine microinjection into the
ventral tegmental area. Pharmacology Biochemistry and Behavior, 12, 965-968.
Sabeti, J., Gerhardt, G. A., & Zahniser, N. R. (2003). Chloral hydrate and ethanol, but not
urethane, alter the clearance of exogenous dopamine recorded by chronoamperometry in
striatum of unrestrained rats. Neuroscience Letters, 343, 9-12.
Spanagel, R., Herz, A., & Shippenberg, T. S. (1992). Opposing tonically active endogenous
opioid systems modulate the mesolimbic dopaminergic pathway. Proceedings of the
National Academy of Sciences U S A, 89, 2046-2050.
Takeuchi, J., Fulton, J., Jia, Z. P., Abramov-Newerly, W., Jamot, L., Sud, M., Coward. D.,
Ralph, M., & Yeomans, J. (2002). Increased drinking in mutant mice with truncated M5
muscarinic receptor genes. Pharmacology Biochemistry and Behavior, 72, 117-123.
Vilaro, M. T., Palacios, J. M., & Mengod, G. (1990). Localization of m5 muscarinic receptor
mRNA in rat brain examined by in situ hybridization histochemistry. Neuroscience
Letters, 114, 154-159.
Vilaro, M. T., Palacios, J. M., & Mengod, G. (1994). Multiplicity of muscarinic autoreceptor
subtypes? Comparison of the distribution of cholinergic cells and cells containing mrna
for five subtypes of muscarinic receptors in the rat brain. Molecular Brain Research, 21,
30-46.
Wei, J., Walton, E. A., Milici, A., & Buccafusco, J. J. (1994). m1-m5 muscarinic receptor
distribution in rat CNS by RT-PCR and HPLC. Journal of Neurochemistry, 63, 815-821.
Weiner, D. M., Levey, A. I., & Brann, M. R. (1990). Expression of muscarinic acetylcholine and
250dopamine receptor mRNAs in rat basal ganglia. Proceedings of the National Academy of
Sciences U S A, 87, 7050-7054.
Yamada, M., Lamping, K. G., Duttaroy, A., Zhang, W., Cui, Y., Bymaster, F. P., McKinzie,
D.L., Felder, C.C., Deng, C.X., Faraci, F.M., & Wess, J. (2001). Cholinergic dilation of
cerebral blood vessels is abolished in m(5) muscarinic acetylcholine receptor knockout
mice. Proceedings of the National Academy of Sciences U S A, 98, 14096-14101.
Yeomans, J. S., Maidment, N. T., & Bunney, B. S. (1988). Excitability properties of medial
forebrain bundle axons of A9 and A10 dopamine cells. Brain Research, 450, 86-93.
Yeomans, J. S., Takeuchi, J., Baptista, M., Flynn, D. D., Lepik, K., Nobrega, J., Fulton, J., &
Ralph, M.R. (2000). Brain-stimulation reward thresholds raised by an antisense
oligonucleotide for the M5 muscarinic receptor infused near dopamine cells. Journal of
Neuroscience, 20, 8861-8867.
Zangen, A., Ikemoto, S., Zadina, J. E., & Wise, R. A. (2002). Rewarding and psychomotor
stimulant effects of endomorphin-1: Anteroposterior differences within the ventral
tegmental area and lack of effect in nucleus accumbens. Journal of Neuroscience, 22,
7225-7233.
Zhang, W., Yamada, M., Gomeza, J., Basile, A. S., & Wess, J. (2002). Multiple muscarinic
acetylcholine receptor subtypes modulate striatal dopamine release, as studied with m1-
m5 muscarinic receptor knock-out mice. Journal of Neuroscience, 22, 6347-6352.
Zocchi, A., Girlanda, E., Varnier, G., Sartori, I., Zanetti, L., Wildish, G.A., Lennon, M.,
Mugnaini, M., & Heidbreder, C.A. (2005). Dopamine responsiveness to drugs of abuse: a
shell-core investigation in the nucleus accumbens of the mouse. Synapse, 50, 293-302.
251
Chapter 4: Morphine conditioned-place preference in M5 knockout mice
252Introduction
Conditioned place preference (CPP) is a paradigm that allows assessment of both the
rewarding and aversive properties of drugs (Tzschentke, 1998). When a primary reinforcer, such
as morphine, is paired with neutral stimuli, such as the contextual cues of a chamber, the stimuli
acquire secondary reinforcing properties through Pavlovian conditioning principles.
Subsequently, when the animal is exposed to the contextual stimuli in a drug-free state, their
secondary reinforcing properties elicit approach responses. When the animal spends more time in
the drug-paired context than in an alternate context, it has acquired a conditioned place
preference (Bardo, Rowlett, & Harris, 1995).
While many different apparatus configurations are used to study CPP, they all share the
basic principle of pairing an experimenter-administered reward with contextual stimuli. Most
commonly, these involve visual (e.g. wall shadings or stripes), and tactile (e.g. floor texture)
stimuli, although in many studies a distinct odor cue is also added. There is also a second,
alternate environment, characterized by its own combination of contextual stimuli (i.e. different
walls, floor texture, and odor) which is paired with experimenter-administered saline or reward.
Pairings of drug and saline with their distinct contexts are repeated several times across days.
Carr, Fibiger, and Philips (1989) reviewed several advantages of CPP over self-
administration. These include 1) sensitivity to lower doses of drug (obtaining CPP with as little
as one drug pairing), 2) the opportunity to measure both rewarding and aversive properties of a
drug, 3) testing in a drug-free state, 4) control of drug dosing (unlike self-administration), and 5)
that no surgery is required. Bardo and Bevins (2000) add that locomotor activity can be
concurrently measured, to assess the association between drug reward and locomotor activation
(Wise & Bozarth, 1987).
CPP has been criticized for its lack of dose-effect curves, as would be obtained in a self-
administration paradigm (Wise, 1989). Place preference appears to be all-or-none rather than
253graded, with a particular threshold dose above which effect size does not show any additional
benefit from higher doses. For example, in the case of morphine place preference in C57Bl/6
mice, Dockstader and van der Kooy (2001) found that the amount of place preference with 1 or
10 mg/kg was identical.
Bias is another source of criticism in CPP experiments. In the case of an apparatus bias,
the animal shows a baseline preference for one context over the other, already prior to
conditioning. Related to this, if during conditioning the reward is paired with the initially less
preferred chamber, then a conditioning bias also exists. These are both important methodological
considerations that have been acknowledged in several reviews (Bardo & Bevins, 2000; Bardo et
al., 1995; Tzschentke, 1998). To illustrate the potential effect of these biases, Cunningham,
Ferree, & Howard (2003) showed that with an apparatus purposely configured to create a
baseline preference, place conditioning was only apparent when ethanol was paired with the
initially less preferred chamber in DBA mice. In the case of opiates, Heinrichs and Martinez
(1986) found that pairing the peripherally acting opioid [Leu]-enkephalin with the initially less
preferred chamber produced reliable place preference, while pairing with the initially preferred
side produced significant place aversion.
A biased conditioning procedure is undesirable because it adds confounds in interpreting
results. First, there are alternative interpretations that come into play when the drug is paired
with an initially aversive environment and a significant increase in the amount of time spent in
that environment is observed after conditioning. If the drug has anxiolytic properties, then it may
decrease aversion to the less preferred chamber so that the animal develops a place preference
for the anxiolytic rather than the purely rewarding properties of the drug (Carr et al., 1989). In
other words, the biased conditioning procedure increases the probability of a false positive
(Tzschentke, 1998; Bardo & Bevins, 2000; Cunningham et al. 2003). Conversely, pairing of the
drug with the already preferred chamber may result in a lack of observable place preference due
254to an inability to measure it. Bozarth (1987) argues this is essentially a ceiling effect, rather than
a lack of the drugs’ rewarding efficacy. In either case, the experimenter faces a dilemma. On the
one hand, to maximize overall place preference, the drug could be paired with the non-preferred
chamber, resulting in interpretation issues. On the other hand, the drug could be paired with the
preferred chamber, probably resulting in a lack of observable effect. Side stepping these issues
by choosing to only analyze animals that have no baseline preference is not ideal either. For one
it is a selection strategy in which only certain animals from each group are included for analysis,
which may not be representative of the population response. Testing very large numbers of
animals may not be a reasonable choice either.
Conditioned place preference has been demonstrated for all of the major drugs of abuse,
including stimulants, opiates, nicotine, and ethanol (for a review see Tzschentke, 1996). CPP has
also been used to study the rewarding properties of food (Bechara et al., 1992) and sex (Kippin
& van der Kooy, 2003). In the case of opiate place preference, support for a role of cholinergic
receptors comes from two studies. First, Rezayof et al. (2007) found that VTA pre-treatment
with the muscarinic agonist atropine, and to a lesser extent the nicotinic receptor antagonist
mecamylamine, dose-dependently reduced morphine place preference in rats. Furthermore, place
preference could be induced for sub-threshold doses of morphine by VTA pre-treatment with the
cholinesterase inhibitor physostigmine. Carbachol infused into the VTA also induced place
preference in rats (Yeomans, Kofman, & McFarlane, 1985). Second, M5 knockout mice showed
almost a complete absence of morphine place preference at many doses (2.5 to 25 mg/kg, i.p.)
(Basile et al. 2002).
A reduction of morphine place preference due to either pharmacological blockade of
VTA muscarinic receptors or systemic M5 knockout is consistent with the reduction in
morphine-induced locomotion due to the same two manipulation (see Chapter 1), and provides
additional support for the importance of M5 receptors in mediating the effects of systemic
255morphine. Basile et al. (2002) maintained their M5 knockout mice on either an isogenic 129SvEv
or a mixed 129SvEv x CF1 background. Their 129 mice should be similar to the 129SvJ x CD1
mice used in the current studies. Thus, the goal here was to replicate the results of Basile et al.
(2002) in 129SvJ x CD1 M5 knockout mice, and second to test whether M5 knockout mice on a
B6 background show a similar phenotype.
Experiment 6: Morphine Conditioned Place Perference in 129 and B6 wild-type and M5
knockout mice
Materials and Methods
Mice
A total of 53 male B6 (28 wild-type and 25 M5 knockout) and 34 male 129 (17 wild-type
and 17 M5 knockout) mice were used in place preference experiments.
CPP testing apparatus
The testing room was illuminated by one 40-watt red light bulb facing a wall away from
the conditioned place preference (CPP) testing apparatus. This was done to avoid direct exposure
of the largely Plexiglas constructed testing apparatus to direct light, which would have created
shadows and reflections. The arrangement also resulted in light levels that were comparable
between the black (approx. 2.25 lux) and white (approx 2.1 lux) compartments of the CPP testing
apparatus.
In the course of these experiments the configuration of the place preference apparatus
was changed, resulting in two slightly different configurations. The original was a replica of that
used by Dockstader et al. (2001) and Dockstader and van der Kooy (2001), and will be referred
to as the “van der Kooy Apparatus”. The second was a hybrid, incorporating aspects of the
design and procedure of both Dockstader and van der Kooy (2001) and Basile et al. (2002). This
apparatus will be referred to as the “Steidl Apparatus”.
256 In either case, the apparatus was entirely constructed of Plexiglas, and consisted of two
chambers that differed in colour and texture, each measuring 15 x 15 x 15 cm. In the case of the
van der Kooy Apparatus, one chamber was painted black and had a smooth Plexiglas floor, while
the other environment was painted white and had a wire mesh floor. A removable guillotine
door, painted white on one side and black on the other, separated the two compartments. With
this apparatus, the divider wall was kept in place during conditioning to confine the mouse to one
side, but removed during habituation, baseline and preference testing, allowing free access to
both environments. In the case of the Steidl Apparatus, one environment was painted black and
had a smooth Plexiglas floor, while the other environment was painted white and had a white
floor insert made from acrylic material, normally used as a light diffuser for fluorescent fixtures,
creating a bumpy floor. With this apparatus a solid divider wall was used during conditioning,
while during habituation, baseline and preference testing a divider wall with a square hole cut
into it (3.5 x 3.5 cm) was used, allowing the mouse to move between the two environments. Up
to 12 mice were run at a time, and videotaped by a camera mounted above the testing apparatus
(Samsung, Model SCD 67, and later Panasonic, Model # WV-CP484). The amount of time spent
in each environment was assessed by manually scoring video recordings. Time spent in one
environment over the other was defined as all four paws being in that environment.
Conditioned place preference
In all experiments, mice were moved from their housing room to the adjacent testing
room 20 minutes prior to the initiation of testing, to allow for acclimatization to the testing room.
One week prior to baseline preference testing, mice were subjected to a 20-min habituation
session during which they could freely explore the CPP apparatus. During both habituation and
the baseline preference test (15 min) one week later, mice were placed into either the white or
black chamber in a counterbalanced manner, and allowed free access to the entire apparatus. On
the 8 conditioning days, wild-type and M5 knockout mice were injected with saline (10 ml/kg,
257i.p.) or morphine (1, 3, or 10 mg/kg, i.p.) and immediately placed into one of the two
conditioning environments for 15 min. To avoid a conditioning bias, pairing of drug with either
the black or white chamber was counterbalanced across mice. Wild-type and M5 knockout mice
were always run together in groups (e.g. 6 wild-type and 6 M5 knockout mice) with half the mice
receiving saline on conditioning days 1, 3, 5, 7 and morphine on conditioning days 2, 4, 6, 8, and
the other half receiving saline on conditioning days 2, 4, 6, 8 and morphine on conditioning days
1, 3, 5, 7. Twenty-four hours after the final conditioning session (i.e. day 9), the preference test
was conducted. Here, mice were again given free access to the entire apparatus for 15 min and
the proportion of time spent in each environment was measured. For the preference test, mice
were always initially placed into the saline-paired chamber.
Data Analysis
Amount of time spent in each chamber during baseline and preference testing (the
habituation session was not scored) was expressed as a percentage of the entire testing period.
The change in the percentage of time in the morphine-paired chamber was calculated by
subtracting the percentage of time spent in the morphine-paired chamber during the baseline test
from the percentage of time spent in the morphine-paired chamber during the preference test.
Accordingly, a positive percent change value represents development of a preference for the
morphine-paired over the saline-paired chamber over the course of conditioning, while a
negative percent change value represents development of an aversion for the morphine-paired
chamber.
Results
van der Kooy Apparatus
Figure 4.1 shows morphine conditioned place preference data across three doses
(1, 3, and 10 mg/kg, i.p.) in B6 wild-type and M5 knockout mice using the van der Kooy
Apparatus. The data were analyzed in two ways. First, in order to assess whether the percent

258Figure 4.1. Morphine conditioned place preference in B6 wild-type (+/+) and M5 knockout (-/-)
mice at 1, 3, and 10 mg/kg (i.p.) morphine using the van der Kooy Apparatus (n’s: B6 1 mg/kg
n=7, 3 mg/kg n=8, 10 mg/kg n=7; M5 knockout 1mg/kg n=7, 3 mg/kg n=5, 10 mg/kg n=7). ∗
p<0.05 one-sample t-test vs zero; † p<0.05 wild-type vs M5 knockout.
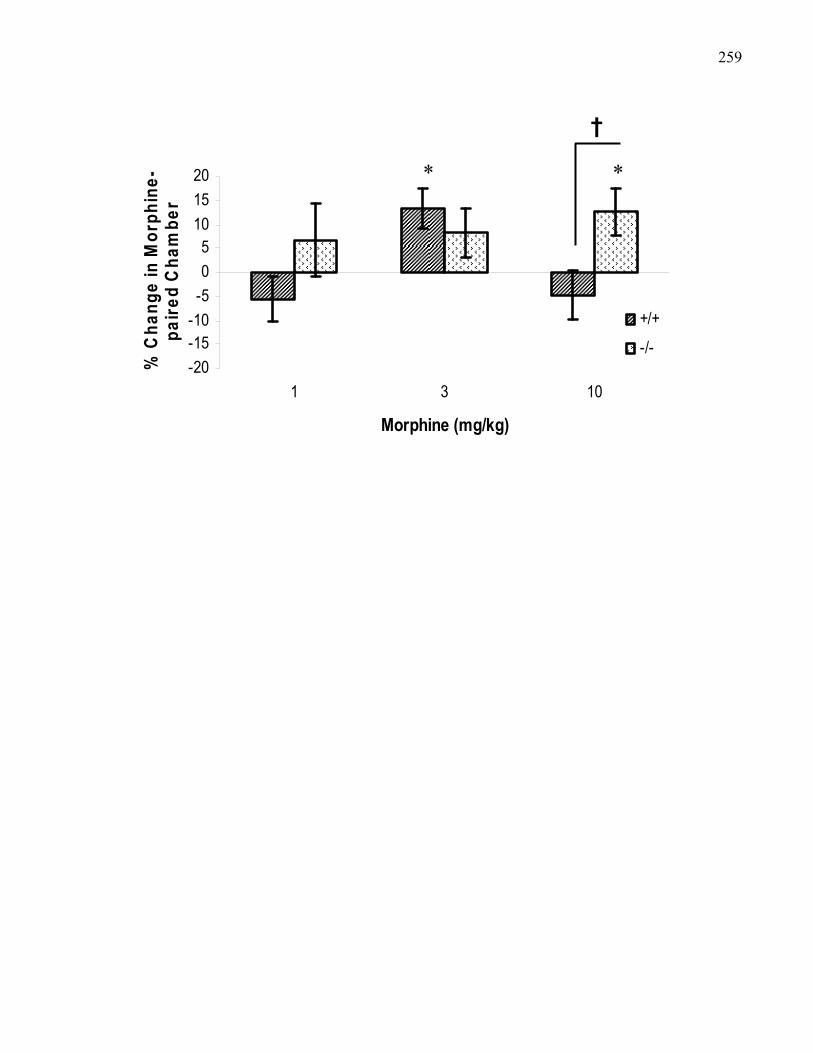
259
-20-15-10-505
101520
1 3 10
Morphine (mg/kg)
% C
hang
e in
Mor
phin
e-pa
ired
Cha
mbe
r
+/+
-/-
∗ ∗
†
260change in preference for the morphine-paired chamber across conditioning (positive or negative)
was significantly different from zero, mean percent change was analyzed using a one-sample t-
test. This showed that morphine conditioned-place preference was not consistently achieved
across doses in either genotype. In B6 wild-type mice, the percent change was significantly
different from zero only at the 3 mg/kg (p<0.05), but not at either the 1 mg/kg (p>0.2) or 10
mg/kg (p>0.3) dose. In M5 knockout mice, the percent change was significantly different from
zero at the 10 mg/kg (p<0.05), but not at the 1mg/kg (p>0.4) or 3 mg/kg (p>0.1) dose. Second,
the percent change score between wild-type and M5 knockout mice at each dose was compared
with an independent samples t-test. Not surprisingly, at the 1 mg/kg dose, where neither
genotype showed evidence of developing significant place preference, there was no significant
difference between wild-type and M5 knockout mice, t(12) = 1.36, p>0.1. At the 3 mg/kg dose,
although only B6 wild-type mice showed significant place preference, the difference relative to
M5 knockout mice was not statistically significant, t(11) = 0.76, p>0.4. Finally at the 10 mg/kg
dose, where only M5 knockout mice showed significant place preference, there was a statistically
significant difference between wild-type and M5 knockout mice, t(12) = 2.45, p<0.05. However,
the direction of this difference, with place preference only in M5 knockout mice, was opposite to
what was predicted.
Baseline preferences
Both wild-type and M5 knockout mice overall spent approximately equal amounts of
time in the morphine- and saline-paired chambers (Figure 4.2a). Inspection of individual mice,
however, revealed a different picture (Figure 4.2b). While the overall arithmetic mean of
baseline preferences was close to 50%, individual mice had baseline preferences as low as 10-
20% and as high as 80-90%. Thus, in many cases the drug was paired with the context for which
the mouse expressed a baseline aversion, and conversely in many cases the drug was paired with
the environment for which the mouse already expressed a strong preference.
261Figure 4.2. Baseline preferences of B6 wild-type (+/+) and M5 knockout (-/-) mice used in
morphine place preference experiments collapsed across doses using the van der Kooy
Apparatus. (A) Overall baseline preference for the morphine-paired chamber in wild-type and
M5 knockout mice (B6 n=22, M5 knockout n=19). (B) Baseline preferences in individual wild-
type and M5 knockout mice (n’s are as above for A). Dashed lines mark 40 and 60% baseline
preferences.
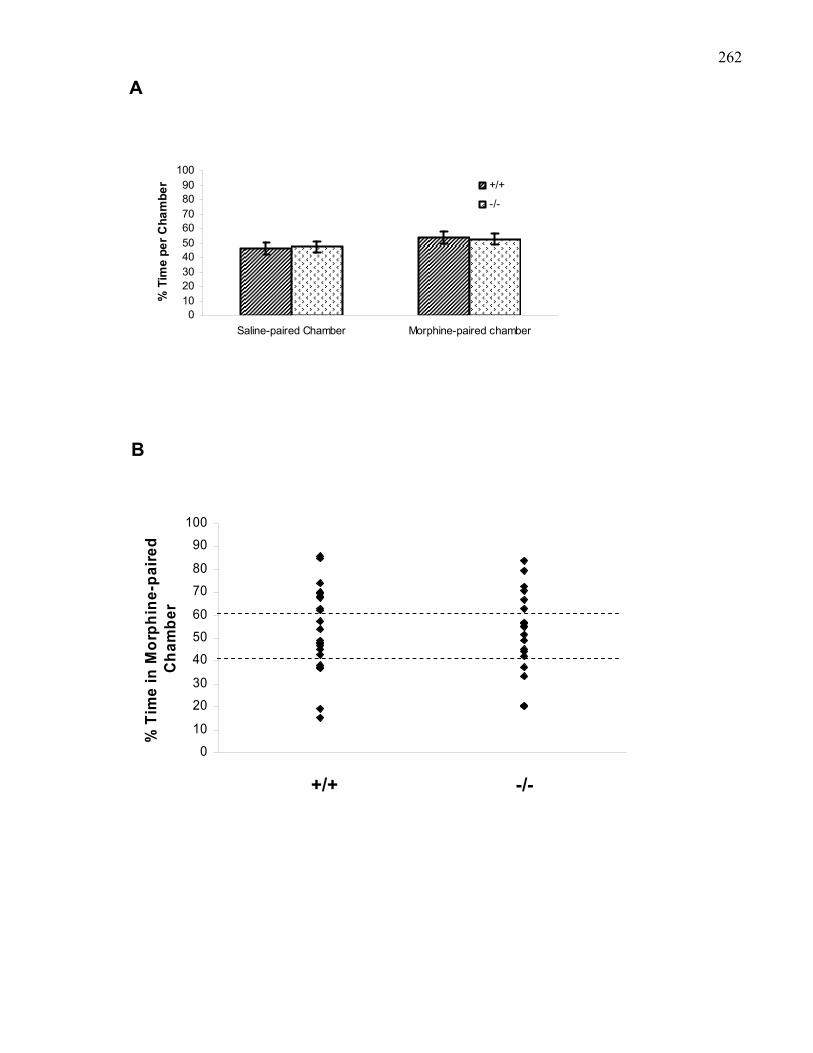
262
B
0
10
20
30
40
50
60
70
80
90
100
% T
ime
in M
orph
ine-
paire
d C
ham
ber
+/+ -/-
A
0102030405060708090
100
Saline-paired Chamber Morphine-paired chamber
% T
ime
per C
ham
ber +/+
-/-
263Steidl Apparatus
Both B6 and 129 wild-type and M5 knockout mice were tested for morphine conditioned
place preference with this apparatus. B6 mice were tested first, using a dose of 3 mg/kg, as the
data obtained in similar mice at this dose with the van der Kooy Apparatus suggested that this
dose was most effective in producing place preference in B6 wild-type mice. 129 mice were
subsequently tested with a 10 mg/kg dose of morphine. Here the choice was based on learning
that, at least within the context of morphine-induced locomotion (Experiment 1), sensitivity to
morphine was reduced in the 129 relative to B6 mice.
B6 mice.
Figure 4.3a shows 3 mg/kg morphine conditioned place preference in B6 wild-type and
M5 knockout mice. The percent change in preference for the morphine-paired chamber was
significantly different from zero for B6 wild-type mice (t(5) = 2.64, p<0.05), but not for M5
knockout mice (t(5) = 1.07, p>0.3), while wild-type and knockout mice were not significantly
different from each other, t(10) = 0.1, p>0.9.
B6 Baseline Preferences.
Analysis of individual baseline preferences revealed results similar to what was seen with
the van der Kooy Apparatus. Overall, both wild-type (52.18 ± 5.2%) and M5 knockout (45.17 ±
7.88) mice showed no preference for either the morphine-paired or saline-paired chamber, but
individual mice showed considerable variability (Figure 4.3b).
129 mice.
Figure 4.4a shows 10 mg/kg morphine conditioned place preference in 129 wild-type and
M5 knockout mice. The percent change in preference for the morphine-paired chamber was not
significantly different from zero for either wild-type mice (t(11) = 0.01, p<0.9) or M5 knockout
mice (t(11) = 0.65, p>0.5), and wild-type and knockout mice were not significantly different
from each other, t(22) = 0.33, p>0.7.

264Figure 4.3. Morphine-induced place preference (3 mg/kg, i.p) in B6 wild-type (+/+) and M5
knockout (-/-) mice using the Steidl Apparatus. (A) 3mg/kg (i.p) morphine conditioned place
preference in B6 wild-type (n=6) and M5 knockout (n=6) mice. (B) Baseline preferences for the
morphine-paired chamber in individual wild-type and M5 knockout mice (n=6 per group).
Dashed lines mark 40 and 60% baseline preferences.
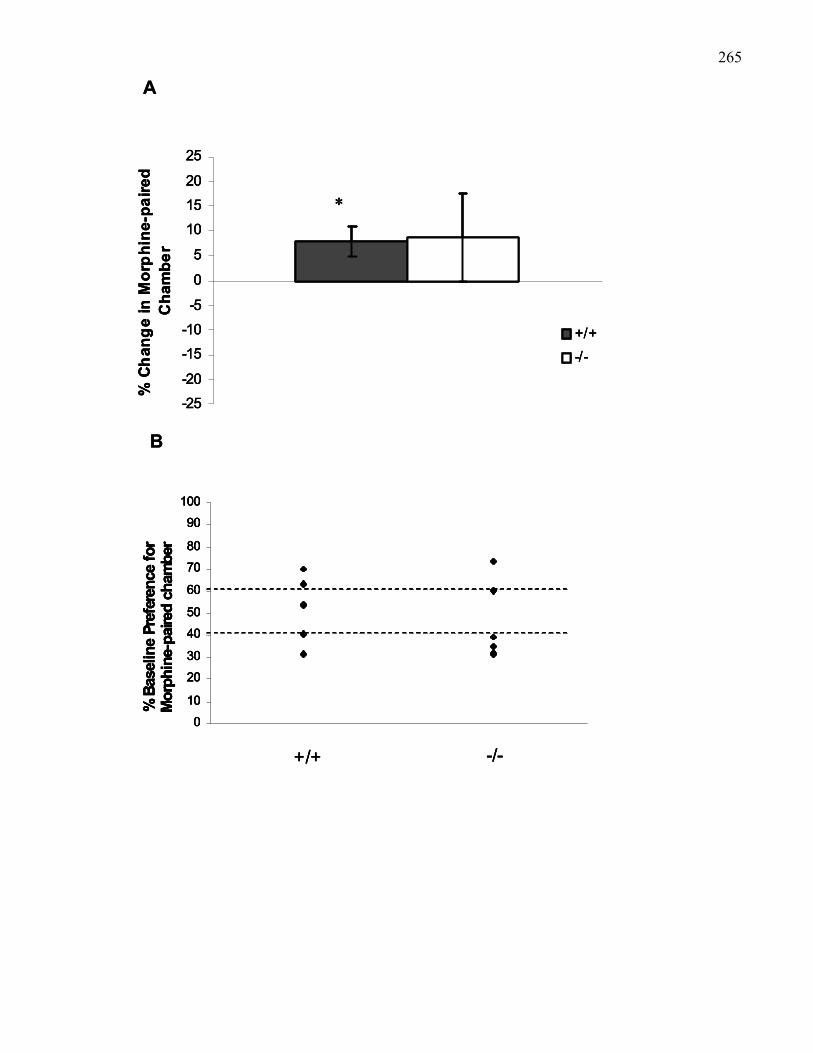
265
-25
-20
-15
-10
-5
0
5
10
15
20
25%
Cha
nge
in M
orph
ine-
paire
d C
ham
ber
+/+-/-
∗
A
-25
-20
-15
-10
-5
0
5
10
15
20
25%
Cha
nge
in M
orph
ine-
paire
d C
ham
ber
+/+-/-
∗
-25
-20
-15
-10
-5
0
5
10
15
20
25%
Cha
nge
in M
orph
ine-
paire
d C
ham
ber
+/+-/-
∗
A
0
10
20
30
40
50
60
70
80
90
100
% B
asel
ine
Pref
eren
ce fo
r M
orph
ine-
paire
d ch
ambe
r
+/+ -/-
B
0
10
20
30
40
50
60
70
80
90
100
% B
asel
ine
Pref
eren
ce fo
r M
orph
ine-
paire
d ch
ambe
r
+/+ -/-
0
10
20
30
40
50
60
70
80
90
100
% B
asel
ine
Pref
eren
ce fo
r M
orph
ine-
paire
d ch
ambe
r
0
10
20
30
40
50
60
70
80
90
100
% B
asel
ine
Pref
eren
ce fo
r M
orph
ine-
paire
d ch
ambe
r
+/+ -/-
B
266Figure 4.4. Morphine-induced place preference (10 mg/kg, i.p) in 129 wild-type (+/+) and M5
knockout (-/-) mice using the Steidl Apparatus. (A) 10 mg/kg (i.p) morphine conditioned place
preference in 129 wild-type (n=12) and M5 knockout (n=12) mice. (B) Baseline preferences for
the morphine-paired chamber in individual wild-type and M5 knockout mice (n=12 per group).
Dashed lines mark 40 and 60% baseline preferences.
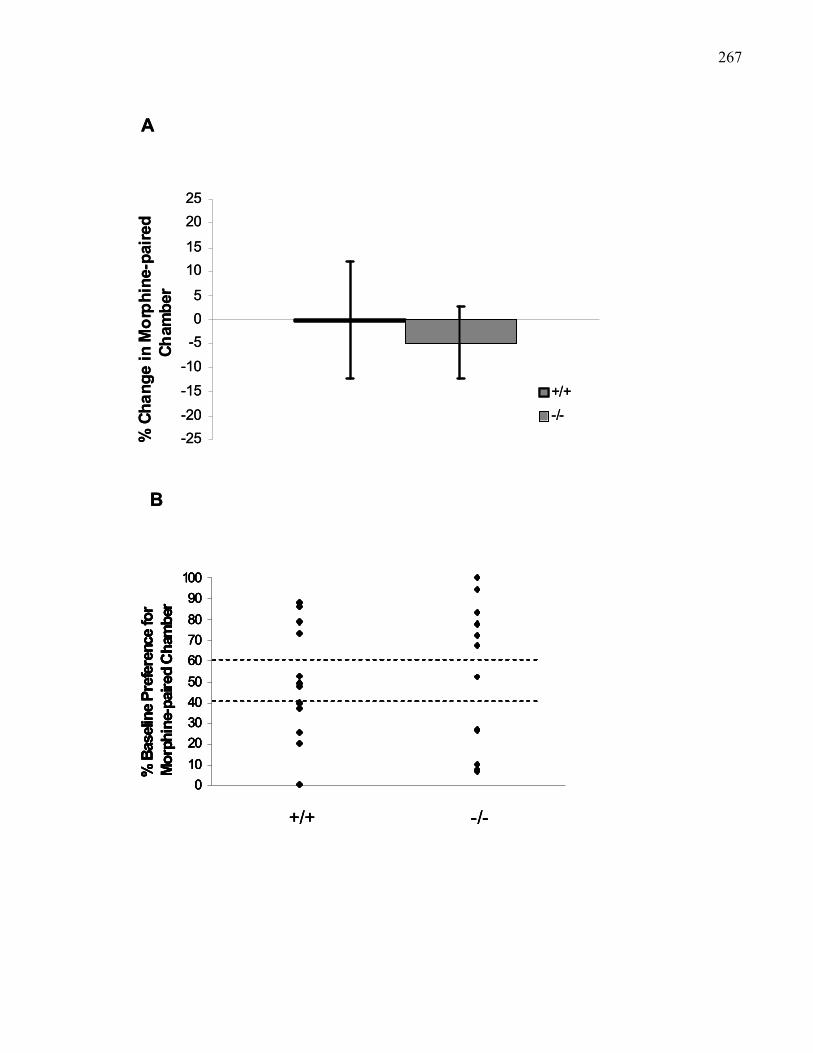
267
-25-20
-15-10
-505
1015
2025
% C
hang
e in
Mor
phin
e-pa
ired
Cham
ber
+/+-/-
A
-25-20
-15-10
-505
1015
2025
% C
hang
e in
Mor
phin
e-pa
ired
Cham
ber
+/+-/-
A
+/+ -/-
0102030405060708090
100
% B
aseli
ne P
refe
renc
e fo
r M
orph
ine-
paire
d Ch
ambe
r
B
+/+ -/-
0102030405060708090
100
% B
aseli
ne P
refe
renc
e fo
r M
orph
ine-
paire
d Ch
ambe
r
+/+ -/-
0102030405060708090
100
% B
aseli
ne P
refe
renc
e fo
r M
orph
ine-
paire
d Ch
ambe
r
0102030405060708090
100
% B
aseli
ne P
refe
renc
e fo
r M
orph
ine-
paire
d Ch
ambe
r
B
268129 Baseline Preferences.
Consistent with analysis of previous place preference data, in 129 mice tested with 10
mg/kg morphine overall baseline preference for the morphine-paired chamber was close to 50%
in both wild-type (50.01 ± 7.94%) and M5 knockout (52.23 ± 10.07%) mice, but individual mice
showed considerable variation in baseline preferences (Figures 4.4b).
Trial Duration in 129 mice.
In an attempt to improve morphine place preference data, an additional group of 129
wild-type and M5 knockout mice was run at the 10 mg/kg dose with the conditioning trials
extended to 30 minutes.
Figure 4.5a shows conditioned place preference in this group of mice. In neither wild-
type (t(5) = 1.2, p>0.2), nor M5 knockout (t(5) = 1.23, p>0.2) mice was the change in preference
for the morphine-paired chamber significantly different from zero. In this group of mice there
was an overall trend of a baseline preference for the saline-paired chamber in wild-type (34.87 ±
14.92%) but not M5 knockout mice (52.46 ± 10.25%). Individual mice, again, showed variation
in baseline preference (Figure 4.5b).
269Figure 4.5. Morphine-induced place preference (10 mg/kg, i.p) in 129 wild-type (+/+) and M5
knockout (-/-) mice using the Steidl Apparatus with 30-min conditioning trials. (A) 10 mg/kg
(i.p) morphine conditioned place preference in 129 wild-type (n=6) and M5 knockout (n=6)
mice. (B) Baseline preferences for the morphine-paired chamber in individual wild-type and M5
knockout mice (n=6 per group). Dashed lines mark 40 and 60% baseline preferences.
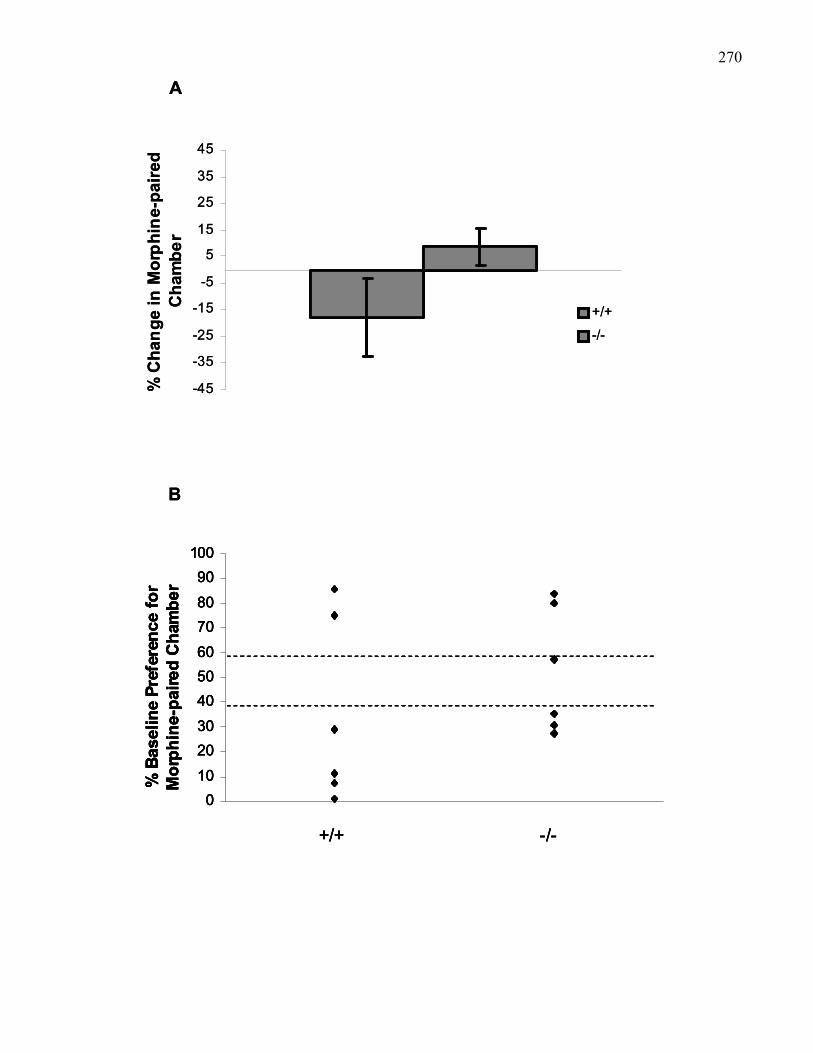
270
-45
-35
-25
-15
-5
5
15
25
35
45%
Cha
nge
in M
orph
ine-
paire
d C
ham
ber
+/+
-/-
A
-45
-35
-25
-15
-5
5
15
25
35
45%
Cha
nge
in M
orph
ine-
paire
d C
ham
ber
+/+
-/-
A
B
010
2030
405060
7080
90100
% B
asel
ine
Pref
eren
ce fo
r M
orph
ine-
paire
d C
ham
ber
+/+ -/-
B
010
2030
405060
7080
90100
% B
asel
ine
Pref
eren
ce fo
r M
orph
ine-
paire
d C
ham
ber
+/+ -/-
010
2030
405060
7080
90100
% B
asel
ine
Pref
eren
ce fo
r M
orph
ine-
paire
d C
ham
ber
+/+ -/-
010
2030
405060
7080
90100
% B
asel
ine
Pref
eren
ce fo
r M
orph
ine-
paire
d C
ham
ber
+/+ -/-
271Discussion
The apparatuses and procedure used in these experiments on the whole were not
successful in producing reliable morphine conditioned place preference in either B6 or 129 wild-
type mice. In B6 wild-type mice, 3 mg/kg (i.p.) morphine produced the strongest place
preference in both the van der Kooy Apparatus and the Steidl Apparatus, with 10-15 % changes
in preference for the morphine-paired chamber. There was no indication of a dose-response
relation in B6 wild-type mice using the van der Kooy Apparatus, consistent with a previous
report using this apparatus showing that a 1 mg/kg morphine dose is above threshold for
producing place preference and that there is no additional gain from using higher doses
(Dockstader et al., 2001; Dockstader & van der Kooy, 2001). Similarly, a meta-analysis of
morphine place preference data in rats, also points to 1 mg/kg as the threshold dose, with no
reliable dose-dependent differences at higher doses (Bardo et al., 1995). In the current studies, 1
mg/kg morphine place preference was tested only in B6 wild-type and M5 knockout mice using
the van der Kooy Apparatus, but clearly no significant place preference was obtained. In the
current experiments, drug doses were always calculated according to free base weight. It is not
known whether Dockstader et al. (2001), calculated dose according to free base weight or salt
weight of morphine. Conceivably, in the current experiment, calculation of 1 mg/kg according to
free base weight may have resulted in a dose just below the threshold. On the other hand, the 10
mg/kg dose which should be above threshold regardless did not produce significant place
preference in B6 wild-type mice.
In 129 wild-type mice, 10 mg/kg morphine also did not produce any significant place
preference using the Steidl Apparatus. Morphine-induced locomotion in 129 wild-type mice (see
Chapter 1) suggested that the small amount of locomotion observed at the 10 mg/kg dose was not
statistically significant from saline until about 20-30 min post-injection, suggesting that the 15-
min conditioning trials used in the current study may have not adequately captured the onset of
272the morphine effect while the mice were still exposed to the CS+ chamber. Also, Basile et al.
(2002) used 30-min conditioning trials in their 129 strain. To test whether this was contributing
to the lack of significant place preference data observed in the present study, one group of 129
mice was run at the 10 mg/kg dose of morphine with 30-min conditioning trials. However, this
manipulation did not improve place preference. Perhaps, even longer trial durations would have
been beneficial. Interestingly, Bardo and colleagues (1995) report that for rats, short (< 20 min)
and long (> 45 min) durations are associated with greater effect sizes than intermediate (25-30
min) trial durations, suggesting that in fact little was to be gained from extending trial duration
from 15 to 30 min.
An alternative approach to increasing the duration of conditioning trials, which was not
implemented, could have been to increase the number of conditioning trials. In this regard, Bardo
and colleagues (1995) reported that in the literature the variation in number of drug conditioning
trials for morphine place preference studies in rats is between 1 and 4. For example, Mucha &
Iversen (1984) have shown that in rats 3 drug conditioning trials produces significant place
preference, with no additional increase in effect size due to the addition of a fourth drug
conditioning trial. While variation in the number of conditioning trials has not been
systematically investigated in mice, a survey of papers on morphine conditioned place preference
in mice shows that the combination of 4 morphine and 4 saline trials is common (Basile et al.,
2002; Dockstader et al., 2001; Dockstader & van der Kooy, 2001; Szumlinski, Lominac, Frys, &
Middaugh, 2005)
A lack of significant expression of morphine place preference in 129 mice with both
morphine (Dockstader et al., 2001; Dockstader & van der Kooy, 2001), and heroin (Szumlinski
et al., 2005) has been previously reported. In discussing the differences in spontaneous
exploration between 129 and B6 wild-type obtained in Experiment 1, differences in basal anxiety
levels were noted. 129 mice showed less open-field spontaneous exploration, consistent with
273reports of greater anxiety in this mouse strain (Homanics et al., 1999). In the context of 10 mg/kg
morphine place preferences, Dockstader and van der Kooy (2001) have demonstrated that
significant place preference does in fact develop in 129 mice, but that the retrieval/expression of
the drug-environment association is masked by anxiety. Accordingly, in their experiments, 129
mice did show significant place preference when pre-treated with either morphine or the
anxiolytic drugs diazepam or pentobarbital on the test day. Thus, it is reasonable to suggest that
the 129 mice tested in the current experiment may have in fact acquired, but not expressed, place
preference for 10 mg/kg morphine. Unfortunately, this possibility was not directly tested.
Instead, use of the divider wall with a door cut into it during baseline and preference testing in
the Steidl Apparatus was expected to lessen anxiety that could be associated with exposure to the
entire two chambers of the apparatus simultaneously, a situation somewhat akin to a small open
field chamber. Clearly this manipulation did not serve to improve place preference scores in 129
mice either.
Dockstader and van der Kooy (2001) found significant place preferences with both 1 and
10 mg/kg morphine in C57Bl/6 mice, and, in contrast to 129 mice, anxiety was not a factor in the
expression of conditioned place preference in B6 mice. In B6 mice, the amount of place
preference was not significantly affected by pre-treatment with morphine, diazepam, or
pentobarbital. The current data in B6 mice conditioned with 10 mg/kg of morphine did not
replicate the findings of Dockstader and van der Kooy (2001). However, the B6 mice used in the
current experiment are not necessarily identical to those used by Dockstader and van der Kooy
(2001). As described in the General Methods section (pg. 67), the B6 wild-type mice used here
were obtained, similar to the M5 knockout mice, by back-crossing onto C57Bl/6 for 6
generations, one generation above the suggested minimum number of back-crossings (Gerlai,
1996; Silva et al., 1997). Given that 5 generations is the minimum, the genome of these mice
should certainly be more like that of a C57Bl/6 than a 129 mouse, but unlikely to be identical to
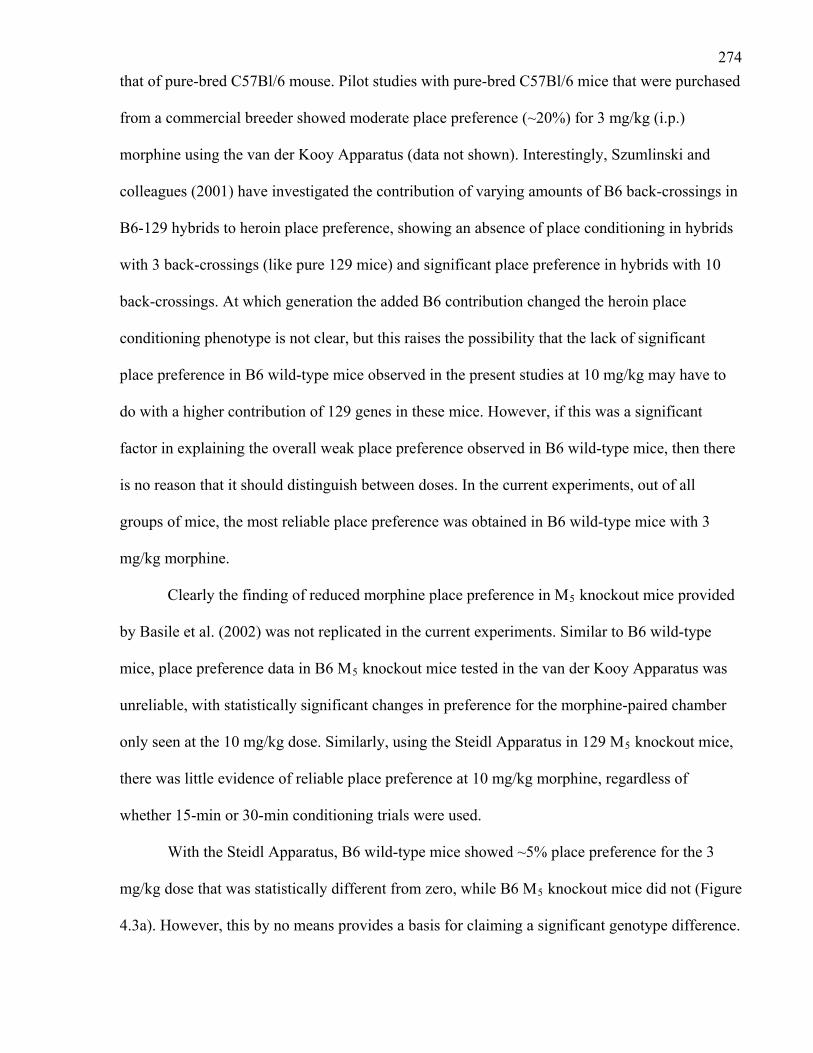
274that of pure-bred C57Bl/6 mouse. Pilot studies with pure-bred C57Bl/6 mice that were purchased
from a commercial breeder showed moderate place preference (~20%) for 3 mg/kg (i.p.)
morphine using the van der Kooy Apparatus (data not shown). Interestingly, Szumlinski and
colleagues (2001) have investigated the contribution of varying amounts of B6 back-crossings in
B6-129 hybrids to heroin place preference, showing an absence of place conditioning in hybrids
with 3 back-crossings (like pure 129 mice) and significant place preference in hybrids with 10
back-crossings. At which generation the added B6 contribution changed the heroin place
conditioning phenotype is not clear, but this raises the possibility that the lack of significant
place preference in B6 wild-type mice observed in the present studies at 10 mg/kg may have to
do with a higher contribution of 129 genes in these mice. However, if this was a significant
factor in explaining the overall weak place preference observed in B6 wild-type mice, then there
is no reason that it should distinguish between doses. In the current experiments, out of all
groups of mice, the most reliable place preference was obtained in B6 wild-type mice with 3
mg/kg morphine.
Clearly the finding of reduced morphine place preference in M5 knockout mice provided
by Basile et al. (2002) was not replicated in the current experiments. Similar to B6 wild-type
mice, place preference data in B6 M5 knockout mice tested in the van der Kooy Apparatus was
unreliable, with statistically significant changes in preference for the morphine-paired chamber
only seen at the 10 mg/kg dose. Similarly, using the Steidl Apparatus in 129 M5 knockout mice,
there was little evidence of reliable place preference at 10 mg/kg morphine, regardless of
whether 15-min or 30-min conditioning trials were used.
With the Steidl Apparatus, B6 wild-type mice showed ~5% place preference for the 3
mg/kg dose that was statistically different from zero, while B6 M5 knockout mice did not (Figure
4.3a). However, this by no means provides a basis for claiming a significant genotype difference.
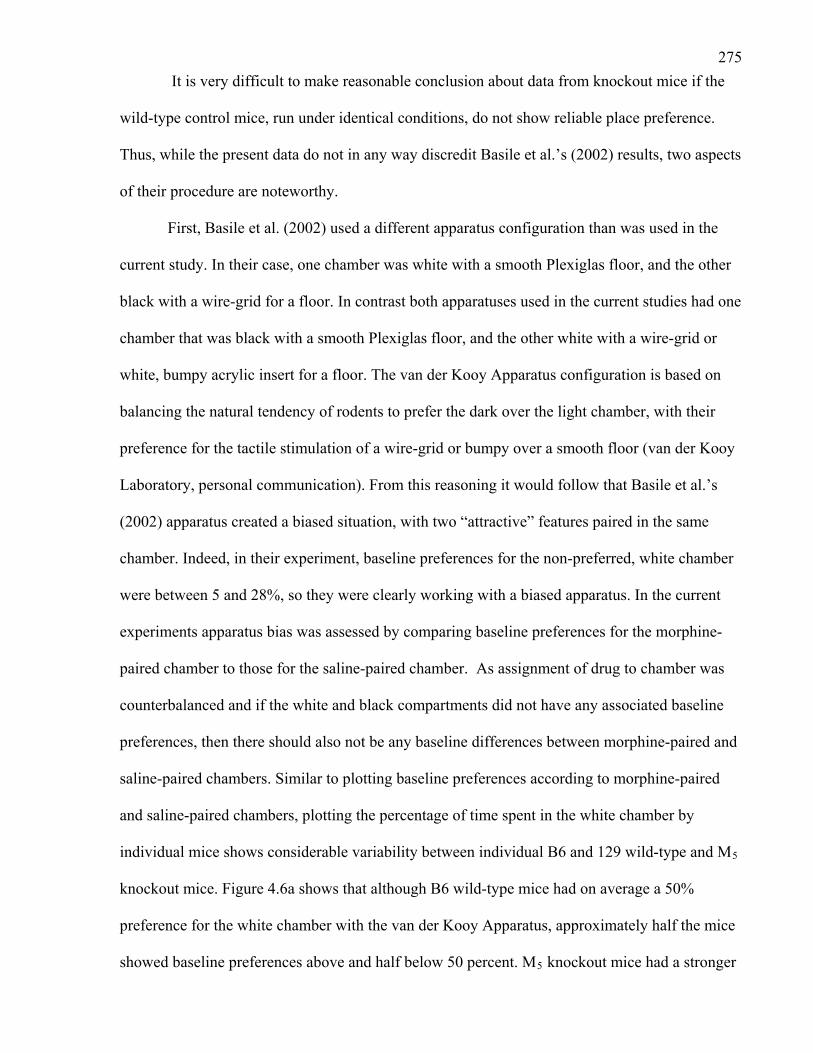
275 It is very difficult to make reasonable conclusion about data from knockout mice if the
wild-type control mice, run under identical conditions, do not show reliable place preference.
Thus, while the present data do not in any way discredit Basile et al.’s (2002) results, two aspects
of their procedure are noteworthy.
First, Basile et al. (2002) used a different apparatus configuration than was used in the
current study. In their case, one chamber was white with a smooth Plexiglas floor, and the other
black with a wire-grid for a floor. In contrast both apparatuses used in the current studies had one
chamber that was black with a smooth Plexiglas floor, and the other white with a wire-grid or
white, bumpy acrylic insert for a floor. The van der Kooy Apparatus configuration is based on
balancing the natural tendency of rodents to prefer the dark over the light chamber, with their
preference for the tactile stimulation of a wire-grid or bumpy over a smooth floor (van der Kooy
Laboratory, personal communication). From this reasoning it would follow that Basile et al.’s
(2002) apparatus created a biased situation, with two “attractive” features paired in the same
chamber. Indeed, in their experiment, baseline preferences for the non-preferred, white chamber
were between 5 and 28%, so they were clearly working with a biased apparatus. In the current
experiments apparatus bias was assessed by comparing baseline preferences for the morphine-
paired chamber to those for the saline-paired chamber. As assignment of drug to chamber was
counterbalanced and if the white and black compartments did not have any associated baseline
preferences, then there should also not be any baseline differences between morphine-paired and
saline-paired chambers. Similar to plotting baseline preferences according to morphine-paired
and saline-paired chambers, plotting the percentage of time spent in the white chamber by
individual mice shows considerable variability between individual B6 and 129 wild-type and M5
knockout mice. Figure 4.6a shows that although B6 wild-type mice had on average a 50%
preference for the white chamber with the van der Kooy Apparatus, approximately half the mice
showed baseline preferences above and half below 50 percent. M5 knockout mice had a stronger

276Figure 4.6. Apparatus bias in B6 wild-type (+/+) and M5 knockout (-/-) mice in (A) the van der
Kooy Apparatus (B6 n=22; M5 knockout n=19), and (B) the Steidl Apparatus (B6 n=6; M5
knockout n=6), and (C) 129 wild-type and M5 knockout mice in the Steidl Apparatus (129 n=24;
M5 knockout n=18).
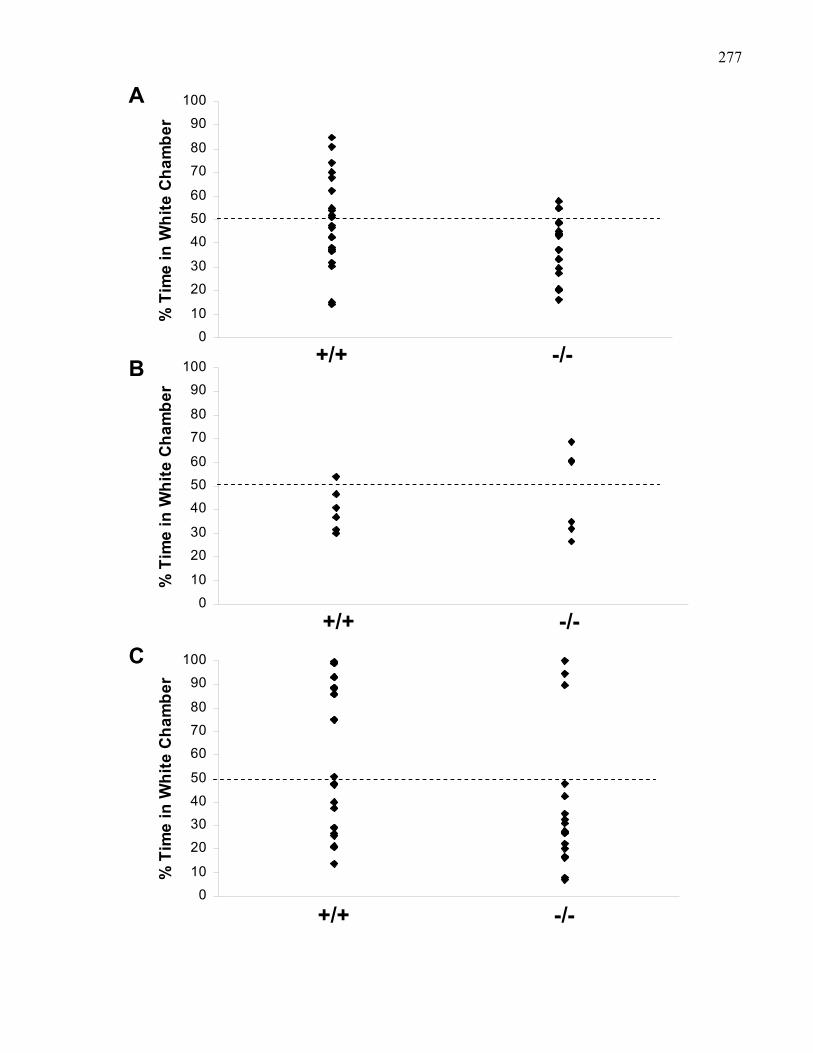
277
0
10
20
30
40
50
60
70
80
90
100
% T
ime
in W
hite
Cha
mbe
r
+/+ -/-
A
0
10
20
30
40
50
60
70
80
90
100
% T
ime
in W
hite
Cha
mbe
r
+/+ -/-
C
0
10
20
30
40
50
60
70
80
90
100
% T
ime
in W
hite
Cha
mbe
r
+/+ -/-
B
278preference for the black chamber. At least in six B6 wild-type and M5 knockout mice tested, the
Steidl Apparatus (Figure 4.6b) seemed to create more balanced baseline preferences. On the
other hand, the same apparatus also produced considerable variation in baseline preference for
the white chamber in both 129 wild-type and M5 knockout mice (Figure 4.6c).
Whether or not the apparatuses used in the present studies were biased seems to depend
on how bias is quantified. If average preferences across mice are taken as an indication, as for
example all B6 wild-type mice run on the van der Kooy Apparatus, then it could be claimed that
this apparatus was not biased. However, Figure 4.6a should serve to illustrate that this approach
is not very meaningful. With half the individual mice above (up to as high as 80%) and half
below (up to as low as 15%) 50% preference, the arithmetic mean will of course be close to 50%.
If assignment of the drug is counterbalanced, which is what an unbiased conditioning procedure
would demand, then this creates a situation where for half the mice the drug is paired with the
preferred chamber and for the other half with the non-preferred chamber.
Second, Basile et al. (2002) used a biased conditioning procedure, where morphine was
always paired with the non-preferred side. By contrast, in the current studies, assignment of
morphine to the black or white chamber was counterbalanced. In Basile et al.’s (2002) study,
unlike Dockstader and van der Kooy (2001), 129 wild-type and mixed 129 x CF1 mice showed
increases in preference for the morphine-paired chamber between 20 and 25 % across doses. It
may be that the use of a biased conditioning procedure served to maximize place preference in
their mice.
While Basile et al.’s (2002) data can be criticized on these grounds, the fact remains that
whatever bias existed in their procedure and apparatus, it was equally applied to wild-type and
M5 knockout mice, and M5 knockout mice did not develop any morphine-place preference at
2.5, 5, or 10 mg/kg, and showed reduced place preference at 25 mg/kg, suggesting that
morphine-place preference critically depended on M5 receptors. The authors related the loss of
279morphine place preference to reduced accumbal dopamine release at 25 mg/kg (i.p) morphine
resulting from reduced activation of the mesolimbic dopamine system in M5 knockout mice.
Their data are consistent with morphine place preference data in rats showing that muscarinic
antagonism in the VTA reduced morphine place preference tested with an unbiased apparatus
and conditioning procedure (Rezayof et al., 2007). At the same time, the data are inconsistent
with the clear demonstration of morphine place preference in rats despite pre-treatment with
systemic ((Nader & van der Kooy, 1997), or nucleus accumbens (Laviolette et al., 2002)
dopamine receptor blockers.
Furthermore, Hnasko et al. (2005) have demonstrated that dopamine-deficient mice
develop conditioned place preference for both 5 and 10 mg/kg (s.c.), but not 2.5 mg/kg
morphine, suggesting that dopamine is not required for an animal to associate the hedonic effects
of morphine with a particular environment. Hnasko et al.’s (2005) data are particularly
interesting as the absence of morphine place preference at 2.5 mg/kg morphine could be reversed
by pre-treatment with L-Dopa just before the preference test, suggesting that at least at low
doses, dopamine may contribute to the expression, but not the acquisition, of morphine place
preference. This suggests that in M5 knockout mice, which are missing a major excitatory input
to the mesolimbic dopamine system, the lack of morphine place preference may at least in part
be due to a decrease in the motivation to seek out the drug-paired chamber rather than an
inability to experience the hedonic properties of morphine or associate them with a given
environment.
280Chapter 4 References
Bardo, M. T., & Bevins, R. A. (2000). Conditioned place preference: What does it add to our
preclinical understanding of drug reward? Psychopharmacology, 153, 31-43.
Bardo, M. T., Rowlett, J. K., & Harris, M. J. (1995). Conditioned place preference using opiate
and stimulant drugs: A meta-analysis. Neuroscience and Biobehavioral Reviews, 19, 39-
51.
Basile, A. S., Fedorova, I., Zapata, A., Liu, X., Shippenberg, T., Duttaroy, A., Yamada, M., &
Wess, J. (2002). Deletion of the M5 muscarinic acetylcholine receptor attenuates
morphine reinforcement and withdrawal but not morphine analgesia. Proceedings of the
National Acadamy of Sciences U S A, 99, 11452-11457.
Bechara, A., Harrington, F., Nader, K., & van der Kooy, D. (1992). Neurobiology of motivation:
Double dissociation of two motivational mechanisms mediating opiate reward in drug-
naive versus drug-dependent animals. Behavioural Neuroscience, 106, 798-807.
Carr, G.D., Fibiger, H.C., & Phillips, A.G. (1989). Conditioned place preference as a measure of
drug reward. In J.M. Liebman & S.J. Cooper (Eds.) The neuropharmacological basis of
reward. Oxford: Claredon Press.
Cunningham, C.L., Ferree, N.K., & Howard, M.A. (2003). Apparatus bias and place
conditioning with ethanol in mice. Psychopharmacology, 170, 409-422.
Dockstader, C. L., Rubinstein, M., Grandy, D. K., Low, M. J., & van der Kooy, D. (2001). The
d2 receptor is critical in mediating opiate motivation only in opiate-dependent and
withdrawn mice. European Journal of Neuroscience, 13, 995-1001.
Dockstader, C. L., & van der Kooy, D. (2001). Mouse strain differences in opiate reward
learning are explained by differences in anxiety, not reward or learning. Journal of
Neuroscience, 21, 9077-9081.
281Gerlai, R. (1996). Gene-targeting studies of mammalian behavior: Is it the mutation or the
background genotype? Trends in Neuroscience, 19, 177-181.
Heinrichs, S.C., & Martinez, J.L. Jr (1986). Modification of place preference conditioning in
mice by systemically administered [Leu]-enkephalin. Behavioral Brain Research, 22,
249-255.
Hnasko, T. S., Sotak, B. N., & Palmiter, R. D. (2005). Morphine reward in dopamine-deficient
mice. Nature, 438, 854-857.
Homanics, G. E., Quinlan, J. J., & Firestone, L. L. (1999). Pharmacologic and behavioral
responses of inbred C57Bl/6J and strain 129/SvJ mouse lines. Pharmacology
Biochemistry and Behavior, 63, 21-26.
Kippin, T. E., & van der Kooy, D. (2003). Excitotoxic lesions of the tegmental pedunculopontine
nucleus impair copulation in naive male rats and block the rewarding effects of
copulation in experienced male rats. European Journal of Neuroscience, 18, 2581-2591.
Laviolette, S. R., Nader, K., & van der Kooy, D. (2002). Motivational state determines the
functional role of the mesolimbic dopamine system in the mediation of opiate reward
processes. Behavioral Brain Research, 129, 17-29.
Mucha, R. F., & Iversen, S. D. (1984). Reinforcing properties of morphine and naloxone
revealed by conditioned place preferences: A procedural examination.
Psychopharmacology, 82, 241-247.
Nader, K., & van der Kooy, D. (1997). Deprivation state switches the neurobiological substrates
mediating opiate reward in the ventral tegmental area. Journal of Neuroscience, 17, 383-
390.
Rezayof, A., Nazari-Serenjeh, F., Zarrindast, M. R., Sepehri, H., & Delphi, L. (2007). Morphine-
induced place preference: Involvement of cholinergic receptors of the ventral tegmental
area. European Journal of Pharmacology, 562, 92-102.
282Silva, A., Simpson, E.M., Takahashi, J.S., Lipp, H.P., Nakanishi, S., Wehner, J.M., Giese, K.P.,
Tully, T., Abel, T., Chapman, P.F., Fox, K., Grant, S., Itohara, S., Lathe, R., Mayford,
M., McNamara, J.O., Morris, R.J., Picciotto, M., Roder, J., Shin, H.S., Slesinger, P.A.,
Storm, D.R., Stryker, M.P., Tonegawa, S., Wang, Y., & Wolfer, D.P. 1997). Mutant mice
and neuroscience: recommendation concerning genetic background. Neuron, 19, 755-
759.
Szumlinski, K. K., Lominac, K. D., Frys, K. A., & Middaugh, L. D. (2005). Genetic variation in
heroin-induced changes in behaviour: Effects of b6 strain dose on conditioned reward and
locomotor sensitization in 129-b6 hybrid mice. Genes Brain and Behavior, 4, 324-336.
Tzschentke, T. M. (1998). Measuring reward with the conditioned place preference paradigm: A
comprehensive review of drug effects, recent progress and new issues. Progress in
Neurobiology, 56, 613-672.
Wise, R.A. (1989). The brain and reward. In J.M. Liebman & S.J. Cooper (Eds.) The
neuropharmacological basis of reward. Oxford: Claredon Press.
Wise, R. A., & Bozarth, M. A. (1987). A psychomotor stimulant theory of addiction.
Psychological Review, 94, 469-492.
Yeomans, J. S., Kofman, O., & McFarlane, V. (1985). Cholinergic involvement in lateral
hypothalamic rewarding brain stimulation. Brain Research, 329, 19-26.

283
General Discussion
284Summary of Chapter 1-4 Findings
The data collected in this dissertation show that M5 receptors in the VTA are important
for mediating the acute effects of morphine on locomotion and are critical for nucleus accumbens
dopamine increases produced by intra-VTA morphine.
First, M5 receptor knockout mice of both the 129 and B6 background strains showed
reduced morphine-induced locomotion relative to their respective wild-type controls. Reduced
morphine-induced locomotion in M5 knockout mice was most evident at the 30 mg/kg (i.p.) dose
of morphine.
Second, in B6 wild-type mice, bilateral VTA pre-treatment with the non subtype-
selective musacrinic receptor antagonist atropine, but not the non suntype-selective nicotinic
receptor antagonist mecamylamine, reduced the locomotion induced by morphine (30 mg/kg,
i.p.) to a similar extent as systemic M5 receptor knockout. By contrast, VTA atropine did not
further reduce locomotion in M5 knockout mice.
Third, the strong and long-lasting (≤ 2.5 hrs) increases in nucleus accumbens dopamine
efflux produced by intra-VTA morphine in wild-type mice were completely absent in M5
knockout mice, consistent with the reductions in morphine-induced locomotion in M5 knockout
mice. Similarly, VTA pre-treatment with scopolamine blocked increases in nucleus accumbens
dopamine efflux induced by intra-VTA morphine in wild-type mice.
Fourth, either VTA atropine or mecamylamine strongly increased locomotion in M5
knockout mice, while only slightly increasing locomotion in wild-type mice. Therefore, in the
absence of VTA M5 receptors the inhibitory effects of muscarinic- and nicotinic-mediated
cholinergic inputs to the mesolimbic dopamine system are more clearly revealed.
285Implications of the Current Findings
Previous studies of M5 knockout mice have found 40-50% reduced amphetamine-
induced locomotion (Wang et al., 2004), reduced cocaine conditioned place preference (Fink-
Jensen et al., 2003), reduced cocaine self-administration (Thomsen et al., 2005), and reduced
morphine place preference as well as reduced naloxone-precipitated morphine physical
withdrawal symptoms (Basile et al., 2002). Here, I found a 45-48% reduction in morphine-
induced locomotion in M5 knockout mice, indicating that the acute effects of morphine on
locomotion importantly depend on VTA M5 receptors. Nucleus accumbens dopamine efflux
induced by VTA morphine critically depended on VTA M5 receptors. As such, the data further
underscore the importance of understanding M5-mediated cholinergic activation of the dopamine
system for understanding the neurobiological mechanisms through which morphine affects
behaviour.
M5, Opiates and Dopamine.
Experiment 5 showed that in urethane-anesthetized mice, intra-VTA morphine induced a
large increase in accumbal dopamine efflux that was mediated through opioid receptors.
Electrophysiological recordings from midbrain dopamine neurons in rat brain slices suggest that
opiates disinhibit VTA dopamine neurons by inhibiting local GABA neurons (Johnson & North,
1992). M5 knockout mice showed no increases in accumbal dopamine efflux in response to VTA
morphine, and increases were similarly blocked by pre-treatment with scopolamine in wild-type
mice. Thus, either the disinhibition of VTA dopamine neurons by opiates requires the presence
of M5 receptors on dopamine neurons, or in the urethane-anesthetized mouse preparation an
additional mechanism of opiate-induced dopamine excitation is revealed that depends on VTA
M5 receptors.
In either case, the locomotion induced by systemic morphine in M5 knockout mice was
strongly reduced due to the absence of M5-mediated opiate-induced excitation of VTA dopamine
286neurons. Consistent with this, morphine-induced locomotion in freely-moving mice was reduced
by intra-VTA atropine to a similar extent as in M5 knockout mice.
Morphine-induced Locomotion and Dopamine Dependence
To what extent is the residual morphine-induced locomotion observed in M5 knockout
mice dopamine dependent? M5 knockouts showed reductions in total morphine-induced
locomotion between 45 and 48%, depending on background strain and dose, meaning that
greater than 50% of overall morphine-induced locomotion in wild-type mice is mediated through
a non-M5 dependent mechanism. Based on work done in rats, the residual non-M5 dependent
locomotion in knockout mice could be due to the action of morphine in the nucleus accumbens
(Amalric & Koob, 1985; Kalivas et al., 1983), the ventral pallidum (Austin & Kalivas, 1990;
Churchill et al., 1992), the PPT, or the mediodorsal thalamus (Klitenick & Kalivas, 1994). In
mice, the effects of opioid agonists directly into these brain areas on locomotion have not been
systematically studied, so it is not clear if the data obtained in rats extends to mice as well. Also,
there are few studies testing the effects of dopamine antagonists on morphine-induced
locomotion in mice. Recently, Ito, Mori, and Sawaguchi (2008) showed that systemic
haloperidol, which by itself did not reduce locomotion relative to saline, dose-dependently
attenuated locomotion induced by 20 mg/kg (s.c.) morphine in ddY mice between 50 and 75% at
doses of 0.032 and 0.1 mg/kg, respectively. By comparison, in rats similar doses (0.05 and 0.1
mg/kg) of α-flupenthixol did not significantly affect heroin-induced locomotion (Vaccarino et
al., 1986). Another comparison is between Hnasko et al.’s (2005) dopamine-deficient mice,
showing a 90% reduction in morphine-induced locomotion, and the effects of 6-OHDA lesions
in rats, showing no change in heroin-induced locomotion (Vaccarino et al., 1986). Taken
together the data suggest that locomotion induced by opiates may depend on dopamine to a
greater extent in mice than in rats.
An important question is whether the reduction in morphine-induced locomotion by
287haloperidol in wild-type mice or in dopamine-deficient mice is a secondary motor deficit. In Ito
et al’s (2008) study none of the doses of systemic haloperidol (0.01, 0.03, and 0.1 mg/kg, i.p.) on
their own reduced locomotion relative to saline, indicating that non-specific motor impairements
were not a major confound in evaluating the effects of haloperidol on morphine-induced
locomotion. The dopamine-deficient mice on the other hand are described as being severly
hyperoactive (Zhou & Palmiter, 1995). When first placed into a novel locomotion testing
chamber, control mice traveled ~23 m/hr, while dopamine-deficient mice traveled only ~3 m/hr.
A single L-Dopa injection (25 or 50 mg/kg, i.p.) increased brain dopamine levels to ~40% of
controls that declined over 24 hrs back to basal levels. Spontaneous locomotion in these mice
concurrently increased to levels above those observed in wild-type mice, peaking at 1 hr, and
then declining back to basal levels over 24 hours. In morphine-induced locomotion experiments
(Hnasko et al., 2005), dopamine-deficient mice were tested 18-24 hrs after L-Dopa
administration, a time during which brain dopamine levels were <1% of controls and
spontaneous locomotion was strongly reduced. Accordingly, non-specific motor impairments
may have contributed to the reduced morphine-induced locomotion observed in dopamine-
deficient mice. On the other hand, in another study dopamine-deficient mice showed locomotion
induced by phencyclidine (PCP) or the NMDA antagonist MK-801 that was similar to control
mice. Thus locomotion induced through glutamatergic systems was normal in these mice,
suggesting that drug-induced locomotion per se is not significantly affected in these mice
(Chartoff, Heusner, & Palmiter, 2005). Rather, the deficit seems to be specific to morphine-
induced locomotion.
If morphine-induced locomotion is dependent on dopamine to a greater extent in mice
than in rats, then the residual morphine-induced locomotion in M5 knockout mice should also be
more dependent on dopamine. In rats, opiates induced dopamine-dependent locomotion in the
PPT (Klitenick & Kalivas, 1994) and both PPT or LDT lesions (Forster & Blaha, 2003; Miller et
288al., 2002) as well as scopolamine in the VTA (Miller et al., 2005) strongly reduced dopamine
increases produced by intravenous morphine (75% and 60%, respectively). Thus, opioid effects
in the PPT may contribute to the residual locomotion seen in M5 knockout mice. It is unclear
however, whether the PPT input to the VTA would be mediated solely through cholinergic
afferents to the VTA in M5 knockout mice. For one, M5 receptors are missing on dopamine
neurons in knockout mice. It is unlikely that cholinergic inputs would be mediated through
nicotinic receptors, as VTA mecamylamine potentiated morphine locomotion in the M5
knockout. Similarly, the potentiation of morphine locomotion by VTA atropine in the knockout
argues against mediation through other muscarinic receptor sub-types. One previous report in
guinea pig brainstem slices showed that PPT cholinergic neurons were inhibited by μ opioid
agonists (Serafin, Khateb, & Muhlethaler, 1990). If this were also the case for mice, then
mediation through PPT cholinergic neurons is unlikely. However, again the fact that VTA
atropine and especially mecamylamine, which should mimic the effect of reduced cholinergic
input to the VTA, were additive with systemic morphine in inducing locomotion would argue
against morphine-induced inhibition of PPT cholinergic neurons in mice. Alternatively, opiates
in the PPT could increase glutamatergic excitation of dopamine neurons, producing dopamine-
dependent locomotion.
Non-dopamine Mediation of Opiate Locomotion.
Several other non-dopamine transmitters have been shown to play a role in mediating the
effects of opiates as well, and these may also contribute to the residual morphine-induced
locomotion observed in M5 knockout mice.
First, mice lacking the NK1 receptor did not acquire self-administration or locomotor
sensitization to morphine, but did for cocaine (Ripley, Gadd, De Felipe, Hunt, & Stephens,
2002). Intra-cerebroventricular administration of a NK-1 antagonist reduced morphine-induced
locomotion in rats (Placenza, Fletcher, Vaccarino, & Erb, 2006). Further, specific ablations of
289NK1 receptors in the amygdala, but not the nucleus accumbens, reduced place preference for
morphine, but not cocaine (Gadd, Murtra, De Felipe, & Hunt, 2003). Together these data suggest
a role for substance P neurotransmission in the amygdala in modulating opiate reward and
locomotion.
Second, norepinephrine neurotransmission, which is known to be important in opiate
withdrawal (Maldonado, 1997), is also important in its acute effects. Cortical blockade of α1-
adrenergic receptors blocked both the acute locomotion induced by morphine, as well as the
expression of behavioral sensitization to morphine (Drouin, Blanc, Trovero, Glowinski & Tassin,
2001). However, it is not entirely clear to what extent cortical norepinephrine is independent
from dopamine in mediating the acute effects. Ventura, Alcaro, and Puglisi-Allegra (2005)
showed that systemic morphine increased norepinephrine levels in the medial prefrontal cortex,
and that this in turn was necessary for the morphine-induced increases in dopamine, as well as
the development of morphine place preference.
VTA morphine may affect accumbens dopamine efflux via a cholinergic feedback loop involving
the PPT and M5 muscarinic receptors
Experiment 4 provides a useful comparison for the effects of intra-VTA morphine on
accumbal dopamine efflux. With electrical stimulation of the LDT (Forster et al., 2002) or the
PPT (Experiment 4), which both provide afferent cholinergic and glutamatergic inputs to
dopamine neurons, the onset of dopamine increase was fast (<30 sec), due to the activation of
dopamine by fast nicotinic and AMPA/kainate ionotropic receptors (Forster & Blaha, 2000;
2003). However, the M5 contribution to PPT-evoked striatal dopamine efflux was slower, with
an onset of 5-10 minutes (see Figure 3.5), the same time at which differences in accumbal
dopamine efflux between wild-type and M5 knockout mice following VTA morphine became
apparent. With LDT-evoked accumbal dopamine efflux, the M5 mediated component followed a
similar time course (Forster et al., 2002). Thus, the time course of M5-mediated dopamine
290activation by PPT or LDT stimulation matches that of M5-mediated dopamine activation induced
by VTA opiates. A better test would be provided by a comparison to the time course of PPT-
evoked accumbal, rather than striatal, dopamine efflux. While the effects of PPT stimulation on
accumbal dopamine efflux have not been specifically studied, the presence of both PPT to VTA
projections (Oakman et al., 1995) as well as the interconnectivity between PPT and LDT (Semba
& Fibiger, 1992) suggest that these are functionally relevant.
VTA morphine administration induced a slow and long-lasting (> 2 hrs) increase in
accumbens dopamine efflux that began about 10 min after infusion and was completely absent in
M5 knockout mice. Consistent with this, microdialysis measures of accumbal dopamine
following VTA morphine showed increases within 15 min of the injection (Leone et al., 1990).
By contrast, systemic administration of morphine in urethane-anesthetized rats induced increases
in accumbal or striatal dopamine efflux within 30-60 sec following the injection (Forster et al.,
2003; Miller et al., 2003; 2005). As systemic morphine in rats produced faster increases in
dopamine than intra-VTA morphine in mice, this suggests that a non-M5 dependent mechanism
must be contributing to the faster dopamine activation associated with systemic morphine.
Furthermore, in contrast to VTA morphine, VTA administration of 0.2 mM or SN
administration of 0.5 mM nicotine in urethane-anesthetized rats induced increases in accumbal
and striatal dopamine efflux, respectively, that were apparent within 1-3 min following the
injection (Blaha & Winn, 1993; Blaha et al., 1996). In addition, VTA carbachol (0.5 μg) in
urethane-anesthetized rats induced increases in accumbal dopamine efflux within 30 sec of the
injection (Miller & Blaha, 2005). Comparing the present data with dopamine increases produced
by other pharmacological manipulations in the VTA suggests, therefore, that the 10-min delay in
accumbal dopamine efflux observed following VTA morphine was not due to delays associated
with the recording method. Increases in dopamine efflux measured by stearate-modified carbon
paste electrodes are apparent within seconds or minutes following electrical and/or chemical
291stimulation of dopamine neurons. If opiates in the VTA were affecting mesolimbic dopamine
neurons via disinhibition of local GABA neurons, then the onset would be expected to occur
faster than 10 minutes. The present data indicate that the delay was due to opiate-induced
dopamine activation through M5 muscarinic receptors.
Laviolette and colleagues (2004) suggest that the VTA contains two separate mechanisms
that can mediate the acute rewarding effects of opiates, depending on the animals’ prior drug
history. Specifically, in drug-naïve animals VTA opiates activate descending GABA projections
to the PPT, while in dependent/withdrawn animals, VTA opiates act through the disinhibition of
dopamine neurons. As all mice tested in the chronoamperometry experiments were drug naïve,
VTA opiates should have activated descending GABAergic inputs to the PPT. It is possible that
this could, in turn, result in the disinhibition of ascending cholinergic inputs to the VTA to
produce dopamine activation through muscarinic receptors (Figure 6). The activation of
dopamine neurons through a cholinergic feedback loop could help explain why the dopamine
increases observed in the present study had a 10 min onset and why muscarinic receptor
blockade in the VTA or M5 knockout completely blocked dopamine increases produced by VTA
morphine. The resulting dopamine activation may also be important for the acute locomotion
produced by opiates.
If this hypothesis is correct then it provides three testable predictions. First, acetylcholine
levels in the VTA should be increased by intra-VTA morphine in wild-type mice. Increases in
VTA acetylcholine levels have previously been shown in rats bar-pressing for lateral
hypothalamus stimulation, as well as in rats eating or drinking following overnight deprivation
(Rada et al., 2000). Second, if the increase in VTA acetylcholine is mediated through
GABAergic disinhibition of PPT, then GABA agonists in the PPT should block it. Third, the
importance of M5 should vary according to the animals’ motivational state, such that in the
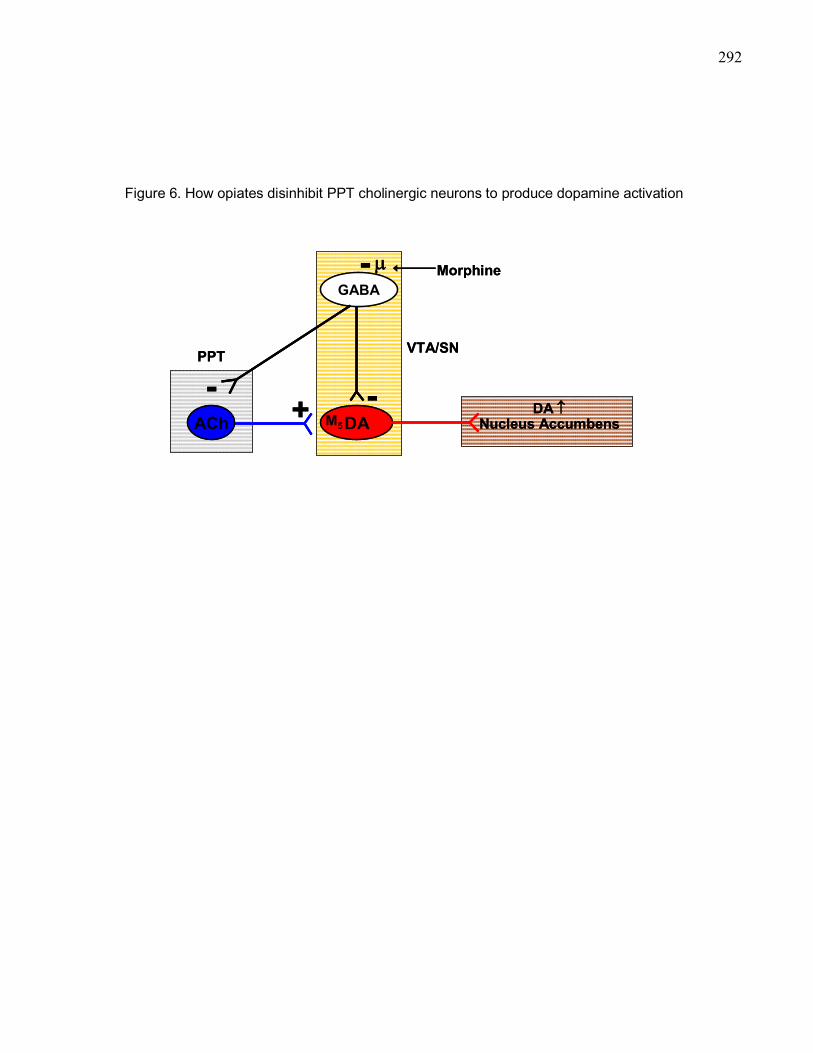
292
DA
GABA
M5
PPT VTA/SN
ACh Nucleus Accumbens
μ
+ - DA ↑-
Morphine-
DA
GABA
M5
PPT VTA/SN
ACh Nucleus Accumbens
μ
+ - DA ↑-
Morphine-
Figure 6. How opiates disinhibit PPT cholinergic neurons to produce dopamine activation
293withdrawn/dependent state, where VTA opiates activate dopamine via GABA disinhibition, the
contribution of M5, acetylcholine release, and PPT neurons should be reduced.
The absence of VTA M5 receptors may affect the excitability of dopamine neurons
An alternative hypothesis that could account for the present results is that VTA dopamine
neurons are less excitable as a result of missing M5 receptors. The firing properties of VTA
dopamine neurons are regulated by afferent inputs. Importantly, the spontaneous activity of
dopamine neurons, which is thought to affect tonic dopamine levels (Grace, 1991), critically
depends on LDT inputs. Specifically, infusion of carbachol into the LDT, which inhibits
cholinergic neurons via M2-like receptors (Leonard & Llinás, 1994), reduced the number of
spontaneously active VTA dopamine neurons, while infusion of the muscarinic antagonist
scopolamine, or NMDA into the LDT, which activates cholinergic neurons, increased the
number of spontaneously active dopamine neurons. Furthermore, decreasing the number of
spontaneously active dopamine neurons by LDT carbachol, blocked dopamine neurons burst
firing induced by either PPT NMDA or VTA glutamate infusion (Lodge & Grace, 2006). As the
phasic increases in dopamine produced by increases in burst firing of dopamine neurons are
thought to be functionally related to reward, the data suggest that the LDT regulates the
responsiveness of VTA dopamine neurons to reward-related stimuli.
Thus, it may be that the absence of M5 receptors on VTA dopamine neurons results in
reduced responsiveness to tonic cholinergic inputs from the LDT that help to maintain the ability
of dopamine neurons to respond to afferent inputs. Dopamine neurons would concurrently be
subject to greater tonic inhibition by local GABA neurons, so VTA dopamine neurons in M5
knockout mice could be in a chronic state of reduced excitability (i.e. hyperpolarized) and so
would require greater afferent input to reach a threshold of excitation. In the case of opiates, this
would mean that VTA dopamine neurons require a greater degree of GABA neuron inhibition by
opiates to reach the threshold of excitation. In the present studies only the 50 ng dose of VTA
294morphine was used, so one way to test this prediction would be to assess whether either higher
doses of morphine or a more potent μ opioid receptor agonist like fentanyl, would lead to
increased accumbal dopamine efflux in M5 knockout mice. However, a more direct test of the
hypothesis would require electrophysiological recordings from VTA dopamine neurons in M5
knockout mice.
Support for this hypothesis comes from studies of orexin knockout mice, which lack the
precursor peptide prepro-orexin for orexin A and orexin B. Orexins directly activate VTA
dopamine neurons (Korotkova, Sergeeva, Eriksson, Haas, & Brown, 2003), and increase levels
of dopamine and its metabolites in the nucleus accumbens (Narita et al., 2006). Prepro-orexin
knockout mice showed reduced sensitivity to the acute effects of morphine, remarkably similar
to what was observed in the M5 knockout mice in the present study. Both M5 and prepro-orexin
knockout mice show reduced locomotion, and reduced increases in nucleus accumbens dopamine
in response to morphine. In addition, the prepro-orexin mice showed a strong reduction in
morphine conditioned place preference across a range of doses (3, 5, and 10 mg/kg).
Orexins have been shown to increase intracellular Ca2+ concentrations in VTA dopamine
neurons via activation of phospolipase C and protein kinase C. Similarly, M5 receptor activation
also leads to increases in intracellular Ca2+ concentrations via activation of phospolipase C and
protein kinase C (Eglen & Nahorski, 2000). Thus it is possible that one consequence of orexin
loss in the knockout mice is that, similar to the loss of M5 receptors, VTA dopamine neurons are
in a state of reduced excitability.
It follows from this hypothesis that VTA dopamine neurons in M5 knockout mice are
influenced to a greater extent by tonic GABAergic input. This may explain why M5 knockout
mice showed increased locomotion in response to either VTA atropine or mecamylamine. It may
also explain why VTA atropine or mecamylamine potentiated locomotion induced by systemic
morphine in M5 knockout mice. The locomotion induced by VTA atropine or mecamylamine
295alone in M5 knockout mice could be explained by blockade of muscarinic and nicotinic receptors
on GABA neurons (see Chapter 2), effectively disinhibiting dopamine neurons. In the case of
systemic morphine in combination with VTA atropine or mecamylamine, blocking tonic
excitatory cholinergic input to GABA neurons should reduce tonic GABAergic input to
dopamine neurons, which may increase their responsiveness to morphine.
M5 and Reward
Basile et al.’s (2002) data on morphine conditioned place preference were not replicated
in Experiment 6. However, the present place preference data are difficult to interpret, as reliable
morphine place preference data was not obtained in either 129 or B6 wild-type mice. While my
data do not refute or support Basile et al.’s (2005) data, it is interesting to compare their data
with data from dopamine-deficient mice. Hnasko et al.’s (2005) data suggest a possible
dissociation between the role of dopamine in morphine-induced place preference and
locomotion. On the one hand, these mice showed virtually a complete absence of locomotion in
response to 2.5 or 12.5 mg/kg morphine, while on the other hand showing unchanged place
preference, no different from wild-type controls, at very similar doses of 2.5, 5, and 10 mg/kg
morphine. Experiment 5 showed that dopamine activation associated with VTA morphine was
crtically dependent on M5 receptors, but Hnasko et al.’s (2005) data would argue that this should
be important for locomotion but should not significantly reduce the acute rewarding effects of
morphine. Thus, it is unclear why morphine place preference should so strongly depend on M5
receptors, as suggested by Basile et al. (2002).
Conclusions and Future Directions
My experiments were intended to better understand the role of M5 receptors in morphine-
induced dopamine release and locomotion in mice. Opiate locomotion may depend more on
dopamine in mice than in rats. Because mice are the species of choice for gene studies, it is
important to understand differences in behavioral pharmacology between mice and rats. In this
296regard, my data add to an already rich body of literature demonstrating differences in how strains
of mice respond to drugs of abuse, and so further underscore the importance of considering the
background strain when interpreting the effects of gene deletion on behaviour. I chose to test the
effects of intra-VTA morphine on accumbal dopamine efflux, in part, because this should most
clearly reveal the effects of opiates on the dopamine system in isolation from other non-
dopamine effects that would be encountered with systemic injections. Basile et al.’s (2002)
already showed reduced accumbal dopamine release in response to systemic morphine in M5
knockout mice, and I have extended that finding by showing that the effects of VTA opiates on
dopamine somehow critically depend on M5 receptors. Behaviourally this resulted in reduced
locomotion.
M5 knockout mice are less sensitive to the acute effects of morphine, so two interesting
extensions of the current work would be to test the development of morphine sensitization and
the sensitivity to endogenous opioids in M5 knockout mice. First, there is substantial evidence
that the mesolimbic dopamine system and its excitatory glutamate inputs are critical for the
development of sensitization (e.g., for a review see Carlezon & Nestler, 2002). In the case of
morphine, both NMDA (Jeziorski, White, & Wolf, 1994) and AMPA (Carlezon, Rasmussen, &
Nestler, 1999; Carlezon et al., 1997) stimulation are important for the development of
sensitization. If a difference in morphine sensitization between wild-type and M5 knockout mice
were observed, it would suggest that concurrent M5-mediated excitation of dopamine neurons by
repeated opiate administration is somehow important for changes in glutamate receptors that
underlie the development of morphine sensitization. Second, Experiment 2 showed that
morphine-induced locomotion in M5 knockout mice was less sensitive to naltrexone antagonism,
and naltrexone on its own (1 mg/kg) did not reduce saline-induced locomotion to the same extent
as in wild-type mice. This suggests that M5 knockout mice may also be less sensitive to the
effects of tonically active endogenous opioids in the VTA (i.e., enkephalins and endomorphins)
297on dopamine and locomotion. In wild-type mice, blockade of endogenous opiate receptors with 1
or 10 mg/kg (i.p.) naltrexone on its own reduced locomotion, and data from two mice in
Experiment 5 with morphine injection sites 1-2 mm dorsal to the VTA showed that naltrexone on
its own produced long-lasting decreases (up to 1.5 hrs) in accumbal dopamine efflux. Consistent
with a reduced naltrexone effect on saline-induced locomotion (Experiment 2), I predict that M5
knockout mice would also show a reduced decrease in accumbal dopamine efflux following
either systemic, or intra-VTA, naltrexone treatment.
Furthermore, endogenous opioid activity has notably been implicated in social bonding
and feeding behaviours. Panksepp and colleagues (1980) have suggested that opiates reduce
distress vocalizations in newborn animals of several species when separated from their mothers.
Conversely, blocking endogenous opiates with naloxone increases separation calls (Robinson,
D’Udine, & Olivero, 1985). Accordingly, our lab has recently found that M5 knockout mice
show fewer separation calls, and fewer calls in response to naltrexone (Yeomans, Podgorski, &
Wang, 2008).
Endogenous opioid peptides have also been implicated in the modulation of feeding
behaviour. Generally opioid agonists increase and opioid antagonists decrease food consumption
(Levine & Billington, 1989; Reid, 1985). Specifically, opioids appear to modify food
consumption based on palatability rather than nutritional content. For example, Evans and
Vaccarino (1990) showed that morphine enhances intake of a rats’ preferred food. Thus, as
endogenous opioids are thought to be important in modulating palatable aspects of food, and if
M5 knockout mice are less sensitive to endogenous opioids, then it would be interesting to test
the sensitivity of M5 knockout mice to food palatability.
The pharmacology studies showed different effects on locomotion in M5 knockout mice
elicited by VTA atropine or mecamylamine. This suggests that the cholinergic afferent control of
the mesolimbic dopamine system in M5 knockout mice is shifted toward indirect inhibition. One
298result of this was reduced responsiveness to opiates. As such, the present work underscores the
importance of better understanding the role of cholinergic inputs to the dopamine system and
how these inputs affect an animals’ ability to respond to opiates. More broadly, it suggests a role
for M5 receptors in responding to other rewards. For example, acetylcholine levels in the VTA
were increased after eating, drinking, or self-stimulation of the lateral hypothalamus (Rada et al.,
2000). Furthermore, VTA scopolamine reduced bar-pressing for food reward under a progressive
ratio schedule in rats (Sharf, McKelvey, & Ranaldi, 2006). Thus, in future work, it would be
interesting to test the role of M5 receptors in non-drug rewards (e.g. food, water, and sex).
299References
Amalric, M., & Koob, G. F. (1985). Low doses of methylnaloxonium in the nucleus accumbens
antagonize hyperactivity induced by heroin in the rat. Pharmacology Biochemistry and
Behavior, 23, 411-415.
Austin, M. C., & Kalivas, P. W. (1990). Enkephalinergic and gabaergic modulation of motor
activity in the ventral pallidum. Journal of Pharmacology and Experimental
Therapeutics, 252, 1370-1377.
Basile, A. S., Fedorova, I., Zapata, A., Liu, X., Shippenberg, T., Duttaroy, A., Yamada, M., &
Wess, J. (2002). Deletion of the M5 muscarinic acetylcholine receptor attenuates
morphine reinforcement and withdrawal but not morphine analgesia. Proceedings of the
National Academy of Sciences U S A, 99, 11452-11457.
Blaha, C.D., Allan, L.F., Das, S., Inglis, W.L., Latimer, M.P., Vincent, S.R., & Winn, P. (1996).
Modulation of dopamine efflux in the nucleus accumbens after cholinergic stimulation of
the ventral tegmental area in intact, pedunculopontine tegmental nucleus-lesioned, and
laterodorsal tegmental nucleus-lesioned rats. Journal of Neuroscience, 16, 714-722.
Blaha, C.D., & Winn, P. (1993). Modulation of dopamine efflux in the striatum following
cholinergic stimulation of the substantia nigra in intact and pedunculopontine tegmental
nucleus-lesioned rats. Journal of Neuroscience, 13, 1035-1044.
Carlezon, W.A. Jr., & Nestler, E.J. (2002). Elevated levels of GluR1 in the midbrain: a trigger
for sensitization to drugs of abuse? Trends in Neurosciences, 25, 610-615.
Carlezon, W.A. Jr., Boundy, V.A., Haile, C.N., Lane, S.B., Kalb, R.G., Neve, R.L., & Nestler,
E.J. (1997). Sensitization to morphine induced by viral-mediated gene transfer. Science,
277, 812-814.
Carlezon, W.A. Jr., Rasmussen, K., & Nestler, E.J. (1990). AMPA antagonist LY293558 blocks
300the development, without blocking the expression, of behavioral sensitization to
morphine. Synapse, 31, 256-262.
Chartoff, E.H., Heusner, C.L., & Palmiter, R.D. (2005). Dopamine is not required for the
hyperlocomotor response to NMDA receptor antagonists. Neuropsychopharmacology,
30, 1324-1333.
Churchill, L., Austin, M. C., & Kalivas, P. W. (1992). Dopamine and endogenous opioid
regulation of picrotoxin-induced locomotion in the ventral pallidum after dopamine
depletion in the nucleus accumbens. Psychopharmacology, 108, 141-146.
Drouin, C., Blanc, G., Trovero, F., Glowinski, J., & Tassin, J. P. (2001). Cortical alpha 1-
adrenergic regulation of acute and sensitized morphine locomotor effects. Neuroreport,
12, 3483-3486.
Eglen, R. M., & Nahorski, S. R. (2000). The muscarinic m(5) receptor: A silent or emerging
subtype? British Journal of Pharmacology, 130, 13-21.
Evans, K.R., & Vaccarino, F.J. (1990). Amphetamine- and morphine-induced feeding: evidence
for involvement of reward mechanisms. Neuroscience and Biobehavioral Reviews, 14, 9-
22.
Fink-Jensen, A., Fedorova, I., Wortwein, G., Woldbye, D. P., Rasmussen, T., Thomsen, M.,
Bolwig, T.G., Knitowski, K.M., McKinzie, D.L., Yamada, M., Wess, J., & Basile, A.
(2003). Role for M5 muscarinic acetylcholine receptors in cocaine addiction. Journal of
Neuroscience Research, 74, 91-96.
Forster, G. L., & Blaha, C. D. (2000). Laterodorsal tegmental stimulation elicits dopamine efflux
in the rat nucleus accumbens by activation of acetylcholine and glutamate receptors in the
ventral tegmental area. European Journal of Neuroscience, 12, 3596-3604.
Forster, G. L., & Blaha, C. D. (2003). Pedunculopontine tegmental stimulation evokes striatal
301dopamine efflux by activation of acetylcholine and glutamate receptors in the midbrain
and pons of the rat. European Journal of Neuroscience, 17, 751-762.
Forster, G.L., Falcon, A.J., Miller, A.D., Heruc, G.A., & Blaha, C.D. (2002). Effects of
laterodorsal tegmentum lesions on behavioral and dopamine responses evoked by
morphine and d-amphetamine. Neuroscience, 114, 817-823.
Gadd, C. A., Murtra, P., De Felipe, C., & Hunt, S. P. (2003). Neurokinin-1 receptor-expressing
neurons in the amygdala modulate morphine reward and anxiety behaviors in the mouse.
Journal of Neuroscience, 23, 8271-8280.
Grace, A. A. (1991). Phasic versus tonic dopamine release and the modulation of dopamine
system responsivity: A hypothesis for the etiology of schizophrenia. Neuroscience, 41, 1-
24.
Hnasko, T.S., Sotak, B.N. & Palmiter, R.D. (2005). Morphine reward in dopamine-deficient
mice. Nature, 438, 854-857.
Ito, S., Mori, T., & Sawaguchi, T. (2008). Dopamine-independent psychostimulant activity of a
delta-agonist. Behavioral Pharmacology, 19, 113-119.
Johnson, S. W., & North, R. A. (1992). Opioids excite dopamine neurons by hyperpolarization of
local interneurons. Journal of Neuroscience, 12, 483-488.
Kalivas, P. W., Widerlöv, E., Stanley, D., Breese, G., & Prange, A. J., Jr. (1983). Enkephalin
action on the mesolimbic system: A dopamine-dependent and a dopamine-independent
increase in locomotor activity. Journal of Pharmacology and Experimental Therapeutics,
227, 229-237.
Klitenick, M.A., Kalivas, P.W. (1994). Behavioral and neurochemical studies of ipioid effects in
the pedunculopontine tegmental nucleus and mediodorsal thalamus. Journal of
Pharmacology and Experimental Therapeutics, 269, 437-448.
302Korotkova, T. M., Sergeeva, O. A., Eriksson, K. S., Haas, H. L., & Brown, R. E. (2003).
Excitation of ventral tegmental area dopaminergic and nondopaminergic neurons by
orexins/hypocretins. Journal of Neuroscience, 23, 7-11.
Laviolette, S.R., Gallegos, R.A., Henriksen, S.J., & van der Kooy, D. (2004). Opiate state
controls bi-directional reward signaling via GABAA receptors in the ventral tegemental
area. Nature Neuroscience, 7, 160-169.
Leonard, C.S., & Llinás (1994). Serotonergic and cholinergic inhibition of mesopontine
cholinergic neurons controlling REM sleep: an in vitro electrophysiological study.
Neuroscience, 59, 309-330.
Leone, D., Pocock, D., & Wise, R.A. (1990). Morphine-dopamine interaction: ventral tegmental
morphine increases nucleus accumbens dopamine release. Pharmacology Biochemistry
and Behavior, 39, 469-472.
Levine, A.S., & Billington, C.J. (1989). Opioids. Are they regulators of feeding? Annals of the
New York Academy of Sciences, 575, 219-220.
Lodge, D. J., & Grace, A. A. (2006). The laterodorsal tegmentum is essential for burst firing of
ventral tegmental area dopamine neurons. Proceedings of the National Academy of
Science U S A, 103, 5167-5172.
Maldonado, R. (1997). Participation of noradrenergic pathways in the expression of opiate
withdrawal: Biochemical and pharmacological evidence. Neuroscience and
Biobehavioral Reviews, 21, 91-104.
Miller, A.D., & Blaha, C.D. (2005). Midbrain muscarinic receptor mechanisms underlying
regulation of mesoaccumbens and nigrostriatal dopaminergic transmission in the rat.
European Journal of Neuroscience, 21, 1837-1846.
Miller, A. D., Forster, G. L., Metcalf, K. M., & Blaha, C. D. (2002). Excitotoxic lesions of the
303pedunculopontine differentially mediate morphine- and d-amphetamine-evoked striatal
dopamine efflux and behaviors. Neuroscience, 111, 351-362.
Miller, A. D., Forster, G. L., Yeomans, J. S., & Blaha, C. D. (2005). Midbrain muscarinic
receptors modulate morphine-induced accumbal and striatal dopamine efflux in the rat.
Neuroscience, 136, 531-538.
Narita, M., Nagumo, Y., Hashimoto, S., Narita, M., Khotib, J., Miyatake, M., Sakurai, T.,
Yanagisawa, M., Nakamachi, T., Shioda, S., & Suzuki, T. (2006). Direct involvement of
orexinergic systems in the activation of the mesolimbic dopamine pathway and related
behaviors induced by morphine. Journal of Neuroscience, 26, 398-405.
Oakman, S. A., Faris, P. L., Kerr, P. E., Cozzari, C., & Hartman, B. K. (1995). Distribution of
pontomesencephalic cholinergic neurons projecting to substantia nigra differs
significantly from those projecting to ventral tegmental area. Journal of Neuroscience,
15, 5859-5869.
Panksepp, J., Herman, B.H., Vilberg, T., Bishop, P., DeEskinazi, F.G. (1980). Endogenous
opioids and social behavior. Neuroscience and Biobehavioral Reviews, 4, 473-487.
Placenza, F. M., Fletcher, P. J., Vaccarino, F. J., & Erb, S. (2006). Effects of central neurokinin-
1 receptor antagonism on cocaine- and opiate-induced locomotor activity and self-
administration behaviour in rats. Pharmacology Biochemistry and Behavior, 84, 94-101.
Rada, P. V., Mark, G. P., Yeomans, J. S., & Hoebel, B. G. (2000). Acetylcholine release in
ventral tegmental area by hypothalamic self-stimulation, eating, and drinking.
Pharmacology Biochemistry and Behavior, 65, 375-379.
Reid, L.D. (1985). Endogenous opioid peptides and regulation of drinking and feeding.
American Journal of Nutrition, 42, 1099-1132.
304Ripley, T. L., Gadd, C. A., De Felipe, C., Hunt, S. P., & Stephens, D. N. (2002). Lack of self-
administration and behavioural sensitisation to morphine, but not cocaine, in mice
lacking nk1 receptors. Neuropharmacology, 43, 1258-1268.
Robinson, D.J., D’Udine, B., Olivero, A. (1985). Naloxone influences ultrasonic calling in young
mice. Behavioral Processes, 11, 253-255.
Semba, K., & Fibiger, H. C. (1992). Afferent connections of the laterodorsal and the
pedunculopontine tegmental nuclei in the rat: A retro- and antero-grade transport and
immunohistochemical study. Journal of Comparative Neurology, 323, 387-410.
Serafin, M., Khateb, A., & Muhlethaler, M. (1990). Opiates inhibit pedunculopontine neurones
in guinea pig brainstem slices. Neuroscience Letters, 119, 125-128.
Sharf, R., McKelvey, J., & Ranaldi, R. (2006). Blockade of muscarinic acetylcholine receptors in
the ventral tegmental area prevents the acquisition of food-rewarded operant responding
in rats. Psychopharmacology, 186, 113-121.
Thomsen, M., Woldbye, D. P., Wortwein, G., Fink-Jensen, A., Wess, J., & Caine, S. B. (2005).
Reduced cocaine self-administration in muscarinic m5 acetylcholine receptor-deficient
mice. Journal of Neuroscience, 25, 8141-8149.
Vaccarino, F. J., Amalric, M., Swerdlow, N. R., & Koob, G. F. (1986). Blockade of
amphetamine but not opiate-induced locomotion following antagonism of dopamine
function in the rat. Pharmacology Biochemistry and Behavior, 24, 61-65.
Ventura, R., Alcaro, A., & Puglisi-Allegra, S. (2005). Prefrontal cortical norepinephrine release
is critical for morphine-induced reward, reinstatement and dopamine release in the
nucleus accumbens. Cerebral Cortex, 15, 1877-1886.
Wang, H., Ng, K., Hayes, D., Gao, X., Forster, G., Blaha, C., & Yeomans, J.S. (2004).
Decreased amphetamine-induced locomotion and improved latent inhibition in mice
305mutant for the m5 muscarinic receptor gene found in the human 15q schizophrenia
region. Neuropsychopharmacology, 29, 2126-2139.
Yeomans, J.S., Podgorski, K., & Wang, H. (2008). The M5 muscarinic receptor is necessary for
opioid-mediated ultrasonic vocalizations during isolation in mouse pups. 2008
Neuroscience Meeting Planner. San Diego, CA: Society for Neuroscience, 2008. Online.
Zhou, Q. Y., & Palmiter, R. D. (1995). Dopamine-deficient mice are severely hypoactive,
adipsic, and aphagic. Cell, 83, 1197-1209.

306
Appendix A: In vivo measurement of dopamine
307Measuring synaptic neurotransmitter overflow has allowed for the correlation of brain
neurochemicals with observable behavior (Blaha & Phillips, 1996; Murphy et al., 2001).
Measuring dopamine, or other neurotransmitters, is principally achieved through one of two
methods, microdialysis or electrochemistry. The choice of method is often determined by the
chemical of interest. Brain monoamines (dopamine, norepinephrine, and serotonin) are
electroactive compounds that can be detected in the brain extracellular fluid (ECF) through in
vivo electrochemical methods or through microdialysis combined with off-line electrochemical
detection. Many other neurotransmitters found throughout the brain are not electroactive (e.g.
GABA, glutamate, acetylcholine) or are present in such low levels (e.g. substance P) that
electrochemical methods cannot be easily used. Although electrochemical detection of
neurotransmitters like glutamate (Burmeister & Gerhardt, 2001; Hascup, Hascup, Pomerleau,
Huettl, Gerhardt, 2008) and acetylcholine (Bruno et al., 2006; Burmeister et al., 2008) has
improved, microdialysis is more commonly used to measure these compounds (Blaha & Phillips,
1996; Stamford, 1989; Westerink, 2000).
1. In vivo Microdialysis
In microdialysis, brain extracellular fluid (ECF) is sampled from a brain area of interest
through a stereotaxically implanted ‘probe’. Typically, the tip of the probe consists of a
cylindrical, hollow dialysis membrane that is made from cellulose-based artificial kidney
material that is attached to an ‘in’ and ‘out’ tube (Westerink, 1995). Typical probe dimensions
are between 0.5-4 mm in length and 200-300 μm in diameter (Blaha and Phillips, 1996; Gerhardt
and Burmeister, 2000; Westerink 1995, 2000). The dialysis membrane is impermeable to large
molecules, but allows for the entry of smaller molecular mass neurotransmitter molecules
(Dawson, 1997). The molecular weight cutoff of most commercially available probes is around
30 000 daltons. Perfusion fluid continuously flows through the probe to maintain a chemical
gradient that allows for the collection of different ECF molecules. The perfusion fluid is
308generally an iso-osmolar solution that contains the appropriate physiological ions to match the
brain ECF (Dawson, 1997). Microdialysis is based on the principle that with iso-osmolar
solutions on both sides of the membrane, molecules in the ECF will diffuse down their
concentration gradients from the brain into the probe. The resulting perfusion fluid, containing
the molecules of interest, is then collected through the “out” tube for off-line analysis. The
volume of the recovered sample fluid is determined by the flow rate of perfusion, and the slower
the perfusion rate the smaller the volume of recovered samples (Dawson, 1997). Typically, flow
rates between 1-2 μl/min are used, resulting in samples collected every 5-20 minutes (Blaha &
Phillips, 1996; Dawson, 1997; Gerhardt & Burmeister, 2000).
The analysis of dialysate samples is achieved by high performance liquid
chromatography (HPLC), coupled with various detection methods. In the case of an electroactive
(oxidizable) chemical of interest like dopamine, electrochemical methods are commonly used to
identify the compound in the recovered sample. A similar process is used as during in vivo
electrochemistry at the recording surface of a carbon-based electrode to estimate analyte
concentrations (see discussion later on). In the case of other compounds like glutamate,
acetylcholine, or GABA which are not electroactive compounds, fluorescence detection or for
some electrochemical detection can be used, after the molecule has undergone an enzyme
reaction converting it to a molecule that is oxidizable (Gerhardt & Burmeister, 2000). The
amount of neurotransmitter that can be detected in a given sample depends on the sensitivity of
the HPLC machine. In the case of dopamine measured by HPLC coupled with electrochemical
detection, the limit of detection is typically in the picomolar (10-9) range (Gerhardt &
Burmeister, 2000).
1.1. Advantages of Microdialysis
First, microdialysis can measure basal levels of the neurotransmitter (Stamford, 1989) in
309terms of absolute molar concentrations, and subsequently measure changes in concentration due
to a given manipulation or some change in behavioral output.
Second, microdialysis can measure two or more chemicals of interest (e.g. glutamate and
acetylcholine in the VTA or striatum). In the case of dopamine, microdialysis allows concurrent
measurement of its major metabolites dihydroxyphenylacetic acid (DOPAC), homovanillic acid
(HVA), and 3-methoxytyramine (3-MT). This allows for a measure of functionally relevant
dopamine turnover in the brain area of interest.
1.2. Limitations of Microdialysis
First, microdialysis can disrupt the extracellular environment surrounding the probe
(Westerink & Timmerman, 1999). For example, Camp and Robinson (1992) found that four days
of continuous dialysis sampling resulted in damage to the functional integrity of the dopamine
system. Also, repeated sampling from the same brain area may lead to depletion of the
neurochemical of interest, in turn creating a local concentration gradient.
Second, microdialysis samples neurochemicals from brain areas other than the one of
primary interest. Given the relatively large probe dimensions (0.5-4 mm in length and 200-300
μm in diameter) and the fact that samples can be drawn from tissue 1 to 2 mm from the probe
(Blaha & Phillips, 1996), the spatial resolution of microdialysis is limited. This may not be a
problem in the case of relatively large neural structures (e.g. the striatum). In smaller areas such
as the VTA and SN, however, the lack of spatial resolution may be a problem. Zocchi and
colleagues (2003) used microdialysis in the mouse brain to compare local differences in
dopamine increases within the nucleus accumbens in response to various drugs of abuse.
Distinctions made between core and shell levels of dopamine, which in the mouse brain are
separated by less than 1 mm, are difficult.
Third, microdialysis has poor temporal resolution (Blaha & Phillips, 1996; Gerhardt &
Burmeister, 2000). Clearly, with sampling intervals on the order of 5-20 min, biologically
310relevant events occurring on a more rapid scale go unnoticed. The temporal resolution of
microdialysis can be improved by increasing the perfusion rate, leading to more rapid
accumulation of samples, allowing for more rapid collection. However, larger dialysate samples
can lead to more rapid depletion of neurochemicals around the probe, potentially reducing spatial
resolution (Bungay, Morrison, & Dedrick, 1990). In turn, this increases the probability of
sampling neurochemicals from areas other than the one of primary interest. Thus, with
microdialysis, improving the temporal resolution by increasing the flow rate comes at the
expense of an even greater loss of spatial resolution, and chemical depletion. If the off-line
detection method was sufficiently sensitive, then very small samples could be taken every few
minutes without having to change the flowrate.
Finally, the use of in vivo microdialysis creates tissue damage caused by the probe.
While this is the case for any kind of implantation in the brain, it is particularly a concern with
the relatively large microdialysis probes. For one, implantation of the probe will locally disrupt
the blood-brain barrier, causing reduced blood flow and consequently reduced oxygen supply
(Westerink, 1995, 2000; Westerink & Timmerman, 1999). The degree of neural damage will
depend on the size of the probe, but generally recovery from damage, as assessed by TTX- and
Ca2+-dependent dopamine release is evident within 8-24 hrs after implantation (Westerink, 2000;
Westerink & Timmerman, 1999). Thus, to allow for recovery, it is standard practice in
microdialysis experiments to leave microdialysis probes in situ for at least 24 hrs before
sampling is initiated (e.g. DiChiara & Imperato, 1988).
2. In vivo Electrochemistry
Electrochemistry can be applied to electrocative compounds such as the monoamines and
some of their metabolites (e.g. DOPAC) and ascorbic acid (Blaha & Phillips, 1996; Gerhardt &
Burmeister, 2000). Electroactive compounds oxidize easily, and in doing so give off electrons
that can be measured as current flow (Figure A1). While, electrochemical techniques have been

311Figure A1. Examples of electroactive compounds that can be detected in the ECF of the brain
using in vivo electrochemistry (modified from Blaha & Phillips, 1996). Oxidation of each species
results in the transfer of two electrons per molecule, which can be measured as current flow.
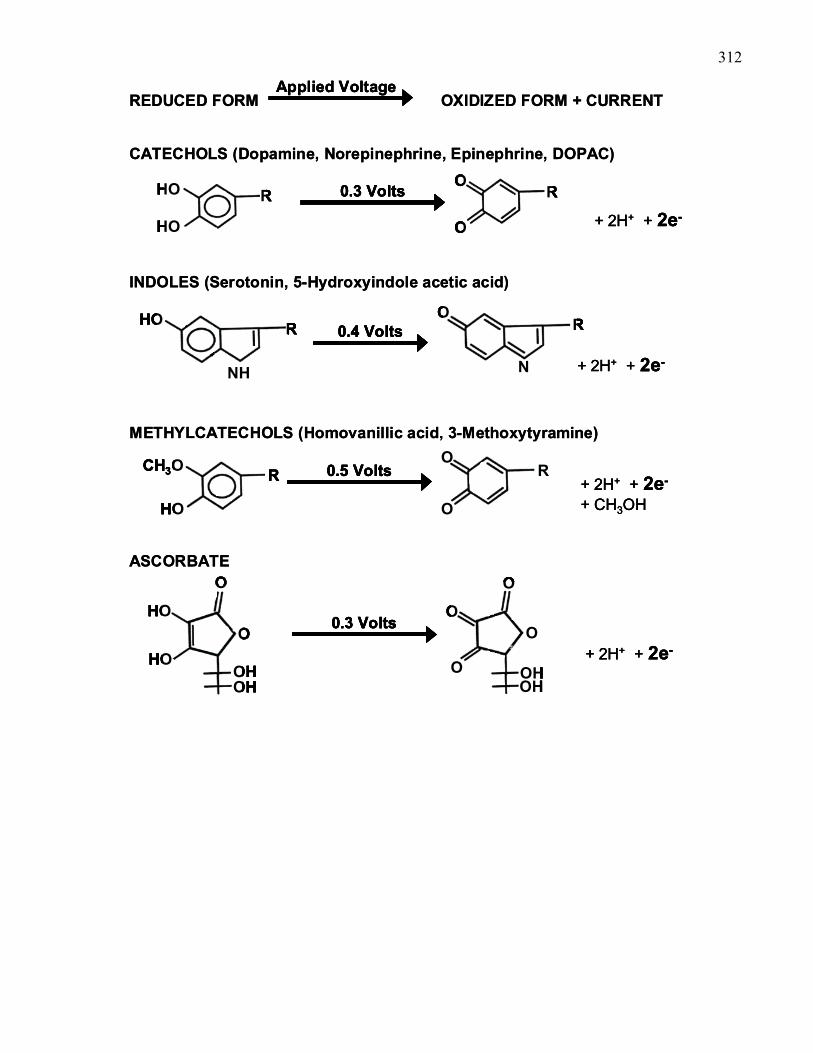
312
REDUCED FORM OXIDIZED FORM + CURRENTApplied Voltage
REDUCED FORM OXIDIZED FORM + CURRENTApplied VoltageApplied Voltage
O
O
RHO
HO
R 0.3 Volts
+ 2H+ + 2e-
CATECHOLS (Dopamine, Norepinephrine, Epinephrine, DOPAC)O
O
RHO
HO
R 0.3 Volts
+ 2H+ + 2e-
O
O
RO
O
RHO
HO
RHO
HO
R 0.3 Volts0.3 Volts
+ 2H+ + 2e-
CATECHOLS (Dopamine, Norepinephrine, Epinephrine, DOPAC)
HO
NH
RO
N
R0.4 Volts
+ 2H+ + 2e-
INDOLES (Serotonin, 5-Hydroxyindole acetic acid)
HO
NH
RO
N
R0.4 Volts
+ 2H+ + 2e-
HO
NH
RHO
NH
RO
N
RO
N
R0.4 Volts0.4 Volts
+ 2H+ + 2e-
INDOLES (Serotonin, 5-Hydroxyindole acetic acid)
CH3O
HO
RO
O
R0.5 Volts+ 2H+ + 2e-
+ CH3OH
METHYLCATECHOLS (Homovanillic acid, 3-Methoxytyramine)
CH3O
HO
RO
O
R0.5 Volts+ 2H+ + 2e-
+ CH3OH
CH3O
HO
RCH3O
HO
RO
O
RO
O
R0.5 Volts0.5 Volts+ 2H+ + 2e-
+ CH3OH
METHYLCATECHOLS (Homovanillic acid, 3-Methoxytyramine)
HO
HO
O
O
OHOH
O
O
O
O
OHOH
0.3 Volts
+ 2H+ + 2e-
ASCORBATE
HO
HO
O
O
OHOH
O
O
O
O
OHOH
0.3 Volts
+ 2H+ + 2e-
HO
HO
O
O
OHOH
HO
HO
O
O
OHOH
O
O
O
O
OHOH
O
O
O
O
OHOH
0.3 Volts0.3 Volts
+ 2H+ + 2e-
ASCORBATE
313traditionally limited to easily oxidizable chemical species (e.g. dopamine), advances allow for
the measurement of acetylcholine (Bruno et al., 2006; Burmeister et al., 2008), glutamate
(Burmeister & Gerhardt, 2001; Hascup et al., 2008), and serotonin (Daws, Toney, Davis,
Gerhardt, & Frazer, 1997).
2.1. Basic Principles of in vivo Electrochemistry
In vivo electrochemistry involves oxidation of the chemicals through the application of a
voltage potential. Similar to microdialysis, it involves the implantation of a probe, in this case
termed the working electrode, into the brain area of interest. This is probably the most important
component of the recording system. In the case of dopamine, two main types of working
electrode are commonly used, the carbon paste and carbon fiber electrode (Figure A2). A carbon-
based recording surface is used because it provides an electrochemically inert surface covered
with oxygen-containing functional groups, which allows for the occurrence of electron transfer
and hence measurement of the resulting current (Kawagoe, Zimmerman, & Wightman, 1993).
Furthermore, carboxyl groups on the carbon surface deprotonate at physiological pH (e.g. in the
brain), creating an anionic recording surface (Kawagoe et al., 1993). Anions, such as DOPAC
and ascorbic acid, consequently show a slower rate of electron transfer at the recording surface
relative to cations such as dopamine (Kawagoe et al., 1993). This results in distinctly different
electrochemical profiles for dopamine and DOPAC and/or ascorbic acid.
Reference and auxiliary electrodes are required in order to carry out the measures at the
working electrode smoothly, without a drift in the applied potential (Gerhardt & Burmeister,
2000). The auxiliary electrode is commonly made from stainless steel, but can also be made from
silver or platinum, and it is placed in contact with the animal at any convenient location. The
reference electrode is most commonly a silver/silver chloride wire that is placed into contact with
the brain or cerebrospinal fluid (Blaha & Phillips, 1996; Gerhardt & Burmeister, 2000). A
potentiostat, or electrometer, creates a circuit between the three electrodes and allows for the
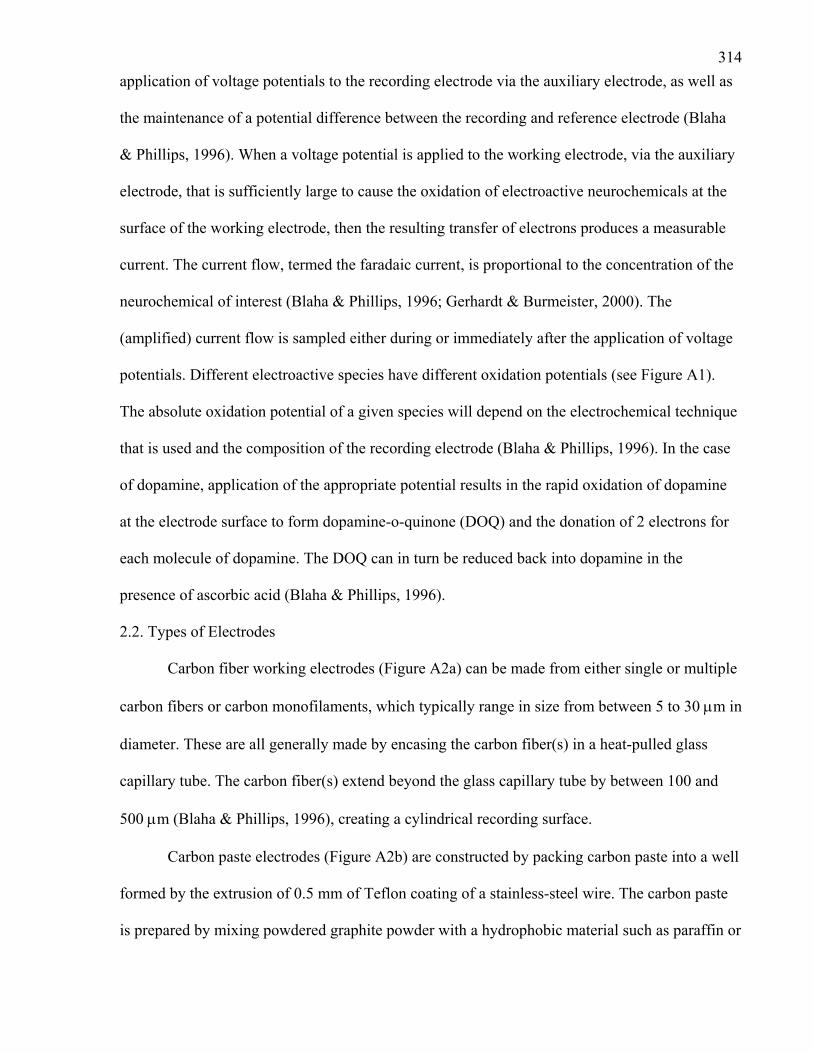
314application of voltage potentials to the recording electrode via the auxiliary electrode, as well as
the maintenance of a potential difference between the recording and reference electrode (Blaha
& Phillips, 1996). When a voltage potential is applied to the working electrode, via the auxiliary
electrode, that is sufficiently large to cause the oxidation of electroactive neurochemicals at the
surface of the working electrode, then the resulting transfer of electrons produces a measurable
current. The current flow, termed the faradaic current, is proportional to the concentration of the
neurochemical of interest (Blaha & Phillips, 1996; Gerhardt & Burmeister, 2000). The
(amplified) current flow is sampled either during or immediately after the application of voltage
potentials. Different electroactive species have different oxidation potentials (see Figure A1).
The absolute oxidation potential of a given species will depend on the electrochemical technique
that is used and the composition of the recording electrode (Blaha & Phillips, 1996). In the case
of dopamine, application of the appropriate potential results in the rapid oxidation of dopamine
at the electrode surface to form dopamine-o-quinone (DOQ) and the donation of 2 electrons for
each molecule of dopamine. The DOQ can in turn be reduced back into dopamine in the
presence of ascorbic acid (Blaha & Phillips, 1996).
2.2. Types of Electrodes
Carbon fiber working electrodes (Figure A2a) can be made from either single or multiple
carbon fibers or carbon monofilaments, which typically range in size from between 5 to 30 μm in
diameter. These are all generally made by encasing the carbon fiber(s) in a heat-pulled glass
capillary tube. The carbon fiber(s) extend beyond the glass capillary tube by between 100 and
500 μm (Blaha & Phillips, 1996), creating a cylindrical recording surface.
Carbon paste electrodes (Figure A2b) are constructed by packing carbon paste into a well
formed by the extrusion of 0.5 mm of Teflon coating of a stainless-steel wire. The carbon paste
is prepared by mixing powdered graphite powder with a hydrophobic material such as paraffin or

315Figure A2. Schematic diagrams of (A) carbon fiber and (B) carbon paste electrodes used for the
in vivo measurement of dopamine efflux (adapted from Blaha & Phillips, 1996).
316
A B
317silicone oil. This results in a disc-shaped active recording surface with an inside diameter of
typically 150 μm and an outer diameter of 200 μm. While the smaller size of carbon fiber
electrodes provides greater spatial resolution, their disadvantage is a smaller current measured,
and hence a greater noise-to-signal ratio (Kawagoe et al., 1993).
2.3. Selectivity for Dopamine
The natural properties of carbon result in distinct electrochemical profiles for anions and
cations, but this is not enough to ensure selectivity for the neurochemical of interest. Figure A1
shows that dopamine, ascorbic acid, and DOPAC all oxidize at the same potential.
Concentrations of DOPAC and ascorbic acid in the brain ECF are orders of magnitude higher
than that of dopamine, so electrochemical records will necessarily be composed of all three
species oxidizing at the working electrode surface (Blaha & Phillips, 1996). Thus to measure
dopamine with confidence, the electrode surface has to be modified in order to increase
selectivity for dopamine.
One method used to increase the selectivity of carbon fiber electrodes for dopamine is to
condition the recording surface electrochemically (Blaha & Phillips, 1996). Typically, triangular
potential waveforms are applied to the electrode in vitro (Gonon, Buda, Cespuglio, Jouvet, &
Pujol, 1981). The resulting high current densities at the carbon surface are thought to create an
oxide film on the surface of the carbon fiber that consequently accelerates the electron transfer
from ascorbic acid, resulting in its oxidation at a lower potential than dopamine and DOPAC
(Blaha & Philips, 1996). While this method reduces the effect of ascorbic acid, it does not
improve the selectivity for dopamine over DOPAC. Some have addressed this issue by inhibiting
the production of DOPAC through addition of an irreversible monoamine oxidase inhibitor, such
as pargyline (Gonon, Buda, Cespuglio, Jouvet, & Pujol, 1980; Gonon et al., 1981). Obviously
this creates a very artificial in vivo situation.
318A more commonly used method to improve the selectivity of carbon fiber electrodes for
dopamine is to coat the carbon fiber with a cation-exchange polymer such as Nafion (Blaha and
Philips, 1996; Gerhardt & Burmeister, 2000; Gerhardt, Oke, Nagy, Moghaddam, & Adams,
1984). The Nafion film largely excludes anions such as DOPAC and ascorbic acid, but is highly
permeable to cations such as dopamine (Gerhardt et al., 1984).
Carbon paste electrodes can be similarly treated to enhance selectivity for dopamine with
either electrochemical conditioning or Nafion coating. An alternative approach is to incorporate
a fatty acid (stearic acid) into the carbon paste mixture (Blaha & Lane, 1983; Blaha & Phillips,
1996). The principle here is similar to that of Nafion, with the fatty acid creating an anionic
recording surface that slows down the electron transfer from anions (DOPAC and ascorbic acid),
resulting in more positive oxidation potentials for these molecules (Blaha & Phillips, 1996).
Neither Nafion-coated carbon fiber nor stearate-modified carbon paste electrodes are
however able to distinguish between dopamine and other electroactive cations such as
norepinephrine and serotonin (see Figure A1). Thus, selectivity for dopamine can only be
ensured if either method is limited to taking electrochemical measures of dopamine from areas of
the brain that are known to have high concentrations of dopamine and low concentration of
serotonin and norepinephrine (i.e. the dorsal striatum and nucleus accumbens; Blaha & Phillips,
1996).
3. Electrochemistry Methods
The large variety of electrochemical techniques falls into two basic categories. On the
one, there are those methods that involve application of a voltage ramp (i.e. a sweep) to the
recording electrode, such as linear sweep voltammetry (LSV), cyclic voltammetry (CV), fast-
scan cyclic voltammetry (FCSV), differential pulse voltammetry (DVP), and differential normal
pulse voltammetry (DNVP) (Blaha & Phillips, 1996; Gerhardt & Burmeister, 2000). On the other
hand, there are those that involve applying a potential pulse, typically chosen as the oxidation
319potential of the neurochemical of interest, to the recording electrode for short durations. These
include fixed potential amperometry (FPA), chronocoulometry (CC) and chronoamperometry
(CA).
3.1. Voltammetry
With voltammetry techniques, the application of a voltage sweep results in oxidation of
several electroactive species at the surface of the working electrode, resulting in a
voltammogram that may have several peaks at different voltages, each peak corresponding to the
oxidation potential of a given electroactive species. In LSV, the potential applied to the working
electrode is linearly increased from an initial to a final value at a fixed sweep rate (typically
between 10-20 mV/s), and the current output is plotted in the form of a voltammogram, with the
current output plotted relative to the applied voltage. Linear sweep voltammetry with
semidifferentiation (LSV-SD) is a variant of this method where the semi-derivative of the output
is plotted to improve the resolution of peaks in the voltamogram (Gerhardt & Burmeister, 2000).
CV and FSCV both involve a steady ramping up of the potential from a starting potential,
which is typically below the oxidation potential of the species of interest, to a switching
potential, after which it is ramped back down to the starting potential. In each case, as the
potential becomes more positive (i.e. the anodic portion of the sweep), the electroactive species
is oxidized, and then as the potential becomes more negative (i.e. the cathodic portion of the
sweep) any of the oxidized species that has not diffused away from the electrode tip is reduced.
Consequently, with these methods both an oxidation and a reduction peak are obtained, and the
ratio of these two can be used to further help identify the neurochemical. What distinguishes the
two is the rate at which the potential sweep is applied. In CV it is between 10 and 300 mV/sec,
and in FSCV between 300 and 900 V/sec, resulting in repetition rates as high as 10 Hz (Gerhardt
& Burmeister, 2000).
320In DVP and DVNP, a voltage sweep is applied at a constant rate, with a potential pulse
superimposed at a fixed interval (Blaha & Phillips, 1996). The current is measured at the peak of
each pulse and subtracted from the current at the end of each pulse. The differential current is
plotted relative to the applied voltage, resulting in a voltammogram that has pronounced peaks.
In DVNP two successive pulses of a fixed potential difference are applied from a constant
baseline, with the amplitude of the double pulse increased at a constant rate. The difference in
current at the peak of each pulse in measured.
3.2. Amperometry
With amperometry techniques, the same potential pulse is repeatedly applied to measure
the oxidation current of only the neurochemical species of interest. In FPA the voltage potential
is applied to the electrode continuously, allowing for continuous recording of oxidation current.
This has the advantage of being able to measure events that occur very fast (200-1000 Hz) and is
also very sensitive. Since the potential is applied constantly, the background current recorded
from the electrode is very low, allowing for measurement of very small faradaic (i.e. oxidation)
currents. However, the problem with FPA is that fixing the potential can cause the analyte and its
oxidation products to adhere to the electrode surface, which will change its recording properties
(Gerhardt & Burmeister, 2000).
In CA (the method used in the present experiments), the potential at the working
electrode is instantaneously stepped up from a resting potential to a value above the oxidation
potential of the analyte of interest for a fixed duration at a fixed interval. In the case of using CA
to measure dopamine with carbon paste electrodes, the potential is instantly stepped from a
resting value of -0.15 V to 0.25 V for 1 sec, every 30-60 seconds (Blaha & Phillips, 1996). As
the potential is stepped up, the recorded current increases dramatically, and this is due to
charging current of the electrode and oxidation of the electroactive species (Gerhardt &
Burmeister, 2000). The charging current decays as the potential is held, and the faradaic (i.e.
321oxidation) current is measured and integrated over the final 50 ms of the 1000 ms pulse (Blaha &
Phillips, 1996). In CC, also referred to as high-speed chronoamperometry (HSC), a similar
procedure as in CA is used. This method has been successfully used in combination with carbon
fiber electrodes (Kiyatkin et al., 1993). Here the potential is instantly stepped from 0 to +0.55 V
and held there for 100 ms. The potential of +0.55 V greatly exceeds the oxidation potential of
dopamine and is chosen because it creates a rapid change in the current recorded that also rapidly
declines over time. The resulting current is measured and integrated over the final 80 ms of the
100 ms potential pulse, after the initial charging current has declined. What distinguished CC
from CA (other than different pulse amplitudes and durations) is the fact the reduction current
produced when the potential is stepped back down is similarly integrated and measured over the
final 80 ms of the 100 ms during which the potential is held at 0V. Similar to CV and FSCV, this
method provides an oxidation and reduction measure, the ratio of which can help in identifying
the analyte of interest (Gerhardt & Burmeister, 2000).
Each of the voltammetry and amperometry techniques discusses above have their
advantages and disadvantages. FSCV, traditionally used with untreated carbon fiber electrodes,
has been most extensively used to measure dopamine (Gerhardt & Burmeister, 2000) and has the
obvious advantage of allowing very rapid measurement of dopamine efflux. With this method
samples can be taken at 25 to 50 ms intervals. Studying very fast events like neurotransmitter
reuptake would require a method with the high temporal resolution of FSCV (Marsden et al.,
1988). Furthermore, the ratio of the oxidizing peak and reducing peak that is obtained by
applying both an anodic (oxidizing) and cathodic (reducing) sweeps can be used to further
identify the analyte of interest (Kawagoe et al., 1993; Gerhardt & Burmeister, 2000). In addition
the small size of carbon fiber electrodes minimizes tissue damage, and the high temporal
resolution means that discrete measures from small brain nuclei can be taken. The downside to
this is the fact that the small recording surface results in a greater noise-to-signal ratio (Kawagoe

322et al., 1993), and that the sensitivity of these electrodes is not high enough to measure basal
levels of dopamine (Marsden et al., 1988).

323Appendix A References
Blaha, C.D. (1996). Evaluation of stearate-graphite paste electrodes for chronic measurement of
extracellular dopamine concentrations in the mammalian brain. Pharmacology,
Biochemistry, and Behavior, 55, 351-364.
Blaha, C. D., & Lane, R. F. (1983). Chemically modified electrode for in vivo monitoring of
brain catecholamines. Brain Research Bulletin, 10, 861-864.
Blaha, C. D., & Phillips, A. G. (1996). A critical assessment of electrochemical procedures
applied to the measurement of dopamine and its metabolites during drug-induced and
species-typical behaviours. Behavioral Pharmacology, 7, 675-708.
Bruno, J. P., Gash, C., Martin, B., Zmarowski, A., Pomerleau, F., Burmeister, J., Huettl, P., &
Gerhardt, G.A. (2006). Second-by-second measurement of acetylcholine release in
prefrontal cortex. European Journal of Neuroscience, 24, 2749-2757.
Bungay, P. M., Morrison, P. F., & Dedrick, R. L. (1990). Steady-state theory for quantitative
microdialysis of solutes and water in vivo and in vitro. Life Sciences, 46, 105-119.
Burmeister, J. J., & Gerhardt, G. A. (2001). Self-referencing ceramic-based multisite
microelectrodes for the detection and elimination of interferences from the measurement
of l-glutamate and other analytes. Analytical Chemistry, 73, 1037-1042.
Burmeister, J.J., Pomerleau, F., Huettl, P., Gash, C.R., Werner, C.E., Bruno, J.P., & Gerhardt,
G.A. (2008). Ceramic-based multisite microelectrode arrays for simultaneous measures
of choline and acetylcholine in CNS. Biosensors and Bioelectronics, 23, 1382-1389.
Camp, D.M., & Robinson, T.E. (1992). On the use of multiple probe insertions at the same site
for repeated intracerebral microdialysis experiments in the nigrostriatal dopamine system
of rats. Journal of Neurochemistry, 58, 1706-1715.
324Daws, L.C., Toney, G.M., Davis, D.J., Gerhardt, G.A., & Frazer, A. (1997). In vivo
chronoamperometric measurements of the clearance of exogenously applied serotonin in
the rat dentate gyrus. Journal of Neuroscience Methods, 78, 139-150.
Dawson, L.A. (1997). Capillary electrophoresis and microdialysis: current technology and
applications. Journal of Chromatography B, 697, 89-99.
Di Chiara, G., & Imperato, A. (1988). Drugs abused by humans preferentially increase synaptic
dopamine concentrations in the mesolimbic system of freely moving rats. Proceedings of
the National Academy of Sciences U S A, 85, 5274-5278.
Forster, G. L., & Blaha, C. D. (2000). Laterodorsal tegmental stimulation elicits dopamine efflux
in the rat nucleus accumbens by activation of acetylcholine and glutamate receptors in the
ventral tegmental area. European Journal of Neuroscience, 12, 3596-3604.
Forster, G. L., & Blaha, C. D. (2003). Pedunculopontine tegmental stimulation evokes striatal
dopamine efflux by activation of acetylcholine and glutamate receptors in the midbrain
and pons of the rat. European Journal of Neuroscience, 17, 751-762.
Gerhardt, G.A., & Burmeister, J.J. (2000). Voltammetry in vivo for chemical analysis of the
nervous system. In R.A. Myers (Ed.) Encyclopedia of Analytical Chemistry. Chichester:
John-Wiley & Sons.
Gerhardt, G. A., Oke, A. F., Nagy, G., Moghaddam, B., & Adams, R. N. (1984). Nafion-coated
electrodes with high selectivity for CNS electrochemistry. Brain Reseach, 290, 390-395.
Gonon, F., Buda, M., Cespuglio, R., Jouvet, M., & Pujol, J. F. (1980). In vivo electrochemical
detection of catechols in the neostriatum of anaesthetized rats: Dopamine or Dopac?
Nature, 286, 902-904.
Gonon, F., Buda, M., Cespuglio, R., Jouvet, M., & Pujol, J. F. (1981). Voltammetry in the
striatum of chronic freely moving rats: Detection of catechols and ascorbic acid. Brain
Research, 223, 69-80.
325Hascup, K. N., Hascup, E. R., Pomerleau, F., Huettl, P., & Gerhardt, G. A. (2008). Second-by-
second measures of l-glutamate in the prefrontal cortex and striatum of freely moving
mice. Journal of Pharmacology and Experimental Therapeutics, 324, 725-731.
Kawagoe, K. T., Zimmerman, J. B., & Wightman, R. M. (1993). Principles of voltammetry and
microelectrode surface states. Journal of Neuroscience Methods, 48, 225-240.
Marsden, C.A., Joseph, M.H., Kruk, Z.L., Maidment, N.T., O’Neill, R.D., Schienk, J.O., &
Stanford, J.A. (1988). In vivo voltammetry – present electrodes and methods.
Neuroscience, 25, 389-400.
Murphy, N.P., Lam, H.A., & Maidment, N.T. (2001). A comparison of morphine-induced
locomotor activity and mesolimbic dopamine release in C57BL6, 129Sv and DBA2 mice.
Journal of Neurochemistry, 79, 626-635.
Stamford, J. A. (1989). In vivo voltammetry--prospects for the next decade. Trends in
Neuroscience, 12, 407-412.
Westerink, B. H. (1995). Brain microdialysis and its application for the study of animal
behaviour. Behavioral Brain Research, 70, 103-124.
Westerink, B. H. (2000). Analysis of biogenic amines in microdialysates of the brain. Journal of
Chromatography B Biomedical Applications, 747, 21-32.
Westerink, B.H., & Timmermann, W. (1999). Do neurotransmitters sampled by brain
microdialysis reflect functional release? Analytica Chimica Acta, 379, 263-274.
Zocchi, A., Girlanda, E., Varnier, G., Sartori, I., Zanetti, L., Wildish, G. A., Lennon, M.,
Mugnaini, M., & Heidbreder, C.A. (2003). Dopamine responsiveness to drugs of abuse:
A shell-core investigation in the nucleus accumbens of the mouse. Synapse, 50, 293-302.
