morphological and behavioural variation in ants:...
TRANSCRIPT
2015
UNIVERSIDADE DE LISBOA
FACULDADE DE CIÊNCIAS
DEPARTAMENTO DE BIOLOGIA ANIMAL
Morphological and Behavioural Variation in Ants:
Comparing species, castes and individuals
Mestrado em Biologia Evolutiva e do Desenvolvimento
Andreia Filipa Eusébio Vincent Teixeira
Dissertação orientada por:
Patrícia Beldade | Instituto Gulbenkian de Ciência
Sara Magalhães | Faculdade de Ciências da Universidade de Lisboa
First I would like to thank Patrícia for her patience throughout this year that I spent in her lab.
I would like to thank Roberto for all the teaching and discussion about this amazing non-model
organism and also for encouraging me to pursue what I want as a scientist. Thank you for
showing me the museum specimens’ utility and its importance for science. And especially for
making me want to keep my own insect collection!
Also want to thank professor Élio for his precious time spent on teaching me how to design
degenerated primers and answering to (sometimes not so) useful questions.
And thank Sara Magalhães for all the support and advice in this final effort.
I want also to thank to all VDS lab for all the support and for teaching me how to work as part
of a team.
To all Evo-Devo community at the IGC for providing me the most inspiring year that I could
ever had.
I want to thank all my friends for their enormous patience and support during a very
complicated year, and also apologize for the lack of attention. To Mariana and Miguel for every
laugh they pulled out of me. To Melinho that always remembered me what I can do and above
all what I should do. To Vasco for remembering me that not only scientists-wannabe have a
difficult life. To Barateiro for all the hugs and loud discussions, not only about science.
To my dearest friend Gonçalo that have always been an example and always had the time to
ask how I was doing, even being 16000km and 9 hours in time zone away.
In last I would like to thank my two musketeers for the companionship during this troubled
journey. Thanks to Ana Catarina and Ana Sofia for all the laughs, brain-farts and late hours
spent (not only) at that institute (not always) working.
Especially to Ana Sofia that listened to me so many times, even when she doesn’t want to.
Honestly I don’t know what to say.
In last I what to thank my heroine Filomena, my sweet grandmother that always supported me
and helped me to accomplish my objectives and finish this long journey. And to my
grandfather Augusto, that unfortunately won’t be able to see me closing this chapter of my
life. I wish you were here.
If I could probably these acknowledgements would be bigger than my thesis.

Abstract
Environment plays a fundamental role in living organisms’ adaptation and selection.
Developmental plasticity allows individuals to sense the surrounding environment and produce
different phenotypes in response to biotic and abiotic cues. Individuals are exposed to these
cues during larval phase and transduce it to shape and size adaptations in the adult. Social
insects are a good (non-)model organism to study developmental plasticity since they present
dramatic castes differences. The reason behind ants’ ecological success is division of labour
and each colony is divided in groups according to specific tasks, like reproduction and colony
defence. Morphology appeared early as a caste defining factor, but soon age and physiology
were included in the list. Extreme dimorphism between queens and workers demonstrated
that morphology and behaviour should not be considered independent traits and species
whose worker caste is divided in sub-castes highlighted that more attention should be paid to
within caste variation and specializations. Morphology is determined by growth during
development and thus regulated by juvenile hormone and ecdysone, which together can
reprogram metamorphosis timing. In this work we compare species, castes and individuals
morphology and can have an overview of how much variation is found between and within
groups. Within worker castes we performed a detailed analysis on morphology and behaviour
and found some task division signatures, even in monomorphic castes. Finally we simulated
environmental cues by manipulating endogenous hormonal levels and to know if a
monomorphic species is able to produce intermediate phenotypes when exposed to the same
conditions as dimorphic species. Our morphometric analysis demonstrated that we could find
more differences between than within castes, and also allowed us to suggest the existence of
more caste-related traits in contrast with other more species-related. Intra-caste analysis
suggested the existence of task-specific behavioural groups within monomorphic colonies.
Hormonal manipulation results were affected by the nature of compounds used and also by
the absence of a specific dosage-response curve for species used. However we could also
address some colony specificity in the response to treatments, and differential sensibility to
these.
Key words: behavioural castes, caste determination, developmental plasticity, juvenile
hormone, monomorphic.
Resumo
A morfologia afecta todos os aspectos do ciclo de vida de um organismo. Há uma relação
muito próxima entre o tamanho e forma de um determinado indivíduo e o comportamento
que este adquire num determinado ambiente. O comportamento de cada indivíduo vai
também afectar e moldar o ambiente em que este é seleccionado, tornando todas estas
interacções mais complexas. Contudo alguns indivíduos conseguem ajustar o seu
desenvolvimento e fenótipo ao ambiente em que se encontram, e esta plasticidade fenotípica
permite que um indivíduo, a partir de um genoma, possa produzir diferentes fenótipos de
acordo com os estímulos a que é exposto.
Os estímulos ambientais que provocam alterações no fenótipo do adulto só poderão ser
efectivos se acontecerem em períodos de tempo específico durante o desenvolvimento, em
que o indivíduo é capaz de sentir e traduzir o que se passa no ambiente envolvente e activar
uma via que produz o fenótipo mais adequado. Estes estímulos podem ser bióticos, como a
presença ou ausência de predadores para as Daphnia e a densidade populacional para os
gafanhotos; ou abióticos, como a temperatura em Byciclus e a nutrição na produção de castas
em insectos sociais.
Os Hymenoptera são um grupo maioritariamente constituído por insectos sociais, e foi a sua
enorme diversidade morfológica e comportamental que permitiu a sua adaptação a vários
nichos ecológicos. Um dos factores que mais contribuiu para o sucesso ecológico deste grupo
foi a divisão de tarefas, isto é, cada grupo de indivíduos dentro de uma colónia especializar-se-
á numa determinada tarefa, defesa, forrageio ou responsáveis por cuidar das larvas, por
exemplo. Este grupo ao qual pertencem as vespas, abelhas, térmitas e formigas tem sido
muito útil para perceber como é que esta divisão de tarefas causou o aparecimento de castas.
As formigas têm um sistema haplo-diplóide de determinação de sexo, em que todos os ovos
fertilizados são diplóides e por isso originam fêmeas, enquanto os ovos não fertilizados são
haplóides e originarão machos. Para além do comportamento e sazonalidade que se
encontram associados a cada sexo, as formigas apresentam castas e, por vezes, sub-castas, o
que as torna um modelo adequado para responder a questões relacionadas com plasticidade e
de que forma esta pode ser moldada durante o desenvolvimento.
As colónias são quase sempre constituídas por fêmeas, produzidas por rainhas fertilizadas, e
um dos típicos exemplos do sistema de castas é a diferença de fenótipos que podemos
encontrar entre as rainhas e as obreiras. Ao serem responsáveis por tarefas tão distintas, que
envolvem um consumo energético tão diferente, estes indivíduos permitiram que a selecção
actuasse sobre os fenótipos que melhor se adequavam a cada função. No entanto sabendo
que as fêmeas são geneticamente idênticas podemos afirmar que o desenvolvimento larvar é
o períodos-chave para que o indivíduo identifique os estímulos que o rodeiam e produza o
fenótipo que melhor se adapta ao ambiente.
As alterações ao desenvolvimento são induzidas pela nutrição, e no caso das formigas
sabemos que o que provoca esta alteração é a quantidade de comida que as larvas recebem. A
nutrição vai afectar os níveis hormonais endógenos, neste caso em particular da hormona
juvenil, e uma das consequências é a alteração do limite de peso crítico necessário para que o
indivíduo sofra metamorfose. As manipulações hormonais em larvas de insectos sociais foram
o primeiro passo para compreender como é que estes sinais são interpretados pelo indivíduo e
quais são os processos envolvidos na produção de fenótipos tão distintos. O período larvar
está dividido em cinco estádios: primeiro, segundo e terceiro estádios larvares, pré-pupa e
pupa; e é no final deste período que a metamorfose ocorre. A determinação de castas ocorre
nas fases iniciais, enquanto as especializações associadas a sub-castas de obreiras são
determinadas nas fases mais tardias.
As sub-castas também terão surgido em resposta à selecção, produzindo morfologias ou
secreções particulares de acordo com a função mais necessária à colónia. Isto conduziu à
classificação da espécies de acordo com a variação que podemos encontrar em tamanho e
forma dentro da casta das obreiras, podendo estas serem classificadas como monomórficas,
dimórficas ou polimórficas. As espécies monomórficas apresentam uma ligeira variação em
tamanho entre os indivíduos; as dimórficas apresentam fenótipos muito distintos,
considerados como unidades discretas em resposta a um determinado gradiente ambiental; e
as polimórficas têm uma distribuição muito ampla de tamanho e forma dos indivíduos ao
longo desse mesmo gradiente. É importante perceber qual o grau de plasticidade associado a
cada um destes casos e se os fenótipos produzidos se devem à não exposição a determinados
estímulos ou se o genoma foi seleccionado para responder apenas quando necessário. Será
que diferentes graus de dimorfismo se devem a diferentes sensibilidades aos estímulos
ambientais?
Para respondermos a este tipo de questões devemos primeiro focar-nos na caracterização
detalhada, morfológica e comportamental, das espécies, castas e colónias. Estudos anteriores
demonstraram que o tamanho e forma dos indivíduos são influenciados não só pelo ambiente
mas também pela colónia em que estes se inserem. Isto relembra a importância de estudos
descritivos e comparativos no que respeita à compreensão das bases evolutivas.
Neste estudo fazemos uma comparação morfológica detalhada entre espécies, castas, colónias
e indivíduos, aprofundando os conhecimentos relativamente à variação que pode ser
encontrada e associada a cada um destes níveis de organização. No entanto sabemos também
que a divisão de tarefas e de castas depende não só da fisiologia do indivíduo em fase larvar
mas também em fase adulta. Para além das habituais castas morfológicas podemos também
referir castas comportamentais, que podem ser ou não dependentes da idade dos indivíduos.
O nosso grupo de espécies analisadas incluiu indivíduos com uma casta de obreiras
monomórfica disponíveis em laboratório, Aphaenogaster senilis, e por isso analisámos em
maior detalhe a sua morfologia e comportamento na tentativa de encontrar possíveis sub-
grupos associados à divisão de tarefas. A relação entre a distribuição preferencial dos
indivíduos e a sua complexa rede de interacções já se demonstrou fundamental para a
organização das colónias, por isso usámos como indicador de divisão de tarefas a localização
dos indivíduos na colónia. Verificámos que embora seja possível encontrar algumas diferenças
morfológicas entre indivíduos que se encontram fora e dentro do formigueiro, é relativamente
ao comportamento que se pode sugerir uma real divisão de tarefas nesta espécie. Mostramos
que há uma forte tendência para que indivíduos encontrados fora do formigueiro se
mantenham lá, sendo os possíveis responsáveis pelo forrageio e recolha de comida para a
colónia.
Outra questão importante é a capacidade de espécies monomórficas responderem a um
gradiente de estímulos ambientais que afecte os indivíduos em diferentes fases do período
larvar. Poderão alterações em fases mais tardias resultar no surgimento de fenótipos ou
características intermédias entre as típicas castas? Manipulámos directamente os níveis da
hormona juvenil nas larvas de A. senilis e os nossos resultados demonstram uma ausência de
resposta por parte dos indivíduos. No entanto, a elevada taxa de mortalidade associada aos
nossos tratamentos, a ausência de curvas de dosagem para os compostos utilizados e a
incerteza acerca da efectividade das nossas manipulações representam possíveis problemas e
dificultam explicações para os nossos resultados.
Este trabalho demonstra a importância que os trabalhos descritivos e comparativos continuam
a ter, bem como a relevância que o estudo da morfologia e comportamento dos organismos
mantêm numa era que favorece visões mais abrangentes e questões mais gerais, tendo como
base a genómica e a epigenética. Compreender a história natural dos nossos organismos
modelo, e principalmente dos nossos organismos não-modelo, continua a ser fundamental
para completar e integrar o que nos permitem concluir trabalhos com uma base molecular.
Palavras-chave: castas comportamentais, determinação de castas, hormona juvenil,
monomórfica, plasticidade fenotípica.
8
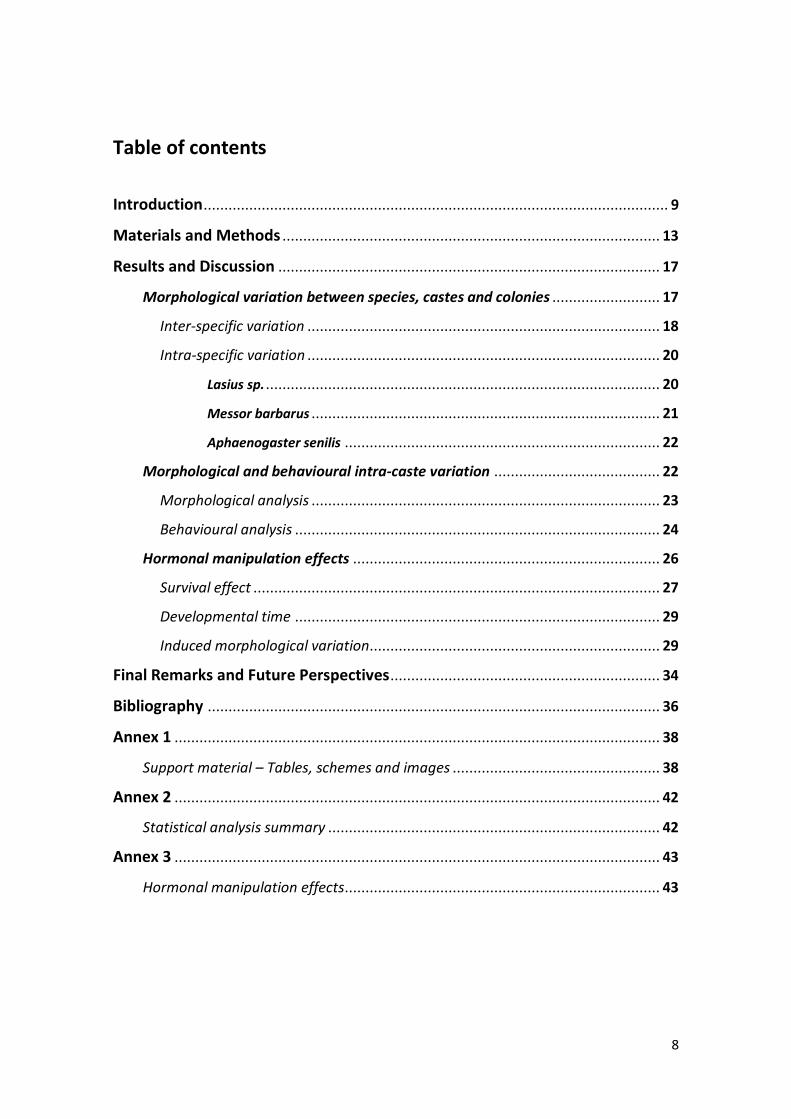
Table of contents
Introduction ................................................................................................................ 9
Materials and Methods ........................................................................................... 13
Results and Discussion ............................................................................................ 17
Morphological variation between species, castes and colonies .......................... 17
Inter-specific variation ..................................................................................... 18
Intra-specific variation ..................................................................................... 20
Lasius sp. ............................................................................................... 20
Messor barbarus .................................................................................... 21
Aphaenogaster senilis ............................................................................ 22
Morphological and behavioural intra-caste variation ........................................ 22
Morphological analysis .................................................................................... 23
Behavioural analysis ........................................................................................ 24
Hormonal manipulation effects .......................................................................... 26
Survival effect .................................................................................................. 27
Developmental time ........................................................................................ 29
Induced morphological variation...................................................................... 29
Final Remarks and Future Perspectives ................................................................. 34
Bibliography ............................................................................................................. 36
Annex 1 ..................................................................................................................... 38
Support material – Tables, schemes and images .................................................. 38
Annex 2 ..................................................................................................................... 42
Statistical analysis summary ................................................................................ 42
Annex 3 ..................................................................................................................... 43
Hormonal manipulation effects ............................................................................ 43
9
Introduction
Body shape and size are crucial properties of multicellular organisms. They both condition and
reflect modes of life and affect a series of other traits, including behavioural and life-history
traits. They are also highly diversified, with sometimes very extreme variation both within and
between species. Size and shape evolve in response to various selective pressures [1-5]. The
evolutionary potential of these traits is translated from an intricate relationship between
morphology, behaviour and environment [5]. Often an organism’s morphology influences its
behavioural repertoire and can itself affect the environment where individuals are selected.
These changes in the environment can, in turn, lead to morphological specializations and
behaviour adjustments. Morphological studies lost some attention along the years and are
constantly being replaced by detailed analysis at the molecular level, including genetic and
epigenetic characterizations. It is unfortunate that many recent studies seem to overlook the
importance of morphological descriptions that keep up with the detail and sophistication of
molecular analysis that is now standard [6].
Like is typical of quantitative traits, variation in body shape and size depends both on genetic
and environmental factors and on the interactions between them [3, 7]. Especially in insects we
can find several examples of how the external environment can influence shape and size.
Environmental factors that affect the development of body shape and size can be biotic or
abiotic, and include nutrition as a prime example [7]. In dung beetles, for example, nutrition
during larval development affects adult body and male horn size, as well as reproductive
strategies [8]. Phenotypic plasticity is a phenomenon through which the same genotype can
produce different phenotypes in response to external environmental cues and it is very
common in nature. Numerous studies reported examples where organismal developmental
trajectories and outcomes are affected by various external environmental factors, including
temperature, presence or absence of predators, population density and nutrition, as referred
[9].
Social insects, ants in particular, have long been prime examples in evolutionary and
developmental studies, including in relation to behavioural and morphological traits. Even
Charles Darwin looked for the existence of fertile and sterile groups within species as a test for
his theory [10]. Ants’ ecological dominance in terrestrial ecosystems and extreme evolutionary
diversification contrasts with the difficulties inherent to not being classical lab models with
limited analytical tools and resources [11]. Targets of many biological questions regarding social
insects’ biology still care for an answer.
10
Ants have a haplo-diploid sex determination system, where all diploid eggs develop into
females and haploid eggs develop into males [11]. Generally only queens have structural and
behavioural support to fertilization, which includes numerous ovarioles, spermatheca – to
store sperm – and wings, used in conspicuous mating flights. Consequently, generally, only
queens are able to produce diploid eggs. Haploid eggs can be laid by queens and/or workers,
depending on the species of ants. Some species have workers with reproductive potential,
called gamergates, which are responsible by haploid eggs production [12].
Ants and other social insects are characterized by a complex social organization with division of
labour between different groups of individuals within colonies, each one with particular
morphology and function, called castes. Queens are generally winged and ensure the colony
reproduction, while workers are responsible for colony maintenance, including tasks such as
foraging, cleaning and brood care [11]. Queens and workers typically differ in total body size,
albeit not as dramatically in all species, and differ also in body shape [11, 13]. Particularly,
differences in thoracic organization have been described and associated to the specialized
tasks of each caste. In queens we observe an enlarged T2, where the muscles that power the
wings are inserted, in relation to T1 and T3. Workers, on the other hand have a relatively
enlarged first thoracic segment, T1, where the muscles that power head movements are [5].
Moreover, queens of different species can be separated based on T1/T2 ratios in a manner
that associates with whether queens do or not forage when establishing new colonies [5].
Aside striking differences between queens and workers, in many ants there are also sub-
groups or sub-castes of workers with distinct morphologies associated with distinct functions
in the colony life. A good example are some Pheidole species where minor and major workers
have extremely different phenotypes, and further sub-division of major in soldiers or super-
soldiers, castes produced specifically for colony defence [14,15]. On the other hand
Pogonomyrmex, Solenopsis and Messor are characterized by extensive size and shape variation
within the worker caste and thus classified as polymorphic species [16-19]. This wide range of
variation is opposite to what was described for species with discrete castes, where variation
presents modest values [20]. Some ants’ species can even present intermediate characteristics
or inter-castes, presenting individuals with a “hybrid phenotype” between queen and worker
[21].
Worker polymorphisms have been used in allometry studies to better understand how growth
rates can differ between body parts. For example, in Solenopsis species worker size increases
with increasing colony size, but some body parts grow disproportionally [18, 20]. These
differential growth rates within single individuals will allow morphological differentiation, later
resulting in function specializations and division of labour within workers [16]. While division of
11
labour is associated to morphological specializations of castes and sub-castes, the latter is not
strictly necessary for the former. Studies have found that even morphologically monomorphic
castes can still have behavioural and functionally specialized sub-groups [10, 16]. For example,
morphologically monomorphic sub-castes include temporal castes, in which different tasks are
ensured by individuals of different ages [22]. This seems to be more common among
Hymenoptera than morphological castes. Age polyethism has been described in many species
and usually entails that younger workers are responsible for feeding and nursing and spend
most of the time inside the nest, while older workers are responsible for foraging outside the
nest [10, 22]. Aside temporal castes, morphologically monomorphic division of labour can also be
associated to glandular morphology or secretory products and levels [22]. Examples of such
“physiological castes” include specialized pathfinders in Pharaoh ants (Monomorium
pharaonic) and specialized brood-care workers in ponerine ants (Ectatomma tuberculatum) [22,
23]. Finally, in some cases complex patterns and networks of group interactions within a colony
can also contribute to some hierarchic division of labour that does not associate with
morphologically distinct sub-castes [24].
Although the lack of information on sociometry and sociogenesis is considerably high and
evolutionary origin of castes and sub-castes remains a topic of discussion, much has been
discovered regarding developmental plasticity in social insects [25]. Several studies
demonstrated that castes are a product of differential feeding and consequential different
pathways activated during development in response to internal hormonal levels [14, 26-27].
Ants are holometabolous insects and their development is divided in three larval instars
corresponding to the growth phase before metamorphosis [26]. After eclosion body size
remains unchangeable throughout adulthood [10, 26]. It is the quantity and/or quality of
nutrition during the larval phase that determines body size and also caste differentiation.
Nutrition determines caste formation mediated by juvenile hormone levels and DNA
methylation [27-29]. Most studies underlying DNA methylation and changes in expression were
developed in honeybees but some recent works confirmed an important role of caste-specific
methylomes in ants [28]. It is known that nutrition directly impacts hormone endogenous levels
[26]. Larval neurosecretory system translates endocrine dynamics to specific developmental
time points and thresholds defining the minimal conditions required to undergo
metamorphosis [14, 26]. Juvenile phase maintenance is sustained by juvenile hormone while
larvae – pupa – adult transformations are held by ecdysone. JH is produced in corpora allata,
near the brain, and it will be the responsible for developmental time delay, being thus involved
in developmental switches needed for caste determination [30-32]. These developmental
switches can occur earlier or later in development having different effects on phenotypes and
12
it depends on the species. Lab studies that artificially lead to increase (using methoprene, a JH
analogue) or decrease (using precocene) of JH levels, independently of nutrition, have allowed
characterization of the sensitive time points and threshold levels [14, 26]. Precocene will affect
corpora allata cells and decrease JH secretion, meaning that when applied it will induce
precocious metamorphosis and consequently miniature versions of adult insects [33].
Specifically precocene II was proved to be effective on Solenopsis invicta dealation process,
which means it is interfering also with adult individual maturation processes naturally induced
by JH [34]. Environmentally-induced caste determination, between queens and workers, occurs
during first and second larval instar and sub-castes are determined in late larval instars, usually
after individuals were already determined as workers. Only well-fed larvae are able to develop
into queens, since high nutrient intake induces corpora allata to secrete more JH [26].
Reprogramming in late larval instars will allow individuals to grow more and for longer periods,
and will allow them to allocate resources to specific structures breaking the default worker
developmental program [26].
Many studies focused on characterizing the morphology and underlying development of
different castes and sub-castes of ants. Much less attention has been given to intra-caste
differences and to plasticity in males. Here we propose to understand not only how
morphology changes both in size and shape across species with different ecologies but also to
analyse in detail the morphological and behavioural variation present within castes and
colonies. Using different species, each one displaying a different dimorphism degree, will also
allow us to better understand morphological variation according to organizational system with
emphasis on monomorphic species. We will also perform hormonal manipulation experiments
to adress monomorphic species response to artificial environmental gradients and preliminary
observations of haploid genomes response to similar cues.
13
Materials and methods
Biological material
We focused on three ant species with different degrees of female plasticity, reflected also in
extent of queen-worker size dimorphism: Aphaenogaster senilis, with a monomorphic worker
caste; Messor barbarus representing a stronger queen-worker size dimorphism and
polymorphic worker caste; and Lasius sp. also with a strong queen-worker size dimorphism but
with a monomorphic worker caste. All colonies were collected in the vicinity of the host
institution (Oeiras, Portugal – see Annex 1, Table S1). For A. senilis, we maintained colonies in
the laboratory, while for the other two species wild-caught individuals were collected and
immediately analysed. We analysed queen and worker morphology for all three species, and
did experiments in female larvae for A. senilis (Annex 1, Table S1).
All A. senilis lab colonies were kept in incubators under controlled conditions, 27°C, 60%
humidity and a 12:12 hours of light:dark cycle. Colonies were feed with frozen Drosophila and
pieces of orange each two days, with sugar cubes and water provided ad libitum. They were
placed in plastic boxes of 40 x 30 x 30cm and the boxes inside “walls” were covered with fluon,
to prevent ants being able to escape. Each box contained a nest simulator with two
compartments of cylindrical shape (10 x 6cm each one) both made of dark material to provide
darkness and separated from each other by a grid. The ants with their larvae were on the top
compartment, from which they could access the outside for foraging, and the bottom
compartment was kept full of water to provide high humidity (scheme on Fig. S1A, Annex 1).
A. senilis colonies were kept in queen-right and/or queen-less status to control larvae
production. Queen-less colonies were either obtained from the field or generated in the lab by
splitting field-collected queen-right colonies in two groups with the approximate same number
of workers, one with the queen laying fertilized eggs that will develop to be diploid larvae and
later adult females, and one without a queen or juveniles where workers were able to lay
unfertilized eggs that will produce haploid larvae and adult males.
Morphological measurements
We measured a series of morphological traits to assess differences between species, castes,
colonies and individuals (un-manipulated individuals) and between hormonal treatments (only
for females). We measured different body parts and traits for each we expected differences
between castes and species. We measured the length of the first (T1) and second (T2) thoracic
lengths and the total thorax length for each individual, known to distinguish queens from
14
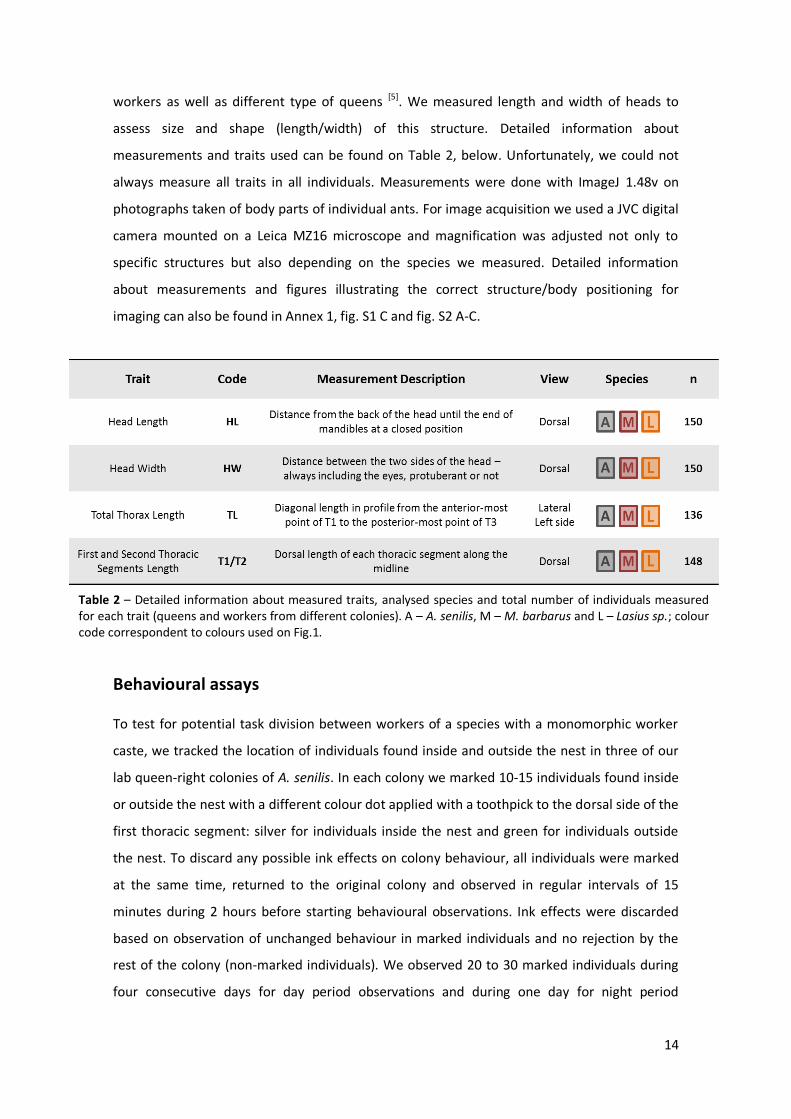
workers as well as different type of queens [5]. We measured length and width of heads to
assess size and shape (length/width) of this structure. Detailed information about
measurements and traits used can be found on Table 2, below. Unfortunately, we could not
always measure all traits in all individuals. Measurements were done with ImageJ 1.48v on
photographs taken of body parts of individual ants. For image acquisition we used a JVC digital
camera mounted on a Leica MZ16 microscope and magnification was adjusted not only to
specific structures but also depending on the species we measured. Detailed information
about measurements and figures illustrating the correct structure/body positioning for
imaging can also be found in Annex 1, fig. S1 C and fig. S2 A-C.
Behavioural assays
To test for potential task division between workers of a species with a monomorphic worker
caste, we tracked the location of individuals found inside and outside the nest in three of our
lab queen-right colonies of A. senilis. In each colony we marked 10-15 individuals found inside
or outside the nest with a different colour dot applied with a toothpick to the dorsal side of the
first thoracic segment: silver for individuals inside the nest and green for individuals outside
the nest. To discard any possible ink effects on colony behaviour, all individuals were marked
at the same time, returned to the original colony and observed in regular intervals of 15
minutes during 2 hours before starting behavioural observations. Ink effects were discarded
based on observation of unchanged behaviour in marked individuals and no rejection by the
rest of the colony (non-marked individuals). We observed 20 to 30 marked individuals during
four consecutive days for day period observations and during one day for night period
Table 2 – Detailed information about measured traits, analysed species and total number of individuals measured for each trait (queens and workers from different colonies). A – A. senilis, M – M. barbarus and L – Lasius sp.; colour code correspondent to colours used on Fig.1.
15
observations. Day period observations were done in the afternoon, and we did five
observations per day in 1 hour intervals. In night period we did four observations divided in 30
minutes intervals. During the observations we took note of the individuals’ location within the
colony by counting number of green and silver dots seen outside the nest (to avoid
disturbances caused by opening a nest). To correct for total number of individuals we also
counted and removed green and silver-marked dead individuals.
Hormonal manipulations
We did manipulations of JH hormones on A. senilis diploid larvae (produced by fertilized
queens and isolated from our queen-right colonies).
For the JH manipulation experiments we staged larvae by size as well as morphology and size
of their mandibles and hairs [35-37]. We decided to manipulate individuals only on second larval
instar (L2) once it has been described as the stage limit for larvae bipotency – able to produce
a worker or a queen development [38].
Three treatments were done by topically applying 1µl of one of three different solutions to
each larva abdominal part (see scheme on Fig. S1 B, Annex 1 [15]. The three treatments
corresponded to: 1) control (CTR) with application of acetone, the organic solvent where the
other compounds were dissolved; 2) a JH- treatment with application of precocene II (Santa
Cruz Biotechnology), an antagonist of juvenile hormone that have a cytotoxic effect on corpora
allata cells decreasing JH production [26]; and 3) a JH+ treatment with application of
methoprene (Sigma-Aldrich), a JH agonist that mimic the original molecule and is able to
activate JH-mediated pathways, reprogramming critical size and delaying metamorphosis
timing [15]. Both methoprene and precocene II were dissolved on acetone to a range of
concentrations, but we only obtained adult individuals from two of the concentrations used,
one for each compound. In JH+ treatment we applied a 5µg/µl concentration, reported as
effective concentration in production of major workers in Pheidole bicarinata, for example [15];
and in JH- treatment we opted for a 2µg/µl concentration, considered appropriate after
experiments where higher concentration of precocene II inhibits dealation in adults in
Solenopsis invicta, correspondent to a delay on reproductive maturation process [34].
In each manipulation round, we collected larvae from one of our colonies, selected those of
the target stage and split them into three groups with the approximate same number of
larvae, one per treatment. After the treatment, the larvae of each group were transferred into
separate small plastic boxes (20 x 20 x 7cm), with 20 workers from the same source colony and
left to develop until adulthood.
16
After eclosion adults were kept in 70% ethanol for measurements.
Data analysis
All analyses were performed with R, version 3.2.2. For all analyses, residuals of the models
have been tested for normality using Shapiro-Wilk (alpha = 0.05), and equality of variances
using Levene’s test. When comparing variances between groups we can quantify the
difference between groups. This data together with distribution plots for each trait allow us to
suggest which group presents more or less variation for that specific trait. We used Levene’s
test to know if we can group colonies when comparing species, based on their homogeneity of
variances. All Levene’s test results are summarized in Table S3. In the first part of results,
relative to morphological variation within species, and between castes and colonies, we used
Kruskal-Wallis test for all traits, after finding some of them that did not meet normal
distribution assumption. We used simple models to test each trait within species (trait~colony
or trait~caste) and between workers of different species. Unbalanced samples do not allow us
to compare every group of individuals in inter-species comparisons, so we selected three
groups of workers with approximate same number of individuals and tested each trait in
function of species (trait~species). For A. senilis we tested whether traits differed between
workers found inside versus outside the nest (trait~location) for both colonies (A1 and A2)
using Wilcoxon test.
Behavioural data showed normal distribution and was analysed using ANOVA (analysis of
variance) to test effect of colour – correspondent to their location when marked – on their
“preferential” location during observation. For our statistical analysis we compared the
probability of finding a specific group of individuals outside, testing a general linear model
(location~observation+colony*colour) and analysing deviance for each period of the day
separately.
Hormonal manipulations comparisons depended on trait. Pearson’s Chi-squared test was used
to test mortality differences between colonies. Developmental time and morphological traits
were tested for possible effects of treatment, colony and their interaction
(trait~colony*treatment) using ANOVA. When significant differences were found, we used
Tukey’s post-hoc pairwise comparisons to establish which groups differed from each other. For
each group of individuals, in this specific case each treatment within colonies, different letters
indicate pairwise comparisons that revealed statistically significant differences.
17
Results and Discussion
Morphological variation between species, castes and colonies
To better understand the morphological variation between ant groups we decided to start
with comparisons between species, castes and colonies. In this first figure panel we wanted to
highlight the differences found in size and shape between and within the three species used,
between and within castes from each of these species and also between colonies and
individuals within castes. We should mention that numerical labels used to distinguish colonies
in different results topics are merely informative to each one of them and does not always
correspond to true colonies ID; these can be found on Annex 1, Table S1.
We should underlie that our Y axis changes its range depending on each trait. In annex 1 we
present some of the images used for each trait measurement, and you can confirm that we are
not expecting the same scale for every trait across castes and species.
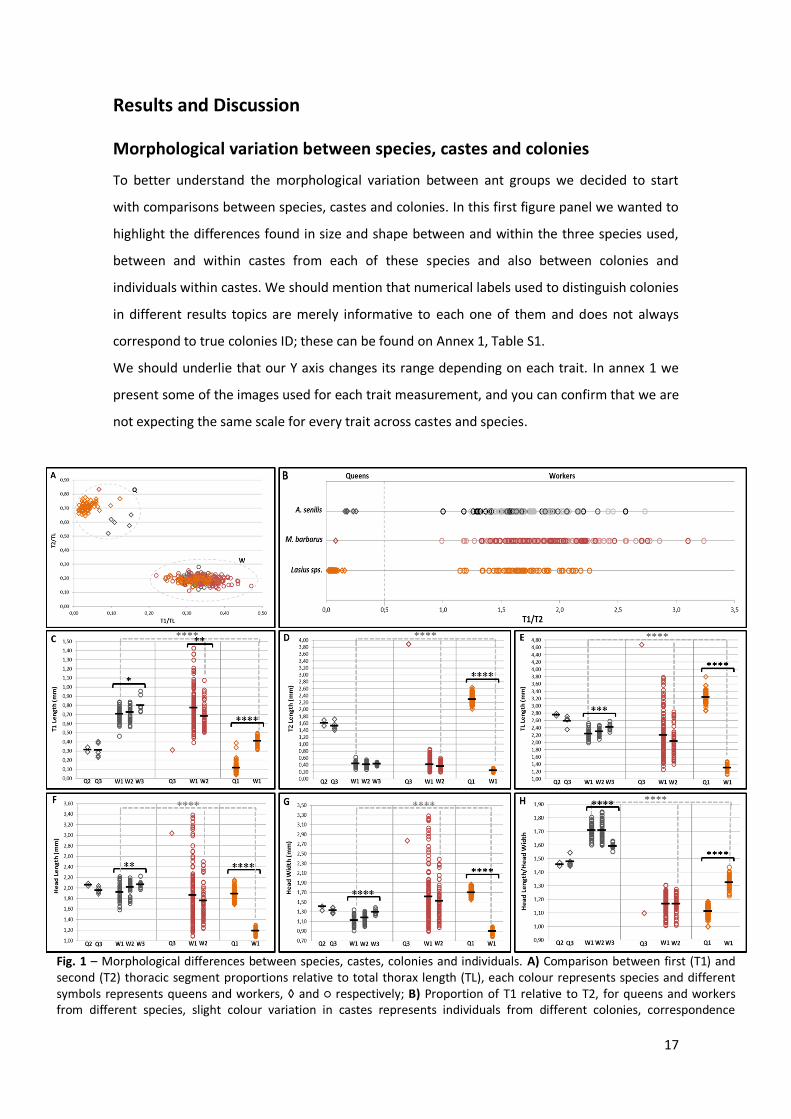
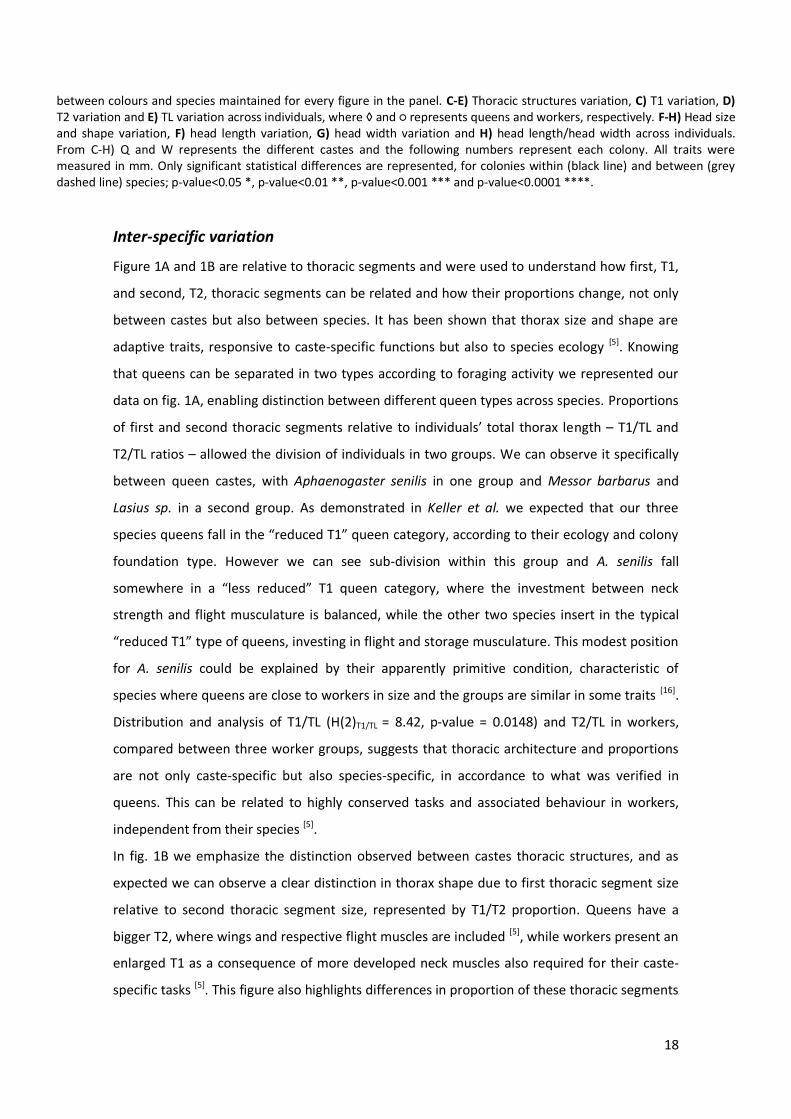
Fig. 1 – Morphological differences between species, castes, colonies and individuals. A) Comparison between first (T1) and second (T2) thoracic segment proportions relative to total thorax length (TL), each colour represents species and different symbols represents queens and workers, ◊ and ○ respectively; B) Proportion of T1 relative to T2, for queens and workers from different species, slight colour variation in castes represents individuals from different colonies, correspondence
18
between colours and species maintained for every figure in the panel. C-E) Thoracic structures variation, C) T1 variation, D) T2 variation and E) TL variation across individuals, where ◊ and ○ represents queens and workers, respectively. F-H) Head size and shape variation, F) head length variation, G) head width variation and H) head length/head width across individuals. From C-H) Q and W represents the different castes and the following numbers represent each colony. All traits were measured in mm. Only significant statistical differences are represented, for colonies within (black line) and between (grey dashed line) species; p-value<0.05 *, p-value<0.01 **, p-value<0.001 *** and p-value<0.0001 ****.
Inter-specific variation
Figure 1A and 1B are relative to thoracic segments and were used to understand how first, T1,
and second, T2, thoracic segments can be related and how their proportions change, not only
between castes but also between species. It has been shown that thorax size and shape are
adaptive traits, responsive to caste-specific functions but also to species ecology [5]. Knowing
that queens can be separated in two types according to foraging activity we represented our
data on fig. 1A, enabling distinction between different queen types across species. Proportions
of first and second thoracic segments relative to individuals’ total thorax length – T1/TL and
T2/TL ratios – allowed the division of individuals in two groups. We can observe it specifically
between queen castes, with Aphaenogaster senilis in one group and Messor barbarus and
Lasius sp. in a second group. As demonstrated in Keller et al. we expected that our three
species queens fall in the “reduced T1” queen category, according to their ecology and colony
foundation type. However we can see sub-division within this group and A. senilis fall
somewhere in a “less reduced” T1 queen category, where the investment between neck
strength and flight musculature is balanced, while the other two species insert in the typical
“reduced T1” type of queens, investing in flight and storage musculature. This modest position
for A. senilis could be explained by their apparently primitive condition, characteristic of
species where queens are close to workers in size and the groups are similar in some traits [16].
Distribution and analysis of T1/TL (H(2)T1/TL = 8.42, p-value = 0.0148) and T2/TL in workers,
compared between three worker groups, suggests that thoracic architecture and proportions
are not only caste-specific but also species-specific, in accordance to what was verified in
queens. This can be related to highly conserved tasks and associated behaviour in workers,
independent from their species [5].
In fig. 1B we emphasize the distinction observed between castes thoracic structures, and as
expected we can observe a clear distinction in thorax shape due to first thoracic segment size
relative to second thoracic segment size, represented by T1/T2 proportion. Queens have a
bigger T2, where wings and respective flight muscles are included [5], while workers present an
enlarged T1 as a consequence of more developed neck muscles also required for their caste-
specific tasks [5]. This figure also highlights differences in proportion of these thoracic segments
19
between colonies within the same species. Both queens and workers were collected from
various colonies. In fig. 1 each colour represents one species and each colour variants
represents different colonies from the same species.
Independently of the sample size for each colony we can suggest that distributions of thoracic
proportions of workers are similar. Although some groups reveal a wider range of distribution
and we found significant differences in T1/T2 (H(2)T1/T2 = 8.42, p-value = 0.0149) between the
same three worker groups previously used, the general interval is maintained independently of
the species. The differences found are probably due to the specific groups used for statistical
analysis. As expected we can observe differences in T1/T2 ratios across species queens in the
same figure. Relative to species we can say that Lasius queens have a much smaller T1 in
relation to their T2 size, while Aphaenogaster presents a bigger T1 when compared with T2
size, somehow presenting a thorax more similar to what we can call a worker-like phenotype.
The unbalanced sample for Messor does not allow us to conclude anything about their queen
phenotype and behaviour, but we can hypothesize by looking to figure 1B that it could have an
intermediate position in relation to T1 and T2 size.
To understand how much of this variation can be attributed to species differences, and for this
we analysed three workers groups chosen due to their similar sample size, one belonging to
each species. The significant differences found for homogeneity of variances (Table S2) did not
allow us to group different colonies. The further analysis included head traits once it is known
to be an informative morphological structure about caste and sub-caste specificity. We only
represented statistical significant differences in the respective figures. We found differences
for all head-related traits, both in size (H(2)HL = 103.23, p-value < 0.0001; H(2)HW = 106.71, p-
value < 0.0001) and shape (H(2)HL/HW = 122.77, p-value < 0.0001). Thoracic traits revealed
significant differences for TL (H(2)TL = 102.49, p-value < 0.0001), T1 (H(2)T1 = 100.1, p-value <
0.0001) and T2 (H(2)T2 = 79.923, p-value < 0.0001) length across the three groups of workers.
For this analysis we also tested the three ratios represented on fig. 1A and 1B, and only found
significant differences for T1/TL (H(2) = 8.4204, p-value = 0.0148) and T1/T2 (H(2) = 8.4171, p-
value = 0.0148). These results can seem contradictory to data in figure 1A, where apparently
all the workers fall in a big group with similar thoracic proportions, independently of species,
and also to what we observe in figure 1B where we can’t point out differences in T1/T2 worker
proportions. However it could be the case that differences found for these three specific
groups may not be confirmed using all the individuals represented, or using bigger samples.
Increase of individuals for each sample considered could also result in decrease of variation in
thoracic proportions for each species, and our analysis can classify the differences found as
non-significant. Unfortunately we are unable to take any conclusion in relation to queens, but
20
we would expect to find differences in this group. This expectation is again related not only to
our information in figure A1, but also justified by previous works where has been shown that
queens thorax morphology is dependent on colony funding behaviour and trade-offs that
these individuals found between ground and flight behaviours associated [5].
Intra-specific variation
After comparisons in relation to thoracic structure and shape variation across species and
castes we tried to get some insight on how each trait behaves individually and how much
variation can we find within each caste and colony. For this we used the same three traits
above –T1, T2 and TL – and added three head-related traits for analysis. We analysed head
length and width for size variation, and head length/head width for variation in shape.
Lasius sp.
For Lasius we used individuals from one single colony to compare castes, and as expected we
confirmed the extreme dimorphism present between workers and queens. We can also notice
these extreme size differences by looking at untreated images on Annex 1, Fig. 3. Statistical
analysis demonstrated significant differences for all traits compared between castes and for
almost all of them we could find a considerably different level of variation. The analysis of
variance revealed a statistically significant effect of caste for all traits. We found significant
differences for T2 length (H(1)T2 = 87.796, p-value < 0.0001), as expected due to their
differences in size, and also for T1 length (H(1)T1 = 86.332, p-value < 0.0001) and for TL (H(1)TL =
87.79, p-value <0.0001). Thoracic proportions analysed, T1/T2 (H(1)T1/T2 = 87.787, p-value <
0.0001), T1/TL ((H(1)T1/TL = 87.787, p-value < 0.0001) and T2/TL ((H(1)T1/TL = 87.787, p-value <
0.0001) also revealed significant differences between workers and queens, as expected. In
relation to head traits we could also confirm the dimorphism expected between workers and
queens. Both head length (H(1)HL = 87.791, p < 0.0001) and head width (H(1)HW = 87.795, p <
0.0001) revealed significant differences between castes. Significant differences were also
found for head shape between castes (H(1)HL/HW = 87.787, p < 0.0001) and revealed a tendency
for queens head to be square-shaped (HL/HW = 1.113 ± 0.039, n = 70) while workers show a
more elongated, barrel-like head shape (HL/HW = 1.324 ± 0.045, n = 51). This last suggestion is
made assuming a squared shape when HL/HW present values near 1, and elongated shape
when HL/HW is relatively higher than 1.
21
Messor barbarus
We considered only worker caste for comparisons between M. barbarus individuals due to a
very unbalanced sample for Messor queen caste, represented only by one individual. For the
two colonies used for traits comparisons we found significant differences for first thoracic
segment length (H(1)T1 = 8.1525, p-value = 0.0043), which can be influenced by original colony
size. Although represented just by one individual, Messor queen head data stands out when
compared with the other species queens for its smaller size in relation to bigger workers head.
This is common on polymorphic species and especially on species like this [16]. Other important
factor missing in our analysis is the real size of the colony. It is known that bigger colonies will
present higher mean size for workers, but we could not assess that information since our
sample only represents a little part of a wild colony [25].
To complete our Messor barbarus analysis we should have collected more individuals from
different colonies and analysed other morphological traits in order to better understand how
allometry and/or isometry are contributing to size and shape variation in a polymorphic
species. Other thing that could be affecting our analysis is the age of the colony. It has been
described that polymorphic species colonies start their worker force by producing a
considerable amount of small workers and only later in life they start producing major workers
and, when possible, specializing workers in particular functions [20]. However the major part of
the information in polymorphic species is about Solenopsis invicta and some Pogonomyrmex
species, and we have no evidence that Messor, although being a seed-harvester species, would
morphologically behave similarly to any of those.
What we can tell by looking to the worker groups represented, even with different sample
sizes – W1 with 123 and W2 with 47 individuals –, is that we can see a wider range of size
distribution for colony W1 (fig. 2C-2H). Individuals from both colonies were collected in the
wild and we cannot address foraging preferences to any worker size. We can only ensure that
the collection was unbiased and if the colonies were the same age we should find the same
size distribution, which means an equal representation of minor and major workers, according
to predictions referred above. Consequently we can suggest that colony W1 was founded
previously to W2 and this can be affecting our results. To solve this we should have used
laboratory reared colonies or follow wild colonies for longer periods and expand our
sociometry and sociogenesis information on this species and in particular about the location
where they have been excavated [25].
22
Aphaenogaster senilis
Again we proceed to comparisons between colonies for worker caste, since it was the only
with considerable sample sizes. Queen individuals were used as an indication about what we
could expect from queens’ phenotype variation. In this specific case workers and queens
represented by colony number 3 actually belong to our colony A3 in Table S1.
This species shows significant differences between colonies for all measured traits, both thorax
(H(2)T1 = 7.9361, p-value = 0.0189; H(2)TL = 17.02, p-value = 0.0002) and head-related (H(2)HL =
10.47, p-value = 0.0053; H(2)HW = 26.441, p-value < 0.0001; H(2)HL/HW = 21.683, p-value <
0.0001), with exception for second thoracic segment length (H(2)T2 = 2.3612, p-value = 0.3071).
Although we could think that these differences were due to the laboratory reared individuals,
from colony 1 (W1 group) and colony 2 (W2 group), being compared to wild-caught ones from
colony 3 (W3 group), our statistical analysis shows that the differences found were not only
caused by W3 group individuals.
Looking to queens and workers data, we can suggest that there are more differences in
thoracic traits than in head traits between castes, with the exception for head shape that also
reveals significant differences. Head shape in A. senilis shows a similar variation to what were
found between Lasius castes, and again workers have more barrel-shape heads (HL/HW =
1.698 ± 0.066, n = 91) while queens show a more square-shaped head (HL/HW = 1.472 ± 0.034,
n = 7). Stronger differences found in thoracic traits are supported by previous studies, where
mesothorax was described as the principal allometric growth-center between workers and
queens [16]. In order to better classify Aphaenogaster senilis an allometric analysis would be
useful since the size similarity between workers and queens has been suggested as a primitive
character, as already referred [16].
Morphological and behavioural intra-caste variation
After recognizing important differences between colonies we tried to understand the origin of
these differences, especially if we could find any pattern associated with intra-caste
morphological variation. Could these differences be due to our sample collection? Or are they
associated with individuals’ preferential location in the nest? Is the morphological
specialization according to function limited to polymorphic, seed-harvester species [17]?
It is already known that in the Hymenoptera there are different strategies to respond to one of
the most remarkable features of eusociality – the division of labour [10]. Ants accomplished that
dividing their tasks through different castes, and these castes can be morphological,
physiological or behavioural [22].
23
Morphological analysis
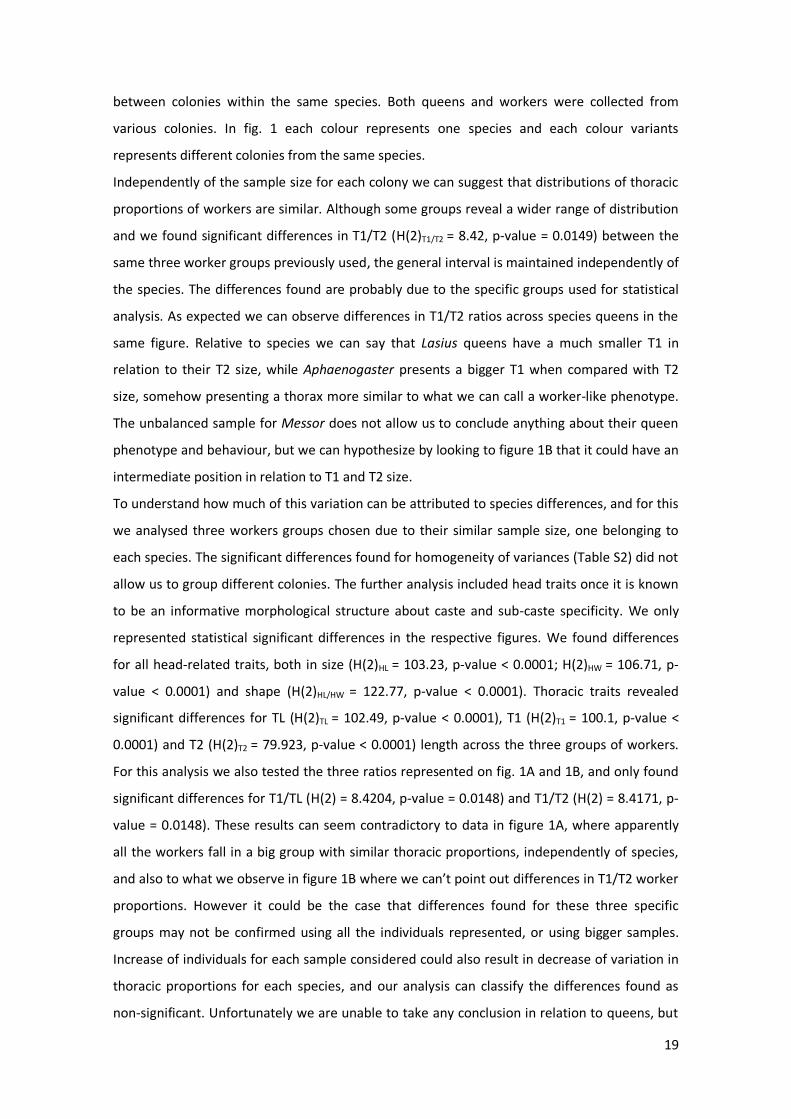
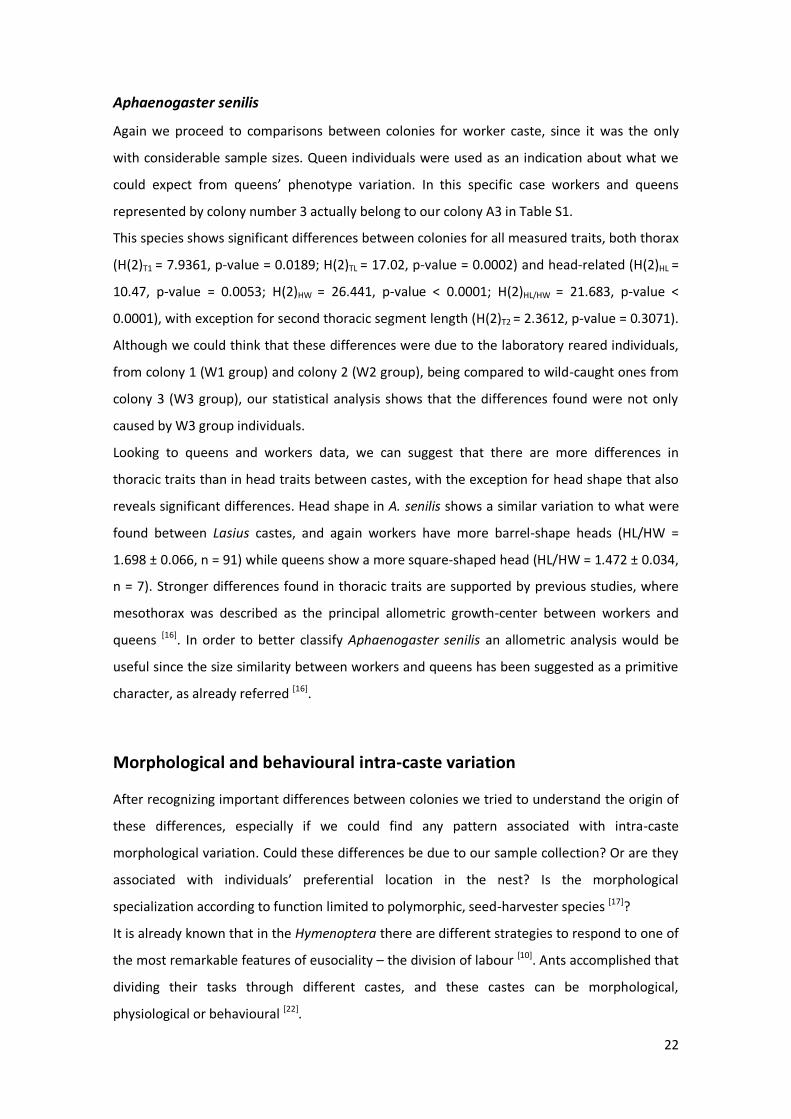
Fig. 2 – Morphological differences between workers found in versus outside of nest. A) Comparison between first (T1) and second (T2) thoracic segment proportions relative to total thorax length (TL), each colour represents individuals’ location/where they were found and marked, grey – inside/green – outside. Empty circles represent A1 (from Aphaenogaster colony 1) individuals and filled circles represent A2 (Aphaenogaster colony 2) individuals. B) Thoracic segments variation for A1 and A2, inside and outside the nest. T1 represented in dark grey (inside) and green (outside), T2 represented in light grey (inside) and green (outside); C) Total thorax length (TL) variation between inside and outside individuals for A1 and A2. D-F) Head size and shape variation, D) head length variation, E) head width variation and F) head length/head width across individuals. Both colonies and colour codes are maintained in all figures. Black lines represent the mean for each group of individuals and only significant statistical differences are represented; p-value<0.05 *, p-value<0.01 **, p-value<0.001 *** and p-value<0.0001 ****. All traits were measured in mm.
First we tried to confirm that our model species Aphaenogaster senilis is morphologically
monomorphic. We collected individuals from two colonies of A. senilis kept in the lab and
sampled them from two different locations inside our colony maintenance boxes, inside and
outside the nest. Using the same traits that were used before for inter and intra-caste
comparisons, we wanted to know if there is some selective pressure for a specific body shape
and/or size prevail according to a specific function. According to previous studies our
expectations will be that inside individuals should be responsible for nursing and outside
individuals should be responsible for foraging [10, 24]. These specific group functions have
already been described for several species, and gave rise to specific morphological and
behavioural adaptations throughout ants’ evolutionary history [10].
Using the same type of graphic used on fig. 1 to highlight possible intra-caste subgroups based
on their thoracic proportions and after our statistical analysis using Wilcoxon test, we can
conclude that there are no differences between individuals from different locations in both

24
colonies, A1 and A2, respectively represented by empty and filled symbols. Apparently there
are no morphological differences between different individuals’ preferential location within
the nest. Preferential location is here referred as the place where individual spend most part of
their time, probably according to their function in the colony, and it is not correspondent to
any demonstrated preference. As we did before both thoracic and head traits were analysed,
and size and shape seem to be maintained across locations. When testing for a location effect
we found some differences in A1 and A2, but none of these were maintained in both colonies.
Individuals from A2 showed differences in T1 length (W = 126, p-value = 0.0333) and
individuals from A1 showed differences in TL (W = 29, p-value = 0.003) and head shape (W =
34, p-value = 0.0008). Although we could not find significant differences for all traits and
across colonies, when the difference appears it is caused by an increase in size of the
individuals found outside the nest. However these differences can be caused by some bias,
once there is a confounding effect associated with inside-nest individuals’ collection. Each time
the nest was opened we can try to be quick enough to pick individuals staying inside and avoid
picking any other individual that moved from the outside to the inside of the nest. In general
these results corresponded to our expectations, showing little morphological variation
between individuals from the same caste.
Behavioural analysis
Aphaenogaster senilis does not seem to have distinct morphological groups, but they could
present behavioural groups. To test the existence of behavioural castes in this monomorphic
species we maintained the two colonies used before in the experiments – A1 and A2 – and
added a third one – A3 – available in the lab at the time, also useful to provide some
robustness to our behavioural experiments. We should underlie that this A3 colony is an
informative code for this behavioural assay, but it corresponds to colony A4 (Annex 1, Table
S1).
For each colony we marked 10-15 individuals outside the nest with green painting and 10-15
individuals inside the nest with silver painting, and during four days and one night counted the
number of individuals found at each location. Our null hypothesis was the absence of
behavioural castes, where all individuals distributed randomly within the colony, without any
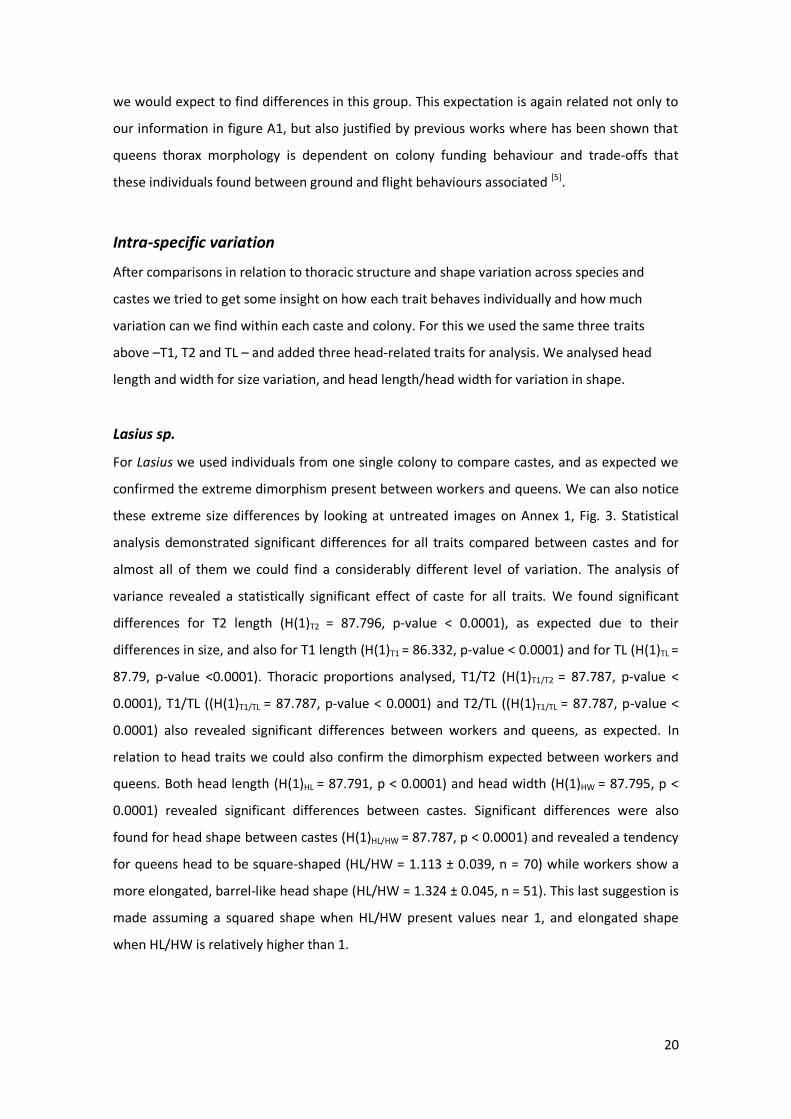
preferential location associated with sub-groups and specific division of tasks. In fig. 3 below,
lines representing 50% determine exactly half of the individuals marked, 50% on top is relative
to silver marked individuals and 50% below represents green marked ones. The 25% and 75%
dashed lines represent 50% of individuals that corresponds to a particular colour and are used
25
to follow their behavioural dynamic. If individuals within a colony distributed randomly we
would observe light columns constantly crossing these dashed lines, meaning that individuals
could usually be found in a “wrong” location.
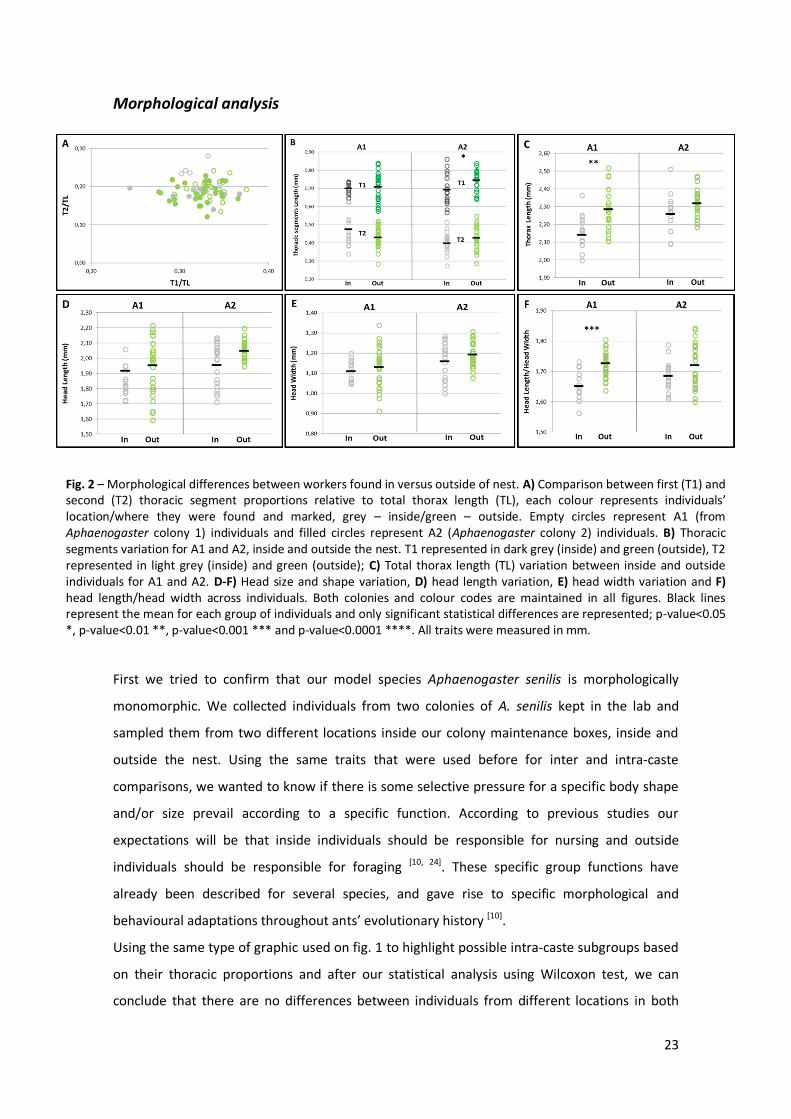
Fig. 3 – Behavioural differences between workers found in versus outside of nest. A-C) Each figure is relative to behavioural observations in one Aphaenogaster colony. Grey represents percentage of individuals marked inside nest and green represents individuals marked outside the nest. Outside individuals are represented from 0-50%, half marked in green; inside individuals are represented from 50-100%. Dark color percentages represent individuals observed where they were marked and light color percentages represent individuals observed in different locations from where they were marked. Black lines mark 50%, which we defined as representation limit for each location group, and black dashed lines mark 25% and 75%, which we expected to be the behavioural variation limit for each group if behavioural groups are maintained. We followed three colonies during four days in day period and one day on night period (highlighted by sun and moon symbols). A) Behavioural variation between workers groups from A1 (Aphaenogaster colony 1), B) behavioural variation between workers groups from A2 (Aphaenogaster colony 2), and C) behavioural variation between workers groups from A3 (Aphaenogaster colony 3). Scheme on top right position summarize our experimental design.
What we can conclude, during our short period of observations, is that the individuals show
fidelity to their group location and possibly to the specific tasks of their group. Individuals
marked in green spent most of their time outside, correspondent to the dark green proportion
always above 25%, and the same is true for individuals marked in silver, where the majority
spent their time inside. We corrected for the total number of individuals marked in each colour
at the end of each day of observations. During the day period we found significant differences
26
in relation to the colour found outside (F(1, 96) = 368.14, p-value < 0.0001), meaning that
individuals’ distribution is really being affected by the group where they first belong. We also
found differences between colonies (F(2, 97) = 12.71, p-value = 0.0017) and these differences tell
us that although individuals present a tendency to maintain their supposed behavioural
groups, the probability of finding the individuals’ in the right place can change across colonies.
Once more we should be careful with the results because these differences can be caused by
some bias introduced by our collection and labelling.
Although our results can suggest the existence of behavioural castes we could not provide any
information about the supposed relationship between individuals’ tasks and their location.
Extended observation time is needed to improve our conclusions about this topic. It would be
important to balance number of observations between different periods of the day since it is
known that circadian rhythms could have strong influence in ants’ behaviour [24]. Different
techniques like video tracking could help us on getting detailed information about behavioural
specializations within colonies and it will allow us to follow specific individuals and their
activity for months.
Hormonal manipulation effects
The follow up to previous questions was to understand the degree of phenotypic plasticity that
is present in Aphaenogaster senilis and to explore in detail intra-caste variation in response to
hormonal manipulations. We wanted to know what could be involved in shaping the reaction
norms for monomorphic workers. Reaction norms are usually associated to discrete
phenotypes in dimorphic ant species or sub-castes [7]. Not only morphological aspects of an
individual but also its life history traits were shown to be affected by a variety of
environmental cues [10, 15]. As referred, juvenile hormone is responsible for castes and sub-
castes determination [15, 26]. We manipulated internal levels of JH, using methoprene treatment
to increase endogenous JH levels [26] and precocene II treatments to decrease them [33]. We
measured not only the phenotypic effect of the treatment on the adults but also the impact of
these on life history traits.
During this experiment several external factors influenced and limited our manipulations, and
it was the case of low reproduction rates in our colonies, loss of individuals and long periods
required for queen-less colonies to lay eggs. Although we are not able to find any good
explanation for low egg laying rates in our queen-right colonies maintained in artificial
conditions during four years, the possible explanation for such low reproduction rates in
queen-less colonies is apparently easy. As referred above A. senilis has gamergates and being
27
responsible for part of colony reproductive potential also results in conflicts between
potentially laying workers. These conflicts are easily associated with our artificial new colony
foundation and it has been described that a queen-less colony – orphaned or originated by
fission – will need a period of 12 weeks to produce their first male pupae, due to policing
behaviour. During this period all eggs and larvae produced will be destroyed by other workers
[37-39].
Our experiments thus included trials with queen-less colonies founded by fission from our
original queen-right colonies, and hormonal manipulation events on male larvae, but as
referred the policing and destruction of our manipulated male larvae could have been the
reason why it never reached a sufficient number of individuals to proceed with the
experiment.
Survival effect
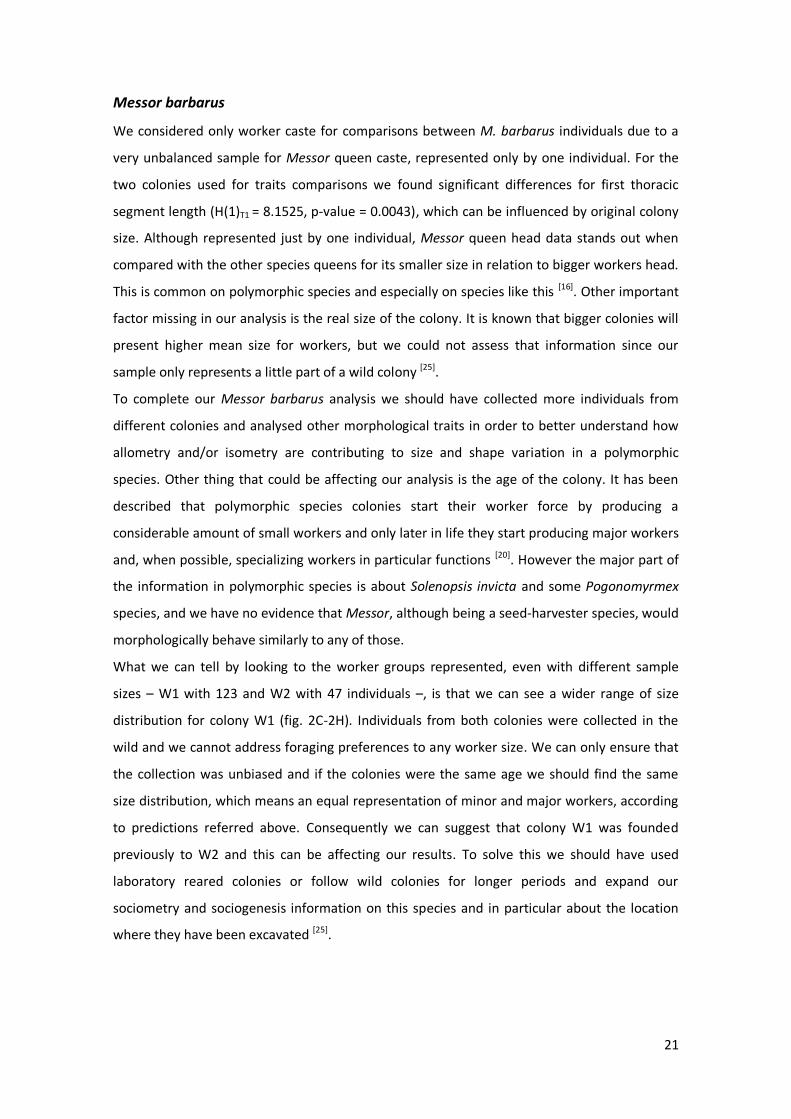
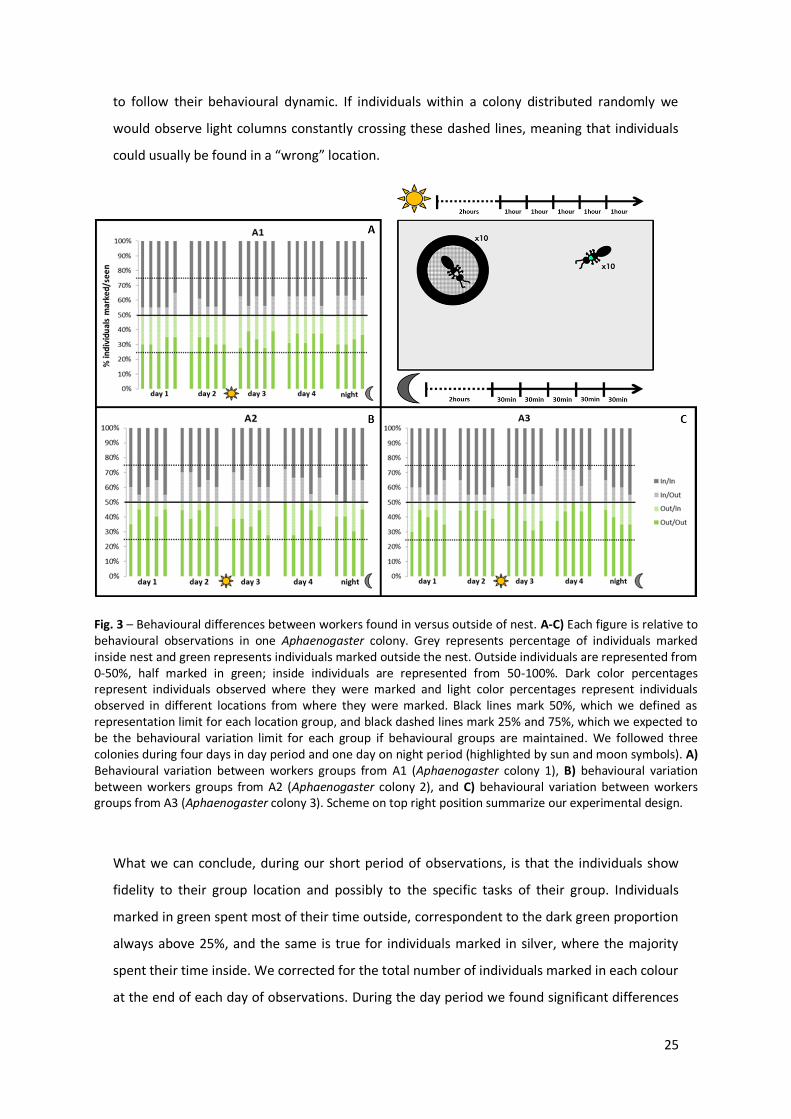
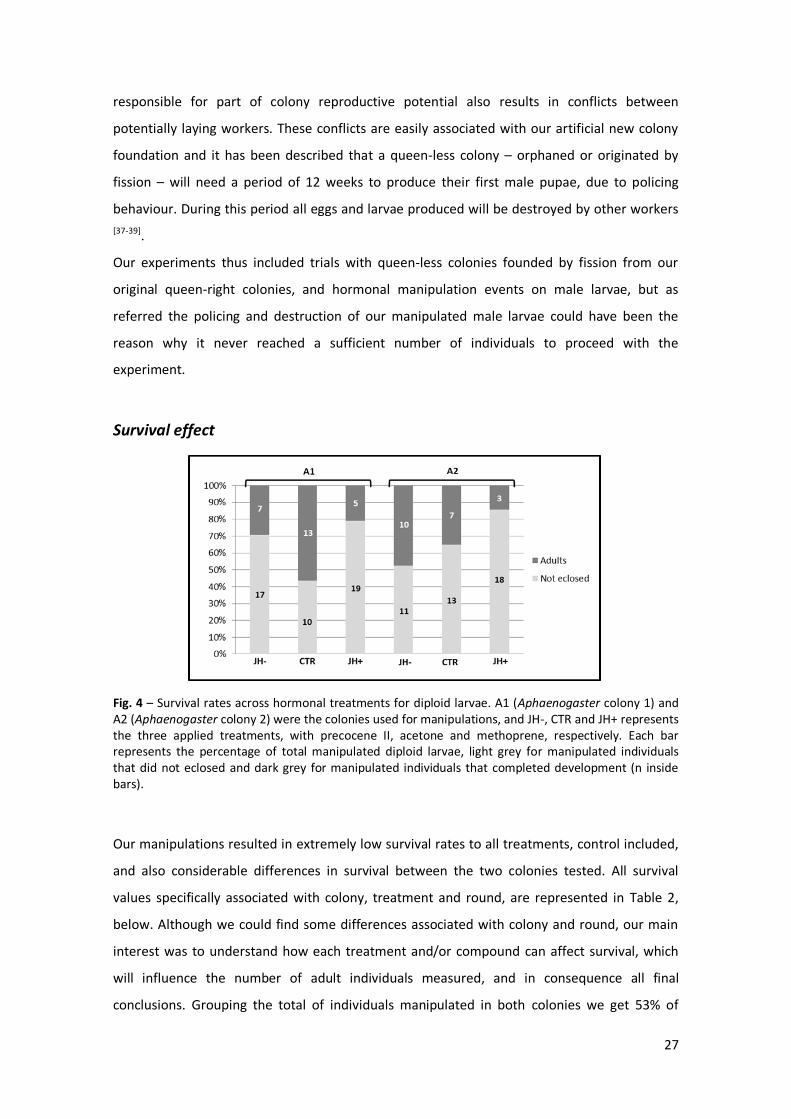
Fig. 4 – Survival rates across hormonal treatments for diploid larvae. A1 (Aphaenogaster colony 1) and A2 (Aphaenogaster colony 2) were the colonies used for manipulations, and JH-, CTR and JH+ represents the three applied treatments, with precocene II, acetone and methoprene, respectively. Each bar represents the percentage of total manipulated diploid larvae, light grey for manipulated individuals that did not eclosed and dark grey for manipulated individuals that completed development (n inside bars).
Our manipulations resulted in extremely low survival rates to all treatments, control included,
and also considerable differences in survival between the two colonies tested. All survival
values specifically associated with colony, treatment and round, are represented in Table 2,
below. Although we could find some differences associated with colony and round, our main
interest was to understand how each treatment and/or compound can affect survival, which
will influence the number of adult individuals measured, and in consequence all final
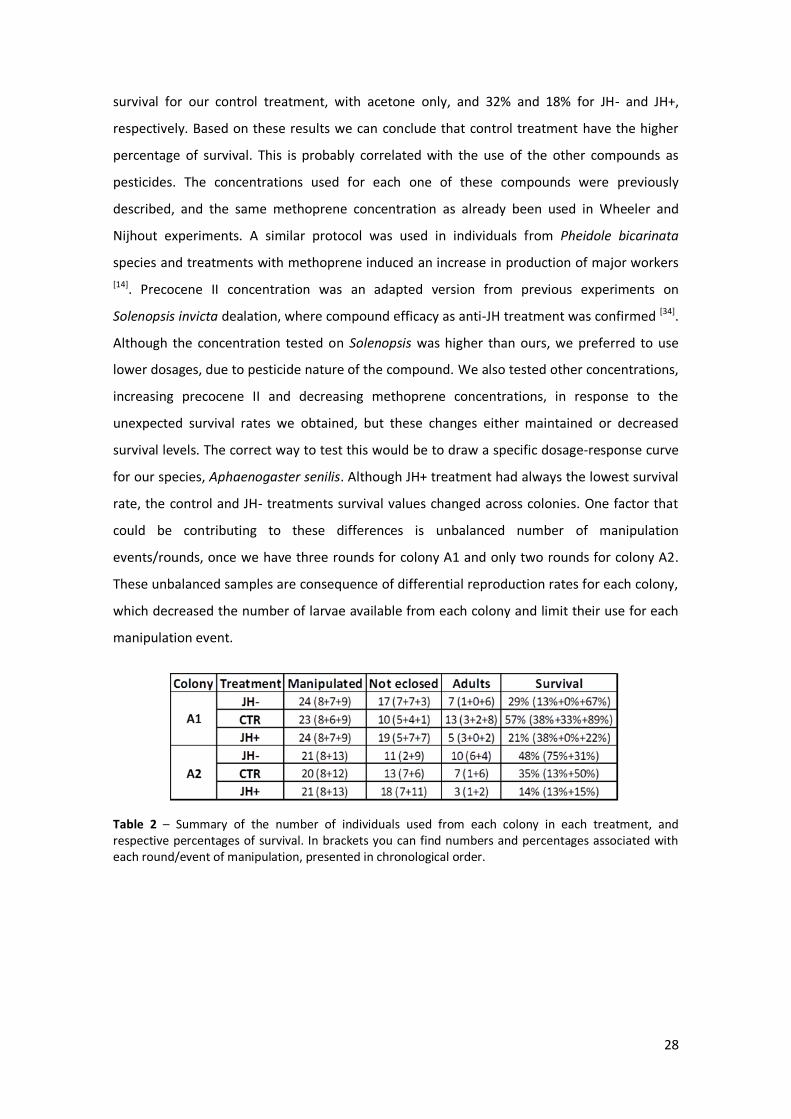
conclusions. Grouping the total of individuals manipulated in both colonies we get 53% of
28
survival for our control treatment, with acetone only, and 32% and 18% for JH- and JH+,
respectively. Based on these results we can conclude that control treatment have the higher
percentage of survival. This is probably correlated with the use of the other compounds as
pesticides. The concentrations used for each one of these compounds were previously
described, and the same methoprene concentration as already been used in Wheeler and
Nijhout experiments. A similar protocol was used in individuals from Pheidole bicarinata
species and treatments with methoprene induced an increase in production of major workers
[14]. Precocene II concentration was an adapted version from previous experiments on
Solenopsis invicta dealation, where compound efficacy as anti-JH treatment was confirmed [34].
Although the concentration tested on Solenopsis was higher than ours, we preferred to use
lower dosages, due to pesticide nature of the compound. We also tested other concentrations,
increasing precocene II and decreasing methoprene concentrations, in response to the
unexpected survival rates we obtained, but these changes either maintained or decreased
survival levels. The correct way to test this would be to draw a specific dosage-response curve
for our species, Aphaenogaster senilis. Although JH+ treatment had always the lowest survival
rate, the control and JH- treatments survival values changed across colonies. One factor that
could be contributing to these differences is unbalanced number of manipulation
events/rounds, once we have three rounds for colony A1 and only two rounds for colony A2.
These unbalanced samples are consequence of differential reproduction rates for each colony,
which decreased the number of larvae available from each colony and limit their use for each
manipulation event.
Table 2 – Summary of the number of individuals used from each colony in each treatment, and respective percentages of survival. In brackets you can find numbers and percentages associated with each round/event of manipulation, presented in chronological order.
29
Developmental time
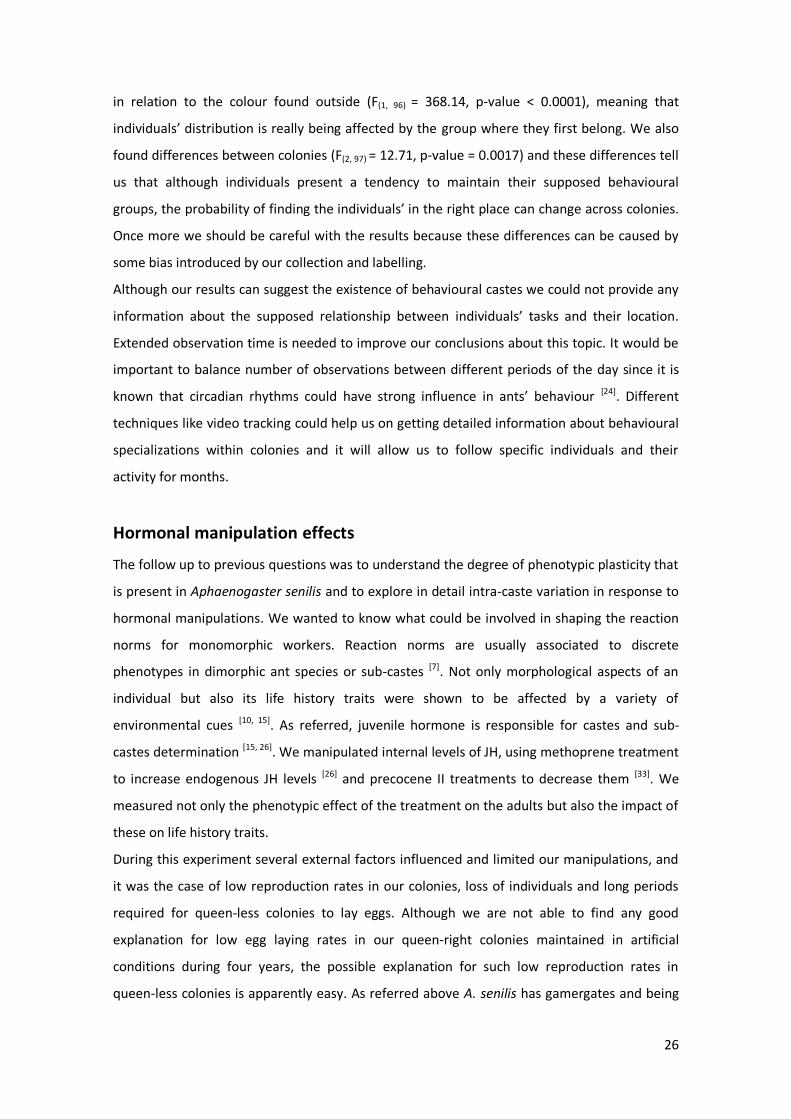
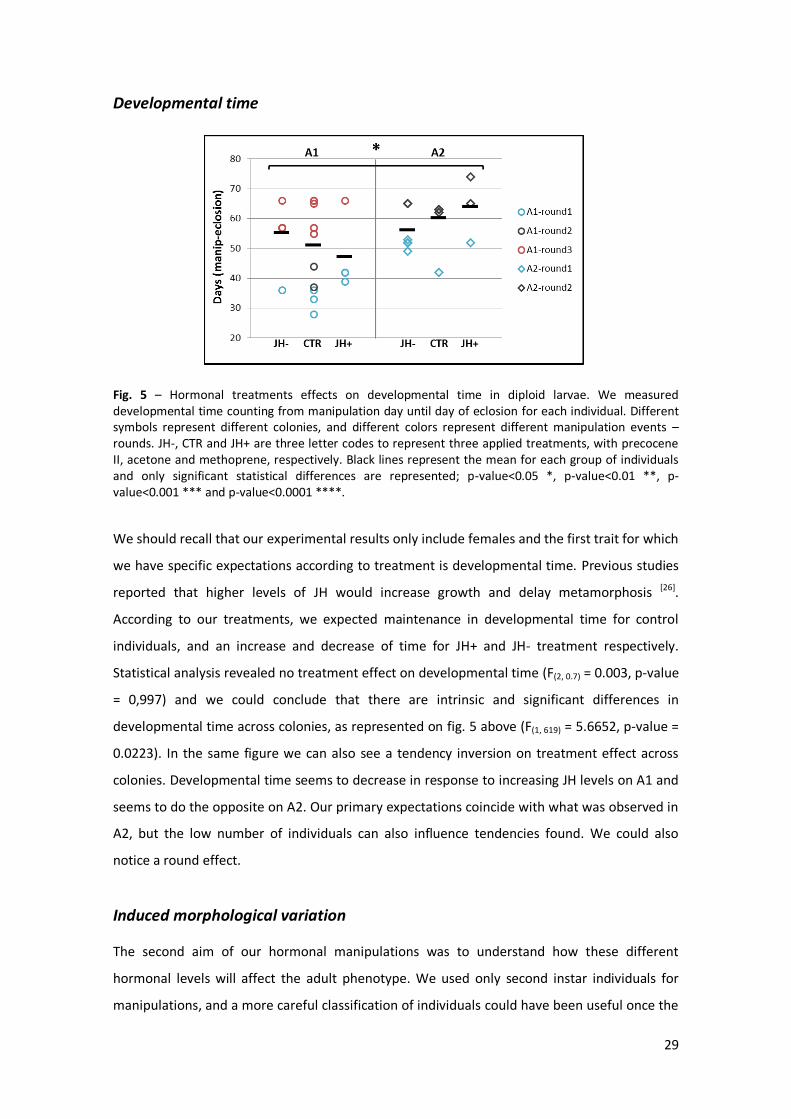
Fig. 5 – Hormonal treatments effects on developmental time in diploid larvae. We measured developmental time counting from manipulation day until day of eclosion for each individual. Different symbols represent different colonies, and different colors represent different manipulation events – rounds. JH-, CTR and JH+ are three letter codes to represent three applied treatments, with precocene II, acetone and methoprene, respectively. Black lines represent the mean for each group of individuals and only significant statistical differences are represented; p-value<0.05 *, p-value<0.01 **, p-value<0.001 *** and p-value<0.0001 ****.
We should recall that our experimental results only include females and the first trait for which
we have specific expectations according to treatment is developmental time. Previous studies
reported that higher levels of JH would increase growth and delay metamorphosis [26].
According to our treatments, we expected maintenance in developmental time for control
individuals, and an increase and decrease of time for JH+ and JH- treatment respectively.
Statistical analysis revealed no treatment effect on developmental time (F(2, 0.7) = 0.003, p-value
= 0,997) and we could conclude that there are intrinsic and significant differences in
developmental time across colonies, as represented on fig. 5 above (F(1, 619) = 5.6652, p-value =
0.0223). In the same figure we can also see a tendency inversion on treatment effect across
colonies. Developmental time seems to decrease in response to increasing JH levels on A1 and
seems to do the opposite on A2. Our primary expectations coincide with what was observed in
A2, but the low number of individuals can also influence tendencies found. We could also
notice a round effect.
Induced morphological variation
The second aim of our hormonal manipulations was to understand how these different
hormonal levels will affect the adult phenotype. We used only second instar individuals for
manipulations, and a more careful classification of individuals could have been useful once the
30
size range during this instar is wide. Individuals should have been divided in early, intermediate
and late L2, in order to give us precise information about the specific time window where
juvenile hormone levels can be interfering with developmental pathway selected and final
adult form [14].
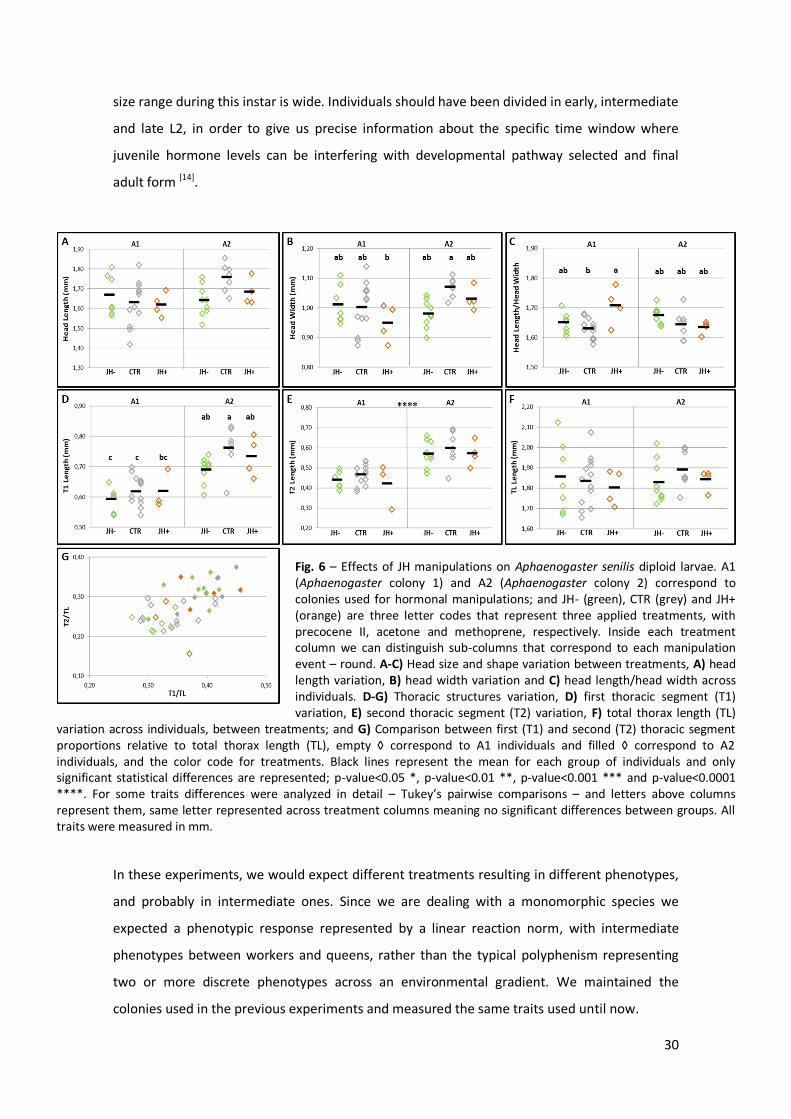
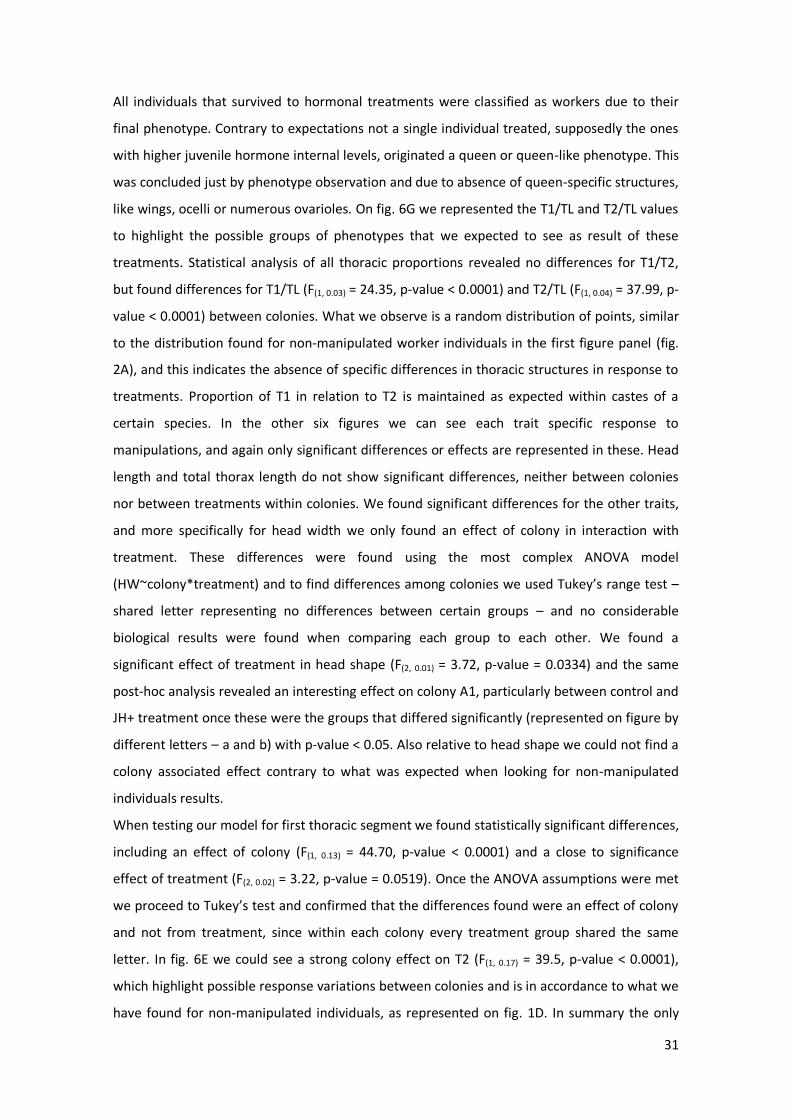
Fig. 6 – Effects of JH manipulations on Aphaenogaster senilis diploid larvae. A1 (Aphaenogaster colony 1) and A2 (Aphaenogaster colony 2) correspond to colonies used for hormonal manipulations; and JH- (green), CTR (grey) and JH+ (orange) are three letter codes that represent three applied treatments, with precocene II, acetone and methoprene, respectively. Inside each treatment column we can distinguish sub-columns that correspond to each manipulation event – round. A-C) Head size and shape variation between treatments, A) head length variation, B) head width variation and C) head length/head width across individuals. D-G) Thoracic structures variation, D) first thoracic segment (T1) variation, E) second thoracic segment (T2) variation, F) total thorax length (TL)
variation across individuals, between treatments; and G) Comparison between first (T1) and second (T2) thoracic segment proportions relative to total thorax length (TL), empty ◊ correspond to A1 individuals and filled ◊ correspond to A2 individuals, and the color code for treatments. Black lines represent the mean for each group of individuals and only significant statistical differences are represented; p-value<0.05 *, p-value<0.01 **, p-value<0.001 *** and p-value<0.0001 ****. For some traits differences were analyzed in detail – Tukey’s pairwise comparisons – and letters above columns represent them, same letter represented across treatment columns meaning no significant differences between groups. All traits were measured in mm.
In these experiments, we would expect different treatments resulting in different phenotypes,
and probably in intermediate ones. Since we are dealing with a monomorphic species we
expected a phenotypic response represented by a linear reaction norm, with intermediate
phenotypes between workers and queens, rather than the typical polyphenism representing
two or more discrete phenotypes across an environmental gradient. We maintained the
colonies used in the previous experiments and measured the same traits used until now.
31
All individuals that survived to hormonal treatments were classified as workers due to their
final phenotype. Contrary to expectations not a single individual treated, supposedly the ones
with higher juvenile hormone internal levels, originated a queen or queen-like phenotype. This
was concluded just by phenotype observation and due to absence of queen-specific structures,
like wings, ocelli or numerous ovarioles. On fig. 6G we represented the T1/TL and T2/TL values
to highlight the possible groups of phenotypes that we expected to see as result of these
treatments. Statistical analysis of all thoracic proportions revealed no differences for T1/T2,
but found differences for T1/TL (F(1, 0.03) = 24.35, p-value < 0.0001) and T2/TL (F(1, 0.04) = 37.99, p-
value < 0.0001) between colonies. What we observe is a random distribution of points, similar
to the distribution found for non-manipulated worker individuals in the first figure panel (fig.
2A), and this indicates the absence of specific differences in thoracic structures in response to
treatments. Proportion of T1 in relation to T2 is maintained as expected within castes of a
certain species. In the other six figures we can see each trait specific response to
manipulations, and again only significant differences or effects are represented in these. Head
length and total thorax length do not show significant differences, neither between colonies
nor between treatments within colonies. We found significant differences for the other traits,
and more specifically for head width we only found an effect of colony in interaction with
treatment. These differences were found using the most complex ANOVA model
(HW~colony*treatment) and to find differences among colonies we used Tukey’s range test –
shared letter representing no differences between certain groups – and no considerable
biological results were found when comparing each group to each other. We found a
significant effect of treatment in head shape (F(2, 0.01) = 3.72, p-value = 0.0334) and the same
post-hoc analysis revealed an interesting effect on colony A1, particularly between control and
JH+ treatment once these were the groups that differed significantly (represented on figure by
different letters – a and b) with p-value < 0.05. Also relative to head shape we could not find a
colony associated effect contrary to what was expected when looking for non-manipulated
individuals results.
When testing our model for first thoracic segment we found statistically significant differences,
including an effect of colony (F(1, 0.13) = 44.70, p-value < 0.0001) and a close to significance
effect of treatment (F(2, 0.02) = 3.22, p-value = 0.0519). Once the ANOVA assumptions were met
we proceed to Tukey’s test and confirmed that the differences found were an effect of colony
and not from treatment, since within each colony every treatment group shared the same
letter. In fig. 6E we could see a strong colony effect on T2 (F(1, 0.17) = 39.5, p-value < 0.0001),
which highlight possible response variations between colonies and is in accordance to what we
have found for non-manipulated individuals, as represented on fig. 1D. In summary the only
32
trait that could show some treatment effect was head length/head width, and it only
happened in one colony.
These colony effects found in manipulated individuals are supported by our previous results on
non-manipulated individuals, where we also found differences between colonies for
Aphaenogaster senilis. However, results for second thoracic segment length and head shape
need some special attention since they are not supported by our previous analysis. Our
expectations for head shape would be a worker like phenotype changing to a queen like
phenotype, which means that a barrel-like structure would become closer to a heart-shaped
structure. This expectation is suggested by our first graphics, where Aphaenogaster queens
seem to have a more square/heart-shaped head according to low values for head length/head
width ratio. Previous experiments reported a head shape change caused by an allometric head
growth that follow body size increase not only between queens and workers, but also in
polymorphic workers in several species [16]. We could only find some effect for JH+ treatment
in A1 colony, and contrary to what we could expect the head is responding by increasing in
length. Relative to T2 differences reported for manipulated individuals could be caused by
higher statistical power associated with the test used, in this case ANOVA, when compared
with data analysed for non-manipulated individuals. What is most probably happening is that
our treatments are not having an effect, but differences between colonies were highlighted
when using a more powerful test for differences in comparison with non-parametric Kruskal-
Wallis test.
Such inconsistency in our results can be related with four different things: i) number of
individuals used is insufficient to reveal any effect, ii) unbalanced samples do not allow the
correct analysis and are masking possible effects, iii) the concentration applied from each
compound is insufficient to trigger a response, and iv) manipulations are not causing hormonal
levels to change, due to low absorbance through the cuticle, for example. In general these
problems could be solved just by increasing our sample size, not only increasing the number of
colonies used but also the number of individuals for each one of them. Other thing that could
have been optimized was the time window and number of colonies used to obtain male larvae
from queen-less colonies. One of our project objectives was to test how haploid genomes
respond to the same environmental cues as females and one of the main difficulties was to get
enough male larvae to test this and report any conclusion about the topic. As referred, the
possible existence of policing between Aphaenogaster workers have been reported as the
main cause for queen-less/orphaned colonies need more than 30 weeks to produce the first
male larvae that are able to complete development.
33
To solve the problem with compounds concentration we would need to perform experiments
in order to get a specific dosage-response curve for this species, as done for other species [15].
In general our expectations do not match our observations, and this could be caused by
precocious degradation of methoprene. Previous studies suggested that if methoprene was
applied out of JH-sensitive periods individuals will degrade it and undergo metamorphosis
sooner than expected [15]. If this is the case recent adults’ phenotype will mimic JH- treatment
effect, which is in accordance with the results on fig. 6.
To test whether juvenile hormone was indeed manipulated by our treatments we want
measure the expression levels of Krüppel-homolog 1, or Kr-h1. This gene acts downstream of
Methoprene-tolerant receptor and both of them are extremely conserved in insects. Their
interaction and function were first reported for Drosophila and Tribolium, where elegant RNAi
experiments proved that these elements are involved in metamorphosis regulation [40, 41]. JH is
therefore responsible for juvenile stage maintenance and metamorphosis delay with Met and
Kr-h1 as intermediates. However, due to our time schedule and this time consuming technique
we were not able to finish our sequencing, and the details about this experiment can be found
on Annex 3.
34
Final remarks and future perspectives
This work brought some insight about the importance of inter-specific analysis but above all
about the importance of within caste comparisons, both between colonies and individuals
inside these colonies.
We could observe that differences between castes are bigger than within castes,
independently of their worker nature. However we can also say that allometric analysis is
needed to give some robustness to our results, especially when comparing polymorphic and
monomorphic worker castes. It has been suggested that workers functional and morphological
specializations are a secondary adaptive modification and our observations can confirm it [16].
Claustral queens, who we confirmed to have a reduced T1 in proportion to other thoracic
structures, morphology should be analysed more carefully since different dimorphism degrees
can reveal an important role in their ecology and adaptation. Inter-specific worker analysis
showed significant differences in all traits, confirming our expectations in relation to their
differences in size, even if proportions were maintained. Specifically relative to head shape our
analysis revealed that we should analyse this data more carefully, once queens’ heads proved
to be more squared-shape without being always bigger, what was somehow unexpected.
Intra-specific A. senilis analysis revealed that we can highlight some degree of morphological
difference between workers that spent more time outside than inside the nest, probably
according to their functions, but a more elaborated experimental design can give us more
security about these results. Although morphological differences could not be securely
assumed as real, the same was not verified for behavioural groups within this species.
Behavioural observations allow us to suggest the existence of behavioural castes, even without
the possibility of classifying them as temporal or physiological.
In relation to our hormonal manipulations little can be suggested about developmental
plasticity associated with monomorphic species, which was our primary objective. Although
we can assume some treatment effect, at least in relation to induced mortality, we should also
conclude that it is of extreme importance to assess specific colony behaviour and
characteristics in order to better interpret results about this type of experiment.
Regarding all the problems we had with extremely unbalanced samples and also differences
found in morphology between laboratory maintained and wild-caught individuals, the first
follow up for this study will include bigger sample sizes and previous analysis of effects that
laboratory maintenance can have on colonies. Increased sample sizes are also necessary to
reinforce our hormonal manipulations experiment, together with a previous analysis of a
specific dosage curve response. An important experiment is also to test if our treatments are
35
really inducing an effect on JH internal levels and for this we need to obtain the correct
sequence for our genes of interest, both Kr-h1 and control, and analyse their expression in
treated individuals.
In addition to these tests, we consider other follow up experiments that would be an
increment to this project and also a more complete way to approach our main questions. It
would be interesting to look to other body structures, like eyes and ocelli – that are also
known to be plastic –, wings when present and wing imaginal discs during development – with
and without JH levels manipulation – [42], mandibles – that also present intra-caste variation –
and ovarioles, with particular attention to reproductive potential of workers (including
manipulated individuals) that can be measured by eggs development analysis [43].
It would be an interesting follow up to analyse developmental adaptive plasticity between
different species regarding possible different responses according to dimorphism degree and
within caste variation, but also to compare these responses between diploid and haploid
genomes. Ants represent a perfect model to answer this type of questions because within a
colony we could assess both diploid and haploid versions of the same genome, and given the
nature of plastic females vs. (apparently) less plastic males with such specific life history and
function we could also try to answer questions about genomes robustness. It would be also
interesting to collect more morphological and behavioural information about male ants in
general since they have been overlooked during all these decades of social insects’ studies.
Follow ups suggested would contribute to a broader view of processes involved on, probably,
the most intriguing example of developmental plasticity within insects. Integrative studies
including morphological, behavioural, physiological and molecular approaches are a
requirement. Nowadays, social insects’ biology and ecology, in parallel with their evolutionary
origin, are part of the most interesting research areas in biology. Their complex organization
systems are contributing to our better understanding of society dynamics and complex
networks patterns, and the contribution of these small animals to the community is (still)
immeasurable, just like their diversity.
36
Bibliography
1. Kingsolver, J. G. et al. The strength of phenotypic selection in natural populations. Am. Nat. 157, 245–261 (2001).
2. Nijhout, H. F. The control of body size in insects. Dev. Biol. 261, 1–9 (2003). 3. Moczek, A. P. Phenotypic plasticity and diversity in insects. Philos. Trans. R. Soc. B Biol. Sci.
365, 593–603 (2010). 4. Wilson, E. O. The origin and evolution of polymorphism in ants. The Quarterly review of
biology 28, 136–156 (1953). 5. Keller, R. a, Peeters, C. & Beldade, P. Evolution of thorax architecture in ant castes highlights
trade-off between flight and ground behaviors. Elife 3, e01539 (2014). 6. Keller, R. A. A Phylogenetic Analysis of Ant Morphology (Hymenoptera : Formicidae) with
Special Reference to the Poneromorph. Bulletin Of The American Museum Of Natural History 355, 1–90 (2011). doi:10.1206/355.1
7. Beldade, P., Mateus, A. R. a & Keller, R. a. Evolution and molecular mechanisms of adaptive developmental plasticity. Mol. Ecol. 20, 1347–63 (2011).
8. Moczek, A. & Emlen, D. Male horn dimorphism in the scarab beetle, Onthophagus taurus: do alternative reproductive tactics favour alternative phenotypes? Anim. Behav. 59, 459–466 (2000).
9. Simpson, S. J., Sword, G. a. & Lo, N. Polyphenism in insects. Curr. Biol. 21, R738–R749 (2011). 10. Darwin, C. On The Origin of Species by Means of Natural Selection, or the Preservation of
Favoured Races in the Struggle for Life. John Murray, Albemarle Street (1859). 11. Hölldobler, B. & Wilson, E. O. The Ants. Harvard University Press (1990). 12. Peeters, C. The occurrence of sexual reproduction among ant workers. Biol. J. Linn. Soc. 44,
141–152 (1991). 13. Pie, M. R. & Tschá, M. K. Size and shape in the evolution of ant worker morphology. PeerJ 1,
e205 (2013). 14. Wheeler, D. E. Developmental and Physiological Determinants of Caste in Social
Hymenoptera: Evolutionary Implications. Am. Nat. 128, 13 (1986). 15. Wheeler, D. E. & Nijhout, H. F. Soldier Determination in Pheidole Bicarinata: Effect of
methoprene on caste and size within castes. J. Insect Physiol. 29, 847–854 (1983). 16. Wilson, E. O. The origin and evolution of polymorphism in ants. The Quarterly review of
biology 28, 136–156 (1953). 17. Arnan, X., Ferrandiz-Rovira, M., Pladevall, C. & Rodrigo, A. Worker size-related task
partitioning in the foraging strategy of a seed-harvesting ant species. Behav. Ecol. Sociobiol. 65, 1881–1890 (2011).
18. Tschinkel, W. R. The morphometry of Solenopsis fire ants. PLoS One 8, 1–22 (2013). 19. Heredia, A. & Detrain, C. Worker size polymorphism and ethological role of sting associated
glands in the harvester ant Messor barbarus. Insectes Soc. 47, 383–389 (2000). 20. Tschinkel, W. R., Mikheyev, A. S. & Storz, S. R. Allometry of workers of the fire ant, Solenopsis
invicta. J. Insect Sci. 3, 1–11 (2003). 21. Peeters, C. P. Ergatoid queens and intercastes in ants: Two distinct adult forms which look
morphologically intermediate between workers and winged queens. Insectes Soc. 38, 1–15 (1991).
22. Robinson, E. Physiology as a caste-defining feature. Insectes Soc. 56, 1–6 (2009). 23. Jackson, D. E., Martin, S. J., Ratnieks, F. L. W. & Holcombe, M. Spatial and temporal variation
in pheromone composition of ant foraging trails. Behav. Ecol. 18, 444–450 (2007). 24. Mersch, D. P., Crespi, A. & Keller, L. Tracking Individuals Shows Spatial Fidelity Is a Key
Regulator of Ant Social Organization. Science (80-. ). 340, 1090–1093 (2013). 25. Tschinkel, W. R. Back to basics: Sociometry and sociogenesis of ant societies (Hymenoptera:
Formicidae). Myrmecological News 14, 49–54 (2010). 26. Nijhout, H. F. Insect Hormones. Princeton University Press (1994).
37
27. Schwander, T., Lo, N., Beekman, M., Oldroyd, B. P. & Keller, L. Nature versus nurture in social insect caste differentiation. Trends Ecol. Evol. 25, 275–82 (2010).
28. Bonasio, R. et al. Genome-wide and caste-specific DNA methylomes of the ants camponotus floridanus and harpegnathos saltator. Curr. Biol. 22, 1755–1764 (2012).
29. Alvarado, S., Rajakumar, R., Abouheif, E. & Szyf, M. Epigenetic variation in the Egfr gene generates quantitative variation in a complex trait in ants. Nat. Commun. 6, 6513 (2015).
30. Jindra, M., Palli, S. R. & Riddiford, L. M. The juvenile hormone signaling pathway in insect development. Annu. Rev. Entomol. 58, 181–204 (2013).
31. Hammock, B.D, Quistad, G. B. Metabolism and mode of action of juvenile hormone, juvenoids and other insect growth regulator. (1981).
32. Libbrecht, R. et al. Interplay between insulin signaling, juvenile hormone, and vitellogenin regulates maternal effects on polyphenism in ants. Proc. Natl. Acad. Sci. U. S. A. 110, 11050–5 (2013).
33. Bowers, W.S., Ohta, T., Cleere, J. S. Precocene II inhibits juvenile hormone biosynthesis by cockroach corpora allata in vitro. Nat. Commun. 265, 548–549 (1977).
34. Burns, S. N., Teal, P. E. a, Vander Meer, R. K., Nation, J. L. & Vogt, J. T. Identification and action of juvenile hormone III from sexually mature alate females of the red imported fire ant, Solenopsis invicta. J. Insect Physiol. 48, 357–365 (2002).
35. Wheeler, G. C. & Wheeler, J. ANT LARVAE : REVIEW AND SYNTHESIS. Mem. Entomol. Soc. Washingt. 7, (1976).
36. Passera, L., Roncin, E., Kaufmann, B. & Keller, L. Increased soldier production in ant colonies exposed to intraspecific competition. Nature 379, 630–631 (1996).
37. Boulay, R. et al. Production of sexuals in a fission-performing ant: Dual effects of queen pheromones and colony size. Behav. Ecol. Sociobiol. 61, 1531–1541 (2007).
38. Boulay, R., CerdÁ, X., Fertin, A., Ichinose, K. & Lenoir, A. Brood development into sexual females depends on the presence of a queen but not on temperature in an ant dispersing by colony fission, Aphaenogaster senilis. Ecol. Entomol. 34, 595–602 (2009).
39. Chéron, B., Doums, C., Fédérici, P. & Monnin, T. Queen replacement in the monogynous ant Aphaenogaster senilis: supernumerary queens as life insurance. Anim. Behav. 78, 1317–1325 (2009).
40. Minakuchi, C., Zhou, X. & Riddiford, L. M. Krüppel homolog 1 (Kr-h1) mediates juvenile hormone action during metamorphosis of Drosophila melanogaster. Mech. Dev. 125, 91–105 (2007).
41. Minakuchi, C., Namiki, T. & Shinoda, T. Krüppel homolog 1, an early juvenile hormone-response gene downstream of Methoprene-tolerant, mediates its anti-metamorphic action in the red flour beetle Tribolium castaneum. Dev. Biol. 325, 341–350 (2009).
42. Rajakumar, R. et al. Ancestral Developmental Potential Facilitates Parallel Evolution in Ants. Science 335, 79–82 (2012).
43. Khila, A. & Abouheif, E. Reproductive constraint is a developmental mechanism that maintains social harmony in advanced ant societies. Proc. Natl. Acad. Sci. U. S. A. 105, 17884–17889 (2008).
44. Lozano, J. & Belles, X. Conserved repressive function of Krüppel homolog 1 on insect metamorphosis in hemimetabolous and holometabolous species. Sci. Rep. 1, 163 (2011).
45. Cheng, D., Zhang, Z., He, X. & Liang, G. Validation of reference genes in Solenopsis invicta in different developmental stages, castes and tissues. PLoS One 8, e57718 (2013).
46. Lubertazzi, D. The Biology and Natural History of Aphaenogaster rudis. Psyche A J. Entomol. 2012, 1–11 (2012).
47. Brown, M. J. Semi-claustral founding and worker behaviour in gynes of Messor andrei. Insectes Soc. 46, 194–195 (1999).
48. Stille, M. Queen/worker thorax volume ratios and nest-founding strategies in ants. Oecologia 105, 87–93 (1996).
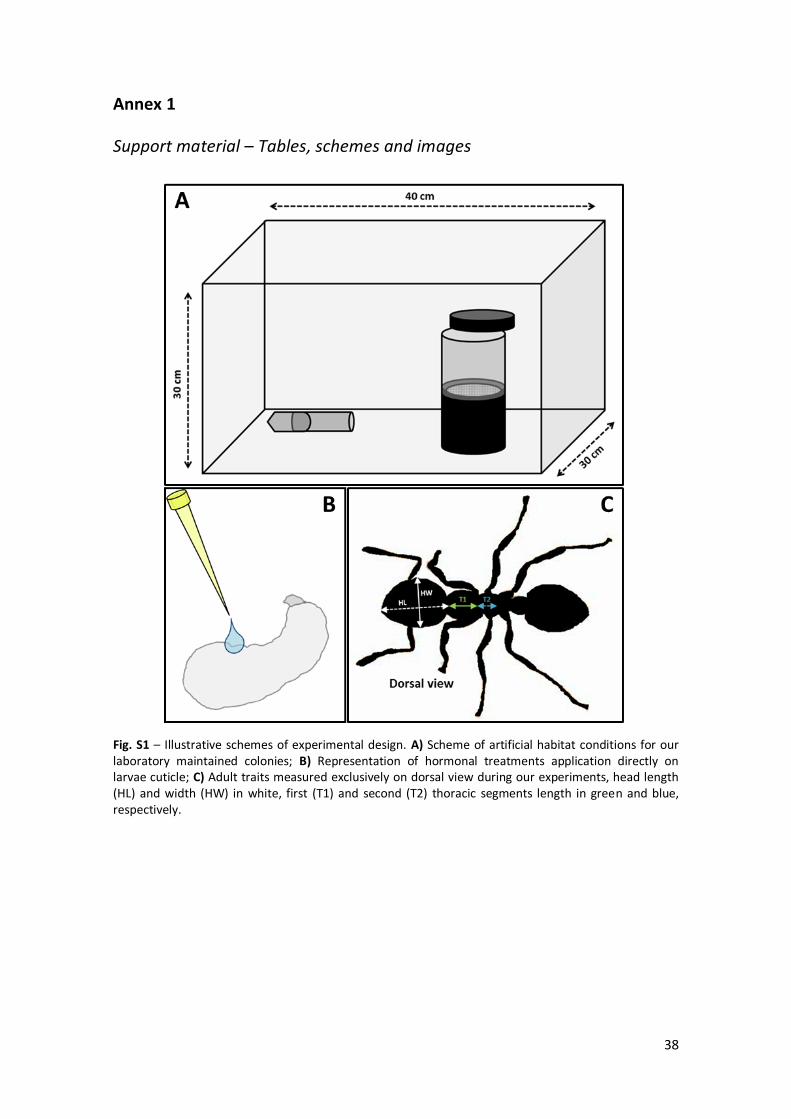
38
Annex 1
Support material – Tables, schemes and images
Fig. S1 – Illustrative schemes of experimental design. A) Scheme of artificial habitat conditions for our laboratory maintained colonies; B) Representation of hormonal treatments application directly on larvae cuticle; C) Adult traits measured exclusively on dorsal view during our experiments, head length (HL) and width (HW) in white, first (T1) and second (T2) thoracic segments length in green and blue, respectively.
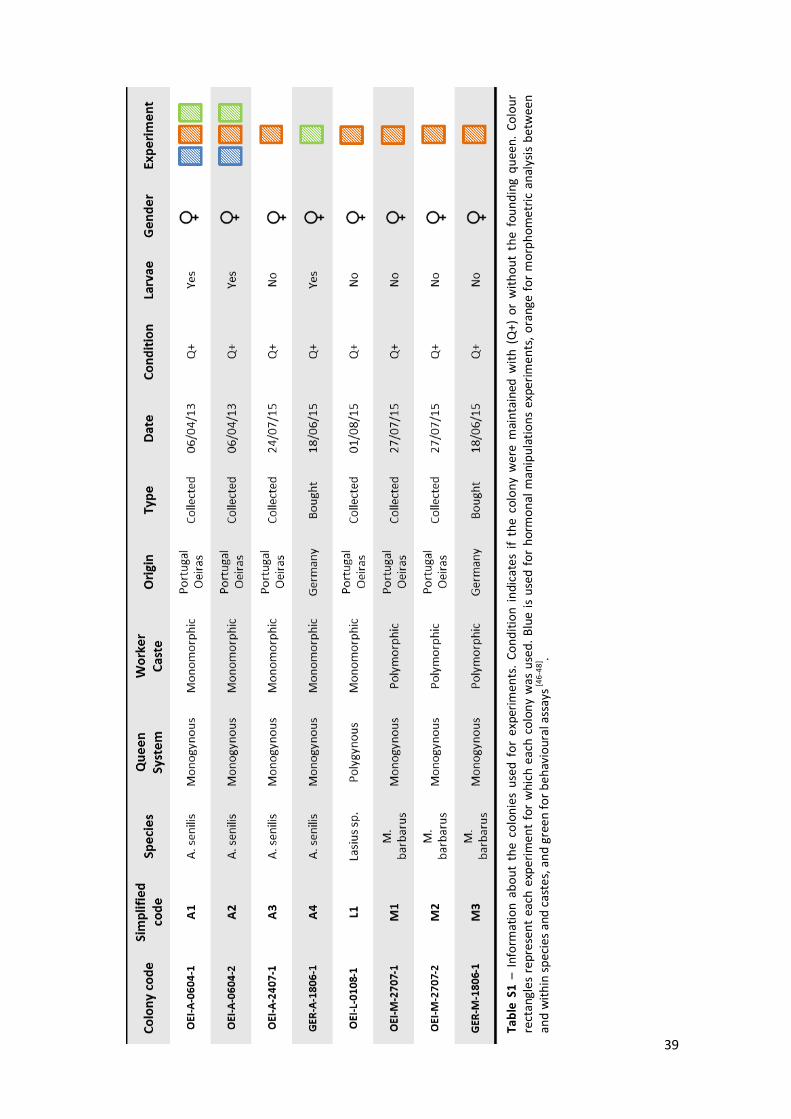
39
Tab
le S
1 –
Inf
orm
atio
n a
bo
ut
the
colo
nie
s u
sed
fo
r ex
peri
men
ts.
Co
nd
itio
n i
ndi
cate
s if
th
e co
lon
y w
ere
mai
nta
ined
wit
h (
Q+)
or
wit
ho
ut
the
fou
nd
ing
qu
een
. C
olo
ur
rect
angl
es r
epre
sen
t ea
ch e
xper
imen
t fo
r w
hich
eac
h c
olo
ny
was
use
d.
Blu
e is
use
d f
or
hor
mo
nal
man
ipu
lati
on
s ex
peri
men
ts,
ora
nge
for
mo
rph
om
etri
c an
alys
is b
etw
een
and
wit
hin
sp
ecie
s an
d c
aste
s, a
nd
gre
en
fo
r b
eh
avio
ura
l ass
ays
[46
-48
] .
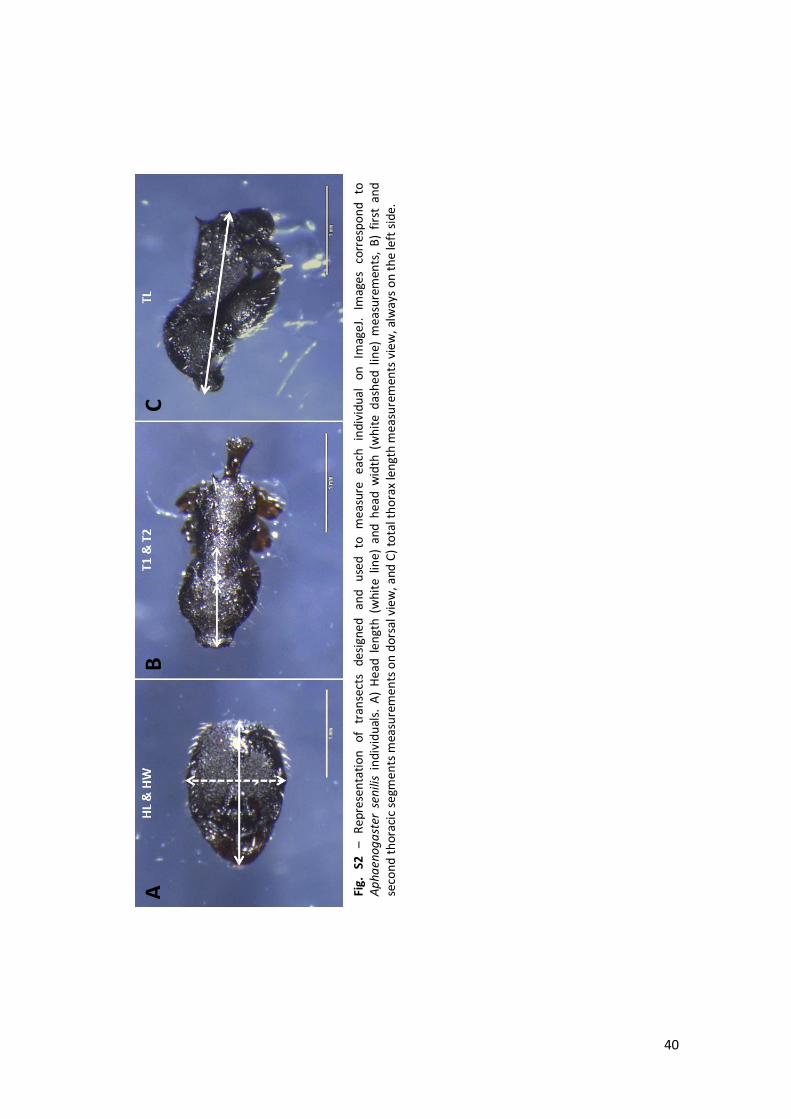
40
A
B
C
Fig.
S2
–
Rep
rese
nta
tio
n
of
tran
sect
s de
sign
ed
and
use
d
to
mea
sure
ea
ch
indi
vidu
al
on
Imag
eJ.
Imag
es
corr
esp
on
d
to
Ap
haen
oga
ster
sen
ilis
indi
vid
ual
s. A
) H
ead
len
gth
(w
hite
lin
e) a
nd h
ead
wid
th (
wh
ite
das
hed
lin
e) m
easu
rem
ents
, B
) fi
rst
and
seco
nd
th
orac
ic s
egm
ents
mea
sure
men
ts o
n d
orsa
l vie
w, a
nd C
) to
tal t
ho
rax
len
gth
mea
sure
men
ts v
iew
, alw
ays
on
the
left
sid
e.
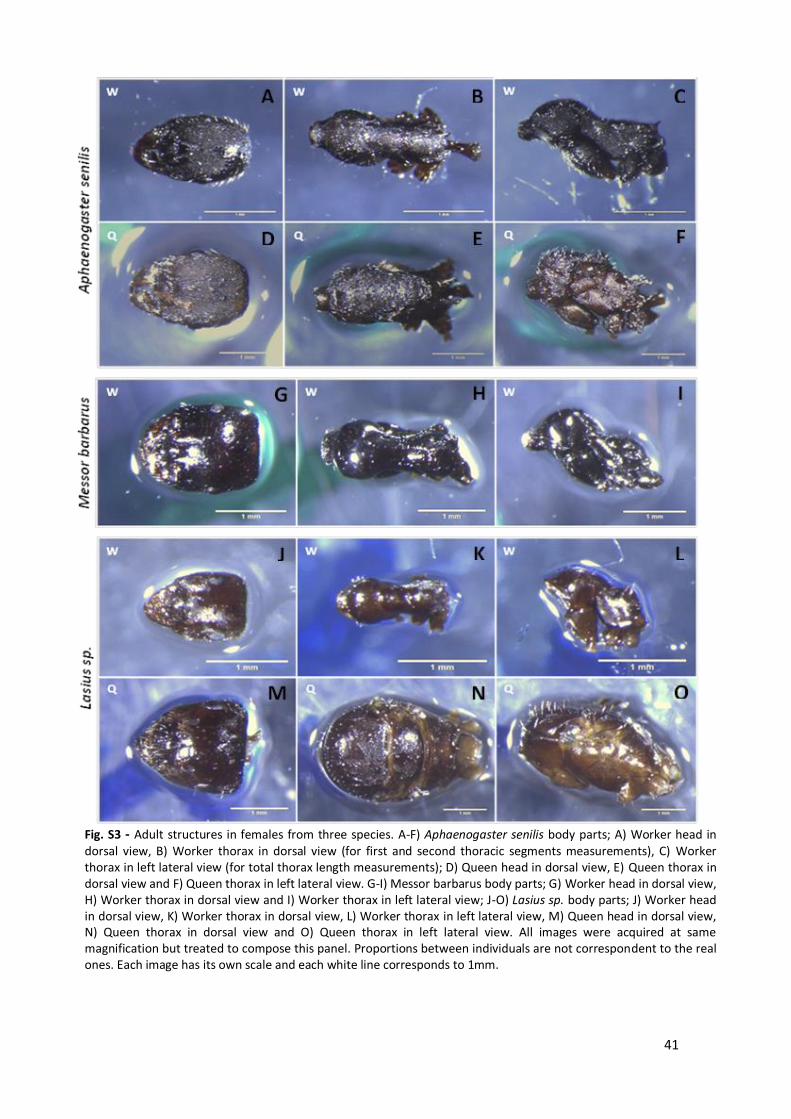
41
Fig. S3 - Adult structures in females from three species. A-F) Aphaenogaster senilis body parts; A) Worker head in dorsal view, B) Worker thorax in dorsal view (for first and second thoracic segments measurements), C) Worker thorax in left lateral view (for total thorax length measurements); D) Queen head in dorsal view, E) Queen thorax in dorsal view and F) Queen thorax in left lateral view. G-I) Messor barbarus body parts; G) Worker head in dorsal view, H) Worker thorax in dorsal view and I) Worker thorax in left lateral view; J-O) Lasius sp. body parts; J) Worker head in dorsal view, K) Worker thorax in dorsal view, L) Worker thorax in left lateral view, M) Queen head in dorsal view, N) Queen thorax in dorsal view and O) Queen thorax in left lateral view. All images were acquired at same magnification but treated to compose this panel. Proportions between individuals are not correspondent to the real ones. Each image has its own scale and each white line corresponds to 1mm.
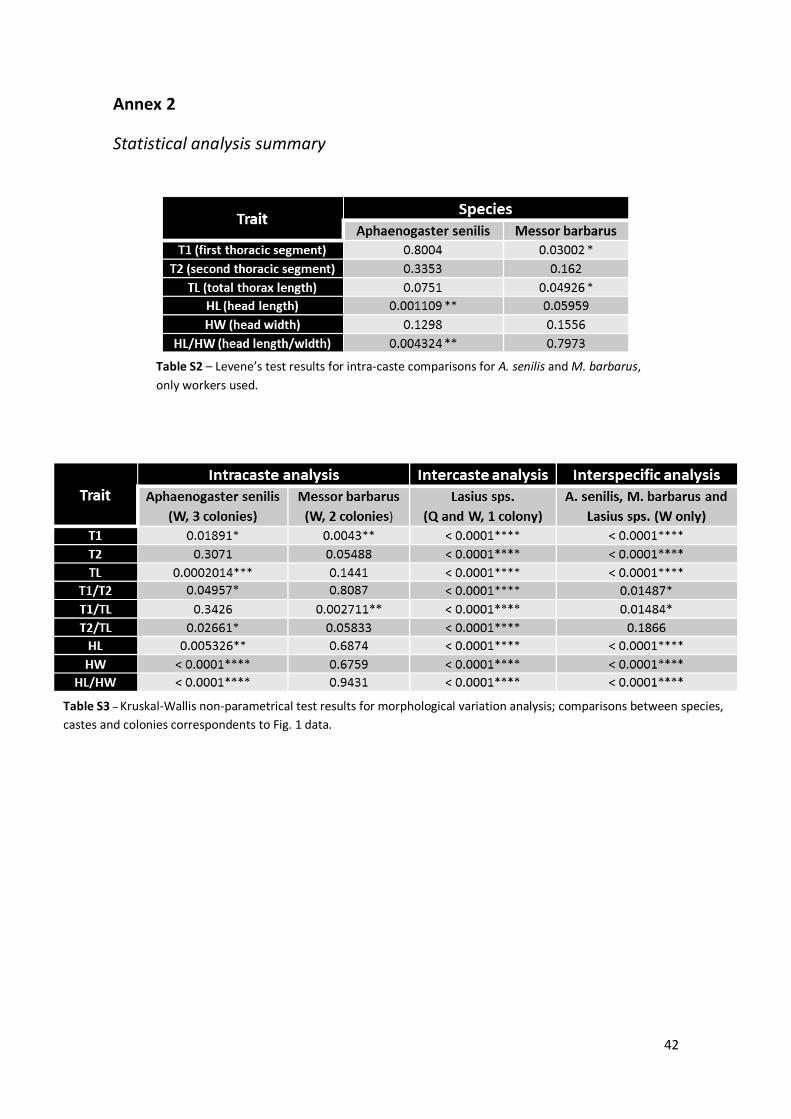
42
Annex 2
Statistical analysis summary
Table S2 – Levene’s test results for intra-caste comparisons for A. senilis and M. barbarus,
only workers used.
Table S3 – Kruskal-Wallis non-parametrical test results for morphological variation analysis; comparisons between species,
castes and colonies correspondents to Fig. 1 data.
43
Annex 3
Hormonal manipulation effects
Hormonal manipulations experiment and its results suggested that compound applications
could be ineffective. Although each round of manipulation has demonstrated a high mortality
rate it is important to refer that this could be due to handling or some other effect that we are
not observing.
To disentangle the effect of treatment for the presence or absence of effect on phenotype
there is a useful experiment that should be done. We know that compounds used are
absorbed when in contact with larval cuticle, but we need to measure how much of these
treatments have a true effect.
We already referred that some genes respond directly to juvenile hormone levels in insects,
which is the case for Krüppel-homolog 1 (Kr-h1), a gene already described as an intervenient in
metamorphosis regulation [44]. Both regulation and amino acid sequence of Kr-h1 are
extremely conserved across insects [44]. Juvenile hormone acts directly through its receptor
Methoprene-tolerant (Met) as demonstrated by Drosophila Met mutants and RNAi on
Tribolium castaneum that produced precocious or miniature adults [40, 41]. This interaction
between ligand and receptor will induce Kr-h1 encoding a putative transcription factor and
allow its action on nucleus and in all individual, delaying metamorphosis [44].
We can thus suggest that Kr-h1 expression levels during development and particularly after
hormonal treatments application (JH-, CTR and JH+) would be a good measurement for our
compounds activity and application effectiveness.
To measure this specific gene expression we will use qPCR in order to quantify juvenile-
hormone responsive elements in comparison with control genes. For this test we used pupae
from both colonies and collected genomic DNA from male and female pools of individuals from
different colonies. Since we do not have the sequenced genome of our model species, A.
senilis, we need to find degenerate primers sequences or design them ourselves. Degenerated
primers are designed using amino acid sequences and are only used when the sequence
resulting of a gene transcript is a highly conserved motif across species inside a taxonomic
group.
Isolation of A.senilis sequence for Krüppel-homolog 1 (Kr-h1) first used degenerate primers
designed for Blatella germanica, a cockroach, generated by RT-PCR using cDNA as template [44].
However, our results for cloning protocol with these primers were not good, and we started
the degenerate primers process from the beginning and tried to maximize process efficiency
following the next steps:
44
1. Sequences alignment, choice of conserved motifs for Kr-h1 and four possible
control genes – EF1, GAPDH, RPL18 and TBP;
2. Design of degenerate primers using CODEHOP, for primer sequences see Table 3;
3. DNA extraction from white pupae with Qiagen – Dneasy Blood and Tissue Kit;
4. Degenerated PCR with gDNA from male and female pools of individuals for target
sequence amplification (PCR program cycle: 95°C for 5min; 35 cycles of 95°C for 20s
– 55°C for 20s - 72°C for 1min; 72°C for 6min);
5. Cloning of PCR products using pGem-T Easy protocol;
6. Plasmid DNA purification with Nucleospin Plasmid protocol (Macherey-Nagel);
7. Cycle sequencing with BigDye Terminator protocol, using reverse primers;
8. Sequence analysis and new alignment, to confirm amplification of genes of interest.
We succeeded and got the proper sequence for our control genes, but our Kr-h1 primers
amplified the wrong region of the genome, with low percentage of identities when aligned
with this conserved region across insects’ groups and in particular when aligned with
Solenopsis sequences used as templates for control genes [45].
The follow up for this process will be the RNA extraction from each larval and pupal instars,
cDNA synthesis and confirmation of sequences expression. The final step would be the
quantification of Kr-h1 expression in different instars in manipulated and un-manipulated
individuals. We would expect for Kr-h1 expression to increase in JH+ treatments and decrease
in JH- treatments.
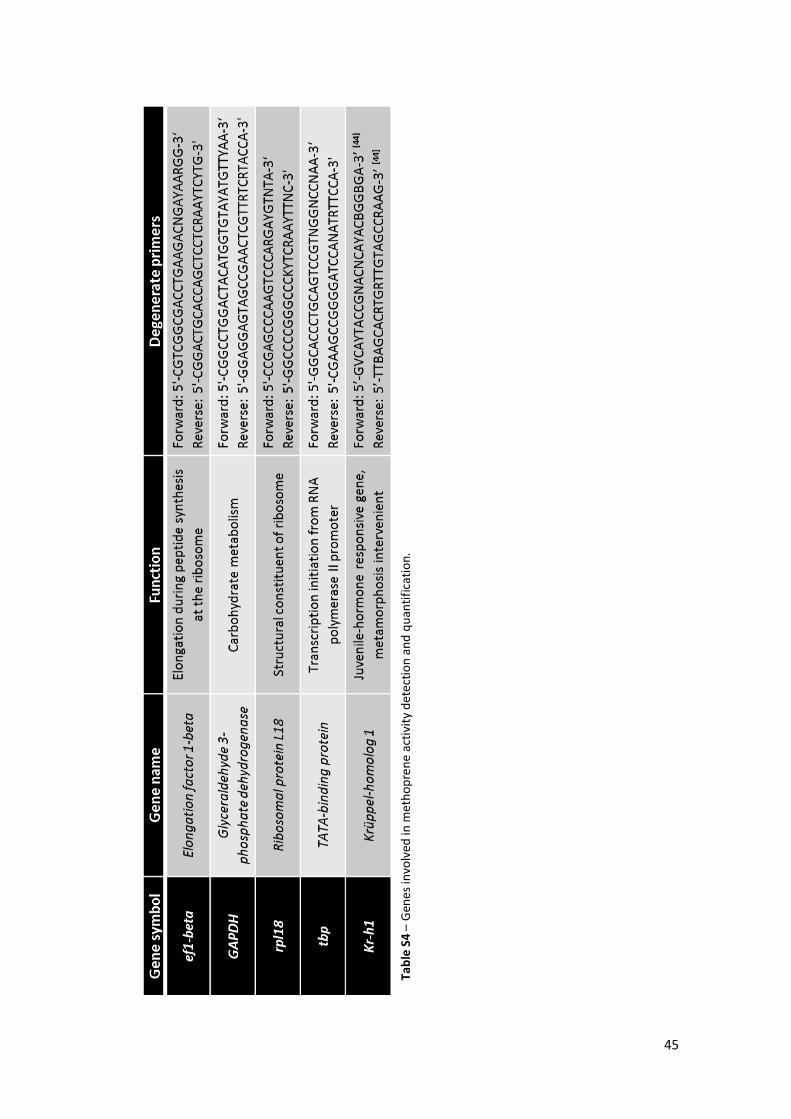
45
Ta
ble
S4
– G
enes
invo
lved
in m
eth
op
ren
e ac
tivi
ty d
etec
tio
n a
nd
qu
anti
fica
tio
n.