morphological and microsatellite dna diversity of nigerian
TRANSCRIPT
JOURNAL OF ANIMAL SCIENCEAND BIOTECHNOLOGY
Agaviezor et al. Journal of Animal Science and Biotechnology 2012, 3:38http://www.jasbsci.com/content/3/1/38
RESEARCH Open Access
Morphological and microsatellite DNA diversity ofNigerian indigenous sheepBrilliant O Agaviezor1,2,3, Sunday O Peters1,3,4, Mufliat A Adefenwa5,3, Abdulmojeed Yakubu3,6,Olufunmilayo A Adebambo1, Michael O Ozoje1, Christian ON Ikeobi1, Matthew Wheto1, Oyeyemi O Ajayi1,Samuel A Amusan1, Oludotun J Ekundayo1, Timothy M Sanni1, Moses Okpeku7, Gbolabo O Onasanya1,Marcos De Donato3, Babatunde M Ilori1, Kadir Kizilkaya8 and Ikhide G Imumorin3*
Abstract
Background: Sheep is important in the socio-economic lives of people around the world. It is estimated that morethan half of our once common livestock breeds are now endangered. Since genetic characterization of Nigeriansheep is still lacking, we analyzed ten morphological traits on 402 animals and 15 microsatellite DNA markers in384 animals of the 4 Nigerian sheep breeds to better understand genetic diversity for breeding management andgermplasm conservation.
Results: Morphological traits of Uda and Balami were significantly (P < 0.05) higher than Yankasa, which were bothhigher than West African Dwarf (WAD) sheep. Stepwise discriminant analysis showed tail length, rump height, chestgirth, ear length and chest depth as the most discriminating variables for classification. Mahalanobis distances showthe least differentiation between Uda and Balami and the largest between WAD and Balami sheep. While 93.3% ofWAD sheep were correctly assigned to their source genetic group, 63.9% of Yankasa, 61.2% of Balami and 45.2% ofUda were classified correctly by nearest neighbour discriminant analysis. The overall high PolymorphismInformation Content (PIC) of all microsatellite markers ranged from 0.751 to 0.927 supporting their use in geneticcharacterization. Expected heterozygosity was high for all loci (0.783 to 0.93). Mean heterozygote deficiency acrossall populations (0.171 to 0.534) possibly indicate significant inbreeding (P < 0.05). Mean values for FST, FIT and FISstatistics across all loci were 0.088, 0.394 and 0.336 respectively. Yankasa and Balami are the most closely relatedbreeds (DA = 0.184) while WAD and Balami are the farthest apart breeds (DA = 0.665), which is coincident withdistance based on morphological analysis and population structure assessed by STRUCTURE.
Conclusions: These results suggest that within-breed genetic variation in Nigerian sheep is higher thanbetween-breeds and may be a valuable tool for genetic improvement and conservation. The higher geneticvariability in Yankasa suggests the presence of unique ancestral alleles reflecting the presence of certain functionalgenes which may result in better adaptability in more agro-ecological zones of Nigeria. These geneticcharacteristics are potentially useful in planning improvement and conservation strategies in Nigerianindigenous sheep.
Keywords: Discriminant analysis, Genetic distance, Microsatellite DNA, Morphological traits, Nigerian sheep
* Correspondence: [email protected] of Animal Science and Fisheries, University of Port Harcourt,Port Harcourt, NigeriaFull list of author information is available at the end of the article
© 2012 Agaviezor et al.; licensee BioMed Central Ltd. This is an Open Access article distributed under the terms of the CreativeCommons Attribution License (http://creativecommons.org/licenses/by/2.0), which permits unrestricted use, distribution, andreproduction in any medium, provided the original work is properly cited.

Agaviezor et al. Journal of Animal Science and Biotechnology 2012, 3:38 Page 2 of 16http://www.jasbsci.com/content/3/1/38
BackgroundThe population of sheep in Nigeria is currently esti-mated at 33.9 million making up 3.1% of the world’stotal [1]. Sheep is an important livestock species in thesocio-economic lives of people around the world includ-ing Nigerians [2]. Increased loss of genetic diversity hasbeen observed for all agriculturally used species, and itis estimated that more than half of our once commonlivestock breeds are now endangered [1]. According toFAO [3], it is estimated that the world loses two breedsof its valuable domestic animal diversity every week.Already, 740 breeds are recorded as extinct, with 1,335(32% of the estimated total) being classified at high riskof loss or under threat of extinction. If the erosion ofanimal genetic diversity continues without adequate ac-tion, more than 2,000 domestic animal breeds could belost within the next two decades [3]. The first step to-ward an efficient conservation strategy for cattle, sheep,and goat genetic resources is the proper characterizationof the conservation value of the different breeds andtheir wild relatives [4].Sheep biodiversity have been described using morpho-
logical measurements [5,6] or characterized using mo-lecular data [7-13]. The phenotypic variation in apopulation arises due to genotypic and environmentaleffects, and the magnitude of phenotypic variability dif-fers under different environmental conditions. Morpho-metric characters are continuous characters describingaspects of body shape [14,15]. Morphometric variationbetween populations can provide a basis for understand-ing flock structure, and may be more applicable forstudying short-term, environmentally induced variationand thus more applicable to livestock management.According to Gizaw et al. [5], morphological descriptionis an essential component of breed characterization thatcan be used to physically identify, describe, andrecognize a breed, and also to classify livestock breedsinto broad categories. Dossa et al. [16] reported thatmorphological measurements such as heart girth, heightat withers and body length can be used for rapid selec-tion of large size individuals in the field to enable the es-tablishment of elite flocks. In addition, microsatelliteshave been used successfully over the years tocharacterize the genetic diversity of sheep populationsin China [12], Ethiopia [5], Europe and Middle East[7-9,17], India [10,11,18] and Brazil [13].The Nigerian sheep is still genetically unimproved, and
the pressure of modern genetic improvement hasincreased the need to better understand natural geneticvariation in Nigerian sheep breeds, as well as formulategermplasm conservation policies. The only genetic diver-sity study of genetic variation among Nigerian sheepbreeds using microsatellite markers covered a limitedgeographical area [19]. Therefore, a more detailed study
using a larger sample size from across the entire countryis still required to better understand the genetic struc-ture of Nigerian sheep population. In this study, mor-phological data on 402 sheep and molecular data on 15microsatellite DNA markers in 384 sheep sampledacross the entire country were used to evaluate the mor-phological and genetic diversity of the four major extantsheep breeds in Nigeria. This study complements our re-cent molecular characterization of the mitochondrial D-loop region in Nigerian sheep [20]. The informationobtained will be useful for designing appropriate breed-ing and selection schemes for indigenous sheep im-provement and sustainable conservation.
ResultsMorphological characterizationThe basic descriptive statistics of the morphologicaltraits of WAD, Yankasa, Uda and Balami sheep are pre-sented in Table 1. The biometric traits of Uda andBalami sheep were significantly (p < 0.05) higher thanthose of WAD and Yankasa, although the latter had su-perior mean values than the former for all morphomet-ric traits with the exception of EL. The effects of sex andsystem of management on the body parameters of thefour sheep breeds are presented in Tables 2 and 3. Maleanimals had significantly higher body parameters thantheir female counterparts and higher values are observedin Balami and Uda compared with other breeds. Thesexual dimorphism observed could be attributed to dif-ferences in the genetic architecture of the sheep popula-tions. Animals reared intensively also had superiormeans than those semi-intensively managed for all mor-phological traits. While all the sheep breeds are rearedsemi intensively, only WAD and Yankasa are reared ex-tensively. However, WAD is not reared intensively. Theeffect of age on morphological parameters was signifi-cant with slight increases with age (Table 4). Table 5shows the spread of the four Nigerian sheep breedsacross the country. WAD is only found in the southernpart of the country. Variation was observed in the vari-ous morphological parameters studied according tobreed in the different sampling location. The stepwisediscriminant procedure showed that TL, RH, CG, ELand CD were the most discriminating variables to separ-ate WAD, Yankasa, Uda and Balami sheep based ontheir significance and partial R2 values ≥0.01 (Tables 6and 7, respectively). The canonical variate analysis(Table 7) clearly showed distinctive differences in themorphological traits of the four sheep breeds. Table 8shows the percentage of individual sheep classified intogenetic groups. The highest value is between WAD andWAD (93.33) and the lowest is between Uda and Uda(45.16). Error level is lowest in Yankasa (0.361). Resultsfor kinship coefficient (Dkf ) and proportion of shared

Table 1 Descriptive statistics of the morphological traitsof Nigerian sheep breeds
Trait WAD sheep Yankasa sheep Uda sheep Balami sheep
LSM ± SEM LSM± SEM LSM ± SEM LSM± SEM
BW 20.12 ± 1.23d 30.87 ± 1.05c 37.86 ± 1.20a 39.00 ± 0.94a
WH 52.35 ± 1.07d 68.52 ± 0.6c 74.53 ± 0.87a 74.31 ± 0.59a
RH 52.12 ± 0.87d 67.44 ± 0.63c 73.78 ± 0.82a 73.64 ± 0.57a
BL 76.87 ± 1.53d 93.56 ± 0.91c 99.40 ± 0.99a 101.77 ± 1.21a
EL 13.03 ± 0.39c 13.19 ± 0.28c 15.63 ± 0.54a 14.54 ± 0.28b
FCL 13.45 ± 0.21d 14.85 ± 0.22c 16.53 ± 0.31a 15.60 ± 0.19b
TL 19.42 ± 0.63d 35.28 ± 0.54c 44.13 ± 0.73a 39.67 ± 0.50a
CG 65.04 ± 1.60d 75.83 ± 0.90c 81.30 ± 1.12a 82.87 ± 1.19a
CD 25.73 ± 0.78d 33.38 ± 0.45c 35.22 ± 0.58a 33.82 ± 0.32a
RW 11.84 ± 0.29d 13.77 ± 0.22c 15.35 ± 0.30a 15.32 ± 0.22a
a,b,c – means with different superscript are significantly (p < 0.05) different.BW body weight, WH withers height, RH rump height, BL body length, EL earlength, FCL fore cannon bone length, TL tail length, CG chest girth, CD chestdepth, RW rump width WAD West African Dwarf sheep, LSM least squaremeans, SEM standard error of mean.
Agaviezor et al. Journal of Animal Science and Biotechnology 2012, 3:38 Page 3 of 16http://www.jasbsci.com/content/3/1/38
alleles are presented in Table 9. The highest kinship co-efficient and number of shared alleles is between WADand Balami.
Molecular genetic diversity between populationsPolymorphism Information Content (PIC) and F statis-tics (FIS, FIT, FST) according to Weir and Cockerham(1984), GST and Shannon index values for all 15 micro-satellite markers analyzed in Nigerian sheep breeds areshown in Table 10. The l5 microsatellite loci demon-strated high polymorphism in this population with PICvalues ranging from 0.751 to 0.927 (Table 10) lendingstrong support to the use of this panel of markers forassessing genetic diversity in Nigerian sheep.Differences in the values of global FST, FIT and FIS over
all loci (Table 10) considered in this study shows the
Table 2 Effects of sex on the morphological traits of Nigerian
Male
Balami Uda WAD Yankasa
BW 40.23 ± 1.69 44.28 ± 1.86 27.01 ± 3.46 37.12 ± 1.83
BL 91.34 ± 3.92 102.06 ± 4.32 79.63 ± 8.02 89.67 ± 4.26
TL 45.00 ± 1.09 46.37 ± 1.20 21.27 ± 2.23 35.39 ± 1.18
WH 73.89 ± 1.36 76.66 ± 1.50 53.09 ± 2.78 67.02 ± 1.48
RW 74.72 ± 1.07 77.73 ± 1.17 54.95 ± 2.19 68.00 ± 1.16
CG 78.39 ± 1.44 83.79 ± 1.59 63.59 ± 2.95 74.64 ± 1.57
CD 27.95 ± 1.85 35.70 ± 2.03 25.68 ± 3.78 32.05 ± 2.01
RH 14.44 ± 0.35 15.38 ± 0.39 11.36 ± 0.74 12.84 ± 0.39
FCL 14.70 ± 0.55 17.73 ± 0.60 14.05 ± 1.12 16.05 ± 0.59
EL 16.91 ± 0.52 18.84 ± 0.58 14.63 ± 1.07 15.42 ± 0.57
suitability of some microsatellite markers over the othersin the study of genetic diversity in Nigerian sheepbreeds. The mean value of FST is 0.088 while that of FITand FIS are 0.394 and 0.335 respectively. The highestvalue of FST (0.146) was observed for BM8125 while thelowest value of 0.022 was seen in DYMS1. Inbreedingvalues within and across breeds can also be attributed toselection. FST and GST are indices of population subdiv-ision. Global FST, GST and GST’ over all loci were allsignificantly different (p < 0.001). The population differ-ences examined by global analysis of FST (coefficient ofmultilocus genetic differentiation fixation index) for eachof 15 microsatellite loci across the four sheep breedsrevealed that most of the total genetic variation corre-sponds to differences among individuals within breeds(91.2%) and 8.8% result from differences among breeds.Values of GST ranged from 0.033 for OarFCB304 to0.211 for OarHH47 with a mean of 0.120 (Table 10).The results of GST in this study reveal that gene vari-ation among the breeds is still low. This differentiationformed the basis for describing how genetic variation ispartitioned within Nigerian sheep breeds. Among theloci considered in this study, OarFCB304 had the highestShannon information index value of 2.51 and the leastindex value of 1.391 was observed for OarHH47.Number of effective alleles, allelic richness, expected
heterozygosity and observed heterozygosity are pre-sented in Table 11. Effective number of alleles rangedfrom 17.330 in Yankasa to 7.200 in WAD. This trendwas also observed for allelic richness with Yankasa hav-ing a value of 10.51 and WAD, 6.59. Yankasa had thehighest expected heterozygosity (0.849) while WAD hadthe least (0.684). Mean values for observed heterozygos-ity across the breeds ranged from 0.405 in Uda to 0.563in Yankasa (Table 11).The analysis of molecular variance (AMOVA) results
revealed that the greatest variation (60.716%) is withinindividuals, 30.545% among individuals within populations
sheep breeds
Female
Balami Uda WAD Yankasa
37.49 ± 1.08 33.89 ± 1.53 17.37 ± 2.63 27.99 ± 1.25
82.65 ± 2.51 96.01 ± 3.55 75.26 ± 6.10 91.34 ± 2.90
44.01 ± 0.69 42.64 ± 0.98 18.34 ± 1.69 34.74 ± 0.80
71.16 ± 0.87 70.98 ± 1.23 47.07 ± 2.12 67.01 ± 1.00
73.34 ± 0.68 71.68 ± 0.97 50.47 ± 1.66 66.45 ± 0.79
78.25 ± 0.92 77.85 ± 1.31 60.21 ± 2.24 73.05 ± 1.07
29.58 ± 1.18 30.96 ± 1.67 23.07 ± 2.88 30.35 ± 1.37
14.91 ± 0.23 14.45 ± 0.32 11.52 ± 0.55 13.86 ± 0.26
12.78 ± 0.35 14.40 ± 0.49 13.10 ± 0.85 14.59 ± 0.41
13.65 ± 0.33 13.93 ± 0.47 12.10 ± 0.82 12.51 ± 0.39
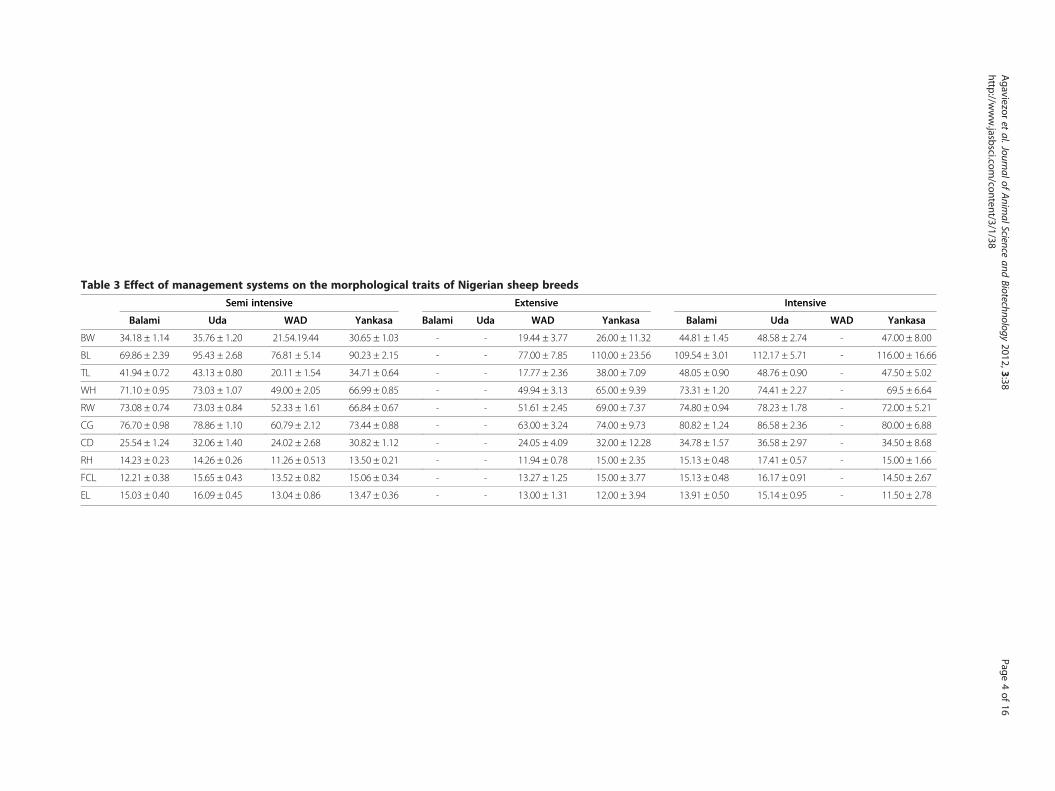
Table 3 Effect of management systems on the morphological traits of Nigerian sheep breeds
Semi intensive Extensive Intensive
Balami Uda WAD Yankasa Balami Uda WAD Yankasa Balami Uda WAD Yankasa
BW 34.18 ± 1.14 35.76 ± 1.20 21.54.19.44 30.65 ± 1.03 - - 19.44 ± 3.77 26.00 ± 11.32 44.81 ± 1.45 48.58 ± 2.74 - 47.00 ± 8.00
BL 69.86 ± 2.39 95.43 ± 2.68 76.81 ± 5.14 90.23 ± 2.15 - - 77.00 ± 7.85 110.00 ± 23.56 109.54 ± 3.01 112.17 ± 5.71 - 116.00 ± 16.66
TL 41.94 ± 0.72 43.13 ± 0.80 20.11 ± 1.54 34.71 ± 0.64 - - 17.77 ± 2.36 38.00 ± 7.09 48.05 ± 0.90 48.76 ± 0.90 - 47.50 ± 5.02
WH 71.10 ± 0.95 73.03 ± 1.07 49.00 ± 2.05 66.99 ± 0.85 - - 49.94 ± 3.13 65.00 ± 9.39 73.31 ± 1.20 74.41 ± 2.27 - 69.5 ± 6.64
RW 73.08 ± 0.74 73.03 ± 0.84 52.33 ± 1.61 66.84 ± 0.67 - - 51.61 ± 2.45 69.00 ± 7.37 74.80 ± 0.94 78.23 ± 1.78 - 72.00 ± 5.21
CG 76.70 ± 0.98 78.86 ± 1.10 60.79 ± 2.12 73.44 ± 0.88 - - 63.00 ± 3.24 74.00 ± 9.73 80.82 ± 1.24 86.58 ± 2.36 - 80.00 ± 6.88
CD 25.54 ± 1.24 32.06 ± 1.40 24.02 ± 2.68 30.82 ± 1.12 - - 24.05 ± 4.09 32.00 ± 12.28 34.78 ± 1.57 36.58 ± 2.97 - 34.50 ± 8.68
RH 14.23 ± 0.23 14.26 ± 0.26 11.26 ± 0.513 13.50 ± 0.21 - - 11.94 ± 0.78 15.00 ± 2.35 15.13 ± 0.48 17.41 ± 0.57 - 15.00 ± 1.66
FCL 12.21 ± 0.38 15.65 ± 0.43 13.52 ± 0.82 15.06 ± 0.34 - - 13.27 ± 1.25 15.00 ± 3.77 15.13 ± 0.48 16.17 ± 0.91 - 14.50 ± 2.67
EL 15.03 ± 0.40 16.09 ± 0.45 13.04 ± 0.86 13.47 ± 0.36 - - 13.00 ± 1.31 12.00 ± 3.94 13.91 ± 0.50 15.14 ± 0.95 - 11.50 ± 2.78
Agaviezor
etal.Journalof
Anim
alScienceand
Biotechnology2012,3:38
Page4of
16http://w
ww.jasbsci.com
/content/3/1/38

Table 4 Effects of age on the morphological traits of Nigerian sheep breeds
< 1 year 1 -2 years 2 – 3 years
Balami Uda WAD Yankasa Balami Uda WAD Yankasa Balami
BW 33.66 ± 2.27 42.33 ± 4.64 13.50 ± 8.04 29.14 ± 4.29 30.86 ± 2.27 33.92 ± 2.68 15.54 ± 3.42 27.46 ± 2.14 37.53 ± 1.52
BL 77.68 ± 4.94 88.45 ± 10.09 74.00 ± 17.47 76.10 ± 9.34 67.12 ± 4.94 89.25 ± 5.82 70.45 ± 7.45 83.06 ± 4.67 77.11 ± 3.30
TL 43.47 ± 1.41 38.45 ± 2.89 19.75 ± 5.00 28.71 ± 2.67 42.48 ± 1.41 41.85 ± 1.66 18.09 ± 2.13 35.93 ± 1.33 42.05 ± 0.94
WH 68.08 ± 1.80 66.13 ± 3.68 46.00 ± 6.38 58.14 ± 3.41 67.05 ± 1.80 70.62 ± 2.12 47.50 ± 2.72 66.21 ± 1.70 72.25 ± 1.20
RW 70.45 ± 1.43 71.25 ± 2.92 50.00 ± 5.05 61.28 ± 2.70 70.02 ± 1.43 72.31 ± 1.68 49.04 ± 2.15 65.11 ± 1.35 74.50 ± 0.95
CG 74.16 ± 1.86 77.63 ± 3.79 56.80 ± 6.58 67.21 ± 3.51 71.53 ± 1.86 75.45 ± 2.19 58.22 ± 2.80 72.34 ± 1.75 79.19 ± 1.24
CD 31.69 ± 2.51 35.06 ± 5.12 22.25 ± 8.88 34.77 ± 4.74 22.84 ± 2.51 30.25 ± 2.96 22.36 ± 3.78 28.29 ± 2.37 28.29 ± 1.67
RH 14.04 ± 0.45 12.42 ± 0.92 9.50 ± 1.59 11.31 ± 0.85 13.15 ± 0.45 13.53 ± 0.53 11.00 ± 0.68 12.66 ± 0.42 14.62 ± 0.30
FCL 13.01 ± 0.76 14.76 ± 1.56 13.25 ± 2.71 15.18 ± 1.45 11.16 ± 0.76 14.49 ± 0.90 12.86 ± 1.15 14.60 ± 0.72 13.30 ± 0.51
EL 13.28 ± 0.79 15.61 ± 1.61 12.50 ± 2.80 12.14 ± 1.49 15.04 ± 0.79 14.55 ± 0.93 12.31 ± 1.19 13.53 ± 0.74 15.22 ± 0.52
Agaviezor
etal.Journalof
Anim
alScienceand
Biotechnology2012,3:38
Page5of
16http://w
ww.jasbsci.com
/content/3/1/38

2 – 3 years 3 – 4 years 5 – 6 years
Uda WAD Yankasa Balami Uda WAD Yankasa Balami Uda WAD Yankasa
BW 36.27 ± 1.87 25.92 ± 3.03 32.62 ± 1.59 44.89 ± 1.75 40.51 ± 2.04 22.16 ± 6.56 31.79 ± 2.01 48.11 ± 3.79 58.75 ± 8.04 - 28.80 ± 5.08
BL 99.23 ± 4.06 81.07 ± 6.60 92.58 ± 3.46 103.44 ± 4.43 103.23 ± 4.43 82.66 ± 14.27 96.13 ± 4.36 121.00 ± 8.23 123 ± 17.47 - 102.68 ± 11.05
TL 43.85 ± 1.16 20.67 ± 1.89 35.50 ± 0.99 47.07 ± 1.09 45.72 ± 1.27 18.16 ± 4.08 34.47 ± 1.25 51.11 ± 2.36 63.00 ± 5.00 - 35.50 ± 3.16
WH 73.69 ± 1.48 50.89 ± 2.41 67.39 ± 1.26 75.32 ± 1.39 75.16 ± 1.62 50.50 ± 5.20 68.33 ± 1.59 880.33 ± 3.00 82.00 ± 6.38 - 71.64 ± 4.03
RW 73.84 ± 1.17 54.50 ± 1.91 67.75 ± 1.00 76.62 ± 1.10 75.41 ± 1.28 53.66 ± 4.13 68.24 ± 1.26 76.88 ± 2.38 84.50 ± 5.05 - 68.54 ± 3.19
CG 79.51 ± 1.53 63.07 ± 2.48 73.07 ± 1.30 83.10 ± 1.67 83.10 ± 1.67 68.83 ± 5.37 76.12 ± 1.64 101.00 ± 6.58 101.00 ± 6.58 - 77.72 ± 4.16
CD 33.36 ± 2.06 25.64 ± 3.35 31.44 ± 1.75 30.92 ± 1.93 32.85 ± 2.25 23.83 ± 7.25 30.96 ± 2.22 36.66 ± 4.18 41.50 ± 8.81 - 32.54 ± 5.61
RH 14.70 ± 0.37 11.78 ± 0.60 13.92 ± 0.31 16.36 ± 0.34 15.90 ± 0.40 13.00 ± 1.30 14.16 ± 0.39 15.33 ± 0.75 19.50 ± 1.59 - 13.64 ± 1.01
FCL 16.38 ± 0.63 13.85 ± 1.02 15.35 ± 0.53 14.56 ± 0.59 15.99 ± 0.69 13.83 ± 2.21 14.67 ± 0.67 14.66 ± 1.28 14.50 ± 2.71 - 16.88 ± 1.71
EL 16.33 ± 0.65 13.85 ± 1.05 14.01 ± 0.55 14.38 ± 0.61 16.23 ± 0.71 12.16 ± 2.28 12.61 ± 0.70 14.38 ± 1.32 16.50 ± 2.80 - 14.04 ± 1.77
Table 4 Effects of age on the morphological traits of Nigerian sheep breeds (Continued)
Agaviezor
etal.Journalof
Anim
alScienceand
Biotechnology2012,3:38
Page6of
16http://w
ww.jasbsci.com
/content/3/1/38

Table 5 Effects of sampling location on the morphological traits of Nigerian sheep breeds
South Middle belt North East
Balami Uda WAD Yankasa Balami Uda WAD Yankasa Balami
BW 45.66 ± 6.37 43.00 ± 3.67 20.91 ± 2.01 44.26 ± 2.53 47.22 ± 3.67 46.99 ± 3.32 - 28.47 ± 1.74 32.79 ± 1.61
BL 102.66 ± 11.77 98.11 ± 6.79 76.86 ± 3.72 92.000 ± 4.67 110.09 ± 6.79 108.89 ± 6.14 - 98.94 ± 3.22 59.74 ± 2.95
TL 44.00 ± 4.03 41.74 ± 2.32 19.41 ± 1.27 36.36 ± 1.60 43.78 ± 2.32 44.50 ± 2.10 - 31.47 ± 1.10 44.06 ± 1.01
WH 74.66 ± 5.19 77.88 ± 3.00 49.28 ± 1.64 65.23 ± 2.06 79.29 ± 3.0 82.01 ± 2.71 - 68.95 ± 1.42 67.62 ± 1.31
RW 77.00 ± 4.17 78.33 ± 2.40 52.11 ± 1.31 68.39 ± 1.65 77.57 ± 2.40 79.60 ± 2.17 - 67.69 ± 1.14 73.25 ± 1.05
CG 76.50 ± 5.58 78.92 ± 3.22 61.45 ± 1.76 72.26 ± 2.21 82.05 ± 3.22 86.60 ± 2.91 - 75.60 ± 1.52 75.57 ± 1.41
CD 33.66 ± 6.71 33.33 ± 3.87 24.03 ± 2.12 30.15 ± 2.66 36.56 ± 3.87 41.26 ± 3.50 - 32.72 ± 1.83 25.31 ± 1.69
RH 15.16 ± 1.35 14.61 ± 0.78 11.46 ± 0.42 12.86 ± 0.53 15.51 ± 0.78 15.65 ± 0.70 - 14.08 ± 0.37 13.84 ± 0.34
FCL 20.00 ± 1.75 20.88 ± 1.01 13.45 ± 0.55 17.21 ± 0.69 18.95 ± 1.01 20.37 ± 0.91 - 16.48 ± 0.48 11.41 ± 0.44
EL 19.83 ± 2.06 20.33 ± 1.19 13.03 ± 0.65 16.26 ± 0.82 18.83 ± 1.19 21.46 ± 1.07 - 13.12 ± 0.56 14.77 ± 0.52
Agaviezor
etal.Journalof
Anim
alScienceand
Biotechnology2012,3:38
Page7of
16http://w
ww.jasbsci.com
/content/3/1/38

North East North West North Central
Uda WAD Yankasa Balami Uda WAD Yankasa Balami Uda WAD Yankasa
BW 32.10 ± 2.08 - 23.00 ± 7.80 42.32 ± 1.32 40.15 ± 1.89 - 27.08 ± 2.67 34.18 ± 2.01 34.38 ± 3.18 - 29.15 ± 1.64
BL 102.47 ± 3.85 - 70.55 ± 14.42 108.43 ± 2.45 106.11 ± 3.49 - 99.76 ± 4.94 58.09 ± 5.88 58.09 ± 5.88 - 80.60 ± 3.04
TL 43.71 ± 1.32 - 44.50 ± 4.93 47.51 ± 0.84 45.85 ± 1.19 - 37.47 ± 1.69 37.47 ± 1.27 41.84 ± 2.01 - 36.05 ± 1.04
WH 70.92 ± 1.70 - 55.50 ± 6.36 73.56 ± 1.08 72.67 ± 1.54 - 69.52 ± 2.18 72.59 ± 1.64 69.05 ± 2.59 - 65.60 ± 1.34
RW 71.65 ± 1.36 - 62.75 ± 5.11 74.88 ± 0.87 74.20 ± 1.23 - 69.58 ± 1.75 70.42 ± 1.31 71.53 ± 2.08 - 64.85 ± 1.07
CG 78.87 ± 1.82 - 71.00 ± 6.83 80.32 ± 1.16 81.79 ± 1.65 - 78.05 ± 2.34 76.94 ± 1.76 74.31 ± 2.79 - 70.70 ± 1.44
CD 32.65 ± 2.19 - 48.00 ± 8.22 34.37 ± 1.40 35.58 ± 1.99 - 33.94 ± 2.82 20.24 ± 2.12 17.72 ± 3.35 - 27.67 ± 1.73
RH 14.42 ± 0.44 - 12.05 ± 1.65 15.39 ± 0.28 16.02 ± 0.40 - 13.35 ± 0.56 14.55 ± 0.42 11.80 ± 0.67 - 13.47 ± 0.35
FCL 16.62 ± 0.57 - 15.60 ± 2.15 14.78 ± 0.36 14.55 ± 0.52 - 13.94 ± 0.73 10.68 ± 0.55 8.98 ± 0.87 - 13.28 ± 0.45
EL 15.75 ± 0.67 - 12.00 ± 2.52 13.62 ± 0.43 13.89 ± 0.61 - 11.52 ± 0.86 14.48 ± 0.65 13.64 ± 1.03 - 13.30 ± 0.53
Table 5 Effects of sampling location on the morphological traits of Nigerian sheep breeds (Continued)
Agaviezor
etal.Journalof
Anim
alScienceand
Biotechnology2012,3:38
Page8of
16http://w
ww.jasbsci.com
/content/3/1/38

Table 6 Stepwise selection of traits
Traits entered Partial R2 F value Pr > F Wilk’s lambda Pr < lambda ASCC Pr > ASCC
Tail length 0.4913 128.12 <0.0001 0.508710 <0.0001 0.164 <0.0001
Rump height 0.1056 15.63 <0.0001 0.454978 <0.0001 0.183 <0.0001
Chest girth 0.1055 15.49 <0.0001 0.356692 <0.0001 0.246 <0.0001
Ear length 0.0650 9.18 <0.0001 0.425392 <0.0001 0.201 <0.0001
Chest depth 0.0626 8.79 <0.0001 0.398760 <0.0001 0.212 <0.0001
ASCC Average squared canonical correlation.
Agaviezor et al. Journal of Animal Science and Biotechnology 2012, 3:38 Page 9 of 16http://www.jasbsci.com/content/3/1/38
and 8.739 among populations which are consistent withthe FST results (Table 12). Figure 1 presents the geneticdistances (DA) between Nigerian sheep breeds.Population structure assessed by STRUCTURE software
and barplots generated by DISTRUCT are presented inFigure 2. Classifications with the highest probability underthe model that assumes independent allele frequencies andinbreeding coefficients among assumed clusters revealedthe presence of ancestral populations (K) which is consist-ent with the morphological and diversity analyses reportedearlier in this study. At K = 2, two clusters were constitutedfrom breeds descended from Balami and Yankasa, both ofwhich are from Northern Nigeria. At K = 3 and K = 4, onemore cluster emerged and further analyses did not revealany additional strong high level substructure, so separatingthe entire dataset into 3 major clusters was chosen as thefinal configuration. There are however, several casesof admixtures in the genome of some of the individualsthat constitute the cluster. Yankasa and Balami breeds hadmore cases of admixtures followed by Uda while theWAD breed had the least cases of admixtures.
DiscussionMorphological diversityPhenotypic characterization has been shown to be an ac-cessible and easy-to-use tool in conservation and breedingprograms [6]. This could be explained in part by the highheritability of measures of size across ontogeny [21].Marked differences were observed in the morphologicaltraits of the sheep breeds in this study. The present valuesof BW and linear body measurements of Yankasa, Udaand Balami sheep are higher than the range of valuesreported for Ganjam sheep in India by Arora et al. [10].Most researchers consider an organism’s phenotype as a
Table 7 Total canonical structure of the discriminantanalysis of the four sheep breeds
Traits CAN1 CAN2 CAN3
Rump height 0.839 0.098 0.038
Chest girth 0.493 −0.112 −0.159
Chest depth 0.485 0.261 −0.012
Tail length 0.922 −0.107 0.098
Ear length 0.239 −0.242 0.791
multivariate set of variables and the covariation of traitsan important analytical consideration [22]. Discriminantanalysis of morphometric traits is a mathematical ap-proach that has been widely used in determining the rela-tionships between different breeds of livestock [6,23-25].The most discriminating variables obtained in this studyare similar to previous reports by Dossa et al. [16] andVargas et al. [26]. The present results indicate that there issignificant morphological differentiation among Nigeriansheep populations. This morphological diversity patterncould be as a result of inherent genetic potential of eachbreed, alongside geographical isolation, ecological vari-ation and community isolation [5,27]. This is noticeable inthe remarkable morphological differences between WAD(more adaptable to the wet, dense forest and derivedsavannah zones of southern Nigeria) and Yankasa, Udaand Balami sheep (more suited to the dry climatic condi-tions of Northern Nigeria).The larger values reported for the conformation traits of
males are in consonance with earlier reports on sheep[28], goats [26] and cattle [29]. However, Bacchi et al. [30]found no sexual dimorphism in the morphometriccharacters considered in Lama guanicoe guanicoe inArgentina. The higher values recorded for intensivelymanaged animals might be as a result of better nutri-tion and management practices as they tend to gain moreattention than those reared semi-intensively. Riva et al.[14] reported that husbandry system was a source of vari-ation in the body measurements of Bergamasca sheep;theirs was a case between transhumance and sedentarysystems, where the former was taller, longer and showed awider hock while the latter was wider at the chest andrump.
Table 8 Percentage of individual sheep classified intogenetic group
Breed WAD Yankasa Uda Balami
WAD 93.33 6.67 0.00 0.00
Yankasa 1.64 63.93 15.57 18.85
Uda 0.00 17.20 45.16 37.63
Balami 0.00 17.83 21.02 61.15
Error level 0.067 0.361 0.548 0.389
Priors 0.250 0.250 0.250 0.250
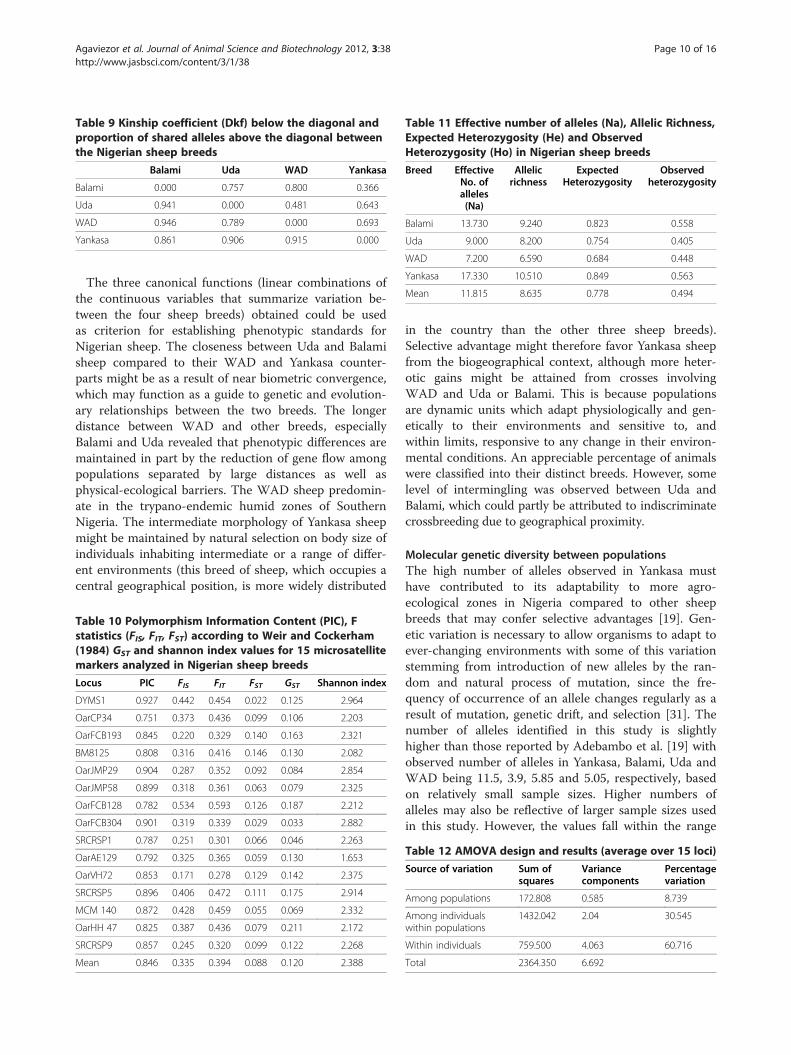
Table 9 Kinship coefficient (Dkf) below the diagonal andproportion of shared alleles above the diagonal betweenthe Nigerian sheep breeds
Balami Uda WAD Yankasa
Balami 0.000 0.757 0.800 0.366
Uda 0.941 0.000 0.481 0.643
WAD 0.946 0.789 0.000 0.693
Yankasa 0.861 0.906 0.915 0.000
Table 11 Effective number of alleles (Na), Allelic Richness,Expected Heterozygosity (He) and ObservedHeterozygosity (Ho) in Nigerian sheep breeds
Breed EffectiveNo. ofalleles(Na)
Allelicrichness
ExpectedHeterozygosity
Observedheterozygosity
Balami 13.730 9.240 0.823 0.558
Uda 9.000 8.200 0.754 0.405
WAD 7.200 6.590 0.684 0.448
Yankasa 17.330 10.510 0.849 0.563
Mean 11.815 8.635 0.778 0.494
Agaviezor et al. Journal of Animal Science and Biotechnology 2012, 3:38 Page 10 of 16http://www.jasbsci.com/content/3/1/38
The three canonical functions (linear combinations ofthe continuous variables that summarize variation be-tween the four sheep breeds) obtained could be usedas criterion for establishing phenotypic standards forNigerian sheep. The closeness between Uda and Balamisheep compared to their WAD and Yankasa counter-parts might be as a result of near biometric convergence,which may function as a guide to genetic and evolution-ary relationships between the two breeds. The longerdistance between WAD and other breeds, especiallyBalami and Uda revealed that phenotypic differences aremaintained in part by the reduction of gene flow amongpopulations separated by large distances as well asphysical-ecological barriers. The WAD sheep predomin-ate in the trypano-endemic humid zones of SouthernNigeria. The intermediate morphology of Yankasa sheepmight be maintained by natural selection on body size ofindividuals inhabiting intermediate or a range of differ-ent environments (this breed of sheep, which occupies acentral geographical position, is more widely distributed
Table 10 Polymorphism Information Content (PIC), Fstatistics (FIS, FIT, FST) according to Weir and Cockerham(1984) GST and shannon index values for 15 microsatellitemarkers analyzed in Nigerian sheep breeds
Locus PIC FIS FIT FST GST Shannon index
DYMS1 0.927 0.442 0.454 0.022 0.125 2.964
OarCP34 0.751 0.373 0.436 0.099 0.106 2.203
OarFCB193 0.845 0.220 0.329 0.140 0.163 2.321
BM8125 0.808 0.316 0.416 0.146 0.130 2.082
OarJMP29 0.904 0.287 0.352 0.092 0.084 2.854
OarJMP58 0.899 0.318 0.361 0.063 0.079 2.325
OarFCB128 0.782 0.534 0.593 0.126 0.187 2.212
OarFCB304 0.901 0.319 0.339 0.029 0.033 2.882
SRCRSP1 0.787 0.251 0.301 0.066 0.046 2.263
OarAE129 0.792 0.325 0.365 0.059 0.130 1.653
OarVH72 0.853 0.171 0.278 0.129 0.142 2.375
SRCRSP5 0.896 0.406 0.472 0.111 0.175 2.914
MCM 140 0.872 0.428 0.459 0.055 0.069 2.332
OarHH 47 0.825 0.387 0.436 0.079 0.211 2.172
SRCRSP9 0.857 0.245 0.320 0.099 0.122 2.268
Mean 0.846 0.335 0.394 0.088 0.120 2.388
in the country than the other three sheep breeds).Selective advantage might therefore favor Yankasa sheepfrom the biogeographical context, although more heter-otic gains might be attained from crosses involvingWAD and Uda or Balami. This is because populationsare dynamic units which adapt physiologically and gen-etically to their environments and sensitive to, andwithin limits, responsive to any change in their environ-mental conditions. An appreciable percentage of animalswere classified into their distinct breeds. However, somelevel of intermingling was observed between Uda andBalami, which could partly be attributed to indiscriminatecrossbreeding due to geographical proximity.
Molecular genetic diversity between populationsThe high number of alleles observed in Yankasa musthave contributed to its adaptability to more agro-ecological zones in Nigeria compared to other sheepbreeds that may confer selective advantages [19]. Gen-etic variation is necessary to allow organisms to adapt toever-changing environments with some of this variationstemming from introduction of new alleles by the ran-dom and natural process of mutation, since the fre-quency of occurrence of an allele changes regularly as aresult of mutation, genetic drift, and selection [31]. Thenumber of alleles identified in this study is slightlyhigher than those reported by Adebambo et al. [19] withobserved number of alleles in Yankasa, Balami, Uda andWAD being 11.5, 3.9, 5.85 and 5.05, respectively, basedon relatively small sample sizes. Higher numbers ofalleles may also be reflective of larger sample sizes usedin this study. However, the values fall within the range
Table 12 AMOVA design and results (average over 15 loci)
Source of variation Sum ofsquares
Variancecomponents
Percentagevariation
Among populations 172.808 0.585 8.739
Among individualswithin populations
1432.042 2.04 30.545
Within individuals 759.500 4.063 60.716
Total 2364.350 6.692
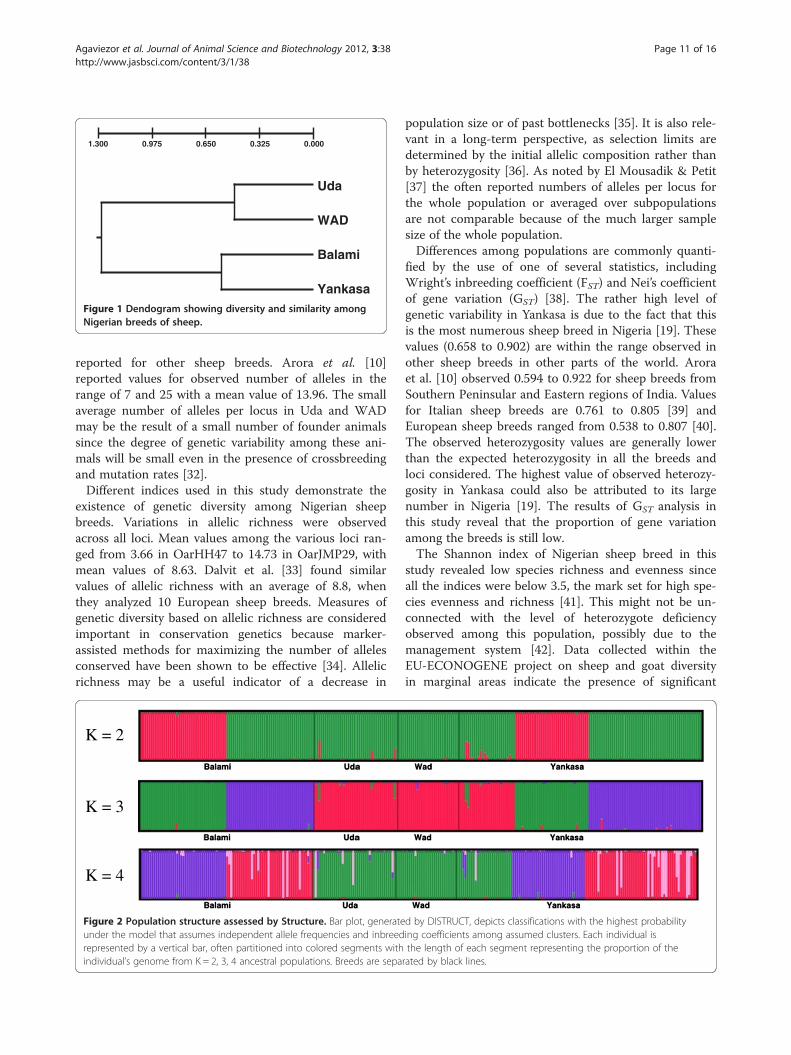
1.300 0.975 0.650 0.325 0.000
Uda
WAD
Balami
Yankasa Figure 1 Dendogram showing diversity and similarity amongNigerian breeds of sheep.
Agaviezor et al. Journal of Animal Science and Biotechnology 2012, 3:38 Page 11 of 16http://www.jasbsci.com/content/3/1/38
reported for other sheep breeds. Arora et al. [10]reported values for observed number of alleles in therange of 7 and 25 with a mean value of 13.96. The smallaverage number of alleles per locus in Uda and WADmay be the result of a small number of founder animalssince the degree of genetic variability among these ani-mals will be small even in the presence of crossbreedingand mutation rates [32].Different indices used in this study demonstrate the
existence of genetic diversity among Nigerian sheepbreeds. Variations in allelic richness were observedacross all loci. Mean values among the various loci ran-ged from 3.66 in OarHH47 to 14.73 in OarJMP29, withmean values of 8.63. Dalvit et al. [33] found similarvalues of allelic richness with an average of 8.8, whenthey analyzed 10 European sheep breeds. Measures ofgenetic diversity based on allelic richness are consideredimportant in conservation genetics because marker-assisted methods for maximizing the number of allelesconserved have been shown to be effective [34]. Allelicrichness may be a useful indicator of a decrease in
K = 2
K = 3
K = 4
Figure 2 Population structure assessed by Structure. Bar plot, generateunder the model that assumes independent allele frequencies and inbreedrepresented by a vertical bar, often partitioned into colored segments withindividual’s genome from K = 2, 3, 4 ancestral populations. Breeds are sepa
population size or of past bottlenecks [35]. It is also rele-vant in a long-term perspective, as selection limits aredetermined by the initial allelic composition rather thanby heterozygosity [36]. As noted by El Mousadik & Petit[37] the often reported numbers of alleles per locus forthe whole population or averaged over subpopulationsare not comparable because of the much larger samplesize of the whole population.Differences among populations are commonly quanti-
fied by the use of one of several statistics, includingWright’s inbreeding coefficient (FST) and Nei’s coefficientof gene variation (GST) [38]. The rather high level ofgenetic variability in Yankasa is due to the fact that thisis the most numerous sheep breed in Nigeria [19]. Thesevalues (0.658 to 0.902) are within the range observed inother sheep breeds in other parts of the world. Aroraet al. [10] observed 0.594 to 0.922 for sheep breeds fromSouthern Peninsular and Eastern regions of India. Valuesfor Italian sheep breeds are 0.761 to 0.805 [39] andEuropean sheep breeds ranged from 0.538 to 0.807 [40].The observed heterozygosity values are generally lowerthan the expected heterozygosity in all the breeds andloci considered. The highest value of observed heterozy-gosity in Yankasa could also be attributed to its largenumber in Nigeria [19]. The results of GST analysis inthis study reveal that the proportion of gene variationamong the breeds is still low.The Shannon index of Nigerian sheep breed in this
study revealed low species richness and evenness sinceall the indices were below 3.5, the mark set for high spe-cies evenness and richness [41]. This might not be un-connected with the level of heterozygote deficiencyobserved among this population, possibly due to themanagement system [42]. Data collected within theEU-ECONOGENE project on sheep and goat diversityin marginal areas indicate the presence of significant
d by DISTRUCT, depicts classifications with the highest probabilitying coefficients among assumed clusters. Each individual isthe length of each segment representing the proportion of therated by black lines.

Agaviezor et al. Journal of Animal Science and Biotechnology 2012, 3:38 Page 12 of 16http://www.jasbsci.com/content/3/1/38
inbreeding in most of the breeds [7,43]. This is likelydue to poor breeding management of frequently smallherds, which leads to partial isolation and fragmentationboth at the local and breed levels [44].Differences in the values of global FST, FIT and FIS over
all loci considered in this study supports the suitabilityof some microsatellite markers over the others in thestudy of genetic diversity in Nigerian sheep breeds. Se-lection based on estimated breeding values rather thanphenotypic merits can lead to the extensive use of asmall number of elite individuals in purebred livestockpopulations, and could potentially increase inbreeding[45]. It has therefore been suggested that breeds withwide range of genetic diversity are needed in the futurefor generating transgressive variation for quantitativetrait loci mapping and developing new genotypes forparticular management systems and market demands[46]. On the average, within-breed heterozygote deficit(FIS) was observed to be 33.5% whereas the total popula-tion (FIT) exhibited 39.5% deficit with significant values(p < 0.05). Some investigations have reported relativelylow variability in local non-selected breeds, as is the caseof certain Nigerian [19] and Chinese sheep [47].The relative higher genetic identity is probably due to
the continuous crossing between populations at least inthe recent past [48]. The AMOVA results revealed thatthe greatest variation (60.716%) is within the individual,30.545% among individuals within populations and 8.739among populations which are consistent with FST results.Finally, the trend in genetic relationship between theseNigerian sheep breeds is the same for delta mu square,kinship coefficient and proportion of shared alleles.Indeed, our recent molecular characterization of Nigeriansheep using mtDNA sequences of the D-loop found 96haplotypes, but only 5 haplotypes are common to all thebreeds [20], showing relatively divergent haplotypes withinbreeds and geographical locations. This suggests that geneflow has occurred on a regional scale at some time in therecent past and that the breeds have not been subdividedby long term biogeographic barriers.
Genetic structure of the populationsThe closest genetic distance between Yankasa andBalami at 0.184 and the farthest distance betweenBalami and WAD (0.665) may be reflective of their geo-graphical locations in Nigeria since Yankasa and Balamiare more of northern than southern breeds. This is fur-ther confirmed by the greater genetic distance betweenWAD and Balami observed in this study. These resultsare supported by Adebambo et al. [19] among thesebreeds. The pattern of differentiation revealed by thematrix of Nei’s genetic distances and the tree topo-logy reflected the evolutionary history, geographical dis-tributions and the gene flow among breeds. Genetic
structure of a breed at any time is the result of a balancebetween genetic drift (founder effect and selection) andgene flow [32]. WAD and Balami shared the highestnumber of alleles while the least is between Yankasa andBalami. However, the pattern of genetic distancesdeviated from the morphological distances obtained forthe four sheep breeds. This may be related to varyingsensitivity of the two distance estimates, although bothmethods were able to separate the southern WAD goatsfrom their northern counterparts. A similar finding wasreported in Ankole cattle [49] where the results of mor-phological analyses were not in concordance with themolecular genetic relationship results. The authorsattributed this to the fact that microsatellites loci are se-lectively neutral whereas morphological traits are underselection.Results from the STRUCTURE analysis revealed that
varying the number of presumed ancestral populations(K) produces clusters that are consistent with theobserved morphological categorization. The first level ofclustering (K = 2) reflects the presence of two clusters inthe four breeds examined and further evaluationrevealed a third strong cluster. This result suggests thatthe four breeds originated from three ancestral popula-tions which diverged as a result of several years of adap-tation and domestication. Further evaluation of theclusters revealed the presence of sub clusters and admix-tures which are indicative of substantial gene flow be-tween these breeds. WAD is the only breed with aminimal case of admixture. This may be due to geo-graphical delineation of the breed and the breeding prac-tices of the owners of these animals predominantly inthe southern part of the country. Yankasa possess alleleswhich are shared by the other three breeds and this isconsistent with the results discussed above.The mitochondrial data showed a different relationship
in the neighbor-joining tree for the four Nigerian sheepbreeds [20]. In that tree, the first divergence was forYankasa breed, followed by WAD and later by Uda andBalami. This can be explained by differences in the breed-ing patterns, by the use of dams and rams in differentmanagement schemes. The higher level of concordance ofmorphological and mitochondrial DNA data could mean amore ancestral relationship among the breeds revealed bymitochondrial DNA that is maternally inherited. Differ-ences found in the microsatellite data may indicate recentcrossbreeding due to geographical closeness among thesympatric breeds, especially involving males from onebreed crossing with females of the other breeds.
ConclusionMorphological and genetic diversity of Nigerian sheepbreeds is eroding gradually. These results suggest thatwithin-breed genetic variation observed in Nigeria sheep

Agaviezor et al. Journal of Animal Science and Biotechnology 2012, 3:38 Page 13 of 16http://www.jasbsci.com/content/3/1/38
is more than between-breed and this variation could bea valuable tool for genetic improvement and conserva-tion. The higher genetic variability in Yankasa may meanthe presence of unique alleles reflecting the presence ofcertain functional genes which may possibly be relatedto better adaptability of Yankasa in more agro-ecologicalzones of Nigeria. The higher level of heterozygosity inthis study provides the basis for further improvementthrough selection of primarily Yankasa as well as theother breeds.
MethodsStudy area and populationSamples were collected across Nigeria covering all agro-ecological zones from the arid North to the dense rain-forest bordering the coast in the South. Nigeria islocated in West Africa on the Gulf of Guinea (latitude10º00’ N, longitude 8º00’ E) with a total area of923,768 km2 (twice the size of California). Nigeria isbounded by Niger, Benin and Cameroon Republics onthe North, West and East, respectively (Figure 3). Theprotocol for the experiment was approved by the Institu-tional Animal Use and Care Committee of the Universityof Agriculture, Abeokuta (UNAAB), Nigeria. A randomsample of 402 sheep (132 males and 270 females) of thefour Nigerian sheep breeds [Balami – 133, Uda – 94, WestAfrican Dwarf (WAD) – 52, Yankasa – 123] were selectedfrom cities and villages across the country. There is no re-lationship between sires and dams of the animals sampledsince they came from different parts of the country. Theanimals were reared in semi-intensive (323 animals) and
Figure 3 Map of Nigeria showing sampled locations.
intensive (79 animals) systems of management. They wereat least 15.5 months of age (2-tooth to 8-tooth age) andwhere records were missing; age was estimated using den-tition as described by Wilson and Durkin [50]. Bodyweight (BW) (kg) and nine body linear measurements(cm), namely height at withers (HW), rump height (RH),body length (BL), ear length (EL), fore cannon bone length(FCL), tail length (TL), chest girth (CG), chest depth (CD)and rump width (RW) respectively were taken on eachanimal, following standard procedure and anatomicalreference points earlier reported [24,28]. In addition,5–7 ml of whole blood were collected from 384 sheepof the four breeds [Balami – 106, Uda – 94, WestAfrican Dwarf (WAD) – 52, Yankasa – 132] into hepari-nized tubes from the jugular vein of each animal andstored on ice before they were transferred to the labora-tory for analysis.
DNA extraction, polymerase chain reaction (PCR) andfragment analysisDNA was extracted from 50 μl of whole blood using theZymoBead™ Genomic DNA Kit (Zymo Research Corp.Irvine, CA, USA) according to the manufacturer’srecommendations and DNA yield and quality wereassessed using a Nanodrop ND-100 Spectrophotometer(Nanodrop Technologies, Inc., DE, USA). The DNA wasamplified by PCR in a MyCycler™ Thermal Cycler(Biorad, Hercules, CA, USA) using 15 microsatellitemarkers selected from the FAO recommended list [51]described in Table 13. The 20 μl amplification reactionscontained 2 μl containing 30-50 ng template DNA,

Table 13 Microsatellite primer sequences that were used and their base lengths
Name Sequence Base length Annealing temperature (°C) Allele range (bp) Dye
1 OarFCB193 TTCATCTCAGACTGGGATTCAGAAAGGC 28 54 96-136 6FAM
GCTTGGAAATAACCCTCCTGCATCCC 26
2 OarJMP29 GTA TAC ACG TGG ACA CCG CTT TGT AC 26 56 96-150 NED
GAA GTG GCA AGA TTC AGA GGG GAA G 25
3 OarJMP58 GAAGTCATTGAGGGGTCGCTAACC 24 58 145-169 6FAM
CTTCATGTTCACAGGACTTTCTCTG 25
4 OarFCB304 CCCTAGGAGCTTTCAATAAAGAATCGG 27 56 150-188 6FAM
CGCTGCTGTCAACTGGGTCAGGG 23
5 OarAE129 AATCCAGTGTGTGAAAGACTAATCCAG 27 54 133-159 6FAM
GTAGATCAAGATATAGAATATTTTTCAACACC 32
6 BM8125 CTCTATCTGTGGAAAAGGTGGG 22 50 110-130 VIC
GGGGGTTAGACTTCAACATACG 22
7 OarFCB128 ATTAAAGCATCTTCTCTTTATTTCCTCGC 29 55 96-130 VIC
CAGCTGAGCAACTAAGACATACATGCG 27
8 OarCP34 GCTGAACAATGTGATATGTTCAGG 24 50 112-130 VIC
GGGACAATACTGTCTTAGATGCTGC 25
9 OarVH72 GGCCTCTCAAGGGGCAAGAGCAGG 24 57 121-145 VIC
CTCTAGAGGATCTGGAATGCAAAGCTC 27
10 OarHH47 TTTATTGACAAACTCTCTTCCTAACTCCACC 31 58 130-152 VIC
GTAGTTATTTAAAAAAATATCATACCTCTTAAGG 34
11 DYMS1 AACAACATCAAACAGTAAGAG 21 59 159-211 NED
CATAGTAACAGATCTTCCTACA 22
12 SRCRSP1 TGC AAG AAG TTT TTC CAG AGC 21 54 116-148 NED
ACC CTG GTT TCA CAA AAG G 19
13 SRCRSP5 GGA CTC TAC CAA CTG AGC TAC AAG 24 56 126-158 NED
GTT TCT TTG AAA TGA AGC TAA AGC AAT GC 29
14 SRCRSP9 AGA GGA TCT GGA AAT GGA ATC 21 55 99-135 6FAM
GCA CTC TTT TCA GCC CTA ATG 21
15 MCM140 GTT CGT ACT TCT GGG TAC TGG TCT C 25 60 167-193 NED
GTC CAT GGA TTT GCA GAG TCA G 22
Agaviezor et al. Journal of Animal Science and Biotechnology 2012, 3:38 Page 14 of 16http://www.jasbsci.com/content/3/1/38
2.0 μl of each primer, and 16 μl nuclease free water in aAccuPower TLA PCR Premix containing NTPs, MgCl2and Taq DNA polymerase (Bioneer Corp., Irvine, CA,USA) using annealing temperatures shown in Table 13.PCR protocol was as follows: denaturing at 94°C for5 minutes, 35 cycles of amplification at 94°C for 30 sec-onds, annealing at annealing temperature of marker for30 seconds, extension at 72°C for 1 minute, final extensionat 72°C for 5 minutes and held at 4°C until analysis. PCRproducts were separated by electrophoresis in 1.5% agar-ose gel stained with 0.5 μg/ml ethidium bromide. Electro-phoresis was carried out at room temperature for 1 hourat 100 volts using a Bio-Rad Power Pac™ electrophoresisapparatus (Biorad, Hercules, CA, USA). The resultingamplified bands were visualized with UV light and photo-graphed using the Alphalmager™ 2200 gel documentationand analysis system (Cell Biosciences, CA, USA), and were
scored using GENEMate Quanti-Marker 100 bp DNA lad-der (BioExpress, Kaysville, UT, USA).DNA fragment analysis of microsatellite markers was
carried out using the Applied BioSystems 3730xl DNAAnalyzer (Applied Biosystems, Carlsbad, CA, USA) atthe Cornell University Genomics Core Facility. Gene-Mapper Software version 3.0 [52] (which combines thefunctions of GeneScan and Genotyper software in oneconvenient package) was used to generate microsatellitegenotypes.
Data analysisMeans, standard deviations, standard errors and coeffi-cients of variation were computed for all the traits mea-sured using the GLM procedure of SAS statisticalpackage [53]. Sources of variation in the linear modelwere breed, sex and system of management. Multivariate

Agaviezor et al. Journal of Animal Science and Biotechnology 2012, 3:38 Page 15 of 16http://www.jasbsci.com/content/3/1/38
analysis [discriminant analysis] was employed to investi-gate morphological structure, and quantify differencesamong the sheep populations. Stepwise discriminantanalysis was performed to gain information about themost important traits in separating the four sheepbreeds using the STEPDISC procedure. These most im-portant variables were then subjected to canonical dis-criminant analysis using the CANDISC procedure toderive canonical functions and estimate Mahalanobisdistances necessary for the differentiation of the sheeppopulations. The ability of these canonical functions toallocate individual sheep to its original breed was calcu-lated as percentage correct assignment of each breedusing the DISCRIM procedure (Nearest Neighbour Dis-criminant Analysis with Mahalanobis Distances) of theSAS statistical package. Microsatellite Analyzer (MSA)version 4.05 [54] and GENEPOP [55] were used to gen-erate genetic diversity parameters.A model-based Bayesian clustering analysis was used
to infer population structure and the level of admixturein the sheep breeds implemented in STRUCTURE v2.3[56]. The STRUCTURE algorithm assumes K popula-tions, each of which is in Hardy-Weinberg and linkageequilibria and characterized by a set of allele frequenciesat each locus. Analysis was performed with a burn inlength of 20,000 followed by 100,000 Markov chainMonte Carlo iterations for each of K = 1 to 6, with tenreplicate runs for each K using independent allele fre-quencies and an admixture model. Results across tenruns at each K were compared based on similarity coeffi-cients (SC) as previously described [57]. The breeds wereassigned to wide clusters based on major ancestry andsubmitted to a second round of STRUCTURE analysisperformed within each wide cluster.
AbbreviationsBL: Body length; BW: Body weight; CD: Chest depth; CG: Chest girth; EL: Earlength; FCL: Fore cannon bone length; HW: Height at withers; RH: Rumpheight; RW: Rump width; TL: Tail length.
Competing interestsThe authors declare that they have no competing interests.
Authors’ contributionsIGI and BOA conceived the study; BOA, IGI, OAA, MOO, CONI designed thestudy; IGI and MO obtained funding for the study; BOA, MAA, AY, MW, TMS,OOA, BMI, SAA, GOO and JOE collected phenotypic data and contributed tomorphological data analysis; BOA, AY, and OOA carried out morphologicaldata analysis; BOA, MAA and MD carried out the molecular lab analysis; BOA,MAA, SOP, MD, KK and IGI carried out the molecular data analysis andinterpretation, BOA, MAA, IGI, MO, AY and SOP wrote the manuscript. Allauthors read and approved the manuscript.
AcknowledgementsThis study was supported by the College of Agriculture and Life Sciences,Cornell University, Ithaca, NY. USA. Additional support from the United StatesAgency for International Development (USAID) through the award of theNorman Borlaug Leadership Enhancement in Agriculture Program (LEAP)Fellowship to Moses Okpeku and as well as a research grant fromInternational Foundation for Science, Stockholm to Moses Okpeku are
gratefully acknowledged. Special thanks to Dr. W. Ron Butler for theopportunity given to Brilliant O. Agaviezor, Mufliat A. Adefenwa andAbdulmojeed Yakubu as visiting graduate students at Cornell University.
Author details1Department of Animal Breeding and Genetics, University of Agriculture,Abeokuta, Nigeria. 2Department of Animal Science and Fisheries, Universityof Port Harcourt, Port Harcourt, Nigeria. 3Dept of Animal Science, CornellUniversity, Ithaca, NY 14853, USA. 4Dept of Animal Science, Berry College,Mount Berry, GA 30149, USA. 5Department of Cell Biology and Genetics,University of Lagos, Lagos, Nigeria. 6Department of Animal Science, NasarawaState University, Keffi, Shabu-Lafia Campus, Lafia, Nigeria. 7Dept of LivestockProduction, Niger Delta University, Amasomma, Bayelsa State, Nigeria.8Department of Animal Science, Adnan Menderes University, Aydin 09100,Turkey.
Received: 30 December 2011 Accepted: 1 November 2012Published: 24 November 2012
References1. FAOSTAT: Food and Agriculture Organization of the United Nations. FAOSTAT
Database on Agriculture. Rome, Italy: 2011 [http://faostat.fao.org/default.aspx.]2. Yakubu A, Ibrahim IA: Multivariate analysis of morphostructural
characteristics in Nigerian indigenous sheep. Ital J Anim Sci 2011,10:17.
3. FAO: The State of Food and Agriculture, Livestock in the Balance. Rome:2010:176.
4. Taberlet P, Coissac E, Pansu J, Pompanon F: Conservation genetics ofcattle, sheep, and goats. C R Biol 2011, 334:247–254.
5. Gizaw S, van Arendonk JAM, Komen H, Windig JJ, Hanotte O: Populationstructure, genetic variation and morphological diversity in indigenoussheep of Ethiopia. Anim Genet 2007, 38:621–628.
6. Carneiro H, Louvandini H, Paiva SR, Macedo F, Mernies B, McManus C:Morphological characterization of sheep breeds in Brazil. Uruguay andColombia. Small Rum Res 2010, 94:58–65.
7. Peter C, Bruford M, Perez T, Dalamitra S, Hewitt G, Erhardt G: Geneticdiversity and subdivision of 57 European and Middle-Eastern sheepbreeds. Anim Genet 2007, 38:37–44.
8. Cinkulov M, Popovski Z, Porcu K, Tanaskovska B, Hodzic A, Bytyqi H,Mehmeti H, Margeta V, Djedovic R, Hoda A, Trailovic R, Brka M, Markovic B,Vazic B, Vegara M, Oslaker I, Kantanen J: Genetic diversity and structure ofthe West Balkan pramenka sheep types as revealed by microsatelliteand mitochondrial DNA analysis. J Anim Breed Genet 2008, 125:417–426.
9. D’Angelo CS, Gajecka M, Kim CA, Gentles AJ, Glotzbach CD, Shaffer LG,Koiffmann CP: Further delineation of nonhomologous-basedrecombination and evidence for subtelomeric segmental duplications in1p36 rearrangements. Hum Genet 2009, 125:551–563.
10. Arora RJ, Bhatia SB, Mishra P, Jain A, Prakash B: Diversity analysis of sheepbreeds from Southern peninsular and Eastern regions of India. Trop AnimHealth Prod 2010, 43:401–408.
11. Arora R, Bhatia S, Mishra BP, Joshi BK: Population structure in Indian sheepascertained using microsatellite information. Anim Genet 2011, 42:242–250.
12. Niu BF, Fu LM, Sun SL, Li WZ: Artificial and natural duplicates inpyrosequencing reads of metagenomic data. BMC Bioinform 2010, 11:187.
13. Paiva SR, Mariante AD, Blackburn HD: Combining US and Brazilianmicrosatellite data for a meta-analysis of sheep (Ovis aries) breeddiversity: facilitating the FAO global plan of action for conserving animalgenetic resources. J Hered 2011, 102:697–704.
14. Riva J, Rizzi R, Marelli S, Cavalchini LG: Body measurements in Bergamascasheep. Small Rum Res 2004, 55:221–227.
15. Cervantes I, Baumung R, Molina A, Druml T, Gutierrez JP, Solkner J, Valera M:Size and shape analysis of morphofunctional traits in the Spanish Arabhorse. Livestock Sci 2009, 125:43–49.
16. Dossa LH, Wollny C, Gauly M: Spatial variation in goat populations fromBenin as revealed by multivariate analysis of morphological traits.Small Rum Res 2007, 73:150–159.
17. Zahedi-Zahra, Esmaeelkhanian S, Torshizi RV: Microsatellite variation of onebreed of Iranian sheep with 12 markers. Pak J Biol Sci 2007, 10:4455–4460.
18. Kumar D, Sharma R, Pandey AK, Gour DS, Malik G, Ahlawat SPS, Jain A:Genetic diversity and bottleneck analysis of Indian Bellary sheep bymicrosatellite markers. Russ J Genet 2006, 43:996–1005.

Agaviezor et al. Journal of Animal Science and Biotechnology 2012, 3:38 Page 16 of 16http://www.jasbsci.com/content/3/1/38
19. Adebambo OA, Williams JL, Blott S, Urquhart B: Genetic relationshipsbetween native sheep breeds in Nigeria based on microsatellite DNApolymorphisms. Anim Genet Res Inform Bull 2004, 34:27–39.
20. Agaviezor BO, Adefenwa MA, Peters SO, Yakubu A, Adebambo AO, OzojeMO, Ikeobi CON, Ilori BM, Wheto M, Okpeku M, De Donato M, Imumorin IG:Mitochondrial D-loop genetic diversity of Nigerian indigenous sheep.Anim Genet Res 2012, 50:13–20.
21. Wilson AJ, Pemberton JM, Pilkington JG, Clutton Brock TH, Coltman DW,Kruuk LEB: Quantitative genetics of growth and cryptic evolution of bodysize in an island population. Evol Ecol 2007, 21:337–356.
22. Collyer ML, Adams DC: Analysis of 2 states multivariate phenotypicchange in ecological studies. Ecology 2007, 88:683–692.
23. Yakubu A, Salako AE, Imumorin IG, Ige AO, Akinyemi MO: Discriminantanalysis of morphometric differentiation in the West African Dwarf andRed Sokoto goats. South African J Anim Sci 2010, 40:381–387.
24. Yakubu A, Idahor KO, Haruna HS, Wheto M, Amusan S: Multivariate analysisof phenotypic differentiation in Bunaji and Sokoto Gudali cattle. ActaAgric Slov 2010, 96:75–80.
25. Ajayi OO, Yakubu A, Jayeola OO, Imumorin IG, Adeleke MA, Takeet MI, OzojeMO, Ikeobi CON, Peters SO: Multivariate analysis of sexual sizedimorphism in domestic turkeys (Meleagris gallopavo) in Nigeria.Trop Anim Hth Prod 2012, 44(5):1089–1095. doi:10.1007/s11250-011-0044-6.In press.
26. Vargas S, Larbi A, Sanchez M: Analysis of size and conformation of nativeCreole goat breeds and crossbreds used in smallholder agrosilvopastoralsystems in Puebla, Mexico. Trop Anim Hth Prod 2007, 39:279–286.
27. Sun W, Chang H, Ren ZJ, Yang ZP, Geng RQ, Tsunoda K: Multivariatestatistical analysis of morphological and ecological characters of somesheep populations in China. Sci Agric Sin 2004, 37:285–290.
28. Yakubu A, Akinyemi MO: An evaluation of sexual size dimorphism in Udasheep using multifactorial discriminant analysis. Acta Agric Scand Sect AAnim Sci 2010, 60:74–78.
29. Polak J, Frynta D: Patterns of sexual size dimorphism in cattle breedssupport Rensch’s rule. Evol Ecol 2010, 24:1255–1266.
30. Bacchi CS, Lanari MR, von Thungen J: Non-genetic factors affectingmorphometric and fleece traits in guanaco (Lama guanicoe guanicoe).Small Rum Res 2010, 88:54–61.
31. Felsenstein J: Has natural selection been refuted? The Arguments ofWilliam Dembski. Rep Na Center Sci Educ (RNCSE) 2007, 27:20–26.
32. Farid A, O’Reilly E, Dollard C, Kelsey CR: Genetic analysis of ten sheepbreeds using microsatellites. Canad J Anim Sc 2000, 80:9–17.
33. Dalvit C, Saccà E, Cassandro M, Gervaso M, Pastore E, Piasentier E: Geneticdiversity and variability in Alpine sheep breeds. Small Rum Res 2008,80:45–51.
34. Bataillon TM, David JL, Schoen DJ: Neutral genetic markers andconservation genetics: simulated germplasm collections. Genetics 1996,144:409–417.
35. Nei M, Maruyama T, Chakraborty R: The bottleneck effect and geneticvariability in populations. Evolution 1975, 29:1–10.
36. Petit RJ, El Mousadik A, Pons O: Identifying populations for conservationon the basis of genetic markers. Conserv Biol 1998, 12:844–855.
37. El Mousadik A, Petit RJ: High level of genetic differentiation for allelicrichness among populations of the argan tree [Argania spinosa (L)Skeels] endemic to Morocco. Theor Appl Genet 1996, 92:832–839.
38. Ryman N, Leimar O: GST is still a useful measure of genetic differentiation- a comment on Jost’s D. Molec Ecol 2009, 18:2084–2087.
39. Bozzi R, Degl’Innocenti P, Rivera-Diaz P, Nardi L, Crovetti A, Sargentini C,Giorgetti A: Genetic characterization and breed assignment in five Italiansheep breeds using microsatellite markers. Small Rum Res 2009,85:50–57.
40. Handley LL, Byrne K, Santucci F, Townsend S, Taylor M, Bruford MW, HewittGM: Genetic structure of European sheep breeds. Heredity 2007,99:620–631.
41. Krebs C: Ecological Methodology. New York: HarperCollins; 1989:1–5.42. Mukesh M, Sodhi M, Bhatia S: Microsatellite-based diversity analysis and
genetic relationship of three Indian sheep breeds. J Anim Breed Genet2006, 123:258–264.
43. Cañon J, Garcia D, Garcia-Atance MA, Obexer-Ruff G, Lenstra JA, Ajmone-Marsan P, Dunner S, ECONOGENE Consortium: Geographical partitioningof goat diversity in Europe and the Middle East. Anim Genet 2006,37:327–334.
44. Taberlet P, Valentini A, Rezaei HR, Naderi S, Pompanon F, Negrini R, Ajmone-Marsan P: Are cattle, sheep, and goats endangered species? Mol Ecol2008, 17:275–284.
45. Wiener G, Lee GJ, Wooliams JA: Consequences of inbreeding for financialreturns from sheep. Anim Prod 1994, 59:245–249.
46. Notter DR: The importance of genetic diversity in livestock populationsof the future. J Anim Sci 1999, 77:61–69.
47. Jia B, Chen J, Zhao RQ, Luo QJ, Yan GQ, Chen J: Microsatellite analysis ofgenetic diversity and phylogenetic relationship of eight sheep breeds inXinjiang. Yi Chuan Xue Ba 2003, 30:847–854.
48. Pedrosa S, Uzun M, Arranz JJ, Gutiérrez-Gil B, San Primitivo F, Bayón Y:Evidence of three maternal lineages in Near Eastern sheep supportingmultiple domestication events. Proc R Soc Lond 2007,272:2211–2217.
49. Ndumu DB, Baumung R, Hanotte O, Wurzinger M, Okeyo MA, Jianlin H,Kibogo H, Solkner J: Genetic and morphological characterization of theAnkole Longhorn cattle in the African Great Lakes regions. Genet Sel Evol2008, 40:467–490.
50. Wilson RT, Durkin JW: Age at permanent incisor eruption in indigenousgoats and sheep in semi-arid Africa. Livest Prod Sci 1984,11:451–455.
51. FAO: Molecular genetic characterization of animal genetic resources.FAO animal production and health guidelines. Rome. 2011, 9:65–84.
52. Genemapper Software Version 3.0. Applied Biosystems. Carlsbad, CA, USA:http://mvz.berkeley.edu/egl/resources/manuals/GeneMapper.
53. SAS: Statistical Analysis System User’s Guide, Statistic. NC 27513, USA: SASInstitute Inc. Cary; 2010.
54. Dieringer D, Schlotterer C: Microsatellite Analyser (MSA): a platformindependent analysis tool for large microsatellite data sets. Molec EcolNotes 2003, 3:167–169.
55. Raymond M, Rousset F: Genepop (Version 1.2): population geneticssoftware for exact tests and ecumenicism. J Hered 1995, 86:248–249.
56. Pritchard JK, Stephens M, Donnelly P: Inference of population structureusing multilocus genotype data. Genetics 2000, 155:945–959.
57. Rosenberg NA, Pritchard JK, Weber JL, et al: Genetic structure of humanpopulations. Science 2002, 298:2381–2385.
doi:10.1186/2049-1891-3-38Cite this article as: Agaviezor et al.: Morphological and microsatelliteDNA diversity of Nigerian indigenous sheep. Journal of Animal Scienceand Biotechnology 2012 3:38.
Submit your next manuscript to BioMed Centraland take full advantage of:
• Convenient online submission
• Thorough peer review
• No space constraints or color figure charges
• Immediate publication on acceptance
• Inclusion in PubMed, CAS, Scopus and Google Scholar
• Research which is freely available for redistribution
Submit your manuscript at www.biomedcentral.com/submit