mortality from nestlé’s marketing of infant formula in low ...mar 21, 2018 · mortality from...
TRANSCRIPT

Mortality from Nestlé’s Marketing of Infant Formula in Low and Middle-Income Countries
JesseAnttila-HughesLiaC.H.FernaldPaulJ.GertlerPatrickKrause
BruceWydick
March21,2018Abstract. Intensive and controversial marketing of infant formula is believed to beresponsibleformillionsofinfantdeathsinlowandmiddle-incomecountries(LMICs),yettodatetherehavebeennorigorousanalysesthatquantifytheseeffects. Toestimatetheimpactofinfantformulaoninfantmortality,wepaircountry-specificdatafromtheannualcorporatereportsofNestlé, the largestproducerof infant formula,withasampleof2.48million births in 46 LMICs from 1970-2011. Our key finding is that the availability offormula increased infant mortality by 9.4 per 1000 births, 95%CI [3.6, 15.6] amongmotherswithoutaccesstocleanwater,suggestingthatuncleanwateractedasavectorforthetransmissionofwater-bornepathogenstoinfants.WeestimatethattheavailabilityofformulainLIMCsresultedinapproximately66,000infantdeathsin1981atthepeakoftheinfantformulacontroversy.Acknowledgments:WethankClaireBoone,IngvildMadsen-LampeandCarolSpectorforoutstanding research assistance, and JereBehrman,MelissaBinder, Kitt Carpenter, JanetCurrie,AndrewDustan,BrianFikkert,RussellMask, TedMiguel,NigelRollins,KiraVilla,and TomVogl aswell as seminar participants at UC Berkeley, UCDavis, USF, Princeton,Vanderbilt, Notre Dame, Covenant College, New Mexico, Minnesota, and the 2017InternationalEconomicAssociationMeetingsinMexicoCity.Theauthorshavenofinancialormaterialinterestsintheresultsdiscussedinthispaper.Affiliations: Anttila-Hughes, University of San Francisco; [email protected];Fernald, University of California, Berkeley; [email protected]; Gertler, University ofCalifornia,BerkeleyandNBER;[email protected];Krause,ProtagonistTechnology,SanFrancisco,California;[email protected];Wydick,UniversityofSanFranciscoandCEGA;[email protected]

1
1. Introduction
There is strong scientific consensus that breastfeeding is optimal for child health
anddevelopment(1-3). TheWorldHealthOrganization(WHO)recommendsthat infants
arebreastfedwithinanhourbirth,exclusivelybreastfedforthefirst4-6monthsoflife,and
then continue to receive breastmilk for up to two years (4). A recent meta-analysis
presentedevidenceontheimportanceofbreastfeedingforchildsurvivalduetotheunique
biological contributionofbreastmilk to thechild’s immuneresponse (5).Theriskofall-
causemortalityissubstantiallylowerinchildrenwhoareexclusivelybreastfedforthefirst
5monthsoftheirliveswhencomparedwithchildrenwhoareeitherpartiallybreastfedor
not breastfed at all, receiving breastmilk substitutes instead (e.g. infant formula) (6).
Childrenwhoreceivebreastmilkinsteadofabreastmilksubstitutesbenefit fromreduced
severityofdiarrhealdiseaseand respiratory infections (7),benefits in cognitive function
(5), and longer-term benefits for cardiovascular health (8). In 2012, the estimated
aggregateeconomiclossfromshortenedbreastfeedingwas$302billion,andthat820,000
infantlivesperyearcouldbesavedifbreastfeedingwereincreasedtonearuniversallevels
(9).
Despite the scientifically supported benefits of breastfeeding, the use of infant
formula as an alternative to breast milk remains widespread (10). Less than half of
newbornsworldwidearebreastfedwithinanhourofbirth,andonly43%areexclusively
breastfedfrombirthto6months(11).Therearemanyreasonscitedforwhyamothermay
choosetouseinfantformulaoverbreastfeeding,includinginsufficientortheperceptionof
insufficientbreastmilk,lackofabilitytopumpbreastmilkatwork,lackoffamilysupport,
depression,poverty,andothersocio-culturalfactors(12-14).
Akeyfactorcontributingtolowratesofbreastfeedinghasbeentheprivatesector
development andmarketing of infant formula (15). Globally, the sales of infant formula
totaledUS$44.8billionin2016,andareexpectedtorisetoUS$70.6billionby2019(16).In
the earlypart of the20th century, companies in theUnitedStates andEuropedeveloped
commercialbreastmilk substitutes,partly in response todemand fromwomenwhohad
difficultybreastfeeding.Theuseofinfantformularosesteadilyintheindustrializedworld
withpostWorldWarIIbabyboombreastfeedingratesdroppingbyhalffromearlierinthe
2
century(17).FormulasalesintheUnitedStatespeakedinthe1950sandbegantorecedein
the 1960s due both to lower birth rates andmothers returning to breastfeeding. Infant
formulacompaniesthenlookedtonewmarketsinthedevelopingworldtomakeupfalling
revenues, raising widespread alarm among public health and humanitarian advocacy
groups.
Thebeginningofthepubliccontroversyoverinfantformulamarketingpracticesin
thedevelopingworldbeganinAugust1973whenanarticle,TheBabyKiller,waspublished
intheNewIndustrialist.Thearticlestressedthenutritional inadequacyof infant formula
relativetobreastmilk(18),andprovidedexamplesofspecificmarketingabusesbyNestlé,
the first major formula manufacturer to enter LMICs (19) and the largest supplier
worldwide(20).Atthesametime,publichealthresearchersdocumentedalargedeclinein
breast-feeding contemporaneous with the introduction of infant formula (Figure1), and
published estimates of infant deaths resulting from theNestlé-led introduction of infant
formula intoLMICs ranging fromannual figuresof1million to10million (21,22). The
article and research became catalysts for activism against the infant formula industry,
which ultimately led to an international boycott ofNestlé products starting in 1977 and
public hearings on theNestlé controversy in the U.S. Senate chaired by Senator Edward
KennedyinMay1978(17).
In response, the World Health Organization and UNICEF organized a meeting of
stakeholdersoutofwhich the InternationalCodeofMarketingofBreast-milkSubstitutes
wascreatedand laterenacted in1981(23). Nestlé, facedwiththeboycott, lawsuits,and
increasingpublicpressure, eventuallyagreed toalter itsmarketingpractices toabideby
theCodein1984.However,in1988theInternationalBabyFoodActionNetworkcalledfor
a reinstatement of the boycott after evidencewas produced thatNestlé had returned to
unethicalmarketingpractices(24-26).
Nestlé was accused of providing health clinics with free or low-cost supplies of
infantformula,oftendispensedby“milknurses”(saleswomendressedinnursesuniforms),
toencouragenewmothersintheuseofinfantformula(24-26).Thispracticeisparticularly
egregiousbecauseformulauseamongneonatesincreasestheriskthatmothersreleasethe
prolactin-inhibiting factor, which signals their milk production to shut down, thereby

3
creating a future dependence on breast milk substitutes (27). In addition, critics were
concernedthatNestlé’smarketingincludedpromotingformulatomothersunlikelytohave
access to cleanwater and likely to possess limited technical understanding of nutrition,
physiology, or disease mechanisms due to relatively little formal education (19).
Inappropriatelypreparedformula(e.g.mixedwithuncleanwater,ormixedwithtoomuch
water),canincreasetheriskofinfantmortalityduetotheincreasedlikelihoodofdiarrhea
andotherintestinalinfections(28).
Inthispaperwepresent,toourknowledge,thefirstcausalestimatesoftheeffecton
infantmortality of Nestlé’s entrance into LIMC formulamarkets for the both population
overall, and for vulnerable subpopulations believed to be most at risk. Nestlé’s phased
geographic entry into national infant formula markets over time in LMICs provides
plausiblyexogenousvariationinthemarketavailabilityofformulaconditionalonlocation
fixed effects.Weexploit this variation to identify the causal effect of formula availability
using difference-in-differences and event-history models. We estimate these models by
combining data on the timing of formula imports provided in Nestlé’s own annual
corporatereportwithdataoninfantmortalityfrom2.48millionindividualbirthrecordsin
48countries for1970 through2011collected inDemographicandHealthSurveys(DHS)
(29).
2. Data
InfantFormulaAvailability:SinceNestléwas the firstmajor formulamanufacturer
toenterLMICs(19)andthelargestsupplierbyfarworldwide(20),weproxyinfantformula
beingavailableinacountrybywhetherNestléwasactivelymarketingandsellingformula
inthatcountry.AnnualdataonthecountrieswhereNestlésellsinfantformulaarefoundin
Nestlé’s1966to2014corporateannualreports,intheManufacturingandSaleofProducts
section describing internationalmarket activity (SupplementaryMaterials Figure A).We
excludesixcountrieswheretherewasalreadylocalproductionofformulabefore1966.
InfantMortality:WemergedNestlé’sinformationoninfantformulaavailabilityina
country with individual infant birth and mortality records from the Demographic and
HealthSurveys(DHS),asetofnationallyandregionallyrepresentativesurveysofwomen

4
between the ages of 15 and 49, covering a large sample of low and middle-income
countries.WeidentifiedallDHScountriesforwhichNestlébegansellingformulabetween
1966and2014,creatingasampleofallchildrenbornwithinthe+/-5yearssurrounding
the year formula imports began, and added control countries from the same geographic
regionaseachtreatmentcountry,leavinguswithasampleofthe18treatedcountriesand
28 control countries, for a total sample of 2,478,842 children in 46 countries as seen in
Table1.
TheDHSsurveyincludesrecalldataforallchildrenincludingdateofbirth,andage
at death if the child died, allowing us to construct location and year-specific infant-level
mortalitydataset.Wedesignateanydeathofachildage12monthsoryoungeras infant
mortalityandrescale thevariable todeathsper thousandsoas toyield rate-comparable
estimates(indeathsper1000livebirths)forpopulationprevalence.
MaternalandHouseholdCharacteristics:Weuseseveralothervariablesof interest
takenat timeof survey includingchildren'sbasicdemographic characteristics (sex,birth
order, date of birth), and mother's and household’s characteristics (education, type of
wateraccess, assetquartilemeasureofwealth,and location). Weuse two indicators for
broadly comparable measures of socio-economic status: a variable indicating that the
mother has completed less than primary education, and a variable indicating that a
household is below the countrymedian in theDHS’s asset index to proxy for household
wealth.
Appropriate preparation of powdered infant formula requires combining the
powderwithcleandrinkingwater;safewater iscritically importantherebecausemixing
infant formulawithuncleanwaterpresentsa severehealthrisk tonewborn infants. We
measure amother’s inability to access cleanwater using theDHSwater source variable
thatindicatesthewatersourcemostcommonlyusedbythehousehold.Surfacewater,the
lowest-qualitywater source in the DHS, is thewater source associatedwith the highest
levels of infant mortality regardless of infant formula use (30). In our sample, surface
waterisusedby15.4%ofhouseholds.

5
An indicator of surface water as the household’s primary water serves as our
measure of poor water quality. We assume that any woman currently using unsanitary
waterwaslikelytobedoingsointhepast.However,thereissomemeasurementerrorin
this variable as the steady decrease in unsanitary water use globally over this period
impliesthattherearelikelytobeobservationsthathadunsanitarywaterinthepastbutdo
not today. Improvements inwater quality access in LMICs that have occurred since the
birth of children in the dataset would likely attenuate our estimates of the impact on
mortalityforthesampledesignatedtouseunsafewater,implyingthatourestimateswould
belowerboundeffects.
MacroeconomicData:TocontrolforthepossibilitythatthetimingofNestléimports
andchoiceofcountrieswereendogenouslyrelatedtoeconomicconditionsthatcouldalso
affect infant mortality, we include a set of country-level macroeconomic controls for
economic growth and foreign investment. Data on Gross Domestic Product (GDP) per
capitaandForeignDirectInvestment(FDI)weretakenfromtheWorldBankDevelopment
Indicators.
3. IdentificationandEstimation
Nestlé’sphasedentryovertimeintonationalinfantformulamarketsprovides
plausiblyexogenousvariationinthemarketavailabilityofformulaconditionalonlocation
fixedeffects.Weexploitthisvariationtoidentifythecausaleffectofformulaavailabilityby
estimatingdifference-in-differencesmodelswithlocationandyearfixedeffects.We
interprettheresultsasIntent-to-Treat(ITT)estimatesthatcapturetheaveragemortality
responsetotheavailabilityofinfantformulaforpurchaseproxiedbywhetherNestléis
activelysellingformulainthecountry.Ourestimatedtreatmenteffectsrepresentthe
intersectionofadoptionofinfantformulabymotherswithintheexposedpopulationand
theimpactsoninfantsfromconsumingtheformula.Theimpactoninfantmortalitywill
alsovarydependingonwhetherformulaiscombinedwithcleanwaterandwhetherit
substitutesforbreastmilkorforsomeinferiornutritionalsupplementationsuchaswater,
dilutedcondensedmilk,juice,ricewater,orotherlow-qualitysubstitute.

6
Specifically,weestimatethefollowingdifference-in-differencesmodelusingalinear
probabilityspecification:
𝑚!"#$% = 𝛽𝑁!" + 𝛼! + 𝛾! + 𝜆!" + 𝜑! + 𝝁!𝒁𝒋 +𝝓′𝑪𝒄𝒕 + 𝜖!"#$% , (1)
where𝑚!"#$%isanindicatorvariableequalto1000ifchildidiedduringorpriorto
hisorher12thmonthoflifetoamotherinDHSregionk,incountryc,andinyeart jand
equalszeroisthechildlivedthroughits12thmonthoflife,;βisthetreatmenteffectandis
thecoefficienton𝑁!" ,whichindicateswhetherthechild iwasborninperiodafterNestlé
begansellingformulaincountryc;𝛼! representsaregionalfixedeffect;𝛾!isafixedeffect
foryearofthechild'sbirth;𝜆!" isavectorofcountry×birth-monthfixedeffectstocontrol
forcountry-levelseasonalityinmortality; 𝜑! isagender×birthorderfixedeffectforchildi;
𝒁𝒋 isavectorofmotherandhousehold-levelcharacteristicsthatincludehouseholdwater
access,mother’seducation,andwhetherthehouseholdisinthelowestwealthquartilein
the country;𝑪𝒄𝒕 is a vectorofmacroeconomic controls that includesGDPper capita and
ForeignDirectInvestmentincountrycinyeart,and𝜖!"#$%istheerrorterm.Weclusterthe
standarderrorsatthelevelofthefirst-levelDHSadministrativeunit,andweightthedata
usingtheDHSsurveyweights.
Wetestwhetherthetreatmenteffectsaredifferentforhouseholdsthatusesurface
waterversuscleansourcesofwater,loweducatedmothersversushigheducatedmothers,
and poor households versus non-poor households. Specifically, we estimate versions of
equation (1) with interactions of β𝑁!" with indictors separately for surface water, low
education,andpoverty.
Finally,weestimatean“eventstudy”versionof thedifference-in-differencemodel
that allows the treatment effects to vary in the years prior to and following formula
introduction.Specifically,
𝑚!"#$% = 𝛼! + 𝛾! + 𝜆!" + 𝜑! + 𝝁!𝒁𝒋 +𝝓!𝑪𝒄𝒕 + 𝜏!!!!!!!!! 𝑇!" + 𝜖!"#$% , (2)
where coefficients in (2) are as in (1) except that 𝜏! is a set of 2m+ 1 coefficients that
represent a child’s birth in different years within the event window surrounding the
introductionofinfantformulawithinacountry.Weuseaneventwindowin(2)thatranges

7
fromfiveyearsbefore(T=-5)tofiveyearsafter(T=+5)Nestlébegansellingformula.The
event-study estimations allow us to examine pre-treatment trends before formula
introductionandwhether introductionof formulacreatesabreak in thesepre-treatment
trends.
4. Results
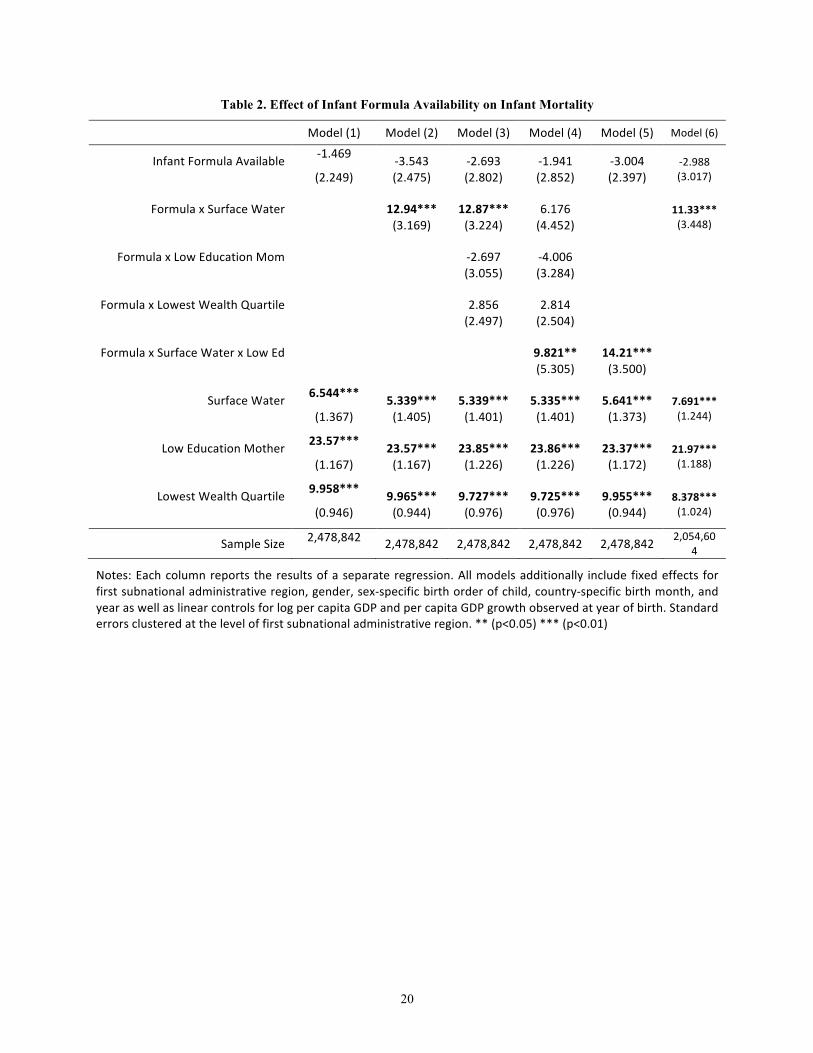
Table2reportsestimatesoftheaveragetreatmenteffectsforthemortalityeffectof
formula from our difference-in-differencesmodels. First, we note that drinking surface
water,havinglowmaternaleducation,andbeinginabelowmedianpovertyhouseholdall
significantlypredictincreasedmortalityinallmodelspecifications.Ourestimatesindicate
thatachildbornintoahouseholdinthebottomquartileofincomethatusessurfacewater
as itsmajorsourceofdrinkingwater,wherethemotherhas less thanprimaryeducation
andlivesinpovertyhasa40.1per1000livebirthshigherprobabilityofinfantmortality,or
55%higherthanthemeanmortalityrateofthesample.
Theintroductionofinfantformulashowsnostatisticallysignificantaverageimpact
oninfantmortalityforthepopulationasawhole(Table2,Model1).However,ourresults
showlargeandsignificantinfantmortalitydeathsfromformulaintroductionconcentrated
in vulnerable sub-populations. Specifically, infant formula availability had a significantly
negativeeffectonmortalityofinfantsborninhouseholdsthatusedsurfacewater(Table2,
Model 2). The availability of formula increased infant mortality by 12.9 per 1000 for
householdsthatusedsurfacewaterrelativetohigher-qualitywaterusinghouseholds.The
net effect of formula availability is an increase of 9.4 infant deaths per 1000 among
motherswithpoor-qualitywater.
Wetestwhetherexposuretosurfacewater isaproxyforsocioeconomicstatusby
addinginteractionsofformulaavailabilitywithindicatorsforbothlowmaternaleducation
and below-median asset poverty (model 3). We find that the estimate is practically
unchanged, and thatmother’s education andwealth are insignificant. Thus, our results
indicate it isthecombinationof infant formulaavailabilityandlackofcleanwateraccess
ratherthanpovertythatdrivesourresults.

8
Althoughthecombinationof formula introductionandwomen’seducation itself is
insignificant,weinvestigatewhetheruneducatedmotherswithoutcleanwateraccesswere
more likelyuse infant formula inwaysthatput infant livesatrisk, followingreportsthat
less-educatedmothersdidnotknowthatthesurfacewatermixedwiththeformulaneeded
to be boiled or purified in some other way (19). We investigate this using a triple
interactionof formulaavailabilitywithsurfacewaterand lowmother’seducation(model
4) and indeed find that the elevated infant mortality from formula introduction is
concentrated among low-literacymothers in surface-water using households. Estimating
the effect of formula availability on just that group (model 5) confirms this result and
showsanevenstrongerdifferenceof14.2perthousandrelativetothehigh-qualitywater
counterfactualgroup.
Our event study estimates in Figure 2 show estimated differences in mortality
betweenthoseeventuallytreatedcountriesandthosenottreatedfortheyearsbeforeand
after formula imports began. We estimated themodel for infants born to two types of
mothers, those using surface water and those using non-surface (higher quality) water.
There are minimal and statistically insignificant differences in infant mortality for
treatmentandcontrolcountriesforsurfacewaterandnon-surfacewaterhouseholdsinthe
years prior to the introduction of infant formula, minimizing concerns over possibly
confoundingnon-parallelpre-trendsinthedifference-in-differencesestimatesreportedin
Table2.TheintroductionofNestléformula,however,generatesavisiblydistinctincrease
ininfantmortalityinsurface-waterhouseholdsrelativetohigh-qualitywaterhouseholds,
one that peaks three years after introduction, suggesting awave ofmortality coinciding
withincreasingmarketpenetration.
Finally,wetestforanyeffectofNestléagreeingtoabidebytheInternationalCodeof
MarketingofBreast-milkSubstitutesin1984. Model(6)reportstheresultsofrestricting
the sample to only children born after 1984, finding that the impact on infantmortality
fromthe introductionofNestlé formulapost-1984 forsurfacewaterhouseholdschanges
slightlyfrom9.40to8.34butremainshighandstatisticallysignificant(p<0.01),providing
noevidencethattheinternationalmarketingcodechangedmortalitydynamics.

9
5. Robustness
Table 3 shows four alternative specifications and robustness checks for ourmain
results.Model(1)reproducestheresultsfromourpreferredspecificationinmainresults
in Model (2) in Table 2 for comparison purposes. Model (2) replicates the same
specificationusingmother-level,insteadofregion-levelfixedeffects,allowingustobetter
control for maternal and family characteristics. Identification, however, relies on the
differential effect of formula on mortality across two or more children born within the
samefamilyoverthesampleperiod,implyingthatidentificationisdrivenbydifferencesin
older versus younger siblings and a reduced the sample size. The coefficient on formula
availability remains virtually unchanged, and the effect of formula among surfacewater
exposedinfantsdecreasesslightlyto8.9deathsper1000.
Wealsoestimatethesamespecificationsusingcountry-levelfixedeffectsinmodel
(3).Thecoefficientonformulaavailabilityremains insignificant,buttheeffectof formula
availabilityonsurfacewaterhouseholdsincreasesto14.15,oraneteffectofanincreasein
11.42infantdeathsper1000amongsurfacewaterhouseholds,indicatingaslightlygreater
impactthanourregional-fixedeffectestimations.
TheDHSdatareliesonmothers’recalltoanswerquestionsrelatedtoinfantbirths
anddeaths,whichmayaddnoise toourestimateand increasemeasurementerrorwhen
thewindowsurroundingtheintroductionofformulapredatesDHSsurveysbymanyyears.
In model (4) we limit the treatment sample to the subset of 11 countries that were
surveyed by DHSwithin fifteen years of the beginning of Nestlé sales. We see that the
resultsagainremainessentiallyunchanged.
6. Discussion
TheNestlécontroversy,oneofmostnotoriousallegationsofcorporatemalfeasance
inthemodernera,hasbeendrivenbyconcernsthatthecontroversialmarketingpractices
usedNestlétosell infant formula inLMICshada large impacton infantmortality. Inthis
research,wecombineinformationfromNestlé’sannualcorporatereportsoncountrylevel
activitywithinfantmortalityfrom2.48millionbirthsin46countriestoestimatetheeffect
of infantformulaavailabilityoninfantmortality.Althoughwefindinsignificanteffectson

10
infantmortality for the population as awhole, we find large and statistically significant
positive effects on infant mortality among households without access to clean water,
especiallyforinfantsofless-educatedmothers,corroboratingmanyoftheobservationsof
healthpractitionersmadeduringthepeakoftheinfantformulacontroversy.
Thestrengthsofourstudyincludethelargenumberofcountriesforwhichthereare
longitudinaldataavailable,theuseofcorporatedatatoidentifytheyearofNestlé’sentry
intoacountry,andaverylargesampleofbirthsoveralongtimeperiod.Otherstrengths
include our ability to exploit the phased entry into LIMCmarkets over time to identify
causaleffectsusingdifference-in-differencesmodels,confirmationofparallelpre-trendsin
theevent-history specifications, and the robustnessofourestimates toawidevarietyof
alternativespecifications.
There are also limitations. First,we use only data fromNestlé, and although the
companyhasthelargestmarketinfantformulashareinLMICs,wedonothavedatafrom
otherinfantformulamanufacturers.Second,wearelimitedtousinginfantmortalitydata
and do not have data on child morbidity; given the large effects of infant formula in
immune system function, we are missing the calculation of effects of infant formula
consumptionondiarrhea,respiratoryfunctioningandothertypesofinfantmorbidity.
HowmanyinfantdeathsresultedfromtheintroductionofNestléinfantformulato
mothers with poor access to clean water?We estimate the number of deaths for 1981,
arguablythepeakyearofthecontroversywhenmediaattentionwasthehighest. Wedo
thisbymultiplyingthe47.8million1981livebirthsthatoccurredinNestléformulasales
countriesbythefractionofthosehouseholdswithsurfacewaterinthosecountriesandby
ourestimateoftheimpactofformulaoninfantsfromhouseholdswithonlyuncleansurface
wateraccess,i.e.0.0094fromTable2.Thisyieldsanestimateof65,676infantdeathswith
a95%confidenceintervalof[24,868,106,485],lowerthanearlierestimatesofonemillion
ormore,butunquestionablyasubstantiallossofhumanlife.
Wecomparethemagnitudeoftheeffectoninfantmortalityduetoinfantformulato
the effect sizes of other factors impacting infant mortality in LMICs. Specifically, we
compareourresultstotheeffectsofhavinganuneducatedmother,lackingpost-natalcare,

11
experiencingalossof10%ofacountry’sGDP,lackingaccesstocleanwatergenerally,and
having no pre-natal care (Figure 3). Our estimated infant-mortality effects of formula
availability on surface-water-using households are on the same order of magnitude as
these other threats to infant life. For example, the introduction of infant formula to
mothers without access to clean water results in an increase in infant mortality that is
roughlysimilartoa lossin10%ofGDP,andsomewhatgreaterthantheeffectofunclean
wateritselfortheabsenceofprenatalcare.
Manyofthesedeathscouldhavebeenavoidedifmoremothershadbreastfed.There
are a number of effective antenatal and postnatal behavioral change interventions that
improve breastfeeding practices and thereby reduce infant formula use (35). Examples
includeeducationandcounselingduringtheprenatalperiodaswellashospitalandhome-
basedsupportinthepostpartumperiod(36,37),andeffectsofwhichcanbeenhancedby
including fathers (38). A very effectiveprogram is theBabyFriendlyHospital Initiative,
which bans promotion of bottle feeding infants post-partum and supports breastfeeding
immediatelyafterbirthandthroughoutthecrucialfirstfewdays(38).
Even with interventions that promote breastfeeding, some mothers will
undoubtedly choose to use formula. Onemessage that emerges from our analysis is the
critical importanceofmakingsurethatmotherswhochoosetouseformula,use itsafely.
Clearinstructionscomprehensibletomothersofalleducationlevelsneedtobeincludedin
marketingmaterials,and forhouseholds thatdonothaveaccess tocleanwater,chlorine
tabletscouldbeincludedinthepowderedformulaorthepre-mixingofformulawithclean
water.
Finally,infantmortalitymaybeavertedbyregulatingunethicalmarketingpractices.
The international community’s response to concerns over marketing was to create the
InternationalCodeofMarketingBreastmilkSubstitutes (ICMBS) (31),whichhas recently
been extended to include inappropriate marketing of all foods to infants and young
children(32).However,compliancewiththeICMBSisvoluntaryandviolationsofbanned
marketing practices continue. Despite consistently denying allegations of unethical
marketing(17),reportsofNestlébreachingtheseinternationalmarketingstandardshave
repeatedly surfaced. As recently as February 2018, TheGuardian reported that Nestlé

12
advertiseditsinfantformulaasaclosesubstituteforbreastmilkandusedsucroseininfant
formulainSouthAfricawhilemarketingitsinfantformulaas“sucrose-free.”(33).Aglobal
watch-dog group, “Breaking theRules, Stretching theRules 2017” documented over 800
violationsoftheICMBSby28formulacompaniesin79countriesbetween2014-2017(34).
The violations range from promotions claims thatmislead consumers, and surreptitious
methods to influencedoctorsandotherhealthprofessionals, suchas sponsoringmedical
conferencesandpartneringwithhealth-promotingNGOs.Tocombattheseabuses,WHO,
UNICEFandtheInternationalBabyFoodActionNetworkhavecalledforcountriestoenact
ICMBSlegislationwithstringentenforcementmechanismsandpenaltiesfornonadherence,
andtocloselymonitoradherence(16).
References:1. Z.A.Bhuttaetal.,Whatworks?Interventionsformaternalandchildundernutrition
andsurvival.Lancet371,417-440(2008).
2. P.R.Brittoetal.,Nurturingcare:promotingearlychildhooddevelopment.Lancet389,91-102(2017).
3. C.K.Lutter,R.Lutter,Fetalandearlychildhoodundernutrition,mortality,andlifelonghealth.Science337,1495-1499(2012).
4. WHO,Infantandyoungchildfeeding:Modelchapterfortextbooksformedicalstudentsandalliedhealthprofessionals.Available:http://www.who.int/maternal_child_adolescent/documents/9789241597494/en/,(2009).
5. C.G.Victoraetal.,Breastfeedinginthe21stcentury:epidemiology,mechanisms,andlifelongeffect.TheLancet387,475-490(2016).
6. M.J.Sankaretal.,Optimalbreastfeedingpracticesandinfantandchildmortality:asystematicreviewandmeta-analysis.ActaPaediatr104,3-13(2015).
7. WHO,Short-termeffectsofbreastfeeding:asystematicreviewonthebenefitsofbreastfeedingondiarrhoeaandpneumoniamortality.Availablehttp://www.who.int/maternal_child_adolescent/documents/breastfeeding_short_term_effects/en/,(2013).

13
8. WHO,Long-termeffectsofbreastfeeding:asystematicreview.Availablehttp://www.who.int/maternal_child_adolescent/documents/breastfeeding_long_term_effects/en/,(2013).
9. N.C.Rollinsetal.,Whyinvest,andwhatitwilltaketoimprovebreastfeedingpractices?TheLancet387,491-504(2016).
10. P.vanEsterik,Beyondthebreast-bottlecontroversy.(RutgersUniversityPress,NewBrunswick,NewJersey,1989).
11. UNICEF,StateoftheWorld'sChildren,http://www.unicef.org/sowc2016/(AccessedMay4,2017).(2017).
12. O.O.Balogun,A.Dagvadorj,K.M.Anigo,E.Ota,S.Sasaki,Factorsinfluencingbreastfeedingexclusivityduringthefirst6monthsoflifeindevelopingcountries:aquantitativeandqualitativesystematicreview.Maternal&childnutrition11,433-451(2015).
13. A.N.Bazzano,A.Kaji,E.Felker-Kantor,L.A.Bazzano,K.S.Potts,QualitativeStudiesofInfantandYoungChildFeedinginLower-IncomeCountries:ASystematicReviewandSynthesisofDietaryPatterns.NutrientsOct18;9,(2017).
14. A.Beasley,L.H.Amir,Infantfeeding,povertyandhumandevelopment.IntBreastfeedJ2,14(2007).
15. E.E.Stevens,T.E.Patrick,R.Pickler,Ahistoryofinfantfeeding.JPerinatEduc18,32-39(2009).
16. WHO/UNICEF/IBAN,Marketingofbreastmilksubstitutes:NationalimplementationoftheInternationalCode,StatusReport2016.Availableathttp://www.who.int/nutrition/publications/infantfeeding/code_report2016/en(2016).
17. S.P.Sethi,Multi-nationalcorporationsandtheimpactofpublicadvocacyoncorporatestrategy:Nestleandtheinfantformulacontroversy.,IssuesinBusinessEthics(KluwerAcademicPublishers,1994).
18. M.Muller,Thebabykiller:AWaronWantinvestigationintothepromotionandsaleofpowderedbabymilksintheThirdWorld.Availablehttp://media.waronwant.org/sites/default/files/THE%20BABY%20KILLER%201974.pdf?_ga=2.72225299.1032552843.1493930031-803636964.1493930031(AccessedMay4,2017).TheNewIndustrialist,(1974).
19. J.Dobbing,Ed.,Infantfeeding:Anatomyofacontroversy1973-1984,(Springer-Verlag,London,1988).
20. H.R.Fund,InfantFormula.Availablehttp://tippie.biz.uiowa.edu/henry/reports16/Infant_Nutrition.pdf(AccessedMay4,2017).
21. J.Clark,inChicagoTribune,Section1,p.6.4/25/1981.(1981).22. J.Grant,TheStateoftheWorld’sChildren.UnitedNationsChildren’sFund(UNICEF)
Oxford:OxfordUniversityPress.,(1982).
14
23. WHO,Internationalcodeofmarketingofbreast-milksubstitutes.Availableathttp://www.who.int/nutrition/publications/code_english.pdf(AccessedMay4,2017).(1981).
24. D.B.Jelliffe,AdvertisingandInfantFeeding.JournalofTropicalPediatrics.21,161-162(1975).
25. M.Gilly,J.Graham,MacromarketingTheoryandtheStudyoftheEffectsofPromotionontheConsumptionofInfantFormulainDevelopingCountries.JournalofMacromarketing26,131-142(2006).
26. J.E.Austin,StrategicManagementinDevelopingCountries..(SimonandSchuster,NewYork,2008).
27. M.Latham,InfantFeedingInNationalAndInternationalPerspective:AnExaminationOfTheDeclineInHumanLactation,AndTheModernCrisisInInfantAndYoungChildFeedingPractices.AnnalsoftheNewYorkAcademyofSciences,300,197-209(1977).
28. D.D.Marino,Waterandfoodsafetyinthedevelopingworld:globalimplicationsforhealthandnutritionofinfantsandyoungchildren.JAmDietAssoc107,1930-1934(2007).
29. DemographicandHealthSurveys.30. F.M.Ngureetal.,Water,sanitation,andhygiene(WASH),environmental
enteropathy,nutrition,andearlychilddevelopment:makingthelinks.AnnNYAcadSci1308,118-128(2014).
31. WHO,InternationalCodeofMarketingBreastmilkSubstitutes.Availableat:http://www.who.int/nutrition/publications/code_english.pdf.(1981).
32. WHO,Endinginappropriatepromotionoffoodsforinfantsandyoungchildren.Availableathttp://apps.who.int/gb/ebwha/pdf_files/WHA69/A69_R9-en.pdf?ua=1.(2016).
33. Nestléunderfireformarketingclaimsonbabymilkformulas.byArthurNelson.TheGuardian,2/1/2018.https://www.theguardian.com/business/2018/feb/01/nestle-under-fire-for-marketing-claims-on-baby-milk-formulas
34. C.Ching,Overview:BreakingtheRules,StretchingtheRules,2017.WorldNutrition8,(2017).
35. S.Haroon,J.K.Das,R.A.Salam,A.Imdad,Z.A.Bhutta,Breastfeedingpromotioninterventionsandbreastfeedingpractices:asystematicreview.BMCPublicHealth13Suppl3,S20(2013).
36. N.K.Wood,N.F.Woods,S.T.Blackburn,E.A.Sanders,InterventionsthatEnhanceBreastfeedingInitiation,Duration,andExclusivity:ASystematicReview.AmJMaternChildNurs.41(5),299-307(2016).
37. S.K.Kim,S.Park,J.Oh,J.Kim,S.Ahn,Interventionspromotingexclusivebreastfeedinguptosixmonthsafterbirth:Asystematicreviewandmeta-analysisofrandomizedcontrolledtrials.IntJNursStud80,94-105(2018).

15
38. M.Tokhietal.,Involvingmentoimprovematernalandnewbornhealth:Asystematicreviewoftheeffectivenessofinterventions.PLoSOne13,e0191620(2018).
39. R.Perez-Escamilla,J.L.Martinez,S.Segura-Perez,ImpactoftheBaby-friendlyHospitalInitiativeonbreastfeedingandchildhealthoutcomes:asystematicreview.MaternChildNutr12,402-417(2016).
40. M.Zhang,36thWorldHealthAssembly:VerbatimReconds.DocumentsWHA36/183REC/3..(WorldHealthOrganization,Geneva,1983).
41. A.Chetley,Thepoliticsofbabyfoods.Successfulchallengestoaninternationalmarketingstrategy.,(1986).
42. A.Berg,TheNutritionFactor.1stEd..(BrookingsInstitution,Washington,DC.,1973).
43. T.Greiner,CommercialInfantFoodsandMalnutritioninSt.Vincent.PresentedattheAmerAnthropologicalAssociation,WashingtonD.C.Nov18.1976.(1976).
44. WorldBank,WorldBankIndicators.EstimatesDevelopedbytheUNInter-agencyGroupforChildMortalityEstimation(UNICEF,WHO,WorldBank,UNDESAPopulationDivision)http://data.worldbank.org/indicator/SP.DYN.IMRT.IN?end=2005&start=2005&view=bar(2005).
45. R.Pena,S.Wall,L.A.Persson,Theeffectofpoverty,socialinequity,andmaternaleducationoninfantmortalityinNicaragua,1988-1993.AmJPublicHealth90,64-69(2000).
46. D.S.Manandharetal.,Effectofaparticipatoryinterventionwithwomen'sgroupsonbirthoutcomesinNepal:cluster-randomisedcontrolledtrial.Lancet364,970-979(2004).
47. L.Pritchet,L.Summers,WealthierisHealthier..JournalofHumanResources31,841-868(1996).
48. V.Srinivasanetal.,RandomizedcontrolledfieldtrialoftwoantenatalpackagesinruralsouthIndia..IndianJournalofMedicalResearch102,86–94(1995).

16
Figure 1: Breastfeeding rates before (blue) and after (grey) infant formula became available in
selected countries
a(27)b(40)c(41)d(27)e(42)f(43)g(41)

17
Figure 2: Event-History Estimates of the Effect of Infant Formula Availability on Infant Mortality
Notes: These figures plots the estimated differences and 95% C.I.s for infant mortality rates (×1,000) in surface and high-quality water treatment households relative to controls in the years before and after Nestlé starting marketing infant formula in treatment countries, as specified in equation (2). The estimates are normalized to 0 in the year prior to entry (t0 -1).

18
Figure3:ComparisonofEffectsofFactorsAffectingInfantMortality
aRegionlevelfixedeffectestimatepresentedinTable2.bRegion-levelfixedeffectestimatepresentedinTable2c(44)d(45)e(46)f(47)gRegion-levelfixed-effectestimatepresentedinColumn(1)ofTable2.h(48)
Note:Errorbarsrepresent95%confidenceintervalsexcept(b)whichgivesstandarddeviationof10-yearinfantmortalitydeclineacrosscountries.

19
Table1:DescriptiveStatistics
Region Country
FirstyearofNestlésales
N
InfantMortality
Rate(per1000births)
Householddrinkssurfacewater
Motherdidnotcompleteprimaryschool
PoorHH(lackingTV,radio,orelectricity)
Asia Bangladesh 1993 94,040 89.0 3.6% 74.2% 51.4%
Cambodia 1998 65,053 92.8 35.1% 71.5% 32.5%
Indonesia 1972 86,667 103.9 10.1% 58.3% 20.4%
Pakistan 1990 34,105 95.8 5.0% 80.6% 14.9%
SriLanka 1981 9,179 33.1 7.0% 32.1% 25.5%
Vietnam 1997 9,558 27.4 18.5% 26.3% 11.5%
Sub-Saharan Cameroon 1992 35,876 84.4 33.5% 51.3% 33.9%
Africa CongoDRC 2011 33,462 133.9 39.9% 91.7% 33.5%
Guinea 1993 8,645 103.2 34.5% 85.1% 55.8%
Madagascar 1972 19,765 131.4 2.77% 89.4% 23.1%
Senegal 1974 204 121.1 25.6% 50.3% 18.6%
Swaziland 1971 7,050 100.5 18.8% 63.4% 55.8%
Zambia 1969 20,961 79.1 15.0% 61.5% 10.5%
Americas Dom.Rep. 1971 3,891 116.4 0.0% 55.5% 9.8%
Ecuador 1970 119,228 78.6 0.1% 65.5% 4.0%
NorthAfrica Egypt 1988 55,718 25.1 4.7% 7.6% 2.4%
Jordan 1999 20,534 59.6 5.4% 85.8% 8.5%
Morocco 1992 94,040 89.0 3.6% 74.2% 51.4%
ControlCountries - 1,854,906 94.2 16.5% 64.5% 27.8%
FullSample 2,478,842 91.9 15.4% 64.1% 26.6%
Notes: This table reports the year Nestlé started selling infant formula by country and means values of key characteristics the DHS surveys in the year before entry for treatment countries and the average of sample years for the control countries. Means were computed using sample weights provided by the DHS. Control countries include Armenia, Azerbaijan, Burkina Faso, Cote d'Ivoire, El Salvador, Ethiopia, Gabon, Ghana, Guatemala, Kazakhstan, Liberia, Malawi, Maldives, Mali, Namibia, Nicaragua, Niger, Nigeria, Paraguay, Philippines, Rwanda, Tanzania, Thailand, Togo, and Yemen.
20
Table 2. Effect of Infant Formula Availability on Infant Mortality
Model(1) Model(2) Model(3) Model(4) Model(5) Model(6)
InfantFormulaAvailable -1.469 -3.543 -2.693 -1.941 -3.004 -2.988 (2.249) (2.475) (2.802) (2.852) (2.397) (3.017)
FormulaxSurfaceWater 12.94*** 12.87*** 6.176 11.33***
(3.169) (3.224) (4.452) (3.448)
FormulaxLowEducationMom -2.697 -4.006
(3.055) (3.284)
FormulaxLowestWealthQuartile 2.856 2.814
(2.497) (2.504)
FormulaxSurfaceWaterxLowEd 9.821** 14.21*** (5.305) (3.500)
SurfaceWater 6.544*** 5.339*** 5.339*** 5.335*** 5.641*** 7.691*** (1.367) (1.405) (1.401) (1.401) (1.373) (1.244)
LowEducationMother 23.57*** 23.57*** 23.85*** 23.86*** 23.37*** 21.97*** (1.167) (1.167) (1.226) (1.226) (1.172) (1.188)
LowestWealthQuartile 9.958*** 9.965*** 9.727*** 9.725*** 9.955*** 8.378*** (0.946) (0.944) (0.976) (0.976) (0.944) (1.024)
SampleSize 2,478,842 2,478,842 2,478,842 2,478,842 2,478,842 2,054,604
Notes:Eachcolumnreports theresultsofaseparateregression.Allmodelsadditionally include fixedeffects forfirstsubnationaladministrativeregion,gender,sex-specificbirthorderofchild,country-specificbirthmonth,andyearaswellaslinearcontrolsforlogpercapitaGDPandpercapitaGDPgrowthobservedatyearofbirth.Standarderrorsclusteredattheleveloffirstsubnationaladministrativeregion.**(p<0.05)***(p<0.01)

21
Table 3. Alternative Specifications and Robustness Checks
Table2Column(2)
Mother-LevelFixedEffects
Country-LevelFixedEffects
SampleLimitedto11ClosestRecall
(1) (2) (3) (4)
InfantFormulaAvailable-3.543 -3.524 -2.732 -4.635
(2.475) (2.786) (2.427) (2.798)
InfantFormulaxSurfaceWater12.94*** 8.939** 14.15*** 13.00***
(3.169) (4.193) (3.774) (3.425)
SurfaceWater5.339*** 3.931** 5.704***
(1.405) (1.538) (1.432)
LowEducationMother23.57*** 27.98*** 23.01***
(1.167) (1.472) (1.202)
LowestWealthQuartile 9.965*** 12.59*** 9.893*** (0.944) (1.148) (0.962)
SampleSize 2,478,843 2,271,037 2,478,843 2,344,061
Notes:Eachcolumnreportstheresultsforaseparateregression.Column(1)isthesameascolumn2from Table 2 for comparison purposes. Model (1) includes fixed effect for first subnationaladministrativeregion.Model(2)replacesthosewithmotherfixed-effectsandthereforthemaineffectof surfacewater, low education, andwealth are subsumed in the fixed effects. Model (3) replacesthose with country-level fixed effects. Model (4) estimates model (1) restricting treatment to thesampleofcountrieswithaDHSsurveyconductedwithin15yearsofNestleentry.Model(5)estimatesmodel (1) restricted to thesampleof countries forwhichNestleenteredafter1984pluscontrolsAllmodelsadditionallyincludefixedeffectsgender,sex-specificbirthorderofchild,country-specificbirthmonth,andyearaswellaslinearcontrolsforlogpercapitaGDPandpercapitaGDPgrowthobservedatyearofbirth.Standarderrorsclusteredattheleveloffirstsubnationaladministrativeregion.**(p<0.05)***(p<0.01).

22
SupplementalOnlineAppendix
Data Nestle participation in country infant formula markets are taken from a table listing import andproductionofdifferentcategoriesofNestléproductsacrossall countries inwhich thecompanyoperates,atablewhichhasstayedremarkablyconsistentoverthefivedecadesofdataweexamine(FigureA).Whilethissectionhashad slightlydifferent titles over time, the layout and structurehasbeen consistent throughout(SeeFiguresAbelow).We identify the specific category in eachyear inwhichbaby formula is reported, acategorywhichchangesovertimeandinsomecasesexplicitlyidentifiesinfantformulaandinothersgroupsit under “Milk-based Dietetic Products” and similar headings which we cross-reference from within thereports.WeareabletospecificallyidentifytheyearNestléinfantformulaimportsbeginbasedonthecodingofthereportsandtheyearinfantformulabeginstoappearasanimportintoagivencountry.
FigureA