mortality rate trends of australian fur seal pups
TRANSCRIPT

SIT Graduate Institute/SIT Study AbroadSIT Digital Collections
Independent Study Project (ISP) Collection SIT Study Abroad
Fall 2018
Mortality rate trends of Australian fur seal pups,Arctocephalus pusillus doriferus, and possiblefactors affecting pup mortality in the Bass Strait ofAustraliaTheresa WatersSIT Study Abroad
Follow this and additional works at: https://digitalcollections.sit.edu/isp_collection
Part of the Animal Sciences Commons, Biology Commons, and the Marine Biology Commons
This Unpublished Paper is brought to you for free and open access by the SIT Study Abroad at SIT Digital Collections. It has been accepted forinclusion in Independent Study Project (ISP) Collection by an authorized administrator of SIT Digital Collections. For more information, pleasecontact [email protected].
Recommended CitationWaters, Theresa, "Mortality rate trends of Australian fur seal pups, Arctocephalus pusillus doriferus, and possible factors affecting pupmortality in the Bass Strait of Australia" (2018). Independent Study Project (ISP) Collection. 2950.https://digitalcollections.sit.edu/isp_collection/2950

Mortality rate trends of Australian fur seal pups, Arctocephalus pusillus doriferus, and possible factors affecting pup mortality in the Bass Strait of Australia
© Duncan Sutherland
By Theresa Waters
Project Advisor: Rebecca McIntosh, Ph.D.
Phillip Island Nature Parks
Phillip Island, Victoria, Australia
Academic Director: Tony Cummings
Home Institution: Vassar College
Major: Biology
Submitted in partial fulfillment of the requirements for Australia: Rainforest, Reef, and Cultural Ecology, SIT Study Abroad, Fall 2018

2
ISP Ethics Review
(Note: Each AD must complete, sign, and submit this form for every student’s ISP.)
The ISP paper by Theresa Waters (student) does/does not* conform to the Human Subjects
Review approval from the Local Review Board, the ethical standards of the local
community, and the ethical and academic standards outlined in the SIT student and faculty
handbooks.
*This paper does not conform to standards for the following reasons:
Completed by: Tony Cummings
Academic Director: Tony Cummings
Signature:
Program: ASE- Australia: Rainforest, Reef, and Cultural Ecology
Date: 30th November, 2018
ABSTRACT

3
Australian fur seals (AFS), Arctocephalus pusillus doriferus, are upper trophic predators
endemic to the Bass Strait of south-eastern Australia. Their populations have been monitored since
the mid-1900s to assess ecosystem health and the continual recovery of the species from extensive
hunting in the early 19th century. The best way to track the environmental conditions and recovery
of AFS populations is by monitoring the pups that are confined to the breeding colonies. This study
looked particularly at the mortality rates of AFS pups because mortality of the young is a good
indicator of population dynamics.
The aim of this study was to determine unusual versus usual mortality rates and the factors
affecting them for AFS pups. Mortality and total pup population data was obtained from the pup
database which contains all the AFS pup data collected since the 1980s up to the 2017-2018
breeding season. Two pup estimates, Capture-Mark-Resight (CMR) and Direct count total, were
used in conjunction with the dead pup count for Deen Maar Island, Seal Rocks, The Skerries, and
Cape Bridgewater breeding colonies. Data were analyzed in RStudio. A Generalized Linear Model
(GLM) was developed to determine differences between breeding site and season on pup mortality
rates. Body condition of live pups was also studied to examine whether health of the AFS pups
provide insight into mortality rates. This was investigated by calculating a Body Condition Index
(BCI) and developing a GLM to determine whether breeding season, site, and pup sex affect this
variable. Pup mortality rates generally fell under 15%. Although Cape Bridgewater and the 2013-
2014 season at Seal Rocks showed unusually high mortality rates than other locations and seasons,
there were no significant differences between breeding locations nor seasons. However, due to the
limited data on dead pup numbers, these results were not entirely conclusive. Furthermore, the
calculated BCI did not align well with veterinarian observed body conditions of pups and the GLM
results were highly variable. For this reason, the BCI results could not provide insight on mortality
rate trends. Given the results of this study, it will be necessary in the future to use more accurate

4
and frequent methods for acquiring dead and live AFS pup numbers to better understand ecosystem
health and population recovery.
TABLE OF CONTENTS

5
ABSTRACT ………………………………………………………………………………… 3-2
ACKNOWLEDGEMENTS ……………………………………………………………........ 6-7
LIST OF FIGURES ………………………………………………………………………… 8
1. INTRODUCTION ……………………………………………………………...………... 9-13
1.1. Background on AFS Population ……………………………………………...... 9-10
1.2. Australian Fur Seal Species ………………………………………………….... 10-11
1.3. Significance of Monitoring AFS Populations …………………………………. 11-12
1.4. Mortality Rates ................................................................................................... 12-13
2. METHODS …………………………………………………………………………..….. 14-21
2.1. Study breeding colonies ……………………………………………………….. 14-15
2.2. Pup Population …………………………………………………………………15-16
2.3. Capture-Mark-Resight (CMR) Estimates ………………………………...….....16
2.4. Direct Ground Counts …………………………...……………………………. 16-17
2.5. Mortality Rates ………………………………………………………………... 17
2.6. Analysis of Mortality Rates …………………………...………………………. 17-19
2.7. Body Condition ………….……………………………………………………. 19-21
3. RESULTS ………………………………………………………………………………. 22-37
3.1. Mortality Rates …………………………………...…………………………... 22-28
3.2. Negative Binomial GLM for Proportion of Dead Pups ………………….…… 29-31
3.3. Body Condition Index (BCI) ……………………...…..…………………….… 31-33
3.4. Gaussian GLM for the BCI of live pups ……………...………………….…… 33-37
4. DISCUSSION …………………………………………………………………….……. 37-41
5. CONCLUSION ………………...…………………………………………….………… 41-43
REFERENCES ……………………………………………………………….…………… 44-48
ACKNOWLEDGEMENTS

6
I would first like to express my sincerest gratitude to my advisor Bec McIntosh.
Throughout the month of my ISP she showed me so much kindness and support during my process
of learning RStudio. She always took the time to answer my questions and provide me with help
when formulating questions while working with the pup database. The experience I gained in data
analysis during my short time as an intern for Bec is a skill I will be able to take with me into my
future endeavors in research science. I would also like to thank her for taking the time to run a
drone survey of Seal Rocks during my time at Phillip Island. She and Ross Holmberg are truly
pioneers in the use of drones for ecological research and I am honored to have gotten to go out in
the field with them.
I also would like to thank Karina Sorrell for providing me with access to the pup database
that she has worked so incredibly hard on. I am so appreciative of the time she took to get me
organized so that I could finish adding data to the pup database and for giving me a helpful crash
course for manipulating the pup data in RStudio.
A massive thank you is owed to André Chiaradia, who allowed me the opportunity to help
in the fieldwork being done on Little Penguins during my time at the Research Center. I would
also like to thank him for teaching me how to properly hold an adult penguin while the loggers
were being attached to their backs. I also greatly appreciate the rides that he gave to Emma and I
and for inviting us so kindly into his home when we were in desperate need of a home-cooked
meal.
Thank you to Jess Pulvirenti for allowing me to carpool with her to work during most of
my ISP. She was so helpful in teaching me the proper fieldwork techniques for the penguins. Thank
you also to Marjolein van Polanen Petel for allowing Jess, Emma, and I to partake in holding and
weighing the day old penguin chicks.

7
Thank you so much to Emma Barreau. One paragraph is not enough to show the gratitude
I have for the incredible friendship that has developed between us in such a short amount of time.
For all the laughs, penguin jokes, fieldwork experience, wallaby pictures, long runs, delicious
meals, adventures around the island, and support during my project, I will forever be grateful. I
am so lucky to have made such a wonderful friendship that I hope will be lifelong. I wish her the
absolute best in the rest of her research on Little Penguins and the best of luck in her future PhD
work.
Thank you to Phillip Island Nature Parks for allowing me the opportunity to be an intern
and conduct my project in their world renown facilities. It was truly an honor.
Thank you to Tony Cummings and the rest of my SIT family who made my experience in
Australia so academically stimulating and the greatest adventure of my life thus far.
Finally, thank you to my family for their endless support and for allowing me the
opportunity to study in an ecological paradise.

8
LIST OF FIGURES
Fig. 1. Map showing the range of AFS .………………………………………………….. 15
Fig. 2. Boxplot of CMR&Direct and Direct pup mortality rates ………………………… 22
Fig. 3. Boxplots of pup mortality rates at The Skerries …………..……………………… 23
Fig. 4. Boxplot of pup mortality rates at Deen Maar Island …………………………….. 23
Fig. 5. Pup mortality trends at Deen Maar Island ……………………………………….. 24
Fig. 6. Boxplot of pup mortality rates at Cape Bridgewater ……………………………... 25
Fig. 7. Pup mortality trends at Cape Bridgewater ……………………………………….. 25
Fig. 8. Boxplots of pup mortality rates at Seal Rocks …..………………………………... 26
Fig. 9. Pup mortality trends at Seal Rocks ...……………………………………………... 26
Fig. 10. Boxplot comparison of Seal Rocks and Cape Bridgewater rates ...……………… 27
Fig. 11. Scatterplot of Seal Rocks and Cape Bridgewater trends ………………………… 28
Fig. 12. Pup mortality trends in 2017-2018 season ………………………………………. 28
Fig. 13. Cooks Distance plot for proportion of dead pups GLM ..………………………... 29
Fig. 14. Pearson residuals for proportion of dead pups GLM ……………………………. 30
Fig. 15. Visual regression for impact of breeding site on prop. dead pups ...…………….. 30
Fig. 16. Visual regression for impact of season on prop. dead pups ...…………………… 31
Fig. 17. Scatterplot of pup body weight to length …………...……………………………. 32
Fig. 18. Boxplot BCI to vet. observed body condition for female pups …………………… 33
Fig. 19. Boxplot BCI to vet. Observed body condition for male pups …………………….. 33
Fig. 20. Cooks Distance plot for BCI of live pups GLM ……...………………………….... 34
Fig. 21. Pearson residuals for BCI of live pups GLM …………………………………….. 34
Fig. 22. Visual regression for impact of breeding site on live pup BCI ...………………… 35
Fig. 23. Visual regression for impact of season on live pup BCI …………………………. 36
Fig. 24. Visual regression for impact of sex on live pup BCI ...………………………….... 37
Table 1. Total pups measured for body condition …...…………………………………..... 20
Table 2. P-values of coefficients from prop. dead pups GLM …………………………….. 31
Table 3. P-values of coefficients from live pup BCI GLM ……………………………….... 37

9
1. INTRODUCTION
1.1. Background on AFS Population
The hunting of Australian fur seals (AFS), Arctocephalus pusillus doriferus, began at least
8,000 years ago by Aboriginal people (Kirkwood et al., 2005). In the late 18th century, AFS were
severely depleted due to large scale commercial hunting (Warneke, 1982). Between 1800 and
1810, it is estimated that the number of seals caught in the Bass Strait Archipelago was 240,000
(Lewis, 1929). In particular, the Seal Rocks colony alone yielded 1000 AFS skins a year during
this time (Warneke, 1966). Prior to this period, the annual total AFS pup production is estimated
to have been between 20,000 and 50,000 at 26 colonies in Bass Strait (Warneke, 1982). By 1860
only 100 individuals survived at Seal Rocks (Warneke, 1966) and 16 of the Bass Strait colonies
had been completely wiped out (Warneke, 1966; McIntosh et al., 2018).
It was not until 1890 that legal protections were set in place for fur seals in Victorian waters
(Warneke, 1966). Due to the increase in numbers, as a result of these protections, professional
fisherman began to complain about AFS interfering with their operations (e.g., damaging nets,
following fishing boats, taking barracouta from the line, and dispersing shoals of fish) (Lewis,
1929). However, in 1929 a report by Chief Inspector of Fisheries and Game concluded that AFS
were not a threat to the fishing industry, so population control measures were not necessary. In
order to appease fisherman, the policy at the time was continued that allowed the shooting of seals
interfering with fishing operations (Lewis, 1929). In 1941, complaints culminated in the approval
for killing 1000 seals at Seal Rocks and in 1948 authorization was given for killing of seals in
Victorian waters based on a permit system (total limit of 2000 per annum) (Warneke, 1966). In
1948 691 seals were killed and utilized for oil, meat, and leather (Warneke, 1966). Illegal shootings
from boats and destruction of individual seals by fishing operations continued until 1975 when all
10
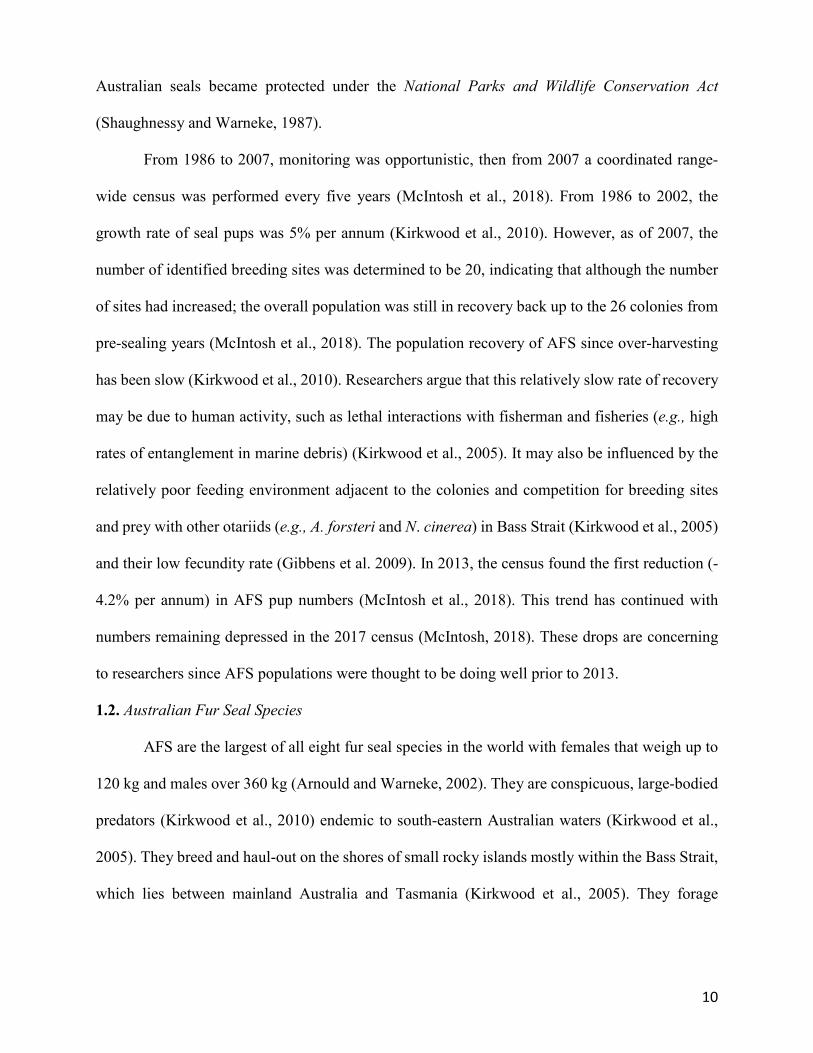
Australian seals became protected under the National Parks and Wildlife Conservation Act
(Shaughnessy and Warneke, 1987).
From 1986 to 2007, monitoring was opportunistic, then from 2007 a coordinated range-
wide census was performed every five years (McIntosh et al., 2018). From 1986 to 2002, the
growth rate of seal pups was 5% per annum (Kirkwood et al., 2010). However, as of 2007, the
number of identified breeding sites was determined to be 20, indicating that although the number
of sites had increased; the overall population was still in recovery back up to the 26 colonies from
pre-sealing years (McIntosh et al., 2018). The population recovery of AFS since over-harvesting
has been slow (Kirkwood et al., 2010). Researchers argue that this relatively slow rate of recovery
may be due to human activity, such as lethal interactions with fisherman and fisheries (e.g., high
rates of entanglement in marine debris) (Kirkwood et al., 2005). It may also be influenced by the
relatively poor feeding environment adjacent to the colonies and competition for breeding sites
and prey with other otariids (e.g., A. forsteri and N. cinerea) in Bass Strait (Kirkwood et al., 2005)
and their low fecundity rate (Gibbens et al. 2009). In 2013, the census found the first reduction (-
4.2% per annum) in AFS pup numbers (McIntosh et al., 2018). This trend has continued with
numbers remaining depressed in the 2017 census (McIntosh, 2018). These drops are concerning
to researchers since AFS populations were thought to be doing well prior to 2013.
1.2. Australian Fur Seal Species AFS are the largest of all eight fur seal species in the world with females that weigh up to
120 kg and males over 360 kg (Arnould and Warneke, 2002). They are conspicuous, large-bodied
predators (Kirkwood et al., 2010) endemic to south-eastern Australian waters (Kirkwood et al.,
2005). They breed and haul-out on the shores of small rocky islands mostly within the Bass Strait,
which lies between mainland Australia and Tasmania (Kirkwood et al., 2005). They forage

11
exclusively over the shelf waters of south-eastern Australia, making them a geographically
restricted fur seal species (Kirkwood et al., 2005).
AFS exhibit a synchronized annual breeding cycle (McIntosh et al., 2014): pups are born
between November and mid-December and remain at the colony until they are 8 months old
(Gibbens and Arnould, 2008). Females birth their first pup around 3-4 years of age, while males
do not attain sufficient size and experience to hold their own breading territories until they are at
least 9 years old (Warneke and Shaughnessy, 1985). Females regularly alternate between foraging
at sea and suckling their pups onshore (Bradshaw et al., 2000).
Pups weigh between 10 and 15 pounds at birth (Warneke, 1966). They have distinguishably
sleek black oily-looking coats that are molted soon after the end of the breeding season (Warneke,
1966). While their mothers are off foraging at sea, unattended pups derive comfort from mutual
contact by congregating in groups of 50 or more called pods, since conditions are generally harsh
for the young pups (Warneke, 1966).
AFS are predominantly benthic foragers that prey on demersal and pelagic schooling
species along with benthic species (Hume et al., 2004; Hardy et al., 2017). Due to their feeding
habits and the rapid exploitation of marine resources by humans, there has been an increase in the
interactions between fur seals and commercial fisheries (Arnould et al., 2003). This has led to
concerns about the impact of commercial fishing on prey availability and the accidental
entanglement in fishing nets on AFS (Arnould et al., 2003).
1.3. Significance of Monitoring AFS Populations
The populations of AFS in Bass Strait have been monitored since the mid-1900s to assess
the potential extent of current human-based interactions (Arnould et al., 2003). Monitoring the
abundance and population trends of upper trophic level predator species provides measures of
ecosystem health and successful management (McIntosh et al., 2018). AFS pose management

12
challenges such as interactions with fisheries, economic value through tourism, impacts on other
important marine species (e.g., seabirds), and emergency situations (e.g., oil spills) (McIntosh et
al., 2018). Knowledge of population trends help managers to maintain updated protected areas,
mitigate natural resource extraction, and other utilization of wildlife resources (McIntosh et al.,
2018). Finally, due to their position towards the top of the marine food web, AFS are affected by
variation in the intensity and location of food resources in the marine environment (Bradshaw et
al., 2000). For this reason, variation in the biological parameters of AFS may offer insight into
changes in the marine environment occurring lower down in the food web (Bradshaw et al., 2000).
1.4. Mortality Rates
The mortality of pups and juveniles is an indicator of population dynamics for large
mammals like AFS (Eberhardt, 1981). In a previous study it was found that a major driving
variable of another fur seal species population, the Pribilof Islands North Pacific fur seal
(Callorhinus ursinus), was the survival of young fur seals (Eberhardt, 1981). Despite the
importance of mortality rates on population dynamics of other fur seal species, there is still little
quantitative data on mortality rates and the factors affecting mortality of AFS (Arnould et al.,
2003). Most studies use a suggested 15% by Warneke (1982) as a minimum mortality rate in the
first two months of AFS pup life, when they are sedentary and do not readily enter the sea.
However, this 15% value has not been closely researched.
Despite the limited research on AFS, the mortality of pups of other seal species have been
investigated. One study on the closely related South African fur seal, Arctocephalus pusillus
pusillus, found that most pups die shortly after birth in November and December every breeding
season (De Villiers and Roux, 1992). The mortality rate during the first month was 20% (De
Villiers and Roux, 1992) - 5% higher than the estimate used in AFS studies. They also found a

13
differential rate of mortality between male and female fur seals, with significantly more females
dying (De Villiers and Roux, 1992).
In another study, on Long-nosed fur seals, Arctocephalus forsteri, it was found that the
mortality rate of seal pups in the first two months of life was also 20% and 40% in the first year of
life (Mattlin, 1978). According to this study, starvation accounted for 70% of the deaths in the first
two months of life, however, stillbirths, suffocation, drowning, and trampling were also significant
factors to the pup mortality rate (Mattlin, 1978). However, another study on the Long-nosed fur
seals found the pup mortality at six major breeding colonies in South Australia to be 4.4%
(Shaughnessy et al., 2015). This is much less than the Mattlin (1978) study which examined
colonies in New Zealand.
This study aims to closely investigate the mortality rates of AFS pups across breeding
colonies and breeding seasons within the Bass Strait in order to determine trends and normal versus
unusual rates. Pup mortality trends will then be analyzed in order to understand possible factors
affecting mortality rates. The factors analyzed in this study include location of the breeding colony,
breeding season, and pup body condition.

14
2. METHODS
2.1. Study Breeding Colonies
Overall distribution: AFS are found from Montague Island, New South Wales, to southern
Tasmania, and throughout Bass Strait and South Australia to a western limit of Williams Island
(McIntosh et al. 2018). More than 2/3 of the present population is concentrated at three sites in
Bass Strait – Judgement rocks, Seal Rocks, and Deen Maar Island (Warneke, 1982). This study
looked particularly at the breeding AFS colonies at Deen Maar Island, Seal Rocks, The Skerries,
and Cape Bridgewater, since these were the sites with the most available data of live and dead AFS
pup counts.
Deen Maar Island (38.25S, 142.00E) is a triangular-shaped island, 2 km long and 1 km wide,
lying 22 km off of western Victoria, Australia. Its top is a featureless plateau, 35-45m high. Seals
are distributed continuously along the west side of the island, on shore platforms, narrow beaches,
scree (product of rock fall) slope, and in sea-worn caves. (Warneke, 1988). At the south-western
end of the island is the Seal Bay breeding area which is comprised of a boulder beach, cliffs, and
a steep scree slope that enable access to the plateau (Shaughnessy et al., 2002).
Seal Rocks (38.31.45S, 145.06.00E) is a major breeding colony that comprises two small basal
islands lying 1 km off the southwest corner of Phillip Island, Victoria, Australia. The larger island
consists of two small areas of plateau ranging from 8 to 10m high. The highest concentrations of
breeding seals are found on the east side beach (Main Beach) of this island. They also congregate
on the inner portion of the reef platform and on a boulder beach behind (Warneke, 1988). Fur seals
also breed on the smaller island, Black Rock (Shaughnessy et al., 2000).

15
The Skerries (37.45.15S, 149.30.45E) are three low graphite islets that extend in a 350-800m line.
They are separated by narrow shallow channels. Seals breed on the all three islets, on course sand
and granite boulders (McIntosh et al., 2018).
Cape Bridgewater (38.22.0S, 141.24.0E) is a relatively small breeding colony to the west of Deen
Maar where the seals are breeding in a large sea cave. However, its population between 2007 and
2013 grew by 60% per annum indicating that it is a rapidly growing colony (Fig. 1).
Fig. 1. Map showing the range of AFS with change (%) per annum between 2007 and 2013 censuses (McIntosh et al., 2018). In this paper, Lady Julia Percy Island is referred to as its Aboriginal title, Deen Maar Island. Deen Maar Island, Seal Rocks, The Skerries, and Cape Bridgewater – the focus sites of this study – are indicated by yellow squares.
2.2. Pup Population
The best way to track the recovery and conditions of AFS populations is by monitoring the
pups that are confined to the breeding colony (McIntosh et al., 2018). AFS pup numbers can

16
provide an indication of population size – a key population statistic – and their growth rate is a
reflection of food availability, foraging efficiency of lactating females, and prey availability
(Kirkwood et al., 2005; Bradshaw et al., 2000). Monitoring pup populations is also an easier
method for tracking AFS population. Pups are small and readily identifiable because they retain
their dark natal pelage until their first molt and they do not swim well or flee to sea when disturbed
during surveys (Littan and Mitchell, 2002).
2.3. Capture-Mark-Resight (CMR) Estimates CMR has been commonly used as a method for tracking pup abundance in the censuses.
AFS pups were marked by clipping black guard hair on the head to reveal the lighter underfur.
Capture across different studies was spread evenly across the breading area to ensure all parts of
the AFS population had been marked. In the Littan and Mitchell (2002) study, for example, pups
were resighted over a 2-3 day period after allowing between 1-2 days for the mixing of marked
and unmarked fur seals. The numbers of both marked and unmarked seal pups were counted during
resighting and overall abundance of the entire colony was estimated using the calculated arithmetic
mean.
CMR provides more accurate estimates of AFS pup numbers than direct counts or aerial
photographs. However, it does cause a high amount of disruption to the pups. CMR is particularly
useful when large numbers of pups are present and for accounting the obscured portion of pups
not quantified in direct and aerial counts. (Kirkwood et al., 2005).
2.4. Direct Ground Counts Direct ground counts have also been commonly used for tracking pup abundance in the
censuses. This method provides a census of the visible portion of pups present, which is affected
by factors such as tide, sea conditions, time of day, temperature, and observer experience
(Kirkwood et al., 2005).
17
The direct ground count method is not very accurate but it is useful when there is
insufficient time for CMR or when CMR will be too disruptive to the pups. Direct counts can lead
to underestimates when an unknown proportion is obscured or overestimates due to recounting
pups. (Kirkwood et al., 2005).
2.5. Mortality Rates
The rates of pup mortality were determined by using the data from the AFS pup database
compiled by Karina Sorrell and myself at Phillip Island Nature Parks. This database contains all
AFS pup data collected since the 1980s. Mortality rates were determined by adding direct counts
of dead pups at a given study site to either the CMR derived or directly counted live pup
populations for a particular breeding season. The directly counted dead pup numbers were then
divided by the total pup (live and dead) population to determine the rate of mortality.
2.6. Analysis of Mortality Rates All analysis of AFS pup mortality data, extracted from the overall pup database, was
conducted in RStudio. The variables investigated in relation to the calculated mortality rates were
breeding site, breeding season, count method used, total live pups, and total dead pups.
The pup mortality rates acquired using the count methods CMR&Direct (total population
estimated using CMR and Direct count used to determine dead pup numbers) and Direct were
compared using a Welch Two Sample t-test. This test was used to determine whether there is a
significant difference in the AFS pup mortality rates depending on the method used to determine
the live population numbers.
Boxplots were used to look at the average pup mortality rates within a given site (Deen
Maar, Seal Rocks, The Skerries, and Cape Bridgewater) and count method used (CMR&Direct
and Direct). Variation in the data within the sites could also be visualized in these plots.

18
The Direct count derived AFS pup mortality rates were compared between Seal Rocks and
Cape Bridgewater, because they had five breeding seasons of data that could be compared.
Significance between the mortality rates of Seal Rocks and Cape Bridgewater was determined
using an ANOVA test. A scatterplot and boxplot were used to visualize the relationship between
mortality rates and trends across the same seasons at the two different sites.
Plots of the trends across breeding seasons within a site were only created for sites that had
at least three data points available for a given count type, since trends could only be determined
with three or more points. For this reason, visualizations of trends could only be developed for
Deen Maar (CMR&Direct count), Seal Rocks (Direct count), and Cape Bridgewater (Direct
count). The trends across sites within a single season could only be made for the 2017-2018
breeding season, because this was the only season with data available from the CMR&Direct
counts for Cape Bridgewater, Deen Maar, Seal Rocks, and The Skerries. Other seasons did not
have enough data of the same method across all the sites.
The relationship of AFS pup mortality rates to breeding colony site and breeding season
was determined using a Generalized Linear Model (GLM) for the regression analysis of the Direct
count data. The CMR&Direct data was significantly sparser than the Direct count data so it was
excluded from this analysis. Regression analysis is useful for understanding which of the
independent variables (e.g., breeding season and site) are related to the dependent variable (e.g.,
proportion of dead pups). GLM was used for analysis instead of ANOVA or t-tests, because of the
heterogeneity of the pup data. GLM has three properties that make it useful when creating a model
for data with non-constant variance: 1) Error structure – GLM can take into account a variety of
different errors (e.g., binomial errors, which are useful for proportional data like that of dead pups
to total pups), 2) Linear predictor – the GLM structure relates each observed value (e.g., proportion
of dead pups) to the linear predictor which is the linear effect of the explanatory variables (e.g.,

19
breeding site and season), and 3) Link function – this relates the mean value of proportion of dead
pups to its linear predictor (Crawley, 2013). Overall, the GLM of the pup mortality data consisted
of a distribution of the proportion of dead pups, a predictor function specifying breeding site and
season as covariates, and a link between the predictor function and the mean of the dead pup
proportion distribution (Zuur et al., 2013).
To determine whether the GLM model for the dead pup proportion data was a good fit for
the regression analysis, multiple tests were performed. The first test was a plot of Cooks Distance
for the model. This was useful for identifying outliers in the observations for breeding site and
season. If any significant points were observed, the model was invalidated. Then a visual
regression was made to determine how far off the expected and observed values were under the
assumed model. This model identified which values were driving the lack of fit to the model, if
this was overdispersed then the model was invalidated. In this study, the best GLM of the dead
pup proportion data in relation to breeding site and season was a negative binomial distribution,
which is commonly used when analyzing proportional data.
2.7. Body Condition Monitoring the body condition of wild animals such as AFS can provide information about
survival, reproductive success, and “well-being” of the population (Arnould, 1995). Furthermore,
body condition can provide insight into factors influencing an animal’s interactions with its
environment (Arnould, 1995). One common and simple way of generating indices of body
condition for seals has been the use of body mass and morphometrics (Arnould, 1995).
This study looked at the length, mass, and observed body condition of AFS pups at The
Skerries (2017-2018), Seal Rocks (2017-2018, 2016-2017), and Cape Bridgewater (2017-2018)
(Table 1). This information was provided from the raw Excel datasheets from when Bec McIntosh
and her team went out with collaborator Dr. Rachael Gray (University of Sydney, Senior Lecturer

20
Veterinary Pathology) to monitor the health of the pups. A physical assessment of the observed
body condition was obtained by feeling the spine and hips and associated body fat along a scale
from poor to excellent. Body condition was also estimated with an index calculated from the length
and weight measurements. In one study on New Zealand fur seals, a morphometric index of pup
condition was estimated by comparing all pups measured across years using a linear regression of
length versus mass (Bradshaw et al., 2000). The length measurements were taken by placing the
pup in a light bag and weighing them with a hook scale (Roberts and Neale, 2016). Mass
measurements were taken by using a tape measure and recording the linear distance from nose-tip
to tail-tip of pups held in an outstretched position (Roberts and Neale, 2016).
Table 1. Total number of male and female AFS pups per site and season sampled for body condition measurements.
To begin with, a scatterplot was created comparing AFS pup weight to length in order to
determine if there was a correlation between body mass and length. A Welch Two Sample t-test
was then conducted to determine if the ratio of weight to length differed between male and female
pups. If the results were that males and females differed, then the body condition index would have
to be calculated using different regression lines for the two sexes.
This study used the same calculation as Bradshaw et al. (2000) for the body condition index
(BCI) of the AFS pups. Applying the regression equation to loge length (L) gave logee predicted
Mass (Mp):
logeMp = a + b*logeL
The Skerries
Seal Rocks
Cape Bridgewater
2017-2018 2017-2018 2016-2017 2017-2018 M F M F M F M F
16 7
25
15
32
18
22
13

21
where a and b are the least-squares regression coefficients. The relative condition index (CI) could
then be determined by solving the ratio of observed mass (Mo) to Mp:
CI = Mo/Mp
The BCI was compared to the observed body conditions in order to determine whether the
two methods for determining condition provided similar results. A GLM was then designed to
determine whether breeding site, season, and sex affect the BCI of AFS pups. The model was
validated similarly to proportion of dead pups by evaluating the Cooks Distance plot and by
looking at the dispersion of data from the expected values of the model. The best GLM for the BCI
data was the one fitted with Gaussian errors to account for non-normality. The residuals of BCI
were plotted based on location, season, and sex in order to determine which of these variables
affect the BCI of AFS pups. A full comparative test was not able to be conducted between BCI
and pup mortality proportions, due to the limited BCI averages available for only two seasons at
three sites.

22
3. RESULTS
3.1. Mortality Rates
Pup mortality rates significantly differed between CMR&Direct and Direct count methods
(p < 0.05) (Fig. 2). For this reason, CMR&Direct and Direct count data were kept separate from
each other during analysis of mortality rates across sites and seasons.
Fig. 2. Boxplot of AFS pup mortality rates gathered from all available CMR&Direct and Direct dead pup count data (t = 2.556, df = 16.617, p = 0.021) for Deen Maar Island, Seal Rocks, The Skerries, and Cape Bridgewater.
The average mortality rates of The Skerries and Dean Maar Island from the CMR&Direct
method were both around 5% (Fig. 3; Fig. 4). Whereas, the Direct count average mortality rate for
The Skerries was nearly double that of the CMR&Direct count average rate (Fig. 3). The data for
The Skerries was similar over the two breeding seasons, per count method (Fig. 3).

23
Fig. 3. Boxplots of AFS pup mortality rates at The Skerries acquired using CMR&Direct (A) and Direct (B) count methods across multiple breeding seasons. (A) January – 2017-2018, 2014-2015 (mean = 5.10%, median = 5.10%), (B) January – 2017-2018, February – 2013-2014 (mean = 9.91%, median = 9.91%). The CMR&Direct count method mortality rates for Deen Maar Island were more variable
than The Skerries (Fig. 4). Between the 1999-2000 and 2017-2018, the morality rates seemed to
be declining at Deen Maar Island (Fig. 5).
Fig. 4. Boxplot of AFS pup mortality rates at Deen Maar Island acquired using CMR&Direct count methods across three breeding seasons in January – 2017-2018, 2013-2014**, 1999-2000 (mean = 5.56%, median = 5.98%). **2013-2014 data was acquired between November and December.

24
Fig. 5. Deen Maar Island scatterplot plot of AFS pup mortality rates of three breeding seasons acquired using the CMR&Direct count method. **2013-2014 data was acquired between November and December, while the other seasons were collected in January. Unlike Deen Maar Island, the pup mortality rates at Cape Bridgewater were higher. The
average mortality rate at Cape Bridgewater across five breeding seasons worth of data was about
21% (Fig. 6). The rates across five breeding seasons seemed to be on the rise from 2013-2014 to
2015-2016, with rates around 25% seasons, which then dropped down near 10% in the 2016-2017
breeding season (Fig. 7). The rate increased closer to 20% again in the 2017-2018 season (Fig.
7).

25
Fig. 6. Boxplot of AFS pup mortality rates at Cape Bridgewater acquired using the Direct count method across five consecutive breeding seasons in January – 2013-14 to 2017-2018 (mean = 21.03%, median = 19.52%).
Fig. 7. Cape Bridgewater scatter plot of AFS mortality rates across five breeding seasons acquired using the Direct count method in January. Both the CMR&Direct and Direct count methods produced similar mortality rates at Seal
Rocks, with rates between about 10%-12% (Fig. 8). The Direct count data for Seal Rocks had one
data point that stood out much higher than the rest of the mortality rates across the five seasons
(Fig. 8). This point came from the 2013-2014 breeding season when the mortality rate was just

26
over 20%, and then dropped back down to 10% the next season and stayed stably around 10%
since then (Fig. 9).
Fig. 8. Boxplots of AFS pup mortality rates at Seal Rocks acquired using CMR&Direct (A) and Direct (B) count methods across multiple breeding seasons in December. (A) 2017-2018, 2013-2014, (B) five consecutive seasons from 2017-2018 to 2013-2014. (A) Mean = 10.98%, median = 10.98%, (B) mean = 12.25%, median = 11.30%.
Fig. 9. Seal Rocks scatter plot of AFS pup mortality rates across five breeding seasons acquired using the Direct count method in December. Since Seal Rocks and Cape Bridgewater had the most overlapping data within the same
five consecutive breeding seasons using the Direct count method, the mortality rates of these two
A B

27
sites were compared. An ANOVA test was conducted and it was found that there was not a
significant difference between the pup mortality rates at Seal Rocks and Cape Bridgewater (p >
0.05) (Fig. 10). Despite not being significantly different, other than the 2013-2014 outlier data
point at Seal Rocks, the mortality rates of the other four seasons fell fairly close to the downward
sloping trend line (Fig. 11). Whereas, for Cape Bridgewater, the mortality rates per season were
much more scattered above and below the slightly downward sloping trend line.
Fig. 10. Boxplots of AFS pup mortality rates across five breeding seasons at Seal Rocks and Cape Bridgewater collected using the Direct count method. Seal Rocks data was collected in December; Cape Bridgewater was collected in January over consecutive breeding seasons from 2017-2018 to 2013-2014. (F-value = 0.582, df = 1, p = 0.501).

28
Fig. 11. Scatterplot with trend lines of AFS pup mortality rates between the Direct counts for Seal Rocks (green) and Cape Bridgewater (red). The only breeding season and count method that had mortality rates from all breeding sites
was the 2017-2018 season data acquired using the CMR&Direct count method. The mortality rate
at Cape Bridgewater was more than double that of the three other breeding sites. Deen Maar, Seal
Rocks, and The Skerries all had rates under 10% (Fig. 12).
Fig. 12. 2017-2018 breeding season trend plot of AFS mortality rates across four breeding colonies acquired using the CMR&Direct count method. Cape Bridgewater data was collected in January; Deen Maar in January; Seal Rocks in December; The Skerries in January.

29
3.2. Negative Binomial GLM for Proportion of Dead Pups
The GLM was only developed for the Direct count data derived proportion of dead AFS
pups due to the sparse CMR&Direct data that was found to not be able to fit any of the possible
GLMs. Unfortunately, this also meant having to exclude Deen Maar Island from data analysis,
because it only had CMR&Direct dead pup counts. The model was overdispersed (dispersion
parameter > 5) when using the Poisson distribution, therefore the negative binomial distribution
was the final model used for the GLM (Fig. 13; Fig. 14). There were no significant outliers in the
Cooks Distance plot which validated the final model (Fig. 13). The Pearson residuals data fell
fairly close to the fitted values, further indicating that the negative binomial was the best fitting
model (Fig. 14).
Fig. 13. The Cooks Distance values for the Direct count negative binomial GLM for proportion of dead pups.

30
Fig. 14. Scatterplot of the Pearson residuals of the Direct count negative binomial GLM for proportion of dead pups versus fitted values in relation to breeding site and season. The visual regression plot of the negative binomial GLM indicated that there was very little
variation in the effects of different breeding sites on proportion of dead pups (Fig. 15). The same
was true for breeding season (Fig. 16). The summary of the negative binomial GLM confirmed
the data presented in the plots, since none of the breeding sites or seasons had a significant effect
on the proportion of dead pups (no p-values < 0.05) (Table 2).
Fig. 15. Visual regression plot of the negative binomial GLM of the proportion of dead AFS pups in relation to breeding site.

31
Fig. 16. Visual regression plot of the negative binomial GLM of the proportion of dead AFS pups in relation to breeding season.
Table 2. P-values for the coefficients from the summary of the negative binomial GLM for proportion of dead AFS pups in relation to breeding site and season. Any coefficients not presented in this table had higher p-values than the ones shown. ___________________________________________________________________________________________
Independent Variable ____________________________________________
P-Value ____________________________________________
Seal Rocks 0.753
The Skerries 0.759
2014-2015 0.952
2015-2016 0.956
2016-2017 0.848
2017-2018 0.879
3.3. Body Condition Index
In order to confirm the validity of using weight and length of pups in body condition
calculations, the two measurements were plotted against one another. A positive correlation was
found between weight and length measurements for pups (Fig. 17). A significant difference was

32
also found between the weight to length values for male and female AFS pups (Fig. 17). As a
result, the body condition index (BCI) values had to be calculated separately for males and females.
Fig. 17. Scatterplot of body weight (kg) versus length (cm) of live AFS pups (correlation coefficient = 0.825). Red trend line indicates female pup data; blue line indicates male pup data (t = -4.553, df = 230.96, p = 8.536x10⁻⁶). AFS pup body measurement data gathered at Cape Bridgewater (2017-2018), Seal Rocks (2017-2018, 2016-2017, 2015-2016), and The Skerries (2017-2018). The calculated BCI was then compared to the body condition observations made by the
veterinarian. For the female AFS pups the BCI values were highly variable in their correspondence
to the observed body condition (Fig. 18). The pups in good observed condition had higher BCI
values than excellent condition pups which had high variability in BCI values (Fig. 18). The BCI
values for males were less variable, but similar across the different observed body conditions (Fig.
19).

33
Fig. 18. BCI (condition index) versus veterinarian observed body condition for live female AFS pups.
Fig. 19. BCI versus veterinarian observed body condition for live male AFS pups.
3.4. Gaussian GLM for the BCI of live pups
A GLM was developed to determine whether breeding location, season, and pup sex had
an effect on the BCI of AFS pups. The GLM that best fit this data was a Gaussian distribution (Fig.
20; Fig. 21). There were no significant outliers in the Cooks Distance plot which validated the
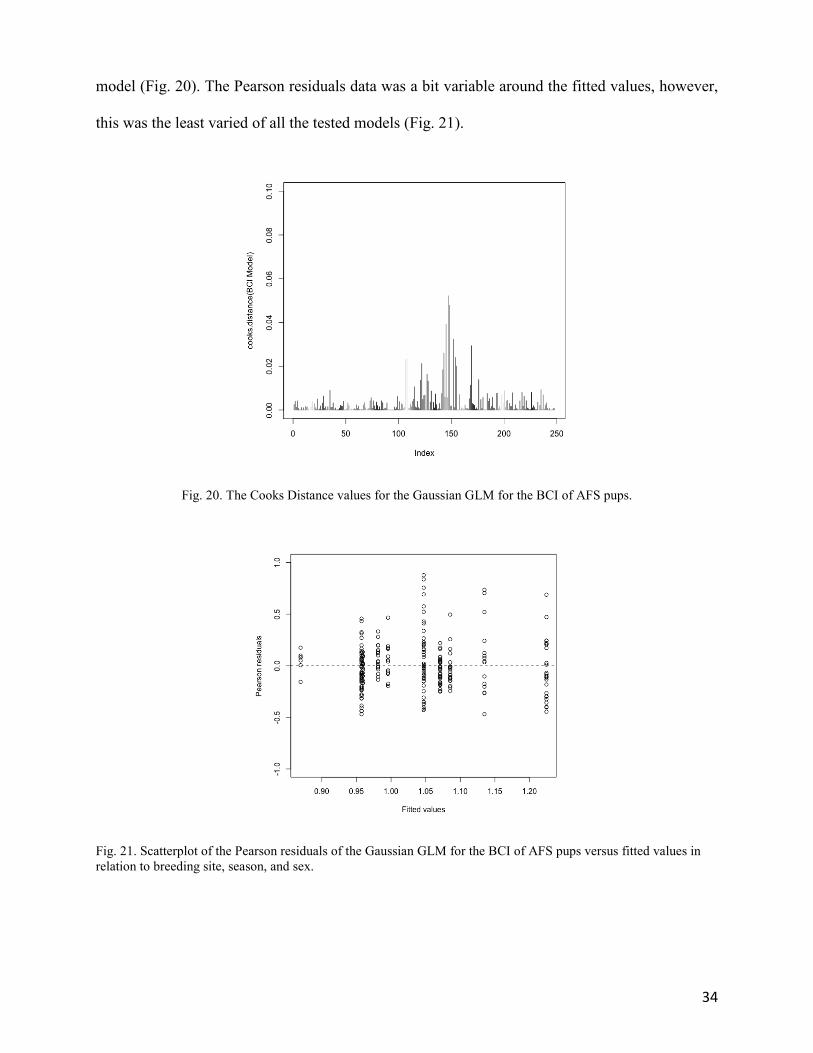
34
model (Fig. 20). The Pearson residuals data was a bit variable around the fitted values, however,
this was the least varied of all the tested models (Fig. 21).
Fig. 20. The Cooks Distance values for the Gaussian GLM for the BCI of AFS pups.
Fig. 21. Scatterplot of the Pearson residuals of the Gaussian GLM for the BCI of AFS pups versus fitted values in relation to breeding site, season, and sex.

35
The visual regression of the Gaussian GLM for BCI in relation to breeding site, indicated
that breeding site, season, and sex may have had a significant impact on the body condition of AFS
pups (Fig. 22; Fig. 23; Fig. 24; Table 2). In the visual model for the effect of breeding site, Seal
Rocks was highly variable showing that something significant may have been occurring at this
particular site (Fig. 22). From the GLM summary, Seal Rocks had a significant p-value (<0.05)
indicating that this site differed in AFS pup body conditions compared to other breeding locations.
The regression for the model based on breeding season also showed high variability in the data
(Fig. 23). In the summary, the GLM showed that the 2017-2018 season in particular had
significantly different body conditions than the other seasons (p-value < 0.05) (Table 2). Finally,
the data for sex of the pups was also variable in the presented model (Fig. 24). The summary of
the model presented that there was a significant difference in body condition between male and
female pups (Table 3).
Fig. 22. Visual regression plot of the Gaussian GLM for the BCI of AFS pups in relation to breeding site.

36
Fig. 23. Visual regression plot of the Gaussian GLM for the BCI of AFS pups in relation to season.
Fig. 24. Visual regression plot of the Gaussian GLM for the BCI of AFS pups in relation to sex.

37
Table 3. P-values for the coefficients from the summary of the Gaussian GLM for the BCI of AFS pups in relation to breeding site, season, and sex. Any coefficients not presented in this table had higher p-values than the ones shown. ___________________________________________________________________________________________
Independent Variable ____________________________________________
P-Value ____________________________________________
Seal Rocks 0.0134** The Skerries 0.0524 2016-2017 0.572 2017-2018 1.18x10⁻⁴** Male pups 0.0047**
**Indicates a significant p-value.
4. DISCUSSION
The AFS pup data that was gathered to determine pup mortality was done using either
CMR to determine total live pup numbers and a direct count to determine dead pup numbers or a
Direct count of both live and dead pups. The CMR&Direct collected data was significantly lower
than those from Direct counts (Fig. 2). This is most likely due to CMR being a more accurate
method for determining total population numbers (Kirkwood et al., 2005). Direct counts are more
prone to underestimates since they do not take into account pups obscured from sight. Since the
CMR live pup populations were generally higher than Direct counts, but the dead pup counts were
underestimated due to the errors of direct counting, the proportion of dead pups to total pups was
a lower ratio than that for Direct counts. For this reason, the pup mortality rate analysis for
CMR&Direct and Direct count methods were kept separate. The difference between the methods
is basically a data transformation, being of a different scale, and either may be used for the purpose
of monitoring trends and effects.
Out of the four breeding colonies studied, Deen Maar Island had the lowest mortality rates
gathered from the CMR&Direct count method (~6%) (Fig. 4). It was expected that Deen Maar
would have a higher rate of pup mortality, at least in comparison with the other sites, due to the
presence of persistent organic pollutants (POPs) bioaccumulated in this region, which has led to

38
the fatal alopecia syndrome in the AFS population (Taylor et al., 2015). Alopecia has been seen in
up to 50% of juvenile females at Deen Maar Island, which affects thermoregulation increasing the
risk of mortality (Taylor et al., 2015). It would be expected that with such high prevalence of
disease causing toxins in the environment around Deen Maar, that this would have an effect on
pup mortality if mothers with alopecia cannot fully provide for their young, or if there are negative
impacts on reproductive success linked to pup health. However, using the CMR&Direct method
may not have been able to capture the full effects of this disease on pup mortality. Deen Maar
Island is characterized by rocky terrain at the base of high cliffs and frequent wave wash. Dead
pups may have slipped through the gaps between the large boulders or been washed away, so they
were missed in counts. For these reasons, the ratio between dead and total pups may have been
underestimated due to the geography of this site and the limitation of using direct count for
identifying dead pups.
Unlike Deen Maar, Cape Bridgewater had the highest average mortality rate across five
breeding seasons using the Direct count method (mean ~ 21%) (Fig. 6). Cape Bridgewater is
located relatively close to Deen Maar Island (Fig. 1), and has similarly been found to have alopecia
present in its AFS population, possibly due to the same toxins found around Deen Maar (McIntosh,
2016). However, it may have presented higher rates of mortality from the Direct count method
because the large breeding cave could have protected AFS pup carcasses from being washed away
or eaten by birds (Fig. 25). It is possible that more accurate dead pup counts were acquired at this
site, which indicated that AFS pup mortality at Cape Bridgewater were typically above the
commonly used 15% mortality rate (Warneke, 1982), and closer to the 20% mortality pup rates in
the first two months of life found for other fur seal species (De Villiers and Roux, 1992; Mattlin,
1978).

39
The average pup mortality rates at Seal Rocks for both the CMR&Direct and Direct count
methods fell under 15% (Fig. 8). There has been more data collected using the Direct count method
at this location, allowing for trends to be depicted across five breeding seasons. In comparison
with Cape Bridgewater, the mortality rates at Seal Rocks have been much more stable over the
course of the five seasons (Fig. 11). However, in the 2013-2014 season the pup mortality rate at
Seal Rocks spiked up to over 20%, which may have been the cause as to why the rates between
Seal Rocks and Cape Bridgewater did not show a significant difference (Fig. 9; Fig. 10). Other
than this season, the Seal Rocks rates were more similar to The Skerries and Deen Maar, which all
fell under 15% (Fig. 3; Fig. 4), similar to the lower mortality rate in Long-nosed fur seals found
by Shaughnessy et al. (2015). It remains possible that sites other than the Cape Bridgewater cave
are subject to loss of dead pups (waves and carrion eaters) and vulnerable to being underestimated
when reliant on a single visit at the end of the breeding season.
The 2013-2014 breeding season fell after the hottest recorded Australian summer in
observational record (IMOS). Hot summers such as this increase seawater temperatures, which
impact marine ecosystems. One study on Australian sea lions in South Australia found that their
populations were declining at 1.14% during the breeding season each year (McIntosh et al. 2012).
They determined that the yearly survival rates of pup cohorts were negatively correlated with the
sea surface temperatures in the areas where the sea lions foraged (McIntosh et al. 2012). Fur seals
are closely related to sea lions, which means that environmental changes that affect Australian sea
lions may have similar impacts on AFS. This means that after a summer period of unusually warm
oceanographic conditions in areas such as Seal Rocks, primary production may be limited. As a
result, female AFS may not have been able to provide sufficient food to their pups (McIntosh et
al. 2012), resulting in an increase in pup mortality rates for this season.

40
The negative binomial GLM for proportion of dead AFS pups signified that neither
breeding site (Cape Bridgewater, Seal Rocks, and The Skerries) nor breeding season (2013-2018)
had an effect on pup mortality rates (Fig. 15; Fig. 16). Although Cape Bridgewater had high
mortality rates in comparison to the other sites (Fig. 7; Fig. 12) and Seal Rocks had a high mortality
rate in the 2013-2014 season (Fig. 9; Fig. 11), these locations and this season were not found to be
significant in an overall comparison across sites and seasons (Table 1). However, these results
were based off of very limited data on pup mortality. It is possible that with more data to compare
and more power in the model, the trends at Cape Bridgewater and Seal Rocks may actually have
been significant. In a study on live AFS pup population trends, it has been found that large colonies
like Seal Rocks and Deen Maar, have had reductions in pup numbers, while newer colonies like
Cape Bridgewater have shown increases since 2007 (McIntosh et al., 2018). Evidently populations
vary, so it may be possible that with more data, pup mortality rates may also show significant
variation at different breeding sites across different seasons.
The strong positive correlation between weight and length of AFS pups (Fig. 17) confirms
the idea that it is necessary to account for body size when analyzing changes in body mass since
mass is proportional to length (Bradshaw et al., 2000). Unlike in other studies that have looked at
fur seal pup body condition, this study found a significant difference in the ratio of weight to length
for males and female pups (Fig. 17). It was expected that for pups of different sexes in the first
two months of life, body condition would not have been considerably different from one another.
This result indicates that body condition may be affected by the sex of the pup. This was found to
be true in the Gaussian GLM for BCI in relation to sex (Fig. 24; Table 2). Furthermore, breeding
location and season also had a significant impact on the BCI of AFS pups (Fig. 22; Fig. 23; Table
2). In particular, Seal Rocks and the 2017-2018 seasons were significantly different, with higher
BCI indices than the other sites and seasons (Table 2, Figs 22-23). It was interesting that the

41
calculated BCI values did not align well with the observed body conditions by a certified
veterinarian, leading to doubts as to whether the calculation used on body mass and length was the
best method for determining body condition for pups (Fig. 18; Fig. 19). Pups may have recently
finished a meal of milk that could affect mass measurements. With further health information via
histology of blood, fur and rectal samples (Gray, R., unpublished data), we may be able to test the
value of the two body condition methods as indices of pup health. Other methods that could be
used to more reliably identify body condition include sampling total body water and total body
lipid data (Arnould, 1995).
Pup body condition is a good indicator of food availability in the environment and foraging
efficiency of females (Bradshaw et al., 2000). For this reason, it was expected that body condition
trends would align with the mortality rate trends, because poor body condition at a location or
within a specific season should lead to higher mortality in pups. Due to sparse and missing data
for both body condition and mortality rates, we were unable to test this with precision. In the future,
with a longer time series of more accurate data, pup condition could supply insight for mortality
rates within given sites and seasons.
5. CONCLUSION Based on the results of this study, it seems that the typical mortality rates in the first two
months of life at major breeding colonies in the Bass Strait region of Australia are under 15%.
This finding is different from previous studies on other closely related fur seals which have higher
mortality rates of 20% (Mattlin, 1978). In fact, the unusual mortality rates for AFS were those at
Cape Bridgewater and the 2013-2014 breeding season at Seal Rocks were 20% or slightly higher.
It could be that the Cape Bridgewater site captures dead pup carcasses, being a cave, resulting in
more accurate counts.

42
Although Cape Bridgewater had the highest observed mortality rates across multiple
seasons of all the sites, its overall live pup population has been dramatically increasing since 2007
(McIntosh et al., 2018). Yet, major breeding colonies such as Deen Maar and Seal Rocks, which
had generally lower mortality rates (under 15%), have shown significant decreases in live pup
populations (McIntosh et al., 2018). It is hard to determine the impacts of breeding location on
mortality rates with such limited data, which may be the cause for insignificant results across the
entire negative binomial GLM for the proportion of dead pups.
The same holds true for the body condition data. With a BCI index that did not align with
the veterinarian observations and that had a high amount of variability, it is difficult to determine
whether breeding location, season, and sex impact the health of AFS pups, and therefore, how their
health affects their mortality rates.
Since mortality rates and the factors affecting them provide knowledge about population
dynamics, insight into changes in the marine environment, and success of management practices
(Eberhardt, 1981; Bradshaw et al., 2000; McIntosh et al., 2018), it will be necessary in the future
to collect more frequent and accurate data for AFS pups. Both CMR and Direct count methods are
logistically demanding, expensive, and cause significant disturbance to wildlife (McIntosh et al.,
2018). As a result, population monitoring is low in frequency and trends are low in precision which
has led to reduced confidence in analyses. This makes it difficult to accurately monitor the recovery
process of AFS from commercial harvesting in the early 1800s. For this reason, alternative
methods need to be developed in order for researchers to obtain quality information on AFS
population trends with minimal disturbance in order to gain accurate information on ecosystem
health.
One such method currently being tested is the use of Remote Piloted Aircraft (RPA)
(McIntosh et al., 2018). RPAs have begun to be used by McIntosh et al. (2018) to survey AFS

43
abundance at Seal Rocks. An RPA at 40 m altitude can produce pup counts 20-32% higher than
ground counts with better resolution and minimal disturbance. With this method, higher quality
data can be obtained at more frequent levels. In the future, the images produced from RPA surveys
can be used to determine total and dead AFS pups with a higher accuracy in order to get better
results for pup mortality rates across more days within breeding seasons and sites.

44
LITERATURE CITED
Arnould, J.P. Y., 1995. Indices of Body Condition and Body Composition in Female
Antarctic Fur Seals (Arctocephalus Gazella). Marine Mammal Science, 11: 301-313.
Arnould, J.P.Y. & Warneke, R.M., 2002. Growth and condition in Australian fur seals (Arctocephalus pusillus doriferus) (Carnivora: Pinnipedia). Australian Journal of Zoology, 50: 53-66. Arnould, J.P.Y., Boyd, I.L., Warneke, R.M., 2003. Historical dynamics of the Australian fur seal population: evidence of regulation by man? NRC Canada, 81: 1428-1436. Bradshaw, C.J.A., Davis, L.S., Lalas, C., Harcourt, R.G., 2000. Geographic and temporal variation in the condition of pups of the New Zealand fur seal (Arctocephalus forsteri): evidence for density dependence and differences in the marine environment. Journal of Zoology, 252: 41-51. Crawley, M.J., 2013. The R Book. Wiley, 2: 557-563.
De Villiers, D.J., Roux, J.P., 1992. Mortality of newborn pups of the South African fur seal, Arctocephalus pusillus pusillus in Namibia. South African Journal of Marine Science, 12: 881-889. Eberhardt, L. L., 1981. Population dynamics of the Pribilof fur seals. Dynamics of Large Mammal Populations, 197-220. Gibbens, J. and Arnould, J.P.Y., 2009. Age-specific growth, survival, and population dynamics of female Australian fur seals. Can. J. Zool., 87: 902-911. Gibbens, J., and Arnould, J.P.Y., 2009. Interannual variation in pup production and the timing of breeding in benthic foraging Australian fur seals. Hardy, N., Berry, T., Kelaher, B.P., Goldsworthy, S.D., Bunce, M., Coleman, M.A., Gillanders, B.M., Connell, S.D., Blewitt, M., and Figueira, W., 2017. Marine Ecology Progress Series, 573: 237-254.

45
Hume, F., Hindell, M.A., Pemberton, D., and Gales, R., 2003. Spatial and temporal variation in the diet of a high trophic level predator, the Australian fur seal (Arctocephalus pusillus doriferus). Marine Biology, 144: 407-415. IMOS, Integrated Marine Observing System. Date accessed: Nov. 24, 2018. https://portal.aodn.org.au/search Kirkwood, R., Gales, R., Terauds, A., Arnould, J.P.Y., Pemberton, D., Shaughnessy, P.D., Mitchell, A.T., Gibbens, J., 2005. Pup production and population trends of the Australian fur seal (Arctocephalus pusillus doriferus). Marine Mammal Science, 21: 260-282. Kirkwood, R., Pemberton, D., Gales, r., Hoskins, A.J., Mitchell, A., Shaughnessy, P.D., Arnould, J.P.Y., 2010. Continued population recovery by Australian fur seals. Marine and Freshwater Research, 61: 695-701. Knuckey, I.A., Eayrs, S., and Bosschietter, B., 2002. Options for reducing incidental catch of seals on wet-boats in the SETF: a preliminary assessment. Marine and Freshwater Resources Institute. Lewis, F., 1929. Investigation into the Feeding Habits, Etc., of Seals in Victorian Waters. Report of the Chief Inspector of Fisheries and Game, 23: 1-17. Lewis, S.C. and Karoly, D.J., 2013. Anthropogenic contributions to Australia’s record summer temperatures of 2013. Geophysical Research Letters, 40: 3705-3709. Littnan, C.L. and Mitchell, A.T., 2002. Australian and New Zealand Fur Seals at The Skerries, Victoria: Recovery of a Breeding Colony. Australian Mammalogy, 24: 57-64. Mattlin, R.H., 1978. Pup mortality of the New Zealan fur seal (Arctocephalus forsteri lesson). New Zealand Journal of Ecology, 1: 138-144. Science.

46
McIntosh, R.R., 2018. Report for Victorian Seal Census – Dec 2017 to Jan 2018. Phillip Island Nature Parks, 1-17. McIntosh, R.R., 2016. Report for trip to Cape Bridgewater – January 2018. Phillip Island Nature Parks, 1-4. McIntosh, R.R., Arthur, A.D., Dennis, T., Berris, M., Goldsworthy, S.D., Shaughnessy, P.D., and
Teixeira, C.E.P., (2012) Survival estimates for the Australian sea lion: Negative
correlation of sea surface temperature with cohort survival weaning. Marine Mammal
McIntosh, R.R., Goldsworthy, S.D., Shaughnessy, P.D., Kennedy, C.W., and Birch, P.,
2012. Estimating pup production in a mammal with an extended and aseasonal breeding
season, the Australian sea lion (Neophoca cinerea). Wildlife Research, 39: 137-148.
McIntosh, R.R., Holmberg, R., Dann, P., 2018. Looking Without Landing – Using Remote
Piloted Aircraft to Monitor Fur Seal Populations Without Disturbance. Frontiers in
Marine Science, 5(202): 1- 13.
McIntosh, R.R. and Kennedy, C.W., 2013. Morphology, sex ratio and cause of death in
Australian sea lion (Neophoca cinerea) pups. Australian Mammalogy.
McIntosh, R.R., Kirkman, S.P., Thalmann, S., Sutherland, D.R., Mitchell, A., Arnould, J.P.Y., Salton, M., Slip, D.J., Dann, P., and Kirkwood, R., 2018. Understanding meta- population trends of the Australian fur seal, with insights for adaptive monitoring. PLOS, 1-24. McIntosh, R.R., Kirkwood, R., Sutherland, D.R., and Dann, P., 2015. Drivers and annual Estimates of marine wildlife entanglement rates: A long-term case study with Australian fur seals. Marine Pollution Bulletin, 101: 716-725. McIntosh, R., Kirkwood, R., Thalman, S., Alderman, R., Arnould, J.P.Y., Mitchell, T., Kirman, S.P., Salton, M., Slip, D., 2014. Pup Estimates for Australian and New Zealand Fur Seals in Victoria, Tasmania, and New South Wales Between 2007 and 2013. Phillip Island Nature Parks, 1-94.

47
Roberts, J. and Neale, D., 2016. Census and individual size of New Zealand fur seal/kekeno pups on the West Coast of South Island from 1991 to 2016. Department of Conservation. Shaughnessy, P.D., Goldsworthy, S.D., and Mackay, A.I., 2015. The long-nosed fur seal (Arctocephalus forsteri) in South Australia in 2013-2014: abundance, status, and trends. Australian Journal of Zoology. Shaughnessy, P.D., Kirkwood, R.J., and Warneke, R.M., 2002. Australian fur seals,
Arctocephalus pusillus doriferus: pup numbers at Lady Julia Percy Island, Victoria,
and a synthesis of the species’ population status. Wildlife Research, 29: 185-192. Shaughnessy, P.D., Troy, S.K., Kirkwood, R., and Nicholls, A.O., 2000. Australian fur seals at Seal Rocks, Victoria: pup abundance by mark-recapture estimation shows continued increase. Wildlife Research, 27: 629-633. Shaughnessy, P.D., Warneke, R.M., 1987. Australian Fur Seal, Arctocephalus pusillus doriferus. Status. Biology, and ecology of fur seals; Proceedings of an international symposium and workshop, 73-77. Taylor, S., Lynch, M., Stevenson, G., Yates, A., Piro, N., and de Araujo, R.G., 2015. Impacts of toxicants in the marin ecosystem on the health of Australian fur seals (Arctocephalus pusillus doriferus). Science of the Total Environment, 1-34. Warneke, R.M., 1966. The Fur Seal. Wildlife in Southeastern Australia, 16-22. Warneke, R.M., 1982. Report on an Aerial Survey of Australian Fur Seal sites in Victoria and Tasmania During the 1986 Breeding Season. Australian National Parks and Wildlife Service. Warneke, R.M., 1982. The Distribution and Abundance of Seals in the Australasian Region with Summaries of Biology and Current Research. Mammals in the Seas, 5: 431-475.

48
Warneke, R.M. & Shaughnessy, P.D., 1985. Arctocephalus pusillus. The South African and Australian fur seal: Taxonomy, evolution, biogeography, and life history. South Australian Museum, Adelaide, 53-77. Wynen, L.P., Goldsworthy, S.D., Insley, S.J., Adams, M., Bickham, J.W., Francis, J., Gallo,
J.P., Hoelzel, A.R., Majluf, P., White, R.W.G., Slade, R., 2001. Phylogenetic
relationships within the eared seals (Otariidae : Carnivora): Implications for the
historical biogeographys of the family. Molecular Phylogenetics and Evolution, 21:
270-284.
Zuur, A.F., Hilbe, J.M., Ieno, E.N., 2013. A Beginner’s Guide to GLM and GLMM with R.
Highland Statistics Ltd., 1-37.