mortality report 2015 - deputy prime minister...mortality report 2015 national mortality registry...
TRANSCRIPT
Mortality Report 2015
National Mortality Registry Page 1
Annual Mortality Report
2015
During 2015 there were 3443 deaths in residents of Malta, with a
stable trend in the crude mortality rate and a decreasing trend in
standardised mortality rate, reflecting the postponement of death to
older age groups.
68.9% of deaths occurred within a hospital with 53.3% occurring at
Mater Dei Hospital.
Circulatory diseases including heart diseases and stroke accounted
for 38.7% of all deaths while cancer deaths accounted for 27.2% of
all deaths.
Trends in major causes of death including heart disease, stroke and
diabetes are showing a downward or stable trend, however
mortality rates for Malta are higher than the EU average.
Trends in standardised mortality rate due to lung cancer in women,
dementia in both sexes and suicide in males are showing an upward
trend. However mortality rates from these causes in Malta is lower
than the EU average.
Causes of death vary with age and gender with external causes of
death accounting for a large percentage of deaths in the younger
(15-44 years) age groups, cancers dominating the middle aged
groups and circulatory diseases increasing in importance with
increasing age. Conditions such as dementia, pneumonia and
diabetes are important causes of death in the older age groups.
Mortality Report 2015
National Mortality Registry Page 2
Overview
During the year 2015 there were 3443 deaths among residents of the Maltese Islands dying
in Malta or abroad. There were 1734 male deaths and 1709 female deaths, an increase of 79
male and 94 female deaths from 2014. There were also 91 non residents who died in Malta
an increase of 22 deaths from 2014.
Trends in the number of deaths and crude mortality rates over time
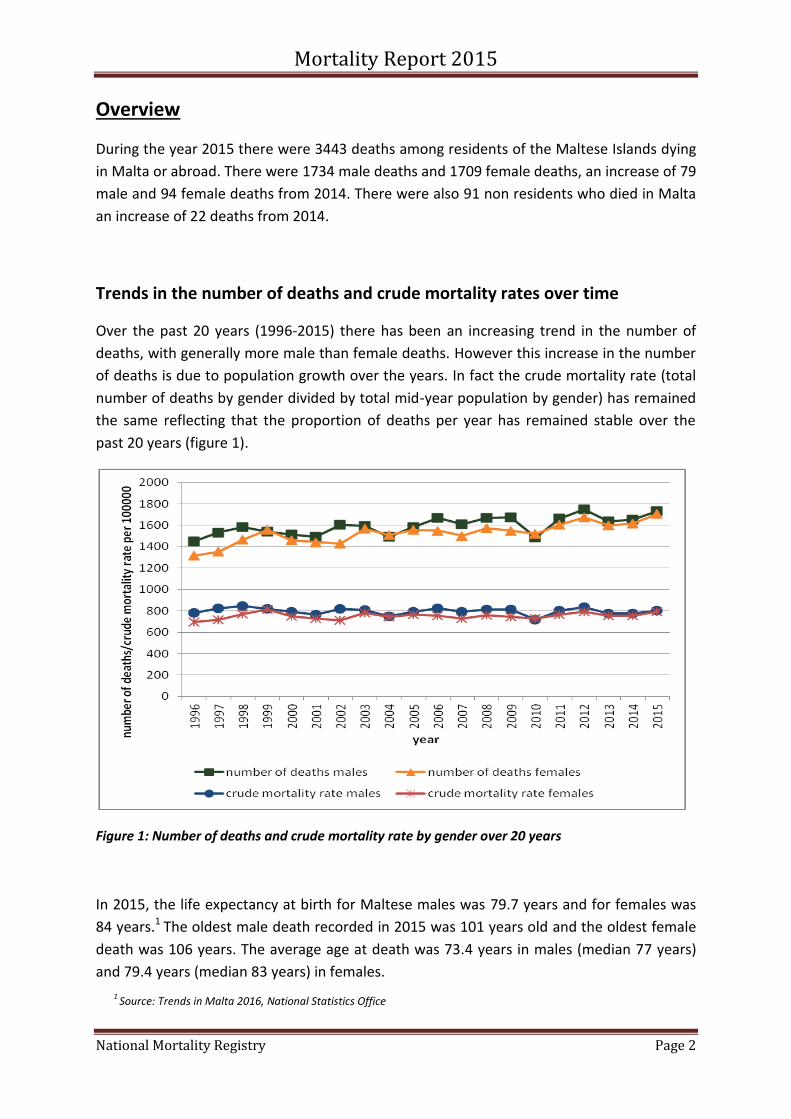
Over the past 20 years (1996-2015) there has been an increasing trend in the number of
deaths, with generally more male than female deaths. However this increase in the number
of deaths is due to population growth over the years. In fact the crude mortality rate (total
number of deaths by gender divided by total mid-year population by gender) has remained
the same reflecting that the proportion of deaths per year has remained stable over the
past 20 years (figure 1).
Figure 1: Number of deaths and crude mortality rate by gender over 20 years
In 2015, the life expectancy at birth for Maltese males was 79.7 years and for females was
84 years.1 The oldest male death recorded in 2015 was 101 years old and the oldest female
death was 106 years. The average age at death was 73.4 years in males (median 77 years)
and 79.4 years (median 83 years) in females.
1
Source: Trends in Malta 2016, National Statistics Office
Mortality Report 2015
National Mortality Registry Page 3
Standardised mortality rate in Malta compared to the European Union
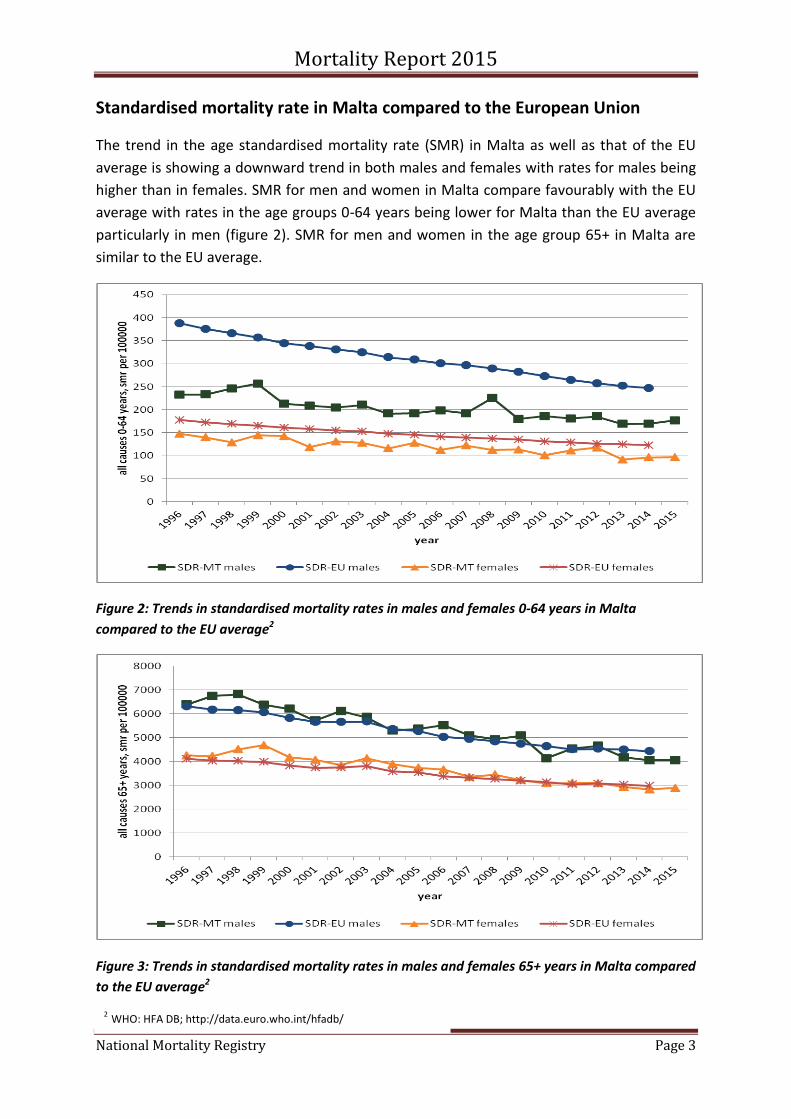
The trend in the age standardised mortality rate (SMR) in Malta as well as that of the EU
average is showing a downward trend in both males and females with rates for males being
higher than in females. SMR for men and women in Malta compare favourably with the EU
average with rates in the age groups 0-64 years being lower for Malta than the EU average
particularly in men (figure 2). SMR for men and women in the age group 65+ in Malta are
similar to the EU average.
Figure 2: Trends in standardised mortality rates in males and females 0-64 years in Malta
compared to the EU average2
Figure 3: Trends in standardised mortality rates in males and females 65+ years in Malta compared
to the EU average2
2 WHO: HFA DB; http://data.euro.who.int/hfadb/
Mortality Report 2015
National Mortality Registry Page 4
Distribution by type of place of death
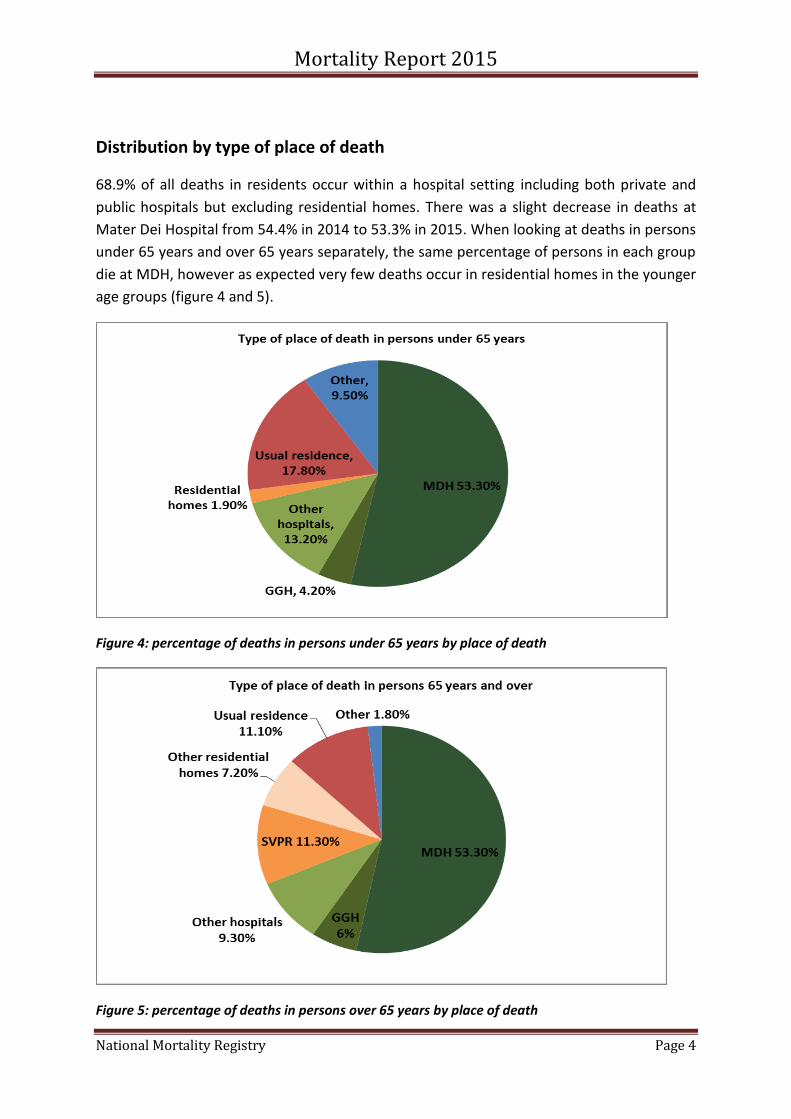
68.9% of all deaths in residents occur within a hospital setting including both private and
public hospitals but excluding residential homes. There was a slight decrease in deaths at
Mater Dei Hospital from 54.4% in 2014 to 53.3% in 2015. When looking at deaths in persons
under 65 years and over 65 years separately, the same percentage of persons in each group
die at MDH, however as expected very few deaths occur in residential homes in the younger
age groups (figure 4 and 5).
Figure 4: percentage of deaths in persons under 65 years by place of death
Figure 5: percentage of deaths in persons over 65 years by place of death
Mortality Report 2015
National Mortality Registry Page 5
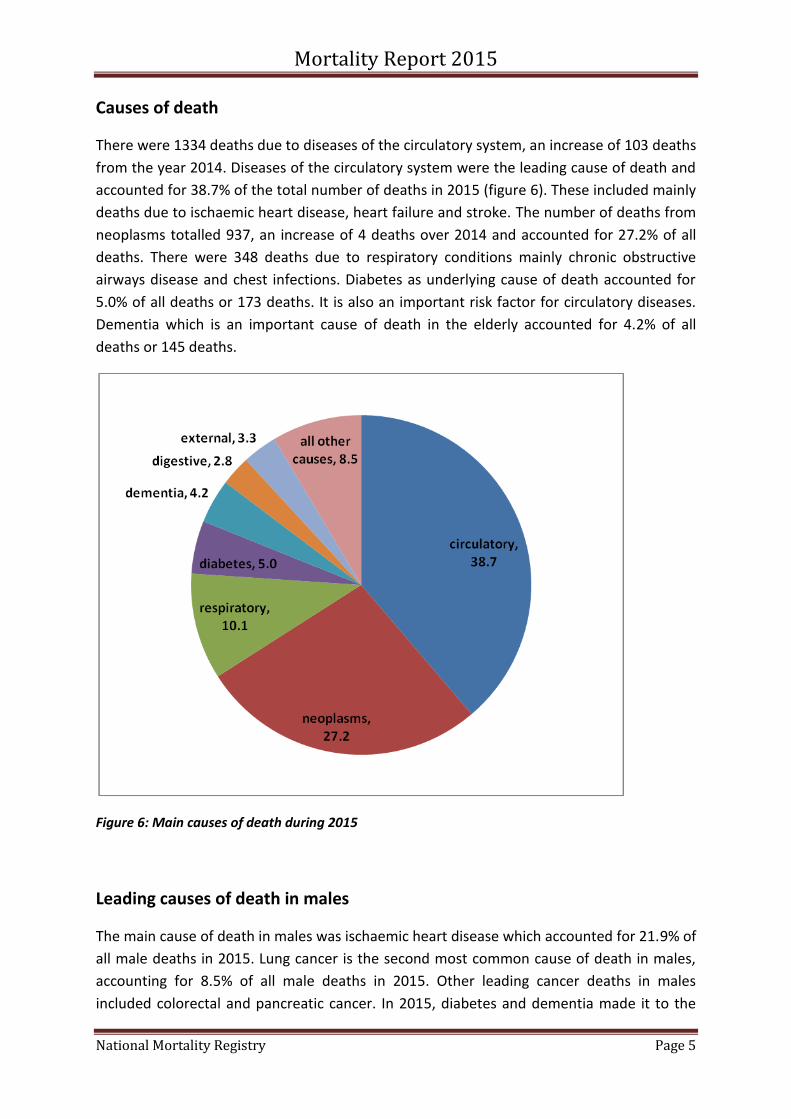
Causes of death
There were 1334 deaths due to diseases of the circulatory system, an increase of 103 deaths
from the year 2014. Diseases of the circulatory system were the leading cause of death and
accounted for 38.7% of the total number of deaths in 2015 (figure 6). These included mainly
deaths due to ischaemic heart disease, heart failure and stroke. The number of deaths from
neoplasms totalled 937, an increase of 4 deaths over 2014 and accounted for 27.2% of all
deaths. There were 348 deaths due to respiratory conditions mainly chronic obstructive
airways disease and chest infections. Diabetes as underlying cause of death accounted for
5.0% of all deaths or 173 deaths. It is also an important risk factor for circulatory diseases.
Dementia which is an important cause of death in the elderly accounted for 4.2% of all
deaths or 145 deaths.
Figure 6: Main causes of death during 2015
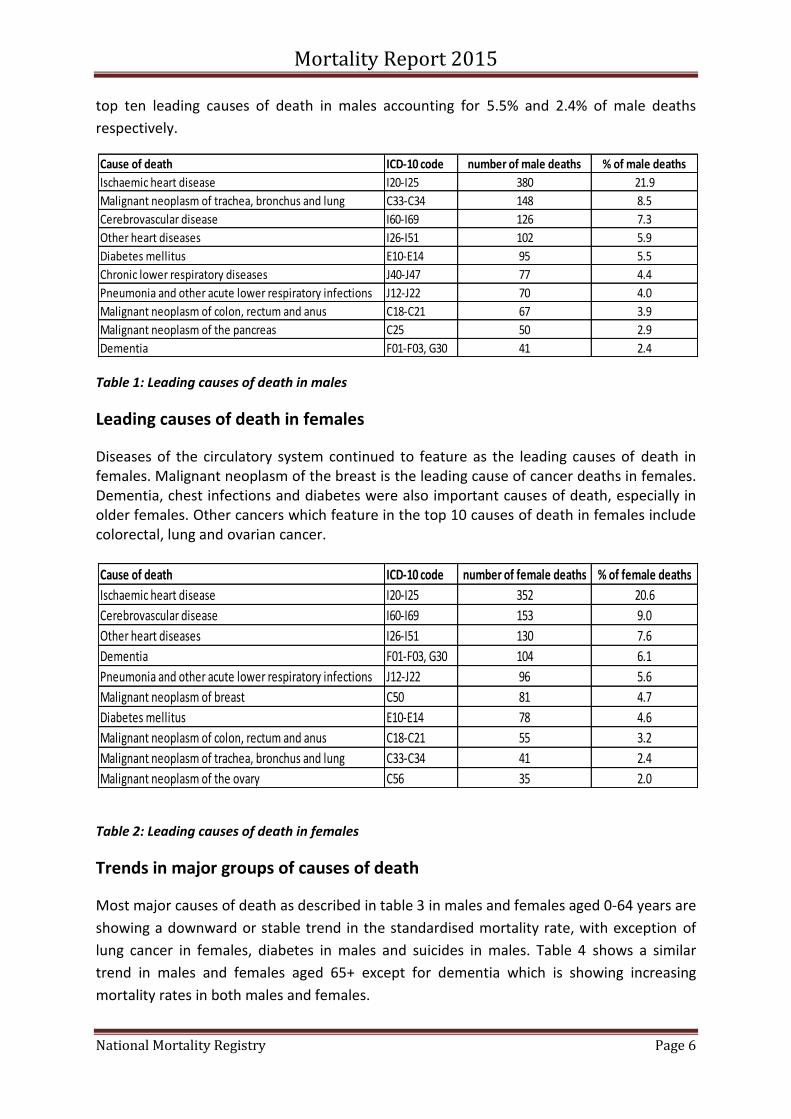
Leading causes of death in males
The main cause of death in males was ischaemic heart disease which accounted for 21.9% of
all male deaths in 2015. Lung cancer is the second most common cause of death in males,
accounting for 8.5% of all male deaths in 2015. Other leading cancer deaths in males
included colorectal and pancreatic cancer. In 2015, diabetes and dementia made it to the
Mortality Report 2015
National Mortality Registry Page 6
top ten leading causes of death in males accounting for 5.5% and 2.4% of male deaths
respectively.
Table 1: Leading causes of death in males
Leading causes of death in females
Diseases of the circulatory system continued to feature as the leading causes of death in females. Malignant neoplasm of the breast is the leading cause of cancer deaths in females. Dementia, chest infections and diabetes were also important causes of death, especially in older females. Other cancers which feature in the top 10 causes of death in females include colorectal, lung and ovarian cancer.
Table 2: Leading causes of death in females
Trends in major groups of causes of death
Most major causes of death as described in table 3 in males and females aged 0-64 years are
showing a downward or stable trend in the standardised mortality rate, with exception of
lung cancer in females, diabetes in males and suicides in males. Table 4 shows a similar
trend in males and females aged 65+ except for dementia which is showing increasing
mortality rates in both males and females.
Cause of death ICD-10 code number of male deaths % of male deaths
Ischaemic heart disease I20-I25 380 21.9
Malignant neoplasm of trachea, bronchus and lung C33-C34 148 8.5
Cerebrovascular disease I60-I69 126 7.3
Other heart diseases I26-I51 102 5.9
Diabetes mellitus E10-E14 95 5.5
Chronic lower respiratory diseases J40-J47 77 4.4
Pneumonia and other acute lower respiratory infections J12-J22 70 4.0
Malignant neoplasm of colon, rectum and anus C18-C21 67 3.9
Malignant neoplasm of the pancreas C25 50 2.9
Dementia F01-F03, G30 41 2.4
Cause of death ICD-10 code number of female deaths % of female deaths
Ischaemic heart disease I20-I25 352 20.6
Cerebrovascular disease I60-I69 153 9.0
Other heart diseases I26-I51 130 7.6
Dementia F01-F03, G30 104 6.1
Pneumonia and other acute lower respiratory infections J12-J22 96 5.6
Malignant neoplasm of breast C50 81 4.7
Diabetes mellitus E10-E14 78 4.6
Malignant neoplasm of colon, rectum and anus C18-C21 55 3.2
Malignant neoplasm of trachea, bronchus and lung C33-C34 41 2.4
Malignant neoplasm of the ovary C56 35 2.0

Mortality Report 2015
National Mortality Registry Page 7
Table 3: Long term trends in major causes of death in persons 0-64 years
Table 4: Long term trends in major causes of death in persons 65+ years
males females
All causes of death (A00-Y89) ↓ ↓
Certain infectious and parasitic diseases (A00-B99) ↓ ↓
Malignant neoplasms (C00-C97) ↓ ↓
Malignant neoplasm of trachea, bronchus & lung (C33-C34) ↓ ↑
Malignant neoplasm of female breast (C50) ↓
Diabetes mellitus (E10-E14) ↑ ↓
Diseases of the circulatory system (I00-I99) ↓ ↓
Ischaemic heart disease (I20-I25) ↓ ↓
Cerebrovascular disease (I60-I69) ↓ ↓
Diseases of the respiratory system (J00-J99) ↓ ↓
Chronic lower respiratory diseases (J40-J44, J47) ↓ ↔
Diseases of the digestive system (K00-K93) ↓ ↓
Chronic liver diseases (K70,K73,K74) ↔ ↓
Diseases of the genitourinary system (N00-N99) ↓ ↔
External causes of morbidity and mortality (V01-Y89) ↔ ↓
Transport accidents (V01-V99, Y85) ↔ ↔
Intentional self harm (X60-X84, Y87.0) ↑ ↔
Cause of deathTrends over past 20 years (1996-2015) 0-64 years
males females
All causes of death (A00-Y89) ↓ ↓
Certain infectious and parasitic diseases (A00-B99) ↔ ↔
Malignant neoplasms (C00-C97) ↓ ↓
Malignant neoplasm of trachea, bronchus & lung (C33-C34) ↓ ↑
Malignant neoplasm of female breast (C50) ↓
Diabetes mellitus (E10-E14) ↔ ↔
Dementia (F01,F03) ↑ ↑
Diseases of the circulatory system (I00-I99) ↓ ↓
Ischaemic heart disease (I20-I25) ↓ ↓
Cerebrovascular disease (I60-I69) ↓ ↓
Diseases of the respiratory system (J00-J99) ↓ ↓
Chronic lower respiratory diseases (J40-J44, J47) ↓ ↔
Diseases of the digestive system (K00-K93) ↓ ↓
Chronic liver diseases (K70,K73,K74) ↔ ↓
Diseases of the genitourinary system (N00-N99) ↓ ↔
External causes of morbidity and mortality (V01-Y89) ↔ ↓
Transport accidents (V01-V99, Y85) ↔ ↔
Intentional self harm (X60-X84, Y87.0) ↑ ↔
Cause of deathTrends over past 20 years (1996-2015) 65+

Mortality Report 2015
National Mortality Registry Page 8
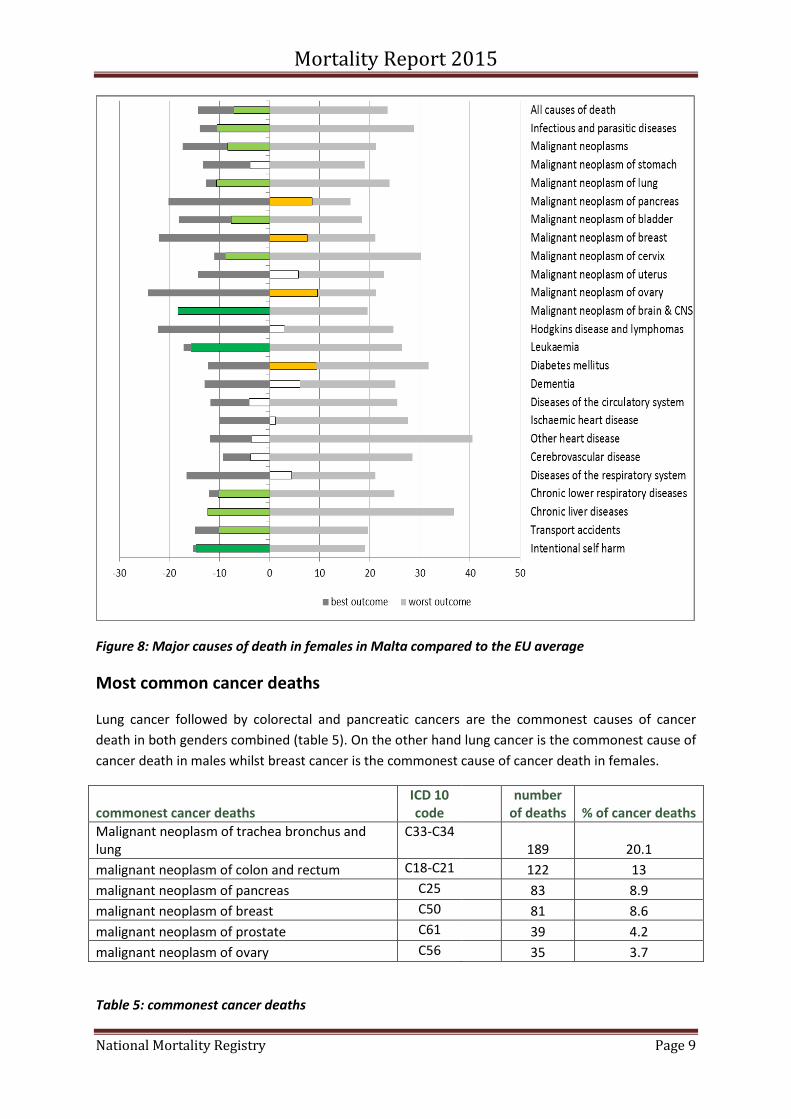
Major causes of death in males and females compared to the EU average
Figure 7 and 8 below show how Malta compares to the EU average as well as to EU
countries with the best and worst outcomes for a number of causes of death. Methodology
used is that developed by the Joint Assessment framework and described in more detail in
the methodology section of this report. The dark grey lines represent the best performing
country for a particular indicator, whilst the light grey lines represents the worst performing
country for the same indicator. Scores for Malta were taken over a 3 year average (2013-
2015) and are shown in light green and dark green for progressively better scores than the
EU average, yellow and red for progressively worse scores than the EU average and white
score for a score which lies around the EU average. For both males and females Malta
scores better than the EU average (green lines) for many of the causes of death. Poorer
outcomes than the EU average were observed for diabetes mellitus in males and females,
Hodgkin’s disease and lymphomas in males, pancreatic cancer in both males and females,
diseases of the respiratory system in males and neoplasms of breast, uterus and ovaries in
females.
Figure 7: Major causes of death in males in Malta compared to the EU average
-30 -20 -10 0 10 20 30 40 50
Intentional self harmTransport accidentsChronic liver diseasesChronic lower respiratory diseasesDiseases of the respiratory systemCerebrovascular diseaseOther heart diseaseIschaemic heart diseaseDiseases of the circulatory systemDementiaDiabetes mellitusLeukaemiaHodgkins disease and lymphomasMalignant neoplasm of brain & CNSMalignant neoplasm of prostateMalignant neoplasm of bladderMalignant neoplasm of pancreasMalignant neoplasm of lungMalignant neoplasm of stomachMalignant neoplasmsInfectious and parasitic diseasesAll causes of death
best outcome worst outcome
Mortality Report 2015
National Mortality Registry Page 9
Figure 8: Major causes of death in females in Malta compared to the EU average
Most common cancer deaths
Lung cancer followed by colorectal and pancreatic cancers are the commonest causes of cancer
death in both genders combined (table 5). On the other hand lung cancer is the commonest cause of
cancer death in males whilst breast cancer is the commonest cause of cancer death in females.
commonest cancer deaths ICD 10 code
number of deaths % of cancer deaths
Malignant neoplasm of trachea bronchus and lung
C33-C34 189 20.1
malignant neoplasm of colon and rectum C18-C21 122 13
malignant neoplasm of pancreas C25 83 8.9
malignant neoplasm of breast C50 81 8.6
malignant neoplasm of prostate C61 39 4.2
malignant neoplasm of ovary C56 35 3.7
Table 5: commonest cancer deaths

Mortality Report 2015
National Mortality Registry Page 10
Commonest causes of death by age group
The relative importance of different causes of death varies in different age groups.
Deaths in children below the age of one year
There were 25 deaths in infants during the year 2015 accounting for 0.7% of the total
deaths. Of these, 16 were male and 9 were female. This was an increase of 4 infant deaths
over 2014. The most important causes of death in this age group were conditions originating
in the early neonatal period such as low birth weight. The next commonest cause of death in
infants was due to congenital anomalies.
The infant mortality rates for Malta was 5.78 deaths per 1000 live births (figure 9), higher
than that of the EU average which was 3.6 deaths per 1000 live births. One reason for this is
that in Malta termination of pregnancy is illegal and therefore infants born with terminal
congenital anomalies may die soon after rather than being aborted during pregnancy and
thereby also raising infant mortality rates.
Figure 9: Trends in infant mortality rate in Malta compared to the EU average
0
2
4
6
8
10
12
infa
nt
mo
rtal
ity
rate
pe
r 1
00
0 li
ve b
irth
s
year
MT EU EU 15
Mortality Report 2015
National Mortality Registry Page 11
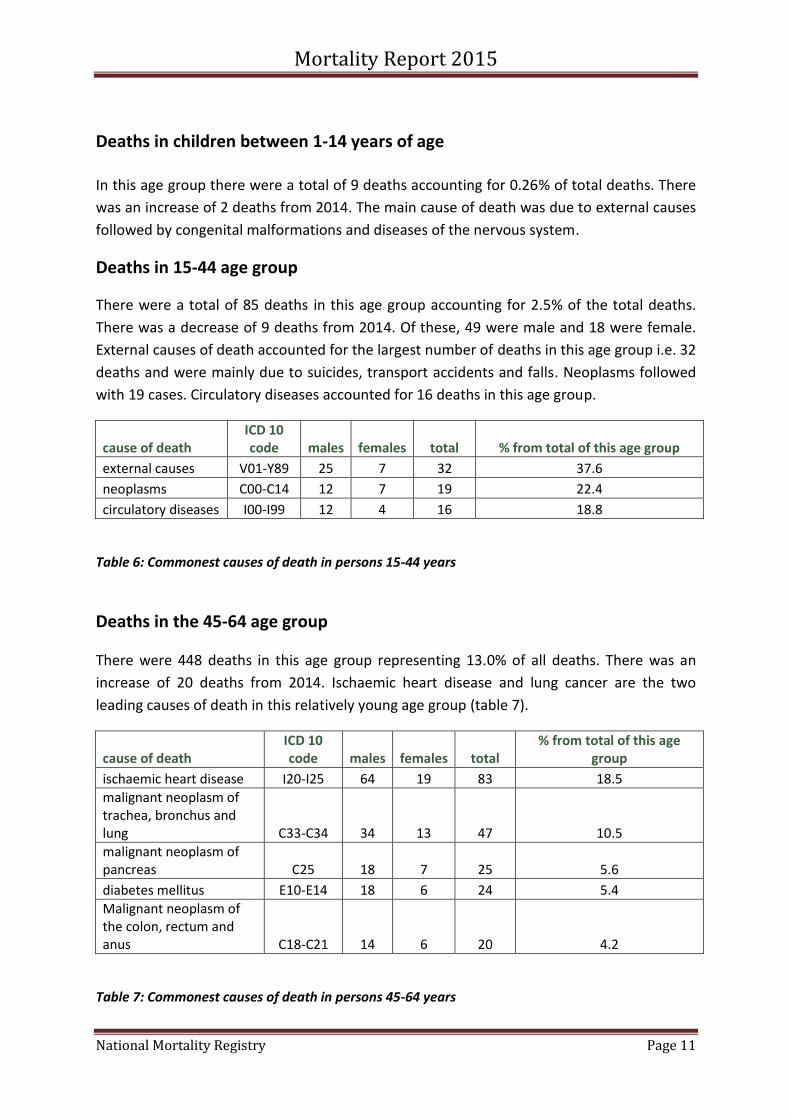
Deaths in children between 1-14 years of age In this age group there were a total of 9 deaths accounting for 0.26% of total deaths. There
was an increase of 2 deaths from 2014. The main cause of death was due to external causes
followed by congenital malformations and diseases of the nervous system.
Deaths in 15-44 age group
There were a total of 85 deaths in this age group accounting for 2.5% of the total deaths.
There was a decrease of 9 deaths from 2014. Of these, 49 were male and 18 were female.
External causes of death accounted for the largest number of deaths in this age group i.e. 32
deaths and were mainly due to suicides, transport accidents and falls. Neoplasms followed
with 19 cases. Circulatory diseases accounted for 16 deaths in this age group.
cause of death ICD 10 code males females total % from total of this age group
external causes V01-Y89 25 7 32 37.6
neoplasms C00-C14 12 7 19 22.4
circulatory diseases I00-I99 12 4 16 18.8
Table 6: Commonest causes of death in persons 15-44 years
Deaths in the 45-64 age group
There were 448 deaths in this age group representing 13.0% of all deaths. There was an
increase of 20 deaths from 2014. Ischaemic heart disease and lung cancer are the two
leading causes of death in this relatively young age group (table 7).
cause of death ICD 10 code males females total
% from total of this age group
ischaemic heart disease I20-I25 64 19 83 18.5
malignant neoplasm of trachea, bronchus and lung C33-C34 34 13 47 10.5
malignant neoplasm of pancreas C25 18 7 25 5.6
diabetes mellitus E10-E14 18 6 24 5.4
Malignant neoplasm of the colon, rectum and anus C18-C21 14 6 20 4.2
Table 7: Commonest causes of death in persons 45-64 years
Mortality Report 2015
National Mortality Registry Page 12
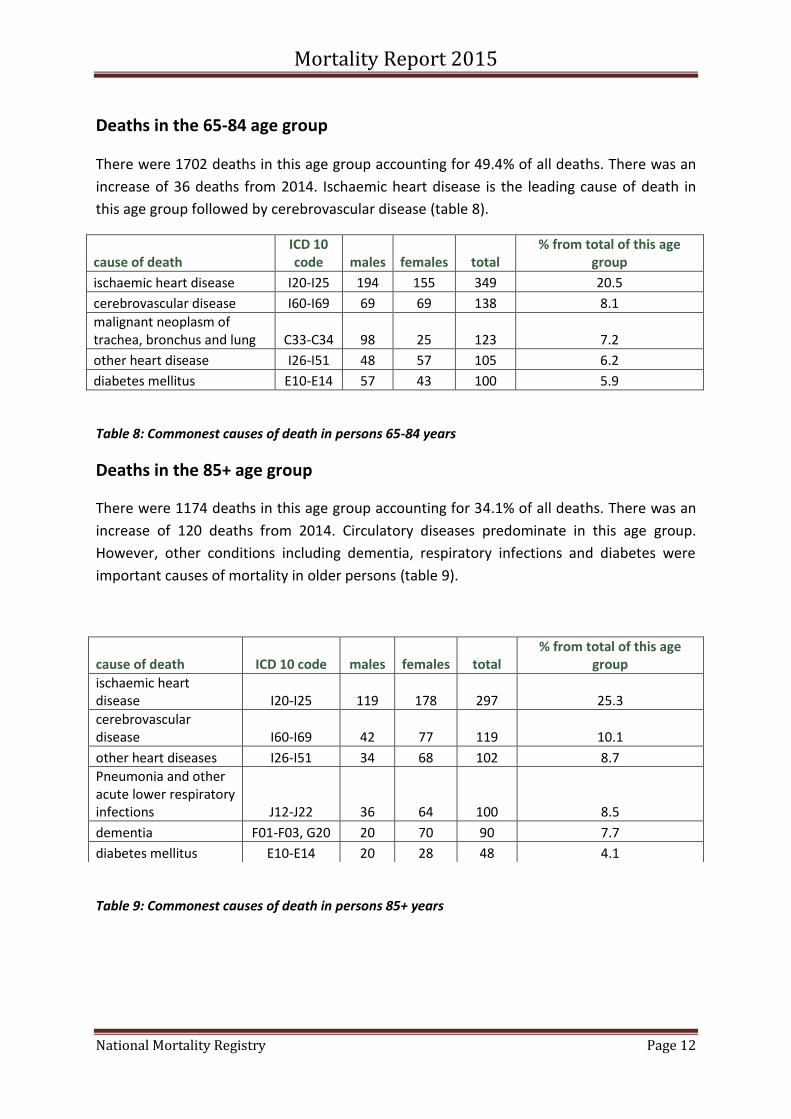
Deaths in the 65-84 age group
There were 1702 deaths in this age group accounting for 49.4% of all deaths. There was an
increase of 36 deaths from 2014. Ischaemic heart disease is the leading cause of death in
this age group followed by cerebrovascular disease (table 8).
cause of death ICD 10 code males females total
% from total of this age group
ischaemic heart disease I20-I25 194 155 349 20.5
cerebrovascular disease I60-I69 69 69 138 8.1
malignant neoplasm of trachea, bronchus and lung C33-C34 98 25 123 7.2
other heart disease I26-I51 48 57 105 6.2
diabetes mellitus E10-E14 57 43 100 5.9
Table 8: Commonest causes of death in persons 65-84 years
Deaths in the 85+ age group
There were 1174 deaths in this age group accounting for 34.1% of all deaths. There was an
increase of 120 deaths from 2014. Circulatory diseases predominate in this age group.
However, other conditions including dementia, respiratory infections and diabetes were
important causes of mortality in older persons (table 9).
Table 9: Commonest causes of death in persons 85+ years
cause of death ICD 10 code males females total % from total of this age
group
ischaemic heart disease I20-I25 119 178 297 25.3
cerebrovascular disease I60-I69 42 77 119 10.1
other heart diseases I26-I51 34 68 102 8.7
Pneumonia and other acute lower respiratory infections J12-J22 36 64 100 8.5
dementia F01-F03, G20 20 70 90 7.7
diabetes mellitus E10-E14 20 28 48 4.1
Mortality Report 2015
National Mortality Registry Page 13
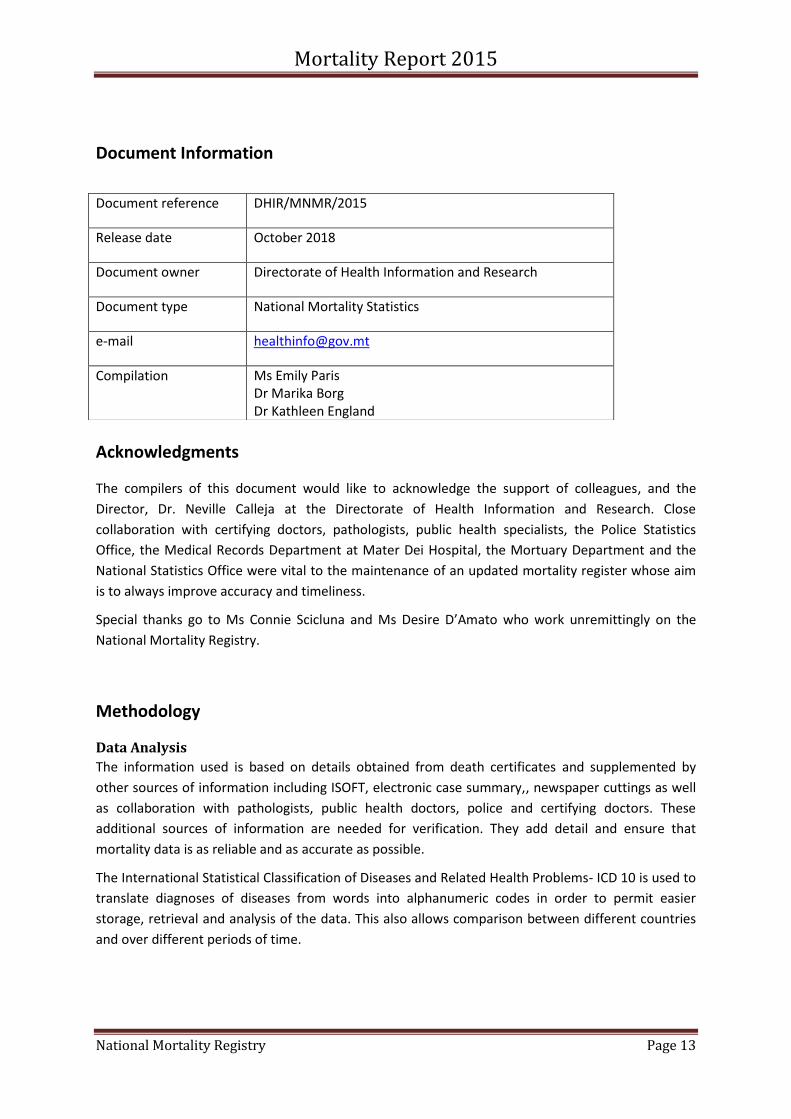
Document Information
Acknowledgments
The compilers of this document would like to acknowledge the support of colleagues, and the
Director, Dr. Neville Calleja at the Directorate of Health Information and Research. Close
collaboration with certifying doctors, pathologists, public health specialists, the Police Statistics
Office, the Medical Records Department at Mater Dei Hospital, the Mortuary Department and the
National Statistics Office were vital to the maintenance of an updated mortality register whose aim
is to always improve accuracy and timeliness.
Special thanks go to Ms Connie Scicluna and Ms Desire D’Amato who work unremittingly on the
National Mortality Registry.
Methodology
Data Analysis
The information used is based on details obtained from death certificates and supplemented by
other sources of information including ISOFT, electronic case summary,, newspaper cuttings as well
as collaboration with pathologists, public health doctors, police and certifying doctors. These
additional sources of information are needed for verification. They add detail and ensure that
mortality data is as reliable and as accurate as possible.
The International Statistical Classification of Diseases and Related Health Problems- ICD 10 is used to
translate diagnoses of diseases from words into alphanumeric codes in order to permit easier
storage, retrieval and analysis of the data. This also allows comparison between different countries
and over different periods of time.
Document reference DHIR/MNMR/2015
Release date October 2018
Document owner Directorate of Health Information and Research
Document type National Mortality Statistics
e-mail [email protected]
Compilation Ms Emily Paris Dr Marika Borg Dr Kathleen England

Mortality Report 2015
National Mortality Registry Page 14
Additional Sources of Data
The National Statistics Office of Malta was the source from which information about mid-year
population 2015 by age group and gender was obtained. WHO Gateway and Eurostat database were
used as a source of data for some of the figures in this report.
Definitions
Crude Death Rate
This is equal to the total number of registered deaths divided by the estimated resident mid-yearly
population of that year multiplied by 1000 (or 100,000). The following mid-year population of 2015
(table 1), provided by the National Statistics Office has been used for this annual report.
Age-Standardised Death/Mortality Rate
The age-standardised death/mortality rate for a particular condition is that which would have
occurred if the observed age-specific death rates for the condition were applied in a given standard
population. The European Standard Population as reported by WHO and Eurostat have been used in
this report.
Mortality Report 2015
National Mortality Registry Page 15