mothers’ participation in paid work: the role of ‘mini-jobs’ · mothers’ participation in...
TRANSCRIPT

Department for Work and Pensions
Research Report No 467
Corporate Document Services
Mothers’ participation in paid work: the role of ‘mini-jobs’Jon Hales, Sarah Tipping and Nick Lyon
A report of research carried out by the National Centre for Social Research on behalf of the Department for Work and Pensions

© Crown Copyright 2007. Published for the Department for Work and Pensions under licence from the Controller of Her Majesty’s Stationery Office by Corporate Document Services, Leeds.
Application for reproduction should be made in writing to The Copyright Unit,Her Majesty’s Stationery Office, St Clements House, 2-16 Colegate, Norwich NR3 1BQ.
First Published 2007.
ISBN 978 1 84712 309 1
Views expressed in this report are not necessarily those of the Department for Work and Pensions or any other Government Department.
Printed by Corporate Document Services.

iiiContents
ContentsAcknowledgements .......................................................................................... ix
The Authors ....................................................................................................... x
Summary ...........................................................................................................1
1 Introduction .................................................................................................5
1.1 The rate of mothers’ participation in paid work ..................................5
1.2 Data sources for the research ............................................................9
1.3 Report structure ..............................................................................12
1.4 Conventions in the presentation of research findings .......................13
2 Mothers’ activity status .............................................................................15
2.1 Rates of participation in paid work ..................................................15
2.2 Role of mini-jobs in accounting for the gap between lone parents and couple mothers .........................................................................16
2.3 Alternative approaches to measuring the rate of participation in work ...............................................................................................22
2.4 The Iacovou and Berthoud research ................................................24
2.5 Discussion of the Iacovou and Berthoud research findings ...............26
2.6 Summary of mothers’ activity status ................................................28
3 Description of mini-jobs .............................................................................31
3.1 FACS wave 7 data ...........................................................................32
3.2 Job characteristics of mini-jobs ........................................................32
3.3 Employer and establishment characteristics .....................................41
3.4 Mother characteristics and mini-jobs ...............................................45

iv
3.4.1 Family characteristics and mini-jobs ..................................45
3.4.2 Age of youngest child ......................................................46
3.4.3 Tenure of accommodation ................................................49
3.5 Work status of mother by income of family .....................................56
3.6 Other differences in demographic profile and circumstances ...........58
3.7 Mini-jobs, other ‘inactivity’ and jobsearch .......................................60
3.8 Mini-jobs and reasons for leaving a job ...........................................63
3.9 Summary ........................................................................................65
4 Patterns of labour market activity over time ...............................................67
4.1 Explaining the data and its structure ...............................................67
4.2 Balanced panel analysis ...................................................................69
4.3 Patterns of activity over time ...........................................................71
4.4 The incidence of mini-jobs ..............................................................76
4.5 Further analysis of main patterns of labour market activity ..............78
4.5.1 Status of mother, tenure and pattern of transition ............80
4.6 Summary .........................................................................................84
5 Analysis of transitions in labour market status ...........................................87
5.1 Analysis of 12-month transitions .....................................................87
5.1.1 Transitions and family status ..............................................89
5.1.2 Transitions and tenure .......................................................92
5.1.3 Factors associated with moving from inactivity to work .....94
5.1.4 Differences in characteristics of couple mothers moving into work ..........................................................................95
5.1.5 Factors associated with the movement away from mini-jobs ...........................................................................96
5.1.6 Movement away from the labour market ..........................96
5.1.7 Movement into work of 16 or more hours .........................97
5.1.8 Conclusions from the analysis of 12-month transitions ......98
5.1.9 Limitations of the 12-month transitions .............................99
Contents

v
5.2 Analysis of the Families and Children Study work history data ........100
5.2.1 Analysis of transitions in the work history data ................101
5.2.2 Factors relating to the length of activity spells ..................104
5.2.3 Analysis of mothers’ movement into work using work history data .....................................................................106
5.3 Summary of key findings ...............................................................108
6 Conclusions .............................................................................................109
6.1 How far does our analysis support the Iacovou/Berthoud argument? ....................................................................................110
6.2 Mini-jobs as a strategy to increase paid work among lone parents .........................................................................................111
6.3 Are mini-jobs a distinct category of work? ....................................114
6.3.1 Employer reasons ...........................................................114
6.3.2 Employee reasons ...........................................................114
6.4 Reaching the target of 70 per cent of lone parents in 2010 ..........115
Appendix A Chapter 5: Tables and details of the analysis .............................117
Appendix B Replicating the multinomial regression analysis of Iacovou and Berthoud (2000) .......................................................................135
References .....................................................................................................141
List of tablesTable 3.1 Respondent status in reference week, for couple mothers and lone parents ..............................................................................33Table 3.2 Banded hours when last paid by current activity status and family type .................................................................................34Table 3.3 Job titles of the most frequently-cited job titles of mothers in 2005 .........................................................................................36Table 3.4 Occupational profile of jobs done as mini-jobs or 16 or more hours per week .........................................................................38Table 3.5 Median hourly take-home pay by hours of work ........................39Table 3.6 Take-home earnings from work last time, by hours worked in reference week ..........................................................................40Table 3.7 Whether the employee job is permanent, temporary or fixed term ...........................................................................................41Table 3.8 Main mode of transport used to get to work .............................41Table 3.9 Number of employees working at the establishment ..................42
Contents

vi
Table 3.10 Whether the employer deducts National Insurance when paying wages ............................................................................43Table 3.11 Number of family-friendly employment practices at the establishment ............................................................................44Table 3.12 Main reasons for leaving previous job ........................................64Table 4.1 Work over five waves of FACS – self-employed hours included ....70Table 4.2 Work history transitions .............................................................77Table 4.3 Classification by the number of months spent in each activity (out of 23) .................................................................................79Table 4.4 Predominant work history pattern by family type and tenure .....80Table 5.1 Personal and work characteristics used in the analysis .................88Table 5.2 Paired transitions of couple mothers ...........................................90Table 5.3 Paired transitions of lone parent mothers ....................................90Table 5.4 Activity transitions of owners in FACS waves 3 to 7 .....................93Table 5.5 Activity transitions of renters in FACS waves 3 to 7 .....................93Table 5.6 Transitions made by couple mothers .........................................102Table 5.7 Transitions made by lone parents ..............................................103Table 5.8 Mean time in months spent in activity spells and transitions made ........................................................................................104Table A.1 Variables used in the analysis ....................................................117Table A.2 Cross tabulations of key variables and whether mother moved into mini-job or other work ......................................................119Table A.3 Factors associated with movement from non-work to a mini-job ....................................................................................122Table A.4 Cross tabulations of key variables and whether mother moved out of work or stayed in a mini-job ...........................................123Table A.5 Factors associated with movement out of work from a mini-job ...................................................................................126Table A.6 Cross tabulations of key variables and whether mother moved into 16+ hours or stayed in a mini-job ......................................127Table A.7 Factors associated with movement into work of 16+ hours from a mini-job .........................................................................130Table A.8 Factors associated with length of time spent in current spell of activity by couple mothers .......................................................131Table A.9 Factors associated with length of time spent in current spell of activity by lone parent mothers .................................................132Table A.10 Factors associated with movement from non-work to a mini-job using Work History data ...........................................................133Table B.1 Estimates from the regression ..................................................137Table B.2 Estimates for probability of moving into work using age bands ......................................................................................139
Contents

vii
List of figuresFigure 1.1 LFS data on employment rate by parental status, 1992 to 2006 ....7Figure 2.1 Profile of labour market status of couple mothers and lone parents in 2005 .........................................................................17Figure 2.2 Age profile of couple mothers and lone parents in 2005 .............19Figure 2.3 Activity status by age band: couple mothers ...............................19Figure 2.4 Activity status by age band: lone parents (age profile as couple mothers) ....................................................................................20Figure 3.1 Number of hours worked per week for reported pay ..................36Figure 3.2 Activity status of couple mothers by age of youngest child ..........47Figure 3.3 Activity status of lone parents by age of youngest child .............48Figure 3.4 Tenure and activity status for couple mothers ..............................49Figure 3.5 Tenure and activity status for lone parents ..................................50Figure 3.6 Comparisons of participation rate by tenure for couple mothers and lone parents ........................................................................51Figure 3.7 Simulating the employment rate of lone parents if their tenure matched that of couple mothers .................................................54Figure 3.8 Participation in paid work by tenure for couple mothers in 1997 and 2005 ..................................................................................55Figure 3.9 Participation in paid work by tenure for lone parents in 1997 and 2005 ..................................................................................55Figure 3.10 Couple mother work status by income quintile ..........................56Figure 3.11 Lone parent mother activity by income quintile ...........................57Figure 3.12 Regional variation in couple mothers’ paid work and mini-jobs ...................................................................................60Figure 3.13 Jobsearch behaviour among those not already working 16 or more hours .................................................................................61Figure 3.14 Reasons given by couple mothers for not planning to get a job of 16 or more hours ...................................................................62Figure 4.1 Couple mothers not working, working as employees or self-employed: March 2000 to September 2005 .........................72Figure 4.2 Lone parents not working, working as employees or self-employed: March 2000 to September 2005 .........................74Figure 4.3 Couple mothers who had worked in a mini-job 1+ months: not working, working as employees or self-employed: March 2000 to September 2005.....................................................................75Figure 4.4 Couple mothers: work history quarters by tenure ........................82Figure 4.5 Lone parents: work history quarters by tenure ...........................83
Contents


ixAcknowledgements
AcknowledgementsThis report has been based on data derived from five of the seven waves of the Families and Children Study (FACS), which was known for the first two years as ‘SOLIF’, the Survey of Low Income Families. The first acknowledgement must be to the respondents in that sample, who participated year after year in a series of survey interviews. The data used in much of the report relates to 4,700 members of the sample, who were interviewed at Wave 7 (2005/06) and had been in the panel from wave 3 (2001) or earlier.
The project has been discussed and developed with the Department for Work and Pensions (DWP) researchers, in particular Rowan Foster and Claire Murphy. Members of the FACS Research Team at DWP, headed by Liz Rayner, have also contributed to the research. Many thanks to those named and their colleagues for insightful comments and helpful criticism.
Valuable comments have been received from Mike Brewer (IFS), Kate Bell (One Parent Families) and Professor Richard Berthoud (University of Essex).
The initial impetus for the study came from an invitation for one of the NatCen authors to present an analysis of FACS to a meeting of DWP and Jobcentre Plus staff in September 2005. Thanks to Nick Murphy of DWP for the invitation.
Finally, the authors are grateful to NatCen researchers, computing and operations staff and interviewers who have worked on FACS.

x The Authors
The AuthorsJon Hales is Director of the Employment, Welfare and Crime research group at NatCen. He was involved in setting up the Families and Children Study (FACS) in 1999. Other relevant research in which he has been involved includes the evaluation of New Deal for Lone Parents and a number of studies of employment practices by organisations.
Sarah Tipping is a Senior Statistician in the NatCen Survey Methods Unit, in which role she has contributed to the design of survey samples and weighting schemes for a number of NatCen’s major projects.
Nick Lyon is a Senior Researcher/Analyst who has worked on the Families and Children Study for several years. As well as having a considerable knowledge of the FACS data, he has been involved in other studies that involved longitudinal analysis of issues such as the persistence of poverty and the consequences of poor housing.

1Summary
SummaryIn late 2005 and early 2006, there was a gap of 15 percentage points in the rate of participation in paid work by mothers, according to whether they lived in a family with a partner or were living as a lone parent. This estimate is based on the UK Labour Force Survey (LFS) and represents the percentages of mothers who reported having worked one hour or more in a ‘reference week’. Around half of this gap reflects mothers in couple families working in jobs where their hours are between one and 15 per week. It is much more common for mothers in couple families to work these hours than it is for lone parents to do so. These jobs are referred to as ‘mini-jobs’ in this report, following the label devised by Iacovou and Berthoud (2000). According to the Families and Children Study (FACS), in autumn 2005, 12 per cent of mothers in a couple family did this type of job, as compared with five per cent of lone parents. This research project developed from a proposal that it would be worth looking at the ways in which the mothers in couple families used these jobs, to see whether it was possible to suggest policy arrangements that might enable more lone parents to increase their participation in paid work by using mini-jobs in a similar way.
Iacovou and Berthoud (2000) had identified a pattern in which mothers moved from not working at all, through a transitional period in a mini-job, to working 16 or more hours per week. They suggested that a gradual transition might suit some people who found it difficult to move directly from not working to a ‘full-time’ job1. Part of the motive for this research was to see whether there appeared to be grounds for thinking that this specific process might suit lone parents who were ‘more distant’ from being able to take up full-time paid work. If so, mini-jobs for
1 In this report, we generally use the term ‘full-time’ to refer to all jobs of 16 or more hours per week, on the grounds that this is the threshold for eligibility for tax credits, and the point where ‘out of work’ benefits such as Income Support (IS) and Jobseeker’s Allowance (JSA) cease to be available. In some part of the analysis, we also distinguish jobs of 16 to 29 hours, which we refer to by the short-hand term of ‘part-time’, in contrast to ‘full-time jobs of 30 or more hours per week’.

2
lone parents might help to close the gap in labour market participation, subject to the policy environment becoming more conducive to this pattern of working.
There are four strands to the report, which reflect four different approaches to the analysis of the role played by mini-jobs within the wider pattern of women’s participation in the labour market. Firstly, we looked at the basis of the observation that a greater percentage of mothers in couples take part in the labour market than do lone parents. Initially, we examined how the rate of participation varies by the age group of the mother. We found that lone parents were younger, on average, than mothers in couples. When we adjusted for this difference, we found that slightly more of the lone parents, around one additional percentage point, would be in work if their age profile matched that of mothers in couples.
Secondly, based on the seventh wave of the FACS, which was conducted in the autumn of 2005, we examined the types of work which mothers were doing, looking at the similarities and differences between mini-jobs and jobs of 16 or more hours per week. We compared the characteristics of the employing establishments and the characteristics of the mothers. As with the age profile, we identified other underlying differences in the demographic characteristics of couple mothers and lone parents. For example, the age of the youngest child in the family was related to the proportion of mothers in paid work.
More significantly, we found that the tenure profile of accommodation ‘explained’ the difference in the overall rate of participation in work. By this, we mean that the overall difference of 15 percentage points in the rate of participation in paid work reflected differences in the profile of tenure. The great majority of mothers in couple families were owner-occupiers, and mothers in these families had a high propensity to be in paid work. Lone parent owner-occupiers also had a high propensity to be in paid work, but they represented only around one-third of lone parent families. About half of the lone parent families were in social-rented accommodation, where around two-fifths of the mothers were doing paid work. Couple mothers in social-rented accommodation had a similar propensity to work, but these represented only one couple family in eight. We found that, if the tenure profile of lone parents matched that of couple mothers, the overall participation rate among lone parents would be over 80 per cent, that is ten percentage points greater than that of couple mothers. This section also included information about jobsearch, constraints on working and reasons for jobs having ended.
Thirdly, we made use of the fact that FACS is a panel study. Since 2001, it has involved detailed annual interviews with a large sample of families with one or more children2. Hence, we have up to five observations of the same families. Some
2 The sample aims to cover all families eligible for Child Benefit in respect of at least one child. That usually includes children aged under 16, although those with a child aged 16 to 18 and in full-time education are also eligible. The study began in 1999, although in this year and in 2000 it was limited to a sample of ‘low income’ families. For this reason, we have not used the data for FACS waves 1 and 2.
Summary

3
of the information collected is retrospective and informs us about the mother’s labour market status each month between March 2000 and September 2005. There were four stages in the way we used this dataset.
• Firstly,forthoseinterviewedonallfiveoccasions,wecodedthemother’sstatusat each of the five interviews and sorted these sequences of five codes to identify those that were most common. Almost half the sample members had spent all five years either in paid work throughout or not working at all. We found a small number of mothers had progressed from not working, to mini-jobs and then to working 16 or more hours per week.
• Secondly,weidentifiedsequencesofactivitiesbasedontheworkhistories.Thismeans the length of time between observations was variable, rather than fixed at around 12 months. While some mothers in the sample had no changes of status, others had up to a maximum of 17 spells. The aim was to look directly at sequences in the activity patterns. This showed that relatively few mothers moved from not working to a mini-job and then to working 16 or more hours per week.
• The third approach used the same data, but we looked at the work statusof mothers at each of 23 points in time, to take better account of changes occurring within each year. Each respondent’s main status was identified for each March, June, September and December, starting in March 2000 and running to September 2005. Overall patterns were coded on the basis of the way time had been distributed between not working, working one to 15 hours per week, and working 16 or more hours per week. Again, spending long periods of time in the same status was found to be the most common pattern. This was also true for those who had done mini-jobs at any time: around half of them had done one or more mini-jobs as a stable pattern of work. Few mothers were found to have progressed from a mini-job to working 16 or more hours per week.
• Fourth, we explored the distribution of time in each activity by mothers indifferent housing tenures. This indicated that the pattern of working was very similar for those in each tenure, whether the mother was in a couple family or was a lone parent.
The analysis outlined so far has the limitation that each characteristic is looked at in turn, although we know there are links between the factors. Chapter 5 of the report uses multivariate analysis to isolate the influence of one characteristic at a time, holding constant the influence of all the others on the patterns of transition. The first stage of this analysis looks at transitions between the five interviews, focusing only on mothers who were in a couple family at all observations. Out of an overall total of 16,000 pairs of observations3, it focused, in turn, on three transitions:
3 Overall, there were almost 25,000 paired transitions. The ones not used in the analysis were mothers who were lone parents or whose family status changed over the five waves of FACS.
Summary

4
• those who were not working and moved into work, comparing those whoworked in a mini-job with those who worked 16 or more hours per week;
• thosewhoweredoingamini-job,comparingthosewhosubsequentlyworked16 or more hours per week and those who continued in their mini-job;
• thosewhoweredoingamini-job,comparingthosewhoremainedinamini-joband those who stopped working.
One general finding was that younger mothers in couples were more likely to change their working status over a period of 12 months4. Older women were more likely to have more stable circumstances. Those older mothers who had a stable relationship and a partner earning a high income were the group most likely to work continuously in a mini-job (or a series of jobs with one to 15 hours) for several years.
A second stage of the paired transitions analysis used the work history data to give a more complete account of shorter and longer spells.
Our principal conclusion is that the apparent gap in the labour market activity rate of women with children, according to whether they live in a couple family or are lone parents, is able to be explained by the different profile of these populations. The families most likely to be in work were those who owned their house or flat. Four in five couple families (80 per cent) were owner-occupiers, as compared with 32 per cent of lone parents. In fact, 91 per cent of lone parent mothers who owned their house or flat were in paid work, compared with 79 per cent of mothers in couple families. At the other extreme, in the case of social renting, 40 per cent of mothers in couples and 38 per cent of lone parents were in paid work. Almost half of the lone parents (44 per cent) were social renters, as compared with 12 per cent of couple families. Few families of either type were private renters or in other circumstances (such as living with relatives). Although couple mothers in social or private rented or in other tenures were slightly more likely to be in work than lone parents, in each case about half of these groups were non-working. Thus the greater proportion of lone parents in these tenures reduced the overall labour force participation rate across lone parent families.
The implication of this for potentially increasing the participation in work of lone parents by encouraging mini-jobs among them is fairly simple. The key factor is whether mini-jobs can be made much more worthwhile for lone parents in social rented accommodation. This suggests changes would be required in Housing Benefit (HB) and Council Tax Benefit (CTB), as well as in rules around earnings disregards by those in receipt of IS or in rules around eligibility for tax credits. If such changes were to be implemented, they might also increase participation in the labour force by mothers in couple families in social rented accommodation.
4 This pattern has been found in various other studies. For example, Evans, M., Harkness, S. and Ortiz, R. (2004) Lone parents cycling between work and benefits, DWP Research Report No. 217.
Summary

5
1 Introduction
1.1 The rate of mothers’ participation in paid work
The extent to which mothers are employed is a key element in a number of policy areas. Two government social policy objectives in which the employment of mothers plays a central role are:
• toincreasetheoverallworking-agelabourforceparticipationratefrom75percent to 80 per cent;
• toreducetheproportionofchildrenlivinginhouseholdswheretheincomeisless than 60 per cent of median incomes of families with children.
The official estimates, based on the UK Labour Force Survey (LFS) for spring 2006, were that 71.4 per cent of mothers in a couple family were in paid work, compared with 56.5 per cent of women single parents5.
Attention has been focused for some years on measures to encourage greater participation in work by lone parents6. The measures introduced have included wider policies such as the National Minimum Wage and in-work financial support for low-income families through tax credits. More specific measures included the New Deal for Lone Parents (NDLP), a voluntary programme of assistance with jobsearch and more general guidance about moving from welfare to work.
5 The LFS shows considerable variation in the overall participation rates between different areas. The highest rates occur in the South East of England.
6 The policy interest in lone parents can be traced back to the 1989 study by Jane Millar and Jonathan Bradshaw, who conducted a major survey of lone parents which was published in 1991 by the Department for Work and Pensions (DWP) as Research Report No 6 Lone parent families in the UK. Since that report, around 100 publications have arisen from DWP-sponsored research about lone parents in Britain. These reports are available at www.dwp.gov.uk/asd
Introduction

6
Another more specific measure was the National Childcare Strategy, which aimed to alleviate a perceived constraint on the ability of lone parents to take up paid work. One reason for the policy emphasis on lone parents is that the rate of child poverty remains relatively high among lone parent families: 43 per cent of children living in poverty are found in lone parent families, although they make up around 25 per cent of families with children.
There is a further official target of achieving a 70 per cent rate of paid work among lone parents by 2010, according to the LFS measure. This may be viewed as a key component of both of the targets mentioned above: the targets on overall working-age labour market participation and on the reduction in child poverty. It may be a coincidence, but 70 per cent was already the rate of participation among couple mothers when the target was set. Another point is that the rates of paid work among lone parents are much higher in some European countries than in Britain. In particular, in Denmark around 90 per cent of lone parents are in work, although this is often linked, by commentators, to greater availability of childcare and the low cost of formal childcare in that country.
While there remains some distance for the targets above to be met, the result of a decade of policies focused on lone parents has been an impressive, and so far sustained, increase in the rate of employment among lone parents. Between 1997 and 2006 there was an increase of 12 percentage points in the employment rate of lone parents, as compared with three percentage points for couple mothers and two percentage points for fathers in couple families (Figure 1.1).
The positive trend in the employment rate among lone parents can be attributed to a combination of favourable factors, including the following:
• economicgrowthandtheavailabilityofjobsinmostpartsofBritain;
• incentivestowork,inparticulartaxcreditswhichweredesignedtobeespeciallybeneficial for lone parents and which have provided a more generous level of payments each time the system has been revised;
• helpwithmakingthetransitiontowork,intheformofNDLP,whichwasrolledout nationally from the end of 1998, and associated measures such as the Adviser Discretionary Fund (ADF) and benefit run-ons;
• theNationalMinimumWage,sincearelativelyhighproportionofloneparentstend to work in low paid jobs, where the Minimum Wage has had its impact.
At its broadest level, this research report is concerned with the issue of the potential for further increases in mothers’ labour market participation. It begins by clarifying what the official estimates of the rate of participation in paid work are measuring. This enables us to identify some of the ways in which the pattern of employment differs between lone parents and mothers in couple families.
Introduction

7
Figure 1.1 LFS data on employment rate by parental status, 1992 to 2006
This report focuses, in particular, on the role of ‘mini-jobs’ for mothers7, that is paid work of one to 15 hours per week. Reasons for the interest in these jobs include:
• theLFSdefinitionofparticipationinthelabourmarketisbasedononehourormore of paid work being reported in the reference week. This is in contrast to some other measures of participation in the labour market that focus on people working 16 or more hours per week either at a single point in time or reported in retrospective accounts of a period;
• of the 14.9 percentage point difference between couple mothers’ and loneparents’ overall rate of participation in paid work in 2005/06, about half was accounted for by differences in the use of ‘mini-jobs’;
• currenttaxcreditspolicydoesnotprovideincentivesforworkingfewerthan16hours per week;
7 The report does not deal with the small proportions of women without children and men who do jobs of under 16 hours per week. All analyses are limited to women aged under 60 in 2005.
Introduction

8
• whileloneparentsinreceiptofIncomeSupport(IS)areallowedtokeepearningsof up to £20 per week (this amount of income from earnings is ‘disregarded’), they are required to report the fact that they have been in paid work and their benefit is withdrawn at a rate of £1 per £1 in respect of earnings in excess of £20 per week. If they receive Housing Benefit (HB) and/or Council Tax Benefit (CTB), a similar situation applies: they are required to report that they have been in paid work and earnings above £25 per week involve deductions from benefit payments. It can be argued that the need to report earnings from work and the potential for suspicion of fraud may act as disincentives for lone parents to engage in any paid work. In this way, the benefit system may inhibit the take up of work for a small number of hours per week, even when the weekly earnings would be within the disregard.
In 2005/06, around 12 per cent of mothers in couple families and around five per cent of lone parents were doing ‘mini jobs’. This appears to be evidence that such jobs are ‘useful’ in some way for the mothers who do them. The main aim of this research is to identify in what ways this pattern of working is appropriate for the mothers involved. If policy measures were adopted that made ‘mini-jobs’ as attractive to lone parents as they are to mothers in couple families, then this could enable a significant group of non-working lone parents to take up work (on the LFS measure), who are not currently given an incentive to do so by the design of tax credits and other benefits. There have been suggestions that tax credits create disincentives for mothers in couple families to increase their earnings, and hence, it could be that the higher rate of working in mini-jobs among mothers in couples may also be partly a reflection of the design of the current system of in-work financial support.
The next step is to consider whether greater use of mini-jobs would appear to make sense for some of the mothers not working at all. An important part of this question is whether a mini-job offers a route into work for the people whose circumstances make this unlikely to occur via the more common route of starting a job working for 16 or more hours per week. Any additional movement by lone parents and couple mothers from being inactive to doing a mini-job would contribute towards the target of increasing participation in paid work according to the LFS measure.
A point to which we devote particular attention is the assertion that ‘mini-jobs’ increase the propensity to move from inactivity into work of 16 or more hours per week. Evidence for this was advanced in a DWP research report by Maria Iacovou and Richard Berthoud (2000), in which these authors coined the term ‘mini-job’ for work of fewer than 16 hours per week. If our research finds support for this hypothesis, it would further strengthen the case for policies to encourage mothers to adopt jobs of this type.
A subsidiary aim of this report is to consider women’s working patterns over time. A key issue that emerges from this perspective is that mothers not currently working have often worked in the recent past, and the great majority of them
Introduction

9
have undertaken paid work at some time in their adult lives. Also, a characteristic of some women’s working patterns is that they are unstable8. This perspective suggests that policies aimed at increasing the employment participation rate need to be directed towards measures that may lengthen some of the shorter working spells and to ensure that gaps between working spells are as short as possible. This approach emphasises the extent to which the rate of participation at a point in time is a product of the rate of movement from work to not working. Of course, there also need to be policies that support the initial move into work by women who have not worked for some years. But these moves into work are only part of the picture. Policies aimed at the lone parents not working at present are not necessarily the most promising option as an approach towards reaching the targets outlined above.
1.2 Data sources for the research
The Families and Children Study (FACS) was initiated by DWP and HM Revenue and Customs (HMRC) in 1999, shortly before the introduction of Working Families‘ Tax Credit (WFTC). The study was designed as a panel with annual interviews and in 2007 the ninth wave of fieldwork is in preparation. Wave 19 was undertaken in summer 1999 and focused on ‘low-income families’, defined as all lone parent families and those couple families whose income was up to 25 per cent in excess of the level at which entitlement to the new WFTC would cease. From wave 3 in 2001, higher-income couple families were included in the study. The sample was initially based on records of Child Benefit (ChB), which has the unique property of being in receipt almost universally, among all families with children. This means the sample is representative of families in Britain10. A feature of FACS is a considerably larger sample of families with children than the British Household Panel Survey (BHPS), which was the source of data used by a number of other commentators on womens’ participation in work over time11.
8 The dynamics of mothers’ working lives were explored in Evans, M., Harkness, S. and Ortiz, R. (2004) Lone parents cycling between work and benefits, DWP Research Report No. 217.
9 The study was called the Survey of Low Income Families (SOLIF) for the first two years, and was renamed in 2001 when it covered all families with children for the first time.
10 Part of the weighting scheme ensures that the achieved sample corresponds to the regional distribution of families in Britain and the weighting also makes allowance for non-response. The weighting provides a longitudinal weight and a cross-sectional weight that aims to ensure that the results are representative of the period in which the data were collected.
11 However, the BHPS started in 1991 and thus, analysts have been able to draw on a longer period of observation, which compensates, to a degree, for the smaller base sizes.
Introduction

10
The panel design of FACS involves following-up the large sample of people previously interviewed. In addition, in each year a much smaller ‘fresh sample’ is added. Part of this represents families that have recently moved from other parts of the country to one of the sample points, and the rest involves families in which a first child has been born. Those families that no longer had a dependent child, usually when the youngest child was no longer in full-time education at age 16 to 19, were ‘aged-out’ of the panel about a year after their entitlement to ChB ceased. These adjustments to the sample aim to ensure that FACS continues to be ‘cross-sectionally’ representative of the population of families in Britain each year.
One of the main topics of the FACS interview is paid work. As well as details of work in which the adult family members may be involved at the time of each interview, the information collected covers the time since the previous interview. This usually means a period of around one year, but it may be two years if the respondent was not interviewed on one occasion. The work history data obtained in this way allows us to look in detail at the extent to which, over time, couple mothers and lone parents participated in different levels of paid work.
There are a number of ways in which this report draws upon the data collected by FACS. Much of the descriptive material is taken from FACS wave 7, for which fieldwork was conducted in late 2005 and early 2006. A criterion for the analysis throughout the report is that all respondents included were part of the achieved sample in wave 7. Another style of analysis uses the ‘balanced panel’, which refers to the part of the sample where the respondents took part in every one of a series of interviews. In this report, we focus on waves 3 to 7. This means that the balanced panel includes people first interviewed in 1999, 2000 or 2001, and then re-interviewed annually up to at least 2005.
A third and somewhat wider basis for analysis is the set of respondents for whom we have a complete work history from wave 3 to wave 7. The work history is available for 4,704 respondents. Given that the initial interview of each respondent covered the work history for at least two previous years, this means, in practice, we have a continuous record of activities between March 2000 and September 2005. Thus the length of the reference period is at least 60 months for all respondents, and what we shall be concerned with is the proportion of these months spent in:
• full-timework(16ormorehoursperweek);
• amini-job(oneto15hoursperweek);
• anyotherstate,someofwhichitmaybeinappropriatetoregardas‘inactivity’.
As well as the cross-sectional analyses based on wave 7 and the longitudinal analysis based on the work history, we also make use of a longitudinal analysis technique named ‘paired transitions’. This is able to use any instance in which the same family was covered in a pair of consecutive interviews. This means it offers the broadest coverage of the FACS longitudinal sample among the approaches we use, and
Introduction

11Introduction
the dataset includes over 24,000 pairs of observations. This analysis focuses on the people in a particular category of activity in the initial year and examines the changes in activity that occurred over a period of 12 months. Those whose activity changed in a particular way may be compared with those who changed to another activity status or to those who remained in the initial activity. In this way, the propensity to have a change in activity can be related to the characteristics of the people involved.
We also apply this analysis technique to the work history data, based on the ‘spell’ of activity and the previous spell. This allows us to look further at patterns of transition, without the artificial constraint of making observations at intervals of 12 months. This enables us to include relatively brief spells as well as recognising that many spells last much longer than 12 months. Thus, the duration of a spell becomes a characteristic of the transition and of the person making the transition.
In the course of interviews, the activity patterns of FACS respondents are classified into a set of categories, as follows:
Periods of paid work are divided into:
• working16ormorehoursperweek;and
• workingfewerthan16hoursperweek.
Periods spent not working but seeking and preparing to work are divided into:
• unemployedandseekingwork;and
• onatrainingscheme.
Other periods spent not working, and not seeking to work in the immediate future, are divided into:
• full-timeeducation,e.g.ataschoolorcollege;
• short-termsicknessordisability(uptosixmonths);
• longer-termsicknessordisability(sixmonthsorlonger);
• lookingafterthehomeorfamily;
• caringforasick,elderlyordisabledperson;
• beingretired;
• anyotheractivitynotcoveredbythesecategories.
These 11 categories are coded giving priority to those at the top of the list. Thus, a mother who is in a training course for one or two days of the week should be coded as doing training, even though her caring responsibilities may occupy her time for seven days of the week.

12 Introduction
The standard set of activity codes is adapted in various ways in this report. In some contexts, we distinguish between people working 16 to 29 hours per week (which may be called ‘part-time’ work) and people working 30 or more hours per week (which may be described as ‘full-time’ work). We also divide those working fewer than 16 hours per week into those doing one to eight hours and those doing nine to 15 hours per week.
1.3 Report structure
In the next chapter, we review the often-cited overall figures for the rate of participation in paid work. The aim is to be clear about what the figures refer to. When we disaggregate the information in different ways, it becomes apparent that the rate of participation in paid work differs appreciably between different groups of mothers. One point is that the rate of participation in paid work changes over the family development cycle. For example, there are considerable differences in this respect between families according to the age of the mother or the ages of the children in the family. The difference in the rate of participation in paid work between couple mothers and lone parents is substantial in some age cohorts and almost disappears in others. Throughout this analysis we shall contrast the situation for lone parents and mothers in couple families.
This background discussion also considers the non-work activities that represent the other side of the coin from paid work. For example, people who state their current labour market status is ‘unemployed and looking for work’ are classified in some other contexts as economically active. However, they are excluded from the count of people participating in the labour market in the official estimates cited above that are derived from the LFS. Those mothers who state they are undertaking an educational or training course are another group whose position is intermediate, at least to the extent that some people who participate in courses are intending to increase their ability to work in future.
The Iacovou and Berthoud analysis of mini-jobs (2002) has been very influential in the literature on women and work. We review how the significance of mini-jobs was identified and the key points of their discussion that led the authors of this report to conclude that mini-jobs should be a focus of policy directed towards workless families. It is worth noting here that other studies that have looked at the issue have sometimes produced supporting evidence and on other occasions have found no evidence for progression into ‘full-time’ work, that is a job for 16 or more hours per week, via a mini-job12.
12 For example, some of the analyses that tested the Iacovou and Berthoud hypothesis were based on the early years of FACS. Kasparova et al. (2003) found evidence to suggest that mini-jobs were associated with a greater probability of a subsequent move to working 16 or more hours per week. Kasparova, D., Marsh, A., Vegeris, S. and Perry, J. (2003) Families and children 2001: Work and childcare Research Report No. 191, Department for Work and Pensions.

13
The third chapter of this report is a descriptive account of mini-jobs, contrasting them with jobs that are done for 16 or more hours per week. As a short-hand, we generally refer to all jobs of 16 or more hours per week as ‘full-time’ jobs. In some contexts, where we distinguish between jobs of 16 to 29 hours per week and those of 30 or more hours per week, we refer to the 16 to 29 hours jobs as ‘part-time’ and those of 30 or more hours per week as ‘full-time’.
The descriptive account identifies what appear to be a number of ‘strategies’ that involve working fewer than 16 hours per week. Part of our aim in this section is to identify the characteristics of the mothers and of the jobs that are associated with transitions between ‘activity statuses’.
The fourth chapter looks at the rate of participation in work across the five survey waves for which we have data in FACS that covers a representative cross-section of families with children. This uses both the relatively straightforward ‘snapshot’ data relating to the annual interviews of FACS respondents, and the month-by-month data on activity status provided by the work history dataset. The principal advantage of this length of observation is that we are able to look at the propensity to be in a state of ‘inactivity’ or in paid work and the extent to which mothers make transitions between these states. This is important to gaining an understanding of mini-jobs, and to clarify whether (and if so how) they act as ‘stepping stones’ between inactivity and spells of full-time work.
The fifth chapter of the report looks in detail at the transitions between labour market statuses. As in the Iacovou and Berthoud report, we focus initially on changes that occur over a period of 12 months between each consecutive survey interview. However, we have extended this analysis to consider each transition between activity states as recorded in the FACS work history. This allows two main additional points to be taken into account in the analysis:
• weareabletoconsiderthetimespentineachmainactivitystatus;
• byincludingspellsthatstartedandendedwithinthe12months,weareabletogive a more complete picture of transitions.
The sixth chapter concludes. We make some tentative suggestions about the policy implications of the research findings presented in the report.
1.4 Conventions in the presentation of research findings
It is important to be aware that the research findings presented in this report are based on surveys that involve sampling in a particular way and varied degrees of success in conducting interviews with sample members. The analyses are based on estimates of the patterns of behaviour among mothers in families with children. Although weighting is intended to ensure the results are representative there is a margin of error around the estimates. Where the analysis is based on wave 7, we use the cross-sectional weight gGrossWt.
Introduction

14
The FACS sample includes some respondents who have not been included in the analysis in this report. Our analysis is based on mothers with co-resident dependent (‘dependent’ in terms of the way ChB is awarded) children and is limited to those aged under 60 at wave 7.
In the tables, estimates of percentages are rounded to the nearest whole number. Cases for which an item of information was missing have been excluded, and as a result the base for the analysis varies slightly from one table to another. Any instance in which the base was less than 50 will be shown in tables by enclosing the figure in square brackets. Non-zero values less than 0.5 per cent are shown in tables as ‘*’.
In most cases, the significance of differences in the analysis has been based on the conventional level of five per cent. Where this is not the case, this is noted in the text.
Additional reports based on FACS and documentation of FACS datasets can be obtained via the website: www.dwp.gov.uk/facs. In the more recent years, both an annual report and a technical report have been compiled for each wave of FACS. A number of additional documentation and guidance materials have also been produced to facilitate further analysis of the datasets. The datasets are available to bona fide researchers through the UK Data Archive.
Introduction

15
2 Mothers’ activity status
2.1 Rates of participation in paid work
The subject of this report is the recent trend in the rate of mothers’ labour market participation in Britain. Our principal focus is on one aspect of this topic, namely the role of ‘mini-jobs’, that is jobs involving work of between one and 15 hours per week. It will be shown that such jobs are a significant factor in the official estimates of the rate of participation by mothers. We are also interested in the potential for future increases in the use of mini-jobs by mothers.
The Government has set a target to achieve an overall increase in participation in paid work from the current rate of 75 per cent to 80 per cent of the ‘working age’ population, defined as people between the age of 16 and State Pension age (SPA). When this target is being discussed, there is often an emphasis on the relatively low rate of labour market participation among lone parents in Britain. Compared with some other European countries, particularly some of the Scandinavian countries, Britain has a relatively low rate of participation in paid work by lone parents. Hence, there is intense interest in the labour market behaviour of lone parents and a separate target to raise the rate to 70 per cent by 2010. This is in the context, moreover, of Britain’s overall rate of working among men and women of working age being one of the highest in Europe13.
A common reading of policy intentions and commentaries on policy options suggests that the current relatively low rate of lone parents’ participation in paid work offers particular scope for increase among this group. This policy aspiration is also supported on the grounds that it would have the merits of reducing dependence on ‘out of work’ benefits and increasing the income of lone parent families. This is the link to the policy targets aimed at eliminating child poverty in Britain by 2020.
13 Given that ‘working age’ is defined as 16 to SPA, the rate of participation in full-time education and its duration is obviously one of the factors involved, as well as rates of unemployment and ‘inactivity’.
Mothers‘ activity status
16
This report focuses on the gap in the rate of participation in paid work between couple mothers and lone parents and tries to account for it, with a particular focus on the current and potential future role of mini-jobs. This focus is justified by two observations, for which evidence will be reviewed in this chapter and later in the report:
• mini-jobsrepresentanimportantpartofthelevelofparticipationinpaidworkamong mothers in couple families, but are less important among lone parents;
• ithasbeensuggestedthatmini-jobsareapredictoroffutureincreasesinhoursworked in paid jobs.
2.2 Role of mini-jobs in accounting for the gap between lone parents and couple mothers
The trend in overall participation rates by those in different family types, according to the UK Labour Force Survey (LFS), has already been presented in Figure 1.1. The cross-sectional estimates from Families and Children Study (FACS) differ slightly from the LFS estimates, and are presented in Figure 2.1. The headline figures from FACS wave 7, which was conducted in late 2005, were that 72.4 per cent of mothers in couple families and 57.7 per cent of female lone parents were in paid work in the reference week. The first of these figures is 1.0 percentage points higher than the LFS estimate for early 2006, and the latter is 1.1 percentage points higher14.
Figure 2.1 shows that a large part of the difference between couple mothers and lone parents is associated with a greater proportion of lone parents stating that their main activity in the reference week was ‘looking after the home and family’. However, lone parents also had higher proportions in all of the remaining non-work activity statuses. These include being ‘unemployed and looking for work of 16 or more hours per week’, ‘attending an education or training course’ and a range of ‘other activities’ that include caring responsibility for an adult, shorter- and longer-term health problems and disabilities.
14 The difference may be associated with a number of reasons. One is that the LFS relies on proxy data, although this is not believed to make a substantial difference to the quality of information. FACS interviews are conducted face to face with the ‘mother figure’ and are subject to weighting designed to make them reflect the demographic profile of Britain; and may be more reliable than those of the LFS as regards the employment patterns of mothers. Another possible factor is ‘ageing’ of the FACS panel members, a point we discuss in Section 4.3.
Mothers‘ activity status

17
Figure 2.1 Profile of labour market status of couple mothers and lone parents in 2005
An important question is whether the differences between couple mothers and lone parents reflect differences in the composition of these groups, or whether a range of other factors underlie the propensity of mothers to work. If, for example, the demographic profiles of the couple mothers and lone parents were identical, such that their age profile, that of their children, their level of education and their soundness of health were very similar, we might have to invoke differences in their motivation to work to explain why fewer members of one group were working than in the other group. Of course, there are differences in context. In particular, in the couple families there was usually a second earner in work. Most of the male partners of the couple mothers were working 16 or more hours per week, and it was their jobs that brought entitlement to tax credits for the family. However, since mothers in couple families tend to take the majority of responsibility for many aspects of caring for their children, it seems best to leave open the possibility that their options and choices about reconciling work and children are not necessarily very different from those of lone parents.
We can illustrate one aspect of these issues by looking first at the age profiles of the couple mothers and lone parents. This is shown in Figure 2.2 and is based on
Mothers‘ activity status

18
FACS 7. If the numbers in the columns are totalled, it can be seen that almost half of the lone parents (46 per cent) were aged under 35. This compares with around one in three (34 per cent) of the mothers in couples.
The difference in the overall rate of participation in paid work is partly the result of differences between different age bands. Figure 2.3 illustrates the variation in the participation in paid work by couple mothers in different age bands. It can be seen that only a minority of couple mothers aged under 25 were in paid work, the estimate being 37 per cent (comprising 31 per cent working 16 or more hours and six per cent working one to 15 hours per week). At the other end of the age range, 79 per cent of couple mothers in the age band 45 to 59 were in paid work. Sixteen per cent of the youngest mothers in couples were in mini-jobs and the rate was similar at 14 per cent among the mothers aged 45 to 59.
Since the proportion of mothers in work is related to their age, and given that far more lone parents are in the younger age bands, where fewer mothers work, it follows that part of the gap between lone parents and couple mothers is associated with the difference in their age profiles. To assess the magnitude of this effect, we can reestimate the overall percentage of lone parents in work, based on the age profile for couple mothers. To illustrate how this works, with just one of the age bands, we increase the proportion of lone parents aged 35 to 39 from 19.7 per cent (337 of 1,713 lone parents) to 24.7 per cent (1,274 of 5,151 couple mothers). When we make this adjustment for all the age bands, the overall rate of participation by lone parents increases from 57.7 per cent to 58.9 per cent. Note that it is only the ‘total’ column that is affected by this adjustment. The other columns are a simple set of estimates from FACS for the proportions of lone parents in each of the main activity categories in each age band. The figures for types of activity for each age band among the lone parents is illustrated in Figure 2.4, with the total adjusted to illustrate the effect of the age profile for couple mothers.
Mothers‘ activity status

19
Figure 2.2 Age profile of couple mothers and lone parents in 2005
Figure 2.3 Activity status by age band: couple mothers
Mothers‘ activity status

20
Figure 2.4 Activity status by age band: lone parents (age profile as couple mothers)
A number of observations about the patterns of working among couple mothers and lone parents can be drawn from the information available in Figures 2.2 to 2.4:
First, we can observe some features of the pattern of working 16 or more hours per week. Couple mothers were more likely to be working 16 or more hours per week (overall, 6.8 per cent more than lone parents). However, looking at various age bands, the difference was very large for mothers aged 30 to 34 (16.3 per cent) and very small for those aged 40 to 44 (1.6 per cent). The difference was also large for the age bands under 25 and 25 to 29. The divergence in the rates of working between lone parents and mothers in couple families could be summed-up as follows: up to age 35, the rate of participation in full-time work was fairly different but after the age of 35 it was more similar.
Secondly, we can observe some patterns in the use of mini-jobs (work of one to 15 hours per week). Couple mothers were more likely to be working in a mini-job. Overall, 6.7 per cent more couple mothers did this, compared with lone parents. This pattern was fairly stable across all age groups. However, the use of mini-jobs among couple mothers was more common among those aged 30 and
Mothers‘ activity status

21
over, although it was still quite common among younger women in couples. Two factors that may explain why mini-jobs are more commonly done by mothers in couple families may be the presence of a working partner in couple families and the ages of children, the latter because the ages of children are likely to be linked to the age of the mother. These factors are among those we consider later in this report.
There are also some interesting patterns among other activity states. An important category is ‘looking after family and home’. This is a ‘residual’ category, which takes lower priority than work, unemployment and training. According to FACS, among older couple mothers and lone parents, the rates were similar – around 16 per cent of those aged 40 and over reported ‘looking after the family and home’ as their main activity. The difference was also fairly small for those aged 35-39 (22 per cent of couple mothers versus 23.4 per cent of lone parents). Among those aged under 25, around 53 per cent of couple mothers and 58 per cent of lone parent mothers reported looking after the family as their main activity. Much of the difference in ‘looking after the home’ was found in the age bands 25 to 29 and 30 to 34. For couple families, the lower rates in these age bands may have been associated with the effect of the partner’s presence for the family’s income from paid work, as well as the influence of the presence of young children on childcare needs.
The activity categories used on FACS and other studies include a range of further types of ‘inactivity’. Across all the age bands, lone parents were more likely than couple mothers to have stated that they were ‘unemployed and seeking work’, and younger lone parents were especially likely to report that they were ‘unemployed’. Across the age bands up to 35 to 39, lone parents were more likely than couple mothers to be in education or training. Lone parents were more likely than couple mothers to have been caring for an adult and/or to have had a health condition, although couple mothers aged under 30 were as likely as lone parents to be classified in one of these activity categories. Among all those aged 30 and over, other activities (‘inactivity’) were more common among lone parents. This appears to be the key reason why the rate of participation in full-time jobs by lone parents aged 45 and over fell slightly below that for couple mothers.
Drawing together these points, we may note the following:
• thepotentialforincreasedinvolvementinpaidworkbycurrentlyinactiveloneparents is probably situated mainly among those aged under 35;
• ifwetreatedunemploymentandeducationor trainingasequivalent topaidwork, that is, as an alternative activity or a preparatory stage leading to work, the discrepancy in the rate of participation in paid work between younger couple mothers and lone parents would be substantially reduced;
Mothers‘ activity status

22
• the use of mini-jobs by couple mothers was less frequent in the age bandsunder 35 than among those aged 35 and over;
• this suggests that the use of mini-jobs by these older mothers in couplefamilies may not have been primarily a response to the need to care for young children.
The patterns of activity among mothers across a series of age bands appear to have some initial policy implications. For example, some policies to promote work, such as the National Minimum Wage, may have a fairly uniform effect across the age bands of mothers. The rate of participation in paid work is already fairly high among both couple mothers and lone parents aged 35 and over. Thus, to the extent that childcare provision is targeted at care of younger children, financial support for childcare and an increase in provision of affordable childcare would appear likely to achieve their main impacts through increasing the availability for work among younger mothers. Because of their interaction with the partner’s work and earnings, tax credits may have rather different incentive effects (and potentially also to have disincentive effects) at different stages in a family’s development.
A further observation is that some mothers appeared to have an ‘attachment’ to specific levels and types of paid work. For example, some mothers worked full-time when their children were young, while others did not work or worked limited hours. For some of them, this appeared to be a long-term pattern, and it appeared to be little affected by the age of any child. The latter pattern appears to be part of the picture of the way mothers in couple families used mini-jobs, since these remained almost as popular among the mothers aged over 45 as they were for the couple mothers aged 30 to 34.
2.3 Alternative approaches to measuring the rate of participation in work
Accepting that the ‘snapshot’ approach is the one adopted by the Office for National Statistics (ONS) and is the international (International Labour Organisation (ILO)) standard for calculating the rate of participation in paid work, we note that the design of the UK LFS would allow different approaches to be taken to the calculation of this statistic. Firstly, the labour market status of each sample member on the LFS is recorded five times over the course of around 12 months. It would appear useful to report the percentage of sample members who were in paid work in any one of the five reference weeks, to give a ’12 month’ snapshot of activity patterns in the population. It would also be useful to know how many of the sample members were in paid work throughout the period, and how many of them combined spells of working with being in other statuses for part of the year15.
15 Of course, there have been analyses of the longitudinal data from the LFS. A recent example is Barham, C. and Begum, N. (2007) Time Series Analysis of the Labour Force Survey longitudinal data sets, in Economic and Labour Market Review, Vol. 1, No 1, January 2007.
Mothers‘ activity status

23
A further approach would be to cover the entire period, rather than the set of five ‘snapshot’ pictures. It is possible to do this sort of analysis using FACS. Those people not in work at the time of the FACS interview are asked whether they have worked in the previous 12 months16. Those people currently in work are also asked when their work started. If that start date does not account for all the time since the previous interview, they are then asked what they were doing prior to their current activity spell. This question is repeated until every month in the period since the last interview has been allocated to one or another of the listed activity categories. Because most of the FACS sample members have been interviewed every year, we can look at the overall pattern of working during a period of over five years.
If we use these FACS data to look at the 12 months prior to wave 7, we find that there was an additional 5.8 per cent of couple mothers and 7.5 per cent of lone parents who had worked in the last year, but were not working in the reference week. On this basis, as estimated by FACS, the overall percentage of ‘working mothers’ in 2005/06 would be 78.2 per cent of couple mothers and 65.4 per cent of lone parents.
One way in which this is relevant for policies to increase rates of workforce participation is that many of the mothers classified as ‘non-working’ in the snapshot picture had worked in the recent past. One implication of this is that the gap to be crossed to achieve the target rate would be reduced if the tendency of these mothers to leave their jobs could be reduced17. In other words, job retention measures and help to re-engage quickly with the labour market can be seen to be of no less importance than measures to encourage those who have not been in work for some years, to take steps towards working again18. This perspective also shows that, among those not working, there is a significant group whose propensity to start working is likely to be high. The question for policy makers is whether it might be useful to adopt policy measures which could encourage this group to move back into work more quickly, or whether efforts of this sort would be ‘deadweight’, that is not likely to produce additional moves into work.
The FACS data also allow us to see how those recently in work had distributed themselves across the various ‘non-working’ categories in the reference week. The current activity of these mothers in the reference week was classified as being
16 In fact, they are asked about the period of time since their last interview, which could be up to 24 months previously.
17 This point was made very effectively by Evans et al. (2005), who estimated job exit rates for lone parents and couple mothers, and showed that lone parents have appreciably higher rates of job turnover (or ‘insecurity’).
18 Of course, in a context of scarce resources, it may be most efficient to target resources on those most likely to represent ‘additional’ employment, rather than on those who may on the whole be better able to achieve a return to work through their unaided efforts.
Mothers‘ activity status

24
unemployed, or in training or education or looking after family, caring or sick. Those in unemployment, education or training would appear to be the ones with a higher propensity to start working.
2.4 The Iacovou and Berthoud research
The term ‘mini-job’ was used by Iacovou and Berthoud in their report ‘Parents and employment: An analysis of low income families in the British Household Panel Survey’ Research Report No. 107, which was published by DWP in 2000. This was based on data from the first seven waves of the British Household Panel Survey (BHPS), that is from 1991 to 1997. As with the estimates cited previously from the LFS and the FACS, the activity status of each person in the BHPS was based on the ‘reference week’ approach.
The period covered by the BHPS data was mostly after the reforms to Family Credit in 1992, one key change at that time being a reduction in the hours of work needed to qualify from 24 to 16 per week. Family Credit had been introduced in 1988 and had addressed some perceived shortcomings with its predecessor, Family Income Supplement. It is worth noting that the early 1990s were a period of economic recession, with a high rate of unemployment and inactivity among groups of people with weaker attachment to the labour market.
The analysis on which Iacovou and Berthoud based their report was derived from around 1,100 couple families with children and around 300 lone parent families, in which there was at least one adult aged under 60 at the first wave of the BHPS. The sample was divided into three groups: The first group consisted of those families in which no adult worked 16 hours or more: these were predominantly families in which no-one was in paid work, but it included families with someone working one to 15 hours per week. This group was labelled, rather incongruously, ‘workless’. The remaining families were divided on the basis of income into ‘low income’ and ‘higher income’. Two different definitions of ‘low income’ were examined, relating to the policy context under Family Credit, which was the tax credit applying throughout the period covered by the BHPS data, and also for the situation under Working Families‘ Tax Credit (WFTC) (which had been introduced in October 1999).
Each BHPS respondent was interviewed each year during the period of seven years, providing a sample of observations adding up to around 7,700 couples and 2,100 lone parents. A striking contrast between these family types was that 75 per cent of the couples were in the ‘higher income’ group while 64 per cent of the lone parents were in the ‘non-working group’. The report discussed the fact that there was a good deal of movement by families between the three groups over the course of the seven years. This finding was based on the sample of 1,126 individuals who were interviewed every year for the seven years under consideration (in this report, we shall use the term ‘balanced panel’ to refer to this category of respondents). Of these, 25 per cent spent one or more years as a ‘non-
Mothers‘ activity status

25
working’ family, including seven per cent who were ‘non-working’ throughout the seven years.
Most of the analysis was based on transitions between two of the annual BHPS interviews, and was thus able to include all families interviewed for any two consecutive years. The base for the analyses of key interest in this discussion was 13,632 pairs of consecutive interviews. Of these, 2,363 families were categorised as ‘non-working’ in the initial year. In the second year, 79 per cent of this group remained ‘non-working’, while 13 per cent (317 cases) had moved to ‘low income’ and seven per cent to ‘higher income’. In other words, an overall total of 21 per cent of the sample had commenced work of 16 or more hours per week in the 12 months following an interview at any time between 1991 and 1996.
The findings reported at this stage of the analysis included both lone parent and couple families within the various income categories. Some of the comments in the report did distinguish between these groups. For example, it was noted that 80 per cent of the non-working lone parents remained non-working in the second year, while fewer of the couple families (66 per cent) did so.
Within the analysis of interest, the key part was concerned with identifying the conditions under which the families moved from being ‘non-working’ to having at least one person working 16 or more hours per week. This analysis brought together data for all families19 with children that were workless at time t, where no adult was aged 55 or over and where the family had been interviewed in year t + 1. Three situations were possible at year t + 1:
• thefamilymayhaveremained‘non-working’;
• anindividualmayhavestartedworking16ormorehoursperweek;
• thefamilystatusmayhavechanged(e.g.aloneparentformedacouple).
These different outcomes were analysed together using a multinomial regression analysis, in which a change of family status was given priority. Those who were observed to have moved into full-time work were those who had remained in the same family type. The results of these two parts of the analysis were presented separately in the report. In effect, therefore, the discussion of transitions from ‘non-working’ to ‘working’ was equivalent to a logistic regression in which family status was the same in year t and in year t + 1. We have replicated this approach to the analysis in Appendix B, based on the FACS data used throughout this report.
It is in this context that the analysis showed the statistically highly significant finding that having a mini-job in year t was associated with increased odds of working 16 or more hours in year t + 1. Moreover, there was also a strong association between working a greater number of hours in a mini-job and the odds of working 16 or more hours the next year.
19 Lone fathers were excluded from the analysis.
Mothers‘ activity status

26
For this review of the report by Iacovou and Berthoud, the key part of their analysis was an examination of all BHPS sample members who had been in a mini-job at any time, regardless of family status, sex or income. This analysis was limited to the under-50s, to avoid any possible tendency for people to adopt mini-jobs prior to full retirement. This showed there were various patterns of behaviour over a series of years. For example, 50 per cent of women and 30 per cent of men observed to be doing a mini-job in the first year had remained in a mini-job in the second year. In the report, this was interpreted as being ‘a stable rather than a transitional state’.
The crucial step in the analysis was based on a sample of 1,030 women who were ‘unemployed’ in year t. It compared the percentage in full-time work in year t + 2 according to whether or not they had been working one to 15 hours per week in year t + 1. While seven per cent of the people who remained ‘unemployed’ in year t + 1 then moved into work of 16 or more hours, 21 per cent of the women in mini-jobs in year t + 1 had then moved into work of 16 or more hours in year t + 2. The analysis also showed that movement from ‘no job – small job – bigger job’ ‘clearly outnumbered movements in the other direction’ (page 43). The authors concluded that ‘for our sample, the mini-job did have a role as a stepping-stone in people’s trajectory from unemployment to work’ (page 44). Another interesting finding was that the move from a mini-job to a full-time job was often associated with a change in industry and/or occupation, rather than being simply a fluctuation in hours worked in the same job.
On the basis of this set of findings, the authors concluded that ‘small part-time jobs might be encouraged rather than discouraged among Income Support (IS) and Jobseeker‘s Allowance (JSA) claimants’ (page 95). They suggested reconsideration of the requirement for claimants to report every change in their earned income and of the withdrawal of benefit in respect of earnings above the level of the disregard. They also suggested that mini-jobs could act as a counterpart to welfare to work measures, with the further advantage of being ‘less invasive of claimants’ independence’.
2.5 Discussion of the Iacovou and Berthoud research findings
Two different analyses were used in reaching these findings: The first stage was the multinomial logistic regression, in which it was found that, controlling for other factors, someone who was already working one to 15 hours per week was significantly more likely to be working 16 or more hours per week a year later, than if she was not working at all in the initial time period. Expressed in this way, the result seems hardly surprising. Indeed, it seems odd to have grouped those working one to 15 hours per week with those not working at all, and to apply the label ‘non-working’ to all of them. We assume this was done on the basis that this is the logic of the benefit system: one set of conditions applies to those working
Mothers‘ activity status

27
16 or more hours per week, who may be eligible for ‘in work benefits’. All the rest are subject to a different set of conditions, namely ‘out-of-work benefits’. Another reason for this grouping may have been the limited sample size.
The second part of the analysis looked at transitions that were observed among the sample members who had done a mini-job in either the initial or second year or both. While the pattern was complex, and many sample members remained in the same state in consecutive years, on balance a slightly greater number of people were found to be moving towards full-time work than had changed status in the opposite direction. However, in this analysis there was no statistical control for differences between the samples. One interpretation of the pattern observed was that the greater employability of the group who did a mini-job in year t + 1 was evidenced by their having already taken a mini-job. This group was defined by their neither having remained non-working, nor that they had already made a transition to working 16 or more hours per week in year t + 1. It seems unsurprising that those non-working in year t + 1 had a lower propensity to move into full-time work than the ‘more employable’ people who were doing a mini-job at that time.
The Iacovou and Berthoud analysis did not make a comparison of the trajectories for mothers in couple and lone parent families. This was presumably a point at which the sample size limited the scope for further disaggregation.
The analysis by Iacovou and Berthoud (2000) has been influential, and has been cited in many studies that have considered policy options for engaging a greater proportion of mothers in paid work. Within the literature, it has become widely accepted that mini-jobs may act as a stepping stone to work of 16 or more hours per week. This proposition was the basis for the current study.
This report re-examines the proposition of Iacovou and Berthoud about the role of these jobs on the labour market behaviour of mothers. The FACS provides a similar but larger data set with which to do so. Our dataset also reflects a somewhat different economic and policy environment. Firstly, from 1999 to 2003, WFTC adapted the basic model of Family Credit; then in April 2003, the New Tax Credits were introduced, with two separate elements: Child Tax Credit (CTC) and Working Tax Credit (WTC). At each stage, these financial measures to support working families on low incomes were more generous than their predecessors. There were also significant differences in the administrative arrangements. In particular, Family Credit and WFTC were payable for six months at a flat rate that had been determined according to the claimant’s situation at the time of claiming. The new WTC was assessed on the basis of expected income for a period of 12 months, usually on the basis of the past year’s income. While this approach was intended to be simpler and more predictable for many recipients of the New Tax Credits, the system introduced a risk that overpayments could occur in situations where an individual’s income from work and other sources turned out to be greater than anticipated.
Mothers‘ activity status

28
One important similarity of the situation between 2001 and 2005 with that during the period of 1991 to 1997 covered by the Iacovou and Berthoud analysis, was that no action has been taken so far to implement their recommendation of policies to encourage mini-jobs to be taken by those in receipt of IS and JSA.
2.6 Summary of mothers’ activity status
In spite of the impressive progress achieved towards targets for increasing the rates of participation in paid work and for reductions in the proportion of children living in poor families, in early 2007 there are signs of anxiety that the targets for 2010 are likely to be missed by some margin20. It may be that the policy environment in 2007 is more conducive to a fresh look at the division that treats 16 or more hours of paid work as ‘work’ and paid work of fewer than 16 hours per week as ‘not work’.
In spite of a large increase in the labour market participation rate of lone parents for over a decade, at the end of 2005 the gap between lone parents and couple mothers remained around 15 per cent. The origin of this study was the observation that a difference in the percentages of mothers doing mini-jobs accounted for a substantial part of the difference in the rate of labour market participation between mothers in couple families and lone parents. The intention was to try to understand the behaviour of the mothers in couples who used these jobs, to see if there were lessons about this pattern of working that might be applied to lone parents. Also, but more implicitly, it was felt that factors such as the withdrawal of IS and fear of falling under suspicion of fraud might inhibit lone parents from taking up such jobs.
The Government’s target of raising the rate of lone parents’ participation rate to match that of mothers in couples appears to be inspired by two points of reference. One of these is the rate of working among mothers in couples in the UK. The other is the fact that in some European countries the rate of participation in work is higher among lone parents than among mothers in couples. An initial comment is that this ignores a difference in the age profile of the two groups in the UK. When the rate of working is looked at within age bands, we find that there is little difference between lone parents and mothers in couples who are aged 35 and over.
We have also pointed out that the ‘snapshot’ rate of participation in paid work in a ‘reference week’ is only one approach to measurement. Looking at the percentage of lone parents who had worked at some time in the last 12 months, there was an increase of 7.5 percentage points in the employment rate for lone parents, taking
20 For example, Gregg, P., Harkness, S. and Macmillan, N. (2006) Welfare to work policies and child poverty – a review of issues relating to the labour market economy, Joseph Rowntree Foundation, have estimated that the lone parent employment rate is likely to reach 65 per cent rather than 70 per cent, by 2010.
Mothers‘ activity status

29
it to 65 per cent. There was also a large increase for couple mothers, of whom 78 per cent worked in the last 12 months.
The original proposal for the current study drew on the proposition, first advanced by Iacovou and Berthoud in 2000, that mini-jobs could act as a ‘stepping stone’ to working 16 or more hours per week, at which point the system of tax credits delivers the Government’s commitment to make sure that ‘work pays’. In this chapter, we have reviewed the evidence put forward by Iacovou and Berthoud, and suggested that the statistical association was a product of the grouping of those in mini-jobs of one to 15 hours with the much larger group of people who were not working at all. While there was clear evidence that some people made these transitions, the BHPS evidence also showed:
• thenumberdoingsowasmodest;
• someofthemwerematchedbypeoplemovingintheoppositedirection;and
• aroundhalfofthosedoingmini-jobshadadoptedthisasastablepatternofwork for a period of two or more years.
In the next chapter we look further at the evidence in FACS for mini-jobs acting as stepping stones.
Finally, this chapter has introduced the FACS, whose data we shall draw upon in the remainder of this report.
Mothers‘ activity status


31
3 Description of mini-jobsThis chapter sets out to describe the characteristics of mini-jobs, both in terms of the kinds of work involved and the characteristics of the mothers21 who engage in them. The information has been drawn from the Families and Children Study (FACS), mainly from wave 7, which involved interviews in autumn 2005. The analysis has been carried out using the cross-sectional weight22. This chapter is intended to act as background for the next two in which we shall look at work trajectories over a period of years and the characteristics associated with transitions between different labour market states.
To anticipate a theme of the discussion in this section, there is a great deal of diversity in terms of the jobs and the situations of the women doing them. However, there are some general ways in which mini-jobs jobs can be distinguished from other types of working. One of the points we are interested in is whether these differences may be associated with the designs of the benefit, tax credit and National Insurance systems, although we have to rely on indirect evidence of this.
One element that is missing from the discussion is the exact pattern of hours worked per week, which is not recorded on FACS. This means we are unable to differentiate between women whose mini-job involved an hour or two of working every day from Monday to Friday, as compared with those who worked for one, two or three days with a more ‘standard’ working day. Although FACS provides no evidence to substantiate the assertion, it seems likely to be the case that some mini-jobs involve working ‘atypical hours’, that is evening work, shift work or working during the weekend. However, when we consider the job titles of the work most often done by mothers, we shall find a common pattern of making the mother’s working day align with the school day and in some cases, with school terms as well.
21 Although some men do mini-jobs, we are not concerned with their situation in this report.
22 Cross-sectional and longitudinal weights are explained in the FACS Technical Reports, e.g. (Lyon, N., Tait, C. and Scholes, S. (2006) Families And Children Study 2005, Wave 7 Technical Report, National Centre for Social Research, London.
Description of mini-jobs

32
3.1 FACS wave 7 data
The analysis in this chapter is based on the current or most recent spell of paid work in the last 12 months for mothers23 in the FACS sample at wave 7. The analysis is based on those aged under 60, of whom there were 5,191 couple mothers and 1,665 lone parents (unweighted totals were 5,032 and 1,826).
Families and Children Study is a refreshed panel, to maintain its cross-sectional representativeness. Given this, it is important to appreciate the composition of the wave 7 sample. Overall, 62 per cent were already members of the sample in waves 1, 2 and/or 3. Just over a quarter (26 per cent) were in-movers, new families or ‘re-entries’, the last of these being families that had missed one of the recent waves, between waves 4 and 6, but which were then participants in later waves, including wave 7. Only 12 per cent were being interviewed as ‘fresh sample’ at wave 7. Of these, over half were ‘new families’ (54 per cent), 35 per cent were in-movers and 11 per cent were ‘re-entries’ from the refreshment samples of an earlier wave (but who had not been in the wave 6 achieved sample).
Detailed questions are asked about current jobs and, for those not working, their most recent paid job. Those respondents who had several brief spells of employment in the last year were additionally asked for each previous spell of work about whether they were an employee or self-employed at that time, about their take-home pay and whether they were in receipt of Income Support (IS) or Jobseeker’s Allowance (JSA) while they were in the job. This information is used for the work history, but is not drawn upon in this part of the report.
3.2 Job characteristics of mini-jobs
The current labour market status of FACS respondents is identified by asking the respondent to choose one of the options shown on a card, using the rule that items towards the top of the card take precedence. The question asks them to define their ‘main’ activity in the reference week, which is defined as ‘the seven days ending last Sunday’. While this question is generally simple to answer for respondents who are working 16 or more hours per week or who are not working at all, there may be some uncertainty among people in some of the intermediate categories, such as those working one or two days per week, who also undertake training for some time each week or who have family responsibilities ‘seven days per week’. A second source of a possible discrepancy in the dataset is that the information about the hours worked relates to the hours on which the reported pay was based, and this may refer to a different week. Given the structure of the data, this report will rely primarily on the first way of defining the labour market
23 The analysis is limited to cases where the mother was also the FACS ‘main respondent’. There were (weighted) 44 cases of couple families in which the male partner was the ‘main respondent’. A further 81 male lone parents and their families are also excluded from the analysis.
Description of mini-jobs

33
status of the respondent, and the second is used where we are dealing with pay and earnings.
On this basis, the numbers (and summary percentages) of mothers in each labour market status in FACS wave 7 (2005), in the reference week prior to interview, were as shown in Table 3.1.
Table 3.1 Respondent status in reference week, for couple mothers and lone parents
Status in reference week for FACS 2005 Couple mothers Lone Parent
Working 16 or more hours 3,138 881
Working 1-15 hours per week 618 82
Unemployed and seeking work 71 86
On a training scheme 5 9
Full-time education/at school 51 32
Sick/disabled (up to six months) 2 8
Sick/disabled (six months or longer) 91 60
Looking after the home or family 1,166 473
Caring for a sick, elderly or disabled person 23 18
Retired 3 0
Other 23 16
Total 5,191 1,665
% %
Working 16 or more hours per week 60.5 52.9
Working 1-15 hours per week 11.9 4.9
Unemployed, in training or education 2.4 7.6
Sick, family/home, caring or retired 24.8 33.6
Other activities 0.4 1.0
Table 3.2 shows a breakdown of the hours of paid work as reported during the discussion of job details, where the question asked was specifically in relation to the hours worked for the stated amount of pay on the last occasion when paid.
Description of mini-jobs

34
Table 3.2 Banded hours when last paid by current activity status and family type
Full-time job Mini-job Unemployed/ Family/ 16+ hours 1-15 hours training other Total % % % % %
Couple mothers
1 to 7 hours 0 21 8 6 4
8 to 15 hours 1 74 13 14 12
16 to 29 hours 50 5 39 31 42
30 hours or more 49 1 39 48 42
Total 100 100 100 100 100
Weighted base 2,900 537 61 221 3,719
Row percentage 74 14 2 6 100
Lone parents
1 to 7 hours 0 52 (6) 8 5
8 to 15 hours 1 41 (8) 14 5
16 to 29 hours 49 5 (56) 39 45
30 hours or more 50 1 (31) 38 45
Total 100 100 100 100 100
Weighted base 833 75 36 84 1,028
Row percentage 81 7 4 8 100
Base: FACS wave 7 (2005): Female respondents aged under 60 who had worked in the period since Wave 6.
It has already been seen that it was more common for couple mothers to be doing mini-jobs. A significant finding about the hours worked in mini-jobs is that for couple mothers, there were nearly four who worked eight to 15 hours per week for every one who worked one to seven hours per week. Among lone parents, it was almost equally common to be working one to seven hours per week as to be working eight to 15 hours per week, although relatively few lone parents did this at all24.
Given the significance of the exact number of hours worked for the systems of out-of-work and in-work financial support, Figure 3.1 shows the hours reported
24 While there is the possibility that some of the 30 lone parents in this group were working and in receipt of IS at the same time, this is difficult to establish definitively with the data in FACS, due to some uncertainty about exactly which activities coincided in time.
Description of mini-jobs

35
by all those who were working at the time of the interview in autumn 2005, or who had been working in the previous 12 months. The values for couple mothers have been made negative, to separate the two data series, and the data have been truncated at 40 hours, although some mothers reported more hours than this. Figure 3.1 indicates that there was a particular tendency for lone parents to be working exactly 16 hours per week (125 cases of the 346 lone parents working 16 to 23 hours per week). The other more commonly reported hours per week for lone parents were 37 (111 cases, actually 37.5 hours in some cases) 30, 25 and 20.
Although a greater proportion of lone parents worked one to eight hours per week, the number of couple mothers doing so was considerably greater. With couple mothers it was also common to be working 16 hours per week, but a considerable number (140 cases) reported working 15 hours, which may have been two standard 7.5 hour-days. Couple mothers who worked ‘full-time’ were also very likely to report a 37 hour (or 37.5 hours) working week.
An additional point regarding working hours is that some mothers did a second job. However, this was fairly unusual, accounting for seven per cent of couple mothers whose main job was 16 or more hours per week and five per cent of the couple mothers in mini-jobs. The corresponding percentages for lone parents were six and five, respectively. On this evidence, there appeared to be no relationship between mini-jobs and the likelihood of having a second paid job, and hence, we make no further reference to second jobs.
Table 3.3 lists the most frequently-cited job titles for mothers working 16 or more hours per week and for those doing mini-jobs. The most interesting point about this is the substantial overlap between the lists. A second point is the gender-specific nature of many of these jobs, with a theme of caring for children in a fair proportion of cases. A related point is the way that many of the most popular jobs are in education, where the mother’s working arrangements fit well with the school holidays as well as with the school day.
The specific occupations in which those doing mini-jobs were most often engaged included education assistants (playgroup, nursery, classroom and lunch staff), sales assistants and shelf-fillers, kitchen staff and waitresses, office clerical staff, cleaners and care assistants. The more qualified people working in mini-jobs were most often in nursing and nursery or primary teaching posts.
Description of mini-jobs

36
Figure 3.1 Number of hours worked per week for reported pay
Table 3.3 Job titles of the most frequently-cited job titles of mothers in 2005
Most frequently-mentioned job titles Working 16 or Mini-jobs of more hours one to 15 hours (Number) (Number)
Nurse 231 16
Sales and retail assistants 202 54
Education assistant 192 37
Care assistant 178 16
General office assistant 159 34
Accounts, wages clerks 127 32
Primary and nursery teachers 108 14
Counter clerks 78 7
Cleaners, domestics 78 51
Secondary education teachers 77 3
Kitchen and catering assistants 77 31
Those mothers working 16 or more hours per week also tended to occupy the same sorts of occupations. However, a higher proportion of these jobs were at a rather higher skill level. For example, while ‘education assistants’ was the largest category among those working in education, there was a much larger number of mothers working 16 or more hours per week who were teaching in secondary
Description of mini-jobs

37
schools and colleges of further education. There was also a large number of nurses among those working 16 or more hours per week.
There was much in common in the profile of occupations for mothers. At least among the most popular jobs, there appeared to be no barrier to increasing the amount worked per week beyond 16 hours. That is, many of the mothers could remain in the same field of work and could be working in a mini-job or 16 or more hours. However, there was evidence of an association between full-time work and higher-skilled occupations. It seems plausible that employers expected their higher-skilled employees to be available for a ‘standard’ working week. As the converse of this employer preference, it may be also that some employers preferred some of their less-skilled employees to do a smaller number of hours per week. While mini-jobs spanned the whole of the occupational spectrum, they were more likely to be found among less-skilled types of work.
Table 3.4 summarises the overall occupational profile of the current or most recent jobs done in the last year by FACS sample members. In general terms, around half of the lone parents and couple mothers working 16 or more hours, that is the groups in the first and third columns, were employed in ‘intermediate’ occupations. Those working 16 or more hours per week were more likely to be in high-skill occupations (managerial, professional and associate professional), although this was considerably less common among lone parents (32 per cent) than among mothers in couples (45 per cent).
Those working in mini-jobs had a markedly different occupational profile. Among couple mothers, almost a quarter (23 per cent) were in low-skilled occupations (defined as elementary and operative occupations), as compared with 22 per cent in high-skilled occupations. However, lone parents doing mini-jobs were very much more likely to be in low-skilled occupations. Over half of them (55 per cent) were in these jobs, and it was unusual for them to be doing high-skilled jobs (11 per cent).
Description of mini-jobs

38
Table 3.4 Occupational profile of jobs done as mini-jobs or 16 or more hours per week
Couple mothers Lone parents
One to One to Standard occupation 16 + hours 15 hours 16 + hours 15 hours classification % % % %
Managers and senior officials 11 4 7 1
Professional occupations 13 8 7 6
Associate professional and technical occupations 20 10 17 4
Admin and secretarial 21 22 21 8
Skilled trades 2 2 2 2
Personal services 16 18 19 11
Sales and customer services 8 13 12 12
Process, plant and machine operatives 2 1 2 4
Elementary occupations 7 22 12 52
Weighted base 3,139 619 883 83
The information presented in Table 3.4 reflects a well-established distinction between the typical skill levels of lone parents and couple mothers, which is partly a reflection of different levels of educational and vocational qualifications.
The occupational levels were associated with varying levels of hourly pay. In Table 3.5, these are shown as the median reported rates, since this central measure is less susceptible than the mean to extreme values in the data (although, in most cases, the mean and median were similar in value). Limited numbers of cases affect the extent to which we can disaggregate some of the groups of mothers, so the occupational levels have been reduced to the three summary categories outlined above.
As we would expect, the variations in skill level were reflected in differences in hourly pay. Those couple mothers and lone parents doing ‘low-skilled’ work had earnings around the level of the statutory Minimum Wage25. There was no evidence that those doing mini-jobs received consistently lower hourly wages than those working full-time.
25 Note that the figures in Table 3.5 are an ‘hourly take-home pay’, rather than the ‘gross hourly pay’, although these may not differ appreciably among those working low numbers of hours in low paid jobs.
Description of mini-jobs

39
Table 3.5 Median hourly take-home pay by hours of work
Couple mothers Lone parents
One to One to Median hourly rate to pay 16 + hours 15 hours 16 + hours 15 hours
Higher skilled £9.28 £8.65 £8.12 (*)
Intermediate £5.94 £6.00 £5.50 (£4.90)
Lower skilled £5.07 £5.34 £5.06 (£4.95)
Weighted base – higher skilled 1,396 135 277 (8)
Weighted base – intermediate 1,473 341 475 (28)
Weighted base – lower skilled 271 143 130 (46)
Note: * indicates there were too few cases for a median to be calculated.
The figures presented in Table 3.5 were derived from the earnings data given by respondents. They were asked to report their total pay, and this figure has been divided by the period of weeks to which it relates and the number of hours usually worked per week. Another way in which mini-jobs differed from full-time jobs was that a substantial majority of the former were paid on the basis of an hourly rate. Of those doing mini-jobs in 2005, 71 per cent were paid an hourly rate, compared with 48 per cent of those working 16 hours or more per week.
Table 3.6 summarises the reported levels of weekly take-home pay. The information relates to the ‘usual take-home pay’ and hence, may not correspond exactly to the status of the individual in the reference week. What is striking about the levels of earnings from mini-jobs is that a substantial proportion of those doing these jobs were taking home, as earnings, less than fifty pounds per week. This applied to around half the couple mothers and two-thirds of the lone parents. This difference by family type is likely to reflect the fact that half of the lone parents were working one to seven hours per week, while only one in five of the couple mothers did jobs of this sort. A further point is that more of the lone parents doing mini-jobs were paid a wage close to the National Minimum Wage.
Description of mini-jobs

40
Table 3.6 Take-home earnings from work last time, by hours worked in reference week
Couple mothers Lone parents
One to One to Banded usual 16 + hours 15 hours 16 + hours 15 hours take-home pay % % % %
Under £25 * 7 1 32
£25 to £49 2 35 5 44
£50 to £99 6 16 12 4
£100 to £149 20 15 21 6
£150 to £199 17 6 16 2
£200 to £300 24 4 21 2
£300 to £400 12 1 10 -
£400 to £500 6 * 3 -
Over £500 5 1 3 -
Not stated (or none/not yet paid) 8 16 7 10
Weighted base 3,139 620 883 82
Note: Table includes self-employed.
It will be seen later that mini-jobs were not necessarily either short-lived or transitional between other labour market states. Table 3.7 shows the way respondents answered a question about whether their job was ‘permanent’ or not. If it was not a permanent job, they were asked to classify their job as either temporary or fixed-term. Respondents were expected to choose one of the terms according to their own interpretation. Interviewers were provided with the definitions shown in Table 3.7, although they mentioned these only if the respondent asked for clarification. Of course, it will be found that some ‘permanent’ jobs had lasted a shorter time than many temporary and fixed-term posts. The distinction was essentially based on whether the duration had been determined when the job started. The significance of this information is that employers may differentiate between their ‘permanent staff’ and others in terms of employment practices.
It can be seen that the great majority of jobs done for 16 or more hours per week were perceived as permanent, while temporary and fixed-term working was somewhat more common for those doing mini-jobs. However, even with mini-jobs, a clear majority of the employees had open-ended contracts of employment. A quarter of lone parents in mini-jobs and 15 per cent of couple mothers in mini-jobs stated that their jobs were fixed-term or temporary.
Description of mini-jobs

41
Table 3.7 Whether the employee job is permanent, temporary or fixed term
Couple mothers Lone parents
One to One to Whether the job is 16 + hours 15 hours 16 + hours 15 hours permanent or temporary % % % %
Temporary (less than 12 months) 3 9 5 20
Fixed-term (one to three years) 3 6 4 5
Permanent (no known end date) 94 84 90 75
Weighted base 2,900 535 832 75
Given that a majority of the jobs were ‘open-ended’ it is interesting to see how the hours worked related to the main mode of transport used by the respondent. Table 3.8 shows the predominance of motor cars or vans as the main mode of travel to work. However, lone parents were less likely than couple mothers to have used privately-owned vehicles and were much more likely to use public transport or walk or cycle to work. This probably indicates that their jobs were often local to their homes. It can also be seen that a higher proportion of mini-jobs were located at the home of the person, although this was not a common arrangement. Jobs involving very little travel would be more suitable for someone whose working pattern involved a few hours each working day. Those working a small number of ‘standard days’ might well have been more likely to travel a greater distance.
Table 3.8 Main mode of transport used to get to work
Couple mothers Lone parents
One to One to Main mode of travel 16 + hours 15 hours 16 + hours 15 hours to work % % % %
Works at home 2 5 1 4
On foot or bicycle 12 23 15 36
Private car or van 76 67 67 45
Public bus, train or tram 10 5 17 12
Weighted base 2,899 535 832 75
Note: Other less common modes of travel to work not shown.
3.3 Employer and establishment characteristics
This section turns to characteristics of the employing organisation, excluding the cases of individuals in the FACS sample who were self-employed at wave 7. Table 3.9 indicates that women doing mini-jobs were more likely to be employed at small establishments than women working 16 or more hours per week. It seems
Description of mini-jobs

42
likely that the places of work for women doing mini-jobs were often both smaller establishments and smaller organisations.
Table 3.9 Number of employees working at the establishment
Couple mothers Lone parents
One to One to Number of employees at 16 + hours 15 hours 16 + hours 15 hours establishment % % % %
1 – 9 17 30 17 41
10 – 24 18 20 19 17
25 – 499 45 40 48 32
500 or more 20 10 16 7
Weighted base 2,900 535 832 75
Table 3.10 shows the proportion of respondents who reported that their employer deducted National Insurance when paying their wages. Half of the couple mothers doing mini-jobs and almost three-quarters of the lone parents doing mini-jobs reported that their employer paid their wages ‘gross’, that is without making deductions for Income Tax or National Insurance26. Those doing full-time jobs almost always had deductions for National Insurance (and usually for Income Tax as well) when they received their pay.
This finding reflects the low hours worked for those in mini-jobs, as well as the low rates of pay that typically applied to these jobs. This was one of the most distinctive features in the comparison of the terms of employment between mini-jobs and full-time jobs. It is treated in this discussion as a characteristic of the employing organisation as it seems likely to be a deliberate strategy by the employer. On one hand, it allowed the employer to minimise the amount of administrative effort involved in employing a workforce. It also meant that the employer was usually not liable to pay the employer National Insurance contributions in respect of employees doing mini-jobs. These factors could be important in helping to explain the availability of mini-jobs. They have the important implication for the employee that no entitlement to contributory benefits (or the State Pension) is gained for weeks in which National Insurance contributions are not being made. In addition, earnings from mini-jobs are usually not subject to Income Tax, since personal allowances cover the first £97 per week of income.
26 In 2005, the primary threshold for National Insurance contributions was around £100 per week. Table 3.6 indicated that it was rare for someone doing a mini-job to be earning more than that amount per week.
Description of mini-jobs

43
Table 3.10 Whether the employer deducts National Insurance when paying wages
Couple mothers Lone parents
One to One to Whether employer deducts 16 + hours 15 hours 16 + hours 15 hours National Insurance % % % %
Yes 96 48 89 25
No 4 51 10 72
Not sure * 1 1 3
Weighted base 2,899 533 833 76
FACS respondents who were working or who had worked in the past year were asked a series of questions about whether their employer offered certain ‘family-friendly’ practices. These were defined as:
• part-timework,‘allowingmetoworkfewerdaysperweek’;
• part-timework,‘allowingmetoworkfewerhoursperday’;
• flexi-time,‘allowingmetochoosewhentoworkmyrequiredhours’;
• workingfromhome,atleastsomeofthetime;
• job-sharing,‘wherepart-timersshareonefull-timejob’;
• paidtimeoffwhenchildrenareill;
• unpaidtimeoffwhenchildrenareill.
Thus, there was a maximum of seven ‘family-friendly’ practices that were covered by the questions. The information is summarised by looking at the number of these practices that employers were reported as offering. Table 3.11 indicates that the number of family-friendly practices tended to be greater at establishments employing mothers in work of 16 or more hours. As seen with other aspects of mini-jobs done by lone parents, their employers were less likely than employers of couple mothers to offer any of the family-friendly practices. However, part of this may be associated with the size of the organisation, as there is generally a direct correlation between having a larger workforce and making more provision for diverse needs among the workforce27.
27 The Department for Trade and Industry (DTI) series of work-life balance surveys show a relationship between size of organisation and the range of family-friendly employment practices. Another recent report confirming this pattern, and based on WERS 2004, is Nadeem, S. and Metcalf, H. (2007) Work-life policies in Great Britain: What works, where and how?, Employment Relations Research Series No. 77, Department of Business, Enterprise and Regulatory Reform.
Description of mini-jobs
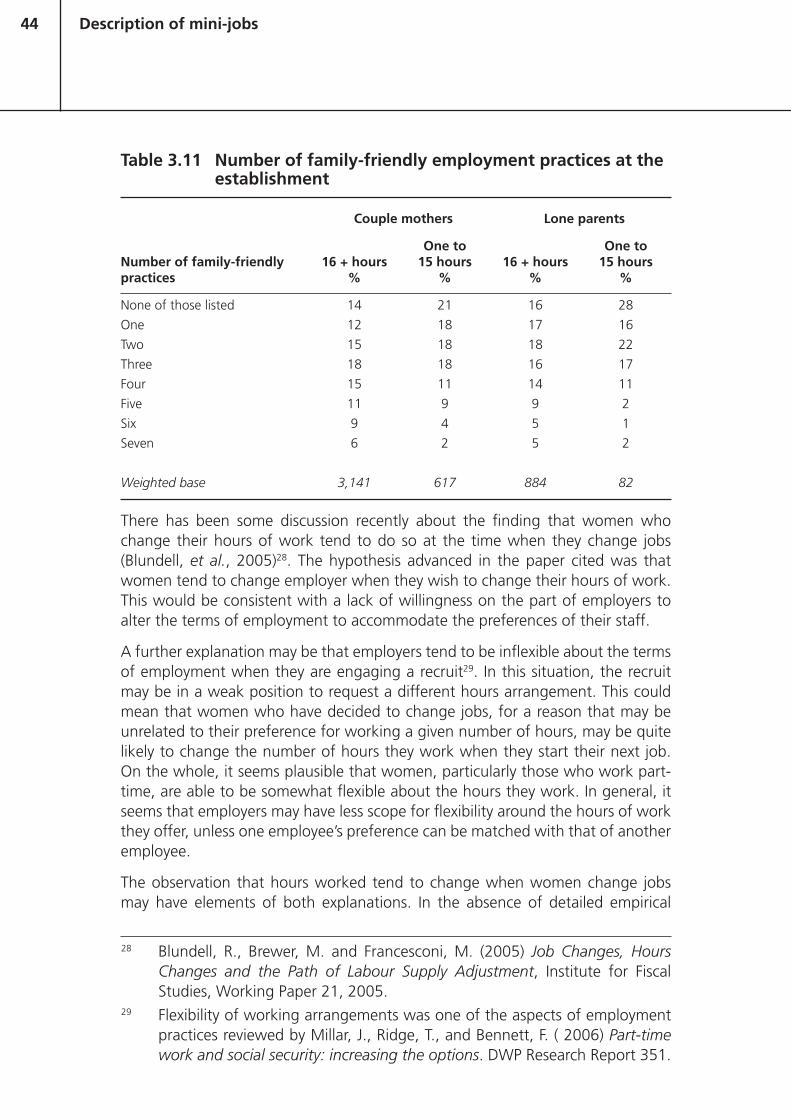
44
Table 3.11 Number of family-friendly employment practices at the establishment
Couple mothers Lone parents
One to One to Number of family-friendly 16 + hours 15 hours 16 + hours 15 hours practices % % % %
None of those listed 14 21 16 28
One 12 18 17 16
Two 15 18 18 22
Three 18 18 16 17
Four 15 11 14 11
Five 11 9 9 2
Six 9 4 5 1
Seven 6 2 5 2
Weighted base 3,141 617 884 82
There has been some discussion recently about the finding that women who change their hours of work tend to do so at the time when they change jobs (Blundell, et al., 2005)28. The hypothesis advanced in the paper cited was that women tend to change employer when they wish to change their hours of work. This would be consistent with a lack of willingness on the part of employers to alter the terms of employment to accommodate the preferences of their staff.
A further explanation may be that employers tend to be inflexible about the terms of employment when they are engaging a recruit29. In this situation, the recruit may be in a weak position to request a different hours arrangement. This could mean that women who have decided to change jobs, for a reason that may be unrelated to their preference for working a given number of hours, may be quite likely to change the number of hours they work when they start their next job. On the whole, it seems plausible that women, particularly those who work part-time, are able to be somewhat flexible about the hours they work. In general, it seems that employers may have less scope for flexibility around the hours of work they offer, unless one employee’s preference can be matched with that of another employee.
The observation that hours worked tend to change when women change jobs may have elements of both explanations. In the absence of detailed empirical
28 Blundell, R., Brewer, M. and Francesconi, M. (2005) Job Changes, Hours Changes and the Path of Labour Supply Adjustment, Institute for Fiscal Studies, Working Paper 21, 2005.
29 Flexibility of working arrangements was one of the aspects of employment practices reviewed by Millar, J., Ridge, T., and Bennett, F. ( 2006) Part-time work and social security: increasing the options. DWP Research Report 351.
Description of mini-jobs

45
research on the process of selecting jobs and the basis on which job-seekers choose which job offers to accept, any hypothesis on the behaviour of employers and job-seekers must be speculative. A further point is that research questions that focus on a specific ‘reference week’ may under-count instances when women do change their hours without making a change of employing organisation.
3.4 Mother characteristics and mini-jobs
3.4.1 Family characteristics and mini-jobs
To introduce the theme about how the mother’s situation may relate to the decisions she makes about whether to work and if so how much, this section outlines very briefly the cases of four FACS respondents. These cases illustrate the range of information collected by FACS and they were each selected to illustrate a pattern in the mother’s labour market behaviour over time:
• onemotherwhoworkedinamini-jobatfivewavesofFACS;
• twomotherswhomoved fromamini-job toworking16ormorehoursperweek;
• onemotherwhowasnotworkingthroughoutFACSwaves3to7.
Mini-job for all of waves 3 to 7
The mother was aged 54 in 2005 and was working 13 hours per week as a school mid-day assistant. She described this as a permanent position which she had been in since 1995. Her pay increased from around £75 per week in 2001 to just over £90 per week in 2005. She had left school with GCSE qualifications graded D-G and she had a driving licence. The mother reported she was in good health in 2005. Her husband worked in a professional job, stated to be 50 hours per week, and had been in that job since 1999. His pay per week had increased from just under £400 in 2001 to just under £500 in 2005. Their combined earnings placed them in the fourth quintile of income. They did not receive Working Tax Credit (WTC) in any of the years. Their older child was aged 16 in 2001 (wave 3), and they had ceased to receive Child Tax Credit (CTC) for this child in 2003/04, but in 2005 they still received around £10 per week in CTC for their younger child, aged 11 to 15. The family were owner-occupiers and stated their property was in good condition.
Mini-job to 16 or more hours per week (in a recent year)
The mother was in her 40s and had worked in various jobs30 as a cleaner. The increase in her weekly hours in 2005 was the result of taking on a second cleaning job for six hours per week. Her main job was paying a net hourly rate of £4.40
30 From the changes in the size of the workforce at the establishment where the work was carried out, it is inferred that there were changes in employment. However, it is possible that the jobs were with a contract cleaning company, in which case they might have been with the same employing organisation.
Description of mini-jobs

46
in 2005 (ten hours with pay of £44, as checked on her payslip) and she stated her earnings from the second job were £22 per week. This suggests that both her jobs were paying around the Minimum Wage. She had left school with no qualifications and did not have a driving licence. She had one child of primary school age. Her husband worked 39 hours per week in 2005 and his work was classified as skilled trades work in a manufacturing company. His weekly earnings had increased from under £250 in 2001 to around £320 in 2005. Their earnings placed them in the third quintile of income. They received no WTC, but they did receive around £10 per week as CTC.
Mini-job to 16 or more hours per week (in an earlier year)
The mother was in her early 40s in 2005 and had one child of secondary school age. In 2001, she had a job in sales working one to 15 hours per week. In 200231, she moved to a job in an office of ten to 24 staff dealing with housing, (which may possibly have been with an estate agent or a local authority housing department). Her occupation was classified as Associate Professional and she stated she was working 40 hours per week for pay of £120. The husband earned around £300 per week and their accommodation was rent-free in connection with his job. One member of the household was in poor health and in receipt of Disability Living Allowance (DLA). They also received CTC, but they were not receiving WTC.
Not working in any of FACS waves 3 to 7
The mother stated her age as 26 in 2005, when she had one child of primary school age and two younger children. Her CTC was just over £100 per week following the birth of the youngest child. In addition, she received around £150 per week in IS. These sources (plus Child Benefit (ChB)) placed the family in the lowest quintile of income. They lived in a social rented home, which was stated to be in poor condition with damp and problems with plumbing. The mother had left school with A-Levels but did not have a driving licence. Looking across the FACS data for the four years in which she was interviewed (wave 4 having been missed), there were occasional references to a partner who was unemployed and seeking work.
This very limited set of ‘case studies’ aimed to illustrate the diversity of women’s situations in work over time. It is possible that a different set of cases would have shown more evidence of change and progression. While we have a fairly detailed picture covering around five years, we really know little about how the mothers felt about their jobs, such as whether they felt able to use their skills or whether they expected to remain in the same situation five years in the future.
3.4.2 Age of youngest child
The discussion in Chapter 2 has already set out the extent to which the pattern of employment among mothers was related to their age. A summary point was that
31 This appears to be some time after her child started Secondary school.
Description of mini-jobs

47
from around the age of 35, the rate of participation in paid work was fairly similar between mothers in couples and lone parents. While the rate of employment was lower for both groups among those aged under 35, it was appreciably lower among lone parents.
Figure 3.2 indicates the relationship between the age of the youngest child in the family and the activity status of the mother in couple families. Figure 3.3 does the same for lone parents.
Figure 3.2 Activity status of couple mothers by age of youngest child
This makes it clear that the relationship between the age of the youngest child and the proportion of mothers in paid work was strong and continuous in nature up to the youngest child reaching the age band ‘16 to 18’. Couple mothers whose youngest child was aged 13 or over were less likely to work in a mini-job than those with younger children. The youngest child being aged 13 to 15 fits into the pattern of successive increases in full-time work, but the overall total in paid work was no greater than in the 11 to 12 age band, because of a reduction in the use of mini-jobs.
Among couple mothers whose youngest child was aged 12 or under, there was no particular pattern of variation in the extent to which mini-jobs were used.
Description of mini-jobs

48
Figure 3.3 Activity status of lone parents by age of youngest child
The overall rate of participation in paid work among lone parents exhibited a similar overall trend, involving a minority (32 per cent) among those lone parents whose youngest child was aged one or younger, and rising steadily to 79 per cent among those whose youngest child was aged 16 to 18. The proportion of lone parents doing mini-jobs did not display a regular pattern, with alternate age bands of children being associated with a higher proportion of lone parents in employment. This instability in the pattern is thought to be simply a reflection of the small number of cases in the sample (81 cases) being spread across seven age bands.
A more distinct trend was that the proportion of lone parents who described their activity as ‘unemployed’ or ‘in education or training’ was greater among those whose youngest child was aged up to seven, and then it reduced gradually among the lone parents whose youngest child was aged eight or over. It is interesting to note that this group was largest among mothers whose youngest child was aged five to seven, that is within a short time of the youngest child reaching compulsory school age.
Description of mini-jobs

49
3.4.3 Tenure of accommodation
There was a very strong relationship between specific forms of tenure and the percentages of mothers in paid work, and the patterns were very similar for couple mothers and lone parents.
Figure 3.4 shows the relationships between tenure and activity status for mothers in couples, and Figure 3.5 shows the corresponding patterns among lone parents. Looking separately at each category of tenure, the percentages of lone parents and mothers in couple families in paid work were very similar. For example, among the ‘social renters’, we see that 40 per cent of couple mothers were in paid work and that the corresponding figure for lone parents was 38 per cent. Among social renters, a higher percentage of lone parents (33 per cent) than couple mothers (30 per cent) were working in jobs of 16 or more hours per week. As we have seen elsewhere, more of the couple mothers in social rented accommodation were doing mini-jobs.
Figure 3.4 Tenure and activity status for couple mothers
The difference in the overall rate of participation in paid work reflects the substantial differences in the proportions of mothers in each tenure category, according to whether they were a lone parent or were in a couple family. Four-fifths of the
Description of mini-jobs

50
mothers in couple families were in the ‘Owner’ category, which combines the small number who owned outright, the much larger group with a mortgage and also the small number with a ‘shared ownership’ arrangement. Of the remaining couple families, around half were social renters (12 per cent), six per cent were private renters and the remaining three per cent were in other tenures, such as living with relatives or rent free.
In contrast, 32 per cent of the lone parents were owners, while 44 per cent were in social rented accommodation. The remainder included 16 per cent who were private renters and nine per cent in the ‘other’ tenures category.
Figure 3.6 illustrates the general similarity in the proportions of mothers in paid work (of any number of hours per week) across each of the tenure categories. Taking this into account, it can be seen that the difference between the 58 per cent of lone parents and the 72 per cent of couple mothers in paid work in 2005/06 (according to FACS) was primarily the result of the different profiles of accommodation tenures for couple mothers and lone parents. It is notable that lone parents who were owners were more likely to be in paid work (91 per cent) than their counterparts who were mothers in couples (79 per cent) who owned their accommodation.
Figure 3.5 Tenure and activity status for lone parents
Description of mini-jobs

51
Figure 3.6 Comparisons of participation rate by tenure for couple mothers and lone parents
Turning attention to the use of mini-jobs by couple mothers, we can see that this was most common (13 per cent) among those who owned their accommodation or who had a mortgage. It was also relatively common (nine per cent) among those who were renters in housing association or local authority accommodation. It was less common among the private renters and ‘other’ tenure categories. Among lone parents, there was more consistency in the use of mini-jobs by tenure. The group with the highest rate was among the lone parents who were renting in the social housing sector. Those lone parents who owned their accommodation were the second-least likely to have been doing mini-jobs. This seems a significant point: it would appear to make little sense as a lone parent and home-owner to work just a few hours per week.
As already seen in Chapter 1, the lone parents were more likely than mothers in couple families to report that their activity status at the time of interview was ‘unemployed and looking for work’. We can see from Figure 3.5 that this was the case for those in social rented, private rented or ‘other’ tenures. Given that 91 per cent of the lone parent owners were already in work, the two per cent who said they were ‘unemployed and looking for work’ represented a high proportion of the non-working lone parents.
Description of mini-jobs

52
The differences in the profile of tenure between couple mothers and lone parents, means it is of interest to estimate the rate of participation in work for lone parents if they had the same profile as couple mothers across the tenure categories. This is illustrated by Figure 3.7. As with the adjustment of the age profile, the calculation involves assigning lone parents to each tenure category in the proportion that applies to mothers in couple families.
In the hypothetical scenario in Figure 3.7, it can be seen that the overall rate of participation in paid work for lone parents in 2005/06 would be 81.7 per cent, which exceeds the rate for couple mothers at that time by almost ten percentage points (as illustrated by Figure 1.1). This finding is dominated by the pattern of paid work among the owner-occupiers, just as the rate of participation in paid work for mothers in couples is a reflection of this group in the ‘real world’ situation. This suggests that tenure, and factors associated with tenure, are key contributors to the differences in the proportions of couple mothers and lone parents participating in paid work.
This finding has various implications for policies aimed at further increasing the rate of lone parents’ labour market participation. One point is that it looks as though it would be sensible to set a target for increasing the rate of employment for mothers in the social rented and private rented tenure categories. Given this, it seemed of value to see whether the same pattern had existed some years previously. We have already seen in Figure 1.1 that there was a striking increase in lone parents’ rate of working over this time, while there was a much smaller increase among mothers in couple families.
Department for Work and Pensions (DWP) researchers provided an in-house analysis of Labour Force Survey (LFS) data for the period from 1997 to 2006. The trend over this time is summarised by looking at the percentages of couple mothers (Figure 3.8) and lone parents (Figure 3.9) in paid work in 1997 and 2006. For the lone parents there were increases in all the tenure categories. The biggest increase was for private renters (16 percentage points) and for those with a mortgage (12 percentage points). Among social renters, there was a more modest increase from 29 per cent to 36 per cent.
As we would expect, based on Figure 1.1, the changes for couple mothers were smaller than for lone parents. This is partly because there was only a modest increase in the rate of working for mothers in couple families with a mortgage (four percentage points). However, in the overall rate, this increase was offset by a reduction in the rate of working among mothers living in privately rented (three percentage points) and social rented accommodation (four percentage points). As these two sets of renters made up less than one-fifth of the couple families, these reductions had only a limited impact on the overall trend.
Description of mini-jobs

53
It is not entirely clear what factors lie behind these varying patterns. There may be underlying changes in the cohorts of mothers who are included in the LFS groups and to some extent a differentiation of couple families based on tenure. Those couple families able to access social rented accommodation in recent years may have been particularly ‘disadvantaged’ in ways that affected the employment rate among mothers in these families.
With the lone parents, it is clear that owners and private renters have been the groups in which there has been the most marked positive response to policy initiatives intended to ‘make work pay’. It is possible to speculate on some of the factors that have meant that lone parents in social rented accommodation were less able to take advantage of these policies. For example, it may have been more common for never-married lone parents to become social renting tenants than those who had divorced after some years of marriage. Factors such as these might account for the smaller changes in employment among social renters.
As a general conclusion on tenure, family types and the rate of employment among mothers, it can be seen that policy changes since 1997 have had varying levels of impact, but the distinctions between high rates of employment among mortgage holders, intermediate rates among private renters and low rates among social renters have been persistent. Lone parents who had a mortgage were just as likely to be working in 1997 as were their counterparts of the mothers in couple families with a mortgage. The effect of the policy initiatives since 1997 was to boost the employment rate of the lone parent home-owners to a level well above that of the couple mothers. All of these changes, moreover, occurred in the context of a buoyant economy.
Description of mini-jobs

54
Figure 3.7 Simulating the employment rate of lone parents if their tenure matched that of couple mothers
Description of mini-jobs

55
Figure 3.8 Participation in paid work by tenure for couple mothers in 1997 and 2005
Figure 3.9 Participation in paid work by tenure for lone parents in 1997 and 2005
Description of mini-jobs

56
3.5 Work status of mother by income of family
Figures 3.10 and 3.11 illustrate the relationship between the activity status of the mother and the family’s annual income. The latter is summarised by dividing all families into quintiles (five bands, dividing the FACS sample as a whole into equal-sized groups). The aim of this is to identify in which parts of the income range it is more common for mothers to be working in mini-jobs.
Figure 3.10 Couple mother work status by income quintile
Description of mini-jobs

57
Figure 3.11 Lone parent mother activity by income quintile
Among couple mothers, the use of mini-jobs was fairly uniform across the income quintiles. More than half of the couple families were in the top two income quintiles. It was the rate among these families, including a lower rate in the top quintile (9.5 per cent), that shaped the overall proportion at 11.9 per cent. The third quintile was the group in which the use of mini-jobs by couple mothers was most common.
As noted before, the sample of lone parents with mini-jobs in FACS Wave 7 was 82, so we should be cautious about generalising about their distribution across the income categories. There was a slightly higher incidence of the use of mini-jobs among those in the two quintiles with the highest income, but these accounted for only six per cent of lone parent families. A very high proportion of the lone parents in the three highest income quintiles were working 16 or more hours per week. It seems reasonable to infer that these were probably people who had stable jobs with high rates of pay. However, just over half of the lone parents in the FACS sample (51 per cent) were in the lowest income quintile. In this category, only four families in ten had the mother in paid work. This was the group in which were concentrated a majority of the lone parents who said they were looking for work and those involved in education or training. Their being in the lowest quintile implied that the hourly rate of pay of mothers in this group was relatively low.
Description of mini-jobs

58
Although the occupational profile of mothers doing mini-jobs appeared to indicate that relatively many of them were working in occupations with low rates of pay, the information here shows that the most common situation was for the mother’s mini-job to be combined with her partner’s higher-paid job. Hence, it was not the case in general that those mothers doing mini-jobs were in the poorer families in the sample. However, there were some mothers who had made long-term use of mini-jobs who were in the first and second quintiles of income. This was established by identifying the work history pattern (discussed further in Chapter 4) and checking the income quintile of the families in which mothers had made more use of mini-jobs.
3.6 Other differences in demographic profile and circumstances
This section summarises more briefly some observed differences between the couple mothers and lone parents in the FACS sample at Wave 7 (2005).
Mothers in couple families were more likely than lone parents to have an academic or vocational qualification, the percentages being 92 per cent and 83 per cent respectively32. Among mothers in couple families, there was only a limited variation in the propensity to do paid work by the level of qualification. On the other hand, the level of qualification made a considerable difference among lone parents. Lone parents with a degree or higher degree were even more likely to have been in paid work in 2005 than couple mothers with a degree. However, those lone parents with a lower qualification or none were less likely to be in paid work than their counterparts among couple mothers, who were matched in terms of qualifications.
Figure 3.12 summarises the percentage of couple mothers in paid work by Government Office Region. The resultant picture is fairly complicated, and it is not our aim to provide a detailed commentary on the patterns in this report. Some key points about this are:
• therewasagooddealofregionalvariationwiththehighestrateofparticipationin Merseyside (82 per cent), but this was attributable to full-time jobs rather than a higher rate of participation in mini-jobs than in other regions;
32 It has often been noted that lone parents tend to have qualifications at low levels. However, in the setting up of the variables for multivariate analyses, as reported in Chapter 5, the mother’s highest qualification and age of leaving full-time education were not significantly associated with transitions to and from work. One reason for this may be that work was available for mothers with varying levels of educational attainment. Another point is that those making transitions may have been fairly likely to have lower levels of qualification, as those with high qualifications and skilled jobs may have had more stable work histories.
Description of mini-jobs

59
• theoverall ratewas lowest inLondon,where itwas63percent;again, theproportion of couple mothers working in mini-jobs was similar to that in other regions;
• the proportion of couple mothers in mini-jobs was especially high in thebuoyant labour markets of the South East and South West, at 16 per cent in both regions;
• it is not apparent why the rate of participation in mini-jobs was lowest inYorkshire and Humberside (seven per cent) and in the North East (eight per cent).
The detailed figures for the percentages of lone parents in paid work by region are not shown. However, several points may be mentioned:
• in some regions, the rate of working among lone parents was close to thetarget figure of 70 per cent, the highest rate being in Yorkshire and Humberside (68 per cent) and the next highest rate being in the South East (65 per cent);
• insomeotherregions,thepercentageofloneparentsinworkwasverylow,notably in London where it was just 45 per cent. This is an issue that has been investigated in the past33. Part of the explanation for this may be that London was the region with the fourth highest percentage of families with children who were social renters.
33 A research study was commissioned by DWP to investigate reasons for the low rate of participation by lone parents in London: McKay, S. (2004) Lone Parents in London Quantitative Analysis of Differences in Paid Work, DWP In-House Report No. 136. Also, O’Connor, W. and Boreham, R. (2002) Investigating Low Labour Market Participation Among lone parents in London: A Review Of The Methods. DWP In-House Report No. 104.
Description of mini-jobs

60
Figure 3.12 Regional variation in couple mothers’ paid work and mini-jobs
3.7 Mini-jobs, other ‘inactivity’ and jobsearch
It was seen in Chapter 2 that a greater proportion of lone parents than couple mothers stated that their current activity was ‘Unemployed and looking for work (of 16 or more hours per week)’. Fortunately, FACS collects a certain amount of information about the jobsearch behaviour of respondents, as well as about their intentions and constraints regarding a move into part-time or full-time work.
All FACS respondents not working 16 or more hours per week (including those doing mini-jobs at Wave 7) were asked whether they were currently undertaking jobsearch. If they were, they were then asked whether the jobs they were interested in were of 16 or more hours per week or mini-jobs. The main findings are illustrated in Figure 3.13, which includes both lone parents and mothers in couple families.
Description of mini-jobs

61
Figure 3.13 Jobsearch behaviour among those not already working 16 or more hours
A first point to note is that Figure 3.13 bears out the information given earlier, showing that lone parents were almost twice as likely as couple mothers to have undertaken some jobsearch. This pattern was strongly influenced by the lone parents doing mini-jobs and by those on a training course. Mothers who described their current activity as looking after the family or ‘other’ (e.g. caring or sickness), whether they were lone parents or couple mothers, were less likely to be looking for a job at the time of interview. However, the group least likely to be seeking a different job were the couple mothers in mini-jobs, of whom only seven per cent (on a base of 619) reported having looked for a job of 16 or more hours per week.
A second difference is that lone parents who were looking for a job were more likely than those mothers in couples to state that they were interested in working 16 or more hours per week. On a base of 82 individuals, we can’t place any weight on the precise proportions, but few of them were looking for another mini-job and it was more common for lone parents to be seeking to increase their hours of work to 16 or more.
Couple mothers and lone parents not working 16 or more hours per week were asked whether there were particular reasons why they were not looking to do
Description of mini-jobs

62
this amount of work. The same question was asked of those doing a mini-job and those not working at all, of whom a few were couple mothers on a training course.
The dominant answer was that the mother valued the time she was able to spend with her child or children. This was what she wanted to do and felt was right for her child or children. This was mentioned by 54 per cent of the couple mothers doing mini-jobs and 53 per cent of those not working at all. The other more common reasons given by couple mothers are shown in Figure 3.14.
Figure 3.14 Reasons given by couple mothers for not planning to get a job of 16 or more hours
Among the more important reasons, there was consistency, whether the couple mothers already had a mini-job or were non-working. Some of the mothers doing mini-jobs may perhaps have seen the question as slightly odd, given that they were already working at the time. This appears to explain the instances where their answer was that they didn’t need a job, or to change their job. The respondent’s own illness or a child’s illness were more often mentioned by the women not currently working. The cost of childcare was mentioned as a constraint by nine percent of the couple mothers.
Description of mini-jobs

63
With the lone parents, the number working in mini-jobs was only 82, so there is less scope to make comparisons with those not working at all. Lone parents were less likely than couple mothers to mention their child’s need for his or her mother’s presence, although this was still the dominant ‘barrier to work’. It was mentioned by two-fifths of the lone parents, 37 per cent of those doing a mini-job and 42 per cent of those not working at all. Among those not working at all, three of the dominant constraints were the same as those cited by non-working couple mothers: their own illness (17 per cent), a child’s illness (seven per cent) and the cost of childcare (14 per cent).
3.8 Mini-jobs and reasons for leaving a job
In the situation where a FACS respondent had changed job or stopped working, they were asked to state the main reasons for their previous job34 having come to an end. It is of interest to compare the reasons given for the end of mini-jobs and those jobs where the mother had worked 16 or more hours per week. In order to provide a satisfactory basis for this comparison, all cases where this had occurred have been combined35 across the five waves of FACS, giving a weighted total of 1,899 cases. Of these, 373 were cases where a mini-job had ended. The reasons listed towards the top of Table 3.12 were included at all waves, while those from ‘childcare broke down’ to ‘retired’ were originally based on in-office coding of ‘other answers’, and were later added to the questionnaire. It can be seen that around ten per cent of the answers given were not in the code frame.
34 The question covers reasons for other activities ending, as well as jobs. However, the end of a job accounted for 88 per cent of these spells. The data relates only to the most recently ended spell prior to each interview.
35 The analysis involved a table for each of the five waves, each case receiving its appropriate weight for that wave, and the resulting tables have been combined.
Description of mini-jobs

64
Table 3.12 Main reasons for leaving previous job
16+ Job Mini-Job All had last job % % %
It was a fixed term or temporary job 4 6 5
You were made redundant 9 5 8
You were dismissed 1 1 1
You were pregnant 36 22 33
For health reasons 8 8 8
You decided to leave yourself 9 18 11
College/full-time study 5 4 4
Wanted to look after family 10 13 11
Childcare broke down 4 4 4
Breakdown of marriage/relationship 3 2 2
Problems with transport * 1 0
Too difficult to combine work with childcare 2 4 3
Financial reasons 1 2 1
Retired * - 0
Other specific answer, not able to back-code 8 11 9
Total 100 100 100
Base: FACS Waves 3 to 7 combined, Cases where the previous spell was paid work 1,526 373 1,899
Note: Limited to spell prior to interview.
The analysis does not distinguish between couple mothers and lone parents, as there were few lone parents doing mini-jobs and the findings may not be very meaningful. Overall, around a third of all previous job spells had ended due to the mother expecting a baby. This was rather less common among those doing mini-jobs, probably as the mothers who did mini-jobs tended to be somewhat older. ‘Voluntary leaving’ was the second most common main reason, and was twice as likely to be mentioned by those who had done a mini-job as by those who had been working 16 or more hours per week. On the other hand, redundancy was more common for those who had been working 16 or more hours per week. The job having a fixed term or being temporary was slightly more common for those doing mini-jobs, and this is consistent with other analyses, but this reason accounted for the end of only around one job in twenty. A variety of reasons connected with family, children and childcare were among the most commonly cited, and there seems little difference between those previously doing mini-jobs and those working 16 or more hours in terms of how often these reasons were mentioned.
Description of mini-jobs

65
3.9 Summary
This section aimed to provide a descriptive background for the analysis to follow in the next two chapters, where we are able to exploit the longitudinal data from FACS.
Some of the key points about the mini-jobs being done by couple mothers and lone parents, as compared with jobs done for 16 or more hours per week, included:
• apredominanceofjobstowardstheless-skilledendofthespectrum,althoughsome mini-jobs were in high-skilled occupations;
• veryfewmothersdoingmini-jobshadasecondregularjob;
• controllingforoccupation,therewaslittledifferenceintheratesofpayamongcouple mothers and lone parents and between mini-jobs and those of 16 or more hours;
• four-fifths of couplemothers doingmini-jobsworked eight to 15 hours perweek, but half of the lone parents worked one to seven hours per week and this seemed likely to reflect the earnings disregard on IS;
• most mothers considered their job to be ‘permanent’, although temporaryjobs were rather more common for those doing mini-jobs, especially for lone parents;
• moreofthemini-jobswereinsmallestablishments,anditseemsreasonabletoassume that these were often in small organisations;
• half the couple mothers in mini-jobs and almost three-quarters of the loneparents reported that no National Insurance was deducted from their pay.
Further examination of the characteristics of mothers participating in paid work showed a strong relationship between the rate of working and the age of the youngest child in the family. However, the percentage of couple mothers doing mini-jobs was similar, irrespective of the age of the youngest child. This means that a greater proportion of mothers in work who did mini-jobs were mothers of young children. There was less of a trend among lone parents, but this was probably related to the small number of cases in the sample in which a lone parent was doing a mini-job.
We then looked at patterns of participation in work by tenure. As well as reflecting differences at present, tenure reflects an individual’s life-course and family background. There is a marked interaction between tenure and the means of financial support for those not working. Non-working individuals who rent their accommodation may have their housing costs met by Housing Benefit (HB). In contrast, those non-working families who are owners with a mortgage receive an allowance to cover interest on the mortgage (IS Mortgage Interest).
When the rate of participation in paid work is viewed separately by tenure, we find that there were marked differences in 2005/06. Owners were very likely to be
Description of mini-jobs

66
in paid work and, among couple mothers, to do mini-jobs. Those in local authority or housing association rented accommodation were the group least likely to be in paid work. The next lowest rate was among those renting privately. It is assumed that one factor in this pattern is the treatment of earnings in HB and Council Tax Benefit (CTB) (as well as the earnings disregards for IS and JSA that have already been discussed). Although Housing Benefit may be received by those in work, the rate of withdrawal is steep. In addition, among potential beneficiaries of HB as an in-work support for low-income families, relatively few were aware of this arrangement (Turley and Thomas, 2006)36.
There was a major difference in the tenure profiles of couple mothers and lone parents. Four-fifths of couple mothers were owners, as compared with one-third of lone parents. When the sample of lone parents was re-weighted, in order that their tenure profile matched that of couple mothers, we found that the difference in the overall rate of participation in paid work ‘disappeared’. Indeed, in that situation, the overall rate of participation in paid work by lone parents would be ten percentage points higher than that for couple mothers.
This chapter briefly presented several other background characteristics of mothers that appeared relevant to their working patterns. One of these was a relationship between the rate of participation in work and the income of the family. This showed the connection between a low propensity to work and very low income among lone parent families. However, the lone parents predominantly working 16 or more hours per week were found in the third, fourth and fifth quintiles of family incomes.
We saw that there were regional differences in the rate of participation in paid work and in mini-jobs. High rates of working in mini-jobs were associated in some cases with high overall rates of working, but the pattern was not uniform across regions.
Finally, we reviewed the information about jobsearch behaviour. This showed that the mothers involved in training or an education course were the group most likely to have been searching for a job around the time of the FACS wave 7 interviews. Couple mothers in mini-jobs were very unlikely to be seeking to change their job. Lone parents doing a mini-job were fairly likely to be looking for a different job, and a majority among them were looking for work of 16 or more hours per week. Among those not looking for a job, or working in a mini-job and not aiming to increase the hours worked each week, the dominant reason cited was the mother’s preference for having time when she could be with her children.
36 Turley, C. and Thomas, A. (2006) Housing Benefit and Council Tax Benefit as in-work benefits; claimants’ and advisors’ knowledge, attitudes and experiences, DWP Research Report No. 383.
Description of mini-jobs

67
4 Patterns of labour market activity over time
4.1 Explaining the data and its structure
This chapter deals with the work histories of couple and lone parent mothers between 2000 and 2005. As in each year of Families and Children Study (FACS), around a quarter of these were lone parent families, and three-quarters were couple families. Attention is focused initially on the sample members who participated in FACS throughout the period of time from 2001 to 2005. Of course, this is a special sub-group of the FACS sample as a whole, albeit a large section of the sample. Each year, FACS has been able to re-interview around 80-90 per cent of the sample members, although attrition has not been distributed uniformly across the sample. As time goes on, the sample becomes somewhat less representative of the population of families. However, while acknowledging this limitation, there is a considerable benefit in being able to track a large sample of families through a period of years.
In doing this, there are three different ways in which we use the data:
• firstly,wemakeuseoftherelativelydetailedinformationcollectedaboutthereference week just before the interview. There are five interviews, so they cover around 48 months, or around 60 months if we include the 12 months prior to the third wave of the study;
• secondly,wecanincreasethenumberofdatapointsbytakingadvantageofthework history that is completed whenever the respondent’s status has changed between interviews;
Patterns of labour market activity over time

68
• thirdly,wecanstructure thedataaround ‘spells’of theworkhistory.Aspellis a consecutive period of months (at least one month in length) in which the respondent would give the same answer about their status from the list presented at Table 3.1. Those people who were continuously in paid work, but who changed their job, were supposed to report each spell of working as a separate period of activity. A spell of working ends and another begins when the individual changes the nature of the work they do on a significant promotion or changing to a different type of work with the same organisation. More obviously, the spell also changes when the individual leaves one job and starts working for a different employer, whether or not the type of work changes at this time. An assessment of the FACS work history data37 concluded that the data itself indicates that there has been good adherence to this arrangement.
A characteristic of work history data is that there may be spells whose starting date or end date are unknown. For someone working at the date of the most recent interview, we know the length of time worked so far, but cannot know the duration of the spell because it is incomplete. This situation is described as a ‘right censored’ spell. Some respondents had been doing the same activity for some time when they were first interviewed. The design of the questions was intended to establish the date when the spell started, but if it failed to do so, then this spell would be ‘left censored’.
There are a number of issues that arise with work histories collected on a series of occasions. Fortunately, Gillian Paull38 (at the Institute for Fiscal Studies) had been commissioned by the Department for Work and Pensions (DWP) to compile an edited work history dataset, in which she identified a range of problems with the data and applied corrections where possible. In making use of this data, we have adopted two rules:
• respondents who had missed one of the FACS waves between 3 and 6 areretained in the data file, as their work history would have been taken back to the date of their previous interview (but they were all required to have been interviewed at Wave 7);
• respondentswhosedataproblemhadbeenresolvedbyGillianPaullhavebeenretained in the data. A small number of respondents (fewer than 100) who had data problems that were not resolved were dropped from the work history analysis.
37 Mike Brewer and Gillian Paull (2005) The Consistency and Reliability of the Activity History Data in the Families and Children Study (FACS), DWP Working Paper No 25.
38 The data file was supplied to NatCen by DWP, together with the User Guide for the FACS Work History Data Release 2: Waves 1-7, a report submitted to DWP in 2006 by Gillian Paull.
Patterns of labour market activity over time

69
4.2 Balanced panel analysis
The first stage in the analysis involved converting the labour market status of each FACS respondent in each reference week to an alphabetical code, as follows:
• F‘full-timework’,thatis30ormorehoursperweek;
• P‘part-timework’,thatis16to29hoursperweek;
• Ma‘mini-job’,thatisoneto15hoursofpaidworkeachweek;
• O‘otheractivities’or‘outofthelabourmarket’.
Table 4.1 shows the most commonly-occurring patterns of codes across the five waves of FACS. To make the results more general, common patterns occurring across the five waves were grouped together by looking for patterns that could occur during the series of spells, but not necessarily on consecutive waves or covering the entire set of five waves. The number of FACS respondents available for this analysis was 3,751.
A first point is that 45 per cent of the respondents could be accounted for by the three most common patterns, all of which indicate someone who was found to be doing the same type of activity at every one of the five waves. This analysis does not pay regard to whether they had done other activities between the interviews, but it is probably fair to assume that many of them had remained in the same status continuously. A similar proportion of the sample remained out of work continuously to that proportion who were working 30 or more hours per week throughout the five waves. Somewhat fewer remained in jobs of 16 to 29 hours per week. Those who did a mini-job in all five waves were considerably less numerous, but there were 92 cases in which this occurred, amounting to two per cent of respondents.
Two of the smaller categories shown in Table 4.1 describe the transition from an initial state of being out of work, through a spell of doing a mini-job and then to a spell of working ‘part-time’ or ‘full-time’. Overall, 59 respondents had made a transition of this pattern during the five waves. It is noticeable that most of this group (47 cases) had moved to working 16 to 29 hours per week, and very few (12 cases) to working 30 or more hours per week. An equally large group (58 respondents) had moved between being out of work, then into a mini-job and had returned to being out of work.
Patterns of labour market activity over time

70
Table 4.1 Work over five waves of FACS – self-employed hours included
Pattern of labour market status over five waves Weighted frequency Percent
Not working in five waves 670 17.9
30+ hours a week in five waves 622 16.6
Part-time (16 to 29) in five waves 390 10.4
P – F 233 6.2
O – P 113 3.0
O – M 112 3.0
F – P 107 2.8
M – P 106 2.8
Mini-job in five waves 92 2.4
P – O 80 2.1
O – F 71 1.9
F – P – F 70 1.9
M – O 67 1.8
O – M – O 58 1.5
P – M – P 55 1.5
F – O 53 1.4
P – F – P 51 1.4
O – M – P 47 1.3
O – P – O 33 0.9
P – O – P 30 0.8
O – P – F 28 0.7
M – O – M 24 0.7
P – M 23 0.6
M – F 16 0.4
O – F – O 16 0.4
M – P – F 15 0.4
O – M – F 12 0.3
F – M 3 0.1
F – M – F 1 0
Other multiple changes 554 14.8
Total 3,751 100
A key limitation of this analysis is that it represents a series of five snapshots of activities. These are a reliable indication of the patterns of behaviour among those of the FACS sample members with more stable circumstances, but they may obscure a degree of change in activity among a significant part of the sample. In this analysis, there is a bias towards longer spells and less representation of short spells lasting only a few months.
Patterns of labour market activity over time

71
4.3 Patterns of activity over time
The second stage of this analysis was to make use of the work history data to gain an outline view of the more frequently-occurring patterns of labour market activity. This allows us to analyse the situation of some respondents who failed to meet the criterion of five consecutive interviews for the balanced panel, that is to include people who missed one of the interviews. This increases the number of respondents to 4,704. A second advantage of using the work history is that it allows us to make better use of the fact that we have data collected about the period prior to wave 3 (fieldwork for which was in autumn 2001). In practice, we have month-by-month data on all 4,704 respondents from March 2000 to September 2005.
Two complementary analyses have been carried out using the work history data. The first increases the number of snapshots from five to 23, by looking at every third month and by covering the additional months at the start of the period. The second approach draws on the fact that we can cumulate the number of months that each respondent spent during this period in each of the main types of labour market status. Neither of these approaches takes direct account of the number of transitions or the order in which they occur, although this was the next part of the analysis and is covered in Section 4.4.
Figures 4.1 to 4.3 show the profile of the FACS panel each quarter between March 2000 and September 2005, with the labour market statuses simplified to five categories:
• outofwork;
• workingasanemployeeoneto15hoursperweek;
• workingasanemployee16ormorehoursperweek;
• beingself-employedandworkingoneto15hoursperweek;
• beingself-employedandworking16ormorehoursperweek.
Figure 4.1 shows the pattern for the mothers in couple families. Over time, there was a steady reduction in the proportion of the sample members who were not working in each quarter. We believe that there is a simple explanation for much of this trend. As previously shown in Figure 2.3, there was a steady increase in the proportion of women doing paid jobs across each age band. We are observing an effect of the members of the sample increasing in age. Part of the trend may also be reflecting the increase in women’s’ employment, but the Labour Force Survey (LFS) suggests this was only a slight increase from 70.7 per cent in 2000 to 71.9 per cent in 2005.
Patterns of labour market activity over time

72
Fig
ure
4.1
C
ou
ple
mo
ther
s n
ot
wo
rkin
g, w
ork
ing
as
emp
loye
es o
r se
lf-e
mp
loye
d: M
arch
200
0 to
Sep
tem
ber
200
5
Patterns of labour market activity over time

73Patterns of labour market activity over time
There was a steady growth in the proportion of women working self-employed. Their number increased by around 40 per cent. Those working as employees increased by seven per cent, although within this there was an increase in working 16 or more hours per week (11 percentage points) and a reduction in the use of mini-jobs (by ten percentage points). Combined with the relatively small number of mothers in couples who were not working, the effect of these changes is that the number of women not working in September 2005 had reduced to 77 per cent of the figure in March 2000.
Figure 4.2 gives the corresponding information on trends among the lone parents in the sample. The overall change is equally impressive, with the number out of work in September 2005 being 72 per cent of the corresponding number in March 2000. This reflects the relatively steep upward trend in the employment rate of lone parents that was seen in Figure 2.4 and the fact that the individuals in the sample – and of course their children – were almost six years older by the end of the period covered by the data. In this case, a greater part of the change is a reflection of increased participation in paid work by lone parents. The LFS reports that this was 51 per cent in 2000 and had increased to 56.2 per cent in 2005.
There were also changes in the composition of employment among the lone parents. There was an increase of 45 per cent in the number working self-employed, all of which was among those working 16 or more hours per week. There was a 35 per cent increase in the number of women employed in jobs of 16 or more hours per week, while the number of lone parents in mini-jobs was only 80 per cent of the number at the outset. When combined, these patterns added up to a 28 per cent increase in the number of lone parents working as employees.
A third analysis in the same format is illustrated in Figure 4.3. This shows the profile over time for the couple mothers who had spent one month or more in a mini-job during the period covered by the work history data. The interpretation of these trends is less obvious than it was for the whole population of mothers in couples. The proportion of person-months spent in mini-jobs was only 90 per cent in September 2005 of the level it was in March 2000. There had been a substantial increase of 84 per cent in the proportion of person-months spent in employee jobs of 16 or more hours per week. There was also an increase of 50 per cent in self-employment, predominantly working one to 15 hours per week but showing a particularly large relative increase in self-employment for 16 or more hours per week. The net effect of this was that those not working each month represented 60 per cent of the person-months in this state at the beginning.

74
Fig
ure
4.2
Lo
ne
par
ents
no
t w
ork
ing
, wo
rkin
g a
s em
plo
yees
or
self
-em
plo
yed
: Mar
ch 2
000
to
Se
pte
mb
er 2
005
Patterns of labour market activity over time

75
Fig
ure
4.3
C
ou
ple
mo
ther
s w
ho
had
wo
rked
in a
min
i-jo
b 1
+ m
on
ths:
no
t w
ork
ing
, wo
rkin
g a
s em
plo
yees
or
self
-em
plo
yed
: Mar
ch 2
000
to S
epte
mb
er 2
005
Patterns of labour market activity over time

76
A possible explanation for the pattern observed is that couple mothers who took mini-jobs as an intermediate state were successful in making the transition to full-time work, in much the way that Iacovou and Berthoud’s (2000) analysis suggested. We are not convinced that this explanation is valid for our data. One basis for this is that there was a similar overall shift, over time, from being out of work to being in paid work among couple mothers as a whole group, as we can see for those who spent some time in a mini-job. The reduction in the proportion of months not working was slightly greater among the couple mothers who had spent some time in a mini-job, but the difference was small. The most marked feature of Figure 4.3 is the fact that the level of usage of mini-jobs was very similar at the end of the period as it had been at the start, even when there had been a marked increase in the proportion of the couple mothers in paid work of some kind.
4.4 The incidence of mini-jobs
Given that we have a series of observations of the activity of respondents to FACS, it is possible to look directly for sequences, as described by Iacovou and Berthoud, that start as ‘non-working’, progress to a ‘small job’ (i.e. a mini-job of one to 15 hours) and then to a ‘bigger job’ (i.e. 16 or more hours per week).
The approach adopted was to create a file of work history spells where each record was a single spell for a respondent. By comparing activities over a series of consecutive records, it was possible to identify sequences of activities. To generalise the findings, these sequences did not need to be adjacent spells. In addition to identifying the complete sequence of three steps, the analysis also recognised where the work history recorded only two of the steps, but the third was unobserved because it fell before March 2000 or after September 2005.
The complete set of 13,304 transition sequences were categorised as shown in Table 4.2.
Patterns of labour market activity over time

77
Table 4.2 Work history transitions
Classification of transitions Number Percentage
Non-working only 1,782 13.4
Non-working, mini-job, 16+ job 196 1.5
Non-working, 16+ job, mini-job 66 0.5
Full-time job, mini-job, non-working 66 0.5
Full-time job, non-working, mini-job 545 4.1
Mini-job, full-time job, non-working 147 1.1
Mini-job, non-working, 16+ job 497 3.7
Mini-job, non-working 195 1.5
Non-working, mini-job 1,195 9.0
Full-time job, non-working 830 6.2
Non-working, 16+ job 2,885 21.7
Full-time job, mini-job 111 0.8
Mini-job, 16+ job 341 2.6
Mini-job only 543 4.1
Full-time job only 3,832 28.8
Unclassified 73 0.5
Total 13,304 100.0
There were 196 cases in which the respondent was initially not working, then did a mini-job, and finally was working 16 or more hours per week. The syntax used to identify these sequences was designed to give priority to this pattern. Much greater numbers of work histories exhibited part of this sequence, such as the 1,195 cases where there was a spell of not working followed by a mini-job. Some of these may have developed into a spell of working 16 or more hours per week outside the period of time covered by the FACS work history. Another group of interest is the 341 cases in which a sequence included a mini-job and then a job of 16 or more hours per week, but there was no record in the data of a previous spell of non-working.
The main point of this analysis is that the ‘stepping stone’ sequence identified by Iacovou and Berthoud represents a very small group in the FACS data, particularly when we look explicitly for the three stages within the period of five years that is available to us. It is possible that part of the reason is the shorter period of time in the FACS data. Iacovou and Berthoud were using data for seven waves of the British Household Panel Survey (BHPS), and may have been better able to capture the entire sequence of three steps over this time.
Patterns of labour market activity over time

78
4.5 Further analysis of main patterns of labour market activity
The work history data file, structured as a series of spells in a single record for each respondent, was amenable to an analysis of the overall number of months each respondent had spent in each of the main types of labour market status. For simplicity, this analysis was based on the 23 quarterly periods already defined, rather than the full series of 69 months39. The principal reason for doing this was to check how many of the respondents had spent periods of time in mini-jobs and how these people had spent the remainder of their time. In practice, it was possible to classify all the respondents into one or another of a set of categories which characterise the proportion of time each respondent spent in a type of activity.
The process of classification was conducted iteratively, with the intention that at one end of the scale the categories should group together the people who spent a large proportion of the time not working, and at the other end should be grouped those who had spent a high proportion of the time in jobs of 16 or more hours per week. Those who had mini-jobs were identified mainly around the middle of the classification, tending towards one extreme when they had spent most of the remaining time out of work, and towards the other when they had spent most of the remaining time working in jobs of 16 or more hours per week. Within the group of people who had done mini-jobs, one group was those who had done this for a high proportion of the months.
Table 4.3 shows the resulting classification, as well as the number of women in each category and the percentage of all respondents in each group.
39 There were some sample members for whom the record covered 75 months. The data covers a period of 69 months for all 4,704 respondents.
Patterns of labour market activity over time

79
Table 4.3 Classification by the number of months spent in each activity (out of 23)
Activity classification (over 23 quarters) Number Percentage
Non-working 20+ months (any activities in the rest) 907 19.3
Non-working 15+ months and no mini-job 193 4.1
Non-working 12+ months and mini-job 1+ months 282 6.0
Similar number months in 16+ work, not in work, in mini-job 37 0.8
Similar number months not in work and in mini-job 139 3.0
Similar number months not in work and in 16+ work 454 9.7
Mini-job 18+ months (any activities in the rest) 186 4.0
Mini-job 12+ (any activities in the rest) 71 1.5
Mainly 16+ work and mini-job, both for 6+ months 114 2.4
Full-time work 18+ months (any activities in the rest) 2,281 48.5
Full-time work 12+ months (any activities in the rest) 40 0.9
All respondents 4,704 100.0
Base: All FACS respondents in the work history data.
Consistent with other analyses in this report, it can be seen that around half (49 per cent) of the respondents were in jobs 16 or more hours per week throughout a high proportion of the period covered by the data. The criterion we used initially for this group was 18 or more months in work of 16 or more hours per week, which includes around three-quarters of the period covered. A further quarter of the sample members had spent a substantial period of time not working. Within this category, the analysis distinguished one group on the basis of their having spent 20 or more months not working. A second smaller group was defined on the basis of 15 or more months spent not working, and no months in a mini-job among the remainder of the time.
Among the groups who did a mini-job, the first group (reading down the Table) is defined as having spent 12 or more months out of work, but one or more months in a mini-job, and these mothers accounted for six per cent of the sample. A second category (139 cases, three per cent) had spent similar proportions of the months in a mini-job and not working. The third group had spent 18 or more months doing mini-jobs, and there were 186 respondents in this group, who accounted for four per cent of the sample. Two further groups complete the categories with mini-jobs. The first of these were women who had done mini-jobs for at least 12 months, and had spent similar amounts of time either out of work or working. Finally, a small group (of 114 respondents, 2.4 per cent of the sample) had done both a mini-job and a full-time job for at least six months each. There were other people who had spent some time doing mini-jobs, but they were, by definition, people who had spent small amounts of time doing so, as compared with the time they had spent doing other activities.
In fact, the five categories of respondents just identified accounted for 90 per cent of all person-months spent in mini-jobs. Of these, the first two groups accounted
Patterns of labour market activity over time

80
for 43 per cent and 11 per cent, respectively. These people are counterparts of the ‘stable’ group in the analysis of mini-jobs by Iacovou and Berthoud. Those who combined mini-jobs with spells of not working accounted for a further 36 per cent of the person-months. They substantially outnumbered the final group of ten per cent, who were those who combined mini-jobs with spells of working 16 or more hours per month. Our conclusion from this is that, however influential the link may be for those to whom it applies, the transition between mini-jobs and jobs of 16 or more hours applied to a relatively small group of people, and the time these people spent in mini-jobs was relatively brief compared with the time they worked in more conventional jobs. The two clearly more predominant patterns that involved mini-jobs were movements between mini-jobs and spending long spells out of work, and a significant group who chose mini-jobs as a long-term strategy.
4.5.1 Status of mother, tenure and pattern of transition
It was seen previously that the differences in the rate of participation in paid work between couple mothers and lone parents at a point in time, that is in late 2005, were much smaller when we looked separately at each of the main categories of tenure. The analysis just discussed allows us to examine the question of whether this relationship between tenure and the proportion of mothers in paid work also holds true over a longer period of time. In order to do this, we have simplified the eleven categories in Table 4.3 into just three. All of the categories that mentioned a spell of working in a mini-job, however brief, have been combined into a middle category. The remaining categories that cover being out of work form the first of the categories, and those associated with working 16 or more hours per week form the final category. This approach, in Table 4.4, emphasises the role of mini-jobs.
Table 4.4 Predominant work history pattern by family type and tenure
Owners Renters/others Total Summary activity % % %
Couple mothers
Not working 13 46 19
Mini-job 18 16 18
Work 16 or more hours 69 38 64
Total 100 100 100
Base: Couple mothers 2,666 534 3,200
Lone parents
Not working 11 50 34
Mini-job 7 11 9
Work 16 or more hours 83 39 56
Total 100 100 100
Base: Lone parents 401 588 989
Patterns of labour market activity over time

81
Looking first at the work status of the mother (the ‘total’ column above), it can be seen that lone parents were more likely to have been predominantly in one of the ‘non-working’ categories than their counterparts who were couple mothers. Around a third of the lone parents (34 per cent) were non-working, compared with around one in five (19 per cent) of the couple mothers. Around twice as many couple mothers (18 per cent) had done mini-jobs as had lone parents (nine per cent), and this is what we would expect from the cross-sectional picture. As a result, more of the couple mothers (64 per cent) had been predominantly in full-time jobs. The percentage of lone parents who had been predominantly in full-time jobs was the same as the cross-sectional percentage (56 per cent) in 2005.
What Table 4.4 shows about the impact of tenure on the work history is what we would expect, having seen the relationship between tenure and working patterns in the wave 7 data in Chapter 3 of this report. As seen there, among the couple mothers and lone parents who rented their accommodation, the differences between their work histories were not substantial. The higher percentage of couple mothers who did mini-jobs was reflected in a smaller percentage who spent the majority of their time not working than among lone parents. Lone parents and couple mothers who rented were equally likely to have spent most of the time working 16 or more hours per week (38 and 39 per cent, respectively). Lone parents who owned their accommodation were the group that was most likely to have worked 16 or more hours per week for a majority of the work history (83 per cent). This reflected their being the group least likely (among the four groups in the analysis) to have been predominantly non-working or in mini-jobs.
Patterns of labour market activity over time

82
Figure 4.4 Couple mothers: work history quarters by tenure
Figure 4.4 shows graphically the composition of the summary classification of work histories among couple mothers. Each of the bars adds to 23, which is the number of months (or quarters) in the analysis. Each bar shows the mean number of months spent by the couple mothers in each of the three broad types of work status. The first three bars relate to renters and the lower set of bars relate to owners. The most straightforward of the types is the ‘Not in Work’ category among renters: it can be seen tha, on average, the mothers in this category spent 21.8 of the 23 months not working. The pattern among owners was similar. Among the ‘Not in Work’ group, on average only one and a half months per mother were spent in work. Among both of these groups, working in mini-jobs was very uncommon.
The category labelled ‘Full-Time Work’ was equally dominated by a single status: working 16 or more hours per week. For owners, 21 of the 23 quarters were spent in jobs. Neither working in a mini-job or not working at all accounted for a substantial proportion of the time.
The most diverse of the categories (as explained, this was by design) is that labelled ‘Mini-Work’, that is the mothers who spent a more than trivial amount of time
Patterns of labour market activity over time

83
in a mini-job. Table 4.3 showed that among couple mothers this accounted for 18 per cent of the owners and 16 per cent of the renters. Among the renters, the proportion of months spent in mini-jobs was just less than half. However, the important point is that working 16 or more hours per week formed a minor part of the work history of these people: they were five times more likely to be non-working than in a mini-job in any of the months when they were not in work of 16 or more hours. Among the owners, a slightly higher proportion of the months was spent in the mini-job (13.7 months), with fewer months (7.5 months) not working.
Figure 4.5 provides a similar picture of the profile of time spent in different activities among the lone parents. In many respects, the pattern matches that of the couple mothers. Among the owners, an appreciably higher proportion of the time was spent in jobs of 16 or more hours per week. Those in the ‘Mini-Work’ category spent slightly more time working in jobs of 16 or more hours per week than did their counterparts among the couple mothers. However, the proportion of time they spent not working was also greater. As with the couple mothers, those classified as not working spent a very small proportion of the time in work, and these lone parents rarely did mini-jobs. As noted elsewhere in this report, an owner was much more likely to have done some work than a renter.
Figure 4.5 Lone parents: work history quarters by tenure
Patterns of labour market activity over time

84
4.6 Summary
This chapter has looked at the history of mothers in the FACS sample in three ways. Firstly, we classified mothers’ by their activity status at each of the five interviews from waves three to seven. This made it necessary to restrict attention to the ‘balanced panel’ of the mothers interviewed on all five occasions. This showed the predominance of stable activities: the two largest groups were people who were in work of 16 or more hours per week throughout the period, or not working at all throughout the period. In terms of re-examining the Iacovou and Berthoud proposition, we found no predominance of flows from mini-jobs to working greater hours as compared with flows from mini-jobs to inactivity.
Secondly, we made use of the work history data collected on FACS. This approach gives an activity status for each ‘mother figure’ respondent at each wave of the study from wave three to wave seven, as well as for months between the dates of interviews and for 18 months before Wave 3. In practice, the data exist for 4,704 respondents between March 2000 and September 2005.
The finding that there were few cases where respondents moved from mini-jobs to working a greater number of hours was also observed when we looked explicitly for FACS sample members who had consecutive spells in which they were non-working, doing a mini-job and then working 16 or more hours per week. Out of 13,304 sequences, only 196 (1.5 per cent) represented this pattern40. We acknowledge that there were other sample members who were observed to make part of this series of transitions, who may have completed the three steps if we had been able to know about their prior situation or their later outcome.
The work history data allowed us to group sample members according to the proportion of time they spent in paid jobs of 16 or more hours per week, in mini-jobs and not working. For ease of manipulation, the data were converted to a series of 23 monthly activity statuses, each representing the last month of a quarter. This classification resulted in eleven categories (Table 4.3).
The key finding regarding mini-jobs was that only ten per cent of the people who did a mini-job during the period of five and a half years also spent an appreciable amount of time in work of 16 or more hours per week. The two dominant patterns associated with mini-jobs were doing them as a distinct, long-term pattern of behaviour, and doing them together with long period of time spent out of work. These spells of being out of work occurred both prior to and following spells in mini-jobs. This seems to be further evidence that the Iacovou and Berthoud proposition about mini-jobs acting as stepping-stones to full-time jobs is not supported (except on a small scale) by the experience of the FACS panel families.
40 It was possible for the same respondent to be counted more than once in this group for the same pattern of transitions, as the syntax allowed for the three stages to be over as many as five spells of activity.
Patterns of labour market activity over time

85
The work history data were also used to review the relationship between tenure and working. This analysis took account of data for a period of five and half years, whereas the analysis in Chapter 3 was for a single point in time. For this purpose, we grouped the eleven categories into just three broader groups: at one end were the people predominantly out of work, at the other those predominantly in jobs of 16 or more hours or week, while the intermediate group consisted of all the mothers who had spent a month or more in a mini-job. Tenure categories were also grouped into one set of ‘Owners’, including those who owned outright as well as a small number with a part-ownership arrangement, and a set of ‘Renters and others’. When the analysis was based on tenure, we found that the proportions of couple mothers and lone parents within each of the activity history patterns were very similar but not identical.
Mothers in couple families were slightly more likely to have been doing mini-jobs. Given that similar proportions of couple mothers and lone parents were working in jobs of 16 or more hours per week, this resulted in a slightly smaller proportion of the sample of couple mothers whose time was predominantly spent in a ‘non-working’ state.
Finally, we showed how many of the 23 months were spent in each of the three broadly-defined labour market statuses according to tenure. Figure 3.7 showed that being a couple family or lone parent family made very little difference to the propensity to work when we compared them by tenure. As a generalisation, those mothers who owned their property or were buying it on a mortgage had a very high propensity to be working. Among renters, particularly those renting in the social housing sector, it was much more common for the majority of the work history to have been spent not working.
The implications of this for policies designed to increase the proportion of the working age population participating in paid work are not entirely clear. Given the current system of financial support for non-working families in the social rented sector of housing, there may be little or no ‘slack’ capacity to work among lone parents. Another way of looking at this set of findings is that, since their situation is so similar when we group mothers by tenure categories, any new policy measures should be designed to apply in a similar way to couple families as they are intended to apply to lone parents. The ‘renting deficit’ deserves closer attention, and we return to consider some implications of this in drawing conclusions on this study in Chapter 6.
Based on the labour market behaviour exhibited by the FACS panel members over more than five years, we consider that mini-jobs may have a role as an element within a package of measures to encourage ‘supply-side’ changes in behaviour. However, on the evidence from FACS, they appear to have little potential to make a substantial contribution to raising participation in work by lone parents. It may be that further increases in their use by couple mothers would be a more achievable contribution towards targets for participation in work according to the Labour Force Survey measure.
Patterns of labour market activity over time


87
5 Analysis of transitions in labour market status In this chapter the focus of the analysis is on the changes in activity over the course of around five years, as recorded by Families and Children Study (FACS) waves 3 to 7. This allows us to look at the movement of mothers into and out of mini-jobs and to identify the characteristics of the mothers making different transitions. The aim is to increase our understanding of how mothers were using mini-jobs to participate in the labour market.
The analysis looks at mothers’ activity status in two ways. Initially, we look at the labour market status of mothers over the period of around 12 months between two consecutive FACS interviews. Secondly, we use the FACS work history data to look at the transitions of mothers between different spells of activity, when the spells may be of varying lengths.
In both of these analyses, we start by comparing the pattern of transitions between activity statuses made by couple mothers and lone parent mothers. This reflects the point noted earlier that couple mothers were more likely to use mini-jobs. The number of lone parents who used mini-jobs was too small to allow further analysis. However, the activity transitions of couple mothers were analysed in more detail. Three patterns of transition were of particular interest:
• movementfromaninactivestatetoworkinginamini-job;
• movementfromamini-jobintoaninactivestate;
• movementfromamini-jobintoworkoflongerhours.
We found significant differences between the types of couple mothers making different transitions, and these are described in more detail below.
5.1 Analysis of 12-month transitions
The analysis of the 12-month transitions involved the FACS data for waves 3 to 7 being re-structured to give a data set where each record represented a mother
Analysis of transitions in labour market status

88
who was interviewed at two consecutive FACS waves. Each record contained information on her status in the initial interview (time t) and her status around 12 months later (time t + 1). For example, those mothers who had taken part in FACS waves 3, 4, 5 and 6 would appear three times in the data set, which will contain a record for the periods covered by waves 3 and 4, another record for waves 4 and 5 and another for waves 5 and 6. Mothers did not need to have been involved in all waves of FACS to appear in the data set, although they did need to have taken part in at least two consecutive interviews. If a mother had only taken part in a single year of FACS, or had not taken part in any consecutive years, then she was not included in the analysis.
The data includes information on the mother’s activity status at times t and t + 1 (around 12 months later), along with a set of personal, family and work characteristics. These are summarised in Table 5.1. A full list of the variables used in this analysis is given in Appendix A, Table A.1. The mothers’ personal, family and work characteristics were used to assess whether there were differences in the types of mothers making certain transitions.
Table 5.1 Personal and work characteristics used in the analysis
Time t Time t + 1
Mother personal characteristics
Mothers age (grouped)
Longstanding illness or disability
Highest academic qualification
Age mother left full-time education
Ethnicity of mother
Mother work characteristics
Mother work status
Mother in self-employed work
Mother SOC code
Whether mother was looking for work
Average hours mother worked per week
Number of hours mother worked (grouped)
Job type (permanent/temp/fixed)
Whether mother was paid hourly
Mothers hourly pay (grouped)
Time in years since mother last had paid employment (grouped)
Partner characteristics
Whether new partner present in the household
Partner work status
Partner SOC code
Continued
Analysis of transitions in labour market status

89
Table 5.1 Continued
Time t Time t + 1
Family/household characteristics
Age of mother and youngest child
Number of dependent children
Age of youngest child
Equivalised family income after housing costs (AHC) below 60 per cent median
Equivalised family income before housing costs (BHC) below 60 per cent median
Living Standards/Hardship index
Worry about money
Bed standard overcrowding measure
Receive tax credits
Working Families’ Tax Credit (WFTC) received
Annual household income (grouped)
Tenure
Government Office Region
5.1.1 Transitions and family status
The full data set contained 24,117 transitions, 16,705 of which were made by couple mothers and 6,192 by lone parent mothers. A much smaller number, 1,220 transitions, were made by mothers who had either ended or started a relationship during the same time period. Mothers who changed family status between two years of FACS have been excluded from the following analysis. This is because a change in family status often coincides with a change in the mother’s work status. We did not wish to confound our results by including these mothers and their numbers were too small to analyse separately: The transitions in activity status made by couple mothers and lone parent mothers are given in Tables 5.2 and 5.3, respectively.
In both of these tables, the columns represent the mother’s status in the first year, while the rows of the table show the mother’s status in the second year. For example, the cell at the top left shows the group of mothers who were working 30 or more hours per week at both points in time (which, in the case of couple mothers, was 84 per cent of the couple mothers who were doing this at time t). The cell below this shows that 11 per cent of the couple mothers who were working 30 or more hours per week in time t had reduced their hours to 16-29 hours per week at time t + 1. As this shows, the table uses column percentages. However, the table also shows the percentage of the mothers in each of the activity statuses at time t, and this involves percentages that sum across this row.
Analysis of transitions in labour market status

90
Table 5.2 Paired transitions of couple mothers
Activity at t
Work Work Work 30+ hours 16-29 hours 1-15 hours per week per week per week Not working Activity at t + 1 % % % %
Work 30+ hours per week 84 13 4 4
Work 16-29 hours per week 11 73 20 8
Work 1-15 hours per week 2 7 58 10
Not working 3 6 17 78
Base 5,049 4,892 2,152 4,612
Row percentage 30 29 13 28
All transitions made by couple mothers in Waves 3 to 7 (n = 16,705).
Table 5.3 Paired transitions of lone parent mothers
Activity at t
Work Work Work 30+ hours 16-29 hours 1-15 hours per week per week per week Not working Activity at t + 1 % % % %
Work 30+ hours per week 86 13 4 3
Work 16-29 hours per week 9 74 20 6
Work 1-15 hours per week 1 3 48 3
Not working 4 11 28 87
Base 1,415 1,476 299 3,002
Row percentage 23 24 5 48
All transitions made by lone parent mothers in Waves 3 to 7 (n = 6,192).
A comparison of the transitions made by couple and lone parent mothers shows some interesting results. The largest difference, which is covered elsewhere in this report, is that lone parent mothers were much less likely to use mini-jobs than couple mothers: 299 of the transitions made by lone parent mothers started with the mother in a mini-job at the beginning of the 12-month period. This represented five per cent of lone parent mothers doing a mini-job at time t. Similarly, 2,152 of the transitions made by couple mothers started with the mother in a mini-job, which represented 13 per cent of all the couple mothers at time t.
A similar pattern can be seen with mothers starting in other activity statuses and moving into mini-jobs by the end of the 12-month period; there were 2,147 transitions (13 per cent) for couple mothers and 289 (five per cent) for lone parent mothers (Table not shown). For both sets of mothers the number of transitions
Analysis of transitions in labour market status

91
made into mini-jobs from any activity was very similar to the number of transitions made from mini-jobs into any activity. This indicates the use of mini-jobs by both sets of mothers was fairly stable during the 5 waves of FACS.
Lone parent mothers were less likely to spend longer periods of time doing mini-jobs than couple mothers. Of the 2,152 couple mothers who started the period in a mini-job, 58 per cent were still in a mini-job 12 months later. The figure for lone parents who remained in a mini-job (although not necessarily the same job throughout this period) was 48 per cent. The difference between these figures was linked to the larger proportion of lone parent mothers moving out of work. Of the lone parent mothers who were initially in a mini-job, 28 per cent had ceased working 12 months later, compared to 17 per cent of couple mothers. For both sets of mothers, 24 per cent had moved from a mini-job at time t to working 16 more hours per week at time t + 1.
An interesting general point in Table 5.2 is that more of the transitions made by lone parents resulted in a move into the inactive category, whatever the starting activity. Once inactive, the lone parents were also more likely to remain inactive. Of the lone parents who were inactive at the start of the 12 month period, 87 per cent were in the same labour market status 12 months later. This compares with 78 per cent of the transitions made by couple mothers from the same starting position41.
The majority of mothers who increased their hours from a mini-job went into ‘part-time’ work of 16-29 hours (20 per cent), rather than ‘full-time’ work of 30 hours or more (four per cent). Additionally, mothers working 16-29 hours per week at time t were more likely to move into a mini-job than was the case for mothers working 30 or more hours per week. This was true for both couple mothers and lone parent mothers.
Compared to the other activity states, the mini-job category may be described as the most ‘transitional’ of the four main activity groups. However, this finding is
41 A comparison can be made between the FACS figures and the tables of transitions presented by Blundell et al. (2005), from a study based on the British Household Panel Survey (BHPS) data. The BHPS data showed the same percentages of couple and lone parent mothers stayed in a mini-job after a 12-month period; 58 per cent and 48 per cent for couple and lone parent mothers, respectively. Similar, but marginally lower, proportions of mothers stayed in full-time work of 30 or more hours; 84 per cent of lone parents and 82 per cent of couple mothers. There were larger differences in the proportions of mothers who remained inactive in the labour market after a 12-month period. The BHPS showed 72 per cent of lone parent mothers remained inactive, rather than 87 per cent, and 82 per cent of couple mothers, rather than 78 per cent. Blundell, R, Brewer, M. and Francesconi, M (2005) Job Changes, Hours Changes and the Path of Labour Supply Adjustment, Institute for Fiscal Studies, Working Paper 21, 2005.
Analysis of transitions in labour market status

92
relative to the high levels of stability found in the other activities, notably the full-time and non-working categories. Although mini-jobs were done by mothers who had a higher overall propensity to move to a different activity category by time t + 1, nevertheless, over half of the mothers in a mini-job at time t were also in the same type of work the following year. This indicates, as shown in Chapter 4, that mini-jobs are a long-term activity for a large number of mothers.
5.1.2 Transitions and tenure
We have already demonstrated in Section 3.4.3 that there was a strong association between specific forms of housing tenure and the proportion of mothers in paid work. It should be noted that this association does not imply that one factor causes the other, but it demonstrates that different types of mothers are more, or less, likely to be involved in different activities. Mothers in rented accommodation, particularly those in social rented accommodation, were less likely to be in paid work than those who owned their accommodation outright or who had a mortgage. Lone parent mothers were more likely to be in social rented accommodation than mothers in couple families. So far we have shown there were differences between the transitions made by lone parent and couple mothers. We wanted to check whether the lone parent and couple mothers transitions would follow a more similar pattern if we looked at the transitions separately by tenure. Tables 5.4 and 5.5 show the transitions made by couple mothers and lone parents, separately for owners and renters.
This analysis shows that there were more similarities in the transitions made by renters than those made by owner-occupiers, although there were still some important differences. Tables 5.3 and 5.4 show that both sets of mothers were less likely to have had a mini-job when they lived in social or private rented housing. Among renters, couple mothers were more likely than lone parent mothers to have used a mini-job. Of the transitions made by couple mothers in rented accommodation, ten per cent were in a mini-job at time t, compared to six per cent of the lone parent mothers. Lone parent renters were also more likely than couple mothers to move from paid work to being inactive, although the difference was small.
There was more variation in the proportion of mothers doing mini-jobs amongst the owners. In this case, only three per cent of the transitions made by lone parent mothers started with the mother working in a mini-job. About half of these periods (49 per cent) ended with the mother still working fewer than 16 hours. Couple mothers in owned accommodation were the group most likely to use mini-jobs and more of them did so for long periods of time; 13 per cent of these periods had started in a mini-job and 60 per cent of these periods ended with the mother in the same type of work.
Analysis of transitions in labour market status

93
Tab
le 5
.4
Act
ivit
y tr
ansi
tio
ns
of
ow
ner
s in
FA
CS
wav
es 3
to
7
C
ou
ple
mo
ther
s –
acti
vity
at
t Lo
ne
par
ent
mo
ther
s –
acti
vity
at
t
W
ork
W
ork
W
ork
N
ot
Wo
rk
Wo
rk
Wo
rk
No
t
30+
ho
urs
16
-29
ho
urs
1-
15 h
ou
rs
wo
rkin
g
30+
ho
urs
16
-29
ho
urs
1-
15 h
ou
rs
wo
rkin
g
Act
ivit
y at
t +
1
%
%
%
%
%
%
%
%
Wor
k 30
+ h
ours
85
13
4
4 92
15
7
5
Wor
k 16
-29
hour
s 11
75
20
9
6 78
28
12
Wor
k 1-
15 h
ours
1
7 60
13
1
1 49
6
Not
wor
king
3
5 16
75
1
6 16
76
Base
4,
561
4,34
6 1,
865
3,07
4 92
9 72
0 69
36
2
Row
%
33
31
13
22
45
35
3 17
All
tran
sitio
ns b
y ow
ners
, inc
lude
s sh
ared
ow
ners
hip
(n =
13,
846
coup
le m
othe
rs a
nd 2
,080
lone
par
ents
).
Mot
her’s
fam
ily s
tatu
s is
at
t an
d t
+ 1
, mot
hers
who
cha
nged
fam
ily s
tatu
s w
ere
not
incl
uded
.
Tab
le 5
.5
Act
ivit
y tr
ansi
tio
ns
of
ren
ters
in F
AC
S w
aves
3 t
o 7
C
ou
ple
mo
ther
s –
acti
vity
at
t Lo
ne
par
ent
mo
ther
s –
acti
vity
at
t
W
ork
W
ork
W
ork
N
ot
Wo
rk
Wo
rk
Wo
rk
No
t
30+
ho
urs
16
-29
ho
urs
1-
15 h
ou
rs
wo
rkin
g
30+
ho
urs
16
-29
ho
urs
1-
15 h
ou
rs
wo
rkin
g
Act
ivit
y at
t +
1
%
%
%
%
%
%
%
%
Wor
k 30
+ h
ours
79
13
5
3 76
10
3
3
Wor
k 16
-29
hour
s 12
64
22
5
13
71
18
5
Wor
k 1-
15 h
ours
3
9 46
4
1 4
48
3
Not
wor
king
6
14
27
87
10
15
32
89
Base
42
3 49
9 25
1 1,
456
431
715
226
2,56
0
Row
%
16
19
10
55
11
18
6 63
All
tran
sitio
ns m
ade
by s
ocia
l and
priv
ate
rent
ers
(n =
2,6
29 c
oupl
e m
othe
rs a
nd 4
,032
lone
par
ents
). M
othe
r’s f
amily
sta
tus
is a
t t
and
t +
1, m
othe
rs w
ho c
hang
ed f
amily
sta
tus
wer
e no
t in
clud
ed.
Analysis of transitions in labour market status
94
The proportion of couple mothers doing mini-jobs varies more by tenure than does the corresponding proportion of lone parents. Our findings suggest tenure only accounts for a minor part in the differences in the proportions of lone parent and couple mothers using mini-jobs. However, this finding is specific to the use of mini-jobs, rather than the general rate of participation of mothers in the labour market.
In the remainder of this section we present the results from further analyses on couple mothers’ use of mini-jobs. The number of lone parents participating in mini-jobs was too small for any detailed analysis; hence we concentrate on couple mothers only and aim to understand how couple mothers were using mini-jobs. Gaining an insight into the role mini-jobs play in couple mothers’ participation in the labour market may increase our understanding of the potential relevance of mini-jobs for lone parents.
5.1.3 Factors associated with moving from inactivity to work
In the first analysis, the focus is on couple mothers who have taken up work in the last year. Among couple mothers who were inactive at time t, a comparison is made between:
• motherswhomovedintoamini-job;and
• motherswhotookupworkof16hoursormoreperweek.
In this analysis, we were modelling factors relating to the hours the mother is likely to work, rather than the mothers propensity to take up work in the first place. The models identify differences between mothers who moved into a mini-job and mothers who moved into work of 16 hours or more. The mothers who moved into part-time work (16 to 29 hours) have been grouped with the mothers who moved into full-time work (30+ hours) since the latter group did not have sufficient numbers for a separate analysis. The aim was to identify the characteristics of non-working mothers who were more likely to take up a mini-job than work of longer hours.
Methods used to analyse paired transitions data
The first stage of the analysis of the mothers who moved from inactivity to work was to run a number of cross tabulations of the outcome variable against the personal, family and job characteristics outlined in Table 5.1 and Table A.1. The association of each characteristic to the outcome variable was tested using a chi-squared test. The variables significantly related to the outcome according to the chi-squared test were used in the modelling. These were mother’s age, number of dependent children, whether mother had worked in the last year, whether
Analysis of transitions in labour market status

95
there had been a new partner in the household in the 12 months prior to time t42, partner’s Standard Occupational Classification (SOC) code, tenure and whether the household income was greater than 60 per cent of the median. The distributions for these variables have been given in Table A.2.
The next stage was to conduct a multivariate analysis on the mothers moving into work. A multivariate analysis allows us to look at more complicated relationships in the data and explore them in more detail. This approach involved modelling the data using a random effects model43. The analysis was run on 944 couple mothers who were inactive at the start of the transition but were in a spell of working one or more hours per week around one year later.
5.1.4 Differences in characteristics of couple mothers moving into work
The full outputs from the multivariate analysis can be seen in Table A.3. There was evidence of significant differences between mothers who moved from a period of inactivity into working 16 or more hours per week and mothers who started at the same point and moved into a mini-job. The model showed that mothers were significantly more likely to move into work of 16+ hours if they were:
• younger(agedunder26);
• hadyoungerchildren;and
• wererentingsocialhousing.
42 For clarity: this variable flags mothers who had a new partner in the year prior to the start of the 12 month transition. Their family status does not change during the actual transition period. Mothers who changed family status during the 12 month transition period were excluded from the analysis.
43 Since the unit of analysis is the transition, individuals can appear more than once in our data. Data containing individuals that were observed more than once contain less variability than data consisting entirely of unique individuals. Traditional methods of analysis assume all individuals in a data set were unique. In addition, they ignore the variability that is found between transitions and will only model the variability found between individuals. This means the standard errors and confidence intervals will be inaccurate. A random effects model allows the variability that is found between transitions to be incorporated into the modelling process. By including information on variability across transitions (instead of just individuals) the analysis generated standard errors, confidence intervals and significance tests that were more accurate. These estimates were typically more conservative than those produced by a traditional model as they would have otherwise taken this information into account. The analysis was run in Stata version 9 using the xtlogit command with random effects. The analysis uses a binary outcome because multinomial random effect models are not yet available.
Analysis of transitions in labour market status

96
Mothers were significantly more likely to move into a mini-job if:
• theirpreviousoccupationhadbeeninsalesandcustomerservicesorinsemi-skilled and unskilled work;
• theywereolder(aged26orover);and
• theywerelivinginowner-occupiedhousing.
Specifically, mothers who moved into a mini-job were three times as likely to be aged 26 or over. These mothers were consistently more likely to move into a mini-job than work of 16 hours or more. Mothers in mini-jobs were also five times as likely to have been semi-skilled or unskilled in their last job and nearly three times as likely to be in sales and customer services as they were to be in a professional and managerial occupation. Mothers who started working 16 or more hours a week were more than twice as likely to be social renters than owner-occupiers. One key reason for this is the greater opportunity for moving into work among renters. Most of the mothers who were in owned occupation were already in work as a stable activity.
5.1.5 Factors associated with the movement away from mini-jobs
The second and third analyses looked at the movement of mothers who started the period in a mini-job. Two models were run. The first compared mothers who remained in work of one to 15 hours at the end of the 12 months with the mothers who had increased their working hours to 16 or more per week. The second model looked at the mothers who moved out of the labour market, comparing them with the mothers who continued to work in mini-jobs. The aim was to identify, for mothers who had been using mini-jobs, whether there were characteristics associated with whether they were likely to increase their hours (to become part-time, working 16 to 29 hours per week, or full-time and working 30 or more hours per week). Likewise, for the third part of the analysis, we were looking at the characteristics of mothers who had left the job market. The methods of analysis used were the same as those described in Section 5.1.2. The two analyses are outlined in more detail below.
5.1.6 Movement away from the labour market
This analysis looked at mothers who were in a mini job at the start of the 12-month period, comparing mothers who remained working one to 15 hours with mothers who left the labour market. As before, the mothers’ personal, family and work characteristics described in Table A.1 were used in the analysis. Chi-squared tests were used to test the distribution of responses across the cells of the tables and flag variables that were significantly associated with a mother leaving the labour market. The significant variables were entered into the regression model. The cross tabulations are shown in Table A.4.
Analysis of transitions in labour market status

97
The model showed that the age of the mother was strongly related to her likelihood of moving out of the labour market. A younger mother was more likely to move out of work, and this was unrelated to the age of her youngest child. The strongest predictor was the mother’s occupation (SOC code). Couple mothers leaving the labour market were more likely to have been working in professional and managerial work than skilled and clerical, sales and customer services, semi-skilled and unskilled work. The hours that a mother worked in a mini-job were also related to the likelihood of her leaving. Mothers who left work were twice as likely to have been working nine to 15 hours a week than one to eight hours. Couple mothers leaving work were more likely to be in a family that was claiming tax credits and more likely to be social renters.
The higher proportion of social renters leaving work may initially seem inconsistent with the occupational profile; a higher proportion of professional and managerial mothers also left work. However, there was very little overlap between the two groups, only two per cent of the professional mothers were also social renters. This suggests there were two fairly distinct groups of mothers leaving mini-jobs. The couple mothers working one to 15 hours in professional occupations overwhelmingly came from owner-occupied housing. The other group consisted of social renters, of whom 65 per cent were in semi and unskilled occupations. These mothers were likely to be low earners. The full model is given in Table A.5.
5.1.7 Movement into work of 16 or more hours
This analysis looked at couple mothers who were in a mini-job at the start of the transition and were still in work 12 months later. The aim was to compare mothers who stayed in a mini-job and mothers who increased their hours. The work of 16 or more hours could be an extension of hours in the same job or a different job of longer hours. As before, a number of cross tabulations were run on the response and variables outlined in Table A.1. Chi-squared tests were then used to flag variables that were significantly associated with a mother moving into work of 16 hours or more. These tables can be seen in Table A.6. The significant variables were entered into the regression model.
The analysis found that couple mothers extending their hours tended to be younger, regardless of the age of their youngest child. They were less likely to have a partner who worked full time and were more likely to be social renters. Mothers who moved into work of 16 or more hours from a mini-job were more likely to have previously been in temporary or fixed term work of one to eight hours. Couple mothers who remained in a mini-job at the end of a 12-month period were more likely to have been previously working in a permanent job of nine to 15 hours. They were also more likely to live in owner occupied accommodation and to have a partner who was working fewer than 30 hours per week. The full model is given in Table A.7.
Analysis of transitions in labour market status

98
5.1.8 Conclusions from the analysis of 12-month transitions
The aim of the analysis of 12-month transitions was to identify factors associated with the movement of mothers into and out of mini-jobs. Initially, we compared the number and direction of transitions made by couple mothers and lone parent mothers, looking for differences in their work patterns. This confirmed that couple mothers who were initially non-working were more likely than lone parents to move into, and to have longer spells in, work of one to 15 hours per week. On the other hand, this analysis also showed lone parent mothers were more likely to move out of the labour market, whatever hours they were working at the start of the 12-month period. When we repeated the analysis on the basis of owned and rented accommodation tenure, these differences remained. However, the differences were more pronounced for mothers in owned accommodation. There was more similarity in the behaviour of couple mothers and lone parents in rented accommodation.
We then looked at the behaviour of couple mothers in more detail. Specifically, we looked at three transitions made by couple mothers:
• themovementofnon-workingmothersintoamini-job;
• themovementofmothersfrommini-jobsintolongerhoursofwork;
• themovementofmothersfromminijobsintoinactivity.
The evidence showed a significant relationship between mini-jobs and age, after controlling for other factors. In each analysis, older mothers were more likely to move into a mini-job and to be doing a mini-job when next interviewed after a 12-month period. Younger mothers were much more likely to make transitions into work of 16 or more hours, both from a mini-job and from a non-working status. Younger mothers in mini-jobs were also more likely to move out of the labour market.
Two of the analyses looked at a sub-set of mothers who were in mini-jobs at the start of the 12-month period. In both analyses the number of hours the mother worked was significantly related to the transitions they made. Couple mothers working one to eight hours per week were more likely to stay in work than leave. Where they stayed in work they were more likely to increase their hours. Compared to couple mothers working nine to 15 hours per week, mothers working one to eight hours were more likely to move into work of 16 or more hours than they were to stay in a mini-job. However, where the alternative was to move out of work, the mother was more likely to stay in the mini-job than leave it.
The transitions made by couple mothers who had a mini-job at time t were also linked to the type of work they were doing. Couple mothers, working in a temporary or fixed-term job, were much more likely to increase their working hours to 16 or more hours than couple mothers working in a permanent job. We would expect mothers doing temporary work to be more likely to make a transition from mini-job into another status within the space of 12 months. However, whether the
Analysis of transitions in labour market status

99
work was temporary or permanent was significantly related only to a move into more hours, and was not associated with making a move away from the labour market.
Couple mothers staying in mini-jobs tended to be in professional occupations, to be living in owner occupied accommodation, and to have a partner working 30 or more hours per week. They were also less likely to have had a new partner in the year before the start of the transition period. Although income itself was not significant in the models, these findings suggest that a combination of a stable relationship and higher income were associated with working in a mini-job tending to be a longer-term activity. In the context of the potential for more lone parents to take up mini-jobs, this conclusion appears to indicate the lack of a partner is a barrier to longer-term use of mini-jobs by lone parents. We conclude that lone parent mothers are intrinsically unlikely to use mini-jobs to the same extent as couple mothers do, even if policy measures were aimed at reducing some of the other barriers such as earnings disregards.
There were a number of similarities between couple mothers who moved from no work to work of 16 or more hours and couple mothers who moved from a mini-job to work of 16 hours or more. For both transitions the couple mothers tended to be younger, to be social renters and they were less likely to have a partner working full time (30 or more hours per week).
We can see some parallels between the situation of couple mothers in social rented accommodation and many lone parent mothers: for both of these groups, the operation of the benefit and tax credits systems means that there is little incentive to take up work of one to 15 hours per week. They are generally faced with a choice between not working and claiming Housing Benefit (HB) and Income Support (IS) or of working 16 or more hours per week and claiming Tax Credits.
The results of the 12-month transitions have provided a number of insights into the behaviour of mothers using mini-jobs. There appeared to be certain groups of mothers for whom mini-jobs were useful and other groups who found less advantage in them. The analysis of 12-month transitions has shown there to be a difference in the movement of mothers into and out of mini-jobs by family status. Lone parents were less likely to use mini-jobs and, when they did so, were less likely to remain in them for periods of more than 12 months. The transitions made by couple mothers showed that there were specific types of mothers who were more likely to use mini-jobs, specifically those who were older, those who had a stable relationship with a partner who worked full-time and those who owned their accommodation or who were buying it with a mortgage. Altogether, this suggests lone parent mothers were intrinsically unlikely to use mini-jobs in large numbers as a long-term option; this is an important finding.
5.1.9 Limitations of the 12-month transitions
There were a number of limitations to the analysis of yearly transitions, the main one being the loss of spells of activity that were too short to be picked up in
Analysis of transitions in labour market status

100
a 12-month transition. The 12-month period means any spells that started and finished between the two interview dates were lost. Any spell that lasted longer than 12 months was also incorrectly identified, as no change was apparent at the end of the 12 month period. In addition, transitions made between spells of working and/or different jobs that fell into the same activity category were lost as they were counted as being in the same spell. This is a slightly artificial situation, although it could be argued that it is the category or type of work that is of interest, rather than the actual job. The jobs a mother moved between, including mini-jobs, were quite likely to be similar in nature, for example in terms of the occupational category and skill requirements.
The 12-months transition data did not distinguish between longer and shorter spells of work, since we were looking at changes in activity for a standardised length of time. Although we can comment on the types of mothers who were likely to still be in work at the end of the 12-month period, we were unable to look at the length of the spell in any detail. By missing short spells we may also have biased the transition data towards those mothers that spent longer periods in mini-jobs.
The FACS work history data already described in Chapter 4 provides information about spells of all lengths. This type of data also enables us to look at the time a mother spent in a spell. Together with the analysis already carried out, this will give us a fuller picture of mothers’ work patterns.
5.2 Analysis of the Families and Children Study work history data
The analyses in this section were carried out on the FACS work history data file prepared by Dr Gillian Paull at the Institute for Fiscal Studies44. The work history data contains information on all spells of activity of mothers, including information on the type of activity carried out, the hours worked and the duration of the spell. To this we added a number of variables from the FACS data files; a set of personal, family and work variables were added by taking the characteristics from the wave in which the activity spell ended. The data were re-structured to enable analysis of the transitions made by mothers between different activity states. Each row of data was a transition made by a mother between two activities. The transitions were analysed by comparing the previous spell to the following spell (or to the ‘current’ spell in the case of Wave 7).
This analysis only looks at a sub-set of the activity spells in the work history data as a number of spells have been excluded from the following analysis. The original data set contained 13,304 activity spells. We have dropped:
44 The data structure and the editing that was carried out have been documented in Paull, G. (2006) User Guide for the FACS Work History Data Release 2: Waves 1-7, a report submitted to the Department for Work and Pensions (DWP).
Analysis of transitions in labour market status

101
• 2,654spellscarriedoutinWaves1and2(whenonlylowerincomehouseholdswere eligible for the sample);
• 265spellswherethehouseholddidnotcontainanydependentchildrenunderthe age of 19; and
• 46malerespondents.
All mothers with a single spell of activity were also dropped. There were 2,010 mothers with a single spell of activity, this amounted to 46 per cent of eligible mothers. For the couple mothers, 65 per cent of these single spells were for continuous periods of working 16 hours or more, while 30 per cent were spells of inactivity. For lone parents, these figures were 42 per cent and 57 per cent, respectively.
There remained 7,641 activity spells made by 2,636 mothers, these amount to 5,280 paired transitions.
In this analysis the focus is on entire spells of work, the lengths of which vary enormously. Note that time spent doing various activities outside the labour market have been grouped into single spells of non-work. In addition, part-time (16 to 29 hours) and full-time (30 or more hours) work have been grouped into a single category of working 16 or more hours per week. The length of spells is recorded in months.
Mothers who changed family status over the course of the activity spell have been dropped from the analysis. This is to avoid confounding the findings about employment with changes in family status.
5.2.1 Analysis of transitions in the work history data
As before, a comparison was made of the transitions made by couple mothers and those made by lone parent mothers. Lone parents tended to have shorter spells of activity, and more of them. The mean length of spells of activity was 49 months for lone parents, compared with 55 months for couple mothers. Lone parents had a mean of 4.4 spells of activity in the work histories from five waves of FACS, compared to 4.2 spells for couple mothers45. This difference is significant at the 95 per cent level.
45 This ties in with the findings from Evans, M., Harkness, S. and Ortiz, R. (2004) Lone parents cycling between work and benefits, DWP Research Report No. 217.
Analysis of transitions in labour market status

102
Tables 5.6 and 5.7 shows the number and direction of transitions made by couple mothers and lone parents, respectively, from the work history data. Mothers who remained out of work for the entire period, even if they cited different circumstances at different times, are treated as not having made any transitions and they do not appear in the following tables46.
Table 5.6 Transitions made by couple mothers
Activity in previous spell
Not in work 1-15 hours 16+ hours % % %
Activity in later or current spell
Not in work 0 49 36
1-15 hours 45 20 6
16+ hours 55 31 58
Base 1,131 781 1,774
Row percentages 31 21 48
All transitions made by couple mothers in Waves 3 to 7 (N = 3,686 transitions made by 1,754 mothers).
The movement of mothers out of work of 16 hours or more is very similar for both family states. Nearly 60 per cent of couple and lone parent mothers ended one spell of work of 16 hours or more and started another spell of similar work. Very few mothers, whether lone parents or couple mothers, left a spell of working more than 16 hours for a mini-job.
46 The work history data contains fewer transitions than the 12-month data. This is because the work history data only gives transitions for changes in activity, rather than every 12 months. Since the majority of activities carried out by a mother last at least three years, the total number of transitions are fewer. The data also excludes mothers with the same activity continuously in a single spell throughout the time they participated in FACS waves 3 to 7, but who would have appeared in the 12-month analysis.
Analysis of transitions in labour market status

103
Table 5.7 Transitions made by lone parents
Activity in previous spell
Not in work 1-15 hours 16+ hours % % %
Activity in later or current spell
Not in work 0 57 38
1-15 hours 25 15 3
16+ hours 75 28 59
Base 479 158 716
Row percentages 35 12 53
All transitions made by lone parent mothers in Waves 3 to 7 (N = 1,353 transitions made by 641 mothers).
There were more differences between the two groups of mothers when attention is turned to other transitions, specifically the movement into work from a non-working status. Whilst both sets of non-working mothers were more likely to move into work of 16+ hours than a mini-job, this difference was more pronounced for lone parent mothers. The proportion of couple mothers moving from inactivity to a mini-job was nearly as high (45 per cent) as the proportion moving into work of longer hours (55 per cent). Lone parent mothers were much more likely to move into work of 16 hours or more (75 per cent) than into a mini-job (25 per cent).
It can also be seen that among those who were initially doing a mini-job, lone parents were more likely to move out of work from a mini-job. Half the couple mothers (49 per cent) who had a spell of working in a mini-job were not-working in the subsequent spell. Among lone parents, the proportion doing this was greater (57 per cent). Couple mothers were more likely to move to another mini-job (20 per cent) than was the case for lone parents (15 per cent).
The work history data allows us to look at the length of time in months spent in the previous and following activity spells. This allows us to look for patterns between time spent in different activities and the transitions made. Table 5.8 shows the mean time in months spent in previous and current activity. In general, the length of the current spell will be shorter than the previous spell because the spell is right censored (we do not know the end dates). However, the table is still useful as it allows a comparison to be made between the different activity states.
Table 5.8 indicates that mothers moving from mini-jobs to work of longer hours tended to be those who had spent longer periods working in mini-jobs. This was true for both couple mothers (31.9 months) and lone parents (18.6 months). However, as seen previously, this shows that the average length of time spent in a mini-job was shorter for lone parent mothers.
Lone parent mothers had spent shorter periods of time in spells of work and longer periods out of work than was seen for couple mothers. A lone parent moving
Analysis of transitions in labour market status

104
out of work was more likely to spend longer out of work than a couple mother, whatever hours she had previously been working. Likewise, a lone parent mother who moved into work from a non-working state will typically have spent longer than a couple mother in the non-working state before making the transition.
Table 5.8 Mean time in months spent in activity spells and transitions made
Couple mothers Lone parents
Mean Mean Mean Mean months in months in months in months in previous current previous current Transition spell spell spell spell
No work – Emp. 1-15 45.9 12.6 63.9 8.7
No work – Emp. 16+ 32.5 17.6 48.5 13.1
Emp. 1-15 - No work 27.4 16.2 9.8 18.6
Emp. 1-15 – Emp. 1-15 26.0 13.7 10.5 10.0
Emp. 1-15 – Emp. 16+ 31.9 20.8 18.6 19.8
Emp. 16+ - No work 46.2 15.8 21.8 16.4
Emp. 16+ - Emp. 1-15 32.2 12.6 13.4 11.4
Emp. 16+ - Emp. 16+ 46.6 18.8 28.0 14.9
All transitions 39.8 16.7 33.3 14.4
All transitions made by mothers in Waves 3-7 (N = 3,686 transitions made by couple mothers and 1,353 by lone parents).
The length of time spent by couple mothers in work of more than 16 hours does not seem related to their transitions; the mean length of time spent in work of more than 16 hours for couple mothers who then moved out of work (46.2 months) was very similar to that of couple mothers who stayed in work of 16 hours or more (46.6 months).
5.2.2 Factors relating to the length of activity spells
The previous tables show that there were some relationships between the length of time spent in a spell of activity and the transitions made by the mother. Longer spells in work indicate stability, that is, the mother was likely to have had a more permanent, secure job. It was felt that factors relating to the length of spells were worth investigating in more detail.
The length of time spent in previous spells was positively and significantly related to the length of time spent in subsequent spells (p<0.05), hence a longer period of time spent in a previous spell implies an increased likelihood that a greater number of months will be spent in the subsequent (or current) activity spell. The work history data also indicates there was a set of mothers who were making a number of transitions between different activities, whilst spending only a relatively short period of time in each of them. A number of factors were likely to be involved in this relationship and this was explored by modelling the data using linear regression.
Analysis of transitions in labour market status

105
The lone parent and couple mothers were analysed separately. As before, mothers who changed family status between spells were excluded. The regression was run with the amount of time in months spent in the subsequent or current spell as the outcome variable. The predictor variables included: time in months spent in the previous activity spell, current and previous activity and a range of mother characteristics, including mother’s age, age of youngest child, number of dependent children, age mother left full-time education, mother’s highest qualification, mother’s health status and tenure47. The full model outputs can be seen in Tables A.8 and A.9.
Couple mothers
The variables significantly associated with length of time spent by couple mothers in their subsequent activity were the nature of the subsequent activity, the previous activity, length of time spent in previous activity, mother’s age, tenure, age of youngest child and the mother’s age when she left full-time education.
The characteristics related to a longer time being spent by couple mothers in the subsequent activity were; the subsequent spell being in work of 16 hours or more, having been in a mini-job in the previous activity spell and having spent a longer time in that previous activity. Having children in the age groups other than five to ten, being an owner-occupier, leaving full-time education at a later age and being in an older ageband were also significantly related to spending longer in the current activity.
Couple mothers spending shorter spells of time in their current activity tended to be in a mini-job in the more recent spell, had previously not been working, were renting accommodation, had children under the age of five and had left school before 16. It can be inferred that these mothers were unlikely to stay in their current activity for long and were more likely to be in a transitional state.
Lone parents
The variables significantly associated with time spent by lone parent mothers in the subsequent activity were the nature of the subsequent activity, the previous activity, time spent in previous activity, mother’s age, tenure and age of youngest child.
Lone parent mothers spending a longer time in their more recent activity tended to be currently not working but to have previously been in work, especially of one to 15 hours. As with couple mothers, the time spent in the previous activity was positively related to the time spent in the subsequent activity. Social renters were more likely to move between different activities, spending shorter periods in each. Lone parent mothers with older children were more likely to spend shorter periods
47 Although bivariate analysis showed pay to have a significant positive relationship with length of spell, the number of missing values in the variable meant it was excluded from the regression.
Analysis of transitions in labour market status

106
in the current activity. This contrasts with the couple mothers, for whom older children were related to longer spells. Lone parent mothers in older age bands were also associated with longer spells of activity; this was the case for both family types. This suggests older mothers tended to have a more settled lifestyle.
Discussion
This analysis suggests couple mothers who spend a long time in a single activity tend to be in work of 16 or more hours, whilst a lone parent who spends a long time in a single spell of activity is likely to do so out of the labour market. For both sets of mothers, previously being in work was related to a longer spell in the subsequent activity, however, for lone parents that subsequent spell was more likely to be economic inactivity.
5.2.3 Analysis of mothers’ movement into work using work history data
The work history data was used to revisit the analyses carried out on couple mothers in Section 5.2. We were unable to repeat the analyses of mothers movement away from mini-jobs because bases were too small, however, we were able to replicate the analysis of factors associated with couple mothers moving into work from a period of inactivity. The main difference is that the transitions were based on changes between spells of different activity, rather than comparisons of activity at 12-month periods. In addition, information about the length of time spent out of work could also be included. It must be noted that, unlike the 12-month transitions, mothers with only one spell of continuous activity between Waves 3 and 7 are excluded from the analysis as no transitions are recorded for them. This means the analysis is carried out an a slightly different sub-set of respondents, as such we would not expect the results to be exactly the same. As before the analysis was run on couple mothers only.
The model was run using the same outcome variable and included the same predictor variables. The outcome was transition from inactivity into a mini-job versus transition from inactivity into work of 16 hours or more. The predictor variables were; age of mother, age of youngest child, number of dependent children, partner work status, tenure and mother’s SOC code. In addition, the time in months spent in the previous activity was included as a continuous variable. The results from the model can be viewed in Table A.10.
In many respects the relationship between the hours worked after a break from the labour market and the predictor variables were the same; mothers who had a propensity to take up mini-jobs were older, had older children and worked in personal services, sales and customer services, semi-skilled and unskilled occupations. However, for a couple of variables the relationship differed slightly to that seen in the model for the yearly transitions. Tenure, that had previously been highly significant in the model, was no longer present. Mothers‘ age was less significant than it had been. Mothers who had spent a long time in their previous activity were more likely to move into a mini-job.
Analysis of transitions in labour market status

107
The relationship between tenure and time spent in the previous activity was looked at in more detail. Both variables were related to the hours a couple mother chose to work after a break from the labour market (p<0.05 in both instances). However, tenure was dropped when both variables were entered together into the model. This is because tenure and time spent in previous activity were closely related to each other48 and were explaining much of the same variance in the model. Time spent in previous activity remained in the model because it explained more of the variance in the mothers’ behaviour than did tenure. It is likely that both variables were acting as proxies and were reflecting a number of inter-related characteristics of the mother that may not have been explicitly addressed in the model.
When time spent in previous activity was omitted from the model, the relationship between outcome and tenure was the same as that found in the analysis of the 12-month transitions; couple mothers who were social renters were significantly less likely to move into a mini-job than couple mothers in owner-occupied housing.
The results in this section, along with the results from the analysis in Section 5.2.2, show that mothers spending longer in spells of work tended to be owners of their accommodation and they tended to be older. Younger mothers and social renters typically changed their activity status more frequently.
The reasons behind these findings are unlikely to be due to any single factor, but are probably linked to a number of inter-related factors:
• older mothers in owner-occupied housing tended to have more favourablecircumstances, this was associated with their having a partner in steady full-time work. This stability might be associated with the mothers’ employment tending to be in longer spells;
• owner-occupierstendedtobeinoccupationsassociatedwithgreaterstabilityinemployment;
• owners of their accommodation have a limited safety net to protect theirhousing costs when they are not in work. They appear likely to have longer spells of work because of the financial consequences of not working. On the other hand, social renters receive financial support for their housing costs that, together with other factors such as low levels of education and low wages, may make it less likely they will move from inactivity to work, and more likely to move from work to inactivity.
48 The mean number of months spent in the previous activity varied by tenure; it was highest for owner occupiers (40 months), followed by social tenants (38 months) and then private tenants (22 months). There was a lot more variation in the time social tenants spent in the previous activity then owner occupiers; social tenants had a 95 per cent confidence interval of (31,46), wider than that of the owner occupiers (36,44).
Analysis of transitions in labour market status

108
5.3 Summary of key findings
As in previous sections of this report, the analysis of mothers’ transitions shows there were appreciable differences in the employment behaviour of lone parent and couple mothers. Couple mothers and lone parent mothers tended to approach the labour market somewhat differently; the involvement of many lone parents in the labour market tended to be less stable than for couple mothers. The analysis of 12-month transitions showed that lone parent mothers were less likely to be in the same activity category at the end of a 12-month period. Likewise, the analysis of work history data showed that, on average, lone parents had slightly more spells of activity, with each spell being shorter. Where lone parents did have longer spells they were more likely to be periods of economic inactivity, whereas for couple mothers longer spells were associated with employment.
Lone parent mothers were less likely than couple mothers to move into a mini-job and, if they did so, lone parents were less likely to remain in a mini-job than were couple mothers. The analysis suggested the main factors that linked couple mothers to mini-jobs were related to their family situation, namely, a stable partnership. We conclude from this that lone parents will be very unlikely to take up mini-jobs in the same way as couple mothers do.
Analysis of transitions in labour market status

109
6 ConclusionsThis study originated in the observation that mini-jobs were a distinctive element in the difference in the behaviour of working mothers, being much more common among mothers in couples than among lone parents. It seemed that there might be lessons to be drawn from the way in which couple mothers made use of mini-jobs, that could be applied to non-working lone parents. Such lessons could suggest ways in which, potentially, a greater proportion of lone parents could be encouraged to work. Implicitly, it seemed that it might be possible to identify factors inhibiting the use of mini-jobs at present by lone parents. The most obvious inhibitor for non-working lone parents is the £20 earnings disregard on Income Support (IS) and its counterpart for Housing Benefit (HB) for those lone parents in rented accommodation. It also seems possible that anxiety about being suspected of fraud might inhibit some claimants from working at all. It was anticipated that the research might stimulate discussion about the implications of the levels of earnings disregards and the hours threshold for Tax Credits49. It also seems worthwhile to raise the question of whether disincentives to working (including work in mini-jobs) are consistent with ‘Work First’ employment policies.
The Iacovou and Berthoud report (2000) suggested that encouragement for mothers to take up mini-jobs would contribute in the longer-term to an increase in lone parents’ participation in jobs of 16 or more hours per week, at which point Tax Credits would augment their income. A key part of the motive for this research was an extension of their argument: it appeared that mini-jobs might potentially be suited to non-working lone parents who faced the greatest difficulties (at least in the short-term) in moving into work of a sufficient number of hours to qualify for tax credits. In this sense, the potential of mini-jobs might be to support moves
49 At the same time as this project was underway, a separate project was examining the likely employment response of lone parents to changes in aspects of the design of benefits and tax credits. This used a micro-simulation model of the UK economy. It outlined a number of possible policy changes that had the potential to increase lone parent employment. The report on this work is Bell, K., Brewer, M. and Phillips, D. (2007) Lone Parents and Mini-jobs, Joseph Rowntree Foundation, York.
Conclusions

110
into work that fall outside the main policy instruments that are designed to ‘make work pay’. If so, this might be a role for mini-jobs that would merit attention in future policy initiatives.
This chapter reviews what we have found out about the working patterns of mothers in couple families and, by comparison, among lone parents. The general research question is an attempt to understand the factors that enable mothers in couple families to work when lone parents remain non-working.
6.1 How far does our analysis support the Iacovou/ Berthoud argument?
In Chapter 3, we discussed the pattern of transition from mini-jobs to working 16 or more hours per week. Iacovou and Berthoud’s report demonstrated a strong statistical association between working in a mini-job and subsequently working in a job of 16 or more hours per week. However, we suggest this was for a simple reason: the comparison was with the odds of a move into work of 16 or more hours among those people who were not working, most of whom subsequently continued not working at all. We have seen in Chapter 4 that, for many of the non-working mothers, their work history was very simple: most of them did not work in any month for over five years. Consequently, the relative odds of a mother moving from a mini-job to working 16 or more hours per week appeared strongly significant in the statistical sense. We have shown (in Appendix B) that similar relative odds could be found in the data for the Families and Children Study (FACS) panel, relating to a different sample of mothers a decade after the British Household Panel Survey (BHPS) data on which Iacovou and Berthoud based their analysis. But in spite of this similarity, when we looked directly for cases exhibiting a pattern of transition described in the Iacovou and Berthoud report, we found only a small number of cases in the FACS data. It seems possible that this could be linked to differences in the labour market environment between the early 1990s, which was a period of high unemployment, and the period since 2000.
We are in agreement with Iacovou and Berthoud on the potential attractiveness of mini-jobs as an initial step in the direction of working for mothers who are not working at a point in time and who would find it difficult to move directly into work of 16 hours or more per week. For example, they suggested that mini-jobs may represent a smaller initial transition after a spell of not working for some years. A mini-job that fits with school hours and terms may have only a small impact on the mother’s time for being with her children. The evidence from FACS is that many mothers give a high priority to being available for their children.
Iacovou and Berthoud proposed that mini-jobs could be viewed as an alternative to welfare to work or training programmes. They perceived this as a route that would be less ‘personally intrusive’ than participation in a welfare to work programme, which almost invariably is based on the involvement of a ‘personal adviser’. However, another point of view would be that there is possibly a good fit
Conclusions

111
between a period of time working in a mini-job and an employment programme. One of the merits of a mother working in a mini-job is that this might allow her to engage in a training course and/or in regular in-work guidance sessions to help with her progressing to a job in which Tax Credits would be payable. It is possible to envisage an arrangement in which a lone parent could be awarded Tax Credits on the basis of doing an approved part-time training course and paid work that, in combination, amounted to 16 or more hours per week. There might be a requirement that this arrangement (that is, the training course) would last for a period of several months and some basis for expecting that the hours of paid work would increase to at least 16 hours per week on completion of the training.
We acknowledge there are a number of potential objections to such an arrangement. Some personal advisers feel that participants in welfare to work programmes should not need large amounts of help: they make the point that someone who is unable to handle jobsearch on their own behalf may not be ready to cope with the demands of a job. There might also be practical difficulties with making arrangements for training compatible with a paid job. An employing organisation might have only limited flexibility to adjust the hours worked by one of their employees to fit around a training course being provided externally50. Another issue is that mini-jobs often involve wages close to the National Minimum Wage. This may act as a constraint on official encouragement of mini-jobs. The hours threshold for Tax Credits was set at 16 (and was 24 hours per week prior to 1992) to improve the chances that an employee has a reasonable level of earnings for her Tax Credits to top up. There could also be official reluctance to support initiatives that involved a lower threshold of hours.
6.2 Mini-jobs as a strategy to increase paid work among lone parents
Looking at behaviour over a period of five and a half years allows us to focus on patterns of stability of working or not working, as well as on the movement between these states. In the report ‘Families, Work and Benefit’ by Marsh and McKay (PSI, 1994), the authors argued that non-working lone parents tended to approach their initial move into work with a cautious and long-term view. They stressed the amount of thinking and preparation that went in to the choice of job. Lone parents wished their initial job to be sustainable in the longer term. On the basis of the FACS material discussed in this report, this looks likely to be a valid interpretation.
50 The ‘day release’ for training, which was part of the original design for the subsidised employment option on the New Deal for Young People (NDYP), seems to have been one aspect of the scheme that otherwise willing employers found difficult to accommodate (Hales, J., Collins, D., Hasluck, C. and Woodland, S. (2000): New Deals for Young People and for Long-Term Unemployed: Survey of Employers, Research and Development Report ESR58, Employment Service).
Conclusions

112
The situation of the lone parent means that in some respects her work choices are likely to be more constrained than those of other employees51. In assessing vacancies for which she might apply, she needs to reconcile many of the same factors as any other employee, such as the level of her previous work experience and skills. For the lone parents, additional factors may assume greater importance than they do for other employees, such as the location of the job, the hours of work offered and her ability to arrange childcare during school terms and school holidays. This perspective suggests that mini-jobs probably have only limited potential among lone parents, whether as a transitional state or as a long-term strategy.
A further insight by Marsh and McKay (1994) was the existence of a ‘benefits fault-line’. This way of understanding the relationship between mothers and paid work is supported by two of the findings that have emerged from the analyses presented in this report. The first of these is simply the polarisation of the population of mothers into those who spend long periods of time in paid work and those who spend long periods of time not working. To some extent, this polarisation is a function of the age of the mother and her children: as mothers become older, they are more likely to move into work, and having done so they tend to remain in work.
The second finding is the association between tenure and working status. Put simply, there is a very high rate of participation in work by mothers who are owners. There is a much lower rate, around 40 per cent, among mothers in the social rented sector of housing. The rate is around 50 per cent for those living in privately rented accommodation. Within these categories of tenure, the rates of participation do not differ substantially between couple mothers and lone parents.
In the light of this, it may be misleading to invoke differences between the family situations of mothers in couples and lone parents to explain their likelihood of being in work. The fact that more mothers in couples are working is often attributed to some combination of the role of the partner in providing childcare, the impact of the partner’s earnings, the ages of the children and the qualifications of the mother. However, it has been shown that living in owned or rented accommodation appears to over-ride these other factors in terms of the odds of a couple mother or lone parent being in work. The evidence suggests that tenure can be treated as a ‘shorthand’ way of describing a complex of social characteristics that affect the likelihood of a mother being in paid work. Among this set of social characteristics are factors such as the level of educational qualifications, work skills gained in the past and the mother’s health. This perspective is consistent with the proposition by Marsh and McKay that there is a ‘benefits fault line’.
51 The ways in which lone parents approach a move into work were explored in some detail in the report by Bell, A., Finch, N., La Valle, I., Sainsbury, R. and Skinner, C. (2005) A question of balance: Lone parents, childcare and work, Department For Work and Pensions, Research Report No 230.
Conclusions

113
This is not simply to ascribe the differences in the observed patterns of working to this ‘complex of social characteristics’ of the mothers. There may also be area characteristics associated with a predominance of social housing, such as limited availability of jobs in the localities where rented housing is provided. In particular, it seems reasonable to suppose that features of the allocation of social rented accommodation to those in greatest need and features of HB may be implicated in the divide between those in work and not working.
Two recent reports provide some analyses of HB and social housing that contribute to the explanation for these patterns. Turley and Thomas52 (2006) conducted research on knowledge of HB among claimants, Jobcentre Plus personal advisers and staff involved in the administration of HB. A key focus was on the level of awareness that HB can be an in-work benefit. Local authority administrative staff had a relatively good understanding of this feature, but it was not seen as their role to explain this to claimants who were not working. Jobcentre staff showed a low level of confidence about being able to explain how HB entitlement would apply to claimants they met. Among claimants, the level of knowledge was low, although lone parents who had some experience of claiming HB while working were some of the more knowledgeable sample members.
Also in 2006, Professor John Hills of the London School of Economics was commissioned by the Secretary of State for Communities and Local Government to review the role of social housing in England in the 21st Century. His report was published in early 200753. Among his key findings was that there was little mobility of social tenants for work-related reasons54. In other words, social tenants might have difficulty in moving to a different area to take up a job. The immediate area of their house or flat often had a very limited range of employment opportunities. This situation represented a considerable change since the early 1980s, when the population in social housing was more mixed. Figure 5.4 (on page 46 of the report) indicates that 67 per cent of working age social renters were in paid work in 1981, and this rate had fallen to 34 per cent in 2006.
Hills identified a number of problems with HB. Among these was the gap between the ‘theory’ that it is a ‘weekly’ benefit, and may be fine-tuned to reflect changing circumstances, and the reality that it may take a long time to establish a claim. This
52 Turley, C. and Thomas, A. (2006) Housing Benefit and Council Tax Benefit as in-work benefits; claimants’ and advisors’ knowledge, attitudes and experiences, DWP Research Report No. 383.
53 Hills, J. (2007) Ends and means: The Future Roles of Social Housing in England, CASE report 34, ESRC Research Centre for Analysis of Social Exclusion.
54 Hills (2007, page 5) states: ‘… the rate of employment-related mobility within social housing is strikingly low. Nationally, one in eight moves is associated with work, but only a few thousand social renters each year move home for job-related reasons while remaining as social tenants […], out of a total of nearly four million’.
Conclusions

114
seems likely to act as a disincentive for moving into work, since earnings above a low disregard must be reported promptly and have an impact on the level of entitlement55. When the original housing need was based on not working and low income, a move into work may represent a change of circumstances that calls into question the claimant’s tenant status.
6.3 Are mini-jobs a distinct category of work?
6.3.1 Employer reasons
There appears to be some indirect evidence that employers wish to engage some of their workforce in mini-jobs, although this involves some speculation about their motives and really deserves a separate study. The information from FACS links some mini-jobs with low rates of hourly pay and weekly earnings below the thresholds for the National Insurance (NI) and Pay As You Earn (PAYE) systems. For some of the small businesses, this appears likely to reduce their overall employment costs. This may be one of the reasons that many of these jobs are offered on a permanent basis. There is evidence that some mini-jobs are also used for short term purposes, but this is not a major pattern observed in the FACS data.
There is also some evidence that mini-jobs have a good ‘fit’ with certain types of work. For example, cleaning jobs on domestic or commercial premises may be best organised as a few hours work per day. The same may apply to some social care and retail work, parts of the education and childcare sector and in other fields of employment in which mini-jobs are relatively common.
But this is not to suggest that all mini-jobs follow this pattern. It appears likely to be the case that many of these jobs involve working a ‘standard day’, but on one, two or three days per week rather than a ‘full-time’ week of five days. One piece of evidence that probably points in this direction is the high percentage of mothers doing mini-jobs who usually travel to work by car.
6.3.2 Employee reasons
From the perspective of the mothers, it seems clear that there are particular situations in which some choose to undertake mini-jobs. When they do so, it often tends to be as a stable activity. However, it is more likely to be an alternative to spending time not working at all than to spending time in a job of 16 or more hours per week.
There is indirect evidence that some women working in mini-jobs may choose to work close to their home. Being able to walk to work would be a rational choice if they were working a few hours per day for around five days per week.
55 Hills (2007, page 5) states: ‘Because of the very steep withdrawal of benefit as recipients’ income rises, Housing Benefit is a major contributor to the ‘poverty trap’, where people’s net income rises by only a very small proportion of any rise in gross earnings’.
Conclusions

115
It is difficult with the information available in FACS to explain the rationale for mothers choosing to do mini-jobs as a long-term strategy. However, the information given by mothers about their reasons for not working 16 or more hours per week, and not looking for work of this amount, points towards one simple dominant reason for wishing to restrict the hours worked: to be available for a child or children at all times when the child or children are not in pre-school or school sessions.
The regression analysis also pointed to the key role of the partner’s earnings and a stable relationship as features of the stable use of mini-jobs by older mothers in couple families.
6.4 Reaching the target of 70 per cent of lone parents in 2010
There has recently been a good deal of commentary on the gap that remains to be bridged to meet the Government’s target of having seventy per cent of lone parents in paid work by 2010. For example, Gregg, et al. (2006)56 have estimated that on current trends and with initiatives announced in the Welfare Reform Bill and the 2006 Budget, the target is likely be missed by around five per cent.
The finding that the current rate of participation is virtually equal between couple mothers and lone parents, when we analyse the rate of participation separately for each housing tenure, makes the prospect for further increases among lone parents seem limited57. This is partly on the reasoning that couple mothers may indicate an ‘upper bound’ for the rate of working in a given situation. Meanwhile, there cannot be much scope for additional lone parent owner-occupiers to work, given that 91 per cent of them were currently doing so in 2005.
It seems there must be relatively greater scope for additional working among the lone parent renters. However, this appears to run into two sorts of obstacle. The first is the low skills, limited work experience and low wage of those couple mothers and lone parents who occupy the social rented sector. The second is how the HB system operates and how it interacts with paid work. From the perspective
56 Gregg, P., Harkness, S. and Macmillan, N. (2006) Welfare to work policies and child poverty – a review of issues relating to the labour market economy, Joseph Rowntree Foundation.
57 An interesting further line of inquiry would be to identify among which tenure groups the increases in employment have occurred among lone parents in the last decade. While FACS could be used for part of this period, we suggest that the Labour Force Survey (LFS) or the Family Resources Study (FRS) would provide suitable evidence of changes in the cross-sectional profile of mothers in and out of work. LFS analysis in Gregg, et al. (2006, page 43) suggested no upward trend in the employment rate among those living in social rented accommodation between 1996 and 2005.
Conclusions

116
of a tenant, this is a system that is difficult (or, in areas where there are particular difficulties with the administration of HB, perhaps better characterised as ‘risky’) to seek to adjust in the short-term. Presumably, this is part of the reason for the very deliberate approach adopted by many lone parents when they move into work. They need to make sure that they are taking up a job that will last some time, and where they will be earning a reasonable amount as well as being able to claim tax credits. Although arrangements to cover transitional costs in the move from welfare to work, through benefit run-ons, are now well-established, the risk of having to re-establish claims to benefits (in particular HB) must make the step one that mothers think about carefully. For social tenants (as with all families), their accommodation is fundamental to their sense of security.
There was no expectation when this research project began that the ‘mini-job’ had the potential to provide a substantial boost to the rate of employment among lone parents. However, it had seemed quite promising that this route into work might be appropriate as an initial step among those lone parents who have the lowest propensity to move into work. Based on the analysis of mini-jobs in this report, our view now is that this approach seems to offer very limited prospects for additional working. This is despite the fact that the occupations of those doing mini-jobs often are ones that require few formal qualifications, and this might appear to make them suited to people who have greater difficulties making the transition to work.
The focus of policy on lone parents has been associated with the observed gap in their employment rate, as compared with mothers in couple families58. Finding that the rate of participation is virtually the same between couple mothers and lone parents when we control for housing tenure, casts some doubt on the prospect for further increases in the participation rate of lone parents in Britain.
Two final observations on these issues are:
• thatmeasuressuchasfinancialincentivesandwelfaretoworkinitiativeshavecontributed to an impressive increase in the employment rate among lone parents in the last decade, but the same policy formula may have more limited potential in the next decade;
• that future measures need to be targeted at the situation of mothers incouple families just as much as they will be directed towards lone parents. The concentration of worklessness among mothers in social and private rented accommodation appears to indicate that future policy measures to increase the incentives to work need to engage with arrangements for financial support for housing.
58 As noted earlier, commentators have also pointed to much higher rates of employment among lone parents in other European countries. This surely does point to additional potential in Britain, but it also makes the point that the rate is linked to a specific social context.
Conclusions

117
Appendix A Chapter 5: Tables and details of the analysisTable A.1 Variables used in the analysis
Mother personal characteristics
Mother’s age at t (grouped)
Longstanding illness or disability t
Longstanding illness or disability t + 1
Highest academic qualification
Age mother left full-time education
Ethnicity of mother
Mother work characteristics
Mother work status at t
Mother work status at t + 1
Mother in self-employed work at t
Mother in self-employed work at t + 1
Mother SOC code
Whether mother was looking for work at t
Average hours mother worked per week at t
Number of hours mother worked (grouped) t
Job type (permanent/temp/fixed) at t
Job type (permanent/temp/fixed) at t + 1
Whether mother was paid hourly at t
Whether mother was paid hourly at t + 1
Mothers hourly pay at t (grouped)
Mothers hourly pay at t + 1 (grouped)
Time in years since mother last had paid employment (grouped)
Continued
Appendices – Chapter 5: Tables and details of the analysis

118
Table A.1 Continued
Mother personal characteristics
Partner characteristics
Whether new partner present in the household at t
Partner work status at t
Partner work status at t + 1
Partner SOC code
Family/household characteristics
Age of mother and youngest child
Number of dependent children t
Number of dependent children t + 1
Age of youngest child t
Age of youngest child t + 1
Equivalised family income AHC below 60 per cent median t
Equivalised family income AHC below 60 per cent median t + 1
Equivalised family income BHC below 60 per cent median t
Equivalised family income BHC below 60 per cent median t + 1
Living Standards/Hardship index t
Living Standards/Hardship index t + 1
Worry about money at t
Bed standard overcrowding measure at t
Receive tax credits t
Receive tax credits t + 1
Working Families’ Tax Credit received t
Working Families’ Tax Credit received t + 1
Annual household income at t (grouped)
Tenure at t Government Office Region at t
Appendices – Chapter 5: Tables and details of the analysis

119
Table A.2 Cross tabulations of key variables and whether mother moved into mini-job or other work
Variable significantly related to No work – No work – outcome work 16+ mini-job Total % % %
Age of mother and youngest child
Child 0-4, mother 16-29 *** 22 17 20
Child 0-4, mother 30-39 31 39 35
Child 0-4, mother 40+ 7 7 7
Child 5-10, mother 16-29 1 2 2
Child 5-10, mother 30-39 15 13 14
Child 5-10, mother 40+ 9 11 10
Child 11+, mother 16-39 5 2 3
Child 11+, mother 40+ 9 9 9
Mother age at t (grouped)
Under 25 ** 10 5 8
25-29 13 13 13
30-34 26 23 25
35-39 26 31 28
40-44 20 18 19
45 plus 6 9 7
Age of youngest child at t
0-4 years 60 64 61
5-10 years 26 26 26
11-15 years 13 9 11
16-18 years 2 1 1
Number of dependent children at t
1 ** 35 27 31
2 46 48 47
3+ 19 25 22
Mothers highest qualification
GCSE 52 52 52
GCE A-level/SCE Higher grades 14 14 14
First degree 15 15 15
Higher degree 5 4 5
Other academic quals 2 3 3
None 11 12 12
Continued
Appendices – Chapter 5: Tables and details of the analysis

120
Table A.2 Continued
Variable significantly related to No work – No work – outcome work 16+ mini-job Total % % %
Limiting longstanding illness at t
Yes 19 17 18
No 81 83 82
Time in years since last job
Less than a year *** 53 40 47
Up to 1 year 14 15 14
Up to 5 years 21 24 22
Over 5 years 12 21 16
Mothers SOC
Professional and managerial *** 26 15 21
Skilled and clerical 15 10 13
Personal services 11 10 10
Sales and customer service 10 9 9
Semi-skilled and Unskilled 12 16 14
Missing 26 40 32
New partner in the household
Yes *** 38 25 32
No 62 75 68
Partner work status
Partner working 30+ hours 89 93 90
Partner working 16-29 hours 2 1 1
Partner working <16 hours 1 0 1
Partner not working 9 6 8
Partner SOC
Professional and managerial ** 48 52 50
Skilled and clerical 25 28 27
Personal services 1 1 1
Sales and customer service 3 1 2
Semi-skilled and Unskilled 22 17 20
Poverty level AHC
Not below * 75 80 77
Below 60 per cent 25 20 23
Continued
Appendices – Chapter 5: Tables and details of the analysis

121
Table A.2 Continued
Variable significantly related to No work – No work – outcome work 16+ mini-job Total % % %
Tenure
Owned outright *** 5 6 6
Mortgage 69 78 73
Social tenant 18 11 14
Private tenant 6 3 5
Other arrangement 3 2 2
Worry about money
No 93 95 94
Yes 7 5 6
Age mother left full-time education
16 or under 47 45 46
17-18 29 30 30
19+ 24 25 24
Mother’s ethnic group
White 94 94 94
Non-white 6 6 6
Base 538 456 994
Notes: 1. The base is all mothers inactive at time t and working at t + 1.
2. The association between the variables and the outcome was tested using a chi-squared test. Significance is denoted by asterisks: *** = 1%, ** = 5% and * = 10%.
Appendices – Chapter 5: Tables and details of the analysis

122
Table A.3 Factors associated with movement from non-work to a mini-job
95% Conf. Interval
Odds Std. Err. z P>z Lower Upper
Age of mother
26+ (baseline)
<26 0.33 0.116 -3.15 0.002*** 0.163 0.655
Age of youngest child
0-4 (baseline)
5-10 0.65 0.138 -2.04 0.042** 0.429 0.984
11+ 0.48 0.137 -2.57 0.010** 0.274 0.839
Number of dependent children
1 (baseline)
2 1.20 0.249 0.88 0.378 0.800 1.802
3+ 1.31 0.337 1.05 0.296 0.790 2.169
Tenure
Owner (baseline)
Council rent 0.41 0.117 -3.11 0.002** 0.233 0.718
Private rent 0.41 0.188 -1.94 0.052* 0.166 1.008
Other 0.48 0.284 -1.24 0.214 0.148 1.534
Partners work status
Other (baseline)
Partner working 30+ hours 1.66 0.530 1.60 0.110 0.891 3.108
Mothers SOC
Professional and managerial (baseline)
Skilled and clerical 1.37 0.426 1.01 0.313 0.744 2.518
Personal services 2.32 0.786 2.48 0.013 1.191 4.502
Sales and customer service 2.80 0.998 2.89 0.004*** 1.393 5.632
Semi-skilled and unskilled 5.18 1.743 4.89 0.000*** 2.679 10.015
Missing 4.41 1.171 5.58 0.000*** 2.616 7.417
Notes: 1. The response is 1 = mother moved into a mini-job, 0 = mother moved into work of 16+ hours .
2. Significance is denoted by asterisks: *** = 1%, ** = 5% and * = 10%.
3. The odds are the exponential of the estimate coefficient with standard error Std.Err.
4. The z-test measures the impact of the categorical variable on the model. If the test is significant then the categorical variable is considered to be ‘significantly associated’ with the response variable.
5. The base is all mothers inactive at time t and working at t + 1 (n=994).
Appendices – Chapter 5: Tables and details of the analysis

123
Table A.4 Cross tabulations of key variables and whether mother moved out of work or stayed in a mini-job
Variable significantly related to Mini-job – Stayed in outcome not working mini-job Total % % %
Age of mother and youngest child
Child 0-4, mother 16-29 *** 18 7 10
Child 0-4, mother 30-39 33 31 32
Child 0-4, mother 40+ 5 7 7
Child 5-10, mother 16-29 1 1 1
Child 5-10, mother 30-39 15 17 16
Child 5-10, mother 40+ 14 19 18
Child 11+, mother 16-39 4 3 3
Child 11+, mother 40+ 10 15 14
Mother age at t (grouped)
Under 25 ** 3 2 2
25-29 10 6 7
30-34 22 23 22
35-39 28 29 28
40-44 22 26 25
45 plus 16 15 15
Age of youngest child at t
0-4 years 45 46 45
5-10 years 33 36 35
11-15 years 21 16 17
16-18 years 2 2 2
Number of dependent children at t
1 28 26 26
2 53 54 54
3+ 20 20 20
Mothers highest qualification
GCSE * 57 57 57
GCE A-level/SCE Higher grades 9 12 11
First degree 14 12 13
Higher degree 6 4 5
Other academic quals 2 3 2
None 12 12 12
Continued
Appendices – Chapter 5: Tables and details of the analysis

124
Table A.4 Continued
Variable significantly related to Mini-job – Stayed in outcome not working mini-job Total % % %
Limiting longstanding illness at t
Yes 14 15 15
No 86 85 85
Mothers SOC
Professional and managerial * 24 20 21
Skilled and clerical 22 21 22
Personal services 19 18 18
Sales and customer service 15 17 17
Semi-skilled and Unskilled 20 23 22
New partner in the household
Yes 22 22 22
No 78 78 78
Partner work status
Partner working 30+ hours * 94 96 95
Partner working 16-29 hours 0 1 1
Partner working <16 hours 1 1 1
Partner not working 5 3 3
Partner SOC
Professional and managerial ** 51 56 55
Skilled and clerical 23 23 23
Personal services 1 2 1
Sales and customer service 3 2 2
Semi-skilled and Unskilled 22 17 19
Poverty level AHC
Not below 88 89 89
Below 60 per cent 12 11 11
Tenure
Owned outright ** 7 7 7
Mortgage 79 82 81
Social tenant 10 7 8
Private tenant 3 2 3
Other arrangement 2 2 2
Continued
Appendices – Chapter 5: Tables and details of the analysis

125
Table A.4 Continued
Variable significantly related to Mini-job – Stayed in outcome not working mini-job Total % % %
Receive Working or Child Tax Credits at t
No 58 62 61
Yes 42 38 39
Working Families’ Tax Credit received at t
No 86 88 88
Yes 14 12 12
Job type (permanent/temp/ fixed) at t
Temporary/fixed term/other 25 23 24
Permanent 75 77 76
Number of hours worked at t
9-15 hours per week *** 85 69 74
1-8 hours per week 15 31 26
Worry about money
No * 95 97 97
Yes 5 3 3
Age mother left full-time education
16 or under 48 47 47
17-18 30 31 31
19+ 22 23 22
Mother’s ethnic group
White 96 97 96
Non-white 4 3 4
Total 520 1,256 1,776
Notes: 1. The base is all mothers in a mini-job at t who were not working 16+ hours at t + 1 (n=1,776).
2. The association between the variables and the outcome was tested using a chi-squared test. Significance is denoted by asterisks: *** = 1%, ** = 5% and * = 10%.
Appendices – Chapter 5: Tables and details of the analysis

126
Table A.5 Factors associated with movement out of work from a mini-job
95% Conf. Interval
Odds Std. Err. z P>z Lower Upper
Age of mother
<30 (baseline)
30-39 0.53 0.134 -2.51 0.012** 0.325 0.870
40+ 0.41 0.120 -3.04 0.002*** 0.229 0.727
Age of youngest child
0-4 (baseline)
5-10 1.29 0.234 1.40 0.163 0.902 1.840
11+ 1.98 0.469 2.90 0.004*** 1.249 3.152
Tenure
Owner (baseline)
Council rent 2.06 0.570 2.60 0.009*** 1.194 3.542
Private rent 1.71 0.732 1.26 0.208 0.742 3.959
Other 0.74 0.420 -0.54 0.591 0.240 2.254
Partners work status
Other (baseline)
Partner working 30+ hours 0.72 0.227 -1.05 0.294 0.386 1.334
Family claiming tax credits at t
No (baseline)
Yes 1.49 0.217 2.76 0.006*** 1.124 1.986
Mothers SOC
Professional and managerial (baseline)
Skilled and clerical 0.69 0.149 -1.70 0.089* 0.456 1.058
Personal services 0.66 0.151 -1.82 0.049* 0.420 1.032
Sales and customer service 0.52 0.124 -2.75 0.006*** 0.324 0.828
Semi-skilled and unskilled 0.50 0.117 -2.96 0.003*** 0.314 0.790
Hours worked in Mini-job
9 to 15 (baseline)
1 to 8 0.32 0.058 -6.27 0.000*** 0.220 0.452
Notes: 1. The response is 1 = mother moved out of work, 0 = mother stayed in a mini job.
2. Significance is denoted by asterisks: *** = 1%, ** = 5% and * = 10%.
3. The odds are the exponential of the estimate coefficient with standard error Std.Err.
4. The z-test measures the impact of the categorical variable on the model. If the test is significant then the categorical variable is considered to be ‘significantly associated’ with the response variable.
5. The base is all mothers in a mini-job at t who were not working 16+ hours at t + 1 (n=1,776).
Appendices – Chapter 5: Tables and details of the analysis

127
Table A.6 Cross tabulations of key variables and whether mother moved into 16+ hours or stayed in a mini-job
Variable significantly related to Mini-job – Stayed in outcome work 16+ mini-job Total % % %
Age of mother and youngest child
Child 0-4, mother 16-29 *** 11 7 8
Child 0-4, mother 30-39 29 31 31
Child 0-4, mother 40+ 4 7 6
Child 5-10, mother 16-29 1 1 1
Child 5-10, mother 30-39 17 17 17
Child 5-10, mother 40+ 15 19 18
Child 11+, mother 16-39 3 3 3
Child 11+, mother 40+ 19 15 16
Mother age at t (grouped)
Under 25 *** 5 2 2
25-29 14 6 8
30-34 23 23 23
35-39 29 29 29
40-44 20 26 25
45 plus 9 15 14
Age of youngest child at t
0-4 years *** 56 46 48
5-10 years 30 36 35
11-15 years 12 16 15
16-18 years 2 2 2
Number of dependent children at t
1 27 26 26
2 49 54 53
3+ 23 20 21
Mothers highest qualification
GCSE ** 50 57 56
GCE A-level/SCE Higher grades 19 12 13
First degree 11 12 12
Higher degree 4 4 4
Other academic quals 3 3 3
None 13 12 12
Continued
Appendices – Chapter 5: Tables and details of the analysis

128
Table A.6 Continued
Variable significantly related to Mini-job – Stayed in outcome work 16+ mini-job Total % % %
Limiting longstanding illness at t
Yes 17 15 15
No 83 85 85
Mothers SOC
Professional and managerial *** 16 20 19
Skilled and clerical 16 21 20
Personal services 16 18 18
Sales and customer service 10 17 16
Semi-skilled and Unskilled 21 23 23
New partner in the household
Yes *** 33 22 24
No 67 78 76
Partner work status
Partner working 30+ hours *** 91 96 95
Partner working 16-29 hours 1 1 1
Partner working <16 hours 1 1 1
Partner not working 7 3 4
Partner SOC
Professional and managerial 56 56 56
Skilled and clerical 24 23 23
Personal services 3 2 2
Sales and customer service 1 2 2
Semi-skilled and Unskilled 17 17 17
Poverty level AHC
Not below *** 82 89 88
Below 60% 18 11 12
Tenure
Owned outright *** 10 7 8
Mortgage 70 82 79
Social tenant 14 7 8
Private tenant 4 2 3
Other arrangement 2 2 2
Continued
Appendices – Chapter 5: Tables and details of the analysis

129
Table A.6 Continued
Variable significantly related to Mini-job – Stayed in outcome work 16+ mini-job Total % % %
Receive tax credits at t
No 66 62 63
Yes 34 38 37
Working Families’ Tax Credit received at t
No ** 84 88 87
Yes 16 12 13
Job type (permanent/temp/ fixed) at t
Temporary/fixed term/other *** 61 23 32
Permanent 39 77 68
Number of hours worked at t
9-15 hours per week *** 58 69 66
1-8 hours per week 42 31 34
Worry about money
No ** 94 97 97
Yes 6 3 3
Age mother left full-time education
16 or under 44 47 46
17-18 34 31 32
19+ 22 23 22
Mother’s ethnic group
White 97 97 97
Non-white 3 3 3
Base 376 1,256 1,632
Notes: 1. The base is all mothers in a mini-job at t who were working at t + 1 (n=1,632).
2. The association between the variables and the outcome was tested using a chi-squared test. Significance is denoted by asterisks: *** = 1%, ** = 5% and * = 10%.
Appendices – Chapter 5: Tables and details of the analysis

130
Table A.7 Factors associated with movement into work of 16+ hours from a mini-job
95% Conf. Interval
Odds Std. Err. z P>z Lower Upper
Age of mother
<30 (baseline)
30-39 0.35 0.086 -4.25 0.000*** 0.217 0.569
40+ 0.23 0.068 -4.95 0.000*** 0.127 0.410
Age of youngest child
0-4 (baseline)
5-10 0.84 0.161 -0.90 0.369 0.579 1.225
11+ 0.84 0.226 -0.65 0.519 0.497 1.423
Tenure (baseline)
Owner 2.48 0.659 3.41 0.001*** 1.470 4.172
Council rent 1.18 0.501 0.38 0.704 0.510 2.712
Private rent 1.49 0.842 0.71 0.479 0.493 4.512
Other
Work at t
Temp/fixed (baseline)
Permanent 0.14 0.023 -11.61 0.000*** 0.097 0.190
Partners work status
Other (baseline)
Partner working 30+ hours 0.48 0.145 -2.43 0.015** 0.268 0.869
Whether new partner in the household
No (baseline)
Yes 0.74 0.121 -1.85 0.065** 0.536 1.019
Hours worked in mini-job
9 to 15 (baseline)
1 to 8 1.64 0.262 3.11 0.002*** 1.202 2.247
Notes: 1. The response is 1 = mother moved into work of 16+ hours, 0 = mother stayed in a mini job.
2. Significance is denoted by asterisks: *** = 1%, ** = 5% and * = 10%.
3. The odds are the exponential of the estimate coefficient with standard error Std.Err.
4. The z-test measures the impact of the categorical variable on the model. If the test is significant then the categorical variable is considered to be ‘significantly associated’ with the response variable.
5. The base is all mothers in a mini-job at t who were working at t + 1 (n=1,632).
Appendices – Chapter 5: Tables and details of the analysis

131
Table A.8 Factors associated with length of time spent in current spell of activity by couple mothers
95% Conf. Interval
Coef. Std. Err. t P>t Lower Upper
Current activity
Not working (baseline)
Work 1-15 -2.70 0.82 -3.29 0.001*** -4.31 -1.09
Work 16+ 3.03 0.64 4.72 0.000*** 1.77 4.29
Previous activity
Not working (baseline)
Work 1-15 1.92 0.77 2.49 0.013** 0.41 3.43
Work 16+ 0.50 0.66 0.77 0.442 -0.78 1.79
Time spent in previous activity 0.02 0.00 3.78 0.000*** 0.01 0.03
Current tenure
Owner occupier (baseline)
Social renter -2.94 0.79 -3.71 0.000*** -4.50 -1.39
Private/other -3.50 1.06 -3.31 0.001*** -5.57 -1.43
Age of youngest child
0 to 4 (baseline)
5 to 10 -1.28 0.62 -2.06 0.040** -2.50 -0.06
11+ 0.30 0.82 0.37 0.711 -1.31 1.92
Age left full-time education
<16 (baseline)
16-18 0.27 0.62 0.43 0.664 -0.94 1.48
19+ 2.27 0.86 2.65 0.008*** 0.59 3.96
Mother’s age group
Under 25 (baseline)
25-29 1.29 1.50 0.86 0.390 -1.65 4.22
30-34 4.00 1.44 2.78 0.006*** 1.18 6.82
35-39 2.41 1.44 1.68 0.094* -0.41 5.23
40-44 3.57 1.51 2.36 0.018** 0.60 6.53
45 plus 2.12 1.63 1.3 0.194 -1.08 5.31
Constant 12.95 1.65 7.83 0.000 9.71 16.20
Notes: 1. The response is length of time in current spell (in months).
2. Significance is denoted by asterisks: *** = 1%, ** = 5% and * = 10%.
3. The coef is the estimate coefficient with standard error Std.Err.
4. The t-test measures the impact of the categorical variable on the model. If the test is significant then the categorical variable is considered to be ‘significantly associated’ with the response variable.
5. The base is all transition by couple mothers (n=3,868).
Appendices – Chapter 5: Tables and details of the analysis

132
Table A.9 Factors associated with length of time spent in current spell of activity by lone parent mothers
95% Conf. Interval
Coef. Std. Err. t P>t Lower Upper
Current activity
Not working (baseline)
Work 1-15 -6.63 1.47 -4.51 0.000*** -9.52 -3.75
Work 16+ -1.81 1.01 -1.79 0.073* -3.80 0.17
Previous activity
Not working (baseline)
Work 1-15 4.86 1.42 3.42 0.001*** 2.07 7.64
Work 16+ 1.99 0.96 2.08 0.038** 0.11 3.87
Time spent in previous activity 0.02 0.01 2.28 0.023** 0.00 0.03
Current tenure
Owner occupier (baseline)
Social renter -2.04 0.94 -2.17 0.030** -3.89 -0.20
Private/other -1.53 1.20 -1.28 0.202 -3.89 0.82
Age of youngest child
0 to 4 (baseline)
5 to 10 -1.49 1.05 -1.42 0.157 -3.54 0.57
11+ -2.85 1.35 -2.11 0.035** -5.49 -0.20
Mother‘s age 0.12 0.07 1.74 0.082* -0.01 0.25
Constant 12.82 2.67 4.81 0.000 7.59 18.05
Notes: 1. The response is length of time in current spell (in months).
2. Significance is denoted by asterisks: *** = 1%, ** = 5% and * = 10%.
3. The coef is the estimate coefficient with standard error Std.Err.
4. The t-test measures the impact of the categorical variable on the model. If the test is significant then the categorical variable is considered to be ‘significantly associated’ with the response variable.
5. The base is all transition by lone parent mothers (n=1,348).
Appendices – Chapter 5: Tables and details of the analysis
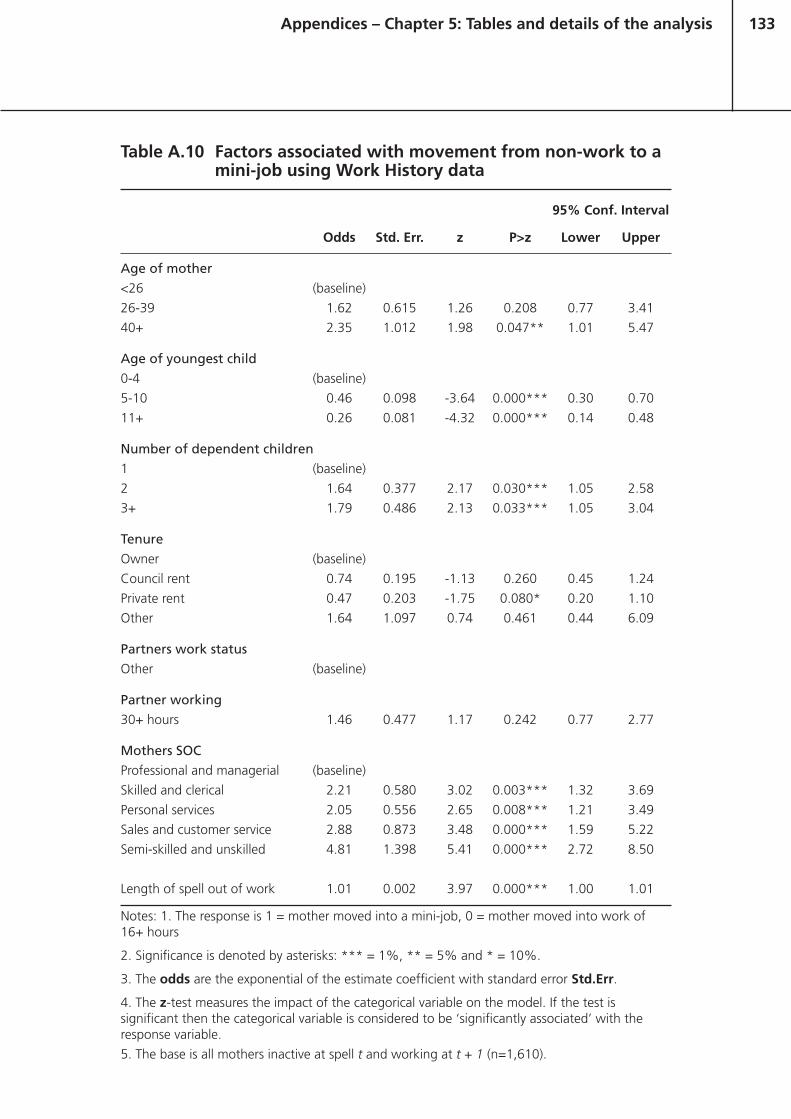
133
Table A.10 Factors associated with movement from non-work to a mini-job using Work History data
95% Conf. Interval
Odds Std. Err. z P>z Lower Upper
Age of mother
<26 (baseline)
26-39 1.62 0.615 1.26 0.208 0.77 3.41
40+ 2.35 1.012 1.98 0.047** 1.01 5.47
Age of youngest child
0-4 (baseline)
5-10 0.46 0.098 -3.64 0.000*** 0.30 0.70
11+ 0.26 0.081 -4.32 0.000*** 0.14 0.48
Number of dependent children
1 (baseline)
2 1.64 0.377 2.17 0.030*** 1.05 2.58
3+ 1.79 0.486 2.13 0.033*** 1.05 3.04
Tenure
Owner (baseline)
Council rent 0.74 0.195 -1.13 0.260 0.45 1.24
Private rent 0.47 0.203 -1.75 0.080* 0.20 1.10
Other 1.64 1.097 0.74 0.461 0.44 6.09
Partners work status
Other (baseline)
Partner working
30+ hours 1.46 0.477 1.17 0.242 0.77 2.77
Mothers SOC
Professional and managerial (baseline)
Skilled and clerical 2.21 0.580 3.02 0.003*** 1.32 3.69
Personal services 2.05 0.556 2.65 0.008*** 1.21 3.49
Sales and customer service 2.88 0.873 3.48 0.000*** 1.59 5.22
Semi-skilled and unskilled 4.81 1.398 5.41 0.000*** 2.72 8.50
Length of spell out of work 1.01 0.002 3.97 0.000*** 1.00 1.01
Notes: 1. The response is 1 = mother moved into a mini-job, 0 = mother moved into work of 16+ hours
2. Significance is denoted by asterisks: *** = 1%, ** = 5% and * = 10%.
3. The odds are the exponential of the estimate coefficient with standard error Std.Err.
4. The z-test measures the impact of the categorical variable on the model. If the test is significant then the categorical variable is considered to be ‘significantly associated’ with the response variable.
5. The base is all mothers inactive at spell t and working at t + 1 (n=1,610).
Appendices – Chapter 5: Tables and details of the analysis


135
Appendix B Replicating the multinomial regression analysis of Iacovou and Berthoud (2000)We used the Families and Children Study (FACS) data to replicate the multinomial regression carried out by Maria Iacovou and Richard Berthoud in their report ‘Parents and Employment: An Analysis of Low Income Families in the British Household Panel Survey’, which was published in 2000. Their findings were based on data from the first seven waves of the British Household Panel Survey (BHPS).
For the analysis of most interest in this report, the core of the research problem was concerned with identifying the conditions under which the families moved from being ‘non-working’ to having at least one person working 16 or more hours per week. This analysis brought together data for all families59 with children that were workless at time t, where no adult was aged 55 or over and where the family had been interviewed in year t + 1. There were three outcomes that could occur by year t + 1:
1 No change – the family remained ‘non-working’.
2 An individual may have started working 16 or more hours per week.
3 The family status may have changed (e.g. a lone parent formed a couple). The changes in family situation took precedence, so if a mother had experienced both a change in work and a change in family status, she was put into the change in family status category.
These three outcomes were analysed together using a multinomial regression analysis. The results showed that that having a mini-job in year t was strongly and significantly associated with increased odds of working 16 or more hours in
59 Lone fathers were excluded from the analysis.
Appendices – Replicating the multinomial regression analysis of Iacovou and Berthoud (2000)

136
year t + 1. In addition, there was a strong association between working a greater number of hours in a mini-job and the odds of working 16 or more hours the next year. Iacovou and Berthoud estimated separate models for couple fathers, couple mothers and lone parent mothers. We have attempted to to replicate their findings for the couple mothers only. Our analysis is based on data from FACS and relates to the period 2001 to 2005, whereas Iacovou and Berthoud’s analysis related to 1991 to 1997. There have been a number of changes in the arrangements for in-work financial support for families between these periods.
Where possible we have derived an identical set of predictor variables to enter into the regression model. However, there were two variables that we were unable to replicate. Iacovou and Berthoud used the employment rate of the local area as a variable in the model, which was not available in the FACS data set. Alternatives, such as the local area index of employment deprivation were considered as a substitute but dropped because they were not available for all waves. In addition, it would have been time-consuming to derive the duration of the couple mother’s relationship. It was decided to drop this variable. As this analysis was being run simply to check on consistency in the main outcomes and since neither of these measures was significantly related to the likelihood of a mother making a change in work or family status, we consider that leaving them out is unlikely to affect the comparison we wish to make.
The analysis was based on data from couple mothers participating in at least two consecutive interviews during waves 3 to 7 of FACS. We selected respondents who were in a ‘workless’ family with children at time t, were aged under 55 and for whom we had data at t + 1. There were 1,035 transitions in our data, compared to 633 in Iacovou and Berthoud’s. The results of our model are presented in Table B.1. The coefficients are reported in the form of relative risk ratios. Each coefficient represents the effect of increasing the predictor variable by one unit on the likelihood of the outcome (change in work status, change in family status), relative to the likelihood of the base (no change in status).
Appendices – Replicating the multinomial regression analysis of Iacovou and Berthoud (2000)

137
Table B.1 Estimates from the regression
Couple mothers Relative Risk Ratios Significance
Change in Work Status
Personal and Labour Market Characteristics
Age 1.15
Age squared/100 0.80
Education: ‘A’ level or better 2.49 **
Education: GCSE or similar 1.88 *
Limiting health problem 1.06
Years since last had a job 0.97
Never had a job 1.36
Would like a job 3.81 ***
Hours in a mini-job 1.10 ***
Family Characteristics
Cohabiting 0.68
Age of youngest child 1.05
Youngest child is under 1 1.49
Youngest child is 4 or 10 0.99
Three or more children 1.22
Social housing 0.47 **
Private renting 0.67
Change in Family Status
Personal and Labour Market Characteristics
Age 0.88
Age squared/100 1.16
Education: ‘A’ level or better 0.27 *
Education: GCSE or similar 1.11
Limiting health problem 1.12
Years since last had a job 0.97
Never had a job 0.72
Would like a job 0.94
Hours in a mini-job 1.03
Family Characteristics
Cohabiting 2.22 ***
Age of youngest child 0.96
Youngest child is under 1 0.77
Youngest child is 4 or 10 1.21
Three or more children 1.10
Social housing 0.88
Private renting 1.44
Notes: 1. The response is 1 = no change, 2 = work of 16 or more hours, 3 = change in family status.
2. Significance is denoted by asterisks: *** = 1%, ** = 5% and * = 10%.
3. Base is all couple mothers aged <55 in non-working families at time t (n= 1,035).
Appendices – Replicating the multinomial regression analysis of Iacovou and Berthoud (2000)

138
Like Iacovou and Berthoud, we found that the hours a couple mother spent working in a mini-job was positively and significantly related to the likelihood of them moving into work of 16 or more hours. Likewise we also found that the mother’s having A-levels and stating she would like a job both had large positive and significant effects.
There were a number of variables that were significantly related to the move into work in the FACS analysis, but not in Iacovou and Berthoud’s results. We found having GCSEs or similar qualifications to be significantly related to a move into work. We also found that, controlling for all other factors in the model, couple mothers who were renting accommodation in the social sector of housing (accommodation rented from a local authority or housing association) were much less likely to make the same transition, and that this finding was statistically highly significant.
The model shows that the age of the mothers was not significantly related to movement into work, when other factors were taken into account. This was an unexpected result, given that other analysis of the FACS data had suggested younger mothers were more likely to move from inactivity into work of 16 or more hours. It was possible that using age as a continuous variable was causing this result. The age of mother was re-coded into ten-year bands and the multinomial model was run again, replacing the continuous age variables with banded age. The results from this model for the couple mothers movement into work are given in Table B.2. This found that the mothers’ age band was significantly related to the probability of moving into work. Mothers in the two bands aged 25 to 34 and those aged 35 to 44 were significantly more likely to move into work. The ratio for the 16 to 24 age group was not significant, probably due to a low base for analysis. This set of findings may suggest there is a more complicated relationship between age and moving into work in the FACS data than was the case in the early 1990s.
Appendices – Replicating the multinomial regression analysis of Iacovou and Berthoud (2000)

139
Table B.2 Estimates for probability of moving into work using age bands
Couple mothers Relative Risk Ratios Significance
Change in Work Status
Personal and Labour Market Characteristics
Age of mother 16-24 3.15
Age of mother 25-34 2.79 *
Age of mother 35-44 3.16 **
Education: ‘A’ level or better 2.63 **
Education: GCSE or similar 1.81 *
Limiting health problem 1.08
Years since last had a job 0.98
Never had a job 1.44
Would like a job 3.86 ***
Hours in a mini-job 1.10 ***
Cohabiting 0.66
Age of youngest child 1.06
Youngest child is under 1 1.53
Youngest child is 4 or 10 1.00
Three or more children 1.24
Social housing 0.47 **
Private renting 0.66
Notes: 1. The response is 1 = no change, 2 = work of 16 or more hours, 3 = change in family status.
2. Significance is denoted by asterisks: *** = 1%, ** = 5% and * = 10%.
3. Base is all couple mothers aged <55 in non-working families at time t (n= 1,035).
Appendices – Replicating the multinomial regression analysis of Iacovou and Berthoud (2000)


141
ReferencesBarham, C. and Begum, N. (2007) Time Series Analysis of the Labour Force Survey longitudinal data sets, in Economic and Labour Market Review, Vol. 1, No 1, January 2007.
Bell, A., Finch, N., La Valle, I., Sainsbury, R. and Skinner, C, (2005) A question of balance: Lone parents, childcare and work, Department for Work and Pensions, Research Report No 230.
Bell, K., Brewer, M. and Phillips, D. (2007) Lone Parents and Mini-jobs, Joseph Rowntree Foundation, York.
Blundell, R, Brewer, M. and Francesconi, M. (2005) Job Changes, Hours Changes and the Path of Labour Supply Adjustment, Institute for Fiscal Studies, Working Paper 21.
Brewer, M. and Paull, G. (2005) The Consistency and Reliability of the Activity History Data in the Families and Children Study (FACS), Department for Work And Pensions Working Paper No 25.
Evans, M., Harkness, S. and Ortiz, R. (2004) Lone parents cycling between work and benefits, Department for Work And Pensions Research Report No. 217.
Gregg, P. Harkness, S. and Macmillan, N. (2006) Welfare to work policies and child poverty – a review of issues relating to the labour market economy, Joseph Rowntree Foundation.
Hales, J., Collins, D., Hasluck, C. and Woodland, S. (2000): New Deals for Young People and for Long-Term Unemployed: Survey of Employers, Research and Development Report ESR58, Employment Service.
Hills, J. (2007) Ends and means: The Future Roles of Social Housing in England, CASE Report 34, ESRC Research Centre for Analysis of Social Exclusion.
Kasparova, D., Marsh, A., Vegeris, S. and Perry, J. (2003) Families and Children 2001: Work and Childcare, Department for Work and Pensions, Research Report.
References

142
Lyon, N., Tait, C. and Scholes, S. (2006) Families And Children Study, 2005, Wave 7 Technical Report, National Centre for Social Research, London.
McKay, S. (2004) Lone Parents in London Quantitative Analysis of Differences in Paid Work, Department for Work and Pensions, In-House Report No. 136.
Millar, J. and Bradshaw, J. (1991) Lone parent families in the UK, Department for Work and Pensions, Research Report No 6.
Millar, J., Ridge, T. and Bennett, F. (2006) Part-time work and social security: increasing the options. Department for Work And Pensions Research Report 351.
Nadeem, S. and Metcalf, H. (2007) Work-life policies in Great Britain: What works, where and how? Employment Relations Research Series No. 77, Department of Business, Enterprise and Regulatory Reform.
O’Connor, W. and Boreham, R. (2002) Investigating Low Labour Market Participation Among lone parents in London: A Review Of The Methods. Department for Work And Pensions In-House Report No. 104.
Paull, G. (2006) User Guide for the FACS Work History Data Release 2: Waves 1-7, Report submitted to Department for Work And Pensions.
Turley, C. and Thomas, A. (2006) Housing Benefit and Council Tax Benefit as in-work benefits; claimants’ and advisors’ knowledge, attitudes and experiences, Department for Work And Pensions Research Report No. 383.
References