motorcycle sliding friction for accident...
TRANSCRIPT

Motorcycle Sliding Friction for Accident Investigation
Erkenntnisse über Motorrad-Rutschverzögerungen
für Unfalluntersuchungen
Louis R. Peck, Bill Focha, Toby L. Gloekler
Dial Engineering, Lightpoint Data, S. D. Lyons, North Coast Truck Inspection,
and Collision Reconstruction Engineers, USA
62

Abstract
The subject research examined 15 actual crashes of motorcycles equipped with frame sliders and estab-
lished the related drag factor using 5 and 10Hz GPS data acquisition systems. The crashes occurred
during track days or races and many were also documented with on-board video, which was synchro-
nized with the GPS data when available. 14 controlled tests were then performed with different motor-
cycles and the sliding friction values were determined using GPS data acquisition and traditional meth-
ods for validation. The average drag factor for the 15 track crashes was -0.45 g’s (SD = 0.09) and
-0.48 g’s (SD = 0.08) in the 14 controlled tests, where none of the motorcycles were equipped with
frame sliders. These results align with previously published research. Of importance, this data showed
frame sliders do not lower the drag factor of a sport bike, but actually increase it. Moreover, a relation-
ship between certain collision dynamics and the sliding friction became apparent. This research will
help accident investigators more accurately quantify the pre-impact speed of downed motorcycles.
63

Motorcycle Sliding Friction for Accident Investigation
64

Introduction
Many studies have been performed to establish the drag factor of a downed motorcycle sliding across
typical roadway surfaces. However, available literature does not address real-world incidents where an
operator is involved and may interact with the motorcycle and roadway. Furthermore, the dynamics of
an actual crash certainly differ from quasi-static tests seen in past research [1, 2], and may differ from
sliding tests where a motorcycle is dropped from a moving truck or trailer [2-6].
Research on the subject to date has been relatively elementary, lacking the technology capable of detail-
ing the behavior of a sliding motorcycle throughout its travel. Typical methodology involves dropping
an upright motorcycle at a known speed and documenting the sliding distance by noting initial contact
with the roadway and final rest. This process allows for the calculation of the average drag factor of the
motorcycle during a slide, but does not provide information about the initial acceleration or changes
throughout the slide. McNally and Bartlett worked to gain more information about the initial decelera-
tion of a motorcycle striking the ground using frame-by-frame video analysis, though that project only
involved two motorcycles and three tests [5].
There is little information regarding the sliding behavior of motorcycles equipped with frame sliders.
Frame sliders are often installed on sport and sport-touring motorcycles and are comprised of metal or
plastic pucks designed to slide across the roadway to prevent damage to the fairings and frame. Some
accident investigators opine the sliding friction factor of motorcycles equipped with frame sliders is
much lower than those without the feature. At the time of this writing though, no published research on
the topic exists.
The goal of this project is to produce information to fill the voids mentioned above. To do so, data from
real crashes was sought using current GPS technology. The GPS data collection process was validated
via controlled testing where the sliding friction value was established using both traditional and updated
GPS-based methods. The controlled testing also serves to add to the current sliding friction database.
Procedure
The advent of an inexpensive, robust, accurate GPS data-logging device by QSTARZ sparked the con-
cept of the present study (Figure 1). The QSTARZ BT-Q1000eX logs position at 5 or 10Hz, depending
on the model, with speed calculation accuracy of ±0.1m/s, and timing accuracy of 50 ns, which creates
an uncertainty of 0.01g in the calculated result.
65

Figure 1. QSTARZ BT-Q1000eX GPS lap timer / data logger.
Track Crashes
The aforementioned GPS devices were distributed at track days and race events, and also grew in pop-
ularity naturally. As a result, a notable population of track riders were in a position to provide crash data
in the event of an incident. Data sets were collected at two paved racetracks in the United States over a
period of three years: New Jersey Motor Park (NJMP) and New Hampshire International Speedway
(NHMS). The motorcycles were standard street-going motorcycles with the usual minor modifications
to meet track requirements. These modifications often included removal of the mirrors, the addition of
frame sliders, and at times, the use of race tires. However, the majority of motorcycles analyzed within
were equipped with DOT approved tires (Figure 2).
Figure 2. Typical motorcycle examined in the track crashes.
This motorcycle was involved in Event 1.
66

The GPS devices were attached firmly to the upper triple clamp or fairings of the motorcycle. Only
instances where the device remained solidly attached throughout the collision sequence were considered
for analysis. The deceleration of the motorcycle was calculated by considering the change in speed and
slide duration, thereby capitalizing on the accuracy strengths of the GPS device. This method consoli-
dates the behavior of the motorcycle during an entire slide, reporting it in a single average value. This
method is most relevant in accident investigation since investigators will likely only know where the
motorcycle first struck the ground, and where it came to final rest.
Several of the involved motorcycles were equipped with on-board video recording devices. In those
cases, the video was synchronized with the GPS data using DashWare, a software package developed
for this purpose. Synchronization allowed for straightforward determination of the motorcycle speed at
first contact with the track. In cases were no video was available, the rider’s dataset was analyzed to
establish the expected behavior in a specific section of the track, which was then compared to the mo-
torcycle behavior in the case of the crash. The slide was considered to terminate when the speed dropped
below 0.9 m/s to eliminate error associated with GPS noise at low speeds.
The drag factor during the initial portion of the slide was calculated to determine if there was any notable
difference in the initial drag as seen by Bartlett, McNally [5]. When the data came from 10Hz units, the
first 0.5 seconds (five samples) were examined. If the data was retrieved from a 5Hz model, the first
0.6 seconds (three samples) were examined.
Controlled Testing
Controlled drop-tests were conducted at an asphalt-paved, police training facility in Roseville, Califor-
nia. 14 motorcycles of varying condition and type were acquired for testing (see Appendix A for a full
list). The make, model, year and vehicle identification number (VIN) of each motorcycle was recorded,
and the motorcycles were photographed in a pre-collision condition. In addition, each motorcycle was
weighed using portable digital scales (Figure 3). For consistency each motorcycle was prepared in the
same fashion: fuel and oil was drained, tires were inflated to the manufacture’s specification, and the
drive chain or belt was removed. Any preexisting damage to components that interfered with the rotation
of the tires was mitigated by removal or adjustment of the offending part.
67
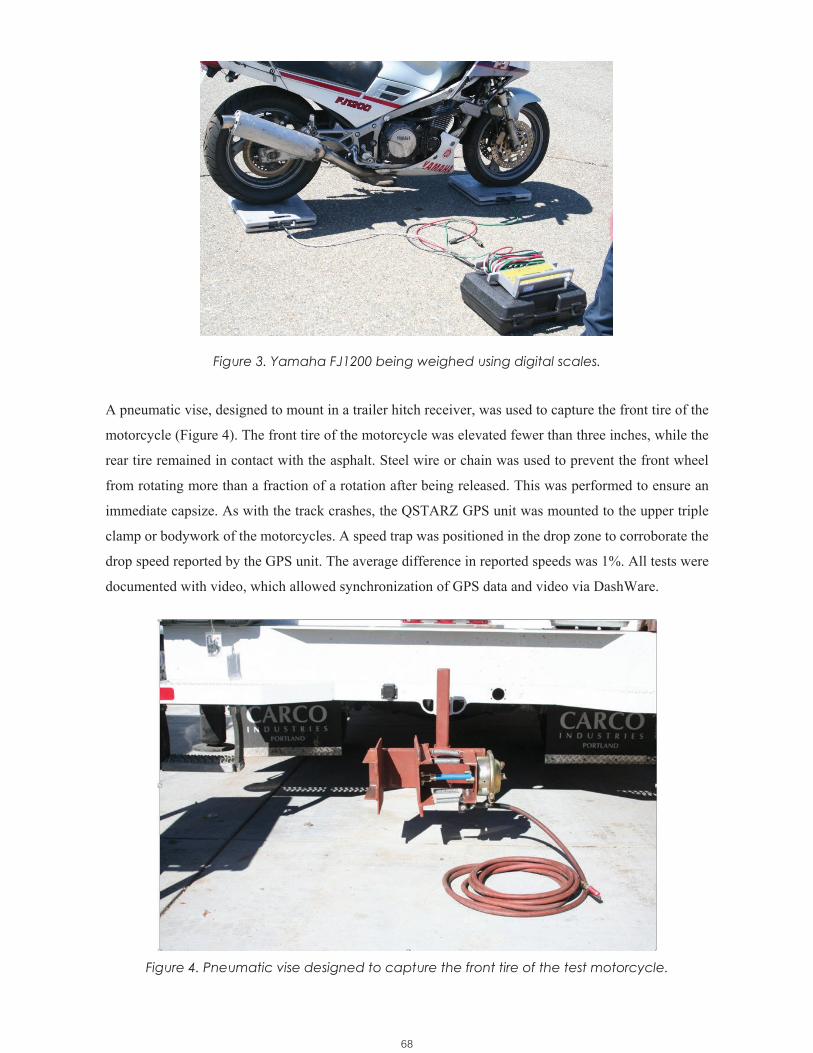
Figure 3. Yamaha FJ1200 being weighed using digital scales.
A pneumatic vise, designed to mount in a trailer hitch receiver, was used to capture the front tire of the
motorcycle (Figure 4). The front tire of the motorcycle was elevated fewer than three inches, while the
rear tire remained in contact with the asphalt. Steel wire or chain was used to prevent the front wheel
from rotating more than a fraction of a rotation after being released. This was performed to ensure an
immediate capsize. As with the track crashes, the QSTARZ GPS unit was mounted to the upper triple
clamp or bodywork of the motorcycles. A speed trap was positioned in the drop zone to corroborate the
drop speed reported by the GPS unit. The average difference in reported speeds was 1%. All tests were
documented with video, which allowed synchronization of GPS data and video via DashWare.
Figure 4. Pneumatic vise designed to capture the front tire of the test motorcycle.
68

The deceleration of the motorcycle was calculated using two methodologies. The GPS-based calculation
was performed as described above. In these tests, the GPS data was consistently synchronized with
video, again, allowing for straightforward determination of the speed of the motorcycle at first contact
with the ground. Traditional calculations were also performed. In these calculations, the sliding distance
of the motorcycle (first contact with the asphalt to center of gravity at final rest) was considered along
with the initial drop speed, which was determined using the speed trap and GPS device. The sliding
distance and drop speed can be used to calculate the drag factor using the following equation:
Where:
drag factor (g’s)
final velocity (m/s)
initial velocity (m/s)
sliding distance (m)
= standard gravity (m/s2)
The geometry of the course was measured using a Topcon GPT-2005 total station to establish grade and
superelevation.
Results
Track Crashes
15 crashes suitable for analysis were obtained. 14 slid on dry pavement, one slid on wet pavement, and
three of those motorcycles slid on grass or dirt for a portion of the event. A summary of the results is
presented in Table 1 below.
69

Table 1. Summary of track crashes.
Location indicates track and turn where the event occurred.
The average sliding drag factor for the track crashes on asphalt was -0.45 g’s (SD = 0.09), while the
average initial drag factor was -0.46 g’s (SD = 0.22). The event that occurred on wet asphalt resulted in
a drag factor of -0.41 g’s, which aligns with the dry asphalt data.
In Event 4, the motorcycle slid for a considerable distance on asphalt and hard packed dirt before coming
to rest. However, despite the change in surface, there was no notable change in the drag factor. There-
fore, the drag factor was determined to be -0.45 g’s for both the asphalt and dirt (Figure 5). The other
two events involving dirt slides, 8A and 9A, resulted in drag factors of -1.11 g’s and -0.61 g’s, respec-
tively.
70
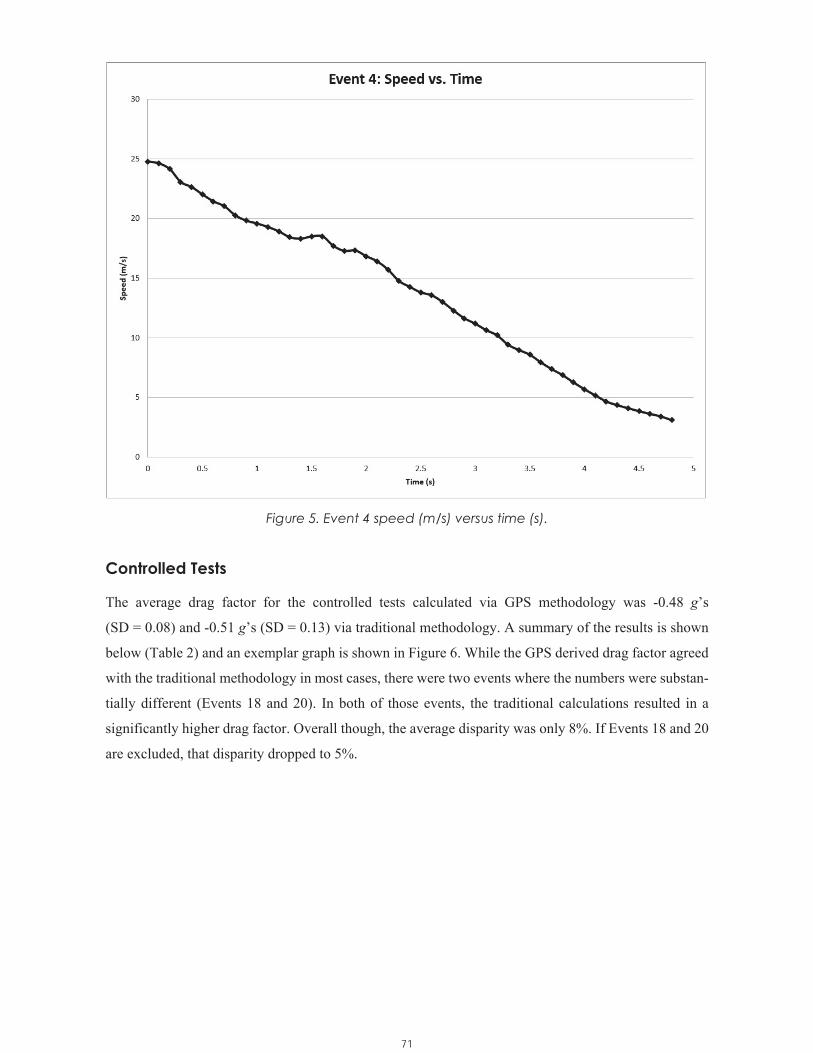
Figure 5. Event 4 speed (m/s) versus time (s).
Controlled Tests
The average drag factor for the controlled tests calculated via GPS methodology was -0.48 g’s
(SD = 0.08) and -0.51 g’s (SD = 0.13) via traditional methodology. A summary of the results is shown
below (Table 2) and an exemplar graph is shown in Figure 6. While the GPS derived drag factor agreed
with the traditional methodology in most cases, there were two events where the numbers were substan-
tially different (Events 18 and 20). In both of those events, the traditional calculations resulted in a
significantly higher drag factor. Overall though, the average disparity was only 8%. If Events 18 and 20
are excluded, that disparity dropped to 5%.
71

Table 2. Summary of controlled tests.
The average initial drag factor for the controlled testing was -0.54 g’s (SD = 0.28). The drag factor
during the first 0.5 or 0.6 seconds of the slide was compared to the average drag factor for the entire
slide. A paired comparison is shown in Figure 7.
Figure 6. Event 25 speed versus time, showing beginning and end of slide and slope of speed
change (calculated drag factor). The acceleration spike seen prior to initial selection point is
a result of the front tire contacting the roadway prior to the motorcycle capsizing.
72

Figure 7. Paired initial drag factor versus average drag factor for entire slide.
Finally, a histogram was prepared for the entire data set to illustrate the distribution, and is shown in
Figure 8.
Figure 8. Drag factor distribution for entire data set.
73

Discussion
The data presented within is consistent with available literature relating to un-faired motorcycles [1-6].
However, if the track crashes are compared to prior data for sportbikes equipped with fairings, there is
a clear disparity. For example, Raftery conducted two tests with a motorcycle equipped with Suzuki
Katana fairings and obtained a drag factor of -0.26 g’s [3]. Similarly, Medwell performed two tests
where a fully faired 1992 Kawasaki Ninja ZX-7 slid across an asphalt roadway and obtained drag factors
of -0.29 and -0.36 g’s [4]. Bartlett et al compiled all sportbike data available from I.P.T.M. testing and
combined that with the tests mentioned here to calculate an average drag factor of -0.37 g’s (SD = 0.08)
for sportbikes [6]. Recall, the average drag factor for the track crashes presented above, which were all
sportbikes, was -0.45 g’s (SD = 0.09). This increase in the drag factor is thought to be a result of the
installed frame sliders, which often prevent contact with nearby fairings, thereby inducing behavior
more consistent with a standard, non-faired motorcycle. It should be noted that all the track-crash mo-
torcycles included in this study were equipped with plastic frame sliders. Metallic frame sliders may
behave differently.
Two of the controlled tests were performed with fully faired motorcycles without frame sliders (Event
21: 1991 Suzuki GSX600F, Event 26: 1989 Suzuki GSX-R750) and the drag factors were -0.47 g’s and
-0.42 g’s, respectively, which aligns with the frame slider data set. Of course, these values also align
with the totality of the small sportbike sample set, where one standard deviation above the mean is
-0.45 g’s.
Excluding the two sportbikes mentioned above from the controlled testing data set yields an average
drag factor of -0.49 g’s (SD = 0.09). This agrees with the totality of data presented by Bartlett et al in a
2007 review paper, where the average was reported to be -0.48 g’s (SD = 0.13) [6].
One moped was included in the controlled tests (Event 20: Peugot 101SP). Unfortunately, this was one
of the two tests where the GPS based calculations did not agree with the traditional methodology. Spe-
cifically, the GPS based calculations yielded a drag factor of -0.66 g’s while the traditional method
yielded a drag factor of -0.90 g’s. Considering the low initial speed (9.4 m/s) and therefore short sliding
distance (4.9 m), any error identifying the area of initial contact with the roadway or the position at final
rest could translate into a substantial error in the drag factor. This factor may be accountable for the
large disparity. This theory is supported by comparing the standard deviations of the traditional meth-
odology and GPS-based method, 0.13 g’s and 0.08 g’s, respectively. Namely, these standard deviations
show there is more variance in the traditionally obtained data, likely a result of the human element.
There was one other major disparity in the calculation methodologies, Event 18. The GPS based drag
factor was -0.45 g’s while the traditional calculation method resulted in a drag factor of -0.54 g’s (20%
74

difference). In that test, the GPS device was mounted to the tail of the motorcycle, as a more appropriate
position was not available. Additionally, the motorcycle nearly completed one entire revolution while
sliding across the asphalt. This movement, combined with the distance between the GPS device and the
motorcycle Center of Gravity could be responsible for the drag factor disparity.
Lambourn concluded when a motorcycle falls to the ground from an upright position, the drag factor
may be dependent on the drop speed [2]. The theory is that at lower speeds, an acceleration spike from
initial contact with the roadway would be significant, but at higher speeds that spike would play less of
a role considering the overall slide distance. McNally and Bartlett investigated this concept using frame-
by-frame video analysis and found the drag factor in the first 4.6 m was more than twice the remaining
drag factor in three tests they performed [5].
With respect to the track crashes presented within, those with on-board video were analyzed to qualita-
tively establish the roll rate of the motorcycle as it fell to the ground. In the cases where roll rate was
high and the motorcycle fell a considerable distance (i.e., not at full lean) an initial drag factor spike was
consistently observed. The spikes observed in this dataset were never as substantial as those observed
by McNally and Bartlett. In the controlled tests, the motorcycles were all dropped from an upright po-
sition, but there was no consistency with respect to the initial drag factor compared with the overall drag
factor. In the most extreme case, the initial drag factor was nearly twice the overall drag factor, but there
were three instances where the initial drag factor was closer to half of the overall drag factor.
Figure 7 shows a paired compilation of the initial drag factor compared to the overall drag factor for all
events presented here. For a total of 29 events, the initial drag was higher in 14, lower in 14, and the
same in 1. This data suggests the dynamics of the motorcycle must be considered when determining if
an initial spike is likely. For accident investigators, it is likely not worth considering for high-speed
slides. However, if the motorcycle was known to have a high roll rate prior to contacting the ground,
and the initial speed was low, utilizing a higher drag factor would be appropriate.
As discussed, the initial acceleration was calculated over a period of 0.5 (five data samples) or 0.6 sec-
onds (three data samples), depending on the specific GPS device. It is possible the initial acceleration
spike is so short that it was imperceptible in some instances. Further testing with higher frequency equip-
ment could provide further insight on that front. Though, if the spike is of such short duration that it was
not detected by the devices used here, it would rarely be worth considering in the field of collision
reconstruction.
75

Conclusions
1) The GPS-based methodology used in this study produced drag factors consistent with previous
research and was confirmed via controlled testing.
2) Sliding sportbikes equipped with frame sliders will behave more like a standard, non-faired
bike, since the sliders prevent the nearby fairings from contacting the roadway.
3) There will not always be an initial spike in the drag factor as the motorcycle contacts the road-
way. The behavior of the motorcycle prior to contacting the roadway must be considered.
References
1. Day, T., Smith, J., “Friction Factors for Motorcycles Sliding on Various Surfaces,” Society of
Automotive Engineers Paper No. 840250, 1984.
2. Lambourn, R., “The Calculation of Motorcycle Speeds from Sliding Distances,” Society of
Automotive Engineers Paper No. 910125, 1991.
3. Raftery, B., “Determination of the Drag Factor of a Fairing Equipped Motorcycle,” Society of
Automotive Engineers Paper No. 950197, 1997.
4. Medwell, C., McCarthy, J., Shanahan, M., “Motorcycle Slide to Stop Tests,” Society of
Automotive Engineers Paper No. 970963, 1997.
5. McNally, B., Bartlett, W., “Motorcycle Sliding Coefficient of Friction Tests,” Presented at
IPTM Special Problems in Accident Reconstruction, 2003.
6. Bartlett, W., Baxter, A., Robar, N., “Motorcycle Slide-to-Stop Tests: I.P.T.M. Data Through
2006,” Accident Investigation Quarterly Vol. 46, Spring 2007.
Contact Information
The authors can be contacted at:
[email protected], [email protected], and [email protected].
76

Acknowledgments
The authors would like to gratefully acknowledge S. D. Lyons, Inc., Tony’s Track Days, The Loudon
Road Race Series staff and riders, The California Association of Accident Reconstruction Specialists,
The Roseville California Police Department, and The Elk Grove California Police Department.
77
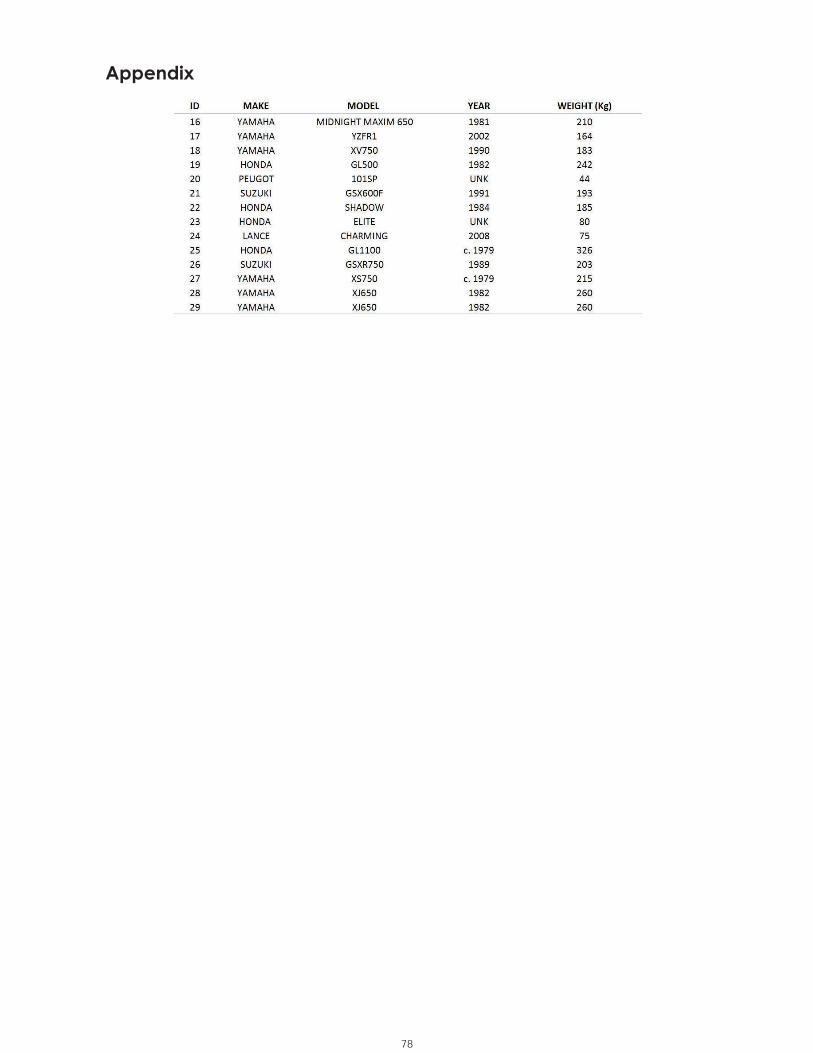
Appendix
78