mottled enamel due to excessive fluorides in water · the cost analysis presented is based on the...
TRANSCRIPT

2 5 7
7 3 D E ( 1 )
' / • • • * ;
' • • • . / / * "
defluoriddtion f25?-73060J }

Mottled enamel due to excessive fluorides in water
S
DEFLUORIDATION
(REVISED)
CENTRAL PUBLIC HEALTH ENGINEERING RESEARCH INSTITUTE
NEHRU MARG, NAGPUR-440020, INDIA
DECEMBER 1973

FOREWORD
A medium "DEFLUORON-2" has been developed for removal of fluorides from water and does not suffer from the handicaps which some of the indigenous media developed earlier suffered from. Laboratory tests have been duly supplemented with pilot plant operations. Cost of defluori-dation, using this new medium, ranges from Re. 0.25 to Rs. 1.11 per M 3
depending on fluoride concentration and alkalinity in the raw water. This is mainly due to cost of regeneration with alum. It is hoped that advantage will be taken of this to ameliorate the conditions of thousands of people who are today exposed to "fluorosis" in India.
First edition of this brochure was brought out in June, 1969. In preparing this revised edition the main structure of the brochure has not been altered, but a number of minor changes and additions have been made to bring the information up-to-date on the basis of further experience with Defluoron-2. The cost analysis presented is based on the current market rates in India.
I wish to acknowledge my thanks to S/Shri K. R. Bulusu, B. N. Pathak, V. P. Thergaonkar, D. N. Kulkarni and W. G. Nawlakhe of Water Chemistry Division who worked tirelessly to develop the medium and evaluate its performance characteristics.
(Prof. N. MAJUMDER)
DIRECTOR
Nagpur:
December 1973

I N D E X
Page
Fluorosis ... 7
Optimum concentration of fluorides ... 7
Description of the process ... 8
"Defluoron-2" Medium characteristics ... 8
Exhaustion curve ••• H
Fluoride leakage test ... 12
Operating and treatment costs ... 12
Annexure A—Cost calculations
of CPHERI Defluoridation Plant ... 18
Annexure B—The details of the test ... 20

Defluoridation
Defluoridation is a process for reducing the concentration of fluorides present in drinking water and consequently the incidence of fluorosis.
FLUOROSIS
Fluorine is one of those remarkable elements which has not only notable chemical qualities but also physiological properties of great interest and importance for human health. Absence of this element in human diet is known to lead to 'dental caries'. When it is present to the extent of more than 1.2 mg/1 in drinking water, it can lead to another disease 'fluorosis'.
A few years after fluorosis was reported in USA, Dr. T. Lakshmi-narayana, District Health Officer in Nellore, A.P., (India) observed in 1936 the prevalence of a condition similar to fluorosis. Subsequently fluorosis has been reported from several areas in India, particularly Andhra Pradesh, Tamil Nadu, Kerala, Punjab, Haryana and Rajasthan.
It is shown that the severity of fluorosis was directly related to the fluoride concentration in the water consumed during the period of permanent tooth calcification. Children continuously drinking water containing about 5 mg/1 or more fluoride are invariably affected with mottled enamel of the permanent teeth; many of these children have gross calcification defects which weaken the enamel and cause eventual loss of teeth through attrition. Other expected effects from excessively high intake level? are*—(a) bone changes when water containing 8-20 mg fluoride per litre is consumed over a long period of time; (b) crippling fluorosis when water with 20 or more mg of fluoride from all sources is consumed per day for 20 or more years, and (c) death when 2250-4500 mg is consumed in a single dose. » «vi' i . •
OPTIMUM CONCENTRATION OF FLUORIDES
The optimum concentration of fluoride, when no ill effects result, seems to vary with proportion of body weight to the total amount of fluoride consumed from water and food, and with the ambient tempera^
* Shaw, J., Editor. "Fluoridation as a Public Health Measure". A.A.A.S. Pub. No. 38. Washington DC, 1954.
7

ture. In India, the optimum fluoride concentration in water might vary between 0.5 and 1.2 mg/1 depending upon climatic conditions prevalent in different parts of the country. The relationship between fluoride content of drinking water and dental fluorosis is shown in Fig. 1 (after Hodge, 1950).
0 1 10 10.0 ..{
FLUORIDE CONTENT OF DRINKING WATER (PPM)
Fig. 1—Relationship between Fluoride Content of Drinking: Water and Dental Fluorosis
(HODGE, H. C. [1950] J. Amer. Dent. Assoc, 40, 436)
DESCRIPTION OF THE PROCESS
In practice, the PHERI Defluoridation Process in its simplest form consists of passing the raw water through a bed of "DEFLUORON-2" medium contained in a cylindrical steel shell to which are attached the necessary pipe work and control valves. Immediately adjacent to the shell the regeneration tank is located so that the whole installation is compact and easily maintained. Fig. 2 is a line diagram of a Defluoridation Plant.
"DEFLUORON-2"
"DEFLUORON-2" is a sulphonated medium developed from indigenous material. It is operated on the aluminium cycle with alum solution as regenerant.
MEDIUM CHARACTERISTICS
Bulk density Size Voids (approximate) Attritional losses
810 kg per M3
0.6-2.0 mm 40 percent Negligible
8

ALUM TANK
rrrwi » » i i » H rBStrrrl T ^ 4 *« VENT
TREATED WATER
RAW WATER
Fig. 2—Defluoridation Plant
Maximum operating service flow rates:
(a) 5.0 M3 per sq. meter of bed area per hour (b) 5.5 M3 per hour per M3 of medium '
Wash water treatment
0.15-0.22 M3 per sq. meter per minute for a maximum duration of 10 minutes.
Regenerant
One bed volume of 4 percent (w/v) alum solution. A bed volume is equal to the volume of the medium in the unit. The alum solution has a pH between 2.6 and 2.8.
Regenerant contact period with medium
30-40 minutes.
9

Depth of the medium
0.6-1.0 meter.
Pressure drop through the medium
1.2-1.5 meter per meter depth of medium at 5 M3 per sq. meter bed area per hour flow rate.
Alkalinity tolerance
Bicarbonate Alkalinity:
With raw water fluorides ranging between 8 and 12 mg/1 the average defluoridation capacity is 650 mg fluoride per litre of medium. However, because of greater difficulty in fluoride removal at lower concentrations, the capacity of the medium reduces to 480 mg/1 of medium, when using a raw water containing between 5 and 7 mg/1 of fluorides. These capacities correspond to a raw water alkalinity of 160 mg/1 as CaCOs. The capacity of the medium at other alkalinity levels is given below:—
FLUORIDE REMOVAL CAPACITY,* mgr FLUORIDE PER LITRE OF MEDIUM
Raw water fluorides, mg per litre
3-5 5-7 7-8 8-10
340 480 560 650 300 400 460 530 230 300 350 400 190 250 270 300 140 170 210 250 100 120 180 200 80 100 120 150
* Based on an average fluoride concentration of 0.6-0.8 mg/1 in the treated water,
Hydroxyl Alkalinity;
The medium can tolerate hydroxyl alkalinity upto about 5 mg/1 as CaC03. The fluoride concentration in the treated water increases with the increase in hydroxyl alkalinity. There is a 30 percent reduction in the capacity of the medium when hydroxyl alkalinity is 25 mg/1 as CaC03.
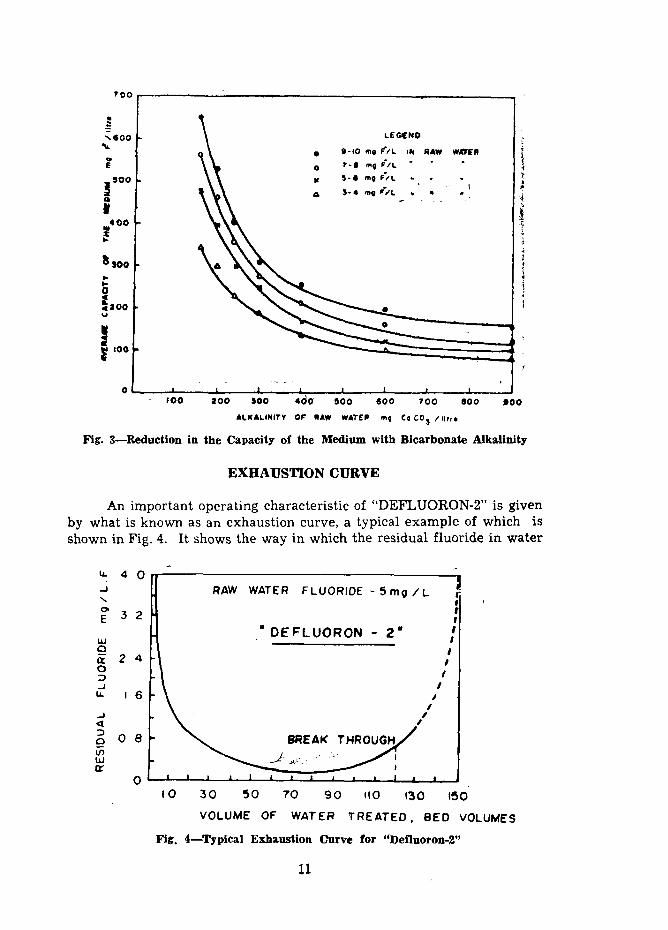
The decrease in the capacity of the medium with increase in bicarbonate alkalinity is shown in Fig. 3.
Bicarbonate alkalinity of the raw water mg CaC0 3 / l
180 200 240 300 400 600 900
10
TOO
LEGCNO
» - I O tng F"/L IN R A W VMFER
roo 2 0 0 500 4 0 0 9 0 0 6 0 0 TOO 8 0 0 • 0 0
Fig. 3—Reduction in the Capacity of the Medium with Bicarbonate Alkalinity
EXHAUSTION CURVE
An important operating characteristic of "DEFLUORON-2" is given by what is known as an exhaustion curve, a typical example of which is shown in Fig. 4. It shows the way in which the residual fluoride in water
4 0
o or o
o ID
3 2 •
0 8
1 RAW WATER FLUORIDE - 5 mo / L r f
"DEFLUORON - 2
0 I—'—'—' L J 1 — i — i i i • ' » «
10 3 0 30 70 9 0 HO 130 ISO
VOLUME OF WATER TREATED, BED VOLUMES
Fig. 4—Typical Exhaustion Curve for "Defluoron-2"
11

changes with the volume of the water treated. There is a sharp breakthrough point, after which, with a further quantity of water treated, the fluoride leakage rises steeply. This enables the end of the exhaustion stage of the process to be easily observed. In practice, defluoridation would be stopped well before sharp break-through when a certain concentration of fluoride ion (say 1.2 mg/1) appears in the effluent.
FLUORIDE LEAKAGE TEST
An easy colorimetric test can be used to detect fluorides in water. The test is based on the reaction between fluoride and zirconium-dye lake. The fluoride reacts with the dye lake, dissociating a portion of it into a colourless complex anion (ZrF8 ) and the die. As the amount of fluoride is increased, the colour produced becomes progressively lighter. Alizarin Red S visual method is suggested as a satisfactory procedure for fluoride evaluation in treated water. Samples collected an hour after the start of the plant can be tested by this method. The details of the test are contained in Annexure B.
OPERATING AND TREATMENT COSTS
Nearly the whole cost of operating a defluoridation plant is the cost of alum required for regeneration. The actual defluoridation cost depends upon the fluoride and alkalinity content of the raw water and the price of alum at site, but as a general rule it may be said that the most of fluoride bearing waters in India contain fluoride ranging from 3 to 10 mg/1 and can be defluoridated at a cost between Re. 0.25 and Rs. 1.11 per M3 (see Table I and Fig. 5). Th e treatment costs increase considerably with alkalinity of the raw water (Table II-V). Annexure A gives cost calculations of CPHERI Defluoridation Plant. The medium requires to be replaced once in every three years.
<r hi >- I 0
m
UJ K K 0 . 4
0 2
9 0 0 mg/ i Alk
Fir. 5—Cost of Defluoridation at Different Levels of Bicarbonate Alkalinity
12

TABLE I—RELATIONSHIP BETWEEN RAW WATER FLUORIDE AND COST ESTIMATE*
Fluoride Legnth of run Quantity of water concentration between rege- treatable per in raw water nerations regeneration at
maximum rate of 6.8 MVhr
mg/1. hours. M8
3
4
5
6
7
8
9
10
5.3-22.7
4.0-17.0
4.0-19.2
3.3-16.0
3.4-16.0
3.9-16.3
3.3-14.4
3.0-13.0
37.33-158.67
28.00-119.00
28.00-134.40
23.33-112.00
24.00-153.60
26.75-113.75
23.33-101.11
21.00-91.00
Cost of treatment Per capita annual Capital cost per per M* (including cost on the basis M 8 of water, staff, chemicals, of 25 1/capita/day depreciation, power etc.)
Rs. Rs. Rs.
0.35-1.11
0.32-1.01
0.30-0.91
0.30-0.98
0.30-1.01
0.27-0.86
0.29-0.86
0.25-0.67
3.19-10.12
2.92-9.22
2.74-8.30
2.74-8.94
2.74-9.22
2.46-7.85
2.65-7.85
2.28-6.11
128.51-154.44
131.17-165.74
129.96-165.74
131.84-174.78
131.84-173.27
131.66-168.75
133.06-174.78
134.44-180.80
* Depends on the alkalinity of raw water which varies between 160 to 900 mg/1 as CaCO,
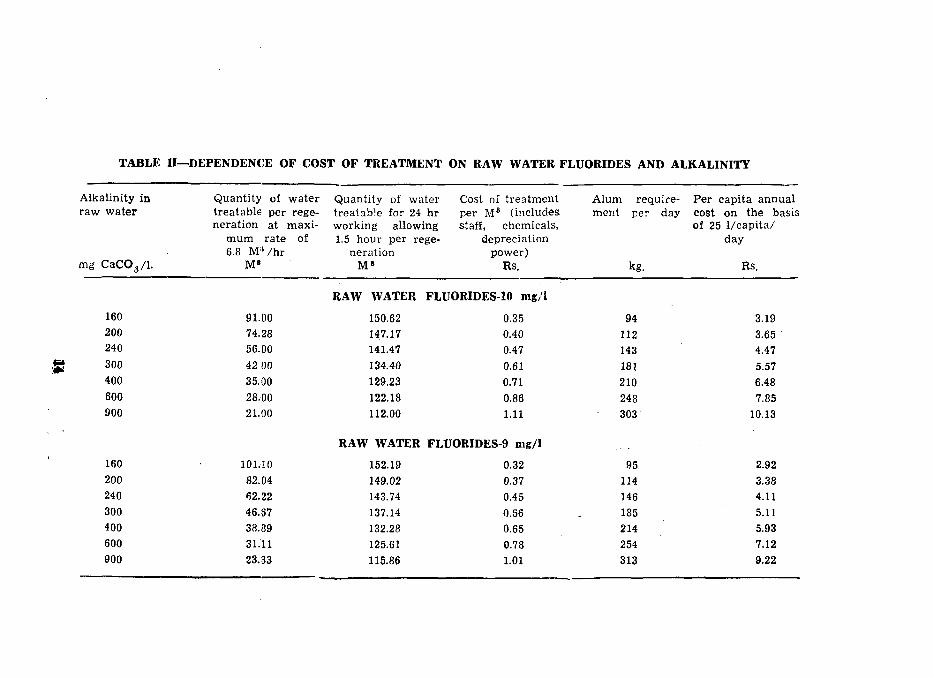
TABLE II—DEPENDENCE OF COST OF TREATMENT ON RAW WATER FLUORIDES AND ALKALINITY
Alkalinity in raw water
mg CaCO.,/1.
Quantity of water treatable per regeneration at maxi
mum rate of 6.8 M : , /hr
Quantity of water treatable for 24 hr working allowing 1.5 hour per rege
neration M»
Cost of treatment per M8 (includes staff, chemicals,
depreciation power)
Rs.
Alum require- Per capita annual ment per day
kg.
cost on the basis of 25 1/capita/
day
Rs.
RAW WATER FLUORIDES-10 mg/l
160
200
240
300
400
600
900
91.00 74.28 56.00 42 00 35.00 28.00 21.00
150.62 147.17 141.47 134.40 129.23 122.18 112.00
0.35
0.40
0.47
0.61
0.71
0.86
1.11
94
112
143
181
210
248
303
3.19 3.65 4.47 5.57 6.48 7.85
10.13
RAW WATER FLUORIDES-9 mg/l
160
200
240
300
400
600
900
101.10 82.04 62.22 46.67 38.89 31.11 23.33
152.19 149.02 143.74 137.14 132.28 125.61 115.86
0.32
0.37
0.45
0.56
0.65
0.78
1.01
95
114
146
185
214
254
313
2.92
3.38
4.11
5.11
5.93
7.12
9.22

TABLE III—DEPENDENCE OF COST OF TREATMENT ON RAW WATER FLUORIDES AND ALKALINITY
w
Alkalinity in raw water
mg CaCO,/l.
160 200 240 300 400 600 900
160 200 240 300 400-600 900
Quantity of treatable per neration at
mum rate
water rege-
maxi-of
5.8 M*/hr M»
113.75 92.75 69.99 52.50 43.75 35.00 26.25
112.00 92.00 70.00 54.00 42.00 32.00 24.00
Quantity of water treatable for 24 hr working allowing 1.5 hour per rege
neration M*
RAW WATER
153.80 150.91 146.08 140.00 135.45 129.22 120.00
RAW WATER
153.60 150.79 146.08 140.65 134.40 126.49 116.67
Cost of treatment per M* (includes staff, chemicals,
depreciation power)
Rs.
FLUORIDES-8 mg/1
0.30 0.34 0.41 0.53 0.59 0.71 0.91
FLUORIDES-7 mg/1
0.30 0.34 0.41 0.50
0.61 0.77 0.98
Alum requirement per
kg.
96 115 147 189 219 262 324
78 93
118 148 181 224 276
day Per i cost of 25
capita annual on the basis 1/capita/ day
Rs.
2.74 3.10 3.74 4.65 5.38 6.48 8.30
2.74 3.10 3.74 4.56 5.67 7.03 8.94

TABLE IV—DEPENDENCE OF COST OF TREATMENT ON RAW WATER FLUORIDES AND ALKALINITY
Alkalinity in raw water
mg CaC03/L
Quantity of water Quantity of water Cost of treatment
160
200
240
300
400
600
900
160
200
240
300
400
600
900
treatable per regeneration at maxi
mum rate of 6.8 M 8 / h r
M «
112.00 93.33 70.00 58:33 39.67 118.00 J!3.33
1J4.40 112.00 £4.00 10.00 47.60 53.60 58.00
treatable for 24 hr per M* (includes working allowing staff, chemicals, 1.5 hour per rege- depreciation
neration power) M' Rs.
RAW WATER FLUORIDE S-6 mg/1
153.60 0.30 151.01
146.08
142.37
132.83
122.18
115.86
0.34 0.41 0.47 0.64 0.86 1.01
RAW WATER FLUORIDES-5 mgr/1
155.52
153.60
149.33
146.08
137.63
128.00
122.18
0.2?.
0.30
0.36
0.41
0.55
0.73
0.86
Alum requirement per
kg.
78 92
118 138 190 247 282
66 77
100 118 164 216 247
day Per cost
capita annual on the basis-
of 25 1/capita/ day
Rs.
2.73 3.10 3.74 4.29 5.84 7.85 9.22
2.46 2.73
. 3.28 3.74 5.02 6.66 7.85

TABLE V—DEPENDENCE OF COST OF TREATMENT ON RAW WATER FLUORIDES AND ALKALINITY
Alkalinity in raw water
mg CaCO./l.
160 200 240 300 400 600 900
160 200 240 300 400 660 900
Quantity of treatable per neration at
mum rate 6.8 M*/nr
M»
119.00 105.00 80.50 66.50 49.00 35.00 28.00
water rege-
maxi-of
Qu tre
antity of water at able for 24 hr
working allowing 1.5 hour per
neration M 8
rege-
Cost of treatment per M8 (includes staff, chemicals,
depreciation power)
Rs.
RAW WATER FLUORIDES-4 mg/I
154.38 152.73 148.61 145.09 138.35 129.23 122.18
0.29 0.32 0.38 0.43 0.55 0.71 0.86
Alum require- Per capita annual
153.67 140.00 107.33 88.67 65.33 46.66 37.33
RAW WATER FLUORIDES-3 mg/1
157.57
156.28
153.03
150.21
144.73
137.14
131.12
0.25
0.27
0.31
0.35
0.44
0.56
0.67
ment per day
kg.
73
83
105
124
160
210
247
56
64
81
96
126
166
199
cost on the basis of 25 1/capita/
day
Rs.
2.65
2.82
3.47
3.92
5.02
6.48
7.85
2.28
2.46
2.83
3.19
4.02
5.11
6.40
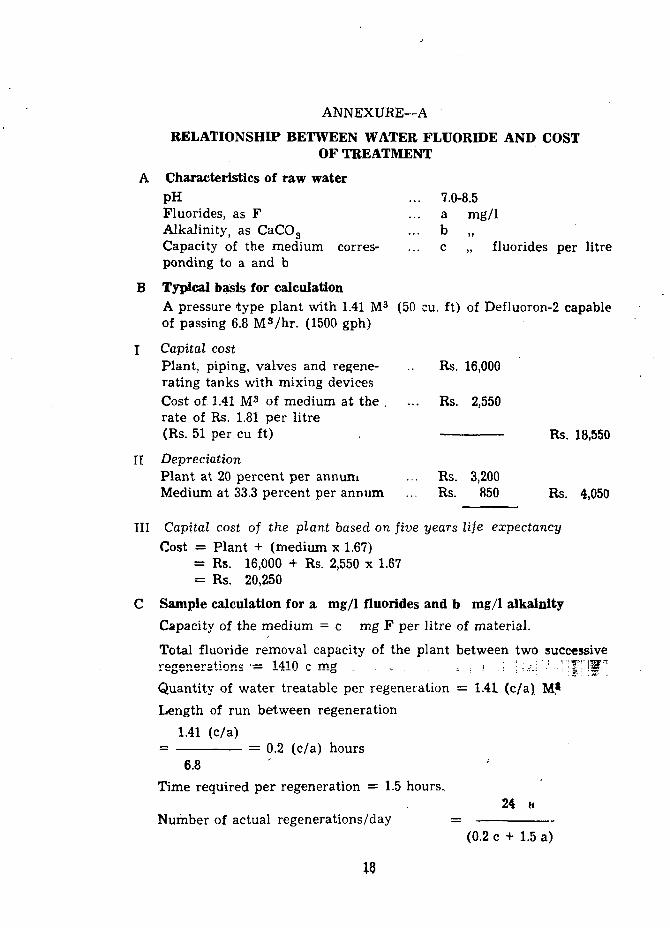
ANNEXURE—A
RELATIONSHIP BETWEEN WATER FLUORIDE AND COST OF TREATMENT
Characteristics of raw water PH Fluorides, as F Alkalinity, as CaCOa
Capacity of the medium corresponding to a and b
... 7.0-8.5
... a mg/1 - b „ ... c „ f fluorides per litre
B Typical basis for calculation A pressure type plant with 1.41 M3 (50 cu. ft) of Defluoron-2 capable of passing 6.8 M3 /hr. (1500 gph)
I Capital cost Plant, piping, valves and regene- Rs. 16,000 rating tanks with mixing devices Cost of 1.41 M3 of medium at the . ... Rs. 2,550 rate of Rs. 1.81 per litre (Rs. 51 per cu ft) Rs. 18,550
II Depreciation Plant at 20 percent per annum ... Rs. 3,200 Medium at 33.3 percent per annum ... Rs. 850 Rs, 4,050
III Capital cost of the plant based on jive years life expectancy Cost = Plant + (medium x 1.67)
= Rs. 16,000 + Rs. 2,550 x 1.67 = Rs. 20,250
C Sample calculation for a mg/1 fluorides and b mg/1 alkalnity
Capacity of the medium = c mg F per litre of material.
Total fluoride removal capacity of the plant between two successive rortonoratinnc ' = 1410 O ma . . i :' ' '•W'. \W.'1
- ~ o - — o - - • ' : ? : : 3 ? ' .
Quantity of water treatable per regeneration = 1.41 (c/a) M*
Length of run between regeneration
1.41 (c/a) = 0.2 (c/a) hours
6.8 Time required per regeneration = 1.5 hours.
Number of actual regenerations/day 24 H
(0.2 c + 1.5 a)
18

Quantity of water treatable for 24 hours working, allowing 1.5 hours per regeneration.
24 a 1.41 c 33.8 c Q = x = M3
(0.2 c +1.5 a) a (0.2 c + 1.5 a)
Alum requirement per regeneration = 56 kg
56 x 24 a 1344 a Alum requirement per day = = kg
(0.2 c+1.5 a) (0.2 c+1.5 a)
Cost of alum @ Re. 0.35 per kg.
0.35 x 1344 a = Rupees (1)
(0.2 c + 1.5 a) Depreciation per day = Rs. 4050 / 365 = Rs. 11.10 (2)
Pumping cost of Q cubic metres against a total head of 18.28 M (60 ft) to the over-head reservoir through the plant (including friction losses and @ Re. 0.10 per unit of power)
1000 x Q x 18.28 x 10 0.168 a = = (3)
102 x 60 x 60 x 100 (0.2c+ 1.5 a)
Operational charges (one operator) = Rs. 8.00 per day (4)
Cost of treatment per day = K = Charges due to (l) + (2) +(3) + (4)
470.4 a 0.167 c = + 11.10 + + 8.00 (0.2c + 1.5a) (0.2 c+1.5 a)
469 a + 0.167 c = 19.10 +
(0.2 c+1.5 a)
(497.65 a+ 3.987 c)
(0.2 c+1.5 a)
Cost of treatment per Ms rupees = K/Q
497.65 a + 3.987 c
33.6 c
20,250 Capital cost per M3 rupees =
Q
19

ANNEXURE—B (
ESTIMATION OF FLUORIDE* (Alizarin Visual Method)
A) Chemicals:
1) Standard Fluoride Solution (1.0 ml = 0.01 mg F~)
Dissolve 0.2210 gms of anhydrous (previously dried in hot air oven at 104°C for an hour) Sodium fluoride (NaF) in distilled water and dilute to one litre. Dilute 10 ml of this to 100 ml. One ml of diluted solution will give 0.01 mg F - . <;•..<• ' ' :
1 ' 2) Zirconyl-alizarin acid solution
Dissolve 0.30 gm zirconyl chloride octahydrate (ZrOCla.8H a o ) m • • ; (50 ml) distilled water taken in one litre glass stoppered volumetric
flask. Dissolve 0.07 gm of 3-alizarin sulfonic acid sodium salt (also called alizarin Red-S) in (50 ml) distilled water. Slowly pour this in zirconyl solution. The solution becomes clear after a few minutes.
Mixed acid:— Dilute (101 ml) cone. HC1 to. approximately 400 ml. Add 33.3 ml cone. H2 S 0 4 to (400 ml) distilled water. Mix the two acids after cooiing.
Mixed reagent:- To the clear zirconyl-alizarin reagent in the one litre flask, add the mixed acid solution. Add distilled water upto the mark and mix. .
B) Glassware: (i) 50 ml Nessler-tub.es•• — one dozen •'• (ii) 5 „ Graduated pipettes — two numbers.
C) Procedure:— In five Nessler tubes prepare fluoride standards by taking 2, 4, 6, 8 and 10 ml of standard ^fluoride solution. This corresponds to 0.4, 0.8, 1.2, 1.6 and 2.0 mg.Fo/l i tre. Make the volume to 50 mar̂ k int all the tubes. In the sixth tube take 50 ml raw water sample.
Add 2.5 ml of the alizarin reagent respectively- in all tubes. Mix well and allow the colour to develop for "one hour. Compare the colour of tube containing raw water with standard ones.
Fluoride (as mg/1 F " ) = 0.4 x Number of tubes with comparable colour
Note:—In case of excess fluoride in raw water, dilute the sample.
* Based on the Standard Methods for the Examination of Water and Waste Water, 13th Ed. APHA, AWWA, and WPCF, 1971.
20

w S ^ ; * '
.̂ *$#&*' W*«» '
A typical defluoridation plant

Printed at the Naspur Times Press, Nsspur