mountain lion - idaho lion statewide...few significant changes to mountain lion harvest seasons were...
TRANSCRIPT
IDAHO DEPARTMENT OF FISH AND GAME
Virgil Moore, Director
Surveys and Inventories
Statewide Report Harvest Season 2017
MOUNTAIN LION
July 1, 2017 to June 30, 2018 Prepared by: Wayne Wakkinen ..................................................................................... Panhandle Region Clay Hickey ............................................................................................ Clearwater Region Rick Ward ................................................................................................ Southwest Region Mike McDonald .................................................................................. Magic Valley Region Zach Lockyer ............................................................................................ Southeast Region Curtis Hendricks .................................................................................. Upper Snake Region Greg Painter .................................................................................................. Salmon Region Erin Roche ........................................................................................................ Biometrician Summer Crea ............................................................................................. Data Coordinator David Smith ............................................................................................... Grants Specialist Debbie Hribik.............................................................................................. Office Specialist
Compiled and edited by: Jim Hayden, Wildlife Staff Biologist
2018 Boise, Idaho

ii
Idaho Department of Fish and Game (IDFG) adheres to all applicable state and federal laws and regulations related to discrimination on the basis of race, color, national origin, age, gender, disability or veteran’s status. If you feel you have been discriminated against in any program, activity, or facility of IDFG, or if you desire further information, please write to: Idaho Department of Fish and Game, PO Box 25, Boise, ID 83707 or US Fish and Wildlife Service, Division of Wildlife and Sport Fish Restoration Program, 5275 Leesburg Pike, MS: WSFR, Falls Church, VA 22041-3803, Telephone: (703) 358–2156. Findings in this report are preliminary in nature and not for publication without permission of the Director of the Idaho Department of Fish and Game. Please note that IDFG databases containing this information are dynamic. Records are added, deleted, and/or edited on a frequent basis. This information was current as of date of this report. Raw data do not have the benefit of interpretation or synthesis by IDFG. IDFG requests that you direct any requests for this information to us rather than forwarding this information to third parties. This publication will be made available in alternative formats upon request. Please contact IDFG for assistance.

TABLE OF CONTENTS STATEWIDE .................................................................................................................................. 1
PANHANDLE REGION ................................................................................................................ 6
Panhandle DAU (GMUs 1, 2, 3, 4, 4A, 5, 6, 7, 9) ...................................................................... 6
Historical Background ............................................................................................................. 6
Management Objectives .......................................................................................................... 6
Capture, Radio-mark, and/or Telemetry .................................................................................. 6
Population Surveys and Monitoring ........................................................................................ 6
Hunting and Harvest Characteristics ....................................................................................... 7
Predation Issues ....................................................................................................................... 7
Depredation Issues ................................................................................................................... 8
Management Discussion .......................................................................................................... 8
CLEARWATER REGION ........................................................................................................... 10
Latah DAU (GMUs 8, 11A) ..................................................................................................... 10
Historical Background ........................................................................................................... 10
Management Objectives ........................................................................................................ 10
Biological Objectives ............................................................................................................ 10
Capture, Radio-mark, and/or Telemetry ................................................................................ 10
Population Surveys and Monitoring ...................................................................................... 10
Hunting and Harvest Characteristics ..................................................................................... 10
Predation Issues ..................................................................................................................... 11
Depredation Issues ................................................................................................................. 11
Management Discussion ........................................................................................................ 11
Palouse-Dworshak DAU (GMUs 8A, 10A) ............................................................................. 13
Historical Background ........................................................................................................... 13
Management Objectives ........................................................................................................ 13
Biological Objectives ............................................................................................................ 13
Capture, Radio-mark, and/or Telemetry ................................................................................ 13
Population Surveys and Monitoring ...................................................................................... 13
Hunting and Harvest Characteristics ..................................................................................... 13
Depredation Issues ................................................................................................................. 14
ii
Management Discussion ........................................................................................................ 14
Lolo DAU (GMUs 10, 12) ........................................................................................................ 16
Historical Background ........................................................................................................... 16
Management Objectives ........................................................................................................ 16
Biological Objectives ............................................................................................................ 16
Capture, Radio-mark, and/or Telemetry ................................................................................ 16
Population Surveys and Monitoring ...................................................................................... 16
Hunting and Harvest Characteristics ..................................................................................... 16
Depredation Issues ................................................................................................................. 17
Management Discussion ........................................................................................................ 17
Hells Canyon DAU (GMUs 11, 13, 18) ................................................................................... 19
Historical Background ........................................................................................................... 19
Management Objectives ........................................................................................................ 19
Biological Objectives ............................................................................................................ 19
Capture, Radio-mark, and/or Telemetry ................................................................................ 19
Population Surveys and Monitoring ...................................................................................... 19
Hunting and Harvest Characteristics ..................................................................................... 19
Predation Issues ..................................................................................................................... 20
Depredation Issues ................................................................................................................. 20
Management Discussion ........................................................................................................ 20
Elk City DAU (GMUs 14, 15, 16) ............................................................................................ 22
Historical Background ........................................................................................................... 22
Management Objectives ........................................................................................................ 22
Biological Objectives ............................................................................................................ 22
Capture, Radio-mark, and/or Telemetry ................................................................................ 22
Population Surveys and Monitoring ...................................................................................... 22
Hunting and Harvest Characteristics ..................................................................................... 22
Predation Issues ..................................................................................................................... 23
Depredation Issues ................................................................................................................. 23
Management Discussion ........................................................................................................ 23

iii
Selway DAU (GMUs 16A, 17, 19, 20) ..................................................................................... 25
Historical Background ........................................................................................................... 25
Management Objectives ........................................................................................................ 25
Biological Objectives ............................................................................................................ 25
Capture, Radio-mark, and/or Telemetry ................................................................................ 25
Population Surveys and Monitoring ...................................................................................... 25
Hunting and Harvest Characteristics ..................................................................................... 25
Depredation Issues ................................................................................................................. 26
Management Discussion ........................................................................................................ 26
SOUTHWEST REGION .............................................................................................................. 28
Warren DAU (GMUs 19A, 20A, 25, 26, 27)............................................................................ 28
Historical Information ........................................................................................................... 28
Management Objectives ........................................................................................................ 28
Capture, Radio-mark, and/or Telemetry ................................................................................ 28
Population Surveys and Monitoring ...................................................................................... 28
Hunting and Harvest Characteristics ..................................................................................... 28
Predation Issues ..................................................................................................................... 29
Management Discussion ........................................................................................................ 29
McCall DAU (GMUs 22, 23 24, 31, 32A) ............................................................................... 31
Historical Background ........................................................................................................... 31
Management Objectives ........................................................................................................ 31
Biological Objectives ............................................................................................................ 31
Capture, Radio-mark, and/or Telemetry ................................................................................ 31
Population Surveys and Monitoring ...................................................................................... 31
Hunting and Harvest Characteristics ..................................................................................... 31
Management Discussion ........................................................................................................ 32
Boise-Stanley DAU (GMUs 32, 33, 34, 35, 36, 39) ................................................................. 34
Historical Background ........................................................................................................... 34
Management Objectives ........................................................................................................ 34
Capture, Radio-mark, and/or Telemetry ................................................................................ 34

iv
Population Surveys and Monitoring ...................................................................................... 34
Hunting and Harvest Characteristics ..................................................................................... 34
Predation Issues ..................................................................................................................... 35
Depredation Issues ................................................................................................................. 35
Management Discussion ........................................................................................................ 35
Owyhee DAU (GMUs 40, 41, 42, 46, 47) ................................................................................ 37
Historical Background ........................................................................................................... 37
Management Objectives ........................................................................................................ 37
Capture, Radio-mark, and/or Telemetry ................................................................................ 37
Population Surveys and Monitoring ...................................................................................... 37
Hunting and Harvest Characteristics ..................................................................................... 37
Predation Issues ..................................................................................................................... 38
Depredation Issues ................................................................................................................. 38
Management Discussion ........................................................................................................ 38
MAGIC VALLEY REGION .................................................................................................... 40
Sun Valley DAU (GMUs 36A, 43, 44, 48, 49, 50)................................................................... 40
Historical Background ........................................................................................................... 40
Management Objectives ........................................................................................................ 40
Capture, Radio-mark, and/or Telemetry ................................................................................ 40
Population Surveys and Monitoring ...................................................................................... 40
Hunting and Harvest Characteristics ..................................................................................... 40
Predation Issues ..................................................................................................................... 40
Depredation Issues ................................................................................................................. 40
Management Discussion ........................................................................................................ 41
Oakley DAU (GMUs 54, 55, 56, 57) ........................................................................................ 43
Historical Background ........................................................................................................... 43
Management Objectives ........................................................................................................ 43
Capture, Radio-mark, and/or Telemetry ................................................................................ 43
Population Surveys and Monitoring ...................................................................................... 43
Hunting and Harvest Characteristics ..................................................................................... 43

v
Predation Issues ..................................................................................................................... 44
Depredation Issues ................................................................................................................. 44
Management Discussion ........................................................................................................ 44
SOUTHEAST REGION ............................................................................................................... 46
Pocatello DAU (GMUs 69, 70, 71, 72, 73, 73A, 74) ................................................................ 46
Historical Background ........................................................................................................... 46
Management Objectives ........................................................................................................ 46
Biological Objectives ............................................................................................................ 47
Capture, Radio-mark, and/or Telemetry ................................................................................ 47
Population Surveys and Monitoring ...................................................................................... 47
Hunting and Harvest Characteristics ..................................................................................... 47
Predation Issues ..................................................................................................................... 47
Depredation Issues ................................................................................................................. 47
Management Discussion ........................................................................................................ 48
UPPER SNAKE REGION ............................................................................................................ 50
Snake River Plain DAU (GMUs 38, 45, 52, 52A, 53, 60, 60A, 61, 62, 62A, 63, 63A, 68, 68A)................................................................................................................................................... 50
Historical Background ........................................................................................................... 50
Management Objectives ........................................................................................................ 50
Capture, Radio-mark, and/or Telemetry ................................................................................ 50
Population Surveys and Monitoring ...................................................................................... 50
Hunting and Harvest Characteristics ..................................................................................... 50
Predation Issues ..................................................................................................................... 50
Depredation Issues ................................................................................................................. 50
Management Discussion ........................................................................................................ 51
Bear Lake-Palisades DAU (GMUs 64, 65, 66, 66A, 67, 75, 76, 77, 78) .................................. 53
Historical Background ........................................................................................................... 53
Management Objectives ........................................................................................................ 53
Biological Objectives ............................................................................................................ 53
Capture, Radio-mark, and/or Telemetry ................................................................................ 53
Population Surveys and Monitoring ...................................................................................... 53

vi
Hunting and Harvest Characteristics ..................................................................................... 53
Predation Issues ..................................................................................................................... 54
Depredation Issues ................................................................................................................. 54
Management Discussion ........................................................................................................ 54
Literature Cited ...................................................................................................................... 54
SALMON REGION...................................................................................................................... 56
Salmon DAU (GMUs 21, 21A, 28, 36B).................................................................................. 56
Historical Background ........................................................................................................... 56
Management Objectives ........................................................................................................ 56
Capture, Radio-mark, and/or Telemetry ................................................................................ 56
Population Surveys and Monitoring ...................................................................................... 56
Hunting and Harvest Characteristics ..................................................................................... 56
Predation Issues ..................................................................................................................... 57
Depredation Issues ................................................................................................................. 57
Management Discussion ........................................................................................................ 57
Borah DAU (GMUs 29, 30, 30A, 37, 37A, 51, 58, 59, 59A) ................................................... 59
Historical Background ........................................................................................................... 59
Management Objectives ........................................................................................................ 59
Capture, Radio-mark, and/or Telemetry ................................................................................ 59
Population Surveys and Monitoring ...................................................................................... 59
Hunting and Harvest Characteristics ..................................................................................... 59
Predation Issues ..................................................................................................................... 60
Depredation Issues ................................................................................................................. 60
Management Discussion ........................................................................................................ 60
LIST OF FIGURES
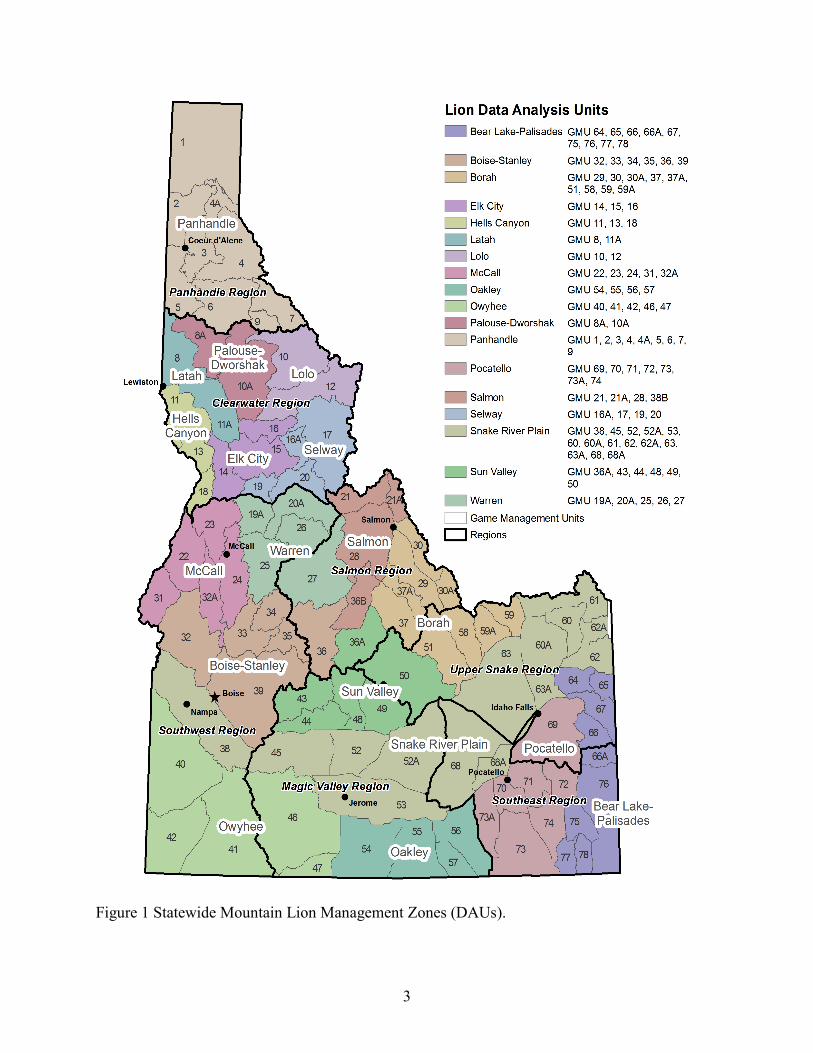
Figure 1 Statewide Mountain Lion Management Zones (DAUs). 3
Figure 2. Statewide Mountain Lion Status and Objectives 4
Figure 4 Panhandle DAU status and objectives 9

vii
Figure 5 Latah DAU status and objectives 12
Figure 6. Palouse-Dworshak DAU status and objectives 15
Figure 7. Lolo DAU status and objectives 18
Figure 8 Hells Canyon DAU status and objectives 21
Figure 9. Elk City DAU status and objectives 24
Figure 10. Selway DAU status and objectives 27
Figure 11. Warren DAU status and objectives 30
Figure 12 McCall DAU status and objectives 33
Figure 13 Boise-Stanley DAU status and objectives 36
Figure 14. Owyhee DAU status and objectives 39
Figure 15. Sun Valley DAU status and objectives 42
Figure 16 Oakley DAU status and objectives 45
Figure 17. Pocatello DAU status and objectives 49
Figure 18 Snake River Plain DAU status and objectives 52
Figure 19 Bear Lake Palisades DAU status and objectives 55
Figure 20 Salmon DAU status and objectives 58
Figure 21 Borah DAU status and objectives 61

1 Mountain Lion 2017 Season
STATEWIDE REPORT SURVEYS AND INVENTORY
JOB TITLE: Mountain Lion Surveys and Inventories STUDY NAME: Big Game Population Status, Trends, Use, and Associated Habitat Studies PERIOD COVERED: July 1, 2017 to June 30, 2018
STATEWIDE For analysis, Idaho’s mountain lion management utilizes 18 Data Analysis Units (DAU) comprised of multiple game management units (GMUs; Figure 1). During Calendar Year 2017 (CY2017), 25,918 mountain lion tags were sold, showing a slight increase of 0.7% annually over the prior 10 years. However, additional mountain lion tags were included in each of 21,617 Sportsman’s Packages sold in Idaho during 2017. It is unknown how many of these individuals hunted mountain lion. A total of 3,428 houndhunter permits were sold in 2017, with a 1.4% annual average increase over the prior 10 years. Few significant changes to mountain lion harvest seasons were made during the report period. A second mountain lion in the bag was authorized for GMUs 4, 4A, 6, 7, 9, 10, 12, a portion of 16, 16A, 17, 19, 20, 20A, a portion of 21, 26, 27, 27, and a portion of 28. Seventy statewide nonresident houndhunter permits were authorized for 2017. Not counted in this limit were nonresidents who hunted solely in GMUs 10, 12, 20A, 26, and 27. An additional 40 nonresident houndhunter permits were authorized for GMUs 16A, a portion of 17, 19, and 20. Mountain lion harvest data are summarized based on the fiscal year (FY; 1 July 1–30 June) because this better reflects the contiguous harvest season (August 30 – March 31). This report summarizes harvest data for FY2017 (July 1, 2017 – June 30, 2018). Hunters are required to report mountain lions harvested within 10 days of kill. Mountain lion harvest has increased an average of 4.2% annually during the past 10 years, with the FY 2017 harvest of 614 lions the second highest during that period. The dominant method for hunting mountain lions is with the use of hounds (74% of the annual harvest, 2017). Harvest objectives are to maintain a mountain lion population capable of sustaining a harvest of at least 331 lions annually (the 1990–1992 average). This objective has been attained annually since 1991, with the most recent 3-year average of 616 lions 86% higher than the minimum. Typically ranging between 40% and 50% in Idaho, the percentage of females in the harvest averaged 40% during FY2015-2017 and was the lowest average of the past 10 years (Figure 2). Typically ranging between 50% and 70%, the percentage of 3 year old and older lions within the male harvest averaged 55% for FY2014–2016, the most recent age data on record.

2
Idaho’s mountain lion population has sustained a heavy harvest well above management plan levels for the past 26 years. Current information includes a recent increase in harvest levels, a recent decrease in the percentage of females in the harvest, and a slightly younger male age structure. This combination of factors is consistent with a mountain lion population that has undergone a recent increase or has undergone substantial recent increase in immigration.
3
Figure 1 Statewide Mountain Lion Management Zones (DAUs).

4
Goal83,620 616
0.755%
* Within male harvest 2014-2016
Harvest Statistics 2008 2009 2010 2011 2012 2013 2014 2015 2016 2017Total 423 431 484 519 530 565 473 573 662 614
0-2 years 65 69 106 122 127 92 121 139 148 03-7 years 139 144 148 131 128 175 117 165 204 08+ years 6 10 11 10 7 14 3 4 8 8Unknown 25 19 15 30 19 20 20 31 40 358Subtotal 235 242 280 293 281 301 261 339 400 3660-2 years 68 78 70 112 113 117 119 111 116 03-7 years 79 72 90 80 86 97 71 88 115 08+years 20 23 19 11 20 25 4 10 13 0
Unknown 21 16 25 23 30 25 18 25 18 248Subtotal 188 189 204 226 249 264 212 234 262 248
Note: Lions in harvest year 2017 have yet to be aged
Note: Harvest does not include unknown aged lions. Lions in harvest year 2017 have yet to be aged.
Males
Females
Harvest per 100 mi2
Males: Percent 3+ yrs *
Statewide
2017 Season (Fall 2017-Spring 2018)Square Miles: 3-Year Averages
Annual Harvest
0
100
200
300
400
500
600
700
2008 2010 2012 2014 2016
Statewide Harvest
34
36
38
40
42
44
46
48
2008 2010 2012 2014 2016
% Female in Harvest
0%
20%
40%
60%
80%
100%
08-10 09-11 10-12 11-13 12-14 13-15 14-16
male <3
male 3-7
male 8+
female <3
female 3-7
female 8+
Three-year Average Mountain Lion Harvest
Figure 2. Statewide Mountain Lion Status and Objectives

5
2008 2009 2010 2011 2012 2013 2014 2015 2016 201722,406 21,662 21,574 21,675 21,589 22,546 22,966 24,081 24,827 25,241
695 526 463 444 528 546 551 558 633 677Total lion tags 23,101 22,188 22,037 22,119 22,117 23,092 23,517 24,639 25,460 25,918
2,844 2,894 2,886 2,863 2,858 3,039 3,145 3,340 3,436 3,438121 108 98 100 97 104 96 97 114 119
2,965 3,002 2,984 2,963 2,955 3,143 3,241 3,437 3,550 3,557Nonresident houndhunter permitsTotal houndhunter permits
TypeResident lion tagsNonresident lion tags
Resident houndhunter permits
0
10,000
20,000
30,000
Resident lion tags Nonresident lion tags
0
1,000
2,000
3,000
4,000
Nonresident houndhunter permitsResident houndhunter permits
Figure 3. Mountain Lion Tag and Permit Status

6
PANHANDLE REGION Panhandle DAU (GMUs 1, 2, 3, 4, 4A, 5, 6, 7, 9)
Historical Background The management of mountain lions has changed dramatically during the past 30 years. Through 1971, it was classified as a predator with a continuous open season and no bag limit, and in many years, a bounty was paid for dead mountain lions. With reclassification as a game animal in 1972, more conservative management was initiated to increase the mountain lion population. The 1972 season for Panhandle DAU was open only September–December, with 1 mountain lion allowed per year. During the late 1970s and early 1980s, seasons remained relatively short, with some GMUs virtually closed. GMU 4, for example, was open for only 7 days in 1970, from 26 November through 2 December. Seasons closed generally at the end of December or in mid-January during most of the 1980s and early 1990s. Beginning in 1993, seasons were extended several times so that lion harvest in Panhandle DAU closed 31 March. Prior to the 1995 season, this DAU was comprised of 3 separate areas made up of GMUs: 1-1 (GMUs 1, 2, 3, and 5), 1-2 (GMUs 4 and 4A), and 1-3 (GMUs 6, 7, and 9). Concurrent with the establishment of a single Panhandle DAU, seasons in some GMUs were extended to establish a single, DAU-wide season framework and to provide a larger annual sample size, although over a broader area. Management Objectives The 2002–2010 Mountain Lion Species Management Plan states that initial harvest goals will be based on maintaining harvest levels on a 3-year running average that are at or above the 3-year average harvest for the 1990–1992 big game seasons (Figure 4) for each DAU, except in areas where other factors or circumstances justify a higher or lower goal (e.g., harvest seasons are deliberately liberalized to reduce the lion population or where the deliberate reduction of a lion population or maintenance at a lower level makes it untenable to continue to reach the harvest levels attained between 1990–1992). The objective for the Panhandle DAU is to maintain a harvest of at least 61 animals. Specific objectives regarding sex and age composition of the harvest will be developed in the future. The Department will continue to gather harvest data via the mandatory check. Regulations will allow the use of training dogs and continue to protect young mountain lions and females accompanied by young-of-the-year. Capture, Radio-mark, and/or Telemetry No mountain lions were captured and radio-marked during 2017 in the Panhandle DAU. Population Surveys and Monitoring Currently mountain lion populations are monitored through hunter harvest information and mandatory big game mortality reports. There are no formal mountain lion population surveys conducted in the Panhandle DAU. Mountain lions have been monitored incidentally on game
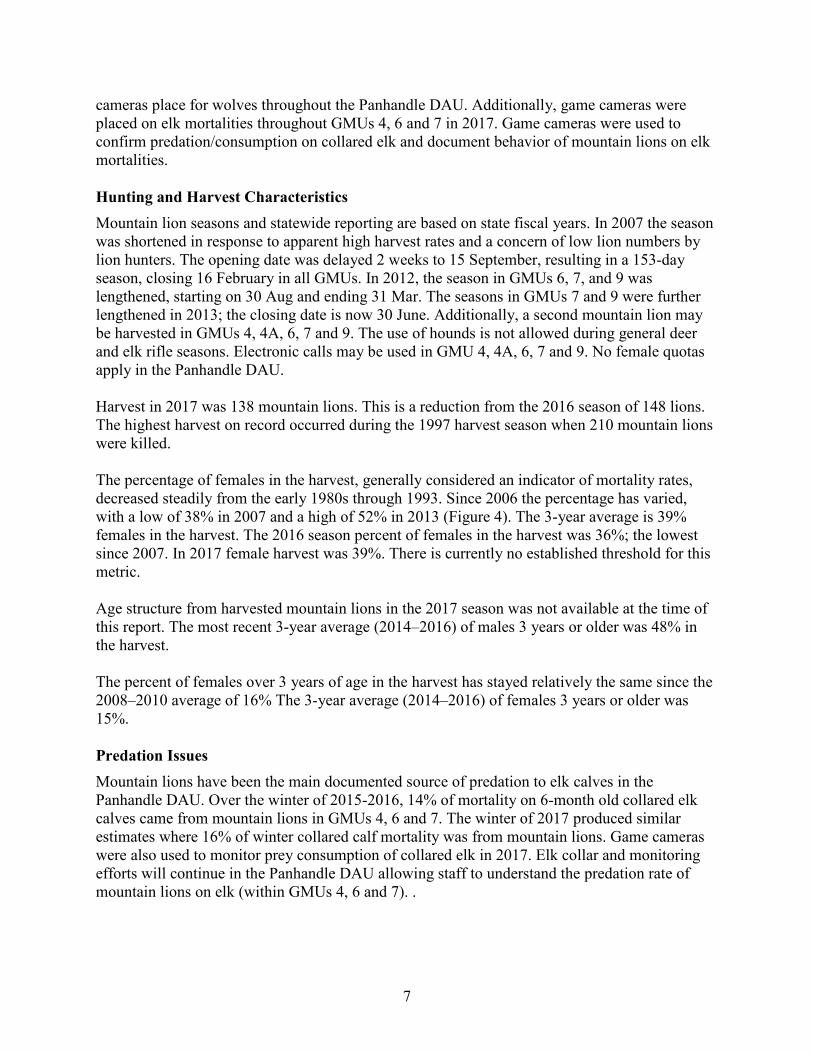
7
cameras place for wolves throughout the Panhandle DAU. Additionally, game cameras were placed on elk mortalities throughout GMUs 4, 6 and 7 in 2017. Game cameras were used to confirm predation/consumption on collared elk and document behavior of mountain lions on elk mortalities. Hunting and Harvest Characteristics Mountain lion seasons and statewide reporting are based on state fiscal years. In 2007 the season was shortened in response to apparent high harvest rates and a concern of low lion numbers by lion hunters. The opening date was delayed 2 weeks to 15 September, resulting in a 153-day season, closing 16 February in all GMUs. In 2012, the season in GMUs 6, 7, and 9 was lengthened, starting on 30 Aug and ending 31 Mar. The seasons in GMUs 7 and 9 were further lengthened in 2013; the closing date is now 30 June. Additionally, a second mountain lion may be harvested in GMUs 4, 4A, 6, 7 and 9. The use of hounds is not allowed during general deer and elk rifle seasons. Electronic calls may be used in GMU 4, 4A, 6, 7 and 9. No female quotas apply in the Panhandle DAU. Harvest in 2017 was 138 mountain lions. This is a reduction from the 2016 season of 148 lions. The highest harvest on record occurred during the 1997 harvest season when 210 mountain lions were killed. The percentage of females in the harvest, generally considered an indicator of mortality rates, decreased steadily from the early 1980s through 1993. Since 2006 the percentage has varied, with a low of 38% in 2007 and a high of 52% in 2013 (Figure 4). The 3-year average is 39% females in the harvest. The 2016 season percent of females in the harvest was 36%; the lowest since 2007. In 2017 female harvest was 39%. There is currently no established threshold for this metric. Age structure from harvested mountain lions in the 2017 season was not available at the time of this report. The most recent 3-year average (2014–2016) of males 3 years or older was 48% in the harvest. The percent of females over 3 years of age in the harvest has stayed relatively the same since the 2008–2010 average of 16% The 3-year average (2014–2016) of females 3 years or older was 15%. Predation Issues Mountain lions have been the main documented source of predation to elk calves in the Panhandle DAU. Over the winter of 2015-2016, 14% of mortality on 6-month old collared elk calves came from mountain lions in GMUs 4, 6 and 7. The winter of 2017 produced similar estimates where 16% of winter collared calf mortality was from mountain lions. Game cameras were also used to monitor prey consumption of collared elk in 2017. Elk collar and monitoring efforts will continue in the Panhandle DAU allowing staff to understand the predation rate of mountain lions on elk (within GMUs 4, 6 and 7). .

8
Depredation Issues There were no mountain lion depredation issues within the Panhandle DAU in 2017. However, sightings of mountain lions have increased in urban areas throughout the Panhandle DAU and developing a protocol to address depredation issues should be a priority. Management Discussion The current mountain lion plan indicates populations will be managed to maintain a 3-year average harvest at or above the 1990–1992 average harvest except in areas where other factors or circumstances justify a different goal. The 3-year average for this DAU from 1990–1992 is 61 mountain lions. The latest 3-year average of 146 harvested lions is well above the minimum criteria and has been at or near this level for the past 8 years. The percent of adult males in the harvest has remained relatively stable over the past 5 years and the percent adult females have decreased during this same time period. The Department will have more information to work with as new mountain lion population estimation techniques become available.

9
Goal7,779 146 61
1.9 TBD48% TBD
* Within male harvest 2014-2016
Harvest Statistics 2008 2009 2010 2011 2012 2013 2014 2015 2016 2017Total 74 80 109 125 140 157 135 151 148 138
0-2 years 10 9 27 24 38 35 37 39 43 03-7 years 24 36 29 32 33 39 24 44 41 08+ years 2 5 3 1 1 0 1 1 1 0Unknown 6 0 4 4 4 2 6 6 9 84Subtotal 42 50 63 61 76 76 68 90 94 840-2 years 14 12 19 32 25 39 46 28 27 03-7 years 10 9 19 18 26 30 15 22 18 08+years 3 5 0 5 4 5 0 1 3 0
Unknown 5 4 8 9 9 7 6 10 6 54Subtotal 32 30 46 64 64 81 67 61 54 54
Note: Lions in harvest year 2017 have yet to be aged
Panhandle DAU
2017 Season (Fall 2017-Spring 2018)Square Miles: 3-Year Averages
(GMUs 1, 2, 3, 4, 4A, 5, 6, 7, 9)
Harvest per 100 mi2
Males: Percent 3+ yrs*
Annual Harvest
Males
Females
0
20
40
60
80
100
120
140
160
180
2008 2010 2012 2014 2016
Harvest (min 3-yr average=61)
0%
10%
20%
30%
40%
50%
60%
70%
80%
90%
100%
08-10 09-11 10-12 11-13 12-14 13-15 14-16
Three-year Average Mountain Lion Harvest
male <3
male 3-7
male 8+
female <3
female 3-7
female 8+
0
10
20
30
40
50
60
2008 2010 2012 2014 2016
% Female in Harvest
Figure 4 Panhandle DAU status and objectives

10
CLEARWATER REGION Latah DAU (GMUs 8, 11A)
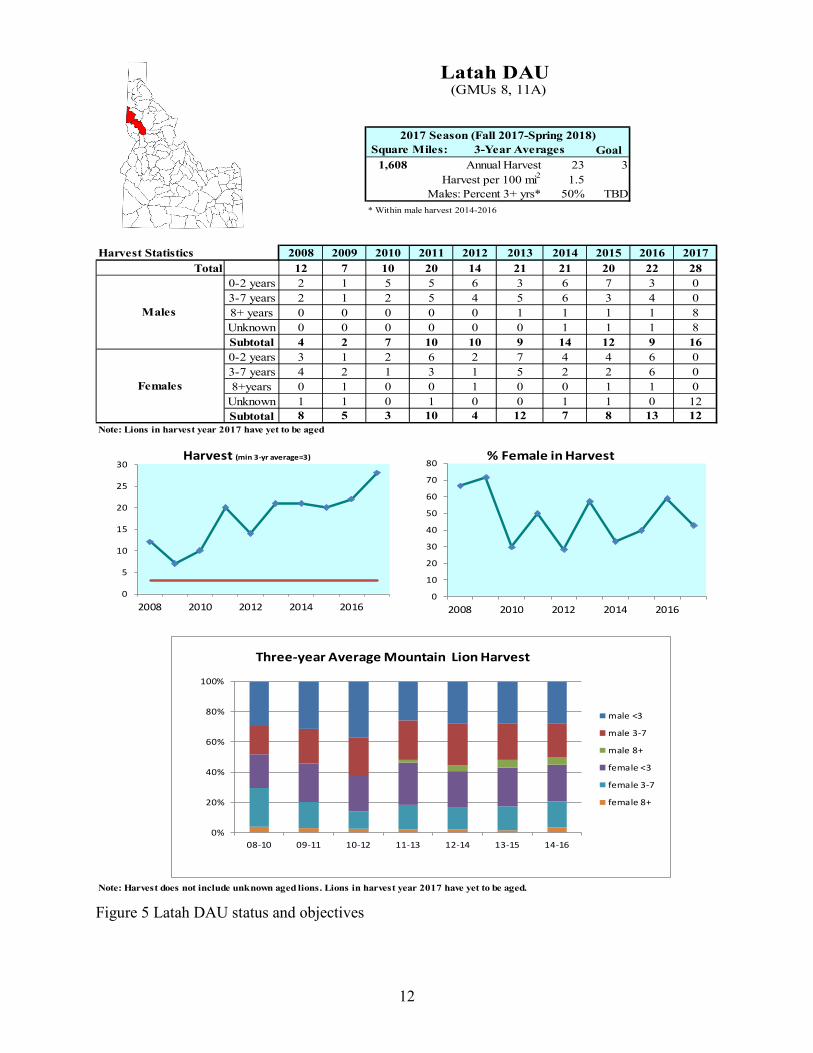
Historical Background Latah DAU GMUs are generally accessible to hunters during winter but support low numbers of mountain lions. Healthy white-tailed deer and elk populations, as well as some mule deer, provide a prey base. Habitats in this area are dominated by privately owned farmlands in upland prairies that are interspersed with coniferous forests leading to the Clearwater River and its tributaries. Canyon breaks leading to the Clearwater River provide quality habitat for many species of wildlife. Management Objectives The 2002–2010 Mountain Lion Management Plan directs the Department to maintain lions at or near their current distribution throughout the state. Harvest goals are based on trends from past harvest data, mountain lion population dynamics, harvest vulnerability, and the desired level and composition of harvest over a 3-year average. Initial harvest goals for a DAU were designed to maintain harvest levels on a 3-year running average that are at or above the 3-year average harvest for the 1990–1992 mountain lion seasons. Biological Objectives Management in this DAU is focused on maximizing hunter opportunity while maintaining a healthy mountain lion population. If the current mountain lion harvest objectives are met, the population with be held below carrying capacity and should exhibit a younger age structure than more lightly harvested DAUs. Capture, Radio-mark, and/or Telemetry While nuisance mountain lions are occasionally removed or relocated, mountain lions are not a focus of department-lead capture or collaring efforts in this DAU. We do not have any current collar or telemetry data for mountain lions in the Latah DAU. Population Surveys and Monitoring There is no mountain lion population monitoring efforts currently underway in the Latah DAU. Hunting and Harvest Characteristics Mountain lion seasons and statewide reporting are based on state fiscal years. No change occurred to season structure for mountain lions in the Latah DAU for the 2016-2017 hunting seasons. There is no dog-training season for mountain lions and no female harvest quotas in this DAU. Mountain lion harvest in Latah DAU GMUs has historically been light, although it has increased in recent years, averaging 20 lions per season from 2014–2016. This level exceeds the 1990–1992 minimum harvest objective of 3 per year. A total of 28 lions were harvested in 2017. Harvest with hounds and incidental harvest each made up 45% of the harvest in the 2017 season.

11
The percentage of females in the harvest, generally considered an indicator of mortality rates, decreased steadily from the early 1980s through 1993. Since 2006, the percentage has varied between a low of 28% in 2012 and a high of 75% in 2007. The current 3-year average is 47% females in the harvest. The 2017 harvest was 43% females. There is currently no established threshold for this metric. Age structure of harvested mountain lions from the 2017 season was not available at the time of this report. The most recent 3-year average (2014–2016) of males 3 years or older was 50% of all males harvested, approximately the same as the 2011–2013 average. The 3-year average (2014–2016) of percent females over 3 years of age in the harvest was 29%. Predation Issues The impact of mountain lion predation on ungulate populations likely varies with the species of prey, their abundance and recent population trends, lion numbers, the types and abundance of other prey, and the type and abundance of other predators. These vary with habitat type and land use, climate and weather, and hunting pressure. Recent research on cause-specific mortality for elk calves collared in portions of the Clearwater Region from 2015–2017 indicated that lions were the primary cause of death (37% of mortalities) for calves between January 1 and May 31, followed by malnutrition (26%), wolf predation (16%), and unknown predation (16%). Depredation Issues There were no mountain lion depredation complaints in the Latah DAU in 2017. In general, mountain lion depredations are usually minor in the Clearwater Region. In 2017 there were 8 total kill permits issued, which is a slight decrease from the previous year, when 10 kill permits were issued and 5 lions were killed. Taking a long-term view of the Clearwater Region, an increasing trend in lion depredations might be due to a growing urban interface with lion-occupied range and an increase in white-tailed deer populations. Management Discussion Due to the increase in sightings and reports of encounters during the mid-1990s in this DAU, hunting seasons were liberalized. Harvest continued to increase and, during the 1997 and 1998 seasons, reached an all-time high for this DAU. It is likely that, due to the dense white-tailed deer populations throughout much of this DAU, the mountain lion population expanded its range in response to the growth of this prey population. This would account for increased observations of mountain lions in this DAU during the mid-1990s. Despite the longer season, harvest has remained below the 1997 and 1998 record harvest.
12
Goal1,608 23 3
1.550% TBD
* Within male harvest 2014-2016
Harvest Statistics 2008 2009 2010 2011 2012 2013 2014 2015 2016 2017Total 12 7 10 20 14 21 21 20 22 28
0-2 years 2 1 5 5 6 3 6 7 3 03-7 years 2 1 2 5 4 5 6 3 4 08+ years 0 0 0 0 0 1 1 1 1 8Unknown 0 0 0 0 0 0 1 1 1 8Subtotal 4 2 7 10 10 9 14 12 9 160-2 years 3 1 2 6 2 7 4 4 6 03-7 years 4 2 1 3 1 5 2 2 6 08+years 0 1 0 0 1 0 0 1 1 0
Unknown 1 1 0 1 0 0 1 1 0 12Subtotal 8 5 3 10 4 12 7 8 13 12
Note: Lions in harvest year 2017 have yet to be aged
Note: Harvest does not include unknown aged lions. Lions in harvest year 2017 have yet to be aged.
Males
Females
(GMUs 8, 11A)Latah DAU
Annual Harvest
2017 Season (Fall 2017-Spring 2018)Square Miles: 3-Year Averages
Harvest per 100 mi2
Males: Percent 3+ yrs*
0
5
10
15
20
25
30
2008 2010 2012 2014 2016
Harvest (min 3-yr average=3)
0
10
20
30
40
50
60
70
80
2008 2010 2012 2014 2016
% Female in Harvest
0%
20%
40%
60%
80%
100%
08-10 09-11 10-12 11-13 12-14 13-15 14-16
male <3
male 3-7
male 8+
female <3
female 3-7
female 8+
Three-year Average Mountain Lion Harvest
Figure 5 Latah DAU status and objectives

13
Palouse-Dworshak DAU (GMUs 8A, 10A) Historical Background Timberlands owned by Potlatch Corporation, Idaho Department of Lands (IDL), and U.S. Forest Service (USFS) comprise 75% of the Palouse-Dworshak DAU. Timber harvest activity has created vast acreages of early successional habitat benefiting several ungulate prey species. The remaining one-fourth of the DAU is open or agricultural lands providing high-quality forage for deer and elk at certain times of the year. The area is bisected by canyons leading to the Palouse and Potlatch rivers (GMU 8A), Clearwater River, and lower North Fork of Clearwater River (GMU 10A). Both GMUs share a common border along the lower end of Dworshak Reservoir. Access is very good throughout the DAU where high open and closed road densities contribute to good opportunities for hunting mountain lions. Management Objectives The 2002–2010 Mountain Lion Management Plan directs the Department to maintain lions at or near their current distribution throughout the state. Harvest goals are based on trends from past harvest data, mountain lion population dynamics, harvest vulnerability, and the desired level and composition of harvest over a 3-year average. Initial harvest goals for the DAU were designed to maintain harvest levels on a 3-year running average that are at or above the 3-year average harvest for the 1990–1992 mountain lion seasons. Biological Objectives Management in this DAU is focused on maximizing hunter opportunity while maintaining a healthy mountain lion population. If the current mountain lion harvest objectives are met, the population with be held below carrying capacity and should exhibit a younger age structure than more lightly harvested DAUs. Capture, Radio-mark, and/or Telemetry While nuisance mountain lions are occasionally removed or relocated, mountain lions are not a focus of department-lead capture or collaring efforts in this DAU. We do not have any current collar or telemetry data for mountain lions in the Palouse-Dworshak DAU. Population Surveys and Monitoring There is no mountain lion population monitoring efforts currently underway in the Palouse-Dworshak DAU. Hunting and Harvest Characteristics No change occurred to season structure for mountain lions in the Palouse-Dworshak DAU for the 2017 hunting season. There is no dog-training season for mountain lions and no female harvest quotas in this DAU. Mountain lion harvest in the Palouse-Dworshak DAU averaged 48 lions for the 2015–2017 seasons. Fifty-four lions were harvested during the 2017 season. This is above the 1990–1992 minimum harvest objective of 21. Harvest has been highly variable, potentially due to varied

14
hunting opportunity (i.e., weather conditions) between years but has generally increased since the late 2000s. Harvest with the use of hounds accounted for 64% of the total harvest in the 2017 season. Incidental harvest made up 35% of the harvest in in 2017. The percentage of females in the harvest, generally considered an indicator of mortality rates, has varied, with a low of 34% in 2009 and a high of 61% in 2012. The 3-year average (2015–2017) was 46.2% females in the harvest. The 2017 season percent of females in the harvest was 46.3%. There is currently no established threshold for this metric. The age structure of harvested mountain lions from the 2017 season was not available at the time of this report. The most recent 3-year average (2014–2016) of males 3 years or older was 53% of the total male harvest, an increase over the 2010–2012 average of 48%. The percent of females over 3 years of age in the harvest has varied between 18% and 29% of total harvest based on a running 3-year average since 2007–2009. The most recent average (2014–2016) was 19.2%. Depredation Issues There were no mountain lion depredation complaints in the Palouse-Dworshak DAU in 2017. In general, mountain lion depredations are usually minor in the Clearwater Region. In 2017 there were 8 total kill permits issued, which is a slight decrease from the previous year, when 10 kill permits were issued and 5 lions were killed. Taking a long-term view of the Clearwater Region, an increasing trend in lion depredations might be due to a growing urban interface with lion-occupied range and an increase in white-tailed deer populations. Management Discussion Due to the increase in sightings and reports of encounters during the mid-1990s in this DAU, hunting seasons were liberalized. Harvest continued to increase and, during the 1997 season, harvest reached an all-time high. It is likely that, due to the dense white-tailed deer populations throughout much of this DAU, the mountain lion population expanded its range into lower elevations and took advantage of the abundant whitetail population. This could potentially account for increased observations of mountain lions in lower-elevation whitetail habitat in this DAU during the mid-1990s. Despite a longer season, harvest has remained below the 1997 peak and currently has stabilized at about half that level. It is unclear whether the current status is a result of a population change or variable hunting conditions.

15
Goal2,310 48 21
2.153% TBD
* Within male harvest 2014-2016
Harvest Statistics 2008 2009 2010 2011 2012 2013 2014 2015 2016 2017Total 22 23 34 35 54 43 36 41 50 54
0-2 years 6 6 10 9 12 8 9 12 10 03-7 years 5 9 5 6 8 13 10 9 15 08+ years 1 0 0 1 0 1 0 0 1 0Unknown 1 0 3 1 1 1 2 1 1 29Subtotal 13 15 18 17 21 23 21 22 27 290-2 years 4 5 5 6 21 11 9 9 13 03-7 years 4 2 10 9 8 7 5 9 8 08+years 0 1 1 2 3 1 0 1 1 0
Unknown 1 0 0 1 1 1 1 0 1 25Subtotal 9 8 16 18 33 20 15 19 23 25
Note: Lions in harvest year 2017 have yet to be aged
Note: Harvest does not include unknown aged lions. Lions in harvest year 2017 have yet to be aged.
(GMUs 8A, 10A)Palouse-Dworshak DAU
Males
Females
2017 Season (Fall 2017-Spring 2018)Square Miles: 3-Year Averages
Annual HarvestHarvest per 100 mi2
Males: Percent 3+ yrs*
0
10
20
30
40
50
60
2008 2010 2012 2014 20160
10
20
30
40
50
60
70
2008 2010 2012 2014 2016
% Female in Harvest
0%
20%
40%
60%
80%
100%
08-10 09-11 10-12 11-13 12-14 13-15 14-16
male <3
male 3-7
male 8+
female <3
female 3-7
female 8+
Three-year Average Mountain Lion Harvest
Harvest (min 3-yr average=21)
Figure 6. Palouse-Dworshak DAU status and objectives

16
Lolo DAU (GMUs 10, 12) Historical Background Lion hunter access to the Lolo DAU is extremely limited during winter months, except along State Highway 12 from Lowell to Lolo Pass and by snowmobile along the North Fork of the Clearwater River. Much of these 2 GMUs are difficult to access because of snow, mud, and steep, rugged terrain. Deer and elk populations throughout most of the DAU provide a considerable prey base; however, elk numbers have declined substantially over the past 2 decades. Habitat includes dense coniferous forest and mountains with relatively high precipitation. Land ownership is almost entirely public (USFS). Management Objectives The 2002–2010 Mountain Lion Management Plan directs the Department to maintain lions at or near their current distribution throughout the state. Harvest goals are based on trends from past harvest data, mountain lion population dynamics, harvest vulnerability, and the desired level and composition of harvest over a 3-year average. Initial harvest goals for this DAU were designed to maintain harvest levels on a 3-year running average that are at or above the 3-year average harvest for the 1990–1992 mountain lion seasons. Biological Objectives Management in this DAU is focused on reducing the impact of mountain lion predation on the elk herd and maximizing hunter opportunity while maintaining a healthy mountain lion population. If the current mountain lion harvest objectives are met, the population with be held below carrying capacity and should exhibit a younger age structure than more lightly harvested DAUs. Capture, Radio-mark, and/or Telemetry While nuisance mountain lions are occasionally removed or relocated, mountain lions are not a focus of department-lead capture or collaring efforts at this time. We do not have any current collar or telemetry data for mountain lions in the Lolo DAU. Population Surveys and Monitoring There is no mountain lion population monitoring efforts currently underway in the Lolo DAU. Hunting and Harvest Characteristics Within the Lolo DAU, the take season began at the end of August and extended through 30 June. The 2-lion bag limit in GMUs 10 and 12 and the use of electronic calls for hunting lions in GMU 12 were discontinued with the 2006 season, but reinstated in 2010. This DAU does not have a dog-training season, and there is no female harvest quota. The remote nature and difficult access in this DAU result in a moderate harvest level. An average annual harvest of 18 lions occurred for the 2015–2017 seasons. Harvest had been trending upwards in recent years, with 25 lions harvested in 2016, compared to 15 in 2015, and only 8 in 2014. Lolo DAU hunter harvest has often been below the 1990–1992 minimum harvest

17
objective of 20. Since the 1990s, availability of mountain lions appears to be declining, potentially a result of the effects of substantial decreases in elk numbers over the past 2 decades and, to a lesser extent, additional lion hunting pressure from reduced nonresident tag costs and the 2-lion bag limit. Harvest with the use of hounds accounted for 93% of the total harvest during the 2017 season. The percentage of females in the harvest, generally considered an indicator of mortality rates, has varied in recent years from a low of 27% in 2015 to a high of 55% in 2008. Females accounted for 35.6% of the harvest on average from 2015–2017. The 2017 season percent of females in the harvest was 40%. There is currently no established threshold for this metric. Age structure from harvested mountain lions in the 2016 season was not available at the time of this report. The most recent 3-year average (2014–2016) of males 3 years or older was 73% of total male harvest, up from the 2011–2013 average of 59%. The percent of females over 3 years of age in the harvest has varied between 23% and 34% of total harvest based on a running 3-year average since 2007–2009. The most recent average (2014–2016) was 21%. Depredation Issues There were no mountain lion depredation complaints in the Lolo DAU in 2017. In general, mountain lion depredations are usually minor in the Clearwater Region. In 2017 there were 8 total kill permits issued, which is a slight decrease from the previous year, when 10 kill permits were issued and 5 lions were killed. Taking a long-term view of the Clearwater Region, an increasing trend in lion depredations might be due to a growing urban interface with lion-occupied range and an increase in white-tailed deer populations. Management Discussion Mountain lion harvest in the Lolo DAU averaged 16 lions harvested per year over the past decade, but harvest has trended upwards in recent years with 25 lions harvested in 2016, which is the highest harvest since 2007. Recent harvest trends followed a substantial decline in harvest since 2000, when harvest peaked at 54 lions. This decline in harvest may be an indication that efforts to increase harvest through liberal season regulations have been moderately effective, and that lion numbers have potentially adjusted to decreased prey availability. Also, anecdotal information suggests that lion hunters are less willing to turn hounds loose in areas with high wolf densities, which might account for reduced harvest since wolves became reestablished in the 2000s.

18
Goal2,396 18 20
0.873% TBD
* Within male harvest 2014-2016
Harvest Statistics 2008 2009 2010 2011 2012 2013 2014 2015 2016 2017Total 11 11 25 22 12 16 8 15 25 15
0-2 years 0 2 4 4 3 2 0 3 4 03-7 years 1 5 11 4 3 6 2 8 8 08+ years 0 0 1 0 0 0 1 0 0 0Unknown 4 0 0 3 0 1 1 0 3 9Subtotal 5 7 16 11 6 9 4 11 15 90-2 years 2 2 3 6 1 0 2 2 3 03-7 years 2 2 3 4 3 2 2 2 4 08+years 0 0 2 1 0 3 0 0 2 0
Unknown 2 0 1 0 2 2 0 0 1 6Subtotal 6 4 9 11 6 7 4 4 10 6
Note: Lions in harvest year 2017 have yet to be aged
Note: Harvest does not include unknown aged lions. Lions in harvest year 2017 have yet to be aged.
(GMUs 10, 12)Lolo DAU
Males
Females
2017 Season (Fall 2017-Spring 2018)Square Miles: 3-Year Averages
Annual HarvestHarvest per 100 mi2
Males: Percent 3+ yrs*
0
5
10
15
20
25
30
2008 2010 2012 2014 2016
Harvest (min 3-yr average=20)
0
10
20
30
40
50
60
2008 2010 2012 2014 2016
% Female in Harvest
0%
20%
40%
60%
80%
100%
08-10 09-11 10-12 11-13 12-14 13-15 14-16
male <3
male 3-7
male 8+
female <3
female 3-7
female 8+
Three-year Average Mountain Lion Harvest
Figure 7. Lolo DAU status and objectives
19
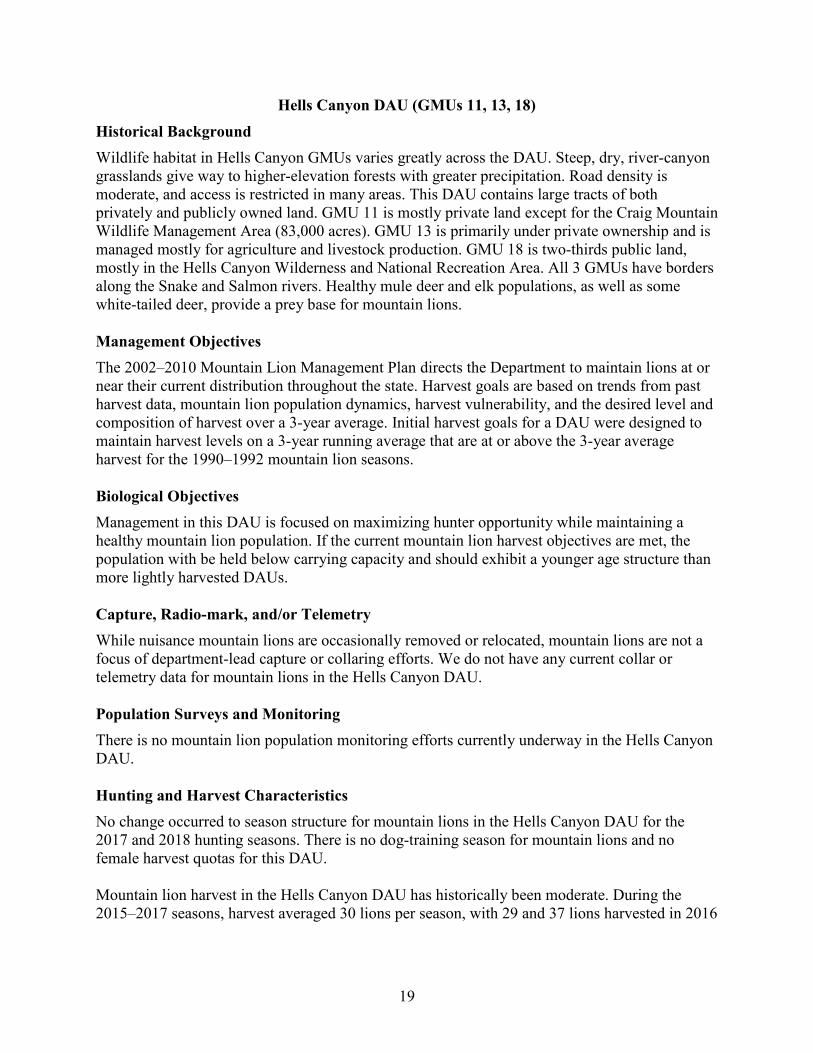
Hells Canyon DAU (GMUs 11, 13, 18) Historical Background Wildlife habitat in Hells Canyon GMUs varies greatly across the DAU. Steep, dry, river-canyon grasslands give way to higher-elevation forests with greater precipitation. Road density is moderate, and access is restricted in many areas. This DAU contains large tracts of both privately and publicly owned land. GMU 11 is mostly private land except for the Craig Mountain Wildlife Management Area (83,000 acres). GMU 13 is primarily under private ownership and is managed mostly for agriculture and livestock production. GMU 18 is two-thirds public land, mostly in the Hells Canyon Wilderness and National Recreation Area. All 3 GMUs have borders along the Snake and Salmon rivers. Healthy mule deer and elk populations, as well as some white-tailed deer, provide a prey base for mountain lions. Management Objectives The 2002–2010 Mountain Lion Management Plan directs the Department to maintain lions at or near their current distribution throughout the state. Harvest goals are based on trends from past harvest data, mountain lion population dynamics, harvest vulnerability, and the desired level and composition of harvest over a 3-year average. Initial harvest goals for a DAU were designed to maintain harvest levels on a 3-year running average that are at or above the 3-year average harvest for the 1990–1992 mountain lion seasons. Biological Objectives Management in this DAU is focused on maximizing hunter opportunity while maintaining a healthy mountain lion population. If the current mountain lion harvest objectives are met, the population with be held below carrying capacity and should exhibit a younger age structure than more lightly harvested DAUs. Capture, Radio-mark, and/or Telemetry While nuisance mountain lions are occasionally removed or relocated, mountain lions are not a focus of department-lead capture or collaring efforts. We do not have any current collar or telemetry data for mountain lions in the Hells Canyon DAU. Population Surveys and Monitoring There is no mountain lion population monitoring efforts currently underway in the Hells Canyon DAU. Hunting and Harvest Characteristics No change occurred to season structure for mountain lions in the Hells Canyon DAU for the 2017 and 2018 hunting seasons. There is no dog-training season for mountain lions and no female harvest quotas for this DAU. Mountain lion harvest in the Hells Canyon DAU has historically been moderate. During the 2015–2017 seasons, harvest averaged 30 lions per season, with 29 and 37 lions harvested in 2016
20
and 2017, respectively. This level surpassed the 1990–1992 minimum harvest objective of 15 per year. Similar to previous years, rifle was the most common weapon used (87% of harvested lions) and hunting with hounds was the most common method (76%), followed by incidental harvest (16%), during the 2017season. The percentage of females in the harvest, generally considered an indicator of mortality rates, has varied, with a low of 29% in 2007 and 2011 and a high of 61% in 2013. The 3-year average (2015–2017) was 46% females in the harvest. The 2017 season percent of females in the harvest was 49%. There is currently no established threshold for this metric. Age structure from harvested mountain lions in the 2017 season was not available at the time of this report. The most recent 3-year average (2014–2016) of males 3 years or older was 54% of all males in the harvest, a decrease from 62% for 2013–2015. The 3-year average (2014–2016) of the percent of females over 3 years of age in the harvest was 19%, and has varied between 15% and 25% since 2007–2009. Predation Issues The impact of mountain lion predation on ungulate populations likely varies with the species of prey, their abundance and recent population trends, lion numbers, the types and abundance of other prey, and the type and abundance of other predators. These vary with habitat type and land use, climate and weather, and hunting pressure. Recent research on cause-specific mortality for elk calves collared in portions of the Clearwater Region from 2015–2017 reported that lions were the primary cause of death (37% of mortalities) for calves between 1 January and 31 May, followed by malnutrition (26%), wolf predation (16%), and unknown predation (16%). Depredation Issues There were no mountain lion depredation complaints in the Hells Canyon DAU in 2017, although a mountain lion reportedly killed a domestic pet in GMU 13. In general, mountain lion depredations are usually minor in the Clearwater Region. In 2017 there were 8 total kill permits issued, which is a slight decrease from the previous year, when 10 kill permits were issued and 5 lions were killed. Taking a long-term view of the Clearwater Region, an increasing trend in lion depredations might be due to a growing urban interface with lion-occupied range and an increase in white-tailed deer populations. Management Discussion Little change in lion harvest has occurred in this DAU since 1998. Harvest has remained low except when favorable weather conditions have provided increased lion harvest opportunities. Wolf presence is minimal, especially in the northern portion of this DAU, which may draw hound hunters to this area, and could increase harvest in the future.

21
Goal1,396 30 15
2.159% TBD
* Within male harvest 2014-2016
Harvest Statistics 2008 2009 2010 2011 2012 2013 2014 2015 2016 2017Total 29 25 18 17 27 28 19 24 29 37
0-2 years 4 3 2 3 6 2 4 7 5 03-7 years 11 10 5 9 8 8 7 4 10 08+ years 1 0 1 0 1 1 0 1 1 0Unknown 1 0 1 0 0 0 2 1 0 19Subtotal 17 13 9 12 15 11 13 13 16 190-2 years 4 8 3 3 9 7 3 5 7 03-7 years 6 4 2 2 2 7 3 5 6 08+years 2 0 3 0 0 0 0 0 0 0
Unknown 0 0 1 0 1 3 0 1 0 18Subtotal 12 12 9 5 12 17 6 11 13 18
Note: Lions in harvest year 2017 have yet to be aged
Note: Harvest does not include unknown aged lions. Lions in harvest year 2017 have yet to be aged.
(GMUs 11, 13, 18)Hells Canyon DAU
Males
Females
2017 Season (Fall 2017-Spring 2018)Square Miles: 3-Year Averages
Annual HarvestHarvest per 100 mi2
Males: Percent 3+ yrs*
0
5
10
15
20
25
30
35
40
2008 2010 2012 2014 2016
Harvest (min 3-yr average=15)
0
10
20
30
40
50
60
70
2008 2010 2012 2014 2016
% Female in Harvest
0%
20%
40%
60%
80%
100%
08-10 09-11 10-12 11-13 12-14 13-15 14-16
male <3
male 3-7
male 8+
female <3
female 3-7
female 8+
Three-year Average Mountain Lion Harvest
Figure 8 Hells Canyon DAU status and objectives

22
Elk City DAU (GMUs 14, 15, 16) Historical Background Land ownership in Elk City DAU is 80% public and 20% private. Privately owned portions are at lower elevations along Clearwater and Salmon rivers. Approximately 8% of the DAU is within the Gospel Hump Wilderness. Most of the area is characterized by productive coniferous forests with intermixed grasslands. Logging and mining efforts have resulted in high open and closed road densities contributing to significant big game vulnerability during hunting season. Deer populations throughout most of the DAU are thriving, providing a substantial prey base; however, elk populations in GMUs 15 and 16 are likely in decline. Management Objectives The 2002–2010 Mountain Lion Management Plan directs the Department to maintain lions at or near their current distribution throughout the state. Harvest goals are based on trends from past harvest data, mountain lion population dynamics, harvest vulnerability, and the desired level and composition of harvest over a 3-year average. Initial harvest goals for a DAU were designed to maintain harvest levels on a 3-year running average that are at or above the 3-year average harvest for the 1990–1992 mountain lion seasons. Biological Objectives Management in this DAU is focused on maximizing hunter opportunity while maintaining a healthy mountain lion population. If the current mountain lion harvest objectives are met, the population with be held below carrying capacity and should exhibit a younger age structure than more lightly harvested DAUs. Capture, Radio-mark, and/or Telemetry While nuisance mountain lions are occasionally removed or relocated, mountain lions are not a focus of department-lead capture or collaring efforts. We do not have any current collar or telemetry data for mountain lions in the Elk City DAU. Population Surveys and Monitoring There is no mountain lion population monitoring efforts currently underway in the Elk City DAU. Hunting and Harvest Characteristics No change occurred to season structure for mountain lions in the Elk City DAU for the 2017 and 2018 hunting seasons. This DAU does not have a dog-training season and there is no female harvest quota. The northern portion of GMU 15 was closed to mountain lion harvest from 1999 through the 2003 season for research purposes. Additional hunting opportunity has been offered with a 2-lion bag limit in that portion of GMU 16 north of the Selway River since 2000. Hunter access can be difficult in some portions of this DAU. During the 2017 season, Elk City DAU hunters harvested 47 mountain lions. The 1990–1992 minimum harvest objective of 40 lions has been met since 2013. Lion harvest peaked in 1996 and has decreased since that time,
23
although harvest has recently increased. Some of the initial decline may be attributed to the lion harvest closure in the northern portion of GMU 15 from 1999 through the 2003 season. Harvest with the use of hounds accounted for 89% of the harvest in 2017, followed by incidental harvest at 32%. Weapon type used for 2017 was predominately rifle (77%), but also included bow (10%) and handgun (10%). The percentage of females in the harvest, generally considered an indicator of mortality rates, has varied between 38% and 60% annually, with 53% of the 2017 harvest comprised of females. The 3-year average (2015–2017) was 52% females in the harvest. There is currently no established threshold for this metric. Age structure from harvested mountain lions in the 2017 seasons was not available at the time of this report. The most recent 3-year average (2014–2016) of males 3 years or older was 50% of all males in the harvest, down slightly from the 2013–2015 average of 52%. The percent of females over 3 years of age in the harvest has fluctuated between 20% and 29% since the 2006, reaching a high of 29% for the 2014–2016 average. Predation Issues The impact of mountain lion predation on ungulate populations likely varies with the species of prey, their abundance and recent population trends, lion numbers, the types and abundance of other prey, and the type and abundance of other predators. These vary with habitat type and land use, climate and weather, and hunting pressure. Recent research on cause-specific mortality for elk calves collared in portions of the Clearwater Region from 2015–2017 reported that lions were the primary cause of death (37% of mortalities) for calves between 1 January and 31 May, followed by malnutrition (26%), wolf predation (16%), and unknown predation (16%). Depredation Issues There were 4 mountain lion depredation complaints in GMU 16 of the Elk City DAU in 2017, one each involving sheep and cattle and 2 involving goats. In general, mountain lion depredations are usually minor in the Clearwater Region. In 2017 there were 8 total kill permits issued, which is a slight decrease from the previous year, when 10 kill permits were issued and 5 lions were killed. Taking a long-term view of the Clearwater Region, an increasing trend in lion depredations might be due to a growing urban interface with lion-occupied range and an increase in white-tailed deer populations. Management Discussion A decline in total mountain lion harvest in Elk City DAU was to be expected after the northern portion of GMU 15 was closed from 1999–2003. However, an additional drop in the Elk City DAU harvest occurred in 2003. This may have been related to unfavorable weather conditions or the desire by hunters to pursue lions in areas known for greater lion densities. Also, lion hunters may have re-located hunting efforts to areas with lower wolf densities to avoid potential conflict with hounds. Annual harvest remained below the 3-year harvest goal of 40 lions until 2013, and has remained above objective since.

24
Goal1,857 48 40
2.656% TBD
* Within male harvest 2014-2016
Harvest Statistics 2008 2009 2010 2011 2012 2013 2014 2015 2016 2017Total 37 32 34 37 26 47 43 47 49 47
0-2 years 7 6 4 10 5 7 9 7 11 03-7 years 9 4 13 9 7 10 10 9 15 08+ years 0 1 0 1 0 2 0 0 0 0Unknown 1 2 0 3 2 2 1 3 2 22Subtotal 17 13 17 23 14 21 20 19 28 220-2 years 10 8 6 9 6 11 11 16 11 03-7 years 7 8 7 5 4 11 9 10 9 08+years 1 1 1 0 1 3 1 1 0 0
Unknown 2 2 3 0 1 1 2 1 1 25Subtotal 20 19 17 14 12 26 23 28 21 25
Note: Lions in harvest year 2017 have yet to be aged
Note: Harvest does not include unknown aged lions. Lions in harvest year 2017 have yet to be aged.
Annual HarvestHarvest per 100 mi2
Males: Percent 3+ yrs*
Males
Females
(GMUs 14, 15, 16)Elk City DAU
2017 Season (Fall 2017-Spring 2018)Square Miles: 3-Year Averages
0
10
20
30
40
50
60
2008 2010 2012 2014 2016
Harvest (min 3-yr average=40)
0
10
20
30
40
50
60
70
2008 2010 2012 2014 2016
% Female in Harvest
0%
20%
40%
60%
80%
100%
08-10 09-11 10-12 11-13 12-14 13-15 14-16
male <3
male 3-7
male 8+
female <3
female 3-7
female 8+
Three-year Average Mountain Lion Harvest
Figure 9. Elk City DAU status and objectives

25
Selway DAU (GMUs 16A, 17, 19, 20) Historical Background GMUs within the Selway DAU are, in part, comprised of the Selway-Bitterroot, Frank Church River-of-No-Return, and Gospel Hump Wilderness areas and large roadless areas that afford limited access for hunters during mountain lion season. Habitat within this DAU includes dense, coniferous forests within rugged mountainous terrain, as well as ponderosa pine-savanna habitat with open understory, and steep open bunchgrass hillsides and brush fields along the Selway and Salmon River breaks. Although some white-tailed deer habitat occurs in these GMUs, the predominant ungulates are elk and mule deer. Management Objectives The 2002–2010 Mountain Lion Management Plan directs the Department to maintain lions at or near their current distribution throughout the state. Harvest goals are based on trends from past harvest data, mountain lion population dynamics, harvest vulnerability, and the desired level and composition of harvest over a 3-year average. Initial harvest goals for a DAU were designed to maintain harvest levels on a 3-year running average that are at or above the 3-year average harvest for the 1990–1992 mountain lion seasons. Biological Objectives Management in this DAU is focused on reducing the impact of mountain lion predation on the elk herd and maximizing hunter opportunity while maintaining a healthy mountain lion population. If the current mountain lion harvest objectives are met, the population with be held below carrying capacity and should exhibit a younger age structure than more lightly harvested DAUs. Capture, Radio-mark, and/or Telemetry While nuisance mountain lions are occasionally removed or relocated, mountain lions are not a focus of department-lead capture or collaring efforts. We do not have any current collar or telemetry data for mountain lions in the Selway DAU. Population Surveys and Monitoring There is no mountain lion population monitoring efforts currently underway in the Selway DAU. Hunting and Harvest Characteristics Within the Selway DAU, the mountain lion take season extended from 30 August–30 June. A bag limit of 2 lions has been allowed since 2000 and electronic calls are permitted. This DAU does not have a dog-training season and nor any female harvest quotas. Mountain lion harvest in the Selway DAU peaked in 2000 and 2001 (39 and 33, respectively), then declined to a recent 10-year average of 14 lions per year. Peak harvest was likely the result of several factors including the increased bag limit and season length, increased nonresident hound permits, outfitter efforts, and low snow pack. After peaking, harvest declined substantially in 2002 and has remained low since. Reduced harvest is likely due to a combination of factors

26
including a substantial decline in the elk population, fewer hunters in some areas, and reluctance to release hounds in areas with high wolf densities. During the 2017 season, Selway DAU hunters harvested 15 mountain lions. The 3-year average of 12 lions was below the 1990–1992 minimum harvest objective of 16. Because these are such large GMUs, with a moderate prey base, the mountain lion population is likely much greater than harvest indicates. This suggests an under-harvested, but evidently self-regulating population. The major obstacle to harvest in this DAU is difficult hunter access. Harvest with the use of hounds accounted for 80% of the total harvest in 2017. The percentage of females in the harvest, generally considered an indicator of mortality rates, has varied, with a low of 33.3% in 2017 and a high of 80% in 2014. The 3-year average (2015–2017) was 44.4% females in the harvest. There is currently no established threshold for this metric. Age structure from harvested mountain lions in the 2017 season was not available at the time of this report. The most recent 3-year average (2014–2016) of males 3 years or older was 56% of all males in the harvest, down from 68% for 2011–2013. The 3-year average percent of females over 3 years of age in the harvest has decreased since the 2008–2010 average, declining from 35% to 23% in 2014–2016. Depredation Issues There were no mountain lion depredation complaints in the Selway DAU in 2017. In general, mountain lion depredations are usually minor in the Clearwater Region. In 2017 there were 8 total kill permits issued, which is a slight decrease from the previous year, when 10 kill permits were issued and 5 lions were killed. Taking a long-term view of the Clearwater Region, an increasing trend in lion depredations might be due to a growing urban interface with lion-occupied range and an increase in white-tailed deer populations. Management Discussion The Selway DAU occupies a vast, remote area with high-quality big game range. Consequently, effects of hunting on mountain lion populations in the DAU are generally considered to be light except in those few areas with good road access or in areas where outfitters concentrate their hunting efforts.

27
Goal2,551 12 16
0.556% TBD
* Within male harvest 2014-2016
Harvest Statistics 2008 2009 2010 2011 2012 2013 2014 2015 2016 2017Total 10 12 21 23 15 13 5 7 14 15
0-2 years 0 1 3 1 3 1 0 1 3 03-7 years 6 3 7 4 3 4 1 1 3 08+ years 0 0 3 2 1 1 0 0 0 0Unknown 0 0 0 1 1 0 0 1 2 10Subtotal 6 4 13 8 8 6 1 3 8 100-2 years 1 1 0 4 5 4 2 2 2 03-7 years 3 4 8 7 0 1 2 1 3 08+years 0 0 0 1 2 2 0 0 0 0
Unknown 0 3 0 3 0 0 0 1 1 5Subtotal 4 8 8 15 7 7 4 4 6 5
Note: Lions in harvest year 2017 have yet to be aged
Note: Harvest does not include unknown aged lions. Lions in harvest year 2017 have yet to be aged.
Males
Females
Annual HarvestHarvest per 100 mi2
Males: Percent 3+ yrs*
(GMUs 16A, 17, 19, 20)Selway DAU
2017 Season (Fall 2017-Spring 2018)Square Miles: 3-Year Averages
0
5
10
15
20
25
2008 2010 2012 2014 2016
Harvest (min 3-yr average=16)
0
10
20
30
40
50
60
70
80
90
2008 2010 2012 2014 2016
% Female in Harvest
0%
20%
40%
60%
80%
100%
08-10 09-11 10-12 11-13 12-14 13-15 14-16
male <3
male 3-7
male 8+
female <3
female 3-7
female 8+
Three-year Average Mountain Lion Harvest
Figure 10. Selway DAU status and objectives
28
SOUTHWEST REGION
Warren DAU (GMUs 19A, 20A, 25, 26, 27) Historical Information Warren DAU is characterized by limited access and rugged topography. Most of the DAU occurs within the Frank Church River-of-No-Return Wilderness. Research data from the early 1970’s (Seidensticker et al. 1973) indicate mountain lion populations in this area are self-regulating, contributing emigrating animals to surrounding GMUs. The current structure of long seasons and 2-lion bag limits in GMUs 20A, 26, and 27 were implemented in response to sportsmen’s concerns about declining ungulate recruitment. Management Objectives Harvest objectives for the Warren DAU are designed to maintain 3-year average harvest at or above the 1990–1992 average harvest of 15 mountain lions. . Capture, Radio-mark, and/or Telemetry Mountain lions are not a focus of department-lead capture or collaring efforts. We do not have any current collar or telemetry data for mountain lions in the Warren DAU. Population Surveys and Monitoring There is no mountain lion population monitoring efforts currently underway in the Warren DAU. Hunting and Harvest Characteristics Season changes include the extension of the take season in GMU 27 by two months (to 30 June) in the 2015 season. A female harvest quota is currently in place in GMU 25 to guard against over-harvest of the reproductive portion of the population, but harvest of males-only is permitted through the end of the season after the female harvest quota has been met. The use of dogs is prohibited during open firearm seasons for deer and elk in all GMUs in this DAU (Appendix A). Seven mountain lions (4 males, 3 females) were harvested in Warren DAU during the 2017 (Figure 11). The female quota in GMU 25 was not met in the 2017 season. The 2017 harvest was 34% below that for the previous 3-year average harvest (2014–2016; 11.0). The 2015–2017 average harvest of 11.7 is 22% below the minimum 3-year average harvest objective of 15 for this DAU. The harvest trend remains below objective. During the 2017 season, the majority of mountain lions harvested in the Warren DAU were taken with assistance of hounds (93%). Age data for the 2017 harvest season are not yet available. Three-year average age data from the most current analyzed years (2014–2016; n=16) indicated that 50% of harvested males were in the ≥3-year-old age class. The proportion of females in the harvest has varied dramatically in the last 10 years (range 0% – 64%), averaging 20% over the past three years (Figure 11).

29
Predation Issues No mountain lion depredations were reported in the Warren DAU in 2017. Management Discussion Three-year average harvest in the Warren DAU continues to be below the minimum objective of 15, consistent with the past 10 years. The remote nature of this DAU makes it unlikely that sport harvest can regulate lion population numbers. Prey populations and competition with wolves will likely have the greatest effect on lion populations in this area.

30
Goal4,289 12 15
0.367% TBD
* Within male harvest 2014-2016
Harvest Statistics 2008 2009 2010 2011 2012 2013 2014 2015 2016 2017Total 9 10 7 9 14 7 5 14 14 7
0-2 years 2 3 2 2 1 1 2 5 0 03-7 years 5 2 3 3 2 3 2 3 7 08+ years 1 1 0 1 1 0 0 0 2 0Unknown 0 0 0 0 1 0 1 1 4 4Subtotal 8 6 5 6 5 4 5 9 13 40-2 years 1 0 1 2 2 1 0 1 0 03-7 years 0 4 1 1 5 1 0 3 1 08+years 0 0 0 0 2 1 0 1 0 0
Unknown 0 0 0 0 0 0 0 0 0 3Subtotal 1 4 2 3 9 3 0 5 1 3
Note: Lions in harvest year 2017 have yet to be aged
Note: Harvest does not include unknown aged lions. Lions in harvest year 2017 have yet to be aged.
Annual HarvestHarvest per 100 mi2
Males: Percent 3+ yrs*
Males
Females
(GMUs 19A, 20A, 25, 26, 27)Warren DAU
2017 Season (Fall 2017-Spring 2018)Square Miles: 3-Year Averages
0
2
4
6
8
10
12
14
16
2008 2010 2012 2014 2016
Harvest (min 3-yr average=15)
0
10
20
30
40
50
60
70
2008 2010 2012 2014 2016
% Female in Harvest
0%
20%
40%
60%
80%
100%
08-10 09-11 10-12 11-13 12-14 13-15 14-16
male <3
male 3-7
male 8+
female <3
female 3-7
female 8+
Three-year Average Mountain Lion Harvest
Figure 11. Warren DAU status and objectives

31
McCall DAU (GMUs 22, 23 24, 31, 32A) Historical Background Approximately two-thirds of the McCall DAU is in public ownership, with most land managed by the USFS. Open, scattered shrub communities at lower elevations and mixed-conifer forests at mid to upper elevations characterize the habitat. The wide valley bottoms of the upper Little Salmon River, Weiser River, and North Fork Payette River are dominated by agri-business and housing developments. Moderate to high road densities exist in most of this DAU, with lower road densities on the eastern side of the DAU. Lions were considered rare in these GMUs in the late 1970s and early 1980s. Like lion populations in other parts of the state, those in McCall DAU began increasing dramatically in the early 1990s. Subsequently, lion sightings, depredation occurrences, and sportsmen concerns for impacts on ungulates increased. Conservative seasons adopted in the 1980s were modified to the more liberal seasons currently in place (Appendix A). Management Objectives Harvest objectives for the McCall DAU are designed to maintain 3-year average harvest levels at or above the 1990–1992 average harvest of 20 mountain lions. Female harvest quotas are currently in place in all GMUs of this DAU to guard against over-harvest of the reproductive portion of the population, but harvest of males-only is permitted through the end of the season after the female harvest quota has been met. Biological Objectives Forty-seven mountain lions were harvested in the McCall DAU during the 2017 hunting season. This is consistent with management objectives of maintaining harvest > 20 lions. The female quota was only reached in GMU 31. It was not met in any other GMU. Capture, Radio-mark, and/or Telemetry No capture, radio-marking, or telemetry occurred in the McCall DAU during the reporting period. Population Surveys and Monitoring No population surveys or monitoring occurred in the McCall DAU during the reporting period. Hunting and Harvest Characteristics No changes occurred to season structure for mountain lions in the McCall DAU for the 2017 seasons. The use of dogs is prohibited during open firearm seasons for deer and elk in all GMUs in this DAU (Appendix A). Forty-seven mountain lions (32 males, 15 females) were harvested in the McCall DAU during the 2017 season (Figure 11). The female quota was reached and exceeded in GMU 31 during the 2017 season. The 2017 harvest was 68% above the previous 3- year average harvest (2014–2016;

32
28.3). The 2015–2017 average harvest of 37 is 85% above the minimum harvest objective of 20 for this DAU. The harvest trend has been above objective for the past 8 years. The majority of mountain lions harvested in the McCall DAU during the 2017 season were taken with assistance of hounds (85%). Age data for 2017 harvest seasons are not yet available. Three-year average age data from the most current analyzed years (2014–2016) indicated that 63% of harvested males were in the ≥3-year-old age class. Percent females in the harvest averaged 40% over the last three years (2015–2017). Three-year average (2014–2016) adult female harvest (>3 years old) was 50% of the total female harvest (Figure 12). Management Discussion Current 3-year average harvest in the McCall DAU is above the minimum objective. Due to the high accessibility to lion habitat in this DAU, harvest restrictions such as female harvest quotas are necessary to maintain viable populations and subsequent hunter satisfaction.

33
Goal3,101 37 20
1.263% TBD
* Within male harvest 2014-2016
Harvest Statistics 2008 2009 2010 2011 2012 2013 2014 2015 2016 2017Total 20 16 24 25 23 29 22 28 35 47
0-2 years 2 4 3 9 5 3 3 6 5 03-7 years 9 7 8 5 8 11 3 8 12 08+ years 0 0 0 0 0 2 0 1 0 0Unknown 1 1 2 2 0 1 1 2 1 32Subtotal 12 12 13 16 13 17 7 17 18 320-2 years 4 0 3 5 5 5 8 5 6 03-7 years 4 3 6 3 3 5 7 5 9 08+years 0 1 0 0 0 1 0 0 1 0
Unknown 0 0 2 1 2 1 0 1 1 15Subtotal 8 4 11 9 10 12 15 11 17 15
Note: Lions in harvest year 2017 have yet to be aged
Note: Harvest does not include unknown aged lions. Lions in harvest year 2017 have yet to be aged.
(GMUs 22, 23, 24, 31, 32A)McCall DAU
Males
Females
2017 Season (Fall 2017-Spring 2018)Square Miles: 3-Year Averages
Annual HarvestHarvest per 100 mi2
Males: Percent 3+ yrs*
05
101520253035404550
2008 2010 2012 2014 2016
Harvest (min 3-yr average=20)
0
10
20
30
40
50
60
70
80
2008 2010 2012 2014 2016
% Female in Harvest
0%
10%
20%
30%
40%
50%
60%
70%
80%
90%
100%
08-10 09-11 10-12 11-13 12-14 13-15 14-16
male <3
male 3-7
male 8+
female <3
female 3-7
female 8+
Three-year Average Mountain Lion Harvest
Figure 12 McCall DAU status and objectives
34
Boise-Stanley DAU (GMUs 32, 33, 34, 35, 36, 39) Historical Background The majority of the Boise-Stanley DAU is forested public land administered by the Boise, Challis and Sawtooth National Forests. However sections of private agricultural also exist in the valley bottoms. A portion of the Treasure Valley-Idaho’s largest metropolitan area-is also found in this DAU. Open, scattered shrub communities at lower elevations and mixed-conifer forests at mid to upper elevations characterize the habitat. Access within the Boise-Stanley DAU ranges from heavily roaded urban areas to roadless wilderness areas. Lions occurred in lower densities in these GMUs in the late 1970s and early 1980s. Like lion populations in other parts of the state, lion numbers in Boise-Stanley DAU began increasing dramatically in the early 1990s, likely in response to increasing deer and/or elk populations in much of the area. Subsequently, lion sightings, depredation occurrences, and sportsmen concerns for ungulates increased. Conservative seasons adopted in the 1980s were modified to the more liberal seasons currently in place (Appendix A). Management Objectives Harvest objectives for the Boise-Stanley DAU are designed to maintain 3-year average harvest levels at or above the 1990–1992 average harvest of 30 mountain lions. Capture, Radio-mark, and/or Telemetry No mountain lions were captured for radio marking or telemetry. Population Surveys and Monitoring During winter of 2016–2017, IDFG implemented a pilot study in GMUs 33 and 35 to test the effectiveness of using remote cameras to monitor mountain lion populations. Approximately 70 trail cameras were deployed on predicted elk winter range in the Garden Valley to Lowman area. Cameras were active from October 2016 to May/June of 2017. Non-invasive genetic sampling of mountain lions was also conducted in the study area (biopsy darting and backtracking) with the assistance of local houndsmen and contractors, and used for comparison with the trail camera results. The data is currently being analyzed at the University of Montana, as part of a graduate project. Hunting and Harvest Characteristics No changes occurred to season structure for mountain lions in the Boise-Stanley DAU for the 2017 season. Female harvest quotas are currently in place in these GMUs (with the exception of GMU 36) to guard against over-harvest of the reproductive portion of the population, but harvest of males-only is permitted through the end of the season after a female harvest quota has been met. GMU 36 contains higher elevation mountainous terrain and has comparatively few wintering ungulates to maintain mountain lions during winter months. The use of dogs is prohibited during open firearm seasons for deer and elk in all GMUs in this DAU (Appendix A). Thirty-four mountain lions (22 males, 12 females) were harvested in the Boise-Stanley DAU during the 2017 season (Figure 13). The 2017 harvest was 17% above the previous 3-year

35
average harvest (2014–2016; 29). The 2015–2017 average harvest of 33 is 10% above the minimum objective of 30 for this DAU. The overall harvest trend has been stable over the past 10 years. The majority of mountain lions harvested in the Boise-Stanley DAU during the 2017 season were taken with assistance of hounds (73%). Age data for the 2017 harvest season are not yet available. Three-year average age data from the most current analyzed years (2014–2016) indicated that 65% of harvested males were in the ≥3-year-old age class. Percent females in the harvest averaged 44% over the last 3 years (2015–2017). Three-year average (2014–2016) adult female harvest (>3 years old) was 50% of the total female harvest (Figure 13). Predation Issues Wolves and mountain lions are the primary large predators in this area. Mountain lions in the Boise-Stanley DAU are known to prey upon mule deer and elk. Necropsy data on radio-marked deer and elk indicate mountain lion predation has not had a population effect on these ungulate species. Depredation Issues No mountain lion depredations on livestock were reported during this period in the Boise-Stanley DAU. Management Discussion Current three-year average harvest in the Boise-Stanley DAU is slightly above the minimum objective of 30 mountain lions. Harvest trends over the past 10 years appear stable. Quotas on female lion harvest, implemented to skew lion harvest toward the male component, probably have little effect in most of the GMUs of this DAU because they are rarely reached.
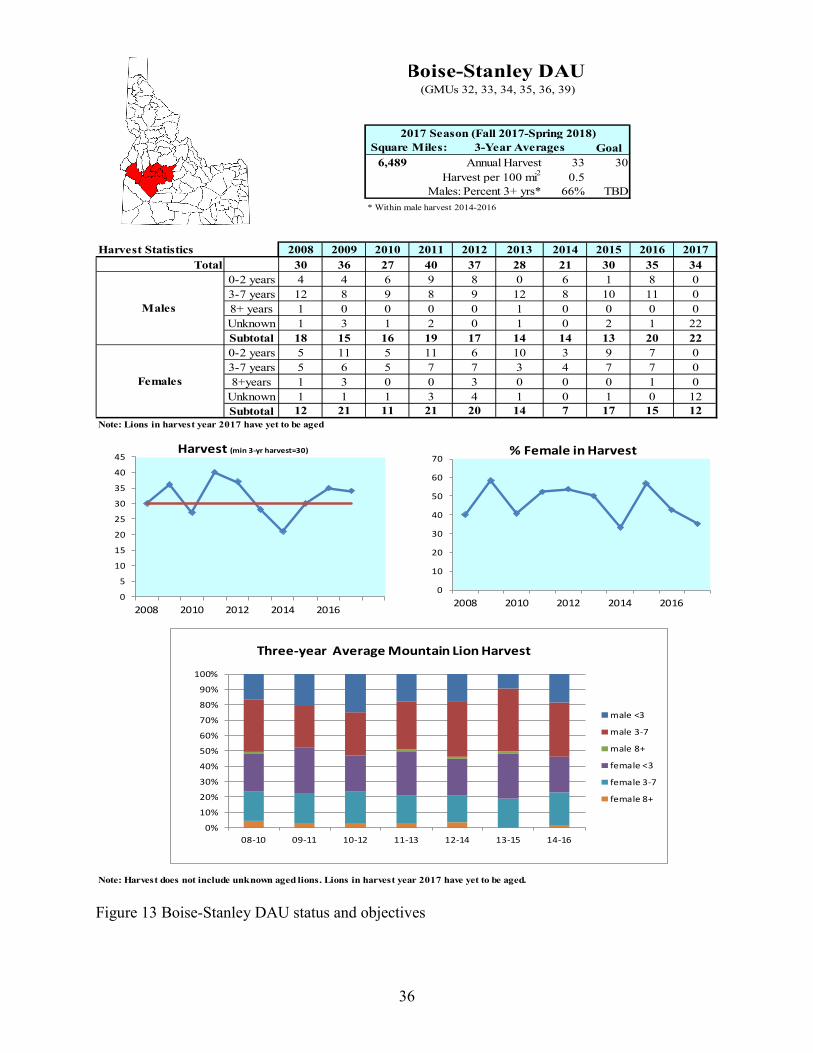
36
Goal6,489 33 30
0.566% TBD
* Within male harvest 2014-2016
Harvest Statistics 2008 2009 2010 2011 2012 2013 2014 2015 2016 2017Total 30 36 27 40 37 28 21 30 35 34
0-2 years 4 4 6 9 8 0 6 1 8 03-7 years 12 8 9 8 9 12 8 10 11 08+ years 1 0 0 0 0 1 0 0 0 0Unknown 1 3 1 2 0 1 0 2 1 22Subtotal 18 15 16 19 17 14 14 13 20 220-2 years 5 11 5 11 6 10 3 9 7 03-7 years 5 6 5 7 7 3 4 7 7 08+years 1 3 0 0 3 0 0 0 1 0
Unknown 1 1 1 3 4 1 0 1 0 12Subtotal 12 21 11 21 20 14 7 17 15 12
Note: Lions in harvest year 2017 have yet to be aged
Note: Harvest does not include unknown aged lions. Lions in harvest year 2017 have yet to be aged.
(GMUs 32, 33, 34, 35, 36, 39)Boise-Stanley DAU
Males
Females
2017 Season (Fall 2017-Spring 2018)Square Miles: 3-Year Averages
Annual HarvestHarvest per 100 mi2
Males: Percent 3+ yrs*
0
5
10
15
20
25
30
35
40
45
2008 2010 2012 2014 2016
Harvest (min 3-yr harvest=30)
0
10
20
30
40
50
60
70
2008 2010 2012 2014 2016
% Female in Harvest
0%
10%
20%
30%
40%
50%
60%
70%
80%
90%
100%
08-10 09-11 10-12 11-13 12-14 13-15 14-16
male <3
male 3-7
male 8+
female <3
female 3-7
female 8+
Three-year Average Mountain Lion Harvest
Figure 13 Boise-Stanley DAU status and objectives

37
Owyhee DAU (GMUs 40, 41, 42, 46, 47) Historical Background Owyhee DAU encompasses the southwest portion of Idaho. The habitat is largely open sagebrush desert with interspersed canyon lands ranging to dry forested mountains. The remoteness of the area and general scarcity of trees and presence of cliffs, caves, and other rocky features in parts of these GMUs make mountain lions more difficult to capture with hounds than in many other areas of Idaho. Deer are the primary big game prey species for mountain lions in most of the DAU. Downward trends in California bighorn sheep populations in the Jacks Creek drainages in GMU 41 and the Owyhee River drainage in GMU 42 prompted the initiation of research on bighorn sheep survival in the Little Jacks and Big Jacks Creek drainages in 2002. Results suggest mountain lions may have contributed to the decline of sheep in this system. The sheep population seems to have stabilized in recent years, and a study initiated in 2011 did not indicate that mountain lions were significantly impacting sheep in these GMUs. Because of the concern about the impacts of lion predation on bighorn sheep, the Idaho Fish and Game Commission passed regulations to legalize the use of electronic calls as an aid to harvest mountain lions in GMUs 41 and 42 in 2000. Management Objectives Harvest objectives for the Owyhee DAU are designed to maintain 3-year average harvest levels at or above the 1990–1992 average harvest of 20 mountain lions. The management direction for this DAU is to encourage sport harvest of mountain lions in GMUs where there is a concern about the impacts of lion predation on California bighorn sheep herds while maintaining a viable mountain lion population throughout the area. Liberal seasons are offered (Appendix A), particularly in GMUs 41 and 42, where there is some concern about the impacts of mountain lions on bighorn sheep. Capture, Radio-mark, and/or Telemetry No mountain lions were captured for radio marking or telemetry. Population Surveys and Monitoring No mountain lion surveys or monitoring were conducted during this reporting period. Hunting and Harvest Characteristics No changes occurred to season structure for mountain lions in the Owyhee DAU for the 2017 season. Female harvest quotas are currently in place in some GMUs (40, 46, 47) to guard against over-harvest of the reproductive portion of the population, but harvest of males-only is permitted through the end of the season after a female harvest quota has been met (Appendix A). There has been no female quota in GMUs 41 or 42 since the 2006 season. The use of electronic calls is permitted in GMUs 41 and 42. The use of dogs is prohibited during open firearm seasons for deer and elk in all GMUs in this DAU (Appendix A).

38
Twenty-eight mountain lions (13 males, 15 females) were harvested in the Owyhee DAU during the 2017 season (Figure 13). No female harvest quotas were reached in the 2017 season. Harvest was 7% below the previous 3-year average harvest (2014–2016; 30). The 2015–2017 average harvest of 31 exceeds the minimum objective of 20 for this DAU. The overall harvest trend shows an increase in harvest over the past five years. Age data for the 2017 harvest season are not yet available. Three-year average age data from the most current analyzed years (2014–2016) indicated that 50% of harvested males were in the ≥3-year-old age class. Percent females in the harvest averaged 37% over the last three years (2015–2017). Three-year average (2014–2016) adult female harvest (> three years old) was 59% of the total female harvest (Figure 14). The majority of mountain lions harvested in the Owyhee DAU during the 2017 season were taken with assistance of hounds (75%). Predation Issues Coyotes, bobcats, and mountain lions are the large predators in this area. Mountain lions in the Owyhee DAU prey on bighorn sheep, mule deer, and elk. Predation rates and effects to ungulate populations are largely unknown. Recent bighorn sheep research and monitoring suggests mountain lion predation may be a limiting factor for some sheep populations, but results are inconclusive. Depredation Issues No mountain lion depredations on livestock were reported in the Owyhee DAU in 2017. Management Discussion Current three-year average harvest in the Owyhee DAU meets the minimum objective of 20 mountain lions. Quotas on female lion harvest, implemented to skew lion harvest toward the male component, probably have little effect in most of the GMUs of this DAU because they are rarely reached.

39
Goal9,106 31 20
0.350% TBD
* Within male harvest 2014-2016
Harvest Statistics 2008 2009 2010 2011 2012 2013 2014 2015 2016 2017Total 19 25 23 19 26 29 25 30 36 28
0-2 years 2 9 10 5 9 6 7 9 10 03-7 years 5 8 4 4 8 10 6 9 11 08+ years 0 0 0 0 0 0 0 0 0 0Unknown 2 0 0 1 0 2 0 2 1 13Subtotal 9 17 14 10 17 18 13 20 22 130-2 years 2 3 3 3 4 1 6 5 3 03-7 years 5 5 4 5 2 7 5 2 9 08+years 3 0 2 0 1 1 0 2 2 0
Unknown 0 0 0 1 2 2 1 1 0 15Subtotal 10 8 9 9 9 11 12 10 14 15
Note: Lions in harvest year 2017 have yet to be aged
Note: Harvest does not include unknown aged lions. Lions in harvest year 2017 have yet to be aged.
(GMUs 40, 41, 42, 46, 47)Owyhee DAU
Males
Females
2017 Season (Fall 2017-Spring 2018)Square Miles: 3-Year Averages
Annual HarvestHarvest per 100 mi2
Males: Percent 3+ yrs*
0
5
10
15
20
25
30
35
40
2008 2010 2012 2014 2016
Harvest (min 3-yr average=20)
0
10
20
30
40
50
60
2008 2010 2012 2014 2016
% Female in Harvest
0%
20%
40%
60%
80%
100%
08-10 09-11 10-12 11-13 12-14 13-15 14-16
male <3
male 3-7
male 8+
female <3
female 3-7
female 8+
Three-year Average Mountain Lion Harvest
Figure 14. Owyhee DAU status and objectives

40
MAGIC VALLEY REGION Sun Valley DAU (GMUs 36A, 43, 44, 48, 49, 50)
Historical Background Sun Valley DAU has accounted for an average of 34% of the mountain lion harvest in the Magic Valley Region over the last 10 years. Prior to 1994, most mountain lion depredations on livestock occurred in these GMUs. However, in recent years depredations have been rare. Management Objectives Broad harvest management goals for all DAUs were developed in the 2002–2010 Mountain Lion Management Plan to maintain current lion population levels, maintain a diversity of sport harvest opportunities, be responsive to human conflicts, and develop better lion population monitoring tools. Specific harvest goals for Sun Valley DAU are currently limited to maintaining a 3-year average minimum harvest of 13 lions. The 3-year average harvest (2015–2017) for the Sun Valley DAU is13. Capture, Radio-mark, and/or Telemetry No capture, radio-marking, or telemetry occurred during this reporting period. Population Surveys and Monitoring No formal mountain lion surveys were conducted during this reporting period. Hunting and Harvest Characteristics The season structure has remained constant in recent years with a season length of 214 days beginning 30 August (Appendix A). Eleven mountain lions were harvested in the Sun Valley DAU during the 2017 season (Figure 15). The current 3-year average harvest of 13 lions meets the minimum objective as detailed in the 2002–2010 Mountain Lion Management Plan. The female quota of 6 lions was not met in GMUs 43, 44, 48, or 49 during this reporting period. There are currently no female quotas in place for GMUs 36A and 50. The percentage of females in the harvest has remained relatively consistent since 2001. Age data indicate that the proportion of adult lions (≥3 years old) in the harvest has remained steady in the last two years. The 3-year mean percent of adult lions in the harvest has varied from a 2003–2005 low of 50%, to a peak of 82% from 2007–2009. The 3-year mean remained in the high 70s until dropping to the mid-40s in the last three years. The 3-year average of adult males ≥3 year of age (2014-2016) is 57% (Figure 15). Ages for 2017 are not available at this time. Predation Issues Coyotes, bobcats, black bear, gray wolf, and mountain lions are the large predators in this area. Mountain lions in the Sun Valley DAU prey on mule deer and elk. Predation rates and effects to ungulate populations are unknown. Depredation Issues Mountain lion depredations are uncommon in the Sun Valley DAU with an average of <1 depredation per year since 2000. Wildlife services reported that there were 2 lion depredations

41
on cattle in unit 49 during the month of July 2016 In February of 2017 a mountain lion killed 21 pregnant ewes in the Macon Flat area. Management Discussion Total harvest in this DAU remains relatively stable, with a peak of 22 in 2007 and a subsequent low of 6 in 2013. The 3-year average of 13 lions meets the minimum harvest objective for this DAU. The recent trend indicates an increasing proportion of adults in the harvest. This may indicate a lack of immigration into the population as a result of relatively high densities.

42
Goal5,114 13 13
0.357% TBD
* Within male harvest 2014-2016
Harvest Statistics 2008 2009 2010 2011 2012 2013 2014 2015 2016 2017Total 13 12 21 16 12 6 16 13 15 11
0-2 years 3 1 1 0 2 0 4 5 4 03-7 years 3 5 7 6 1 4 5 6 5 08+ years 0 2 1 0 0 0 0 0 1 0Unknown 1 0 1 3 1 1 0 1 1 6Subtotal 7 8 10 9 4 5 9 12 11 60-2 years 0 0 5 3 5 0 3 1 1 03-7 years 6 4 4 3 2 1 4 0 1 08+years 0 0 2 1 1 0 0 0 1 0
Unknown 0 0 0 0 0 0 0 0 1 5Subtotal 6 4 11 7 8 1 7 1 4 5
Note: Lions in harvest year 2017 have yet to be aged
Note: Harvest does not include unknown aged lions. Lions in harvest year 2017 have yet to be aged.
(GMUs 36A, 43, 44, 48, 49, 50)Sun Valley DAU
Males
Females
2017 Season (Fall 2017-Spring 2018)Square Miles: 3-Year Averages
Annual HarvestHarvest per 100 mi2
Males: Percent 3+ yrs*
0
5
10
15
20
25
2008 2010 2012 2014 2016
Harvest (min 3-yr average=13)
0
10
20
30
40
50
60
70
2008 2010 2012 2014 2016
% Female in Harvest
0%
20%
40%
60%
80%
100%
08-10 09-11 10-12 11-13 12-14 13-15 14-16
male <3
male 3-7
male 8+
female <3
female 3-7
female 8+
Three-year Average Mountain Lion Harvest
Figure 15. Sun Valley DAU status and objectives

43
Oakley DAU (GMUs 54, 55, 56, 57) Historical Background The Oakley DAU has accounted for an average of 66% of the mountain lion harvest in Magic Valley Region during the last 10 years. GMU 54 consistently has the highest annual mountain lion harvest of any GMU in the region. Most of the GMUs within this DAU have had female quotas since the 1980s. As such, female harvest has generally been very conservative. However, it should be noted that female quotas increased regularly during the early 1990s, and regrouping of GMUs has taken place numerous times. There is currently a quota of 6 females each for GMUs 54 and 55. A historical perspective of female quotas and grouping of GMUs can be found in the 2001–2002 report. Management Objectives Broad harvest management goals for all DAUs were developed in the 2002–2010 Mountain Lion Management Plan to maintain current lion population levels, maintain a diversity of sport harvest opportunities, be responsive to human conflicts, and develop better lion population monitoring tools. Specific harvest goals for Oakley DAU are currently limited to maintaining a 3-year average minimum harvest of 12 lions. The 3-year average harvest for 2015–2017for the Oakley DAUs is 36 lions.. Capture, Radio-mark, and/or Telemetry No capture, radio-marking, or telemetry occurred during this reporting period. Population Surveys and Monitoring From 1987 to 2000 researchers from Idaho State University evaluated mountain lion population trends in southeastern Idaho (GMUs 55 and 57) and northeastern Utah. Predictably, the long-term study found that mountain lion numbers, particularly the number of juveniles, fluctuated in response to variations in mule deer populations. No surveys or monitoring were conducted during this reporting period. Hunting and Harvest Characteristics The season structure has remained constant in recent years with a season length of 214 days beginning 30 August (Appendix A). The female quota of 6 lions was not met in any unit in the DAU during this reporting period. Twenty-seven mountain lions were harvested in the Oakley DAU during the 2017 season. These levels exceeded the 1990–1992 minimum harvest objective of 12 (Figure 16). Total lion harvest has remained relatively stable over the past 10 years, with the exception of 2015 and 2016 when harvest increased 36%. The 3-year average of male lions ≥3 year of age (2014-2016) was 53%. Ages for 2017 were not available. Males continue to constitute the majority of the mountain lion harvest in this DAU (Figure 16).

44
Predation Issues Coyotes, bobcats, and mountain lions are the large predators in this area. Mountain lions in the Oakley DAU prey primarily on mule deer. Elk occur throughout the DAU and a small population of bighorn sheep has been established in GMU 55. Mountain lions prey on both but likely to a lesser extent. Predation rates and effects to ungulate populations are largely unknown. Depredation Issues Mountain lion depredations are uncommon in the Oakley DAU with an average of <1 depredation per year since 2000. There were no depredations during this reporting period. Management Discussion Current harvest strategies in this DAU resulted in slightly decreased annual harvest from 1997 through 2000, but annual harvest has remained relatively unchanged through 2014, and still well above the minimum objective of 12. The increased harvest observed in 2015 and 2016 may be indicative of an increasing mountain lion population. The distribution of males and females in the harvest fluctuated in the late 1990s through the mid-2000s. However, these fluctuations have moderated over the past 5 years. In general, males have comprised the majority of the harvest; indicative of light harvest pressure. Reevaluating mountain lion trends in response to the reintroduction (bighorn sheep) and proliferation (elk) of alternative prey species could provide valuable information for future management.

45
Goal3,675 36 12
1.053% TBD
* Within male harvest 2014-2016
Harvest Statistics 2008 2009 2010 2011 2012 2013 2014 2015 2016 2017Total 23 20 20 25 18 22 24 32 50 27
0-2 years 4 3 8 10 2 3 8 10 11 03-7 years 7 9 3 4 5 9 7 12 14 08+ years 0 0 1 1 2 1 0 0 0 0Unknown 1 1 0 2 1 0 0 3 5 20Subtotal 12 13 12 17 10 13 15 25 30 200-2 years 7 3 3 3 5 6 5 5 6 03-7 years 1 3 3 2 3 1 4 2 12 08+years 1 1 1 1 0 2 0 0 1 0
Unknown 2 0 1 2 0 0 0 0 1 7Subtotal 11 7 8 8 8 9 9 7 20 7
Note: Lions in harvest year 2017 have yet to be aged
Note: Harvest does not include unknown aged lions. Lions in harvest year 2017 have yet to be aged.
(GMUs 54, 55, 56, 57)Oakley DAU
Males
Females
2017 Season (Fall 2017-Spring 2018)Square Miles: 3-Year Averages
Annual HarvestHarvest per 100 mi2
Males: Percent 3+ yrs*
0
10
20
30
40
50
60
2008 2010 2012 2014 2016
Harvest (min 3-yr average=12)
0
10
20
30
40
50
60
2008 2010 2012 2014 2016
% Female in Harvest
0%
20%
40%
60%
80%
100%
08-10 09-11 10-12 11-13 12-14 13-15 14-16
male <3
male 3-7
male 8+
female <3
female 3-7
female 8+
Three-year Average Mountain Lion Harvest
Figure 16 Oakley DAU status and objectives

46
SOUTHEAST REGION Pocatello DAU (GMUs 69, 70, 71, 72, 73, 73A, 74)
Historical Background The mountain lion was first classified as a big game species in Idaho in 1972. Mountain lion tags have been required since 1975. Mountain lion numbers are believed to have been low in the Southeast Region during the 1950s and 1960s when annual harvest in eastern Idaho averaged from 2 to 4 animals. Population information is sparse; however, increased sightings, increased depredations, and increased harvest all suggest that mountain lion populations have increased over recent historic levels. Populations of the main prey species, mule deer, fluctuate widely and are currently at moderate levels. A large livestock industry in southeastern Idaho and the concern for depredations has and will probably continue to influence mountain lion populations and management. From 1991–1997 and again from 1999–2000, the region was divided into a west district (GMUs 70, 71, 73, 73A, 74) and an east district (GMUs 66A, 72, 75, 76, 77, 78) with a female harvest quota for each district. In 1999, GMU 74 was moved from the western to eastern quota district. Quotas varied from 2 females per district to 15 in the west and 5 in the east district. GMU’s 70, 71, 73, and 73A served as ‘mountain lion harvest treatments’ for the mule deer research project conducted from 1998 through 2003. Management was intended to maintain relatively higher harvest compared to adjacent ‘control’ GMU’s with lower harvest levels (Hurley et al. 2011). Due to pressure from sportsmen’s groups and a commitment to the Mule Deer Initiative, the Department initiated a general lion season with no female quotas across the Southeast Region for the 2005–2009 mountain lion seasons. Starting for the 2010 Big Game Season, a female quota of 22 was established for the entire southeast region which includes GMUs from the Pocatello DAU (70, 71, 72, 73, 73A, 74), the Snake River DAU (68, 68A), and the Bear Lake-Palisades DAU (66A, 75, 76, 77, 78). Starting in 2017, the regional quota of 22 was divided into 4 clusters of GMUs to better align with DAUs and to distribute harvest more equitably. The female quota was removed from GMUs 68 and 68A. GMUs 76 and 66A had a quota of 5 females. GMUs 75, 77, and 78 had a female quota of 4 females. GMUs 71, 72, and 74 had a female quota of 5 females. Lastly, GMUs 70, 73, and 73A had a female quota of 8 females. Mountain lion harvest opportunity within the southeast region ceases once the female quota has been reached or at the closing date for that hunting season, whichever occurs first. If the female quota is reached prior to the closing date, pursuit-only opportunity is allowed until the close of the season. It is mandatory that all mountain lions harvested by hunters are checked and pelts tagged by the Department. Harvest data and characteristics are taken from these mandatory checks. Management Objectives The Department’s Mountain Lion Management Plan was rewritten in 2002. Management policy and strategy calls for maintaining viable populations of lions in Idaho while maintaining harvest

47
at levels at or above those of the early 1990s where appropriate. Harvest levels in that period were significantly lower than those of the mid-to late 1990s and early 2000s. Biological Objectives The current Mountain Lion Management Plan states that initial harvest goals will be to maintain the harvest level on a 3-year running average at or above the 3-year average harvest for the 1990–1992 big game seasons (6 lions). Capture, Radio-mark, and/or Telemetry No capture, radio-marking, or telemetry was conducted during this reporting period. Population Surveys and Monitoring No population surveys or monitoring occurred during this reporting period. Hunting and Harvest Characteristics The fall 2017–spring 2018 mountain lion take season was from 30 August through 31 March (Appendix A). Dogs remained prohibited from 1 October to 30 November in all of the Pocatello DAU. The female harvest quota was previously set at 22 for the entire southeast region. However, for the 2017-2018 big game seasons the regional quota of 22 was divided into 4 clusters of GMUs to better align with DAUs and to distribute harvest more equitably. In the Pocatello DAU GMUs 71, 72, and 74 had a female quota of 5 females, and GMUs 70, 73, and 73A had a female quota of 8 females. GMU 69 is in the Upper Snake Region and does not have a female quota. Reported harvest of lions from the Pocatello DAU for the fall 2017–spring 2018 season was 35; 22 males and 13 females (Figure 17). Hound hunting comprised 86% of the harvest this reporting period. Incidental harvest (generally lions taken while deer or elk hunting), still/stalk, and predator calling accounted for the remainder. The 3 year average (2014–2016) of male’s ≥3 year of age was 40%. Ages were not available for 2017 at the time of this report. Predation Issues Mountain lions are the dominant predator of ungulates in southeast Idaho. Current research and data do not suggest that predation by lions is the limiting factor for ungulates. Monitoring predation by lions, as well as other predators, on ungulate populations will continue to be an important factor for wildlife managers to consider. Depredation Issues Wildlife Services responds to mountain lion depredation issues in concert with the Department. One male mountain lion was removed by Wildlife Services for depredations during the reporting period.

48
Management Discussion During the period 1981–1990, the annual harvest of mountain lions in southeast Idaho was low (0–10). Seventeen mountain lions were reported harvested in 1990, prompting the establishment of a female quota beginning in 1991. As the quotas gradually increased during the 1990’s, the harvest increased significantly, reaching a high of 94 in 1998. Male/female ratios in the harvest have generally ranged between 1:1 and 2:1. Females comprised 37.1 % of the harvest in fall 2017–spring 2018. Tracking the age structure within the harvest to identify changes in mountain lion population structure will continue to be important. Low deer populations in the mid-1990s prompted many hunters to suggest that lion predation was a significant limiting factor and to favor reducing lion populations through increased harvest. The Department implemented a deer research project in southeast Idaho in 1998 which, in part, looked at whether varying levels of lion harvest influenced deer population response. Increased lion harvest did show some short term positive effect on deer survival, but did not indicate any change in population trends (Hurley et. al. 2011). Continuing concern for the Southeast Region’s mule deer herd resulted in the removal of the female harvest quota in previous years. This, however, generated concern among lion hunters regarding healthy lion populations and opportunities for future trophy lion hunting. During the season setting process in the spring of 2010, lion hunter comments unanimously favored some form of protection for the female portion of the lion population. As a result, in an effort to compromise between the lion hunting and mule deer hunting publics, a region wide female lion harvest quota was set at 22 females. However, in 2016 and 2017 the female quota was reached before the end of the take season with harvest inequitably distributed across the region. This prompted a division of the female quota amongst smaller clusters of GMUs for the 2017 and 2018 big game seasons to more equitably distribute female harvest from year to year.

49
Goal5,241 41 6
0.856% TBD
* Within male harvest 2014-2016
Harvest Statistics 2008 2009 2010 2011 2012 2013 2014 2015 2016 2017Total 33 33 37 38 41 44 22 49 38 35
0-2 years 8 2 10 13 14 7 7 11 10 03-7 years 7 11 13 10 9 17 6 14 16 08+ years 0 0 0 1 1 1 0 0 0 0Unknown 4 2 1 2 3 5 3 3 2 22Subtotal 19 15 24 26 27 30 16 28 28 220-2 years 4 6 5 7 4 4 3 8 3 03-7 years 6 5 2 5 5 7 1 8 4 08+years 1 3 2 0 0 1 0 1 0 0
Unknown 3 4 4 0 5 2 2 4 3 13Subtotal 14 18 13 12 14 14 6 21 10 13
Note: Lions in harvest year 2017 have yet to be aged
Note: Harvest does not include unknown aged lions. Lions in harvest year 2017 have yet to be aged.
(GMUs 69, 70, 71, 72, 73, 73A, 74)Pocatello DAU
Males
Females
2017 Season (Fall 2017-Spring 2018)Square Miles: 3-Year Averages
Annual HarvestHarvest per 100 mi2
Males: Percent 3+ yrs*
0
10
20
30
40
50
60
2008 2010 2012 2014 2016
Harvest (min 3-yr average=6)
0
10
20
30
40
50
60
2008 2010 2012 2014 2016
% Female in Harvest
0%10%20%30%40%50%60%70%80%90%
100%
08-10 09-11 10-12 11-13 12-14 13-15 14-16
Three-Year Average Mountain Lion Harvest
male <3
male 3-7
male 8+
female <3
female 3-7
female 8+
Figure 17. Pocatello DAU status and objectives
50
UPPER SNAKE REGION Snake River Plain DAU (GMUs 38, 45, 52, 52A, 53, 60, 60A, 61, 62, 62A, 63, 63A, 68, 68A)
Historical Background In general, these GMUs have marginal lion habitat, lack year-round prey sources, and lie on the margins of areas with established lion populations. Lion presence tends to be occasional transient lions from other areas having established territorial lion populations. Management Objectives Specific objectives regarding sex and age composition of the harvest have not been developed for this DAU. Objectives are to maintain harvest at or above the 1990–1992 average harvest level of 1.5 mountain lions as specified in the 2002–2010 Mountain Lion Management Plan. From 2015–2017, harvest averaged 12 lions per year. This level is 8 times higher than the 1990–1992 minimum harvest objective. Capture, Radio-mark, and/or Telemetry No activities meeting these criteria occurred in the Snake River Plain DAU for this reporting period. Population Surveys and Monitoring Population monitoring consisted of monitoring trends in harvest demographics (sex and age obtained from tooth cementum analysis) via mandatory checks of all harvested bears. Hunting and Harvest Characteristics Hunting seasons have varied from closed to 214 days with some having female quotas and others with no female quotas; however, none of these GMUs have had female quotas since the 2004 harvest season (Appendix A). Eleven mountain lions (6 males, 5 females) were harvested in the Snake River Plain DAU in 2017. Nine were harvested using hounds and 2 were incidental take. . Harvest has varied from 2–16 for the 1994–2017 seasons and has also varied from all male to all female. Age data for the 2017 harvest season are not yet available. The 3 year average from the most current age data available2014–2016) indicated that males ≥3 years old compromised 47% of the male harvest. Female harvest compromised 59% of the total harvest over the last three years (2015–2017). The number of females harvested decreased from 11 (69% of the harvest) in 2016 to 5 (45% of the harvest) in 2017. Predation Issues Predation by mountain lions is not a limiting factor for ungulate populations in the Snake River Plain DAU. Depredation Issues No lion depredation complaints were verified during this reporting period.
51
Management Discussion GMUs included in this DAU are managed by the Southwest (GMU 38), Magic Valley (GMUs 45, 52, 52A, and 53), Upper Snake (GMUs 60, 60A, 61, 62, 62A, 63, and 63A) and Southeast (GMUs 68 and 68A) regions. As stated in the historical section, this DAU is a population sink area for several adjacent areas that act as source populations for lions harvested in this DAU. Prior to 2004, hunting season restrictions varied between these administrative regions. As of 2009 it varies again with a female quota of 22 spread throughout the Southeast region’s GMUs. Hunter access, winter conditions, and vulnerability of lions to harvest also vary throughout this DAU. Therefore, it is difficult to manage lions in this DAU based on data collected. As long as harvest remains light and principally opportunistic, there is probably no need for more intense monitoring or management. Individual regions, especially Magic Valley Region, will need to monitor harvest for their GMUs to ensure it is consistent with local public desires.
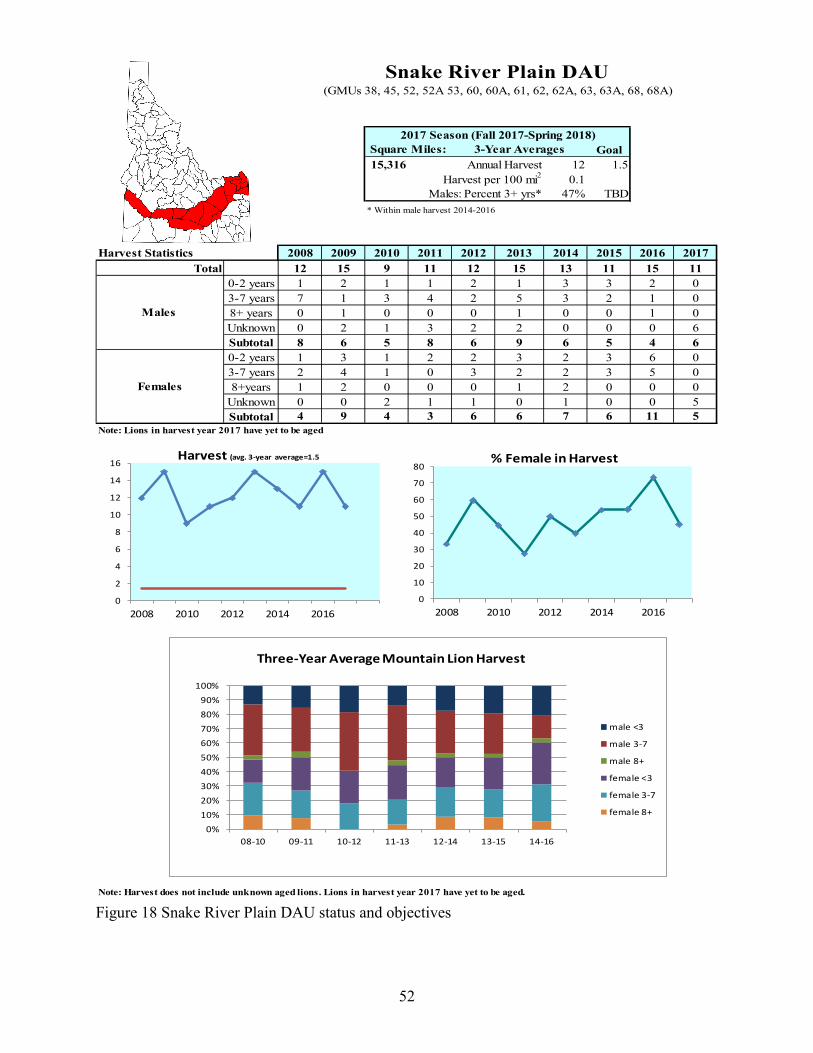
52
Goal15,316 12 1.5
0.147% TBD
* Within male harvest 2014-2016
Harvest Statistics 2008 2009 2010 2011 2012 2013 2014 2015 2016 2017Total 12 15 9 11 12 15 13 11 15 11
0-2 years 1 2 1 1 2 1 3 3 2 03-7 years 7 1 3 4 2 5 3 2 1 08+ years 0 1 0 0 0 1 0 0 1 0Unknown 0 2 1 3 2 2 0 0 0 6Subtotal 8 6 5 8 6 9 6 5 4 60-2 years 1 3 1 2 2 3 2 3 6 03-7 years 2 4 1 0 3 2 2 3 5 08+years 1 2 0 0 0 1 2 0 0 0
Unknown 0 0 2 1 1 0 1 0 0 5Subtotal 4 9 4 3 6 6 7 6 11 5
Note: Lions in harvest year 2017 have yet to be aged
Note: Harvest does not include unknown aged lions. Lions in harvest year 2017 have yet to be aged.
Snake River Plain DAU
Annual HarvestHarvest per 100 mi2
Males: Percent 3+ yrs*
(GMUs 38, 45, 52, 52A 53, 60, 60A, 61, 62, 62A, 63, 63A, 68, 68A)
2017 Season (Fall 2017-Spring 2018)Square Miles: 3-Year Averages
Males
Females
0
2
4
6
8
10
12
14
16
2008 2010 2012 2014 2016
Harvest (avg. 3-year average=1.5
0
10
20
30
40
50
60
70
80
2008 2010 2012 2014 2016
% Female in Harvest
0%10%20%30%40%50%60%70%80%90%
100%
08-10 09-11 10-12 11-13 12-14 13-15 14-16
Three-Year Average Mountain Lion Harvest
male <3
male 3-7
male 8+
female <3
female 3-7
female 8+
Figure 18 Snake River Plain DAU status and objectives

53
Bear Lake-Palisades DAU (GMUs 64, 65, 66, 66A, 67, 75, 76, 77, 78) Historical Background The mountain lion was first classified as a big game species in Idaho in 1972. Mountain lion tags have been required since 1975. Population information is sparse; however, increased sightings, increased depredations, and increased harvest all suggest that mountain lion populations have increased over recent historic levels. Populations of the main prey species, mule deer, fluctuate widely and are currently at moderate levels. A large livestock industry in eastern Idaho and the concern for depredations has and will probably continue to influence mountain lion populations and management. This DAU lies along the Idaho-Wyoming state line from the Teton Valley south to the Utah state line and is managed by both Upper Snake (GMUs 64, 65, 66, and 67) and Southeast (GMUs 66A, 75, 76, 77, and 78) regions. Management Objectives Specific objectives regarding sex and age composition of the harvest have not been developed for this DAU. The current Mountain Lion Management Plan states that initial harvest goals will be to maintain the harvest level on a 3-year running average at or above the 3-year average harvest for the 1990–1992 big game seasons. From 2015–2017, harvest averaged 36 lions per year. This level is 6 times higher than the 1990–1992 minimum harvest objective of 6 lions. Biological Objectives The current Mountain Lion Management Plan states that initial harvest goals will be to maintain the harvest level on a 3-year running average at or above the 3-year average harvest for the 1990–1992 big game seasons (6 lions). Capture, Radio-mark, and/or Telemetry No capture, radio-marking, or telemetry was conducted during this reporting period. Population Surveys and Monitoring During the fall of 2016, IDFG initiated a mountain lion research project in GMUs 75 and 77 targeted at using a new technique to estimate lion abundance. Remote cameras were deployed across predicted mule deer and elk winter range to detect lions. Simultaneously, houndsmen covered the same area and collected DNA samples from treed lions and/or from backtracking to pick up scat and hair samples. This project is ongoing and data sources will be analyzed for use of this technique to monitor mountain lion populations elsewhere. Hunting and Harvest Characteristics Hunting seasons have ranged from closed in some GMUs to liberal with no quotas in other GMUs. GMUs 64, 65, 66, and 67 did not have a female quota for the 2004 harvest season and from 2005–2009 none of the GMUs in the DAU had a female quota. From 2010–2016 the GMU’s in the Southeast region had a combined female quota of 22 (Appendix A). For the 2017 season, GMUs 66A and 76 had a combined female quota of 5.

54
Harvest has been quite variable and ranged from 12 in 1996 to 44 in 2016. Adult female harvest averaged 15% from 2014–2016. During the 2017season, 86% of successful mountain lion hunters used hounds, 9% of take was incidental, and 5% of take was still/stalk. From 2014–2016, 26% of the harvest were male lions under 3 years old, 31% were male lions 3 years and older, 28% were females under 3 years old, and 15% were females 3 years and older (Figure 19). Age data for harvested lions in 2017 are not yet available. Predation Issues Current research and data do not suggest that predation by lions is the limiting factor for ungulates. Monitoring predation by lions, as well as other predators, on ungulate populations will continue to be an important factor for wildlife managers to consider. Depredation Issues Wildlife Services responds to mountain lion depredation issues in concert with the Department. During this reporting period there were not any mountain lions removed by Wildlife Services for depredations. Management Discussion GMUs within this DAU are managed by Upper Snake and Southeast regions and were previously parts of other DAUs. Consequently, hunting seasons have varied from area to area and from year to year. However, in 2005, GMUs within this DAU had the same lion season with no female quotas. Since 2010 there have been female quotas applied to the GMUs in the Southeast Region. There is a need to monitor the percentage of adult females harvested closely. Anderson and Lindzey (2005) found that when the adult (≥3-year-old) female harvest averaged 25% or greater, the lion population declined. Our latest 3 year average (15%) is well below that threshold. Literature Cited Anderson, C. R. Jr., and F. G. Lindzey. 2005. Experimental evaluation of population trend and
harvest composition in a Wyoming cougar population. Wildlife Society Bulletin 33(1):179–188.

55
Goal3,928 36 6
0.954% TBD
* Within male harvest 2014-2016
Harvest Statistics 2008 2009 2010 2011 2012 2013 2014 2015 2016 2017Total 35 32 30 31 27 21 28 22 44 43
0-2 years 4 6 6 7 6 5 7 5 9 03-7 years 11 11 10 11 9 6 6 7 12 08+ years 0 0 0 0 0 0 0 0 0 0Unknown 2 3 1 2 1 1 2 1 5 30Subtotal 17 20 17 20 16 12 15 13 26 300-2 years 4 7 2 6 5 3 6 6 10 03-7 years 9 3 6 5 5 3 4 2 6 08+years 4 1 4 0 0 1 0 0 0 0
Unknown 1 1 1 0 1 2 3 1 2 13Subtotal 18 12 13 11 11 9 13 9 18 13
Note: Lions in harvest year 2017 have yet to be aged
Note: Harvest does not include unknown aged lions. Lions in harvest year 2017 have yet to be aged.
Annual HarvestHarvest per 100 mi2
Males: Percent 3+ yrs*
(GMUs 64, 65, 66, 66A, 67, 75, 76, 77, 78)Bear Lake-Palisades DAU
2017 Season (Fall 2017-Spring 2018)Square Miles: 3-Year Averages
Males
Females
05
101520253035404550
2008 2010 2012 2014 2016
Harvest (min. 3-yr average=6)
0
10
20
30
40
50
60
2008 2010 2012 2014 2016
% Female in Harvest
0%10%20%30%40%50%60%70%80%90%
100%
08-10 09-11 10-12 11-13 12-14 13-15 14-16
Three-Year Average Mountain Lion Harvest
male <3
male 3-7
male 8+
female <3
female 3-7
female 8+
Figure 19 Bear Lake Palisades DAU status and objectives
56
SALMON REGION Salmon DAU (GMUs 21, 21A, 28, 36B)
Historical Background Land ownership in the Salmon DAU is 95% Federally owned public and 5% private, with most private land occurring as agricultural and residential properties along valley bottoms. Approximately 11% falls within the Frank Church – River of No Return Wilderness. Elevations vary from 3,000 to 10,000 feet and include sagebrush grasslands, river breaks, mixed conifer forests, and sub-alpine habitats. The DAU supports mountain lion populations that are generally accessible during winter. Both deer and elk are abundant prey species with bighorn sheep and mountain goats locally available. Salmon DAU mountain lion populations are likely partly sustained by immigration from adjacent, less-hunted wilderness populations (e.g., Warren DAU). During 1995 and 1996, wolves were reintroduced in Salmon and Warren DAUs. Wolves are well established within the DAU, and a harvest season was implemented beginning in 2009. Depredation problems are not a major concern in Salmon DAU. Management Objectives Objectives are to maintain the distribution of mountain lions and harvest at or above the 1990–1992 average harvest level of 15 mountain lions as specified in the 2002–2010 Mountain Lion Management Plan. Specific objectives regarding sex and age composition of the harvest will be developed in the near future (e.g., ≤40% females in the harvest, ≥20% of males ≥5 years old). Capture, Radio-mark, and/or Telemetry No activities meeting these criteria occurred in the Salmon DAU for this reporting period. Population Surveys and Monitoring Population monitoring consisted of monitoring trends in harvest demographics (sex and age obtained from tooth cementum analysis) via mandatory checks of all harvested lions. Hunting and Harvest Characteristics During 1996–1997, the general mountain lion season in Salmon DAU was extended by 15 days from 31 January to 15 February. The 1999–2000 season was extended by another 60 days (30 Aug to 31 Mar) because of an apparent continued increase in mountain lion populations. With 16 days added to the beginning and 44 days at the end, total season length became 214 days. A female quota of 2 mountain lions was implemented for GMU 36B in this DAU beginning in the 2014 season. In general, dogs may be used when a firearm season for deer or elk is not open. Neither spotted young nor female mountain lions accompanied by young may be taken. There were no dog-training seasons in Salmon DAU GMUs. Seventeen mountain lions (10 males, 7 females) were harvested in the Salmon DAU during the 2017 season (Figure 20). The female quota was reached in GMU 36B during the 2017 season. The 2017 harvest slightly exceeded the previous 3-year average harvest (2014–2016; 16.3). The
57
2015–2017 average harvest of 18 is 20% above the minimum harvest objective of 15 for this DAU. The average harvest has been above objective for the past 7 years, although there has been a downward trend in average harvest over the prior 10 years from the high of 26 during 2008-2010. The majority of mountain lions harvested in the Salmon DAU during the 2017 season were taken with assistance of hounds (71%). The remaining harvest was attributed to still hunting or incidental to other hunting. Age data for the 2017 harvest season are not yet available. Three-year average age data from the most current analyzed years (2014–2016) indicated that the ≥3 year-old male age class comprised 73% of the total known-aged male harvest, and 52% of the overall harvest. Percent females in the harvest averaged 31% over the last 3 years (2015–2017). Three-year average (2014–2016) adult female harvest (>3 years old) comprised 60% of the total known-aged female harvest, and 13% of the overall harvest. Predation Issues The Salmon Elk Zone, which is comprised of the same GMUs as the Salmon Mountain Lion DAU, is considered highly limited by predation (IDFG 2014). Predation by mountain lions also likely plays a limiting role on deer numbers within this DAU. Mountain lion predation accounts for a significant proportion of known-caused radiocollared ungulate mortalities in this DAU. Depredation Issues No mountain lion depredations on domestic livestock were reported in the Salmon DAU in 2017. Management Discussion While still meeting the DAU harvest objective of 15 mountain lions, the 3-year average harvest has steadily declined over the prior 10 years. Over this period (2008–2016), adult female (>3) harvest has averaged 20%, and has also show a downward trend beginning in 2012. Total harvest density (0.7 mountain lions harvested/100mi2) is light to moderate relative to other mountain lion DAUs in the state, suggesting the declining harvest trend in this DAU may be due to factors relative to participation or success (e.g., fewer hound hunters, mild winters that are less conducive to hunting with hounds). However, female harvest in this DAU has historically been high, and may have some influence on current harvest trends due to the sensitivity of lion populations to female harvest.

58
Goal2,678 18 15
0.773% TBD
* Within male harvest 2014-2016
Harvest Statistics 2008 2009 2010 2011 2012 2013 2014 2015 2016 2017Total 24 33 21 15 17 23 11 20 18 17
0-2 years 5 6 1 8 4 6 2 4 3 03-7 years 9 11 11 2 4 8 6 8 10 08+ years 0 0 0 2 0 0 0 0 0 0Unknown 0 4 0 0 2 1 0 2 1 10Subtotal 14 21 12 12 10 15 8 14 14 100-2 years 2 7 2 1 1 2 2 0 2 03-7 years 4 2 6 1 5 1 0 2 2 08+years 2 3 1 0 1 3 0 2 0 0
Unknown 2 0 0 1 0 2 1 2 0 7Subtotal 10 12 9 3 7 8 3 6 4 7
Note: Lions in harvest year 2017 have yet to be aged
Note: Harvest does not include unknown aged lions. Lions in harvest year 2017 have yet to be aged.
(GMUs 21, 21A, 28, 36B)Salmon Zone DAU
Males
Females
2017 Season (Fall 2017-Spring 2018)Square Miles: 3-Year Averages
Annual HarvestHarvest per 100 mi2
Males: Percent 3+ yrs*
0
5
10
15
20
25
30
35
2008 2010 2012 2014 2016
Harvest (min 3-yr average=15)
0
5
10
15
20
25
30
35
40
45
2008 2010 2012 2014 2016
% Female in Harvest
0%
20%
40%
60%
80%
100%
08-10 09-11 10-12 11-13 12-14 13-15 14-16
male <3
male 3-7
male 8+
female <3
female 3-7
female 8+
Three-year Average Mountain Lion Harvest
Figure 20 Salmon DAU status and objectives

59
Borah DAU (GMUs 29, 30, 30A, 37, 37A, 51, 58, 59, 59A) Historical Background Land ownership in the Borah DAU is 86% Federally owned public and 13% private, with most private land occurring as agricultural and residential properties along valley bottoms. Elevations vary from 4,000 feet to 12,000 feet and include a large proportion of high desert shrub-steppe communities, as well as mixed conifer forests and sub-alpine habitats. This DAU receives much less precipitation, and therefore has less forest than DAUs farther north and west. Borah DAU supports a mountain lion population of low to moderate density that is generally readily accessible during winter. Both deer and elk are common prey species with bighorn sheep and mountain goats locally available. Depredation problems are an uncommon concern in the Borah DAU. Management Objectives Objectives are to maintain the distribution of mountain lions and harvest at or above the 1990–1992 average harvest level of 7 mountain lions as specified in the 2002–2010 Mountain Lion Management Plan. Specific objectives regarding sex and age composition of harvested mountain lions will be developed in the near future (e.g., ≤40% females in the harvest, ≥20% of males ≥5 years old). Capture, Radio-mark, and/or Telemetry No activities meeting these criteria occurred in the Borah DAU for this reporting period. Population Surveys and Monitoring Population monitoring consisted of monitoring trends in harvest demographics (sex and age obtained from tooth cementum analysis) via mandatory checks of all harvested lions. Hunting and Harvest Characteristics During 1996–1997, the general mountain lion season was extended from 31 January to 15 February in northern GMUs and to 31 March in southern GMUs. During 1999–2000, seasons throughout the DAU were extended to 30 August through 31 March (214 days) because of an apparent continued increase in mountain lion populations, to provide additional opportunity, and to allow archers to harvest mountain lions during standard deer and elk seasons. Female quotas were removed in southern GMUs starting fall 2003. There were no quotas or dog-training seasons in northern GMUs within the DAU. In general, dogs may be used when firearm seasons for deer or elk are not open. Neither spotted young nor female mountain lions accompanied by young may be taken. Twenty mountain lions (12 males, 8 females) were harvested in the Borah DAU during the 2017 season (Figure 21). The 2017 harvest declined slightly from the previous 3-year average harvest (2014–2016; 21). The 2015–2017 average harvest of 21 is 200% above the minimum harvest objective of 7 for this DAU. The average harvest has been above objective for the past 7 years, and has steadily risen from the 2008-2010 average of 11 mountain lions harvested.

60
The majority of mountain lions harvested in the Borah DAU during the 2017 season were taken with assistance of hounds (75%). The remaining harvest was attributed to still hunting or incidental to other hunting. Age data for the 2017 harvest season are not yet available. Three-year average age data from the most current analyzed years (2014–2016) indicated that the ≥3 year-old male age class comprised 55% of the total known-aged male harvest, and 36% of the overall harvest. Percent females in the harvest averaged 34% over the last 3 years (2015–2017). Three-year average (2014–2016) adult female harvest (>3 years old) comprised 55% of the total known-aged female harvest, and 18% of the overall harvest. Predation Issues Predation limitation is low in the Elk Zones that are overlapped by the Borah DAU (IDFG 2014), and is likely similar for other ungulate prey within this DAU. Some bighorn sheep populations may be locally effected by mountain lion predation. Depredation Issues No mountain lion depredations on domestic livestock were reported in the Borah DAU in 2017. Management Discussion Annual mountain lion harvest in the Borah DAU has steadily increased over the last 6 seasons and is currently well above minimum harvest objectives. Total harvest density (0.4 mountain lions harvested/100mi2) is relatively light, although a large portion of this DAU is composed of open sagebrush habitat that is poor mountain lion habitat and where harvest is minimal. Given the relatively high proportion of females in the harvest over the prior 10 years (38%) and the sensitivity of populations to harvest of this demographic, monitoring future trends in harvest rate and sex-age composition will remain a priority to determine if current harvest rates are sustainable.
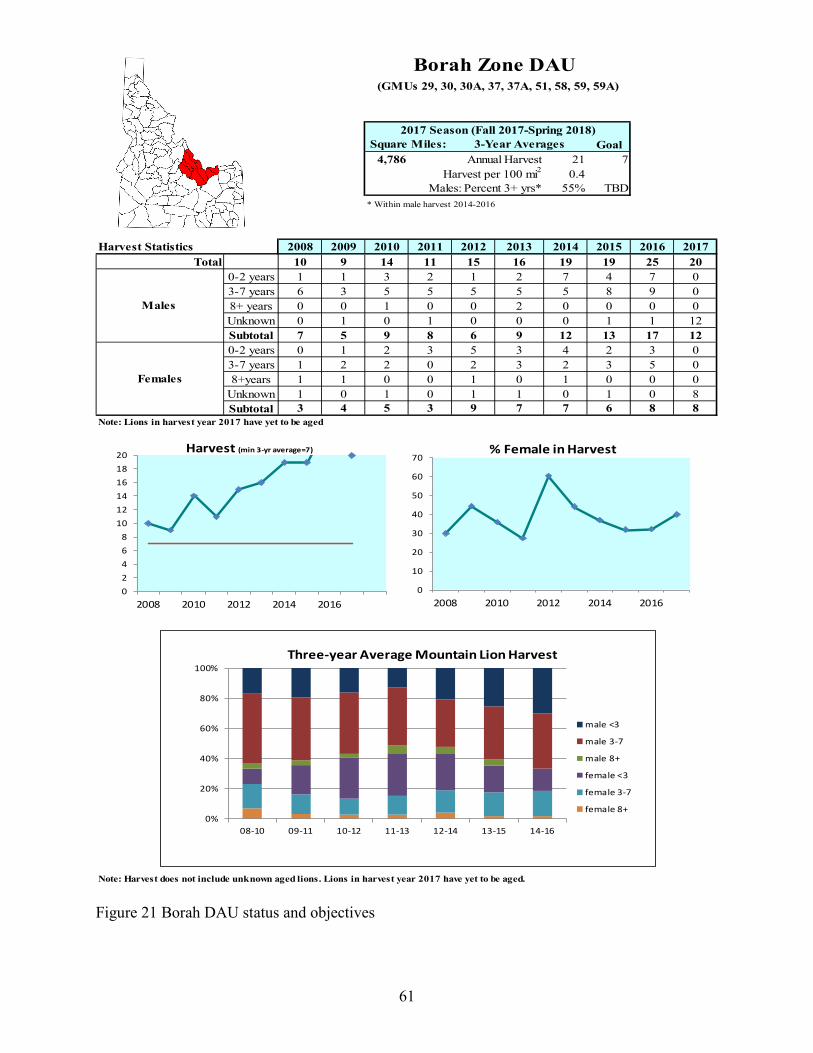
61
Goal4,786 21 7
0.455% TBD
* Within male harvest 2014-2016
Harvest Statistics 2008 2009 2010 2011 2012 2013 2014 2015 2016 2017Total 10 9 14 11 15 16 19 19 25 20
0-2 years 1 1 3 2 1 2 7 4 7 03-7 years 6 3 5 5 5 5 5 8 9 08+ years 0 0 1 0 0 2 0 0 0 0Unknown 0 1 0 1 0 0 0 1 1 12Subtotal 7 5 9 8 6 9 12 13 17 120-2 years 0 1 2 3 5 3 4 2 3 03-7 years 1 2 2 0 2 3 2 3 5 08+years 1 1 0 0 1 0 1 0 0 0
Unknown 1 0 1 0 1 1 0 1 0 8Subtotal 3 4 5 3 9 7 7 6 8 8
Note: Lions in harvest year 2017 have yet to be aged
Note: Harvest does not include unknown aged lions. Lions in harvest year 2017 have yet to be aged.
(GMUs 29, 30, 30A, 37, 37A, 51, 58, 59, 59A)
Borah Zone DAU
Males
Females
2017 Season (Fall 2017-Spring 2018)Square Miles: 3-Year Averages
Annual HarvestHarvest per 100 mi2
Males: Percent 3+ yrs*
02468
101214161820
2008 2010 2012 2014 2016
Harvest (min 3-yr average=7)
0
10
20
30
40
50
60
70
2008 2010 2012 2014 2016
% Female in Harvest
0%
20%
40%
60%
80%
100%
08-10 09-11 10-12 11-13 12-14 13-15 14-16
male <3
male 3-7
male 8+
female <3
female 3-7
female 8+
Three-year Average Mountain Lion Harvest
Figure 21 Borah DAU status and objectives

62

63

64

65

66
Submitted by: Wayne Wakkinen Clay Hickey Rick Ward Regional Wildlife Manager Regional Wildlife Manager Regional Wildlife Manager Regan Berkley Mike McDonald Zach Lockyer Regional Wildlife Manager Regional Wildlife Manager Regional Wildlife Manager Curtis Hendricks Greg Painter Regional Wildlife Manager Regional Wildlife Manager Approved by: IDAHO DEPARTMENT OF FISH AND GAME Toby Boudreau, Asst. Chief Scott Reinecker, Chief Bureau of Wildlife Bureau of Wildlife