moving away from prescriptive pachyderm palliatives
TRANSCRIPT

Moving Away From Prescriptive Pachyderm Palliatives: Toward an Integrated Assessment of FarmerElephant Conflict in Gabon
by
Kendra L. Walker
A dissertation submitted in partial fulfillment of the requirements for the degree of
Doctor of Philosophy (Natural Resources and Environment)
in The University of Michigan 2010
Doctoral Committee:
Professor Bobbi S. Low, chair Professor Arun Agrawal Professor Donald Scavia Professor Carl P. Simon

© Kendra L. Walker 2010

ii
Dedication
For my parents, Don and Trudi
For providing me a solid foundation, inspiration, and unwavering support of my dreams
And to Miguel, for his patience

iii
Acknowledgements
I would like to extend my deepest thanks to the many people have helped this
dissertation become a reality: to my family, for always encouraging my dreams and
journeys even though they all too often take me so far away, and to my committee
for guiding me through this leg of the journey. I am truly lucky to have such
motivating mentors. I could not have asked for a more attentive and inspirational
committee chair than Bobbi Low, who truly goes above and beyond as an advisor
and role model.
Arun Agrawal, Don Scavia, and Carl Simon have all provided engaging perspectives,
wise advice and great interdisciplinary discussions. Many others at the University
of Michigan have provided additional feedback and inspiration. I especially thank
Brady West and Kathy Welch at the Center for Statistical Consultation and Research
for invaluable statistical advice and Michael Moore and Rebecca Hardin for
insightful feedback on early versions of parts of this work.
I received financial support for this research from a Fulbright Fellowship with the
U.S. Department of State and from the International Institute and the Rackham
Graduate School at the University of Michigan.
In Gabon, I thank the Centre des Recherches Scientifique et Techniques (CENERSET)
for permission to conduct the necessary fieldwork and Wildlife Conservation
Society for providing much technical and logistical support. I could not have
accomplished as much in the field without the invaluable assistance and
encouragement of Guy Mabika. I am also forever grateful to the farmers and
authorities of the 38 villages I stayed in for making this research possible and for
their tremendous hospitality. The following people all provided critical logistical
support and generous hospitality in the villages:

iv
M. MEYE Brice Léandre, Conservateur du Parc National de Moukalaba‐Doudou
M. NZENGUE‐NZENGUE Antoine, Chef de Brigade de la Faune et la Chasse, Mourindi.
M. BOUESSI Anselm et M. MATSIENDI Judicaël
Feu KONDI, chef du village Dighoudou (en 2005), et femme
M. BOUTAMBA Paul et famille à Doussala
Mme ITSEMBOU Genevieve, Chef du village de Paghou‐Nzambi
M. KOUMBA Pierre, Chef du village, de Louango et femmes
M. IBWILI, Etienne, Chef du village de Maborigha et famille
Papa KOMBILA‐IBOANGA Emile et famille à Ndenga
M. IMOGOU Gaston, Chef de regroupement de Tono
M. MABYALLA‐BOUSSAMBA Alexandre, Chef de canton (jeune)
Richard Parnell & Aimee Sanders of WCS
Mme. NGOUESSONO Solange, Conservatrice du PN de Mayumba
M. NZASSI Souami, Eco‐guard à Mayumba
Mme. KAMSI‐NZINGA Elize et famille à Yoyo
M. SAFOU‐KOUMBA Antoine, 1ère Vice Président de l’Assemblée Départemental, et famille
M. NGOMA‐MAKAYA André, Chef du cartier Centreville, et famille
M. KOUMBA‐MBOUMBA Norbert, Chef du village, RinaNzala et famille
M. MAKAYA‐MBOUSSOU Nicholas, Chef du Canton de Tiya, et famille
M. MBOUMBA‐MPASSI Hilare, Chef du village, Mallembé et femmes
M. KOUMBA Raymond et famille à Mambi
M. MAVOUNGOU‐MAKANGA Félicienne, Chef du village de Mambi
M. TCHIKAYA‐OZINGA Zidore, Chef du village Mangali, et famille
Mme KOUMBA‐MOITI Agathe, Chef du Village de Lubomo
Mme MAGANGA‐PAMBOU Jaqueline, Chef du village de Panga
M. MIHINDOU Gildore, Chef du village, de Bibioa et famille
M. NGOWOU Joseph, Conservateur du parc National de La Lopé
Mme MBOUMBA Marie‐Paule et l’équipe outreach de WCS
M. MOAMBOE Etienne, chef de regroupement Kazamabika, et famille
Papa BONGOLO George, chef de regroupement de Mikongo, et femmes
M. MOKOKOU Jean Jaques, chef de regroupement de Makoghé
M. HEGA Martin de WCS
M. NDONG‐ALLOGHO Hervé, Conservateur du PN des Monts de Cristal

v
M. Antonio et Mr. ENGOANG Nicholai, Chef de village de Avang
Mme. ANGUE‐ONA Anoinette, chef de regroupement Assok
M. OBAME‐NDONG Jerome, Chef de village de M’Veng‐Ayong
M. NDONG Michel, Chef de village Ayeme Aoula et famille
M. Le Chef du village de Matek‐Mavi et femme
Mam’Oyan d’Alarmatek, a truly inspirational character
PEINDI Edmund et Stevens of WCS
M. BETI à l’hôtel Nyonie
Maman MBOUMBA Jeanne
Mme. KOUMBA‐MAWILY Pirette et famille
Paul Telfer & Michel IKAMBA of WCS, Plateaux Batekés
M. Eugene, chef de regroupement Onkoua, et sa femme,
Maman OKOMI Jeanne
M. ZONG Michel, Chef de Regroupement de Momo et famille
M. ZE‐OMABE Jules, Chef de regroupement de Mbome et famille
M. EKOUME‐OBAME Pierre, Chef de Regroupement Gabonville
M. MINKO Paul, Chef de cartier Eboboro à Konossoville, et famille
M. MEYE M’BA Jean Fosten, chef du village Mindzi, et famille
Mme. Albertine à Lalara
vi
Table of Contents
Dedication ii
Acknowledgements iii
List of Tables vii
List of Figures viii
List of Appendices ix
Chapter
1. Introduction: an overview of the dissertation 1
2. Benefit‐cost analysis of methods to reduce crop‐raiding by elephants in Gabon
10
3. When coping with crop‐raiding may be more rational than protecting crops: empirical findings in Gabon
33
4. A choice experiment of farmers’ willingness to pay for protection methods against crop‐raiding elephants in Gabon
52
5. Modern Gabonese use of “village” and implications for farmer‐elephant conflict
70
6. Conclusion: Toward an integrated assessment of farmer‐ elephant conflict in Gabon
86
Appendices 110

vii
List of Tables
Chapter 2.
2.1 Variables used in benefit‐cost model 14 2.2 Summary of optimal strategies in benefit‐cost model 18 2.3 Farmers' estimated expected crop loss to elephants and rodents 19 2.4 General information and value estimates for prototype crop systems 21 2.5 Costs of planting for prototype crop systems 21 2.6 Costs of five methods of protecting crops from elephants 23
Chapter 3. 3.1 Response and predictor variables in protection and coping models 40 3.2 Cluster‐size models for farms without protection 48
Chapter 4. 4.1 Attributes presented in choice experiment 55 4.2 Characteristics of choice experiment participants 60 4.3 Aggregate utility values for protection costs 63 4.4 Odds of package rejection model 64 4.5 Decision strategies of choice experiment participants 65
Chapter 5. 5.1 Urbanization trends in Gabon 73 5.2 Average farm size (ha) over time 73 5.3 Age of rural farmers, 1960 vs. 2007 74 5.4 Composition of sample for community and mobility interviews 76 5.5 Identity with “home”(Chez moi) in Gabon 76 5.6 Farmers and experience farming, current and future 78
Chapter 6. 6.1 Goals aligning agencies in common interest to mitigate farmer‐
elephant conflict 89
6.2 Some* agencies/stakeholders interested in farmer‐elephant conflict in Gabon
90
6.3 an outline of potential strategies and research needs to mitigate farmer‐elephant conflict
95

viii
List of Figures
Chapter 1.
1.1 Farmer‐elephant conflict study sites in Gabon 9
Chapter 2.
2.1 Costs of protecting A) plantain and B) manioc parcels for five protection strategies compared with costs of planting extra to buffer losses
25
2.2 Efficiency level at which net benefits of protecting plantain plots are positive (top row) and outweigh net benefits of planting extra (bottom row)
26
2.3 Effect of cooperation on net benefit of protection methods 27
Chapter 3.
3.1 Significant variables for strategies of protecting from or coping with crop raiding
42
3.2 Farm size models for existing farms without protection 48
ix
List of Appendices
A Variation in estimates of crop value and yield for Gabon 110
B Farm protection and coping models 111
C Choice experiment design 114
D Community and mobility questionaires 116
1
Chapter 1.
Introduction: an overview of the dissertation
I began this dissertation research after three years as an Environmental Educator
with the Peace Corps in Lopé National Park, Gabon. If the occasional elephants in
my backyard and the constant buffalo in the driveway in Lopé were not enough to
clue me in on the potential difficulties of sharing space with large wildlife, farmers in
the neighboring villages I visited made sure to remind me at every opportunity.
Gabon had just formalized a network of 13 national parks, of which Lopé was the
most experienced forerunner. Despite relatively intact infrastructure and research
programs, however, Lopé still faced many obstacles to becoming the tourism
success President Bongo envisioned (Bongo 2002).
This dissertation work was motivated in part by my own passion for understanding
and optimizing people/protected‐area interactions, and in part by request of several
of my colleagues at Wildlife Conservation Society, who were concerned with the
negative community‐park relations caused by farmer‐elephant conflict. My specific
questions and methods were most influenced by conversations with farmer‐
elephant conflict experts elsewhere in Africa. One particular e‐mail neatly
summarizes the view echoed by many:
“The only people in a position to address crop loss is the individual farmer. It seems in Gabon that people are some way from accepting responsibility. I believe that low tech methods made from material that can be sourced on site is the only way any method or deterrence system will be taken up by a farmer or village. …I don't even sympathize with a farmer who lost their crops to elephants if they were not guarding their fields They are growing food in elephant habitat, of course the animals will eat it they know that. People have to change.”
This perspective has inspired great creativity and helped many farmers throughout
Africa to discover and implement such low‐tech methods. My intent is not to
villainize this perspective; however, I do hope to expand it by adding tools to assess
the conditions under which such low‐tech methods may or may not be taken up by
farmers, and to explore other potential mitigation options in the case of the latter.

2
The need for more tools became apparent to me as I looked around Gabon, at these
experts’ urging, for farmers innovating or using low tech methods to protect against
elephants; I found almost none1. I did not look everywhere, and certainly there are
innovative farmers in Gabon, although innovation might not always lead to the kinds
of protection concerned agencies may hope for2. Likewise, while I observed some
small projects implemented by agencies to help farmers protect crops against
elephants, most notably fencing projects by World Wildlife Fund and fenced
community gardening projects by a few groups affiliated with the Ministry of
Agriculture, these projects suffered notable lack of uptake and follow‐through by
farmers. Electric fencing projects failed due to lack of maintenance by the farmers
involved3; donated fencing materials were not transferred to new parcels the
subsequent year4; community garden projects deteriorated due to disagreement
over who would pay for fencing and other materials the following year5.
Farmers’ lack of innovation, uptake, and continuation of methods to protect crops
against elephants may suggest that elephants are not a real threat to agriculture in
Gabon. The few available reports regarding assessments of actual damages seem to
support this possibility. Languy (1996) estimated that elephants destroy less than
one percent of crops near the Gamba complex. Although reporting substantial
variation in estimates for the same area, Blaney et. al. (1998) produce a maximum
estimate of 6% loss, which still may be low enough to provide farmers with little
motivation to protect crops. However, both of these studies involved small sample 1 The protection methods I did find, aside from a few projects funded by outside agencies, consisted of string‐and‐tin‐can fences and burnt tires, which the proprietors themselves claimed did not work. 2 For example, innovation can also lead to the conversion of D‐batteries into “elephant bullets” for shotguns, which I witnessed more often than I witnessed other effective protection methods against elephants. 3 Electric fences installed by World Wildlife Fund in Sette Cama and Gamba in 1997 failed after the first few years due to lack of maintenance (Mba, pers. com). Throughout Africa, electric fences have seen mixed success in deterring elephants (Thouless & Sakwa 1995; de Boer & Ntumi 2001; Omondi et al. 2004); however, they are generally inhibitive due to initial expenses and maintenance demands (Osborn & Parker 2002; Okello & D'Amour 2008). 4 For example, logging cable donated and installed by World Wildlife Fund in Moukoualo and Mourindi effectively deterred elephants during the year of study (Mba, pers. com; farmers, pers com) but was not continued in subsequent years when farmers’ own labor was required for installation. Despite this lack of uptake, projects following the same framework were being set up in Panga when I visited in 2006. 5 For example, the community garden of Ayem in 2007, supported by the Ministry of Agriculture
3
sizes over relative short periods of time. Both also conclude that crop‐raiding
intensity varies substantially by location; while most farms are relatively unaffected
by elephants, some are at high risk. A study by Lahm (1996) extends this
observation to the national level; although farmers cited cane rats more frequently
than elephants as a primary raider, elephant raiding was widespread in three
provinces and observed raiding events often resulted in destruction of a large
percentage of the farmer’s crops. Despite these losses, over a third of farmers who
lost crops to elephants did nothing to deter them.
In the decade following these preliminary studies, little seems to have changed in
Gabon regarding the methods used by farmers and agencies to deter elephants from
raiding crops, although it is clear that some areas are hard hit by crop‐raiding. Most
farmers I met knew of low‐tech options yet chose not to implement them. Why
would farmers who lost crops to elephants choose not to implement low‐tech
protection methods that were available to them? This was the driving question
behind the research presented here. By exploring decision‐making by Gabonese
farmers in the context of farmer‐elephant conflict, my goal was to gain insight into
the characteristics and circumstances of adoptable protection strategies and to
thereby assess the potential for various methods to mitigate farmer‐elephant
conflict in Gabon.
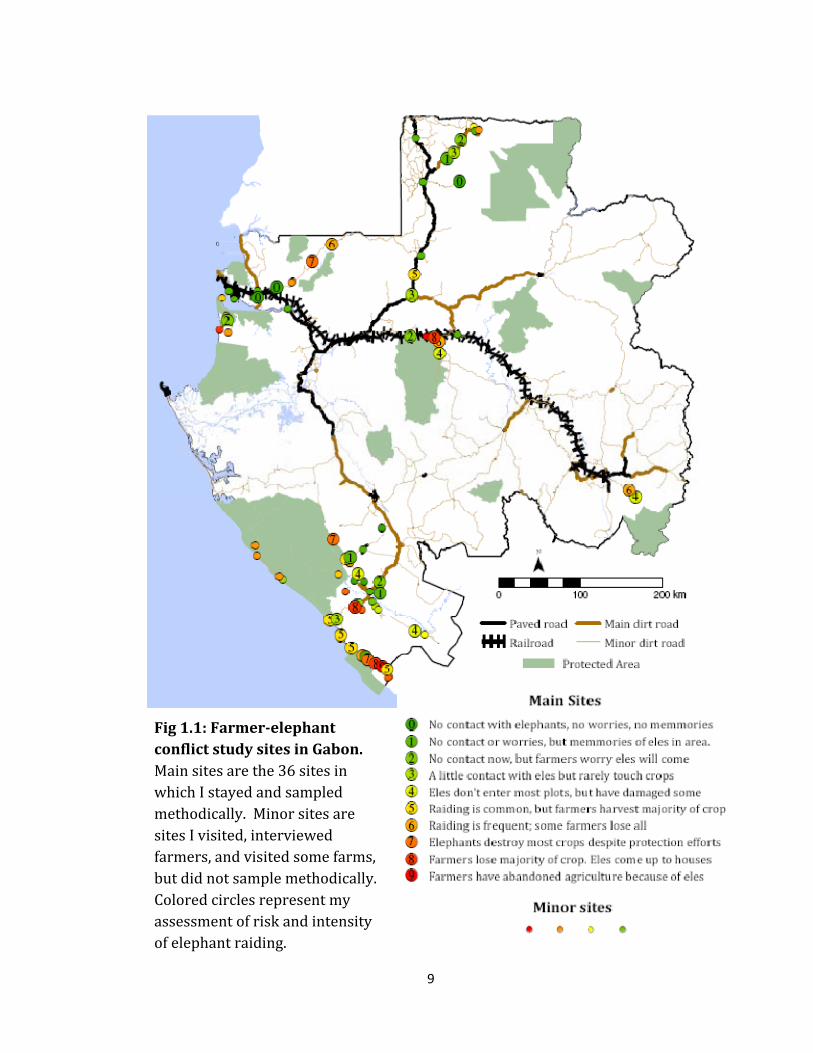
I spent two years in the field between 2005 and 2008 exploring farmer decision
making and farmer‐elephant conflict through various frameworks and
methodologies. Most of my time was spent observing and interviewing farmers in
villages throughout Gabon (Figure 1.1). I also interviewed other agents interested
in farmer‐elephant conflict including hunters, agricultural technicians, and
conservation practitioners. In my time between villages, I interviewed urban
residents to help situate my understanding of Gabonese agriculture and farmer‐
elephant conflict in their larger social settings.
Although planting practices have remained remarkably static, culture surrounding
agricultural systems has changed drastically in the several generations spanning

4
independence, from shifting camps that grew crops as a compliment to hunting
(Lahm 1993; Pourtier 1989), to sedentary villages practicing swidden agriculture
within walking distance. This process was initiated by colonial and Gabonese
governments as the direct result of a regroupement policy that forced people to
move to villages along the roads for better governance and access to services
(Pourtier 1989). As common throughout Africa (Berry, 1993), post‐colonial tends
in labor diversification and migration to urban centers for schools and jobs have left
farmers with scarce labor resources. These processes thus bring to the forefront the
issue of labor in farmers’ decision‐making.
The implicit assumption that a low‐tech method of protecting crops from elephants
is low cost generally only applies if labor costs are not considered. The next three
chapters are dedicated to this subject. In chapter two, I develop a theoretical model
to allow for accounting for labor costs in addition to monetary costs when assessing
costs and benefits of farm protection. In chapter three, I test this model against
empirical observations and elaborate on other factors that impact the likelihood of a
farmer using one of various strategies for protecting against or coping with raiding.
Because I observed so few cases of protection, I move from the empirical to the
hypothetical in chapter four, to explore farmers’ willingness to pay different kinds of
costs for protection strategies that might one day become available.
The fact that the majority of my work focuses on the level of the individual farmer
reflects the fact that solutions presented in the farmer‐elephant conflict literature
almost invariably focus at this level, as do organizations interested in mitigating
farmer‐elephant conflict. However, if we find that farmers are unwilling to accept
the extra costs, or “responsibilities,” yet would like them to continue farming or to
farm even more (Ministère de l’Agriculture 2007; République Gabonaise 2001,
2003), and to stop practicing the potentially cheaper strategy of killing elephants
(Blake et al. 2008), a new strategy may be required. Colleagues studying farmer‐ or
rancher‐wildlife conflict in the developed world could offer new insight and tools;
such literature generally takes for granted that farmers do not take responsibility

5
for costly wildlife protected by the State6 (e.g. Moberly et al. 2004; Naughton‐Treves
et al. 2003); tools used in these contexts, such as benefit‐cost analyses and
integrated assessments, could help decision‐makers imagine other options.
The applicability of many solutions proposed for other parts of the world is not
immediately apparent in the context of the developing nations faced with farmer‐
elephant conflict, however. The potential for and consequences of new strategies
need to be explored within the specific context where they might be applied. In
Chapter five, I discuss some of the processes and issues that decision‐makers would
need to consider as they begin shifting focus out to village‐ and landscape‐level
solutions. Specifically, I explore how mobility and modern concepts of “village” have
influenced and might continue to influence farmer‐elephant conflict in Gabon.
Methods of focusing out even further, to explore potential solutions at larger
geographical and temporal resolutions, might include using GIS and agent‐based
modeling. For the purpose of this work, however, I conclude with recommendations
for an Integrated Assessment in chapter six, to begin the process of imagining new
strategies to move forward in addressing farmer‐elephant conflict in Gabon, taking
into account the mandates and needs of the various stakeholders and interested
parties.
Such an Integrated Assessment is ambitious. However, I do not believe that it is
more ambitious than trying to change farmers’ behaviors if they are indeed acting
rationally. Integrated problem‐solving, involving multiple stakeholders and
perspectives, offers a more fruitful path to finding lasting solutions and to
developing the institutions and skills necessary to adapt to constantly changing
social‐ecological systems (Berkes et al. 2003; Costanza et al. 2001; Folke et al. 2002).
6 I have yet to come across a serious solution proposal to human‐carnivore conflict in the United States entailing ranchers sleeping with their sheep or cattle as their ancestors used to do.

6
The title of this dissertation borrows from a work of another expert on farmer‐
elephant conflict:
"Most attempts to tackle cases of elephant crop raiding are searches for an effective palliative an aspirin for that particular situation. But the elephants will always return unless a longterm solution is found by addressing the underlying causes of the problem.” (Barnes 2002)
Here, I provide some tools to help distinguish between aspirin and real solutions. If
we find that we are really pushing palliatives, or even proposing solutions that
further aggravate farmer‐elephant conflict in Gabon, we need to be willing to dig
deeper into the underlying issues. I provide some tools and perspectives, but I do
not provide the miraculously simple, low‐cost solution that my colleagues might
have hoped for; the solution, I believe, lies in the will of the decision‐makers.
7
Cited References
Barnes, R. F. W. 2002. Treating crop‐raiding elephants with aspirin. Pachyderm 33:96‐99.
Berkes, F., J. Colding, and C. Folke 2003. Navigating Social‐Ecological Systems. Cambridge University Press, Cambridge.
Berry, S. 1993. No condition is permanent: the social dynamics of agrarian change in sub‐
Saharan Africa. University of Wisconsin Press, Madison, Wisconsin.
Blake, S., S. Strindberg, P. Boudjan, C. Makombo, I. Bila‐Isia, O. Ilambu, F. Grossmann, L. Bene‐Bene, B. de Semboli, V. Mbenzo, D. S'hwa, R. Bayogo, L. Williamson, M. Fay, J. A. Hart, and F. Maisels. 2008. Forest elephant crisis in the Congo Basin. PLoS Biology 5:0945‐0953.
Blaney, S., S. Mbouity, P. Nzamba, J. Nkombé, M. Thibault. 1998. Complexe aires protégées de Gamba: caractéristiques socio‐économiques du département. WWF CARPO, Libreville.
Bongo, El Hadj Omar. 2002. Introduction. in National Geographic Society and Wildlife Conservation Society, editors. Les parcs nationaux du Gabon : Stratégie pour le troisième millénaire. Imprimerie Multipress, Libreville.
Costanza, R., B. S. Low, E. Ostrom, and J. A. Wilson. 2001. Ecosystems and human systems: a
framework for exploring the linkages. Pages 3‐20 in R. Costanza, B. S. Low, E. Ostrom, and J. A. Wilson, editors. Institutions, Ecosystems, and Sustainability. Lewis Publishers, Boca Raton, FL.
de Boer, F., and C. P. Ntumi. 2001. Elephant crop damage and electric fence construction in
the Maputo Elephant Reserve, Mozambique. Pachyderm 30. Folke, C., S. R. Carpenter, T. Elmqvist, L. H. Gunderson, C. S. Holling, and B. H. Walker. 2002.
Resilience and sustainable development: Building adaptive capacity in a world of transformations. Ambio 31:437‐440.
Lahm, S. A. 1993. Ecology and Economics of Human/Wildlife Interaction in Northeastern
Gabon. PhD Dissertation. New York University, New York.
Lahm, S. A. 1996. A nationwide survey of crop‐raiding by elephants and other species in Gabon. Pachyderm 21:69‐77.
Languy, M. 1996. Suivi et atténuation de l'impact des éléphants et autres mammifères
sauvage sur l'agriculture au Gabon. Rapport final. WWF Programme pour le Gabon. Mba, M. 2005. Chef de Surveillance, Ministère des Eaux et Forêts, Direction de la Faune et la
Chasse, Gamba. Ministère de l’agriculture. 2007. Projet de mis en place d’un échantillon maitre au Gabon
République Gabonaise, Libreville.

8
Moberly, R. L., P. C. L. White, C. C. Webbon, P. J. Baker, and S. Harris. 2004. Modelling the costs of fox predation and preventative measures on sheep farms in Britain. Journal of Environmental Management 70:129‐143.
Naughton‐Treves, L., R. Grossberg, and A. Treves. 2003. Paying for Tolerance: Rural Citizens' Attitudes toward Wolf Depredation and Compensation. Conservation Biology 17:1501‐1511.
Okello, M. M., and D. E. D'Amour. 2008. Agricultural expansion within Kimana electric fences and implications for natural resource conservation around Amboseli National Park, Kenya. Journal of Arid Environments 72:2179‐2192.
Omondi, P., E. Bitok, and J. Kagin. 2004. Managing human‐elephant conflicts: the Kenyan
experience. Pachyderm 36:80‐86. Osborn, F. V., and G. E. Parker. 2002. Living with elephants II: a manual. Page 21. MZEP, 37
Lewisam Ave, Chisipte, Harare, Zimbabwe. Pourtier, R. 1989. Le Gabon. Tome 2: Etat et Développement. Editions L'Harmattan, Paris.
République Gabonaise. 2001. Bilan Commun de Pays, CCA. United Nations, Libreville, Gabon.
République Gabonaise. 2003. Objectifs du Millénaire pour le Développement: Premier Rapport National. Ministère de la Planification et de la Programmation du Développement; United Nations, Libreville, Gabon.
Thouless, C. R., and J. Sakwa. 1995. Shocking elephants: fences and crop raiders in Laikipia
district, Kenya. Biological Conservation 72:99‐107.
9
Fig 1.1: Farmerelephant conflict study sites in Gabon. Main sites are the 36 sites in which I stayed and sampled methodically. Minor sites are sites I visited, interviewed farmers, and visited some farms, but did not sample methodically. Colored circles represent my assessment of risk and intensity of elephant raiding.

10
Chapter 2
Benefitcost analysis of methods to reduce cropraiding by elephants in Gabon
Abstract:
Cropraiding by elephants can be a major risk for farmers in central Africa. Despite
overwhelming consensus on the need to reduce cropraiding and decades of research
invested, efforts have had little success. Such efforts have consistently involved
prescriptive “lowcost” protection methods at the level of the individual farm,
assuming that rational farmers will adopt such methods once provided required
knowledge and skills. Here, I present a benefitcost analysis that considers both
monetary and labor costs of such strategies in comparison with the alternative coping
strategy of planting more to compensate expected losses. I find that proposed
protection strategies are generally inferior to coping strategies in situations where
farmers expect to lose less than half of their unprotected crops to elephants. Where
expected losses are higher, proposed protection strategies may be superior, depending
on technological efficiency and cooperation among farmers. This analysis is based on
interviews and farm observations with 426 farmers in 36 villages in Gabon, but frames
a general reflection process regarding technology adoptability that applies anywhere.
Introduction:
Elephants can destroy an entire year’s work of crops in a single visit, threatening not
only farmers’ livelihoods but also the elephants themselves when angry farmers
retaliate. While formal research on methods to mitigate farmer‐elephant conflict is
in its infancy in Gabon, several localities across Africa offer longstanding
experiments from which concerned agencies can garner much. When considering
farm‐level protection methods (the most popular mitigation

11
technique) however, transferability of technologies should be examined with care
before encouraging farmers to adopt them. Questions of transferability take two
forms: 1) functionality and efficiency of the technologies in a new ecological setting,
and 2) feasibility and adoption potential in different social and economic situations.
Ideally, both types of transferability should be assessed simultaneously for each
proposed solution in each locality; constraints on time and resources, however,
render such a thorough assessment unrealistic. Here, I use a simple economic
framework, narrowing the range of possible solutions to ensure that limited time
and resources are spent researching those methods with the highest likelihood of
being adopted by farmers.
The success of a mitigation scheme depends as much on farmer adoption as it does
on effectiveness of the technology. A solution that is effective in keeping elephants
out, but is unattractive to farmers for cultural or economic reasons, is as useless as
an ineffective solution. Economic benefit‐cost analysis provides a framework for
predicting likelihood of adoption using the principles of 1) economic threshold: act
only if the benefits of acting outweigh the costs, and 2) input/output optimization:
when choosing among multiple options, choose the one that maximizes net benefits.
Under this framework, farmers can be expected to adopt a given protection method
if: the expected benefits exceed the expected costs, or in other words, if the
expected losses without the protection strategy are greater than the expected losses
with the protection strategy minus the costs of implementing the protection
strategy, and if these net benefits are higher than for any other available option.
Economic threshold and input/output optimization are prominent principles in the
agricultural decision‐making literature, spanning insect management (e.g. Mumford
& Norton 1984; Pedigo et al. 1986), weed control (e.g. Wiles 2004; Wilkerson et al.
2002), and crop choice (e.g. Janssen 2007). Such theories are clearly applicable to
farmer‐decision making regarding wildlife (Moberly et al. 2004) and have been used
to assess the tradeoffs of farming in areas of high elephant densities versus areas
with lower densities (Kamonjo et al. 2007). Economic considerations appear often
in farmer‐elephant conflict literature in the sense that “high‐cost” protection

12
methods requiring expensive materials are generally dismissed as impractical for
individual farmers (de Boer & Ntumi 2001; Osborn & Parker 2002, 2003). Broadly
missing from the farmer‐elephant conflict literature, however, is a discussion of the
economic value of labor and the need to account for labor costs in addition to
monetary costs when predicting farmer uptake of protection methods.
Household labor is one of the most important inputs to small‐scale swidden
agriculture (Ruthernberg 1976) and has been shown to substantially impact
agricultural decision‐making and output under conditions similar to those in Gabon
(Elad & Houston 2002). It is therefore not surprising that labor costs and
constraints influence farmers’ decisions about adopting new technologies (White et
al. 2005). When calculating input/output ratios for plantation protection methods,
it is just as reasonable to expect farmers to choose a method that maximizes outputs
for a given level of labor input as it is for a given level of monetary input.
Incorporating traditionally‐unmeasured labor costs in a benefit‐cost analysis
framework provides insight into why farmers have rejected proposed crop
protection methods in the past and helps predict whether they are likely to accept
similar solutions under development for the future. While some methods, such as
fences or guards, might be relatively effective in reducing losses, the costs of
implementation may be such that less effective coping strategies, such as planting
multiple parcels to distribute risk or planting larger parcels to buffer against losses,
offer greater net benefits and thus more appealing options. More appealing does
not mean ideal, however; farmers who opt for coping strategies will likely still be
upset when elephants raid their crops. However, convincing a farmer to adopt a
protection method with a lower net benefit is probably futile. Below, I demonstrate
the role of benefit/cost analysis in predicting farmer uptake of farm protection
methods using data on small‐holder farming systems in Gabon.

13
Methods:
RESEARCH LOCALITY: I observed farms and interviewed farmers in 36 villages across
Gabon, mostly in the northern, central, and southwest regions. These sites included
26 villages with current exposure to elephants and ten control sites having no
current contact with elephants. Gabon is primarily forested and contains one of the
densest populations of African forest elephants, Loxodonta cyclotis (Barnes 1997;
Blake et al. 2008). Gabon’s human population, however, is among the least dense,
with an average of four persons per square kilometer. Over 70% of people live in a
handful of urban centers (République Gabonaise 1993), leaving the rural
countryside very sparsely populated. Despite this small rural population, rural
farmers are responsible for 80% of Gabon’s agricultural production (Nguema 2005).
Rural agriculture is almost always rain fed and swidden, with a one to two‐year
production cycle and a five to thirty‐year fallow period. Men clear the new farm and
are traditionally responsible for protecting it against wildlife, while women do most
of the planting, weeding and harvesting. Although farmers have battled crop‐
raiding wildlife for generations in Gabon, recent government protection of
conspicuous crop‐raiding animals such as elephants has brought farmer‐wildlife
conflict issues to the spotlight. Other top raiders include cane rats, mandrills,
gorillas, chimpanzees, buffalo, and bush pigs (Lahm 1996).
MODEL OVERVIEW: Based on my own observations and reports from various
institutions, I estimated costs (monetary and labor) of different strategies of
protecting crops from elephants as well as benefits of such protection. Under the
general basis of benefit‐cost analysis, a farmer is expected not to choose a given
protection strategy (k), unless the net benefit of doing so is positive. The net
benefit of protection is the product of the value of the crop per unit of area (V), the
area planted (A), the expected percentage of crop lost without protection (L) and
the efficiency of the protection strategy in terms of the percentage of L averted,
minus the costs of implementing the protection strategy .
Net benefit of protection strategy:

14
This equation allows us to not only identify fruitless strategies where costs
outweigh benefits, or 0, but also to compare strategies to maximize .
A rationally acting farmer is expected to opt to protect his or her crops using
method if is positive. When choosing between strategies, however, a farmer
will choose that with the larger net benefit, or value. Strategies to be weighed
include not only protection methods but also coping strategies such as planting
multiple parcels to distribute risk, planting extra crop to buffer against losses, or
planting closer to the home (in less fertile soil). By taking into account such coping
schemes when comparing net benefits, this model allows us to determine whether a
proposed protection strategy will theoretically be adopted by a farmer in a given
situation.
PROTECTION STRATEGIES : I chose to analyze protection strategies based on those
most prominently discussed in the human‐elephant conflict literature or by
organizations or individuals in Gabon. I grouped similar strategies to represent the
wide spectrum of options without overwhelming the presentation. Other strategies
can always be added into this framework. Those evaluated here are:
• THREE “LOW‐COST,” HIGH‐MAINTENANCE STRATEGIES:
PG) Hot pepper grease applied along a wire fence with cloth strips. Methods
follow with those presented by Ongognongo and Stokes (2006), with weekly
reapplication of the grease.
Table 2.1: Variables used in benefitcost model Crop value ($/m2 = kg/m2 * $/kg at market) Total area planted (m2) Marginal costs of planting ($/m2) Percent of unprotected crop farmer expects to lose to elephants Extra area planted to compensate 1m2 of loss due to L (m2)
Protection method Efficiency of k (percent of L prevented) Cost of k ($) Net Benefit of k ($)
Net Benefit of planting extra ($)

15
PB) Hot pepper and sawdust bricks burnt weekly. Methods follow with those of
Ongognongo and Stokes (2006), with bricks burnt weekly at 50m intervals along
the perimeter.
S) Sleeping nightly in the plot to chase away raiding elephants. Includes building
a simple hut and encircling the farm with a simple wire alert system.
• ONE “HIGHCOST”, LOWMAINTENANCE STRATEGY:
BW) a two‐strand barbed‐wire using live trees as posts
• ONE COPING STRATEGY:
PX) Planting extra crops to buffer against losses. The cost of this strategy is the
cost of planting a given unit of area times the extra area needed to buffer
losses . Depending on the situation, can follow different functions in
relation to the expected percentage of crop lost :
o Linear : In many cases, elephants enter the farm sporadically, take a
small percentage of the crop, and leave the rest standing. In these cases, one
could presume that planting extra would not increase the amount eaten, as
the elephants could have just as easily eaten the crop that was left standing.
The amount a farmer would need to plant to buffer against losses would thus
equal the amount s/he expected to lose originally: , where
represents the original area planted.
o Power : In other situations, elephants take a higher percentage of the
crop at a time. In these cases, one could presume that elephants would eat a
similar proportion of the extra crop planted. Thus, the amount a farmer
would need to plant to buffer against losses would follow a power series
function: ∑∞
o Compromise : For this general analysis, I compromised between these
two situations by estimating the amount one would need to plant to buffer
against losses as the average of the linear and power‐series estimates. Thus
extra area planted to buffer against losses is thus: ∑∞

16
A secondary component, cooperation among farmers, can be applied to any of the
above strategies to reduce individual risk and minimize costs. Gabonese farmers
often clear land in clusters such that each farmer’s parcel borders those of fellow
farmers. Farmers generally explain clustering as both a means to enhance personal
safety by decreasing isolation and a strategy to decrease individual losses to wildlife
by reducing edge effects. In theory, an additional benefit of clustering is substantial
reduction of protection costs by reducing each farmer’s share of perimeter for
fencing projects or by distributing responsibilities, such as sleeping in the farm,
among multiple individuals. I therefore evaluated the above strategies at different
raiding intensities as well as varying levels of farmer cooperation.
CROP VALUE: To estimate crop value, I focused on the three most typical cropping
systems in Gabon:
• Plantain) dominant crop of plantain or banana with a mix of taro, sweet
potato, or yam as minor crops
• Manioc) dominant crop of cassava with squash or yam as minor crops
• Nut) first‐cycle dominant crop of groundnuts with corn as a minor crop,
followed by a second‐cycle dominant crop of cassava
To create a representative prototype for each system, I visited the farms of 426
households in 36 villages throughout Gabon and measured fields with a handheld
GPS unit to calculate average percent cover for each crop. To estimate the average
value per square meter of each system, I multiplied the percent cover yield
estimates and value of each crop in the market. Lack of systematic agricultural data
for Gabon render precise estimates for yield and value unrealistic; I estimated upper
and lower error bounds where possible to convey degree of certainty and provide
sources for yield and value estimates in appendix A.
EXPECTED LOSSES: Expected percentage lost without protection (L) varies widely
depending on site. To explore the range in raiding risk, I interviewed 304 farmers in
26 sites with current exposure to elephants and 122 farmers in ten control sites
having no current contact with elephants. To assess risk perception, farmers were

17
asked to: recount all raiding incidences in the past 12 months, indicate on a visual
Likert‐like scale their level of certainty that a raid will occur in the next 12 months,
and remove pebbles from a 10x10 grid to illustrate percentage of crop lost per raid.
It is common for farmers to exaggerate losses (Bell 1984; Languy 1996; Malima et al.
2005), either consciously, for example in an attempt to draw attention and
compensation funds, or unconsciously due to psychological phenomena of risk
aversion (Anderson 2003). A farmer’s decision is based on his or her perception of
risk, whether empirically accurate or not; the latter source of exaggeration is thus
not a problem for analysis of decision‐making. Conscious exaggeration can lead to
faulty calculations, however, as a farmer’s decisions are based on different
information than that which is reported. To reduce conscious exaggeration, I clearly
explained my role as a researcher, lived about a week in each village and developed
a rapport with the community, and observed elephant signs and crop health in the
surrounding area to substantiate farmers’ reports and inform follow‐up questions.
COST OF PROTECTION generally entails both a monetary and labor/temporal
component. I estimated the monetary cost to protect one hectare based on the
market value of required materials and information from farmers and organizations
regarding the lifespan of such materials in the field. Although farms are rarely
neatly square in Gabon, I assume that farmers are able to make square farms, and
would choose to do so if building a fence, based on observations of fencing projects.
I therefore used 4√Area for perimeter‐based calculations such as fencing length. For
clustered farms, I divided this value by √N, with N representing the number of
farmers sharing a fence, to estimate an individual’s share of the perimeter. I
estimated labor costs in man‐hour equivalents by observing the time required for an
adult male (or adult female for culturally female‐specific work) to complete
necessary tasks. I used the reported market value of labor for similar work to
convert these temporal costs to monetary costs.

18
EFFICIENCY is also a highly variable parameter; it is difficult to determine for
many protection systems, and probably impossible on a national scale. The initial
model is based on the assumption that is 100% for all methods, or that an
elephant will not touch crops if the protection method is properly implemented (all
estimated costs are paid). While unrealistic, setting to 100% for all methods
yields important initial insights. I later relaxed this assumption to examine the
expected effects of imperfect efficiency on farmer decision‐making. Setting the net
benefits equal to zero and solving for reveals the “break even” efficiency level, at
which a given method becomes adoptable: .
Simply yielding positive net benefits, however, is not a sufficient requirement for a
solution to be optimal. Other strategies, such as the readily available alternative of
planting extra to buffer against losses (PX), may have higher net benefits. The net
benefit of planting extra equals the value of the expected losses averted
minus the cost of planting the area required .
Net benefit of planting extra:
A protection strategy, , is superior to PX when it has a higher return rate, or when:
or:
From the above equation, we can derive the break‐even efficiency level at which a
protection method, k, becomes adoptable over the alternative of planting extra:
Break‐even efficiency: /
Table 2.2: Summary of optimal strategies in benefitcost model
Optimal strategy: “Break even” efficiency
Do nothing if: 0 & 0 /
Adopt k over PX if: /
Adopt PX over k if: /
Adopt strategy k with highest
19
Results:
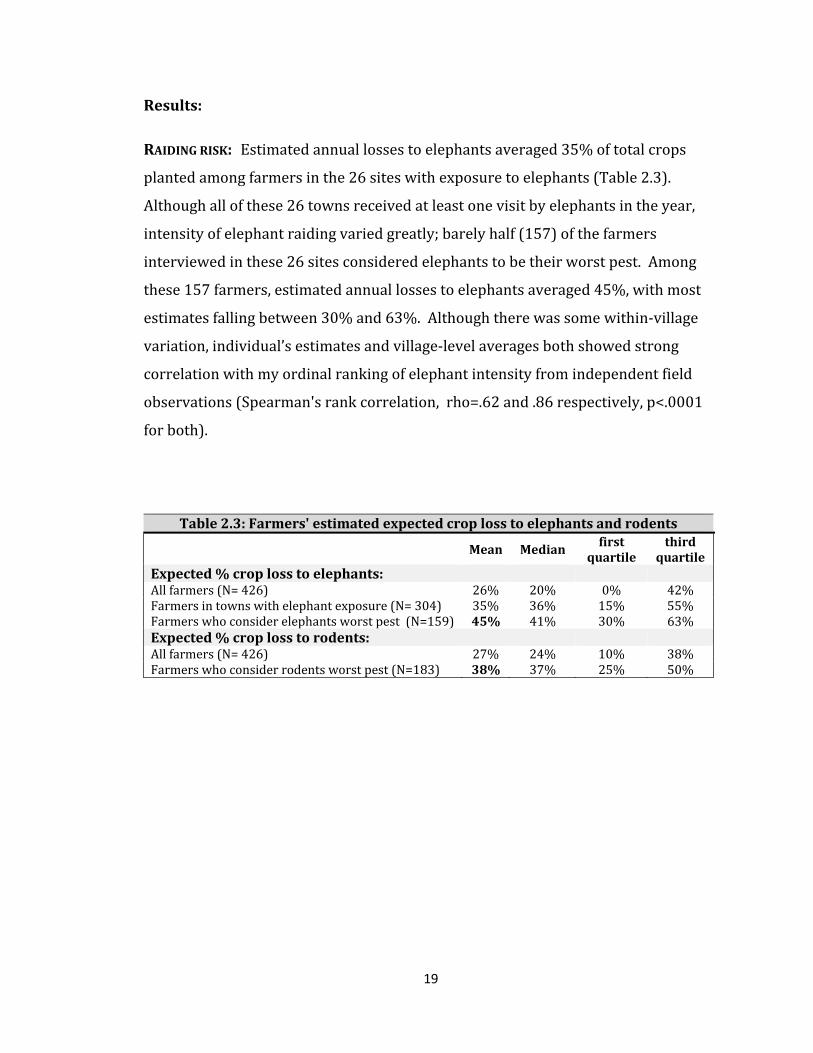
RAIDING RISK: Estimated annual losses to elephants averaged 35% of total crops
planted among farmers in the 26 sites with exposure to elephants (Table 2.3).
Although all of these 26 towns received at least one visit by elephants in the year,
intensity of elephant raiding varied greatly; barely half (157) of the farmers
interviewed in these 26 sites considered elephants to be their worst pest. Among
these 157 farmers, estimated annual losses to elephants averaged 45%, with most
estimates falling between 30% and 63%. Although there was some within‐village
variation, individual’s estimates and village‐level averages both showed strong
correlation with my ordinal ranking of elephant intensity from independent field
observations (Spearman's rank correlation, rho=.62 and .86 respectively, p<.0001
for both).
Table 2.3: Farmers' estimated expected crop loss to elephants and rodents
Mean Median first quartile
third quartile
Expected % crop loss to elephants: All farmers (N= 426) 26% 20% 0% 42%Farmers in towns with elephant exposure (N= 304) 35% 36% 15% 55%Farmers who consider elephants worst pest (N=159) 45% 41% 30% 63%Expected % crop loss to rodents: All farmers (N= 426) 27% 24% 10% 38%Farmers who consider rodents worst pest (N=183) 38% 37% 25% 50%

20
CROP VALUE AND COSTS OF PLANTING: The 426 farmers interviewed had planted a total
of 924 plots in the 12 months prior to the interview. Of these plots, 276 fell under
the general plantain cropping system, 576 fell under the manioc cropping system,
and 72 fell under the nut system (Table 2.4). The plantain cropping system requires
more fertile soil than the other two and is grown with an average fallow period of 22
years compared to 14 for manioc and 9 for nuts. Due to this increased fallow period,
plantain parcels are farther from the home (two kilometers compared to one
kilometer for the other two systems) and require more initial labor to cut, often
requiring a chainsaw, which costs substantially more than typical axe methods used
in areas with shorter fallow periods. This initial investment is somewhat balanced
by the lower costs for preparing and planting a plantain system, however, because
weeding requirements decrease as fallow period increases.
Based on my observations of farming activities, farmers’ recollections of time and or
money spent on different tasks, and parcel measurements, I estimated the cost of
planting one square meter (costs of planting extra to buffer against losses) as $0.24
for plantain systems, $0.19 for manioc systems, and $0.20 for nut systems, each
within an error bound of ±$.04 (Table 2.5). Although farmers often pay temporary
laborers, these costs are entirely labor‐derived and require no financial investment
(with the exception of seed material for farmers who have no carryover material
and gender‐specific labor costs for farmers who have no corresponding labor
capital). Because farmers often pay temporary laborers, however, there is a general
consensus on the value of labor for different tasks, allowing for easy conversion of
labor‐value to monetary‐value and vice‐versa.

21
Table 2.4: General information and value estimates for prototype crop systems
Fallow (yrs)
size (ha)
dist. (km)
cluster size
Main crop Secondary seed mat.
(cfa/m2)
Total value (cfa/m2)
Total valueb (US$/m2) N yielda
(kg/m2)pricea (cfa/kg)
yielda (kg/m2)
pricea (cfa/kg)
Plantain 221 22 0.40 2.0 3.3 1.42 361 0.06 617 30 575 1.13 (±3)° (±0.04)° (±0.2)° (±0.4)° (±0.79) (±161) (±0.02) (±36) (±8) (±406) (±0.8)
Manioc 389 14 0.31 1.1 3.9 1.48 130 0.06 448 25 244 0.48 (±2)° (±0.02)° (±0.1)° (±0.6)° (±0.97) (±20) (±0.02) (±29) (±0) (±146) (±0.29)
Nut 155 9 0.20 0.9 4.9 0.09 883 1.48 130 12 268 0.52 (±2)° (±0.02)° (±0.1)° (±0.6)° (±0.02) (±68) (±0.97) (±20) (±0) (±150) (±0.29)
a See Appendix A for data sources and summary methods. °mean and 95% confidence intervals of data from 426 farmers.
Table 2.5: Costs of planting for prototype crop systems
seed mat.
(cfa/m2)
Cutting Clearing Weeding Planting Total time (hr/m2)
Total cost
(cfa/m2)
Total costb ($/m2) Labor
(hr/m2)value (cfa/m2)
Labor (hr/m2)
value (cfa/m2)
Labor (hr/m2)
value (cfa/m2)
Labor (hr/m2)
value (cfa/m2)
Plantain 60 0.01 12.0 0.02 10.7 0.07 30.9 0.02 9.2 0.13 123 $0.24 (±0.004) (±1.5) (±0.01) (±4.9) (±0.02) (±9.6) (±0.04) (±16) (±0.03)
Manioc 25 0.02 9.7 0.03 11.7 0.11 45.7 0.01 5.0 0.16 97 $0.19 (±0.003) (±1.4) (±0.01) (±4.2) (±0.02) (±8) (±0.03) (±14) (±0.03)
Nut 0.01 6.1 0.03 12.9 0.15 70.3 0.02 10.0 0.21 105 $0.20 5 (±0.002) (±1.2) (±0.01) (±3.5) (±0.04) (±18) (±0.05) (±23) (±0.04)
All means and 95% confidence intervals of data from 426 farmers. b $1 = 511cfa

22
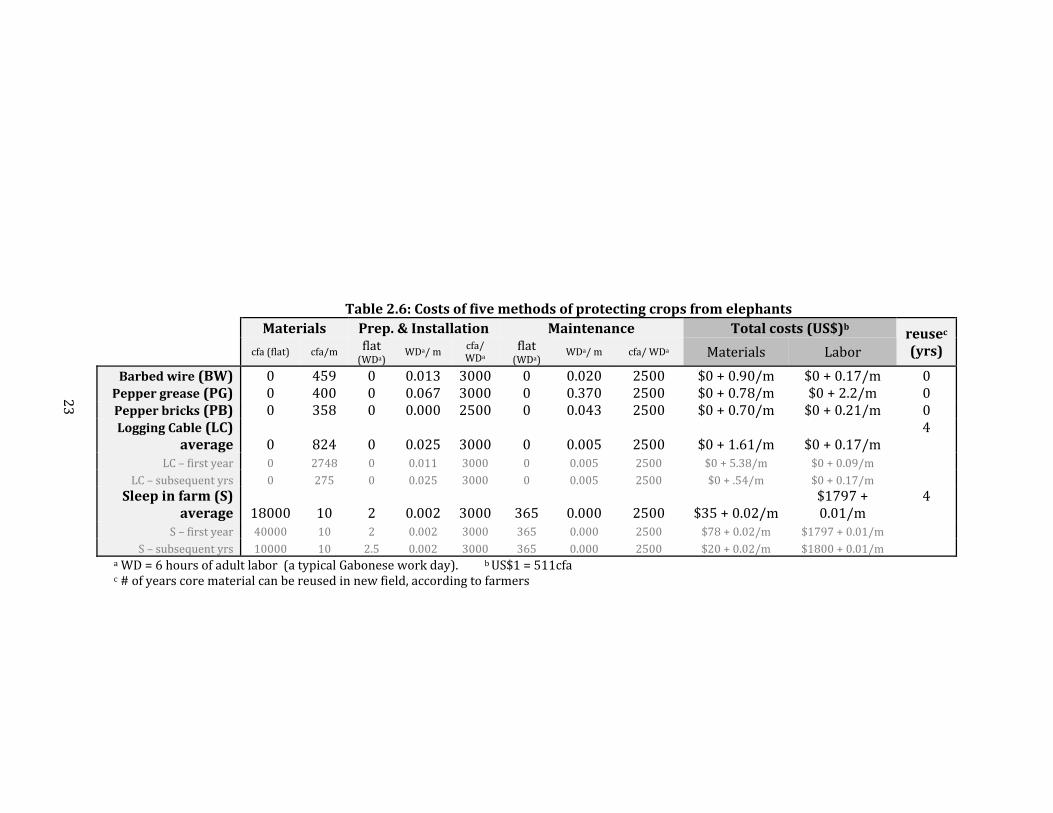
PROTECTION COSTS: Estimates for the costs of the four protection strategies studied
are summarized in Table 2.6. Logging cable has by far the highest material cost at
US$1.61 per meter of perimeter, even when reused over four years; barbed wire,
pepper grease and pepper bricks follow at $0.90, $0.78 and $0.70 per meter,
respectively. Sleeping in the field has the lowest materials costs for all but the
tiniest gardens, at a rate of $0.02 per meter plus a flat rate of $35 for building a hut.
Total material costs for the prototypic plantain plot of .40 hectares are thus
USD$407, $221, $197, $177, and $40 respectively. Material costs for pepper buffer
and pepper grease could be reduced by growing the required pepper one’s self and
thus converting material costs to labor costs. Labor costs follow a near‐inverse
pattern, with sleeping in the field being the most expensive at $1797 plus $0.01 per
meter perimeter, followed by pepper grease at $2.20 per meter, pepper bricks at
$0.21 per meter, and barbed wire and logging cable both at $0.17 per meter. Total
labor costs for protecting the prototypic plantain plot are thus: $1,800, $557, $53,
and $43 respectively, yielding a combined cost of $1840 for sleeping in the field,
$753 for pepper grease, $450 for logging cable, and $271 for barbed wire and $230
for pepper bricks.
23
Table 2.6: Costs of five methods of protecting crops from elephants
Materials Prep. & Installation Maintenance Total costs (US$)b reusec (yrs) cfa (flat) cfa/m flat
(WDa)WDa/ m cfa/
WDa flat (WDa)
WDa/ m cfa/ WDa Materials Labor Barbed wire (BW) 0 459 0 0.013 3000 0 0.020 2500 $0 + 0.90/m $0 + 0.17/m 0Pepper grease (PG) 0 400 0 0.067 3000 0 0.370 2500 $0 + 0.78/m $0 + 2.2/m 0Pepper bricks (PB) 0 358 0 0.000 2500 0 0.043 2500 $0 + 0.70/m $0 + 0.21/m 0Logging Cable (LC)
average 0 824 0 0.025 3000 0 0.005 2500 $0 + 1.61/m $0 + 0.17/m 4
LC – first year 0 2748 0 0.011 3000 0 0.005 2500 $0 + 5.38/m $0 + 0.09/m LC – subsequent yrs 0 275 0 0.025 3000 0 0.005 2500 $0 + .54/m $0 + 0.17/m Sleep in farm (S)
average 18000 10 2 0.002 3000 365 0.000 2500 $35 + 0.02/m $1797 + 0.01/m
4
S – first year 40000 10 2 0.002 3000 365 0.000 2500 $78 + 0.02/m $1797 + 0.01/m S – subsequent yrs 10000 10 2.5 0.002 3000 365 0.000 2500 $20 + 0.02/m $1800 + 0.01/m
a WD = 6 hours of adult labor (a typical Gabonese work day). b US$1 = 511cfa c # of years core material can be reused in new field, according to farmers

24
BENEFITCOST ANALYSIS: In this model, costs of protection strategies do not vary with
raiding intensity. However, costs of the coping strategy of planting extra to buffer
against losses does vary with raiding intensity, as the higher the expected losses, the
greater the area that must be planted to compensate. Under the (unrealistic)
assumption that all protection methods are 100% efficient, a farmer’s decision could
be predicted from Figure 2.1. For example, a farmer growing the prototypic
plantain parcel of .4 hectares who expects to lose 30% of her crop to elephants
could be expected to choose to use pepper bricks, as this has the lowest associated
cost (Figure 2.1A). If this option is not available or does not have a high enough
efficiency rate, the farmer might choose barbed wire. If this is also deemed
infeasible or inefficient, the farmer would be expected to choose to plant more to
buffer against losses over the remaining options, even if the other options are truly
100% efficient. For a farmer growing the same prototypic plantain plot who expects
to lose 63% of her crop to elephants, all of the options with the exception of sleeping
in the farm become adoptable over the alternative of planting extra at high
efficiency levels. For the farmer growing the prototypic manioc parcel, only pepper
bricks are the only rational option until expected losses are above 30%, regardless
of the efficiency of the other methods (Figure 2.1B).
Relaxing the assumption that all methods are 100% effective, Figure 2.2 illustrates
the break‐even efficiency level at which a given protection method would have to
perform to be appealing to a farmer. For example, in a situation where a farmer
growing the prototypic .40 hectare plantain plot expects to lose 30% to elephants in
the absence of protection, pepper bricks or barbed wire would be better than doing
nothing if they reduced crop loss by 20% or more. Likewise, logging cable would be
reasonable if it reduced crop loss by 33% or more, and pepper grease would be
reasonable if it reduced crop loss by 55% or more. In situations where expected
losses without protection are higher, minimum efficiency levels are considerably
lower, suggesting that proposed protection methods can be worthwhile even when

25
A) PLANTAIN SYSTEMS B) MANIOC SYSTEMS
Figure 2.1: Costs of protecting A) plantain and B) manioc parcels for five protection strategies compared with costs of planting extra to buffer losses at three levels of raiding intensity. The three intensity levels represent the mean and first and third quantiles for estimates of expected crop loss to elephants given by the 159 farmers who cited elephants as their worst pest. Dashed lines show confidence in cost of planting estimates. Vertical white bars highlight size of prototypic systems. relatively inefficient. The bottom row of Figure 2.2, however, illustrates the
minimum efficiency level at which a protection method would be expected to be
adopted over the alternative of planting extra to buffer against losses. Here, we see
that only pepper bricks and barbed wire can outperform planting extra for a .4
hectare plantain parcel when expected losses without protection are 30%. For
pepper bricks to be preferred over planting extra, efficiency must be around 65% or
higher. For barbed wire to be a feasible alternative, efficiency must be around 75%
or higher. For a .4 hectare parcel at a raiding intensity of 45%, pepper bricks and
barbed wire are optimal strategies if they reduced crop loss by around 50%.
Logging cable can also be optimal over planting extra if it reduces crop loss by 70%.
At a raiding intensity of 63%, pepper grease also becomes a potentially optimal
strategy at high efficiency levels.

26
A) 30% LOSS B) 45% LOSS C) 63% LOSS
Figure 2.2: Efficiency level at which net benefits of protecting plantain plots are positive (top row) and outweigh net benefits of planting extra (bottom row) for varying farm size and raiding intensity. The three intensity levels represent the mean (B) and first and third quantiles (A and C, respectively) for estimates of expected crop loss to elephants given by the 159 farmers who cited elephants as their worst pest. Vertical gray bars highlight the average sized plantain parcel.
COOPERATION: The results thus far suggest that some methods, such as sleeping in
one’s farm, are almost never worthwhile. However, net benefits of protection
methods can be significantly altered via cooperation. By clustering plots together,
multiple households can reduce protection costs by reducing their individual share
of the perimeter to be fenced or by sharing the costs of sleeping in the farm.
Farmers growing .4 hectares of plantain individually and expecting 45% loss to
elephants without protection would see a similar ranking of strategies if sharing
costs among three farmers as if acting individually. As cooperative groups increase
to five or ten farmers working together, however, other methods become more
attractive, even at relatively low efficiencies (Figure 2.3).

27
A) 3‐PERSON CLUSTERS B) 5‐PERSON CLUSTERS C) 10‐PERSON CLUSTERS
Figure 2.3: Effect of cooperation on net benefit of protection methods for plantain plots where expected loss without protection is 45%. Top row compares costs of protection and planting extra from the perspective of an individual farmer for three levels of farmer cooperation. Bottom row directly compares the four protection methods to the coping strategy of planting extra (PX), illustrating the minimum efficiency level at which net benefits of protection outweigh net benefits of planting extra. Vertical gray bars highlight average sized plantain plots.
Discussion:
This analysis yields much insight into likelihood of adoption of crop protection
methods. Knowledge of the efficiency of the proposed method in keeping elephants
out is essential if the goal is to estimate the exact benefit of a method. However,
reliable tests of technology efficiency require considerable financial and time
investments. Here, I demonstrate that many methods can be ruled out for a given
situation by starting off with the assumption that they are 100% efficient. By
requiring this type of adoptability assessment, we can help ensure that limited
resources are used to explore projects that are likely to succeed.
28
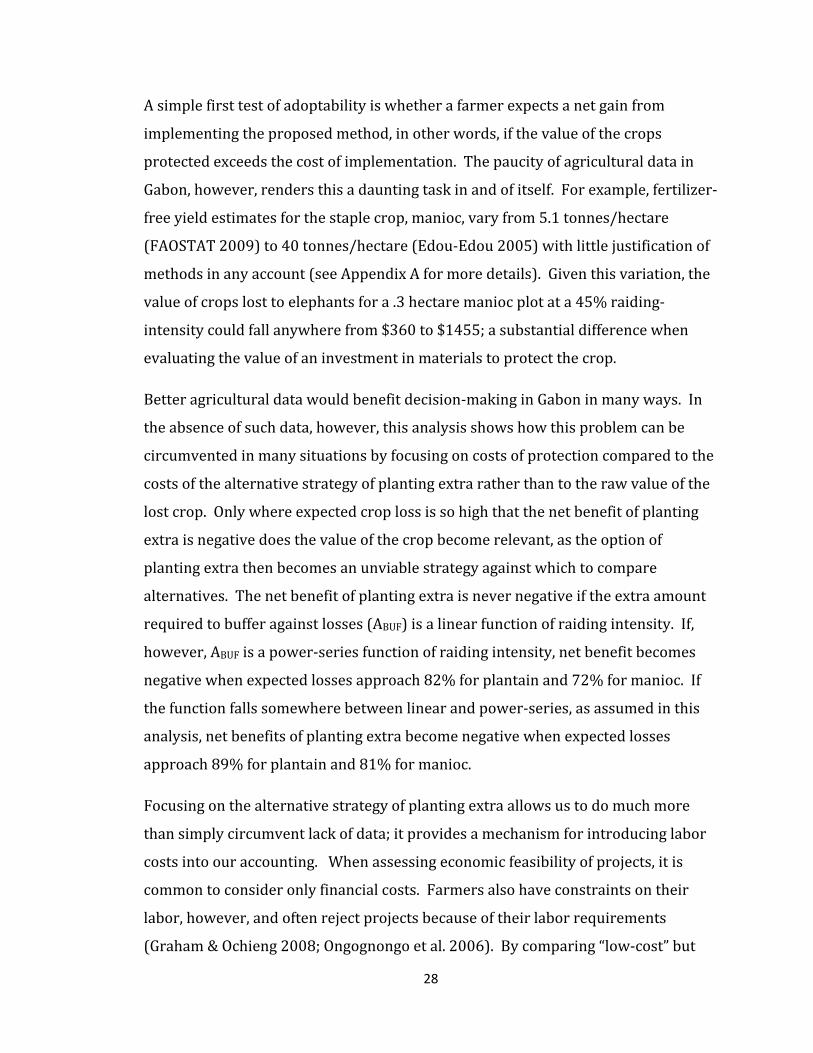
A simple first test of adoptability is whether a farmer expects a net gain from
implementing the proposed method, in other words, if the value of the crops
protected exceeds the cost of implementation. The paucity of agricultural data in
Gabon, however, renders this a daunting task in and of itself. For example, fertilizer‐
free yield estimates for the staple crop, manioc, vary from 5.1 tonnes/hectare
(FAOSTAT 2009) to 40 tonnes/hectare (Edou‐Edou 2005) with little justification of
methods in any account (see Appendix A for more details). Given this variation, the
value of crops lost to elephants for a .3 hectare manioc plot at a 45% raiding‐
intensity could fall anywhere from $360 to $1455; a substantial difference when
evaluating the value of an investment in materials to protect the crop.
Better agricultural data would benefit decision‐making in Gabon in many ways. In
the absence of such data, however, this analysis shows how this problem can be
circumvented in many situations by focusing on costs of protection compared to the
costs of the alternative strategy of planting extra rather than to the raw value of the
lost crop. Only where expected crop loss is so high that the net benefit of planting
extra is negative does the value of the crop become relevant, as the option of
planting extra then becomes an unviable strategy against which to compare
alternatives. The net benefit of planting extra is never negative if the extra amount
required to buffer against losses (ABUF) is a linear function of raiding intensity. If,
however, ABUF is a power‐series function of raiding intensity, net benefit becomes
negative when expected losses approach 82% for plantain and 72% for manioc. If
the function falls somewhere between linear and power‐series, as assumed in this
analysis, net benefits of planting extra become negative when expected losses
approach 89% for plantain and 81% for manioc.
Focusing on the alternative strategy of planting extra allows us to do much more
than simply circumvent lack of data; it provides a mechanism for introducing labor
costs into our accounting. When assessing economic feasibility of projects, it is
common to consider only financial costs. Farmers also have constraints on their
labor, however, and often reject projects because of their labor requirements
(Graham & Ochieng 2008; Ongognongo et al. 2006). By comparing “low‐cost” but

29
potentially labor‐intensive protection strategies to the alternative of planting extra
to buffer against losses, we can directly explore payoffs in allocation of labor
resources, as planting extra requires little to no financial capital. If the net benefit of
a different strategy is less than that of planting extra, it is fair to say that a farmer
will probably find it unattractive. Caution should be taken when combining
financial and labor costs into one total cost, however. There is good reason to
consider financial costs separately from labor costs, as most swidden farmers do not
have much financial capital to invest in projects. Exercises such as this one may
make projects that require heavy financial capital, such as barbed wire, appear more
feasible than they actually are for certain farmers. I argue that that dropping labor
costs from the equation entirely can be equally misleading. Separate analyses may
need to be done for farmers with financial capital and those without to assess
adoptability in a specific situation.
Although coping strategies such as planting extra to buffer against losses may yield
the largest net benefits, they go undetected as strategies due to difficulty in
distinguishing them from doing nothing. Other coping strategies include moving the
farm closer to the house and switching from plantain systems to manioc or nut
systems, which are less attractive to elephants and have less exposure time due to
faster maturation. More information on soil fertility and local markets would be
required to assess the net benefits of such strategies. Keeping a farm close to the
house, for example, entails short fallow periods, which generally result in lower
yields and substantially higher investment in weeding. Growing less plantain and
more cassava, or less cassava and more groundnuts, likewise entails considerable
losses, as each respective system has a considerably lower output/input ratio.
Farmers often make these changes for reasons that have nothing to do with
elephants, however. For instance, farmers with no access to male labor to clear
large trees generally plant cassava over plantain. Farmers who are sick or tired may
choose to plant closer to the house. Access to market also influences planting
decisions, as cassava and groundnuts store longer and are much easier to transport
than plantains. In the absence of knowledge regarding what a farmer would have

30
planted if elephants were not a threat, it is difficult to say whether farmers are
actually implementing coping strategies. However, failure to consider these
strategies as alternatives in benefit‐cost analyses can lead to overly optimistic
technologies and overly pessimistic opinions of farmers.
Using a cooperative strategy to minimize costs shows much promise in theory but
can be more difficult to implement in practice. Farmers do often cluster together in
groups of three or four, but most interviewed expressed concern over free‐riding
problems when asked about the possibility of sharing materials or labor costs of
protection. Those who thought sharing was a good idea generally agreed that
groups of three or four were the optimal size, beyond which they believed conflict
among farmers to be almost inevitable. I have witnessed the collapse of several
pilot fencing projects largely because their implementers assumed that ten or more
neighboring farmers would cooperate with one another in maintaining the project.
This is not to say that there is no hope for cooperation, but that projects relying on
cooperation to make payoffs beneficial to individual farmers need to think about
mechanisms to facilitate cooperation and reduce free‐rider hazards rather than to
expect cooperation to occur innately.
The benefit‐cost analysis presented in this paper does not consider many aspects at
the village‐level or household‐level that might influence farmers’ decision‐making.
Issues such as access to market, access to labor, access to financing, and barriers to
cooperation should be taken into account when possible in evaluating a specific
project. It also does not seek to identify the actual intensity of crop‐raiding in a
given area, which would be essential to evaluate costs and benefits for any given
farmer. Through this analysis, however, I provide an initial sketch of the kinds of
questions that should be asked before diving into costly analyses of specific
technology or accusing farmers of laziness for not adopting a proposed solution.
31
Cited References:
Anderson, J. A. 2003. Risk in rural development: challenges for managers and policy makers. Agricultural Systems 75:161‐197.
Barnes, R. F. W. 1997. Estimating forest elephant numbers with dung counts and a geographic information system. Journal of Wildlife Management 61:1384‐1393.
Bell, R. H. V. 1984. The man‐animal interface: an assessment of crop damage and wildlife control. Pages 387‐416 in R. H. V. Bell, and E. Mechane‐Caluzi, editors. Conservation and Wildlife Management in Africa. US Peace Corps, Malawi.
Blake, S., S. Strindberg, P. Boudjan, C. Makombo, I. Bila‐Isia, O. Ilambu, F. Grossmann, L. Bene‐Bene, B. de Semboli, V. Mbenzo, D. S'hwa, R. Bayogo, L. Williamson, M. Fay, J. A. Hart, and F. Maisels. 2008. Forest elephant crisis in the Congo Basin. PLoS Biology 5:0945‐0953.
de Boer, F., and C. P. Ntumi. 2001. Elephant crop damage and electric fence construction in the Maputo Elephant Reserve, Mozambique. Pachyderm 30.
Edou‐Edou, G. 2005. Etude des Systèmes d'Exploitation Agricoles de la zone d'Ayeme. Institut Gabonais d'Appui au Développement, Libreville, Gabon.
Elad, R. L., and J. E. Houston. 2002. Seasonal labor constraints and intra‐household dynamics in the female fields of southern Cameroon. Agricultural Economics 27:23‐32.
FAOSTAT. 2009. FAO Statistical Division.
Graham, M. D., and T. Ochieng. 2008. Uptake and performance of farm‐based measures for reducing crop raiding by elephants Loxodonta africana among smallholder farms in Laikipia District, Kenya. Oryx 42:76‐82.
Janssen, S. 2007. Assessing farm innovations and responses to policies: A review of bio‐economic farm models. Agricultural Systems 94:622‐636.
Kamonjo, A. W., N. W. Sitati, W. R. Adano, N. Leader‐Williams, and P. J. Stephenson. 2007. Assessing the economic costs and benefits of maize farming in elephant ranges in Transmara District, Kenya. Pages 46‐54 in M. Walople, and M. Linkie, editors. Mitigating human‐elephant conflict: Case studies from Africa and Asia. Fauna and Flora International, Cambridge, UK.
Lahm, S. A. 1996. A nationwide survey of crop‐raiding by elephants and other species in Gabon. Pachyderm 21:69‐77.
Languy, M. 1996. Suivi et atténuation de l'impact des éléphants et autres mammifères sauvage sur l'agriculture au Gabon. Rapport final. WWW Programme pour le Gabon.
Malima, C., R. E. Hoare, and J. J. Blanc. 2005. Systematic recording of human‐elephant conflict: a case study in south‐eastern Tanzania. Pachyderm 38:29‐38.
32
Moberly, R. L., P. C. L. White, C. C. Webbon, P. J. Baker, and S. Harris. 2004. Modelling the costs of fox predation and preventative measures on sheep farms in Britain. Journal of Environmental Management 70:129‐143.
Mumford, J. D., and G. A. Norton. 1984. Economics of decision making in pest management. Annual Review of Entomology 29:157‐174.
Nguema, V. M. 2005. L'agriculture du Gabon. Karthala, Paris.
Ongognongo, P., D. B. Ekoutoumba, and E. J. Stokes. 2006. Conflit Homme‐Eléphant dans la périphérie du Parc national de Nouabalé‐Ndoki au nord Congo. Evaluation des méthodes de lutte contre la dévastation des champs de manioc par les éléphants dans le village de Bomassa. Wildlife Conservation Society, Brazzaville, Congo.
Osborn, F. V., and G. E. Parker. 2002. Living with elephants II: a manual. Page 21. MZEP, 37 Lewisam Ave, Chisipte, Harare, Zimbabwe.
Osborn, F. V., and G. E. Parker. 2003. Towards an Integrated approach for reducing the conflict between elephants and people: a review of current research. Oryx 37:80‐84.
Pedigo, L., S. Hutchins, and L. Higley. 1986. Economic injury levels in theory and practice. Annual Review of Entomology 31:341‐368.
République Gabonaise. 1993. Recensement général de la population et de l'habitat Bureau Central du Recensement, Ministère de la planification et de l'aménagement du territoire, Libreville.
Ruthernberg, H. 1976. Farming Systems in the Tropics. Oxford University Press, Oxford.
White, D. S., R. A. Labarta, and E. J. Leguis. 2005. Technology adoption by resource‐poor farmers: considering the implications of peak‐season labor costs. Agricultural Systems 85:183‐201.
Wiles, L. J. 2004. Economics of Weed Management: Principles and Practices. Weed Technology 18:1403‐1407.
Wilkerson, G. G., L. J. Wiles, and A. C. Bennett. 2002. Weed management decision models: pitfalls, perceptions, and possibilities of the economic threshold approach. Weed Science 50:411‐424.

33
Chapter 3.
When coping with cropraiding may be more rational than protecting crops: empirical findings in Gabon
Introduction:
Wildlife and farmers do battle with each other over scarce resources in all corners
of the earth. A large portion of a farmer’s job entails constant assessment and
reassessment of the battle wounds to decide how much loss should be tolerated and
how many resources should be invested in building fortresses or battling pests. I
examined this phenomenon in Gabon, where my inquiries about crop‐raiding often
evoked an all‐out war cry against the perpetrators, namely elephants (Loxodonta
africana cyclotis), large rodents such as cane rats (Thryonomys swinderianus) and
brush‐tailed porcupines (Atherurus africanus), and the occasional primate (e.g.
Mandrillus sphinx, Gorilla gorilla gorilla, Pan troglodytes). Given the passionate
response from farmers, observers are often surprised to see the paucity of methods
used to protect farms from crop‐raiding in Gabon.
Protecting crops from wildlife, especially strong and intelligent wildlife such as
elephants, requires a heavy investment in resources in the form of money and labor.
Chapter 2 lays out a theoretical model for evaluating costs and benefits of protection
to predict adoption of farm protection methods. Based on this framework alone, we
would expect farmers in Gabon to favor “invisible” coping strategies, such as
planting extra to buffer against losses, over material‐ or labor‐intensive protection
strategies, such as building fences or sleeping in their farms, in most situations.

34
Individual situations vary much more than accounted for in the model presented in
Chapter 2, however. Some farmers have more labor available to them and less
financial resources, while others have income but little labor to spare. Cultural
factors may cause a farmer to reject an economically optimal strategy or accept a
strategy that is economically suboptimal. Variations in social capital make it easier
or harder for some farmers to cooperate to reduce individual costs of protection,
enabling them to adopt strategies that would be suboptimal if each farmer acted
alone. The work presented here examines the role of such individual and town‐
level factors on farmers’ decisions regarding crop protection. Specifically, I assess:
1) How well protection methods used by farmers align with the predictions of
the model presented in Chapter 2. Specifically, I expect fence‐building to
occur among farmers with a higher payoff ratio for building fences versus
planting extra to buffer against losses.
2) what additional factors make a farmer prone to adopting a given protection
strategy,
3) whether there are indications of coping strategies where crop loss is higher:
Are farmers who appear to be doing nothing to protect their farms actually
planting extra to buffer against losses?
Methods:
This work is based on interviews and farm observations with 426 farmers in 36
villages across Gabon, mostly in the northern, central and southwest regions. I used
a two‐tiered sampling design, selecting villages to balance town‐level variables,
particularly intensity of elephant raiding, and selecting farmers randomly within
those villages. Traditional village leaders were always included out of respect for
cultural protocol. Target sample size was ten to twelve farmers per village, although
fewer farmers were interviewed in some villages due to lack of available farmers.
Interviews were conducted in a semi‐structured format and included questions on
personal and household demographics, farming practices, losses to wildlife, and
protection methods. Interviews also included a visit to each parcel planted in the

35
year (September to September), during which I observed crop damage and
protection methods and estimated parcel size and coverage of individual crops by
walking around them with a handheld GPS unit. To help ensure that I observed all
principal crops (often difficult given the mixed cropping system typical to Gabonese
agriculture), I first asked farmers to list the crops they had planted and to create a
sketch of each parcel, showing the relative areas of each crop listed.
To estimate farmers’ expected crop loss, I asked farmers to list the five animals that
cause the most damage to their crops and estimate the damage caused by each. To
encourage the most accurate estimates possible, I presented the farmer with three
different tasks and informed follow‐up questions with observations from the farm.
The three tasks, repeated for each of the top five raiders, were:
T1) recount all raiding incidences in the past 12 months (for infrequent raiders)
or the past seven days (for resident animals such as rodents),
T2) indicate on a visual Likert‐like scale level of certainty that a raid will occur in
the next 12 months (or next seven days for resident animals),
T3) remove pebbles from a 10x10 grid to illustrate amount of crop lost per raid
(repeated for each crop planted)
With these responses and my own measurements of area of each crop planted, I
estimated the value of the crop lost to each animal from the farmer’s perspective as:
Loss to rodents and other small raiders:
( ∑ T1 S T2 T Y V
Loss to elephants and other large raiders:
( ∑ T1 S T2 T A Y V
where T1, T2, T3 represent the farmer’s response to the three tasks above, Si
represents the growing season of the crop i, in weeks (for resident raiders), Ai
represents the area planted of crop i, di represents the density of crop i, in number
of plants per unit of area, and Yi and Vi represent yield and market‐value estimates
of crop i per unit of area. These last estimates are discussed more thoroughly in
chapter 2.

36
The distinction between large raiders and small raiders in the two equations results
primarily from different behavior with the grid task (T3) for the two groups. Think‐
aloud exercises drew my attention to the fact that farmers tended to view the grid as
a representation of their entire farm (and each pebble thus as multiple plants) when
considering raiders that take many plants per visit, but tended to view individual
pebbles as individual plants when considering raiders that take only a few plants
per visit. For this latter case, I therefore divided the response to T3 by the area
planted times the observed density crop density. I estimated this density by
averaging the distance between a plant and its four nearest neighbors, repeated for
five randomly selected plants.
Value lost to elephants was calculated after subtracting the expected losses to
resident raiders from the total value of each crop, based on the notion that these
losses are inevitable regardless of the farmer’s choice of protection against larger
animals. Not removing these losses would thus overestimate the total value of the
harvestable crop under a given protection scheme.
To enable comparison of estimates among farmers, I converted estimated value of
crop lost to each animal to percentages by dividing by the total farm value: (VT) =
∑ A Y V . I then averaged these estimates for all farmers in a given town to
produce a general estimate of raiding intensity in the area. These averaged
estimates were used in the protection models to reduce the confounding effect of
protection: part of the theory being tested is that a farmer will be more likely to
protect when raiding intensity is higher in the area, but use of an effective
protection strategy is expected to lower raiding intensity for that farmer.
Models: I modeled farmer decision‐making regarding protection first as a series of
dichotomous response variables representing the principle protection strategies I
observed in the field. For those farmers who did not implement one of the
dichotomous strategies, I then modeled a series of continuous response variables to

37
assess the presence of more subtle coping strategies. The specific dichotomous
response variables were:
• RFENCE: presence/absence of a fence against rodents (any height, gaps <10cm)
• EFENCE: presence/absence of a fence against elephants (at least one meter
high, of any material),
• SLEEP:
o SLEEP.hut: presence /absence of a hut for sleeping in the farm
o SLEEP.yes: yes/no response to the question: “Have you ever slept in your
farm this year” (“Estce que vous avez dormi parfois en brousse dans votre
plantation cette année”)? Follow‐up questions were asked to exclude
incidences where farmers only slept in the farm during cutting/clearing,
as is often done to reduce walking time during this labor‐intensive period.
• GIVEUP: Did farmer abandon farming or reduce farm size to that of a home
garden during the year of study? Only applies to farmers who maintained
larger farms within the past two years that I could observe and who claimed
that the change in farming practices was due to wildlife.
• NOSTRAT: The alternative to the four strategies above: Yes if none of the above
was observed
Positive cases from the NOSTRAT group were used in a series of models to examine
“invisible” coping strategies, or strategies that are unobservable without knowledge
of what the farmer would have done in the absence of the pest. The response
variables of these models were:
• FSIZE: Size of farm, to assess whether farmers plant extra to buffer losses
• CLUSTER: Number of farmers sharing a contiguous space, to assess whether
farmers group together more under higher risk
To assess whether farmers with a higher payoff ratio for building fences versus
planting extra are indeed those building fences, I created the explanatory variables
LCAE and LCAR, for elephants and rodents, respectively, as proxies for this relative
payoff ratio. This payoff can be calculated as the cost of planting extra divided by

38
the cost of building a fence, or √
, where L represents the percent of total
crop lost to elephants (or rodents); A represents the total area planted; Cp represents the marginal cost of planting an extra unit of area (Chapter 2); and Ck represents the marginal cost of building a fence, per unit of perimeter. Marginal
costs of building any given fence type are assumed to be constant for all farmers;
thus the variable simplifies to: √ and √
To analyze the impacts of individual and town‐level characteristics on use of
protection and coping strategies, I included several such characteristics as potential
predictive variables in the models (Table 3.1). Choice of variables to include was
informed by farmers’ responses to questions on rationale for various decisions as
well as my own observations from the field.
Based on general differences in responses between older and younger farmers, I
tested interaction effects of age with the other predictive variables. I also examined
the square‐terms of age and raiding intensity, based on the hypothesis that neither
variable has a linear relationship to farm size. Observations suggest that older
farmers are generally more active in their farming than younger farmers; however
this relationship is unlikely to continue over the entire range (an eighty‐year‐old
farmer is unlikely to be more active than a sixty‐year‐old farmer). Likewise, I expect
farm size to increase with raiding intensity for farmers who choose to buffer rather
than protect against losses, but there is clearly a level of raiding intensity at which
this coping strategy becomes infeasible; at very high raiding intensity, the size of
unprotected farms would likely drop as farmers opt for different strategies (such as
planting closer to the house).
Statistical methods:
R statistical software, version 2.9.1 (R Development Core Team 2008) was used for
all statistical analyses. I used the “glmer” method from the lme4 package (Bates &
Maechler 2009) to fit a generalized linear mixed model with a binomial structure for
the five dichotomous response variables. Towns were set as the grouping factor to

39
account for the possible non‐independence of individuals within towns.
Infrequency of observation of each strategy prevented the use of a multinomial
model. This rareness of positive events (implemented strategies) also limited the
power of the models to detect relationships of individual variables; an event‐to‐
predictive‐variable ratio less than ten can result in biased estimates (Peduzzi et al.
1996), limiting some of my protection strategy models to two or three predictive
variables. The relative rareness of positive events also called into question the
theoretical fit of a logistic link. I addressed this by testing model fit, using exact
regression methods from the elrm package (Zamar et al. 2007) to corroborate
model results at the individual level, and modeling aggregated town‐level data using
zero‐altered Poisson methods in the pscl package (Zeileis et al. 2008)to corroborate
model results at the town level. Model fit details are provided in appendix B.
I modeled continuous coping responses (farm size and cluster size) for farmers with
no observed strategy with linear or generalized linear Gaussian models. The
potential non‐independence of individuals within towns suggests a mixed model
structure may be more appropriate; however, an ANOVA test between models with
and without random town effects (West et al. 2007) indicated that the between‐
town variance was insignificant in most cases. Ordinary least‐square methods also
seemed to provide adequate fit for most models, although one case of
heterogeneous variances observed in diagnostic tests (for elephant as worst pest)
led to use of a generalized least squares structure for that particular model.
To compare the relative strength of predictors within models, I standardized the x‐
coefficients using the “standardize” method in the arm package (Gelman et al. 2009).
This method rescales coefficients to have a mean of zero and standard deviation of
.5, which enables comparison not only among coefficients for numerical predictor
variables but also between coefficients for numerical and dichotomous predictor
variables (which are not standardized) (Gelman 2008).
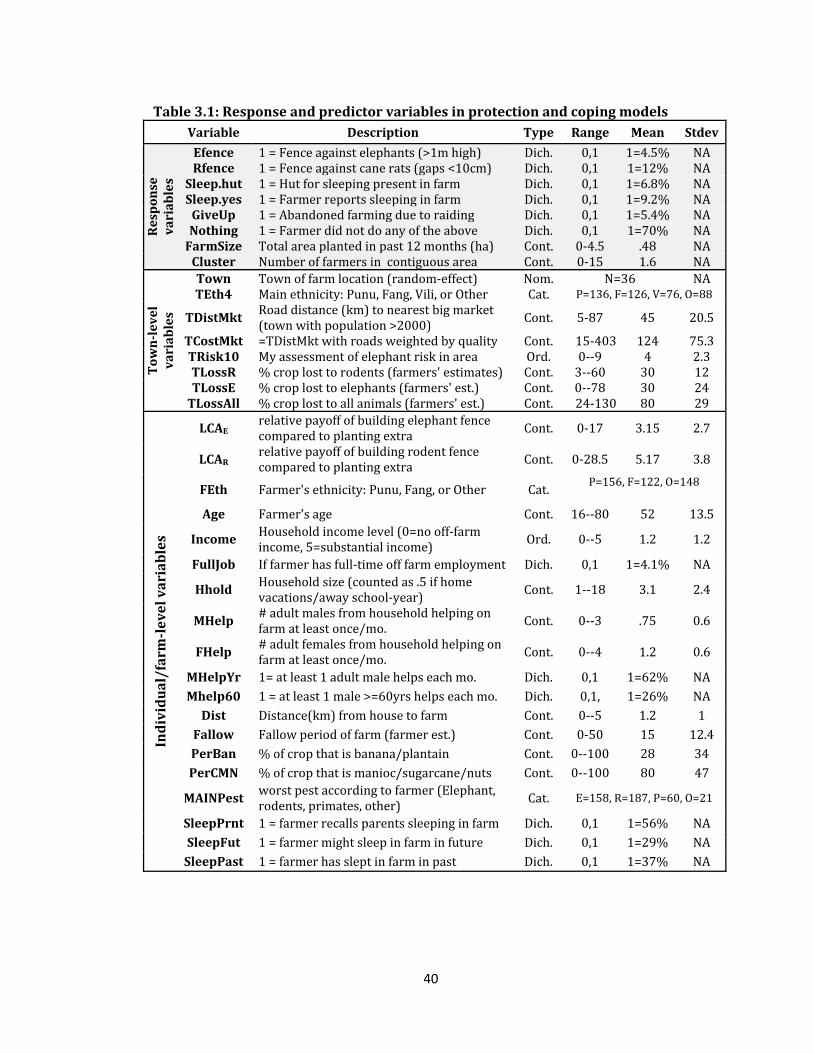
40
Table 3.1: Response and predictor variables in protection and coping models
Variable Description Type Range Mean Stdev
Response
variables
Efence 1 = Fence against elephants (>1m high) Dich. 0,1 1=4.5% NARfence 1 = Fence against cane rats (gaps <10cm) Dich. 0,1 1=12% NASleep.hut 1 = Hut for sleeping present in farm Dich. 0,1 1=6.8% NASleep.yes 1 = Farmer reports sleeping in farm Dich. 0,1 1=9.2% NAGiveUp 1 = Abandoned farming due to raiding Dich. 0,1 1=5.4% NANothing 1 = Farmer did not do any of the above Dich. 0,1 1=70% NAFarmSize Total area planted in past 12 months (ha) Cont. 0‐4.5 .48 NACluster Number of farmers in contiguous area Cont. 0‐15 1.6 NA
Tow
nlevel
variables
Town Town of farm location (random‐effect) Nom. N=36 NATEth4 Main ethnicity: Punu, Fang, Vili, or Other Cat. P=136, F=126, V=76, O=88
TDistMkt Road distance (km) to nearest big market (town with population >2000) Cont. 5‐87 45 20.5
TCostMkt =TDistMkt with roads weighted by quality Cont. 15‐403 124 75.3TRisk10 My assessment of elephant risk in area Ord. 0‐‐9 4 2.3TLossR % crop lost to rodents (farmers' estimates) Cont. 3‐‐60 30 12TLossE % crop lost to elephants (farmers' est.) Cont. 0‐‐78 30 24TLossAll % crop lost to all animals (farmers' est.) Cont. 24‐130 80 29
Individual/farmlevel variables
LCAE relative payoff of building elephant fence compared to planting extra Cont. 0‐17 3.15 2.7
LCAR relative payoff of building rodent fence compared to planting extra Cont. 0‐28.5 5.17 3.8
FEth Farmer's ethnicity: Punu, Fang, or Other Cat. P=156, F=122, O=148
Age Farmer's age Cont. 16‐‐80 52 13.5
Income Household income level (0=no off‐farm income, 5=substantial income) Ord. 0‐‐5 1.2 1.2
FullJob If farmer has full‐time off farm employment Dich. 0,1 1=4.1% NA
Hhold Household size (counted as .5 if home vacations/away school‐year) Cont. 1‐‐18 3.1 2.4
MHelp # adult males from household helping on farm at least once/mo. Cont. 0‐‐3 .75 0.6
FHelp # adult females from household helping on farm at least once/mo. Cont. 0‐‐4 1.2 0.6
MHelpYr 1= at least 1 adult male helps each mo. Dich. 0,1 1=62% NA Mhelp60 1 = at least 1 male >=60yrs helps each mo. Dich. 0,1, 1=26% NA Dist Distance(km) from house to farm Cont. 0‐‐5 1.2 1 Fallow Fallow period of farm (farmer est.) Cont. 0‐50 15 12.4 PerBan % of crop that is banana/plantain Cont. 0‐‐100 28 34 PerCMN % of crop that is manioc/sugarcane/nuts Cont. 0‐‐100 80 47
MAINPest worst pest according to farmer (Elephant, rodents, primates, other) Cat. E=158, R=187, P=60, O=21
SleepPrnt 1 = farmer recalls parents sleeping in farm Dich. 0,1 1=56% NA SleepFut 1 = farmer might sleep in farm in future Dich. 0,1 1=29% NA SleepPast 1 = farmer has slept in farm in past Dich. 0,1 1=37% NA

41
Results
General: The average farm was just under half a hectare, distributed between one
to two parcels (mean = 1.6), each sharing a contiguous area with that of three other
farmers, on average Crops were dominated by manioc, followed by plantains and
groundnuts. A more detailed description of cropping systems is provided in Chapter
2. The average farmer was 52‐years‐old (median = 60), and had a household size
of 3.2, two of whom worked on the farm at least once a month (including the
interviewee).
Of the 426 farmers interviewed, 347 were female and 79 were male. This unequal
ratio reflects gender roles in farming more than the composition of the farming
population; as it is generally considered the woman’s role to plant, weed and
harvest, I observed far more women in the farms in which I was interested (those
already planted) than men. Due to the man’s traditional role in clearing and
protecting farms, access to male labor can heavily influence both farm size and
protection strategies. Of the females interviewed, 134 (38%) did not have access to
male labor in their household. Similarly, 29 (37%) of the 79 males interviewed did
not have access to female labor in their household.
Protection strategies:
CROP PROTECTION AGAINST RODENTS (RFENCE): Of the 426 farmers interviewed, 50
built a fence to protect against rodents. Of these fences, 18 were constructed using
traditional methods of interweaving palm fronds, 7 involved stacked logs, 21 used
sheets of zinc roofing material, and 4 used fishing nets. Half of these fences (26)
incorporated intentional gaps with traps intended to catch large rodents (Atherurus
africanus, Thryonomys swinderianus) and other small animals for consumption. An
additional 25 farms used traps but no fence. Although traps may provide some
protection to the crop, they were not considered as a protection strategy here due to
general consensus among farmers interviewed, including those who used traps, on
their inefficiency in reducing crop raiding.

42
#YES STRATEGY SIGNIFICANT VARIABLES IN GLMMa
Variable β.coefb Log
odds Log odds orig. coef p.c
AGAINST RODENTS
50
RFENCE
(Intercept) ‐3.61 <.001perCMN 2.14 8.50 0.019 <.001Dist ‐1.60 0.20 ‐0.064 0.01LCAR 1.27 3.56 0.166 0.014MHelp60 0.68 1.97 0.677 0.076TLossR 0.39 1.48 0.916 0.667TOWN effect: Var = 3.55, std. dev. = 1.88, p= 9.13E‐7
AGAINST ELEPHANTS
19 EFENCE (Intercept) ‐9.74 <.0001
LCAE 3.09 21.98 1.77 0.02MHelpYr 1.45 4.26 4.26 0.09
TOWN effect: Var = 35.04 , std. dev.=5.9 , p= 5.58 E‐79 .
29
SLEEP
hut
(Intercept) ‐5.11 <.001LCAE 2.01 7.46 1.00 0.001Dist 1.06 2.89 0.00 0.068MHelp60 1.02 2.77 1.07 0.067TOWN effect: Var = 3.33, std. dev. = 1.82, p = 2.10 E‐11
44
SLEEP
“yes”
(Intercept) ‐3.88 <.001TRisk10 1.64 5.16 1.43 0.029MHelpYr 1.67 5.31 5.31 0.014SleepPrnt 2.5 12.18 12.27 0.006TOWN effect: Var = 1.54 , std. dev. =1.24 , p=
19
GiveUp
(Intercept) ‐6.45 <.001Income 1.52 4.57 1.91 0.037TRisk10 3.87 47.94 2.34 0.005TEth4Oth 0.21 1.23 1.23 0.916TEth4Pnu 0.69 1.99 2 0.727TEth4Vli 3.83 46.06 45.8 0.038TOWN effect: Var = 2.57 , std. dev.=1.60 , p=
292
NoStrat (Intercept) 2.56 12.94 1586 <.001
SleepPrnt ‐1.52 0.22 0.22 0.003TRisk10 ‐3.25 0.04 0.49 <.001TCostMkt ‐1.36 0.26 0.99 0.012TOWN effect: Var =1.3 , std. dev.= 1.1, p=
a fit by adaptive Gaussian Hermite approximation with "glmer" from nlm4 package in R (Bates, 2009) b coeficients rescaled to have mean=0 and sd=.5; binary variables centered (Gelman, 2009) c most conservative estimates: number of groups minus number of parameters(Bolker et al. 2009) d Some farmers have more than one parcel Figure 3.1: Significant variables for strategies of protecting from or coping with crop raiding, from generalized linear mixed model. Variables are summarized in Table 1. Model details and fit tests are provided in appendix B.
D
C
F
E
B
A
ALL PARCELSd
N=666
50
ALL FARMERS
N=426

43
At least one rodent fence was observed in 19 of the 36 towns. Crop composition
(PerCMN), distance to farm (Dist), relative payoff of protecting versus planting extra
(LCAR), and help from a male aged 60 or older (MHelp60) were the most significant
variables in predicting likelihood of building a rodent fence (Fig 3.1A). Farms where
manioc, sugar cane and groundnuts comprised over 90% of the crop (two standard
deviations) had 8.5 times greater odds of having a rodent fence. Farms half a
kilometer (two standard deviations) farther from the farmer’s house had five times
lower odds of having a rodent fence. Farmers with help from males aged 60 or older
had twice the odds of having a rodent fence, although this relationship was only
marginally significant. Access to help from younger males showed no signs of
significance.
Increase in the relative payoff of protecting versus planting extra, LCAR, significantly
increased a farm’s likelihood of having a rodent fence; a one‐half‐standard deviation
increase in LCAR increased the odds of observing a rodent fence by 3.56. Other
variables of raiding intensity, such as TLossR, showed no significance. This
indicates that it is the combination of farm size, planting costs, and expected losses
from rodents that influences farmers’ decisions to build rodent fences, rather than
just intensity of rodent raiding in the area.
CROP PROTECTION AGAINST ELEPHANTS: Only 19 of the 426 farmers built any kind of
fence to protect crops against elephants. Huts for sleeping were observed in 29
farms and 39 farmers claimed to have slept in their farm in the past year.
• ELEPHANT FENCES (EFENCE): The 19 observed elephant fences all consisted of
relatively small investments with questionable efficacy, even according to the
farmers who built them. The three observed fencing methods consisted of rope
with tin cans, one meter high sheets of zinc roofing, and single strands of logging
cable. Of the three methods, farmers rated the logging cable as having the
highest potential of keeping elephants out. Town‐effects were significant; all
fences were observed in five towns, and 11 of the 16 fences were observed in

44
just two towns, Assok and Kazamabika, both experiencing very high levels of
elephant raiding and very small remaining farmer populations
The relative payoff of protecting versus planting extra, LCAE, was a significant
predictor of whether a farm had an elephant fence (Figure 3.1B). Farms with a
two standard deviation increase in LCAE had 22 times greater odds of having an
elephant fence. Elephant‐raiding risk variables alone (TRisk10 or TLossE) were
insignificant in predicting presence of elephant fences. Access to male labor
throughout the year (MHelpYr) showed a trend in increasing the odds of having
an elephant fence, although this was not significant at the .05‐level (p=.09).
• SLEEPING IN FARMS (SLEEP.HUT & SLEEP.YES):
o SLEEP.HUT: Huts with sleeping equipment were observed in 29 farms,
excluding short term “camping” events during the clearing season to
reduce walking time. The relative payoff of protecting versus planting
extra, LCAE, was the only significant predictor at the .05 level, although
distance to the farm (Dist) and access to male labor throughout the year
(MHelpYr) both showed marginal significance (p=.07 for each)
(Figure3.1C). A farm with a two‐standard‐deviation increase in LCAE had
7.5 times greater odds of having a hut. Neither of the elephant‐raiding risk
variables alone (TRisk10 or TLossE) was significant in predicting presence
of a hut.
o SLEEP.YES: An additional 15 farmers claimed to have slept in their farms
because of animals, although no hut was observed. Incorporating these
farmers changed the dynamics in interesting ways: Risk of elephant
raiding (TRisk10) became significant in the place of LCAE, access to male
labor became more significant, and memories of parents sleeping in their
farms became a significant predictor of whether a farmer would claim to
sleep in his or her own farm (Table 3.1D).

45
Alternative strategies:
• GIVING UP ON FARMING (GIVEUP): of the 426 farmers interviewed, 19 had farms in
the past three years but decided not to farm in the year of the study (or
substantially reduced their farm size to that of a garden next to their house) due
to wildlife. These 19 farmers were distributed among 7 towns, thus making the
random town‐effect highly significant. The majority (17) lived in towns with
elephants as the main raider, while two came from towns with primates as the
main raider; none came from a town with rodents as the main raider.
Risk of elephant raiding (TRisk10), ethnicity, and income were the strongest
predictors of abandoning farming (Fig 3.1E). Farmers in towns with estimated
TRisk10 two standard deviations above the mean had 48 times greater odds of
abandoning farming. Those of Vili ethnicity had 46 times greater odds of
abandoning than those farmers of other ethnicities. A two‐standard‐deviation
increase in income level increased odds of abandoning by 4.5 times. LCAE was
not tested in this model because would‐be farm size was impossible to estimate
for those who had abandoned farming.
• NO OBSERVED STRATEGY (NOSTRAT): Aside from the 19 farmers who built
elephant fences, the 39 who slept in their farms, and the 19 who abandoned, the
remaining 349 farmers did not implement any obvious strategy to protect
against elephants. The strongest predictors of whether a farmer fell into this
category were risk of elephant raiding (TRisk10), memories of parents sleeping
in their farms (SleepPrnt), and cost‐weighted distance to the market
(TCostMkt) (Fig 3.1F). A one‐half‐standard‐deviation increase in TRisk10
increased the odds of a farmer using one the above strategies by 96%, from one
in 22 for the null model to one in 11. Likewise, farmers whose parents slept in
the farm had 78% greater odds of using one of the above strategies to protect
against elephants, and those who lived in towns one‐half‐standard‐deviation
farther from a large market, in terms of distance weighted by road quality, had
76% greater odds of using one of the above strategies.
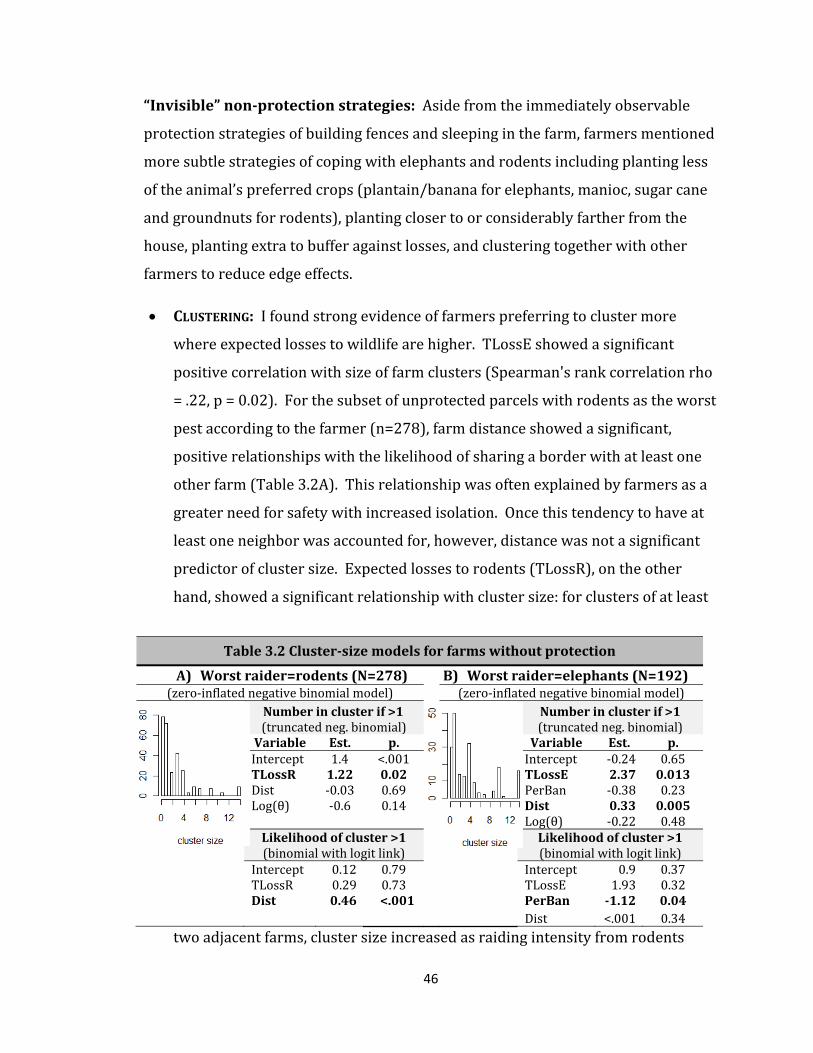
46
“Invisible” nonprotection strategies: Aside from the immediately observable
protection strategies of building fences and sleeping in the farm, farmers mentioned
more subtle strategies of coping with elephants and rodents including planting less
of the animal’s preferred crops (plantain/banana for elephants, manioc, sugar cane
and groundnuts for rodents), planting closer to or considerably farther from the
house, planting extra to buffer against losses, and clustering together with other
farmers to reduce edge effects.
• CLUSTERING: I found strong evidence of farmers preferring to cluster more
where expected losses to wildlife are higher. TLossE showed a significant
positive correlation with size of farm clusters (Spearman's rank correlation rho
= .22, p = 0.02). For the subset of unprotected parcels with rodents as the worst
pest according to the farmer (n=278), farm distance showed a significant,
positive relationships with the likelihood of sharing a border with at least one
other farm (Table 3.2A). This relationship was often explained by farmers as a
greater need for safety with increased isolation. Once this tendency to have at
least one neighbor was accounted for, however, distance was not a significant
predictor of cluster size. Expected losses to rodents (TLossR), on the other
hand, showed a significant relationship with cluster size: for clusters of at least
two adjacent farms, cluster size increased as raiding intensity from rodents
Table 3.2 Clustersize models for farms without protection
A) Worst raider=rodents (N=278) B) Worst raider=elephants (N=192) (zero‐inflated negative binomial model) (zero‐inflated negative binomial model)
Number in cluster if >1 Number in cluster if >1 (truncated neg. binomial) (truncated neg. binomial)Variable Est. p. Variable Est. p. Intercept 1.4 <.001 Intercept ‐0.24 0.65TLossR 1.22 0.02 TLossE 2.37 0.013 Dist ‐0.03 0.69 PerBan ‐0.38 0.23Log(θ) ‐0.6 0.14 Dist 0.33 0.005
Log(θ) ‐0.22 0.48Likelihood of cluster >1 Likelihood of cluster >1 (binomial with logit link) (binomial with logit link)
Intercept 0.12 0.79 Intercept 0.9 0.37TLossR 0.29 0.73 TLossE 1.93 0.32Dist 0.46 <.001 PerBan 1.12 0.04
Dist <.001 0.34

47
increased. Farmers explained the larger clusters as a means to reduce the total
edge exposed to the forest.
For the subset of unprotected parcels with rodents as the worst pest according
to the farmer (n=192), farms comprised primarily of plantain were less likely to
be clustered (Table 3.2B). Increased farm distance and expected losses to
elephants (TLossE) both had a significant positive relationship with the number
of farms in a cluster.
• PLANTING MORE TO BUFFER LOSSES: Significant predictors of farm size for farmers
who still farm but do not build fences or sleep in their farms were: distance to
farm (Dist), expected losses to all raiders (TLossA), the amount of male help
available (Mhelp), and age (Fig3.2). The best model yielded an average farm
size estimate of .43 hectares for an average farmer. Farm size estimates
increased by 8% for each year of age, but decreased by .1% for each unit of age‐
squared, such that farm size peaked at farmer age of 55 years. Farm size
estimates increased by 21% for each male who helps in the farm and by 19%
for each kilometer from the farmer’s house. Farm size estimates decreased by
.6% for each percent increase in expected crop loss.
This last observation provides evidence against the hypothesis that farmers
with higher raiding risk who choose not to protect their farms are planting
extra to buffer against losses. Dividing cases by worst raider helps provide
insight into where this hypothesis breaks down. For the 92 farmers who
consider their worst pest to be elephants but who do not protect their farms
(Fig 3.2B), farmers of average age (52 years) plant significantly less with
increasing raiding intensity, although the interaction effect between age and
raiding intensity is such that farmers above the age of 64 plant more with
increased raiding intensity. For the 145 farmers who consider their worst pest
to be rodents (Fig 3.2B), however, farms in towns with higher average

48
3.2A) Worst pest = elephants WLS Regression: Adjusted R‐squared: 0.22, df=91, p‐value=6.3e‐05
log Exp(coef) coef. [95% CI] p. (Intercept) 3072 8.030 7.820 8.240 <.0001Age (centered) .998 ‐0.002 ‐0.012 0.008 0.630Mhelp 1.25 0.220 0.020 0.420 0.034fullJob .445 ‐0.810 ‐1.388 ‐0.232 0.007TLossE (centered) .991 ‐0.009 ‐0.587 ‐0.569 0.016TLossE:Age 1.0007 0.0007 ‐0.005 0.007 0.015
Weights =1/TLossE; ANOVA with OLS model: p<.001results of ANOVA test with model including TOWN grouping factor: p=0.50
3.2B) Worst pest = rodents OLS Regression: Adjusted R‐squared: 0.27 , df=140, p‐value: 3.5e‐09
log Exp(coef) coef. [95% CI] p. (Intercept) 4964 8.51 7.76 9.240 <.0001Age 1.11 0.104 0.047 0.161 <.001Age^2 .999 ‐0.001 ‐0.001 ‐0.001 0.002Eth_Punu 1.14 0.131 ‐0.183 0.445 0.410Eth_Other .499 ‐0.696 ‐1.068 ‐0.324 <.001TLossR 1.014 0.014 0.004 0.024 0.011Dist 1.197 0.180 0.045 0.315 0.010results of ANOVA test with model including TOWN grouping factor: p=0.45
3.2C) Worst pest = primates OLS Regression: Adjusted R‐squared: 0.56, df=41, p‐value: 1.48E‐07
log Exp(coef) coef. [95% CI] p. (Intercept) 3011 8.010 7.534 8.486 <.0001Age 1.02 0.017 0.003 0.031 0.018Hhold 1.12 0.115 0.056 0.174 0.003Mhelp 1.44 0.363 0.057 0.669 0.025PerBan 1.01 0.013 0.007 0.019 <.0001TRisk10 0.91 ‐0.097 ‐0.195 ‐0.001 0.058results of ANOVA test with model including TOWN grouping factor: p=0.45
3.2) All Farmers with no apparent strategy Deviance=165, Residual variance: .41 Number of obs: 300log Exp(coef) coef. [95% CI] p.
(Intercept) 4316 8.39 8.115 9.125 <.0001Age 1.08 0.077 0.042 0.112 <.0001Age^2 .999 ‐0.0007 ‐0.001 0.000 <.001Mhelp 1.21 0.192 0.051 0.333 0.008Dist 1.19 0.178 0.082 0.274 <.001TLossA .994 ‐0.006 ‐0.010 ‐0.002 0.013Random effects (TOWN, N=33): Variance=.05, std. dev.=.22, p=.005
N=301
N=92
N=145
N=43
Figure 3.2: Farm size models for existing farms without protection.
49
estimated losses are significantly larger, increasing by 1.2% with each percent
increase in estimated losses. Finally, for the 43 farmers who consider their worst
pest to be primates, (Fig 3.2C), farm size decreased considerably with higher
estimated losses to pests.
Discussion:
The significance of LCAE and LCAR in the protection models suggests that they
provide good proxies for estimating farmers’ relative incentives to protect farms
against elephants and rodents, respectively. Raiding intensity alone was not found
to be a good proxy for incentive to protect; individual farm parameters, specifically
size and crop composition, need to be taken into account.
Those who have relatively lower incentives to implement the labor‐intensive
strategies such as building fences or sleeping in the farm seem to be using a mixture
of coping strategies. Older farmers in areas with higher raiding risk seem to plant
more to buffer against losses, while younger farmers seem to plant less. One
possible explanation for this phenomenon is that younger farmers tend to be more
mobile and may have more opportunities to do small task‐work (bricole), potentially
at a higher payoff per unit of labor.
My results also suggest that the type of pest influences farmers’ coping strategies:
farmers with higher expected losses to rodents show evidence of planting more to
buffer against the losses, while those with higher expected losses to elephants and
primates seem to have more mixed strategies. This difference could be due to the
fact that losses caused by rodents are regular and thus easily predicted, whereas
those caused by elephants and primates are unknown risks. Farmers often
explained to me that of every X plants they planted, one was for the rodents. It is
therefore logical that they could plan ahead and plant X+1 plants for every X plants
they want to harvest. In the case of elephants, however, farmers generally do not
have a good idea of how many times they will raid or how much they will take at a
given time. Risk adverse farmers might plant extra just to be safe, especially if they
could bank any savings in good years. However, Gabonese farmers, especially in the

50
remote areas where elephants and primates tend to raid the most, generally find it
hard to bank surplus due to lack of transportation and access to market. It is not
uncommon for farmers to watch stock after stock of plantain or pile after pile of
cassava rot due to lack of clients (pers. obs., Pourtier 1984). Some farmers I
interviewed almost seemed to fear having too much. Instead of planting more,
farmers in such situations may use other strategies, such as planting farther away or
planting back‐up gardens right next to the house.
Although my results indicate that farmers with higher payoffs for building fences to
protect against elephants versus planting extra (LCAE) are indeed more likely to
build fences, this does not mean that these fences are effective. The only fences I
observed that were built by the farmers themselves, rather than by an organization
on their behalf, were made of rope and cans, sheets of zinc roofing, or logging cable.
I observed elephant prints inside farms with both zinc and rope fences within days
of the construction of the fence. Logging cable may provide better protection, but is
expensive (Chapter 2); the only cases I observed involved cable brought in by an
NGO or left over from an abandoned logging camp in the area.
This study provides evidence of the overwhelming lack of strategies being used in
Gabon to protect farms against elephants. Even where raiding is high, farmers are
generally unwilling to sleep in their farms. Fence building is also extremely
uncommon and those that are built are relatively cheap, in terms of both money and
labor, and ineffective. This supports the idea that the costs of known methods of
farm‐level protection generally outweigh the benefits for Gabonese farmers.
Characteristics that affect potential for adoption of similar protection strategies
should be examined before too much effort is invested in developing such strategies.
Looking beyond farm‐level protection may prove more fruitful for mitigating
farmer‐elephant conflict in the long run.
51
Cited References:
Bates, D., and M. Maechler. 2009. lme4: Linear mixed‐effects models using S4 classes. R package version 0.999375‐31.
Bolker, B. M., M. E. Brooks, C. J. Clark, S. W. Geange, J. R. Poulsen, H. H. Stevens, and J.‐S. S. White. 2009. Generalized linear mixed models: a practical guide for ecology and evolution. Trends in Ecology and Evolution 24:127‐135.
Gelman, A. 2008. Scaling regression inputs by dividing by two standard deviations. Statistics in Medicine 27:2865‐2873.
Gelman, A., Y.‐S. Su, M. Yajima, J. Hill, M. G. Pittau, J. Kerman, and T. Zheng. 2009. arm: Data analysis using regression and multilevel/hierarchical models. R package version 1.2‐9.
Peduzzi, P., J. Concato, E. Kemper, T. R. Holford, and A. R. Feinstein. 1996. A simulation study of the number of events per variable in logistic regression analysis. Journal of Clinical Epidemiology 49:1373‐1379.
Pourtier, R. 1984. Agro‐industrie et développement rural au Gabon: une contradiction? Pages 447‐459 in C. Blanc‐Pamard, J. Bonnemaison, J. Boutrais, L.‐J. Véronique, and A. Lericollais, editors. Le Développement Rural en Questions. Orstom, Paris.
R Development Core Team. 2008. R: A language and environment for statistical computing in R. F. f. S. Computing, editor. R Foundation for Statistical Computing, Vienna, Austria.
West, B., K. B. Welch, and A. T. Galecki 2007. Linear Mixed Models: A practical guide using statistical software. Chapman & Hall / CRC Press, Boca Raton, FL.
Zamar, D., B. McNeney, and J. Graham. 2007. elrm: Software implementing exact‐like inference for logistic regression models. Journal of Statistical Software 21.
Zeileis, A., C. Kleiber, and S. Jackman. 2008. Regression models for count data in R. Journal of Statistical Software 27.
52
Chapter 4.
A choice experiment of farmers’ willingness to pay for protection methods against cropraiding elephants in Gabon
Introduction:
Crop‐raiding by elephants threatens both human livelihoods and elephant
populations as angry farmers retaliate. As concerned agencies seek to mitigate
farmer‐elephant conflict, they generally push for “low cost,” low‐tech strategies of
protecting crops that farmers can implement with little assistance (Osei‐Owusu &
Bakker 2008). “Low cost” generally refers to monetary costs, under the assumption
that smallholder farmers do not have much financial capital with which to pay
upfront costs. The additional implicit assumption, however, that farmers can and
will take on often extensive labor costs to implement a strategy with low financial
costs, does not always follow (Graham & Ochieng 2008; Ongognongo et al. 2006).
Farmers’ valuation of tradeoffs between monetary costs and labor costs differ
across both individual and societal situations. One way to evaluate such tradeoffs in
decision‐making processes is to observe actual choices, or revealed preferences, of
individuals (e.g. Bockstael et al. 1987). In the case of farm protection in rural
situations, however, it can also be argued that farmers often lack the technical
knowledge and/or access to resources to implement potential protection methods,
and thus that current strategies provide limited insight into what farmers might
actually choose if provided with more technical or logistical assistance from
concerned agencies.
53
Choice experiments offer one mechanism by which to explore preferences in
tradeoffs via hypothetical markets. In a choice experiment, a respondent is asked to
choose between products or “packages”, comprised of a set of attributes (features)
with different levels in each package. For example, a respondent could be asked to
choose among travel “packages”, with three attributes: cost, time, and mode of
transportation. One package could be a $50 trip by car taking 6 hours, another
could be a $500 trip by plane taking 3 hours, and a third package could be a $200
trip by train taking 4 hours. By gathering the respondent’s preferences for a
number of different choice sets, one can gain much insight into how that person
evaluates tradeoffs between time and money as well as into which factors most
influence that person’s decision‐making.
Choice Experiments are attractive tools in their intuitive nature and ability to focus
on different product attributes rather than valuation of one total product. Another
advantage over many other preference solicitation techniques is their empirical
grounding in behavioral theory and compatibility with random utility theory
(Hanley et al. 1998; Louviere et al. 2000). Choice experiments allow for a level of
irreducible variability or error, associated with each individual, such that no
individual is assumed to be a perfect chooser who consistently uses deterministic
choice rules. Accounting for variance in errors is always important for statistical
validity, and is especially important in this case of hypothetical tasks, where
responses may be more vulnerable to transient feelings or thoughts (Shogren 2006).
Choice experiments are common in marketing research and are growing in use in
the environmental and health sectors (Alriksson 2008; Hanley et al. 1998; Louviere
& Lancasar 2009). Despite their rapid increase in research in developed countries,
choice experiments are still quite rare in the contexts of lesser developed countries
(Mangham et al. 2008). These methods can be of particular value in such contexts,
where the market value of services is often less apparent than it is in industrialized
nations. However, the implementation of choice experiments requires great care,
especially in the context of the lower literacy and education levels often
encountered. When designing a choice experiment, one is presented with great

54
tradeoff between the statistically sound design that will yield precision in estimated
parameters (assuming that the respondents made realistic choices) versus the most
intuitive or realistic design that will best assist respondents in making realistic
choices.
Here, I present a choice experiment designed to gain insight into the characteristics
that influence farmers’ likelihood of adopting methods to protect crops from
elephants in Gabon. Field observations reveal that Gabonese farmers rarely
implement protection strategies despite substantial level of crop loss in certain
locations (Chapter 3). It is clear that tradeoffs in allocation of labor (Chapter 2), as
well as other cultural and demographic factors (Chapter 3), significantly impact
farmers’ decisions of whether to adopt known strategies. However, because the
range of known strategies is quite limited, it is useful to identify the characteristics
that would make future strategies attractive to farmers.
The purpose of this choice experiment was to evaluate the general characteristics of
hypothetical crop protection strategies that most heavily influence their likelihood
of being adopted by farmers, and to gauge farmers’ valuation of tradeoffs in costs,
particularly labor versus monetary. I also elaborate on decisions I made in the
design and implementation process to balance statistical power and response
validity. Because choice experiment methodology is constantly evolving (Louviere
& Lancasar 2009), and choice experiments conducted in developing nations are so
rare (Mangham et al. 2008), such transparent presentation of the process and
current knowledge gaps is vital to advancing effective use of this method.
Methods:
This choice experiment comprised one component of a larger interview and
observation process to understand farmer decision‐making regarding strategies to
protect crops from elephants. The design and pretest portion of this choice
experiment was an iterative process involving nearly 200 farmers with whom I
worked during the six months prior to administering the choice experiment. This

55
process entailed: 1) identifying the attributes most likely to influence farmers’
decisions of whether to adopt a protection method, 2) choosing the number of levels
and range for each attribute, 3) creating a statistically efficient design, 4) creating an
empirically efficient design, and 5) pre‐testing and altering the design based on
results.
• IDENTIFYING ATTRIBUTES: I used semi‐structured interviews and farm
observations with nearly 200 farmers to inform attribute selection. Questions
on why farmers did not choose to adopt known strategies to protect crops
revealed organizational issues (access to knowledge, access to materials) as well
as preferences and constraints influencing decision‐making. These latter
components were considered as attributes in the choice experiments. The most
frequent reasons given for abandoning or not implementing a particular crop‐
protection strategy were: not enough money, not enough labor available
(especially male labor), inability to visit the farm during certain periods due to
travel or other obligations, inability or unwillingness to sleep in the farm for
various reasons, and disputes over or concerns about others not contributing
their fair share in cooperative protection projects.
The final attributes selected for the choice experiment were therefore: A1)
monetary costs, A2) initial labor costs, A3) required visitation frequency, A4)
ongoing labor costs, A5) whether it is a collective project requiring cooperation
with other farmers, and A6) whether sleeping in the farm is required to
successfully implement the protection method (Table 4.1).
Table 4.1: Attributes presented in choice experiment
Units Levels A0) Protection from elephant raiding no/yes 0* 1 A1) Monetary costs 1000cfa 0* 40 80A2) Initial labor costs Hours 0* 16 32A3) Maintenance frequency times/month 1* 4 20A4) Maintenance labor hours/month 1* 8 16A5) Collective project requiring cooperation no/yes 0* 1 A6) Sleeping in farm required occasionally no/yes 0* 1 * status‐quo level and reference level in categorical statistical analyses

56
• ASSESSING NUMBER OF LEVELS AND RANGES FOR EACH ATTRIBUTE: Increasing the
number of levels within an attribute produces a tradeoff between the complexity
of the conclusions one can draw and the demands one places on the participants.
A respondent’s utility for an attribute with only two levels can only be
interpreted as linear, while that for an attribute with three levels can be more
complex. With increasing number of levels, the relationship can increase in
complexity. However, this imposes a steep cost in terms of the number of
packages that a respondent must consider for results to be conclusive.
More important than having many levels is to ensure that the range covered by
those levels maximizes information gained from each question. A range too
small to be sensitive to most respondents’ preferences, for example using levels
of price differing by $100 in an experiment to assess preferences in car
purchases, can misleadingly suggest that the respondent does not base choices
on that attribute. At the opposite extreme, values so large that many of the
participants automatically exclude any package with which they are associated
cause loss of valuable information regarding tradeoffs in attributes.
With the goal of minimizing the number of packages a respondent needed to
evaluate, it was critical to identify the ranges that would yield the most
informative responses. To assess these ranges, I asked farmers general iterative
willingness‐to‐pay questions in the form: Would you pay X (or work X number of
days, etc.) for a system that completely protects your farm against elephants?
Such questions are riddled with pitfalls and are unlikely to produce accurate
estimates unless conducted very strategically with a large sample (Flachaire &
Hollard 2006). However, they provide a good starting point by which to gauge
general ranges that can then be calibrated in further experiments, as was my
goal here.
About half of the farmers interviewed gave willingness‐to‐pay estimates of
80,000 to 100,000cfa, 30% gave estimates between 20,000 to 50,000cfa, and
20% were not willing to pay even 20,000. These results led me to choose three
57
levels for monetary value: 0, 40,000cfa, and 80,000cfa (Table 4.1). Following a
similar process, I chose three levels for initial labor costs (one day, two days, and
four days), three levels for visitation frequency (once a week, twice a week, and
five times a week), and three levels of ongoing labor costs (one hour per week,
two hours per week, and four hours per week). Although many farmers who
expressed willingness to cooperate with others on a protection project indicated
that there was a maximum number of participants (generally three to five)
beyond which they would less likely join, the fact that many others flatly rejected
any cooperation led me to set is as a dichotomous variable: cooperation versus
no cooperation. Similarly, the large number of farmers indicating that said they
would flatly reject any project requiring sleeping in their farm led me to set that
as a dichotomous variable: requires sleeping in the farm occasionally, or not.
• CREATING A STATISTICALLY EFFICIENT DESIGN: The statistical efficiency of a choice
experiment refers to the level of precision at which one can estimate effects for
the given number of packages presented. If one is not extremely careful with the
design of the experiment, the effects of one or multiple attributes can confound
the effects of other attributes. To avoid this, the options presented should be
balanced (all levels presented an equal number of times for each attribute) and
orthogonal (all pairs of attribute levels presented an equal number of times)
whenever possible. Recent methods of designing optimally efficient choice
experiments (Burgess & Street 2005; Street et al. 2005) demonstrate that
relatively small choice experiments can have strong statistical power when
balanced and orthogonal. The design choices I made in steps one and two result
in a design with two attributes with two levels each and four attributes with
three levels each, for which there is no orthogonal array. To produce the most
efficient design possible under these conditions, I used the %choiceff macro in
the marketing research application for SAS 9.2 (Kuhfeld 2009). A highly efficient
design was identified using a total of 18 runs (packages), partitioned into six
separate tasks in which the respondent chooses among three packages each
time. This design is provided in Appendix C.
58
• MODIFYING THE DESIGN FOR EMPIRICAL EFFICIENCY: Although the above design is
statistically efficient, it lacks empirical validity in that it requires that the
respondent choose one of the proposed packages in each set; in reality the
respondent may think all options are bad and prefer to stick with the status quo
(no protection, in this case). By forcing choices, one risks artificially inflating a
respondent’s utility value for one or more attributes. This can be corrected by
including a status quo option in each set, although by doing so, the balance, and
thus statistical power, of the design is greatly reduced. Although work is still
needed on methods for analyzing data with status quo options (Louviere &
Lancasar 2009), I included a status quo option for the sake of empirical validity.
Another problem with the most efficient design is that it assumes a perfectly
consistent responder; with only six choice sets to analyze, one inconsistent
response will likely prohibit convergence in the statistical model. One solution is
to increase the number of observations by doubling the number of choice sets.
This greatly increases the demand on the respondent, however, and risks
introducing more inconsistency due to respondent fatigue. Another option for
increasing the number of observations is to use Best‐Worst scaling (Hensher et
al. 1999; Louviere et al. 2008): instead of asking the respondents to choose only
their favorite option from the choice set, one asks them to choose both their
favorite and least favorite options. In this case of only three choices per set, this
is no different than asking for a full ranking of choices, but is shown to be more
empirically sound than full ranking in the case of larger choice sets (Louviere et
al. 2005). I used Best‐Worst scaling in the hopes of compensating for both the
decreased statistical efficiency introduced by the status quo option and the lack
of robustness caused by the small number of choice sets.
IMPLEMENTATION: I randomly selected sixty farmers within ten villages with endemic
crop‐raiding problems to participate in the choice experiment. I explained the
activity, emphasizing the fact that the scenarios I was about to present were purely
hypothetical. While there is empirical benefit to making participants believe that

59
they are making real decisions, the moral implications of doing so strongly outweigh
the benefits in this situation in consideration of both the farmers involved as well as
of future researchers and development workers who must deal with jaded farmers.
To reduce hypothetical bias, I worded questions clearly to ensure that participants
knew I was asking what decision they would make right now rather than what they
might do under some unknown set of circumstances (Blumenschein et al. 1998).
I presented each package as a string of simple images representing each attribute at
its given level. I explained that this package represented the costs of a hypothetical
method to protect a farm from elephants that was completely efficient (no elephants
would enter) provided that the farmer paid all of the costs and accepted all of the
conditions presented in the package. I first presented each new package by itself,
asking the farmer to decide whether she or he would accept the corresponding costs
and conditions portrayed in that package if an agency were offering to help set up an
efficient protection system under those conditions, with only that one option to
offer. After the three packages in the set were evaluated individually in this manner,
I then asked the farmer to choose his or her preferred package from those valued
higher than the status quo, then his or her preferred package from the remaining
two if all three were valued above the status quo.
To ensure that the participants understood the activity, I began with a warm‐up set
(Scarpa et al. 2003). Because four of the attributes represent continuous factors
with logically preferred directions (ceteris paribus, one prefers to pay less and work
less), I was able to evaluate the participant’s understanding of the task by creating
logically inferior and superior situations. For example, the attributes of the first
package were set at: 40000cfa7, 2 days of initial work, 2 hours per week of
maintenance, etc. while those of the second were set at: 0cfa, 1 day initial work, 1
hour per week of maintenance, etc. I stressed that fact that each package
represented the costs of an efficient protection method; one was no more efficient
than the other. If the respondent chose the first package, there was good indication
7 $1USD= 511 cfa at the time of study

60
that she or he did not fully understand the task and more explanation was provided
before continuing.
To gain maximum insight into interpretation and decision rules, I encouraged
participants to think out loud throughout the process and often asked for
explanation of rationale for a given choice. This interaction also helped to reduce
satisficing, where participants may be tempted to randomly select choices or to
make lexicographical choices in which they base choices on only one attribute and
randomly select in the case of ties (DeShazo & Fermo 2001). This think‐aloud
interaction also provided much qualitative insight into the complexity of decision‐
making that cannot be garnered statistically in a reasonable number of choice sets.
During the interview, I collected information on demographic variables such as age,
income, and household size to assess the influence of such variables on farmers’
preferences (Table 4.2). I also assessed raiding risk at the town level through
independent field observations to analyze whether intensity or risk of elephant
raiding increased a farmer’s willingness to pay different costs of protection. Raiding
risk was recorded as an ordinal variable, from zero to nine, with zero representing
no risk of elephant raiding and nine representing year‐round presence of elephants
in the village center. All towns included in this study had a risk rating above three,
meaning that elephant raiding was a real risk for all participants but at varying
levels of probability and intensity (Table 4.2).
Table 4.2: Characteristics of choice experiment participants Income level of farmer and spouse N 0 No income outside agriculture 121 Irregular income, from hunting/fishing/odd jobs/small stipend (~$20‐$40/month) 132 Regular income from hunting/fishing/task labor/small pension (up to $100/month) 123 Steady, salaried job or steady retirement income (>$100/month) 134 Relatively wealthy 2 Age
<40 N=13 4059 N=13 6069 N=22 >69 N=5 Risk of elephant raiding N 4‐‐5 Elephant raiding is real risk but occurs sporadically (temporally/geographically/both) 216‐‐7 Elephants raid every year and in all farming zones, but rarely arrive in village center 168 Elephants are present many months out of the year and frequent village center 16

61
ANALYSIS: I analyzed ranked choices via an exploded logit model fit using PROC
PHREG in SAS 9.2. PROC PHREG was designed as a survival analysis package but fits
choice experiment data well when set to maximum likelihood estimation (Allison
1999; Kuhfeld 2009). One drawback of this procedure is that it assumes that each
choice set is an independent observation rather than one of several made by the
same respondent. I compensated for this in the results by estimating the variance‐
covariance matrix using the robust sandwich method to take into account multiple
observations from the same farmer.
I analyzed both main effects and expected two‐way interaction effects that farmers
suggested during think‐aloud activities. Particularly, I examined the interaction
between the cooperation and sleep attributes and the cooperation and monetary
cost attributes due to suggestion by many farmers that they considered both the
sleep and monetary cost options differently depending on whether cooperation was
involved.
In addition to attribute effects, I analyzed the effect of individual‐level variables on
odds of package rejection. Under the hypotheses that a farmer with higher income
will be willing to pay more, that an older farmer will be more willing to sleep in the
farm, and that a farmer under higher risk of elephant raiding will be more willing to
accept higher costs, I examined the effect of income, age, and raiding risk on
rejection rate.
To analyze rejected packages, I fit a binomial logit mixed model using PROC
GLIMMX, allowing for different variances among individuals as well as towns. All
packages rated higher than the status quo were assigned a one, and all packages
rated lower than the status quo were assigned a zero. I analyzed all attributes as
categorical variables to allow for identification of the particular level at which a
given attribute causes a farmer to reject the package.
62
Results:
Of the original 60 participants, seven rejected the activity or dropped out early and
four gave protest votes, rejecting every package including one requiring nothing but
a few hours of work. The final sample size used for the analysis was thus 49. The
average participant was 52 years old and had an income of 1.6, meaning that most
participant households earned some money from non‐agricultural sources such as
hunting, fishing, odd jobs, or very small government stipends, but most had no
steady income (Table 4.2). Average raiding risk was six, meaning that elephants
habitually raided farms in all zones outside the core village area (Table 4.2).
The exploded logit model of ranked choices revealed highly significant negative
odds of adoption associated with four of the six attributes tested: monetary costs,
maintenance labor costs, and requirements of cooperating with others and sleeping
in the farm (Table 4.3) An additional attribute, Initial labor, received a marginally
significant negative estimate (p=.06). Only one attribute, frequency of maintenance,
showed no signs of significance.
Setting the four three‐level variables as categorical enables exploration of the
linearity of the acceptance odds for these attributes. The ranking for the three levels
of monetary costs followed a nearly perfect linear path, with an 80,000cfa monetary
cost receiving a negative odds estimate twice that of a 40,000cfa monetary cost.
Odds for Initial labor and monthly maintenance labor tended to plateau, however,
with a relatively large difference between the middle level and the lower reference
level, but little difference between the middle level and the highest level. Odds for
maintenance frequency followed a curved path, with positive odds attributed to the
middle level and negative odds attributed to the highest level. Neither of these
levels was significantly different from the reference level, however.
Significant interaction effects were observed between cooperation and sleep and
cooperation and monetary costs (Table 4.3). While a package had half the odds
(exp(‐.71)=.49) of being selected if it required sleeping in the farm occasionally,
these odds were increased to .6 (exp(‐.71+.3)=.6) if cooperation was required. The

63
overall impact of cooperation on odds of package selection was significantly
negative, however. This is due to the interaction between cooperation and other
costs, particularly monetary. At the reference levels of zero monetary costs and low
labor costs, farmers exhibited indifference to cooperation and many even preferred
it. At higher labor costs and especially monetary costs, however, cooperation was
strongly disfavored. Cooperation served to further decrease the odds of a farmer
selecting a package involving monetary from ‐.007 per 1000cfa to ‐.009 per 1000cfa.
Table 4.3: Aggregate utility values for protection costs from exploded logit model
Lines highlighted with grey indicate results from model where A1‐A4 were coded as continuous variables. White lines represent model where A1‐A4 were coded as categorical variables.
Attribute utility std. error
monetary equiv. (cfa)
p.
A0) Protection from raiding ‐2.190 0.438 336,923 <.0001‐2.190 0.422 312,857 <.0001
A1) Monetary (1000 cfa) ‐0.007 0.001 ‐1,000 <.0001L1) 40 000cfa ‐0.007a 0.002 ‐1,000 0.001 L2) 80 000cfa ‐0.007a 0.0001 ‐1,000 <.001
A2) Initial labor (hrs) ‐0.003 0.002 ‐462 0.06L1) 16 hours ‐0.004a 0.004 ‐625 0.18 L2) 32 hours ‐0.002a 0.0002 ‐268 0.21
A3) Maintenance frequency (times/mo) ‐0.003 0.002 ‐462 0.24L1) 4 (once a week) 0.020a 0.012 2,857 0.15 L2) 20 (five times a week) ‐0.005a 0.004 ‐679 0.22
A4) Maintenance labor (hrs/mo) ‐0.020 0.008 ‐3,077 0.008L1) 8 (two hours a week) ‐0.054a 0.015 ‐7,679 0.0003 L2) 16 (four hours a week) ‐0.033a 0.009 ‐4,643 0.0002
A5) Must Cooperate ‐0.335 0.11 ‐51,538 0.002 A6) Must sleep sometimes in farm ‐0.71 0.15 ‐109,231 <.0001A5*A6) Interaction : cooperate and sleep 0.3 0.118 46,154 0.014 A1*A6) Interaction: cooperate and money ‐0.002 0.001 308 0.03
a values represent a single unit of change in the units of the given attribute
ASSESSING THE MONETARY EQUIVALENTS OF ATTRIBUTES: The odds ratio assigned to each
attribute can also be interpreted as farmers’ collective utility for that attribute, or
the value they place on that attribute relative to others. The linear nature of the
monetary cost attribute allows for easy calculation of marginal rates of substitution
to measure trade‐offs between different types of costs in comparable units

64
(Lancasar et al. 2007). By dividing all utility estimates by that for monetary cost
(.007) and multiplying by 1000 to get the original units for monetary costs8, I
converted all utility values into their monetary equivalents. Respondents
collectively valued one hour of upfront labor at 462cfa, in near perfect alignment
with the going market rate of 2,500 to 3,000cfa for a six‐hour day of labor.
Respondents collectively valued an hour per month of labor at 3,077cfa, or 256cfa
per hour over the course of the year. Requiring cooperation decreased the value of
1000cfa by almost a third. Finally, sleeping in the farm was valued at an equivalent
of ‐109,000cfa and having efficient protection over doing nothing was valued at an
equivalent of 336,923cfa.
INDIVIDUAL UTILITIES: In the mixed model of package rejection versus the status quo,
monetary costs, at both the 40,000cfa and 80,000cfa levels, and the requirement of
sleeping in the farm both had significant positive influence on the odds of a package
being rejected (Table 4.5). Of the individual‐level variables, only income was
significant at the .05 level: respondents with higher income had lower odds of
rejecting packages entailing costs of 80,000cfa. Higher risk of elephant raiding
showed weak evidence of reducing the odds of rejection of packages with higher
costs (p = .1).
Table 4.4: Odds of package rejection model – logistic mixed model
Attribute Log odds
std. error
p.
Intercept ‐11.5 4.26 A1) Monetary (1000 cfa) 0.074 0.017 <.0001
L1) 40 000cfa 2.48 0.554 <.0001L2) 80 000cfa 4.06 0.627 <.0001
A2) Initial labor (hrs) ‐0.008 0.009 0.42A3) Maintenance frequency (times/mo) 0.002 0.009 0.81A4) Maintenance labor (hrs/mo) 0.030 0.026 0.26A5) Must Cooperate .126 0.25 0.61A6) Must sleep sometimes in farm 2.23 0.28 <.0001 Income Individual income level .470 0.51 0.35Risk Risk of elephant raid 0.53 0.53 0.32A1*Income Interaction: income & monetary .007 0.003 0.036 A1*Risk Interaction: risk & monetary ‐0.004 0.002 0.10
8monetary costs were coded in thousands of cfa rather than single cfa

65
Although most ranked models did not converge at the individual level, a simple
summary of farmers’ decision behavior shows great heterogeneity in preferences
(Table 4.6). Barely half (23) of the participants rated all packages presented higher
than the status quo option of no protection, while four participants did not rate a
single package higher than the status quo. Seven respondents rejected any package
involving any amount of money and an additional four rejected any package
involving 80,000cfa. Ten respondents refused any package involving sleeping in the
farm while an additional three refused sleeping in the farm unless cooperation was
a requirement and two refused sleeping in the farm if cooperation was required.
Although visitation frequency was not significant in the aggregated model, four
farmers refused any package requiring visiting their farms five times a week.
Discussion:
The aggregated analysis gives a good indicator of the attributes that are most
important for adoption of crop protection methods by the general farming
population in Gabon. A method that costs more in terms of money and or labor has
significantly lower odds of being chosen than a method that costs less; however,
farmers are collectively willing to pay quite a bit for protection in terms of both
money and time.
Table 4.5: Decision strategies of choice experiment participants (N=53)
26 Yes to all packages relative to status quo 4 No to all packages relative to status quo 7 No to all packages involving any money 4 No to all packages involving >40 000 cfa 10 No to all packages involving sleeping in the farm 3 No to packages involving sleeping in the farm unless cooperation involved 2 No to packages involving sleeping in the farm unless cooperation not involved 4 No to all packages involving visiting the farm five days a week 53 TOTAL number of participants
66
Initial labor costs are valued at 462cfa per hour, which coincides almost exactly with
the going market rate in most rural settings in Gabon. With increased labor costs,
collective valuation of an hour of labor decreases, however. This might reflect the
fact that initial labor tasks require heavy, traditionally male labor. Many rural
farmers have no access to such labor and thus need to pay wage laborers. Those
farmers with access to such labor may value it lower than those without.
Participants collectively valued an hour of labor per month across the year as about
half of that of initial labor, which could be a phenomenon of discounting or over‐
optimism. It might also reflect other factors such as the generally less‐intensive
nature of monthly work compared to initial work, or the already limiting aspect of
male labor during the critical field preparation period.
If a project requires sleeping in the farm, the odds are much lower that it will be
accepted, although odds increase if it is part of a cooperative project. Projects
involving money, however, have lower odds of being accepted if part of a
cooperative project. This inverse effect of cooperation was explained quite simply
by several participants: it is dangerous to sleep in the forest by oneself, thus
cooperation must be involved if many are to agree to sleep in their farms. However,
the more people involved in a project the more likely some are not going to pay
their fair share or do their fair share of the work. This free‐riding dilemma has been
cited by many farmers as the reason protection solutions of the past do not work
anymore. Communication (Ostrom & Walker 1991), and collective identity (Simon
& Schwab 2006) help overcome such dilemmas; most villages, however, are
experiencing a much higher turnover of people than in the past (chapter 5), thus
making it difficult to build or maintain such institutions.
The aggregate utility model is not intended to imply that all farmers have the same
utility functions. To the contrary, results show that farmer utility is quite
heterogeneous. Although collective willingness‐to‐pay estimates are quite high,
many individuals exhibited low personal willingness‐to‐pay estimates by accepting
the status‐quo of no protection over a package they deemed too expensive. The
option to reject packages relative to the status quo prohibited the estimate and

67
comparison of individual farmers’ utility values because attributes that were
consistently rejected resulted in utility estimates of negative infinity. Also, the
differing number of tied or unranked packages resulted in different variance
structures for different farmers, making comparison of estimates useless. A simple
summary of status quo responses reveals the strong empirical necessity of including
it, however. Many farmers used this option; had they been forced to choose one of
the three non status‐quo packages, resulting utility estimates would have been
artificially inflated.
An ideal method to analyze heterogeneity of utility based on characteristics of
individual responders for a choice experiment using the status quo option remains
to be ironed out. Regardless, this process offers many advantages over other
methods used to solicit willingness‐to‐pay information. The primary advantage is
the ability to compare different attributes at once, thus assessing willingness‐to‐pay
in monetary, labor, and more abstract values rather than relying on assumptions of
the importance of one relative to the others. By conducting these experiments in
person and incorporating a think‐aloud component, one can also gain much direct
insight into decision rules of the participants involved.

68
Cited references Allison, P. D. 1999. Logistic regression using the SAS system: Theory and application. SAS
Institute, Cary, NC.
Alriksson, S. 2008. Conjoint analysis for environmental evaluation: a review of methods and applications. Environmental Science and Pollution Research 15:244‐257.
Blumenschein, K., M. Johannesson, G. C. Blomquist, B. Liljas, and R. M. O'Conor. 1998. Experimental Results on Expressed Certainty and Hypothetical Bias in Contingent Valuation. Southern Economic Journal 65:169‐177.
Bockstael, N., I. Strand, and M. Hanemann. 1987. Time and the Recreational Demand Model. American Journal of Agricultural Economics 69:293‐302.
Burgess, L., and D. Street. 2005. Optimal designs for choice experiments with asymmetric attributes. Journal of Statistical Planning and Inference 134:288‐301.
DeShazo, J. R., and G. Fermo. 2001. Designing Choice Sets for Stated Preference Methods: The Effects of Complexity on Choice Consistency. Journal of Environmental Economics and Management 44:123‐143.
Flachaire, E., and G. Hollard. 2006. Controlling starting‐point bias in double‐bounded contingent valuation surveys. Land Economics 82:103‐111.
Graham, M. D., and T. Ochieng. 2008. Uptake and performance of farm‐based measures for reducing crop raiding by elephants Loxodonta africana among smallholder farms in Laikipia District, Kenya. Oryx 42:76‐82.
Hanley, N., R. E. Wright, and W. L. Adamowicz. 1998. Using choice experiments to value the environment ‐‐ Design issues, current experience and future prospects. Environmental and Resource Economics 11:413‐428.
Hensher, D. A., J. J. Louviere, and J. Swait. 1999. Combining sources of preference data. Journal of Econometrics 89:197‐221.
Kuhfeld, W. F. 2009. Marketing Research Methods in SAS. SAS Institute Inc, Cary, NC, USA.
Lancasar, E., J. Louviere, and T. Flynn. 2007. Several methods to investigate relative attribute impact in stated preference experiments. Social Science & Medicine 64:1738‐1753.
Louviere, J., D. A. Hensher, and J. D. Swait 2000. Stated choice methods, analysis and application. Cambridge University Press, Cambridge.
Louviere, J., and E. Lancasar. 2009. Choice experiments in health: the good, the bad, the ugly and toward a brighter future. Health Economics, Policy and Law 4:527‐546.

69
Louviere, J. J., L. Burgess, D. Street, N. Wasi, T. Islam, and A. A. J. Marley. 2008. Modeling the Choice of Single Individuals by Combining Efficient Choice Designs with Extra Preference Information. Journal of Choice Modelling 1:128‐163.
Louviere, J. J., T. C. Eagle, and S. H. Cohen. 2005. Conjoint Analysis: Methods, Myths and Much More. CenSoC Working Paper No. 05‐001. CenSoC.
Mangham, L. J., K. Hanson, and B. McPake. 2008. How to do (or not to do)... Designing a discrete choice experiment for application in a low income country. Health and Policy Planning 2009:151‐158.
Ongognongo, P., D. B. Ekoutoumba, and E. J. Stokes. 2006. Conflit Homme‐Eléphant dans la périphérie du Parc national de Nouabalé‐Ndoki au nord Congo. Evaluation des méthodes de lutte contre la dévastation des champs de manioc par les éléphants dans le village de Bomassa. Page 49. Wildlife Conservation Society, Brazzaville.
Osei‐Owusu, Y., and L. Bakker. 2008. Human‐wildlife conflict: Elephant, farmers manual. Page 10. Wildlife Management Working Paper, Number 12. Food and Agriculture Organization of the United Nations, Rome.
Ostrom, E., and J. Walker. 1991. Communication in a Commons: Cooperation without External Enforcement. Pages 287‐322 in T. R. Palfrey, editor. Laboratory Research in Political Economy. University of Michigan Press, Ann Arbor.
Scarpa, R., E. S. K. Ruto, P. Kristjanson, M. Radeny, A. G. Drucker, and J. E. O. Rege. 2003. Valuing indigenous cattle breeds in Kenya: an empirical comparison of stated and revealed preference value estimates. Ecological Economics 45:409‐426.
Shogren, J. F. 2006. Valuation in the Lab. Environmental and Resource Economics 34:163‐172.
Simon, A., and D. Schwab. 2006. Say the Magic Word: Effective Communication in Social Dilemmas. Workshop in Political Theory and Policy Analysis. Indiana University, Bloomington.
Street, D., L. Burgess, and J. J. Louviere. 2005. Quick and easy choice sets: Constructing optimal and nearly optimal stated choice experiments. International Journal of Research in Marketing.

70
Chapter 5.
Modern Gabonese use of “village” and implications for farmerelephant conflict
In much of the world, escalation of incidences of human‐wildlife conflict can be
attributed to increase in human population and reduction in wildlife habitat, forcing
wildlife into more frequent contact with humans (Kiiru 1995; Hill 1997; Boafo et al.
2004). In the case of farmer‐elephant conflict in Gabon, however, escalated crop‐
raiding is more often accompanied by enhanced elephant habitat and decrease in
local human populations. Rather than reduce elephant habitat, Gabon’s rural
farmers create an ideal habitat for elephants by maintaining the area around their
villages in a perpetual state of secondary regrowth, which elephants prefer to
primary forest (Barnes et al. 1991, Blake 2002). Although attracted to human‐used
lands, elephants are wary of human presence and tend to avoid large human
settlements (Blake et al. 2008). Gabon’s declining village populations, however,
result in a situation where elephants are more at ease in their proximity, and thus
potentially clash with farmers more often.
Trends in declining village populations may suggest that villages will soon die out
and farmer‐elephant conflict will no longer be an issue. However, my observations
in the field suggest that the village still plays a key role in the lives of many
Gabonese, including many who are not physically present at any given time. This
absentee population can help villages to persist, and even thrive, conceptually while
maintaining low physical populations ideal for elephants and detrimental to
agriculture in Gabon.
Here, I present trends in physical and conceptual use of the village space to explore
implications for farmer‐elephant conflict. Following elaboration on the

71
interconnectivity of farmer and elephant land‐use patterns in Gabon, I discuss
general trends in use of the village space and effects of such trends on agricultural
production in general and crop‐raiding by elephants specifically. I then present
findings from interviews with 4500 Gabonese citizens to further insight into current
and future use of the village space and inform discussion regarding implications for
farmer‐elephant conflict.
Farmer and elephant landuse patterns in the past and present
Although farmers and elephants would each likely be better off without the other,
they find themselves sharing spaces frequently, with a degree of “intimacy” (Hardin
2008) beyond that shared with most wildlife. In many locations, this phenomenon
is caused by limitations of suitable habitat for each (Boafo et al. 2004), but this is not
the case in Gabon, where the abundant forest is very sparsely populated. Instead,
affinity for one another’s “forest gardening” (Graham 1973) habits seem to draw the
two together.
In my interviews with farmers across Gabon, I occasionally found myself being
escorted along an old elephant path to arrive at a farmer’s field. Hunters also make
regular use of elephant paths, although most subsistence or leisure hunters I
interviewed claimed to fear elephant encounters and would prefer to hunt their
smaller game in a safer area. Likewise, elephants seem to fear humans, evidenced
by a strong preference for habitat farther from large settlements and roads (Barnes
et al. 1991; Blake et al. 2008; Laurance et al. 2006), but are attracted to habitats that
have been used by people in the recent past. Both logging and agricultural practices
in central Africa generate rich secondary growth for which elephants show strong
preference over the more open primary forest (Barnes et al. 1991; Lahm 1993). The
bonus of encountering fresh crops and fruit trees in the mix makes the typical rural
agricultural scene an ideal habitat for elephants.
Despite their affinity for human‐used lands, elephants tend to avoid infrastructure
and towns above a certain population threshold regardless of the surrounding
habitat when alternatives are available (Buij et al. 2007; Sitati et al. 2003). In many

72
situations throughout Africa, population increase and agricultural expansion limit
these other alternatives, bringing elephants and humans in contact regardless of
fear. In Gabon, however, the problem is the opposite: Village populations and rural
agriculture have experienced rapid declines in the past few decades, evidently
bringing many below the threshold population size that signals danger for
elephants. Small villages are often hard hit by elephant raiding, creating a self‐
perpetuating decline as many farmers give up and move elsewhere. While this
pattern feeds into the chronic rural exodus in Gabon (Pourtier 1989; République
Gabonaise 2001), villages do not simply disappear. Those that do momentarily
disappear often reappear years later, with the re‐founding party frustrated or even
outraged to have to cohabit their entitled space with elephants.
This dynamic between present and past human land use and elephant land use
brings about questions of how Gabonese are currently using the rural landscape and
how trends may play out in terms of agricultural production generally and farmer‐
elephant conflict specifically. General trends in urbanization, declining agricultural
production, and aging of the rural population may suggest that villages and rural
agriculture are on a path to extinction in Gabon. However, my observations in
Gabonese villages suggest that this might not be the case.
General demographic and agricultural trends in Gabon
Gabon has experienced an unwavering trajectory of urbanization since
independence in 1960. In contrast to the 14% reported in the 1960 census (INSEE
1961), around 80% of Gabon’s population currently lives in urban areas (Cour
Constitutionnelle 2005) (Table 5.1). This decline in rural population has been
accompanied by a natural decline in agriculture, due to the fact that 80% of the
nation’s agriculture is still produced by smallholder rural farmers (Nguema 2005).
Agricultural imports have thus risen steadily (FAOSTAT 2009); even the staple,
cassava, is increasingly imported from neighboring countries such as Cameroon and
Nigeria, despite the better growing conditions in Gabon (Nguema 2005).

73
Table 5.1: Urbanization trends in Gabon 1961 1993 2003
INSEEa RGPH93b RGPH03cTOTAL population: 444,264 1,014,976 1,269,732 % urban based on: % living in Libreville ? 41% 45% % living in towns with population >10,000 ? 66% 72% % living in 50 “urban” canton centers 14% 73% 80% % rural (based on last definition of urban) 86% 17% 20% rural population density d (persons/km2) 0.76 0.61 0.57
a (INSEE 1961) b(Bureau Central du Recensement 1993) c Data reported by the census bureau (Bureau Central du Recensement 2003) and published by the Constitutional Court, along with the officially recognized alterations (Cour Constitutionnelle 2005). Given the general disbelief of the official figure (IRIN 2008), and inability of representatives of the Court to explain how specific changes were made, I report the original RGPH numbers here. d global density estimate calculated by dividing total area outside urban centers by rural population
Not only has agriculture decreased overall in Gabon, but field size per individual has
decreased as well. While the agricultural census of 1960 reported farm sizes of
nearly one hectare per household (République Gabonaise 1969), I found an average
farm size of about half this in 2007 (Table 5.2, more details in Chapter 2). Smaller
studies in different locations have found sizes in line with this trend (Edou‐Edou
2005; Lahm 1993). If one accounts for declines in production from other types of
farms, such as coffee and cocoa, declines in average production per farmer have
been much more severe than those reported here (Pourtier 1989). While changes
in policy and institutions can explain the decline in cash crops such as coffee and
cocoa (Anderson 1987; Nguema 2005), the decline in production of subsistence
crops is more likely linked to demographic changes.
Table 5.2: Average farm size (ha) over time 1960a 1989b 2005c 2007d 0.975 0.632 0.5 0.491
a Agricultural census, N=960 farmers in 240 villages (République Gabonaise 1969) figure only includes type VI (arachid) and VII (viviere) farms.
b 45 farmers in the Ogooué Ivindo province (Lahm 1993) c 72 farmers in the Ayeme region of the Estuaire province (Edou‐Edou 2005) d Personal data from sample of 426 farmers in 36 villages (Chapter 2)
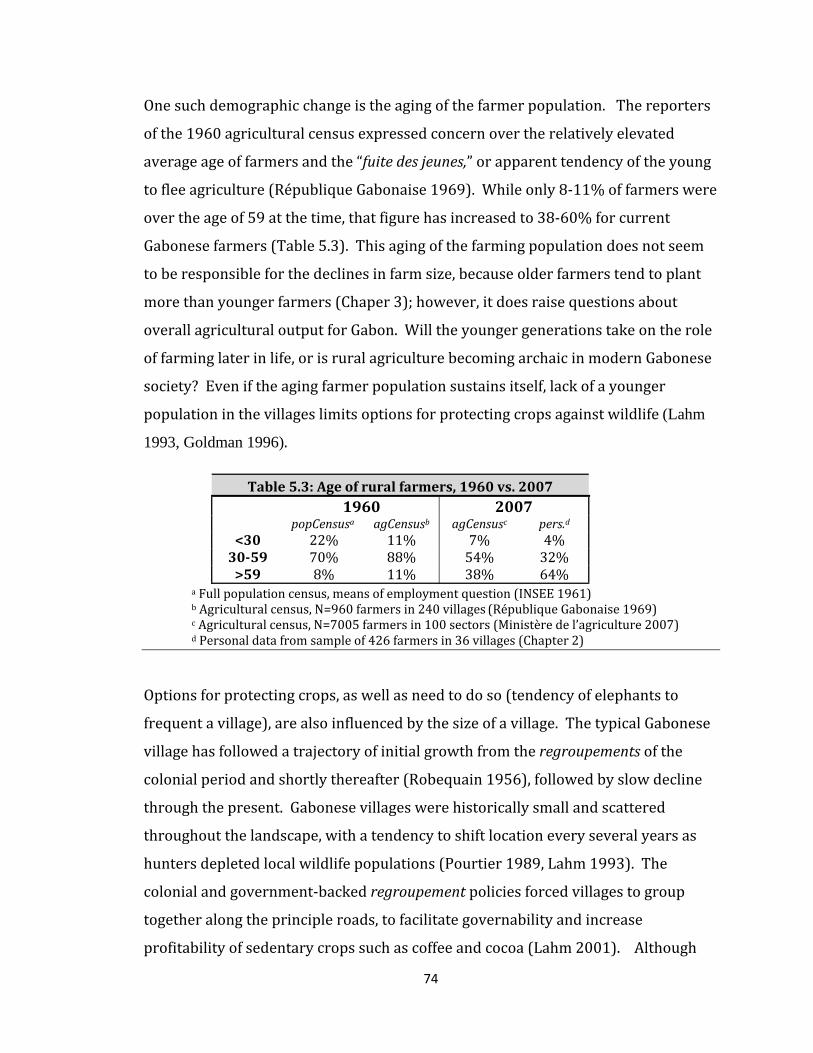
74
One such demographic change is the aging of the farmer population. The reporters
of the 1960 agricultural census expressed concern over the relatively elevated
average age of farmers and the “fuite des jeunes,” or apparent tendency of the young
to flee agriculture (République Gabonaise 1969). While only 8‐11% of farmers were
over the age of 59 at the time, that figure has increased to 38‐60% for current
Gabonese farmers (Table 5.3). This aging of the farming population does not seem
to be responsible for the declines in farm size, because older farmers tend to plant
more than younger farmers (Chaper 3); however, it does raise questions about
overall agricultural output for Gabon. Will the younger generations take on the role
of farming later in life, or is rural agriculture becoming archaic in modern Gabonese
society? Even if the aging farmer population sustains itself, lack of a younger
population in the villages limits options for protecting crops against wildlife (Lahm
1993, Goldman 1996).
Table 5.3: Age of rural farmers, 1960 vs. 2007
1960 2007
popCensusa agCensusb agCensusc pers.d
<30 22% 11% 7% 4%3059 70% 88% 54% 32%>59 8% 11% 38% 64%
a Full population census, means of employment question (INSEE 1961) b Agricultural census, N=960 farmers in 240 villages (République Gabonaise 1969) c Agricultural census, N=7005 farmers in 100 sectors (Ministère de l’agriculture 2007) d Personal data from sample of 426 farmers in 36 villages (Chapter 2)
Options for protecting crops, as well as need to do so (tendency of elephants to
frequent a village), are also influenced by the size of a village. The typical Gabonese
village has followed a trajectory of initial growth from the regroupements of the
colonial period and shortly thereafter (Robequain 1956), followed by slow decline
through the present. Gabonese villages were historically small and scattered
throughout the landscape, with a tendency to shift location every several years as
hunters depleted local wildlife populations (Pourtier 1989, Lahm 1993). The
colonial and government‐backed regroupement policies forced villages to group
together along the principle roads, to facilitate governability and increase
profitability of sedentary crops such as coffee and cocoa (Lahm 2001). Although

75
the villages have remained by the roads, the coffee and cocoa projects have failed
(Pourtier 1984), causing farmers to return to their swidden practices and thus
create lush secondary vegetation around their towns. This factor, coupled by the
general trends in declining rural populations and infrequent use of many of the
roads, has likely resulted in increased crop‐raiding in many villages. Today, the
average Gabonese village has 50‐100 people (RGPH2003, unofficial data), and many
I visited had a considerably smaller population present.
Unless such villages happen to have a skilled elephant hunter in their ranks, they
are unlikely to be able to ward off attracted elephants, especially given that most of
the people who are present are usually in their sixties or older. Many farmers tend
to move away from villages hard hit by elephant raiding, thus compounding the
relationship between village exodus and farmer‐elephant conflict. Despite this
emigration, villages rarely disappear. Many that do disappear are brought back to
life, only to experience similar issues, perhaps at a heightened level.
Survey of community and mobility in Gabon
To understand rural‐urban mobility patterns and the functioning of the modern
village, I interviewed 4500 Gabonese distributed throughout the urban and rural
landscape in proportion with the 1993 census data (Bureau Central du Recensement
1993), the latest data available at that level of detail at the time. Although I could
not replicate the distribution exactly due to time and logistical constraints, I shaped
my sample to best represent the rural and urban populations of each province
(Table 5.4), with the exception of the Nyanga, which I sampled at a finer resolution.
Because the Nyanga showed no significant differences with the other grouped
provinces for any of the variables reported here, I lump all provinces together for
the purposes of this report.
The survey was in the form of a questionnaire in French, administered by myself or
one of two trained assistants. Respondents could fill out the questionnaire
themselves or opt to respond to questions orally; about 95% chose the latter. I
pretested questions in both rural and urban settings and generated options for

76
closed‐form responses based on an open‐form version administered to the first 500
respondents. The final questionnaire and IRB approval are provided in appendix D
Table 5.4: Composition of sample for community and mobility interviews Sample RGPHa Sample RGPH93a
Province** urban rural urban rural average age** 28 24 Estuaire 38.3% 3.3% 42.2% 3.5%female** 51% 51% Haut O. 4.9% 1.1% 7.5% 2.8%living in urban** 78% 73% Moyen O. 0.2% 0.2% 1.8% 2.3%living in village** 22% 27% Ngounie 2.4% 0.1% 3.7% 4.0%currently in school 54% 34% Nyanga 14.4% 9.2% 2.1% 1.7%formally employed 12% 17% O. Ivindo 4.9% 3.7% 1.8% 3.1%task workers 9% 13% O. Lolo 1.5% 0.1% 1.9% 2.4%not in school nor 25% 36% O. Maritime 10.9% 0.6% 8.6% 1.0% employed Woleu‐Ntem 0.9% 3.3% 3.5% 6.1%N** 4500 TOTAL 78% 22% 73% 27%
** Parameter was purposely fixed by the sampling design a (Bureau Central du Recensement 1993)
HOME IDENTITY: When asked about “home” (chez vous), most respondents
immediately identified with a geographic location, to which they claim a strong
bond, although 46% had never lived in that location (Table 5.5). Although 78% of
respondents resided in an urban center, 47% cited a rural village as “home.” Most
respondents’ “homes” are locations to which they trace family ancestry. While this
“home” is solely a social space for some, the physical location has a distinct role for
many. Many youth spend vacations in the geographic “home” location and/or plan
to return to this location when they are older. Fifty‐five percent expect to live in
their “home” village when they are “old,” and 57% would live in a village if suffering
financial hardship. These responses suggest that the village is far from dying out,
but plays an important role at different stages of the lives of modern Gabonese.
Table 5.5: Identity with “home”(Chez moi) in Gabon current residence age
All urban rural <20 2029 3039 4049 50+
"Home" is a rural village 47% 40% 78% 38% 44% 52% 62% 79% Currently lives at "home" 22% 15% 46% 23% 15% 19% 31% 44% Was born at "home" 49% 41% 79% 38% 42% 55% 74% 88% Has never liveda at "home" 46% 53% 21% 60% 50% 38% 28% 14% a greater than 6 months
77
VILLAGE ROLE AS A SAFETY NET: Many respondents expressed importance in the village
as a safety net to fall back on when times are difficult. Given Gabon’s urban
unemployment rate of 27‐30% (République Gabonaise 1993), this “natural
insurance” (McSweeney 2003; Pichon 1997) is critical at one point or another in the
lives of many. This role is evidenced by the responses from young adults living in a
village: Of those between the ages of 18 and 24, 23% were “taking a break” from
school due to pregnancy or hardships, 48% had recently dropped out of school due
to pregnancy or hardships, and 23% had no source of funding to pay school fees.
Most men (74%) between the ages of 25 and 35 had attempted to find work in a city
without success. Most women between the ages of 25 and 35 were single mothers
who had not progressed far in school. Most farmed, and many sent food to children
who were in school in the city. Respondents almost unanimously agreed that life is
cheaper in the villages, and many commented that food is free9
VILLAGE ROLE AS A PLACE OF RETIREMENT: The village also clearly plays a role as a
retirement destination for many Gabonese. Fifty‐five percent of respondents,
including 42% of urban residents, expect to live in their “home” village when they
are “old.” Many explained their preference of the village for retirement with reasons
similar to retirees of industrialized nations: “it’s quieter and more peaceful in the
village,” or “the air is cleaner in the village.” Others saw returning to the village as a
personal duty or obligation: “I have to follow my ancestors and take care of their
land,” or “my grandmother farms so she can send me good food; I have to do the
same for my grandchildren – that’s the grandmother’s job.” While it is difficult to
predict what the respondents will actually do 30‐40 years from now, interviews
with farmers in the villages confirm that many people do return to the village in
older life stages, after having spent most of their life away. Of the 426 rural farmers
included in the survey, 42% had returned to the village after living in an urban area.
Farming is seen increasingly as a retirement activity (Franqueville 1984) and as a
form of both social security and family obligation.
9 Farmers clearly agree that there is a price to farming, however; see Chapter 4.

78
There is a notable difference, however, between the current farmers who took a
break from farming and returned and the 21% of urban dwellers surveyed who
believe that they will one day farm (Table 5.6): the majority of these latter (93%)
have never farmed on their own, and 23% have never even helped on a farm. Of
current farmers, on the other hand, 95% were farming or helping their relatives
farm regularly by the age of 12. This lack of farming experience among the younger
generations could help explain declining size of individual farms as well as
increasing lack of use of traditional techniques in dealing with raiding wildlife.
Table 5.6: Farmers and experience farming, current and future
Current farmers Has own farm currently Helped on a farm regularly by age 12
rural Urban rural urban no 17% 84% no 4% 5% yes 83% 16% yes 96% 95%
Potential future farmers Will farm in the future Have farmed in past
rural Urban rural urban Definitely not 4% 10% no 7% 69% Probably not 1% 3% yes 93% 31% Maybe 15% 44% Has helped on a farm Probably 1% 6% no 0% 21% Definitely 54% 15%
yes 100% 79%
VILLAGE ROLE AS AN INVESTMENT: Gabonese speak often of a moral obligation to invest
in one’s village both to keep the village alive and to pass along the village
inheritance to the next generation. Given the poor roads and very rudimentary
infrastructure in most villages, it is tempting to ask “what inheritance,” as did many
younger respondents who expressed no interest in the village. However, many
others, especially political leaders and elders who have witnessed the coming and
going of enterprises and interests, have more nuanced perspective on the potential
of the landscape and the importance of positioning oneself astutely. Even if they do
not currently use the village space, such individuals may invest both socially and
physically in that space as a means of guarding access to resources or preserving
future ability to contest such access to resources that may become more valuable
under different circumstances (Berry, 1993).
79
This sort of territorial claim‐staking is accomplished both through membership in
social networks as well as physical marking, typically via houses or fruit trees. As in
other parts of Africa (Hill 1963; Berry, 1985), houses are commonly used as a
symbol of belonging in Gabonese villages regardless of the current residence of the
owner. Cinder‐block houses “en dur” are awarded greatest respect as a means by
which to “invest” in one’s village, and are generally accepted as a valid claim to a
location regardless of the state of apparent abandonment of the house. This
phenomenon is especially apparent along the beach‐front lots of Mayumba, where
cement houses in various states of disarray litter the scenery, not so much as
remanants of more prosperous days but as anticipants of such prosperity. Such
cement houses are also common throughout villages in the interior of the country as
a signal of village inclusion, providing owners and their families with means of
access to land or other resources such as dividends from logging or access to future
development projects.
Eighty percent of the rural residents interviewed own a house, versus only 11% of
the urban residents. Of these home‐owning urban residents, 20% own a home in a
rural location. While the houses of rural residents tend to be of less durable
materials, such as clay and wood, urban residents build more commonly with
cement. Although 2% (20% of 11%) is a small percentage of the urban population,
it represents a considerable number of people staking a claim in village landscapes
relative to the small population currently residing in these villages. The relatively
young average age of the sample population also probably leads to underestimation
of this figure, as half of the sample population was school‐aged and unlikely to have
the resources to build a house.
Cheaper and more subtle than building a house, planting fruit trees can also be a
powerful means of investing in the village landscape. It is not trivial that 38% of
urban‐dwelling respondents claim to have planted fruit trees in a village; fruit trees
can provide a legitimate claim to a piece of land. In my work with rural farmers, I
often heard entire sectors of forest ascribed to a person based on the presence of
fruit trees he or she planted, regardless of whether that person currently lived in the
80
village. Such land could almost always be borrowed, free of cost, for a cycle of
farming, but the owner of the land was nonetheless acknowledged and would have
to be consented regarding more permanent uses of the land.
Fruit trees are also notable in their role in reviving abandoned villages; the presence
of trees such as oil palm and mango, which do not survive in the forest without
human assistance (White & Abernethy 1997), often form the basis of proof for the
existence of an ancestral village. In following up on complaints of farmer‐elephant
conflict, I visited seven such villages that had been completely abandoned and later
reestablished based on claims of ancestry and evidence of fruit trees. While
ancestral responsibility was generally evoked as the primary reason for reviving the
village, this concept was applied so loosely that the ancestors’ role in providing
future kin with diverse means of access to resources was more apparent than the
role of the kin in honoring their ancestors’ land10.
By formalizing villages, new leaders (chefs) receive access to government resources,
including modest monthly stipends as well as often generous envelopes of money
during election periods. Resource access generally extends farther, however, given
that founding members almost always have current or past government affiliations
which allow them to legitimize their village and afford the high costs of building
with cinder block and running a generator (the characteristics that seem to
distinguish reborn villages from permanent camps, which were banned during the
regroupements). In line with Bayart’s politics du ventre philosophy, re‐founding of
villages provides a means for individuals with some political influence to expand
and legitimize claims to resources by evoking tradition and ancestry. Such
resources may include access to land and wildlife, a cut in a nearby forestry interest
or development project, or simply more government resources to develop the
newfound village.
10 Ancestral responsibility can relate to anything from historical ethnic grounds to temporary dwellings of recent family members; three of the revived “villages” had in fact been temporary forestry camps where current founders recalled a parent or grandparent having lived, far from the traditional territories of their respective ethnicities.

81
Although revived villages represent a tiny percentage of the population, they can
attract a disproportionally large amount of resources due to the political influence
that village revivers generally wield. In the case of farmer‐elephant conflict, these
new villages can be especially draining on resources, as crop‐raiding is typically
chronic in these locations. Most residents of the revived villages I visited mentioned
relentless elephant raiding as a major reason for the original demise of the village.
Although two chefs I met were proud to announce ability to take care of their own
problem via talented elephant hunters with apparently privileged political status11,
those of four of the other five villages were outraged by the high level of elephant
raiding, and had or were seeking government funding for the problem. One chef,
who had revived a village in an area currently used for elephant tourism, was
seeking funding for a banana farm despite the fact that his new village consisted
only of his family, who lived there only during vacations. Such reformation of
villages by politically‐connected individuals thus creates new incidences of farmer‐
elephant conflict and likely detracts attention and funds from situations of farmer‐
elephant that impact a larger number of current and future farmers.
Conclusion:
The changing village role in Gabon likely aggravates farmer‐elephant conflict. The
combination of smaller populations, fewer young men to ward off elephants and
guard crops, less experienced farmers, and the constant repopulating of villages
previously ceded to elephants, all contribute to the problem of crop‐raiding.
Because Gabonese spend increasingly less of their time in the rural landscape, many
village populations have shrunk to levels that are not threatening to elephants.
Because most of the people who do reside in the villages are older, villages have a
difficult time actively warding off elephants via traditional techniques. Because new
farmers have increasingly less experience farming, these traditional techniques are
being forgotten regardless. However, because a larger proportion of Gabonese still
11 In these cases, farmer‐elephant conflict provides access to a different resource: elephants. This is similar to other situations I encountered where young men farmed small patches far away from their villages and evoked crop‐raiding as justification for hunting elephants in the area.

82
identify conceptually with the “village” and invest in that identity, and because a
smaller, but powerful, proportion re‐create village spaces, small villages persist
along with the problem of farmer‐elephant conflict. Although Gabonese villages are
unlikely to die out, elevated farmer‐elephant conflict and continued agricultural
decline are likely. Without large scale policy change, Gabon is unlikely to arrive at
the government’s goal of agricultural self‐sufficiency (République Gabonaise 2001)
in the near future.
Investment in improving the quality of existing roads may be the best way to
promote rural agriculture while decreasing farmer‐elephant conflict (Pourtier
1989). Although crop‐raiding among the primary concerns, rural farmers I
interviewed cited the bad quality of the roads and lack of transport more often than
wildlife when asked about the worst problem faced by farmers in the area. The
reporters of the 2007 agricultural census complain that they could not even arrive
in some of their selected villages due problems with transport (Ministère
d’Agriculture 2007). Urban residents who connect with these rural villages would
likely spend more time in them if the transport were better, potentially maintaining
a large enough human presence to ward off elephants. Improved roads would also
benefit agriculture by facilitating transport of agricultural products to the urban
markets, thereby increasing incentive for farmers to produce.
83
Cited References
Anderson, H. 1987. The Limits of Development Management: An Analysis of Agricultural Policy Implementation in Gabon. Page 279. Indiana University.
Barnes, R. F. W., S. Asika, and B. Asamoah‐Boateng. 1995. Timber, cocoa and crop‐raiding elephants: a preliminary study from southern Ghana. Pachyderm 19:33‐38.
Barnes, R. F. W., K. L. Barnes, M. P. T. Alers, and A. Blom. 1991. Man determines the distributions of elephants in the rain forests of northeastern Gabon. African Journal of Ecology 29:54‐63.
Bayart, J.‐F. 1989. L'Etat en Afrique. La politique du ventre. Librairie Artheme Fayard, Paris.
Berry, S. 1993. No condition is permanent: the social dynamics of agrarian change in sub‐Saharan Africa. University of Wisconsin Press, Madison, Wisconsin.
Berry, S. 1985. Fathers Work for their Sons ‐ Accumulation, Mobility and Class Formation in an Extended Yoruba Community. University of California Press, Berkeley.
Blake, S., S. L. Deem, S. Strindberg, F. Maisels, L. Moment, I. Inogwabini‐Bila, I. Douglas‐
Hamilton, W. B. Karesh, and M. D. Kock. 2008. Roadless wilderness area determines forest elephant movements in the Congo Basin. PLoS One 3.
Blake, S. 2002. The Ecology of Forest Elephant Distribution and its Implications for Conservation. University of Edinburgh.
Boafo, Y., U.‐F. Dubiure, E. K. A. Danquah, M. Manford, A. Nandjui, E. M. Hema, R. F. W.
Barnes, and B. Bailey. 2004. Long‐term management of crop raiding by elephants around Kakum Conservation Area in southern Ghana. Pachyderm 37:68‐.
Buij, R., W. McShea, P. Campbell, M. E. Lee, F. Dallmeier, S. Guimondou, L. Mackaga, N. Guisseougou, S. Mboumba, J. E. Hines, J. D. Nicholas, and A. Alonso. 2007. Patch‐occupancy models indicate human activity as major determinant of forest elephant (Loxodonta cyclotis) seasonal distribution in an industrial corridor in Gabon. Biological Conservation 135:189‐201.
Bureau Central du Recensement. 1993. Recensement Général de la Population et de l'Habitat du 1er juillet 1993; Répertoire des Regroupements & Villages. Page 43. Directeur Général de la Statistique et des Etudes Economiques, Ministère de la Planification et de l'Aménagement du Territoire, Libreville.
Bureau Central du Recensement. 2003. Recensement Général de la Population et de l'Habitat du 2003. Page 43. Directeur Général de la Statistique et des Etudes Economiques, Ministère de la Planification et de l'Aménagement du Territoire, Libreville.
Chiyo, P. I., E. P. Cochrane, L. Naughton, and G. I. Basuta. 2005. Temporal patterns of crop raiding by elephants: a response to changes in forage quality or crop availability? African Journal of Ecology 43:48‐55.

84
Cour Constitutionnelle. 2005. Décision nο 3/CC du février 2005. Pages 126‐128. Hebdo informations Nο 505, 16‐30 juillet 2005, Libreville.
Edou‐Edou, G. 2005. Etude des Systèmes d'Exploitation Agricoles de la zone d'Ayeme. Institut Gabonais d'Appui au Développement, Libreville, Gabon.
FAOSTAT. 2009. FAO Statistical Division.
Franqueville, A. 1984. La population rurale africaine face à la pénétration de l'économie moderne: le cas de Sud‐Cameroun. Pages 433‐442 in C. Blanc‐Pamard, J. Bonnemaison, J. Boutrais, L.‐J. Véronique, and A. Lericollais, editors. Le Développement Rural en Questions. Orstom, Paris.
Graham, A. D. 1973. The Gardeners of Eden. George Allen & Unwin Ltd., London
Hardin, R. 2008. Toward an ethic of intimacy: Touring and trophy hunting for elephants in Africa. Pages 419‐470 in C. Wemmer, and C. A. Christen, editors. Elephants and ethics: Toward a morality of coexistence. The Johns Hopkins University Press, Baltimore.
Hill, C. M. 1997. Crop‐raiding by wild animals: the farmers’perspective in an agricultural community in western Uganda. International Journal of Pest Management 43(1):77‐84.
Hill, P. 1963. Migrant cocoa farmers of southern Ghana. Cambridge: Cambridge University Press.
INSEE. 1961. Recensement et enquête démographiques 1960‐1961. Page 148. République Gabonaise, Service de Statistique, Libreville.
IRIN. 2008. Gabon: Census shows population of 1.5 million, but experts say the figure is too high. UN Office for the Coordination of Humanitarian Affairs.
Kiiru W. 1995. The current status of human‐elephant conflict in Kenya. Pachyderm 19:15‐18
Lahm, S. A. 1993. Ecology and Economics of Human/Wildlife Interaction in Northeastern Gabon. Page 128. Department of Anthropology. New York University, New York.
Lahm, S. A. 2001. Hunting and wildlife in northeastern Gabon: why conservation should extend beyond park boundaries. Pages 344‐354 in W. Webber, L. J. T. White, A. Vedder, and N. Naughton‐Treves, editors. African Rain Forest Ecology and Conservation. Yale University Press, New Haven, CT.
Laurance, W. E., B. M. Croes, L. Tchignoumba, S. A. Lahm, A. Alonso, M. E. Lee, P. Campbell, and C. Ondzeano. 2006. Impact of roads and hunting on central African rainforest mammals. Conservation Biology 20:1251‐1261.
McSweeney, K. 2003. Tropical forests as safety nets? The relative importance of forest product sale as smallholder insurance, Easern Honduras. Page 25. International Conference on Rural Livelihoods, Forests and Biodiversity, Bonn, Germany.

85
Ministère de l’agriculture. 2007. Projet de mis en place d’un échantillon maitre au Gabon République Gabonaise, Libreville.
Naughton, L., R. A. Rose, and A. Treves. 1999. The social dimensions of human‐elephant conflict in Africa. A literature review and case studies from Uganda and Cameroon. Page 80 pp. A report to the African Elephant Specialist, Human‐Elephant Conflict Task Force of IUCN. IUCN, Glands, Switzerland.
Nguema, V. M. 2005. L'agriculture du Gabon. Karthala, Paris.
Pichon, F. J. 1997. Settler households and land‐use patterns in the Amazon frontier: Farm‐level evidence from Ecuador. World Development 25:67‐91.
Pourtier, R. 1984. Agro‐industrie et développement rural au Gabon: une contradiction? Pages 447‐459 in C. Blanc‐Pamard, J. Bonnemaison, J. Boutrais, L.‐J. Véronique, and A. Lericollais, editors. Le Développement Rural en Questions. Orstom, Paris.
Pourtier, R. 1989. Le Gabon. Tome 2: Etat et Développement. Editions L'Harmattan, Paris.
République Gabonaise. 1969. Résultats de l'enquête agricole au Gabon 1960‐1961. Page 139. Ministère du plan de la coopération, Service de statistique générale, Paris.
République Gabonaise. 1993. Recensement général de la population et de l'habitat Bureau Central du Recensement, Ministère de la planification et de l'aménagement du territoire, Libreville.
République Gabonaise. 2001. Bilan Commun de Pays, CCA. United Nations, Libreville, Gabon.
Robequain, C. 1956. Citadins et ruraux du Gabon et du Moyen‐Congo. Annales de Geographie 65:305‐308.
Sitati, N. W., M. J. Walpole, R. J. Smith, and N. Leader‐Williams. 2003. Predicting spatial aspects of human‐elephant conflict. Journal of Applied Ecology 40:667‐677.
White, L. J. T., and K. Abernethy 1997. A Guide to the Vegetation of the Lope Reserve. Ecofac, Gabon.

86
Chapter 6.
Conclusion: Toward an integrated assessment of farmerelephant conflict in Gabon
Crop‐raiding by elephants threatens not only farmers’ livelihoods but also elephant
populations, as angry farmers retaliate, and national food security, as discouraged
farmers give up on farming altogether. Farmer‐elephant conflict is thus a key issue
for policy‐makers in Gabon concerned with a wide array of issues related to
agriculture, rural development and conservation. As the oil reserves currently
driving Gabon’s economy dwindle, the government is expected to rely more heavily
on its currently weak agricultural and ecotourism sectors (République Gabonaise
2001), thus increasing the pressure to address critical issues such as farmer‐
elephant conflict.
So far, little progress has been made in mitigating farmer‐elephant conflict in Gabon
despite general consensus regarding the high priority of the issue among farmers,
agricultural agents and conservation representatives. Although each sector is
making small investments in addressing specific instances of farmer‐elephant
conflict, most project leaders and experts I spoke with placed little optimism in the
prospects of their projects making a significant impact in reducing crop raiding or
appeasing affected farmers.
Several factors likely contribute to this lack of progress including:
• the diversity of the agencies involved and need for interagency collaboration
to avoid pursuing contradictory strategies
• the complex nature of the problem and need for information on diverse
topics ranging from farmer decision‐making to forest elephant ecology
87
• the geographic heterogeneity of the conflict and potential need for different
solutions at different scales
• the lack of data in Gabon, particularly pertaining to rural agriculture, and
small number of trained personnel permanently stationed in Gabon to
conduct such research and oversee long‐term projects (Anderson 1987; FAO
2008; Stads et al. 2004).
Integrated Assessment (IA) offers a robust methodology to guide policy‐making; it is
designed especially for such complex problems that involve diverse actors and
require information and perspectives from multiple disciplines. Although climate
change policy currently constitutes the bulk of IA application and reflection (e.g.
Intergovernmental Panel on Climate Change 2001), applications outside of climate
change are increasing rapidly, due to the alignment of IA objectives with the needs
of policymakers. While scientists are strongly involved in the IA process, the goal is
not to arrive at some objective scientific “truth,” but rather at a collective social
agreement regarding a given issue (Hisschemoller et al. 2001). Knowledge is
generated not for its intrinsic value alone, but rather to inform policy and decision‐
making (Tol & Vellinga 1998; Weyant et al. 1996). In this vein, it is especially
important to consider what kinds of knowledge are generated and whose
viewpoints are represented in the process.
Successful IAs include decision‐makers and citizens at all levels in the design,
creation, testing and use of the model or method (Jager 1998; Mitchell et al. 2006).
While democracy alone justifies inclusive participation, involving stakeholders is
especially critical in situations where the outcome depends on changes in
stakeholder behavior. For example, if the success of proposed solution to farmer‐
elephant conflict is contingent upon farmers adopting a given method or otherwise
altering their behavior, farmers should be key participants in the IA process.
When nonscientists are involved in an IA, it is often termed a Participatory
Integrated Assessment (PIA). At its best, PIA not only strives to integrate
knowledge and values of all participants into the policy product but also to enhance
88
future decision‐making skills through the process (van Asselt & Rijkens‐Klomp
2002). This process‐oriented approach is particularly important in this situation
because elephants are known to adapt to new situations, requiring continual
reassessment on the part of the planners (Osborn & Parker 2002). Process‐oriented
PIA could help decision‐makers in Gabon to identify a cohesive, feasible strategy to
address farmer‐elephant conflict and to gain empowerment and stronger analytic
and collaborative abilities for future decision‐making.
In chapters one, two, and three, I demonstrate some types of questions that
interested parties might pursue to gain insight into the scope of the problem and
potential solutions before committing to a particular strategy. These chapters are
limited to examining only one type of strategy, however: protecting individual farms
from raiding elephants. A problem as complex as farmer‐elephant conflict needs a
robust set of strategies. Decision‐making regarding both agricultural systems
(Bland 1999; Nassauer et al. 2007b) and elephant conservation (Blake et al. 2008)
benefit most from a complex systems perspective; it is no surprise that this conflict
at the interface is not easily addressed by singular strategies (Barnes 2002; Hoare
2001; Osborn & Parker 2003). The IA framework is specifically amenable to
incorporating diverse facets of such complex issues to allow for imagination of and
comparison among diverse intervention strategies. In the remainder of this chapter,
I outline the steps of an IA with particular emphasis on how a successful assessment
might look for identifying and comparing a broad range of strategies to address
farmer‐elephant conflict in Gabon.
Recommendations for an Integrated Assessment on farmerelephant conflict in Gabon:
PROCESS INITIATION:
The issue of farmer‐elephant conflict concerns a diverse array of agencies and
organizations, including those interested in planning/development, agriculture, and
conservation. Successful Integrated Assessments are generally initiated and

89
endorsed by an agency with the intentions and authority to implement the results
(MSG&GESI 2009). In this case, the agency best positioned to oversee and
implement an IA concerning such broad mandates would be the Ministry of
Planning, who sets Gabon’s development budget and passes down broad policy
goals to the other ministries, including the Ministry of Agriculture and the Ministry
of Waters and Forests.
Primary millennium goals set by the Ministry of Planning, in collaboration with the
United Nations and World Bank, include reducing poverty, increasing agricultural
self‐sufficiency, curbing rural exodus, protecting the environment, and diversifying
the economy via both agriculture and ecotourism (République Gabonaise 2001,
2003), all of which correspond to reasons for mitigating farmer‐elephant conflict
given by one or more of the individual organizations stating interest in the problem
(Table 6.1).
Table 6.1: Goals aligning agencies in common interest to mitigate farmer‐elephant conflict Goals underlying G1 mentioned by representatives of organizations MPPD1 goals G1) Reduce crop‐raiding by elephants
G2) Improve rural livelihoods MDG1, CCA‐1.1.5b G2.1) reduce trends in rural exodus (migration to urban centers) CCA‐1.2.3c
maintain villages at viable size for schools, health clinics, etc. reduce urban unemployment (use village as security net) MDG1
G2.2) Improve health and nutrition MDG1, CCA‐1.2G3) Improve nation‐wide agricultural production MDG1, CCA‐1.7
address steady decline in rural farmingG4) Maintain healthy elephant populations MDG7, SNPA‐DB
reduce retaliatory killingsG5) Increase revenues from tourism CCA‐1.6.1
G5.1) enhance community‐park relations to improve tourismG5.2) increase tourism revenues to benefit community
1MPPD: Ministry of Planning and Development. Goals stated in three documents below: MDG: Millennium Development Goals (Republique Gabonaise, 2003)CCA: Common Country Assessment (Republique Gabonaise, 2001)SNPA‐DB: National Strategy and Plan of Action for Biodiversity Conservation, 2000
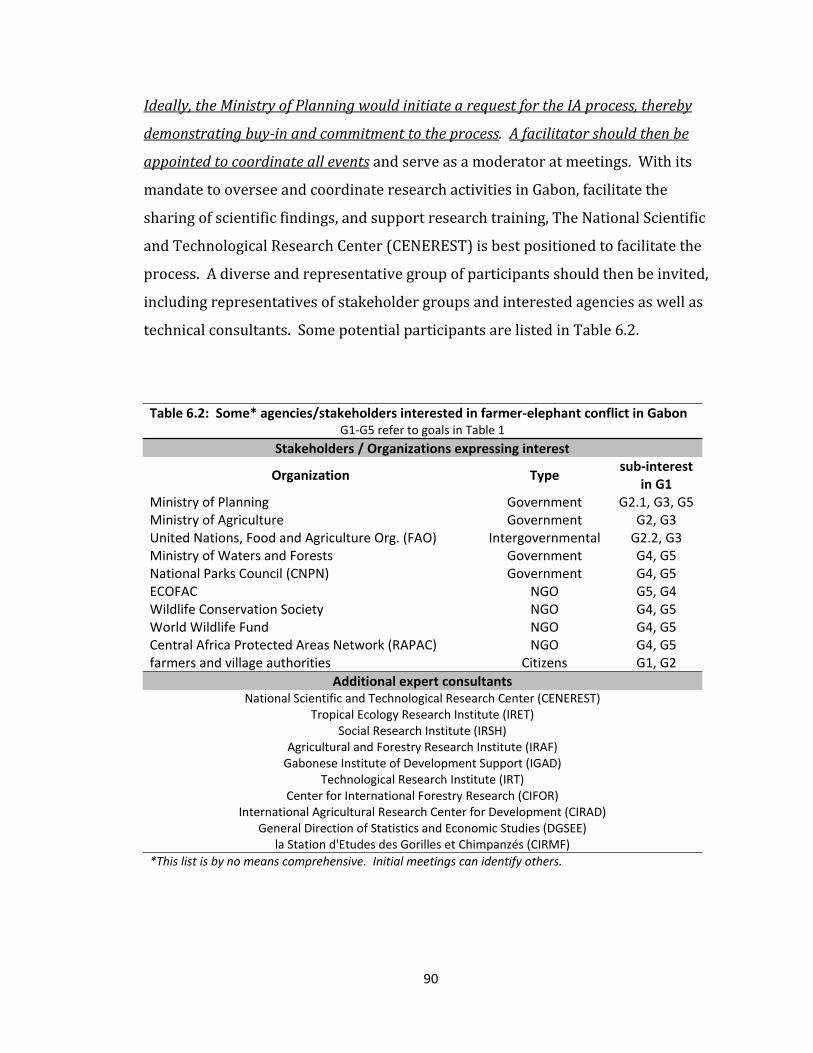
90
Ideally, the Ministry of Planning would initiate a request for the IA process, thereby
demonstrating buyin and commitment to the process. A facilitator should then be
appointed to coordinate all events and serve as a moderator at meetings. With its
mandate to oversee and coordinate research activities in Gabon, facilitate the
sharing of scientific findings, and support research training, The National Scientific
and Technological Research Center (CENEREST) is best positioned to facilitate the
process. A diverse and representative group of participants should then be invited,
including representatives of stakeholder groups and interested agencies as well as
technical consultants. Some potential participants are listed in Table 6.2.
Table 6.2: Some* agencies/stakeholders interested in farmer‐elephant conflict in Gabon G1‐G5 refer to goals in Table 1
Stakeholders / Organizations expressing interest
Organization Type sub‐interest
in G1 Ministry of Planning Government G2.1, G3, G5 Ministry of Agriculture Government G2, G3 United Nations, Food and Agriculture Org. (FAO) Intergovernmental G2.2, G3 Ministry of Waters and Forests Government G4, G5 National Parks Council (CNPN) Government G4, G5 ECOFAC NGO G5, G4 Wildlife Conservation Society NGO G4, G5 World Wildlife Fund NGO G4, G5 Central Africa Protected Areas Network (RAPAC) NGO G4, G5 farmers and village authorities Citizens G1, G2
Additional expert consultants National Scientific and Technological Research Center (CENEREST)
Tropical Ecology Research Institute (IRET)Social Research Institute (IRSH)
Agricultural and Forestry Research Institute (IRAF)Gabonese Institute of Development Support (IGAD)
Technological Research Institute (IRT)Center for International Forestry Research (CIFOR)
International Agricultural Research Center for Development (CIRAD) General Direction of Statistics and Economic Studies (DGSEE)
la Station d'Etudes des Gorilles et Chimpanzés (CIRMF)*This list is by no means comprehensive. Initial meetings can identify others.

91
The primary advantage of including all interested parties in the process is to
incorporate multiple viewpoints to arrive at one agreed upon cohesive strategy
rather than the separate, often contradictory strategies that each agency may
implement individually. In my conversations with representatives from several
organizations expressing interest in mitigating farmer‐elephant conflict in Gabon,
the diversity of overarching goals and reasons for involvement was striking (Table
1). Not surprisingly, each organization’s stated interests in addressing the conflict
related directly to its mandates (Table 6.2): for conservation organizations, as a
means to preserve healthy elephant populations and enhance tourism revenues; for
agricultural organizations, as a means to improve agricultural production; and for
development organizations, as a means to improve livelihoods. Acting separately, a
conservation organization might choose to reduce farmer‐elephant conflict by
helping farmers find alternative means of employment in ecotourism while an
agricultural agent might encourage more farming by providing materials to help
farmers minimize risks and maximize output. Yet another agency might provide
ammunition to ward off raiding elephants. While all three strategies may have the
potential to reduce farmer‐elephant conflict by themselves, the combined effect is
counterproductive. By acting together and framing the question in a narrower
sense to incorporate each other’s broader goals these agencies could make a much
greater impact in addressing the issue. The first step is to define this inclusive,
policy‐relevant question.
STEP 1: DEFINE A POLICYRELEVANT QUESTION
The Ministry of Planning is in an excellent position to help participants frame the
scope of the integrated assessment in a way that incorporates each agency’s
mandate, given its own mandate in setting the broad policy agenda for each of the
ministries representing these diverse interests. Conservation representatives
cannot endorse strategies that lead to declines in elephant populations; agricultural
representatives cannot endorse strategies that lead to declines in agricultural
production; development and planning representatives cannot endorse strategies
that lead to increased unemployment or food insecurity. An appropriate question

92
that encompasses all mandates might therefore be: What are plausible strategies to
reduce farmer‐elephant conflict while maintaining healthy populations of both
farmers and elephants in Gabon?
STEP 2: ESTABLISH APPROPRIATE ASSESSMENT METHODS
Once the framing question is set, the next step is to begin identifying data needs and
appropriate assessment methods. As the overall goal of the assessment is to
evaluate different policy options, different kinds of data will need to be integrated
into cohesive policy packages that can be compared. There are several ways to
achieve this packaging, ranging from purely descriptive narrative scenarios to
formal, quantitative models. More details on scenario‐building and modeling are
provided in step 6 below. It is crucial that the broader IA‐participant group be
involved at this preliminary development stage, even (especially) if the anticipated
analysis methods are too technical for most participants to fully understand. Such
involvement will lend legitimacy and credibility to the data and methods and will
increase the interest and capacity of participants to provide valuable feedback in the
final analysis stages. A preliminary workshop should be held during which
stakeholders and experts identify the gaps in knowledge most critical for assessing
strategies and help calibrate methods that will be used to evaluate those data. Key
questions to consider are discussed in the next steps.
STEP 3: DOCUMENT STATUS AND TRENDS AND INVESTIGATE UNDERLYING CAUSES
The first data‐collection step is to document relevant status and trends. One
question that often comes up is what causes the perceived increase in conflict: have
crop‐raiding events actually increased, has farmers’ tolerance and ability to cope
decreased, or has increased attention toward tourism and elephants simply
increased farmers’ vocalization of the conflict? Proving one cause over another will
not make the current conflict any less valid, but insights into the driving causes
might help identify the most promising intervention strategies. If elephants are
raiding more frequently in some areas, maybe there is an issue with habitat
degradation or poaching driving them away from their traditionally preferred

93
habitat. If farmers are not coping as effectively, identifying changes in farming
systems and community structures or culture that have altered farmers’ ability to
cope may help uncover paths to improving coping strategies under current
situations. If the recently established protected areas and (re)new(ed) focus on
elephant conservation has elevated complaints from farmers, perhaps mechanisms
for farmers to benefit more from tourism would be as effective in mitigating the
conflict as addressing the actual crop‐raiding problem. Research into the
underlying causes is not likely to prove one cause over another, but rather reveal
various degrees of each, differing with specific location and situation. Any exercise
in identifying causes and trends should be oriented toward the implications the
findings would have for specific intervention strategies, not toward who should be
blamed for the problem.
There exist little quantitative data on the extent and intensity of crop‐raiding in
Gabon, thus documentation of trends in actual crop‐raiding events rely on the
recollections of the farmers’ themselves, which are prone to exaggeration of the
present (Hill et al. 2002; Languy 1996). Establishing the actual intensity of crop‐
raiding is not necessary to agree that it is a problem, but such data would help
inform potential mitigation strategies. Unfortunately, this requires a long‐term
effort, because elephant behavior varies from season to season and year to year;
quick surveys provide only snap‐shot images which are dependent on the time the
researcher happens to visit and thus tell us little about larger trends. Standardized,
quantitative documentation protocols, such as that recommended by Hoare (2001)
should be put in place around all of the national parks and locations where
permanent staff is available to investigate raiding‐events year‐round. Because crop‐
raiding is clearly a problem in many areas, however, such quantitative data are
likely unnecessary to proceed with the larger‐scale planning outlined here.
STEP 4: DESCRIBE ENVIRONMENTAL, SOCIAL, AND ECONOMIC CONSEQUENCES
While the ultimate goal of reducing farmer‐elephant conflict is explicit in the nature
of this assessment, it is not enough simply to choose the policy that leads to the

94
largest expected decrease in crop‐raiding. Participants have other goals and values
that affect the attractiveness of options, as each policy option brings a different set
of environmental, social, and economic consequences. During the preliminary
workshop, participants should brainstorm mitigation strategies, potential primary
and secondary consequences of such strategies, and gaps in knowledge most critical to
evaluating these strategies and consequences. Table 6.3 provides an example of such
an exercise based on my observations and information from relevant literature;
actual strategies and information gaps should be identified by the participants
themselves, however.
Focus groups, workshops with break‐out sessions, debates, and role‐playing
activities can be used to solicit perspectives from a diverse group of participants.
If later analyses are to involve more technical modeling, this first phase might
involve a system sketch model using user‐friendly modeling software such as
STELLA to stimulate participant input. This allows participants to get a feel for the
modeling process while providing modelers a structured means by which to gather
important input on potential model parameters (Costanza & Ruth 2001).
Regardless of the final packaging technique, feedback should be solicited from
participants regarding the input and output variables that are most likely important.
For example, if the product is to include a benefit‐cost analysis, participants’ values
and perspectives regarding relevant types of benefits and costs should be discussed
before data are collected. If only monetary costs are explored, “low cost” options
that may appear attractive to modelers may be rejected by the end‐users due to
other unaccounted for costs (chapter 2). If the product is to include a spatial model
of elephant land‐use dynamics, loggers, farmers, and former elephant hunters can
all provide valuable information on landscape characteristics influencing elephant
movement in a given region that can greatly enhance sparse scientific data12.
12 For example, NZASSI Souami, current Ecoguard for Wildlife Conservation Society, and former elephant hunter, provided maps of elephant movement in the Banio lagoon region of Mayumba (author data) that elucidate the potential of a landscape‐level solution in the region. Souami and colleagues should play an integral role in the exploration of such strategies.

95
Table 6.3: an outline of potential strategies and research needs to mitigate farmer-elephant conflict G1, G2, G3, G4, and G5 refer to the goals presented in Table 1
POTENTIAL POLICY OPTIONS TRENDS/CAUSES/CONSEQUENCES RELEVANT TO PRIMARY GOALS
POTENTIAL SECONDARY CONSEQUENCES
OTHER QUESTIONS TO
CONSIDER FARM‐LEVEL PROTECTION
• Passive barriers G1) Are there known methods that effectively deter elephants? How effective are they in Gabon?
Social: Theft of materials, children being withheld from or missing school more often (if sleeping in farms), potential hazards of bees
Who should/would bear the costs (monetary and labor)? Are passive barriers feasible with swidden agriculture, or will agricultural practices need to be changed also (refer to questions under "Agricultural Systems
Change")
(chili‐pepper fences13 beehive fences14, barbed‐wire, etc.)
G2) Will farmers be better off using proposed methods compared to alternative methods of coping with elephants? What are the opportunity costs?
• Passive repellants (e.g. pepper bricks1,15)
G3) Will farmers produce more using such methods? Would those who abandoned find it more attractive?
Economic: If farmers bear all of the monetary/labor costs, likely to resent conservation. If others take on too many costs, farmers may not “own” and maintain/apply methods effectively.
• Active guarding of farms G4/G5) What situations/characteristics would such a strategy require for farmers to support elephant conservation?
(could include active repellants)
VILLAGE‐LEVEL PROTECTION • Fencing agricultural zones for entire villages
G1) Are there known methods that effectively deter elephants?
Social: Enhanced community cohesion/ management capacity if successful. Likely community conflicts if unsuccessful.
Who should/would bear the costs (monetary and
labor)? Who will maintain the fences? Can an area large enough for swidden agriculture be
fenced off, or will agricultural practices need to be changed also (refer
to questions under "Agricultural Systems
Change")
• cooperative farms / organized guarding
G2/G3) Under what characteristics/situations would community members buy in to and benefit from such a strategy? What other cooperative management situations exist in Gabon that we can draw from? If fencing, how much space does each farmer need?
Need to consider high mobility in Gabon; the fixed capacity of fencing projects could bring about issues of immigration and village "belonging" G4/G5) What situations/characteristics would such a
strategy require for communities to support elephant conservation?
Environmental: if fencing, may fence off habitat or migration corridors vital to wildlife.
13 (Osborn & Parker 2002) 14 (King et al. 2009) 15 (Ongognongo et al. 2006)
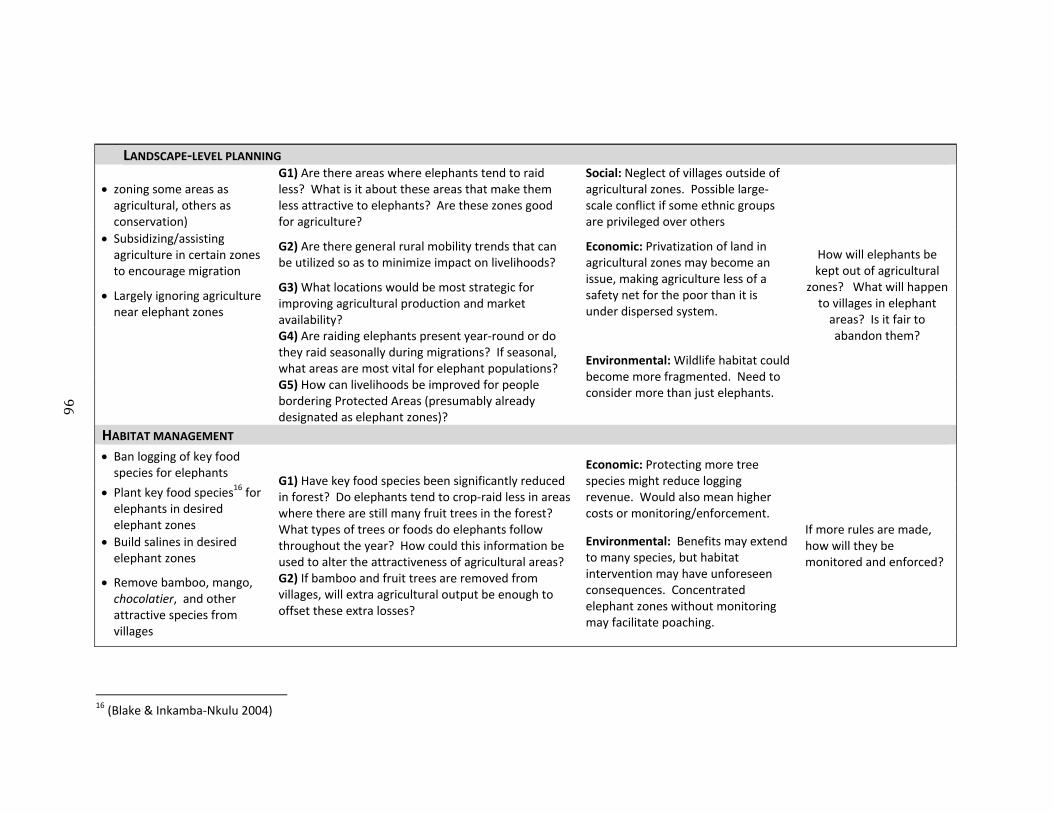
96
LANDSCAPE‐LEVEL PLANNING
• zoning some areas as agricultural, others as conservation)
G1) Are there areas where elephants tend to raid less? What is it about these areas that make them less attractive to elephants? Are these zones good for agriculture?
Social: Neglect of villages outside of agricultural zones. Possible large‐scale conflict if some ethnic groups are privileged over others
How will elephants be kept out of agricultural
zones? What will happen to villages in elephant areas? Is it fair to abandon them?
• Subsidizing/assisting agriculture in certain zones to encourage migration
G2) Are there general rural mobility trends that can be utilized so as to minimize impact on livelihoods?
Economic: Privatization of land in agricultural zones may become an issue, making agriculture less of a safety net for the poor than it is under dispersed system.
• Largely ignoring agriculture near elephant zones
G3) What locations would be most strategic for improving agricultural production and market availability?
G4) Are raiding elephants present year‐round or do they raid seasonally during migrations? If seasonal, what areas are most vital for elephant populations?
Environmental: Wildlife habitat could become more fragmented. Need to consider more than just elephants.
G5) How can livelihoods be improved for people bordering Protected Areas (presumably already designated as elephant zones)?
HABITAT MANAGEMENT • Ban logging of key food species for elephants
G1) Have key food species been significantly reduced in forest? Do elephants tend to crop‐raid less in areas where there are still many fruit trees in the forest? What types of trees or foods do elephants follow throughout the year? How could this information be used to alter the attractiveness of agricultural areas? G2) If bamboo and fruit trees are removed from villages, will extra agricultural output be enough to offset these extra losses?
Economic: Protecting more tree species might reduce logging revenue. Would also mean higher costs or monitoring/enforcement.
If more rules are made, how will they be monitored and enforced?
• Plant key food species16 for elephants in desired elephant zones
• Build salines in desired elephant zones
Environmental: Benefits may extend to many species, but habitat intervention may have unforeseen consequences. Concentrated elephant zones without monitoring may facilitate poaching.
• Remove bamboo, mango, chocolatier, and other attractive species from villages
16 (Blake & Inkamba‐Nkulu 2004)

97
AGRICULTURAL SYSTEMS CHANGE
• Swidden to permanent
G1) What is the market potential for crops that elephants avoid?
Social: likely result in sudden privatization of historically communal resources
How will poor farmers meet startup costs? How will communal land be allocated? How will
subsistence farmers cope if far from markets? How
will this affect food security?
(which can be protected with more permanent structures)
G2) What infrastructure/Institutions would need to be in place for farmers' livelihoods to improve with a switch to cash crops or permanent agriculture (e.g. roads, credit/microcredit, trainings on use of pesticides). What lessons can be learned from the fall of the Caisse cafe‐cacao in the 1970s17,18?
Economic: Rural farmers would interact more with the market. More opportunity for taxation.
• Promote tree/shrub crops (coffee, cocoa) that less prone to trampling
G3) If switch to cash‐crops, what would export/import market look like? How might food security be affected?
Environmental: Pollution from toxic chemicals, lower carbon emissions, likely impact on forest? (Longer‐term soil degradation leads to expansion by farmers without much capital for fertilizer)
• Promote crops not liked by elephants (i.e. pepper, oseille)
G4) What might deforestation trends look like under a shift to permanent agriculture? Would elephant habitat be affected?
CROP INSURANCE SCHEMES
• Farmers buy premiums for crop‐insurance
G2) If farmers buy insurance, how can the system be managed to ensure that farmers' livelihoods improve in general? Are there similar insurance schemes elsewhere that we could learn from?
Social: moral hazards19, increased incentives for corruption20. If funds are external (no farmer buy‐in), can increase perception that raiding is solely others’ responsibility.
Who will manage insurance? How will the
payment funds be managed? How will losses be monitored? How will farmers be encouraged not to take unnecessary
risks?
• Government or NGOs subsidize crop insurance, based on intensity of raiding in area
G3) How might overall agricultural output be affected by such a system? Would the benefits outweigh the costs of managing/monitoring the payment scheme
Economic: More interaction between rural farmers and the market. Could produce useful data on individual and nationwide agricultural production
G4) Are there elephant‐prone areas that farmers avoid now but would farm in and thus degrade under such a scheme? If so, how could this be prevented?
Environmental: Farmers may clear more forest than usual if payments are based on area planted
17 (Anderson 1987) 17 (Nguema 2005) 18 (Hazell 1995) 18 (Anderson 2003)

98
PROBLEM ELEPHANT CONTROL • Current system of
battue administrative with the Ministry of Waters and Forests21
• Revised version of
similar system
G1) Is crop‐raiding the result of a few individuals? Mostly male bulls? If so, does removing them reduce raiding? What can we learn from the current system of battue administrative? G2) Do all farmers have equal access to the system? Would the benefits of reporting a problem outweigh the costs to the individual farmer?
Social: Farmer who lost crops to elephant may get little benefit Economic: Effective system can cost a lot (e.g. to ensure that elephants targeted are the actual problem elephants). Issues distinguishing legal vs. illegal guns, ammunition and tusks facilitate market for the latter. Environmental: Can destabilize elephant herd dynamics22. Safari hunting needs organization; can create need to fill demand when there are no problem elephants
Would there be enough good elephant hunters in a given area to address problem animals quickly? Would these hunters have an incentive not to hunt illegally?
• Safari hunting of problem animals23
G4) What is the impact of such control on elephant populations? What mechanisms would need to be in place to ensure that only frequent raiders are targeted?
INDIRECT MITIGATION (COMPENSATE LOSSES IN OTHER WAYS)
• Create jobs from conservation/tourism
G2) Would the (would‐be) farmers who suffer from crop‐raiding be the same ones who gain from conservation? Would women gain as much? Elderly?
Social: Greater inequities in village if some benefit more than others. Potential for conflict. Issues with village “belonging” may arise if funds are given directly to community.
How will inter‐village immigration affect the
outcome? How are future farmers incorporated? • Create community
fund from tourism revenue
G3) Would agriculture be increased elsewhere to compensate net decline? G5) Would village see benefit in conserving elephants over reverting to agriculture?
Economic: More unemployed elderly (most farmers are 60 or older).
21 (Lahm 1993) 22 (Omondi et al. 2004) 23 (Hoare 1999)

99
Once data needs are identified, the intensive task begins of amassing the data
necessary to begin assessing feasibility of strategies and comparing among the
proposed strategies. A preliminary triage is likely necessary to determine the most
critical data gaps that would allow for the broadest range of policy options that can
be reasonably assessed in the shortest possible timeframe. Less critical gaps could
be made part of a less urgent, longer‐term research agenda. Small working teams
should be assigned to specific research topics that fit within their domain of expertise.
In light of the ongoing need for data and the fact that Gabon’s agricultural research
capacity is among the smallest in Sub‐Saharan Africa (Stads et al. 2004), it is critical
that teams include both current experts familiar with the required research and
analysis methods and residents training to become future experts of these methods for
Gabon. As in process‐based participatory Integrated Assessments, the goal should
be as much to gather data in the present as to develop capacity to continue the
process in the future.
CONSIDER VARIOUS SCALES:
The most powerful integrated assessments help planners anticipate effects of
proposed policies at multiple scales (Scavia & Nassauer 2007; Verburg et al. 2006).
Indeed, there is likely great variation in causes and effectiveness of potential
intervention strategies throughout Gabon. There is great tradeoff in identifying
strategies that are best fit for each location and arriving at a cohesive strategy that is
best suited for a large‐level player such as the Ministry of Planning, however,
especially with limited personnel and resources. A reasonable compromise might
be to select a few strategic locations to focus on for the principle assessment process,
aimed at defining a loose national strategy. Once this national strategy is outlined,
smaller regional assessments can be carried out to fine‐tune and help identify the
most appropriate course of action within this broader framework at specific
locations.

100
Based on my observations, I would suggest the regions around Mayumba, Lopé, and
Monts de Cristal for the initial assessment, as each embodies different issues and
potential solutions that I encountered. With its status as a UNESCO world heritage
site, Lopé represents Gabon’s most fully functioning national park and stands to
serve as an example for the development of other protected areas. A strategy for
addressing the intense crop‐raiding problems in neighboring villages, such as
Kazamabika, would thus serve well for national‐level policy planning. As a marine
park, Mayumba does not generate the quantity of revenue from terrestrial wildlife‐
based tourism as does Lopé, nor could it really be blamed for the intense elephant
raiding in the area. It provides insight into other factors at play, likely related to
farming trends, microhabitat, and hunting pressure from neighboring Congo. These
latter issues open potential for regional‐level landscape management (e.g. Jackson et
al. 2008) and could be used as an exemplary case of how to assess such strategies.
The villages around the Monts de Crystal do not receive the same intensity of
elephant raiding as the other two regions; however they experience enough raiding
to discourage many people from farming. The proximity of this area to Libreville
heightens the interest of the Ministry of Agriculture, which is looking to increase
production in the rural areas surrounding the capital. A potential conflict of interest
occurs between those interested in the conservation of the Monts de Crystal Region
and those interested in agricultural development. A general strategy for balancing
the two while taking into account the issues that occur at their interface could serve
as an example for similar situations near other urban centers, such as Tchibanga.
Other regions, such as the Plateaux Batekés, Pongara, Ivindo, Woleu‐Ntem, and the
Ngounie all have unique experiences and situations which should be taken into
account when developing a national strategy. Representatives from these areas
should be asked to participate in brainstorming and information‐sharing meetings
to help account for their particular situations. General data should also be gathered
from these areas, especially when assessing strategies such as national‐level
landscape planning. However, with limited resources, it is likely infeasible to
conduct all aspects of the in‐depth data collection suggested above in all regions.

101
STEP 5: DEVELOP ALTERNATIVE POLICY SCENARIOS; IDENTIFY DESIRED OUTCOMES
The goal of the data gathering step is to inform the construction of a range of policy
scenarios and plausible outcomes of pursuing each policy path. Again, given the
scarcity of data in Gabon, simultaneous evaluation of all potential policy options
should not be the goal. A subset of options that appear most promising in balancing
participants’ needs should be identified during the preliminary assessment
meetings. The research teams should then collect the necessary information to
inform the potential impact and outcomes of this set of strategies. Once relevant
data are collected, the participants can reconvene to assess the policy scenarios as in
the next step.
STEP 6: EVALUATE VARIOUS POLICY OPTIONS
Once enough data have been gathered on the key underlying processes, a second
participant workshop should be convened to project these processes into the future
and evaluate plausible outcomes under the proposed policy interventions. The goal
is not to predict the future, but rather to generate plausible scenarios to stimulate
discussion. At this stage, the focus should be on understanding stakeholders’ priorities
and values in weighing different solutions in terms of environmental, social, and
economic costs.
Various methods can be used to compare options and stimulate discussion between
participants. Descriptive scenarios and role‐playing can generate much insight into
participants’ perspectives and values (e.g. Caille et al. 2007). Images can offer an
intuitive means by which to extract basic preferences and provoke discussion (e.g.
Nassauer et al. 2007a). Various degrees of complexity can be added with a dynamic
temporal component (e.g. Dockerty et al. 2006) and/or a broader spatial component
based on GIS (e.g. Santelmann et al. 2007). This latter method could be particularly
useful for comparing landscape options for mitigating farmer‐elephant conflict.
102
More technical computer‐based simulations or agent based models offer an
attractive means to project processes and watch futures unfold under different
intervention strategies. The intent of such an activity should never be to provide an
exact model of what will happen, but to provide a plausible image to drive
discussions about desired outcomes and most likely paths to arrive at such
outcomes. Modelers need to be acutely conscious of the role of their model in this
capacity to avert the dangers of stakeholders or decision‐makers placing too much
weight in specific model predictions or dismissing the model altogether due to
debate over precision in the predictions (Hisschemoller et al. 2001). Although
overly technical models are often too opaque, detail‐rich simulation models tend to
draw out more insightful discussion than more abstract models at this stage in the
process (Costanza & Ruth 2001; Siebenhuner & Barth 2005).
The data gathering and analysis phases can be an iterative process: If research
findings or discussions highlight other critical data gaps or bring other policy
options to the forefront, the research teams may need to collect more data until the
decision‐maker is satisfied that there is enough data to evaluate plausible outcomes.
“Plausible” is different from “certain”, however. We will never have enough data to
be certain of the outcome of a policy; human and elephant behaviors are driven by
complex systems that will always maintain a degree of elusiveness. As with all
policy decisions, it is up to the decision‐makers to decide when they have enough
information to make an initial policy intervention, knowing that policies must be
adapted constantly as systems change or unexpected results occur.
STEP 7: PROVIDE GUIDANCE FOR POLITICAL ACTION:
Based on all understanding gathered from both the data and the discussions, policy
options can be assessed to maximize success in achieving the goal of mitigating
farmer‐elephant conflict while minimizing consequences judged unfavorable by
stakeholders. Stakeholders and experts should be drawn upon not only to identify
preferred options, but also to generate a set of concrete steps to implementing those
options and a list indicators to be used to measure the success of the policy in meeting
103
stated goals. Such indicators may include average rural farm production to assess
success in meeting G2 (table 6.1), per‐capita agricultural imports to assess success
in meeting G3, or numbers of elephants sited during tourism safaris, to assess
success in meeting G5.
STEP 8: ASSESS THE COMPARATIVE OVERALL PERFORMANCE
Given that this is an iterative process, the initial Integrated Assessment should
compile lessons learned and gaps in information to inform the next round of
assessment. It should wrap up with an evaluation of the process itself and
recommendations for future assessments.
This Integrated Assessment process is ambitious and should not be judged solely on its
ability to produce immediate results in reducing farmerelephant conflict. Although
end results are clearly important, they will unlikely be apparent immediately. In the
short term, there are several other criteria by which to evaluate the success of an IA
(Farrell & Jager 2006; Social Learning Group 2001). If these short‐term criteria are
met, there is far greater likelihood that the IA will be successful in meeting its
longer‐term goals. It is therefore useful to design the IA process around the goal of
meeting the following short‐ and long‐term criteria:
• Credibility/Technical adequacy: Were the methods used credible in the eyes of the
scientific and stakeholder communities?
• Legitimacy/Fairness: Did a wide range of stakeholders participate in the process?
Were they involved in all steps of the process? Do they perceive the process as fair?
• Salience/Value: Did the assessment address a policy-relevant question at a time that
its recommendations could impact decision-making? Did the end user find the
process and end product useful?
• Effectiveness: Did the process change how stakeholders and decision-makers
understand or view the issue? Did the process and product influence policy? Did the
resulting policy intervention influence outcomes in the desired way?
104
To establish credibility and technical adequacy, the research teams involved should
report their findings in the form most appropriate for their discipline or methodology,
and subject these findings to peer review from other experts both within and outside of
Gabon. External review, which may include publication in peer‐reviewed journals
or presentations at conferences, helps ensure use of data collection and analysis
techniques accepted by other experts in the field. Internal review by peers in Gabon
helps ensure that sampling techniques and methods are accountable to on‐the‐
ground realities. Such review may include reports of presentations subjected to
review by the larger IA participant group or by a committee selected by the
CENEREST.
To evaluate legitimacy and fairness, the diversity of perspectives incorporated in the
end product should be considered as well as the participants’ own perceptions of
the fairness of the process in soliciting their viewpoints and of the end product in
representing those views. An external reviewer should be asked to conduct followup
interviews with all participants to provide insight into the equity and fairness of the
process.
In this process‐oriented approach, facilitated communication and improvement in
understanding among a wide group of stakeholders should be considered a large
achievement in and of itself. The impact of the immediate process on participants’
understanding and views of the problem can be evaluated with additional questions
on the follow‐up interviews. Preprocess interviews, designed to complement the
followup interviews and detect changes in understanding and views, should also be
conducted by the external reviewer.
As with facilitated communication, increased capacity of local individuals or
institutions to conduct research should be considered a tremendous
accomplishment in Gabon and deserves a large focus of the investment.
Standardization of research methods between institutions and establishment and
training of in‐country research teams dedicated to collecting data on various aspects
of farmer‐elephant conflict over time would greatly enhance the potential of

105
meeting longer‐term goals of understanding and mitigating farmer‐elephant
conflict.
Despite the potential for success in many dimensions, the most unfortunate possible
outcome of an IA is that results are unusable or ignored (MSG&GESI 2009). To help
ensure that this does not occur, it is critical that the IA be requested by an agency
with the authority and intent to act on the findings at a time when it is able to do so.
Until this point arrives, institutions and individuals interested in mitigating farmer‐
elephant conflict can continue to assess and address the situation individually, with
a focus on generating quality data that can be used to inform such integrated
processes in the future.

106
Cited References
Anderson, H. 1987. The Limits of Development Management: An Analysis of Agricultural Policy Implementation in Gabon. Page 279. Indiana University.
Anderson, J. A. 2003. Risk in rural development: challenges for managers and policy makers. Agricultural Systems 75:161‐197.
Barnes, R. F. W. 2002. Treating crop‐raiding elephants with aspirin. Pachyderm 33:96‐99.
Blake, S., and C. Inkamba‐Nkulu. 2004. Fruit, Minerals, and Forest Elephant Trails: Do All Roads Lead to Rome? Biotropica 36:392‐401.
Blake, S., S. Strindberg, P. Boudjan, C. Makombo, I. Bila‐Isia, O. Ilambu, F. Grossmann, L. Bene‐Bene, B. de Semboli, V. Mbenzo, D. S'hwa, R. Bayogo, L. Williamson, M. Fay, J. A. Hart, and F. Maisels. 2008. Forest elephant crisis in the Congo Basin. PLoS Biology 5:0945‐0953.
Bland, W. L. 1999. Toward integrated assessment in agriculture. Agricultural Systems 60:157‐167.
Caille, F., J. L. Riera, B. Rodriguez‐‐Labajos, H. Middelkoop, and A. Rosell‐Mele. 2007. Participatory scenario development for integrated assessment of nutrient flows in a Catalan river catchment. Hydrology and Earth System Sciences 11:1843‐1855.
Costanza, R., and M. Ruth. 2001. Modeling for scoping, research and management. Pages 169‐178 in R. Costanza, B. S. Low, E. Ostrom, and J. A. Wilson, editors. Institutions, Ecosystems, and Sustainability. Lewis Publishers, Boca Raton, FL.
Dockerty, T., A. A. Lovett, K. Appleton, A. Bone, and G. Sunnenberg. 2006. Developing scenarios and visualizations to illustrate potential policy and climatic influences on future agricultural landscapes. Agriculture, Ecosystems and Environment 114:103‐120.
FAO. 2008. Appui à la réhabilitation du système de statistiques et d'information agricoles, TCP/GAB/3201 Food and Agriculture Organization of the United Nations.
Farrell, A. E., and J. Jager 2006. Assessments of Regional and Global Environmental Risks. Resources for the Future, Washington, D.C.
Hazell, P. B. R. 1995. The appropriate role of agricultural insurance in developing countries. Journal of International Development 4:567‐581.
Hill, C. M., F. V. Osborn, and A. J. Plumptre. 2002. Human‐wildlife conflict: Identifying the Problem and Possible Solutions. Albertine RIft Technical Report Series, No.1. Wildlife Conservation Society, New York, USA.
107
Hisschemoller, M., R. S. J. Tol, and P. Vellinga. 2001. The relevance of participatory approaches in integrated environmental assessment. Integrated Assessment 2:57‐72.
Hoare, R. E. 1999. Determinants of human‐elephant conflict in a land‐use mosaic. Journal of Applied Ecology:689‐700.
Hoare, R. E. 2001. A Decision Support System (DSS) for Managing Human‐Elephant Conflict Situations in Africa. IUCN African Elephant Specialist Group, Nairobi, Kenya.
Jackson, T. R., S. Mosojane, S. M. Ferreira, and R. J. van Aarde. 2008. Solutions for elephant Loxodonta africana crop raiding in northern Botswana: moving away from symptomatic approaches. Oryx 42:83‐91.
Jager, J. 1998. Current thinking on using scientific findings in environmental policy making. Environmental Modeling and Assessment 3:143‐153.
King, L. E., A. Lawrence, I. Douglas‐Hamilton, and F. Vollrath. 2009. Beehive fence deters crop‐raiding elephants. African Journal of Ecology 47:131‐137.
Lahm, S. A. 1993. Ecology and Economics of Human/Wildlife Interaction in Northeastern Gabon. Page 128. Department of Anthropology. New York University, New York.
Languy, M. 1996. Suivi et atténuation de l'impact des éléphants et autres mammifères sauvage sur l'agriculture au Gabon. Rapport final. WWW Programme pour le Gabon.
Michigan Sea Grant and Graham Environmental Sustainability Institute. 2009. Solving wicked problems through integrated assessment: A guide for decision makers, project leaders and scientists. University of Michigan, Ann Arbor, MI.
Mitchell, R. B., W. C. Clark, and D. W. Cash. 2006. Information and Influence in R. Mitchell, W. C. Clark, D. W. Cash, and N. M. Dickson, editors. Global Environmental Assessments ‐ Information and Influence. MIT Press, Cambridge, Massachusetts.
Nassauer, J. I., R. C. Corry, and R. M. Cruse. 2007a. Alternative Scenarios for Future Iowa Agricultural Landscapes. Pages 41‐55 in J. I. Nassauer, M. V. Santelmann, and D. Scavia, editors. From the corn belt to the gulf: societal and environmental implications of alternative agricultural futures. Resources for the Future, Washington, DC.
Nassauer, J. I., M. V. Santelmann, and D. Scavia, editors. 2007b. From the corn belt to the gulf: societal and environmental implications of alternative agricultural futures. Resources for the Future, Washington, DC.
Nguema, V. M. 2005. L'agriculture du Gabon. Karthala, Paris.
Omondi, P., E. Bitok, and J. Kagin. 2004. Managing human‐elephant conflicts: the Kenyan experience. Pachyderm 36:80‐86.

108
Ongognongo, P., D. B. Ekoutoumba, and E. J. Stokes. 2006. Conflit Homme‐Eléphant dans la périphérie du Parc National de Nouabalé‐Ndoki au nord Congo. Page 42. Wildlife Conservation Society, Brazzaville.
Osborn, F. V., and G. E. Parker. 2002. Living with elephants II: a manual. Page 21. MZEP, 37 Lewisam Ave, Chisipte, Harare, Zimbabwe.
Osborn, F. V., and G. E. Parker. 2003. Towards an Integrated approach for reducing the conflict between elephants and people: a review of current research. Oryx 37:80‐84.
République Gabonaise. 2001. Bilan Commun de Pays, CCA. United Nations, Libreville, Gabon.
République Gabonaise. 2003. Objectifs du Millénaire pour le Développement: Premier Rapport National. Ministère de la Planification et de la Programmation du Développement; United Nations, Libreville, Gabon.
Santelmann, M. V., D. White, K. F. Lindsay, J. I. Naussuer, J. M. Eilers, K. B. Vache, B. I. Danielson, R. C. Corry, M. E. Clark, S. Polasky, R. M. Cruse, J. C. Sifneos, H. L. Rustigian, C. U. Coiner, J. Wu, and D. M. Debinski. 2007. An Integrated Assessment of Alternative Futures for Corn Belt Agriculture. Pages 162‐174 in J. I. Nassauer, M. V. Santelmann, and D. Scavia, editors. From the corn belt to the gulf: societal and environmental implications of alternative agricultural futures. Resources for the Future, Washington, DC.
Scavia, D., and J. I. Nassauer. 2007. Introduction: Policy Insights from Integrated Assessments and Alternative Futures. Pages 1‐7 in J. I. Nassauer, M. V. Santelmann, and D. Scavia, editors. From the corn belt to the gulf: societal and environmental implications of alternative agricultural futures. Resources for the Future, Washington, DC.
Siebenhuner, B., and V. Barth. 2005. The role of computer modeling in participatory integrated assessments. Environmental impact assessment review 25:367‐389.
Social Learning Group 2001. Learning to Manage Global Environmental Risks Volume II: A Functional Analysis of Scoial Response to Climate Change, Ozone Depletion and Acid Rain. MIT Press, Cambridge, MA.
Stads, G.‐J., P. O. Angwe, and A. Ngoye. 2004. Gabon: ASTI Country Brief No. 23. Agricultural Science and Technology Indicators. International Food Policy Research Institute, Washington, D.C.
Tol, R. S. J., and P. Vellinga. 1998. The European Forum on Integrated Environmental Assessment. Environmental Modelling and Assessment 3:181‐191.
van Asselt, M. B. A., and N. Rijkens‐Klomp. 2002. A look in the mirror: reflection on participation in Integrated Assessment from a methodological perspective. Global Environmental Change 12:167‐184.
Verburg, P. H., C. J. E. Schulp, N. Witte, and A. Veldkamp. 2006. Downscaling of land use change scenarios to assess the dynamics of Eurpoean landscapes. Agriculture, Ecosystems and Environment 114:39‐56.

109
Weyant, J., O. Davidson, H. Dowlatabati, J. Edmonds, M. Grubb, E. A. Parson, R. Richels, J. Rotmans, P. R. Shukla, R. S. J. Tol, W. R. Cline, and S. Fankhauser. 1996. Integrated assessment of climate change: an overview and comparison of approaches and results in J. P. Bruce, H. Lee, and E. F. Haites, editors. Climate Change 1995: Economic and Social Dimensions ‐‐ Contribution of Working Group III to the Second Assessment Report of the Intergovernmental Panel on Climate Change. Cambridge University Press, Cambridge.
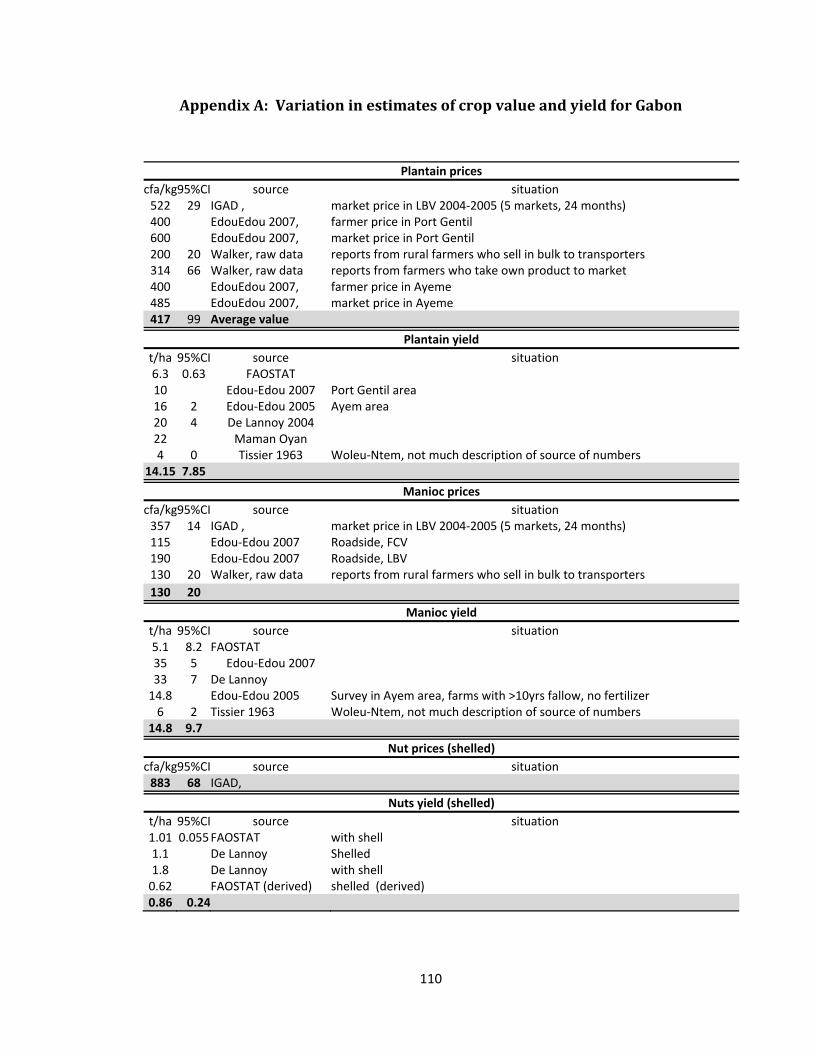
110
Appendix A: Variation in estimates of crop value and yield for Gabon
Plantain pricescfa/kg95%CI source situation522 29 IGAD , market price in LBV 2004‐2005 (5 markets, 24 months) 400 EdouEdou 2007, farmer price in Port Gentil600 EdouEdou 2007, market price in Port Gentil200 20 Walker, raw data reports from rural farmers who sell in bulk to transporters 314 66 Walker, raw data reports from farmers who take own product to market 400 EdouEdou 2007, farmer price in Ayeme485 EdouEdou 2007, market price in Ayeme417 99 Average value
Plantain yieldt/ha 95%CI source situation6.3 0.63 FAOSTAT 10 Edou‐Edou 2007 Port Gentil area16 2 Edou‐Edou 2005 Ayem area20 4 De Lannoy 2004 22 Maman Oyan 4 0 Tissier 1963 Woleu‐Ntem, not much description of source of numbers
14.15 7.85
Manioc pricescfa/kg95%CI source situation357 14 IGAD , market price in LBV 2004‐2005 (5 markets, 24 months) 115 Edou‐Edou 2007 Roadside, FCV190 Edou‐Edou 2007 Roadside, LBV130 20 Walker, raw data reports from rural farmers who sell in bulk to transporters 130 20
Manioc yieldt/ha 95%CI source situation5.1 8.2 FAOSTAT 35 5 Edou‐Edou 2007 33 7 De Lannoy 14.8 Edou‐Edou 2005 Survey in Ayem area, farms with >10yrs fallow, no fertilizer 6 2 Tissier 1963 Woleu‐Ntem, not much description of source of numbers
14.8 9.7
Nut prices (shelled)cfa/kg95%CI source situation883 68 IGAD,
Nuts yield (shelled)t/ha 95%CI source situation1.01 0.055 FAOSTAT with shell1.1 De Lannoy Shelled1.8 De Lannoy with shell0.62 FAOSTAT (derived) shelled (derived)0.86 0.24
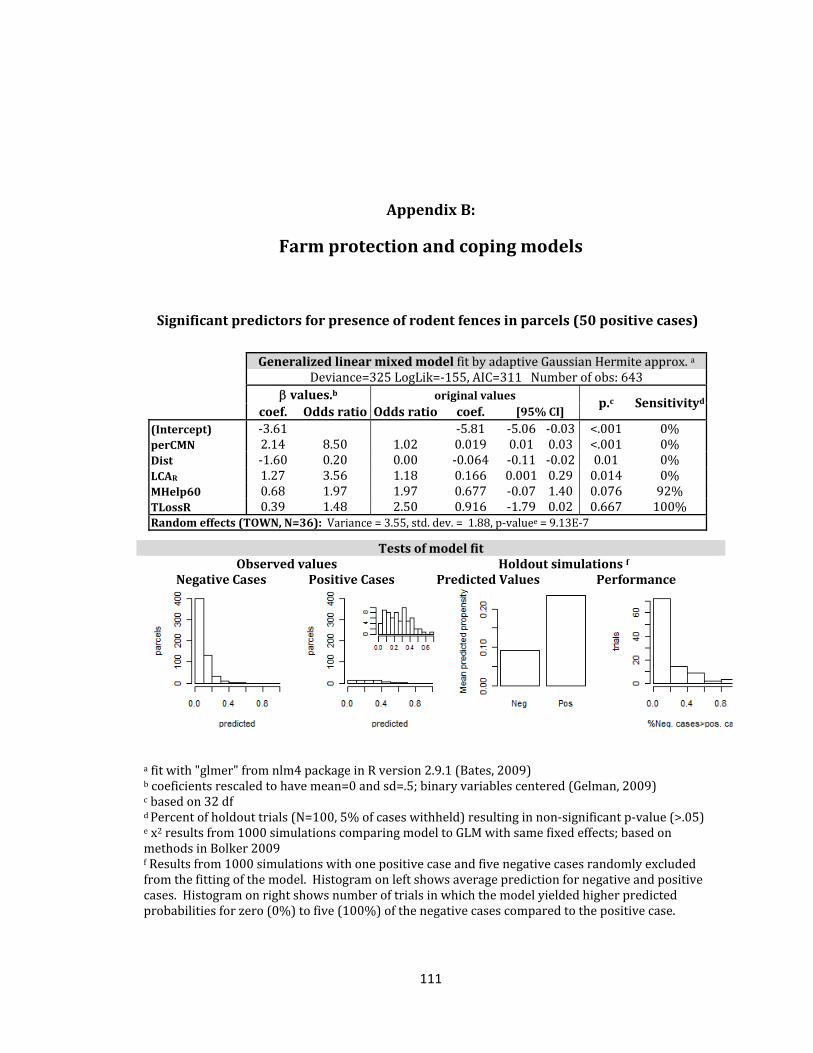
111
Appendix B:
Farm protection and coping models
Significant predictors for presence of rodent fences in parcels (50 positive cases)
Generalized linear mixed model fit by adaptive Gaussian Hermite approx. aDeviance=325 LogLik=‐155, AIC=311 Number of obs: 643
β values.b original values p.c Sensitivityd
coef. Odds ratio Odds ratio coef. [95% CI]
(Intercept) ‐3.61 ‐5.81 ‐5.06 ‐0.03 <.001 0%perCMN 2.14 8.50 1.02 0.019 0.01 0.03 <.001 0%Dist ‐1.60 0.20 0.00 ‐0.064 ‐0.11 ‐0.02 0.01 0%LCAR 1.27 3.56 1.18 0.166 0.001 0.29 0.014 0%MHelp60 0.68 1.97 1.97 0.677 ‐0.07 1.40 0.076 92%TLossR 0.39 1.48 2.50 0.916 ‐1.79 0.02 0.667 100%Random effects (TOWN, N=36): Variance = 3.55, std. dev. = 1.88, p‐valuee = 9.13E‐7
a fit with "glmer" from nlm4 package in R version 2.9.1 (Bates, 2009)b coeficients rescaled to have mean=0 and sd=.5; binary variables centered (Gelman, 2009)c based on 32 df d Percent of holdout trials (N=100, 5% of cases withheld) resulting in non‐significant p‐value (>.05)e x2 results from 1000 simulations comparing model to GLM with same fixed effects; based on methods in Bolker 2009 f Results from 1000 simulations with one positive case and five negative cases randomly excluded from the fitting of the model. Histogram on left shows average prediction for negative and positive cases. Histogram on right shows number of trials in which the model yielded higher predicted probabilities for zero (0%) to five (100%) of the negative cases compared to the positive case.
Tests of model fit Observed values Holdout simulations f
Negative Cases Positive Cases Predicted Values Performance

112
Significant predictors for presence of elephant fences (19 positive cases)
Generalized linear mixed model fit by adaptive Gaussian Hermite approx. aDeviance=122 LogLik=‐61, AIC=130 Number of obs: 666
β values.b original values p.c Sensitivityd coef. Odds ratio Odds ratio coef. [95% CI]
(Intercept) ‐9.74 ‐12.47 ‐17.47 ‐7.48 <.0001 0% LCAE 3.09 21.98 1.77 0.57 0.13 1.02 0.02 2%MHelpYr 1.45 4.26 4.26 1.45 ‐0.23 3.13 0.09 96%Random effects (TOWN, N=36): Variance = 35.04 , std. dev.=5.9 , p‐valuee= 5.58 E‐79
a fit with "glmer" from nlm4 package in R version 2.9.1 (Bates, 2009)b coeficients rescaled to have mean=0 and sd=.5; binary variables centered (Gelman, 2009)c based on 32 df d Percent of holdout trials (N=100, 5% of cases withheld) resulting in non‐significant p‐value (>.05)e x2 results from 1000 simulations comparing model to GLM with same fixed effects; based on methods in Bolker 2009 f Results from 1000 simulations with one positive case and five negative cases randomly excludedfrom the fitting of the model. Histogram on left shows average prediction for negative and positive cases. Histogram on right shows number of trials in which the model yielded higher predicted probabilities for zero (0%) to five (100%) of the negative cases compared to the positive case.
Tests of model fit Observed values Holdout simulations f
Negative Cases Positive Cases Predicted Values Performance

113
Significant predictors for presence of a hut to sleep in (29 positive cases)
Generalized linear mixed model fit by adaptive Gaussian Hermite approx. a Deviance=165 LogLik=‐82, AIC=175 Number of obs: 643b
β valuesc original values p.d sensitivitye
coef. Odds ratio Odds ratio coef. [95% CI]
(Intercept) ‐5.11 ‐7.14 ‐5.23 ‐7.34 <.001 0%LCAE 2.01 7.46 1.45 0.37 0.58 3.55 0.001 0%Dist 1.06 2.89 0.00 0.04 0.09 1.89 0.068 82%MHelp60 1.02 2.77 2.77 1.02 2.07 1.90 0.067 60%Random effects (TOWN, N=36): Variance = 3.33, std. dev. = 1.82, p‐valuee = 2.10 E ‐11
a fit with "glmer" from nlm4 package in R version 2.9.1 (Bates, 2009)b coeficients rescaled to have mean=0 and sd=.5; binary variables centered (Gelman, 2009)c based on 32 df d Percent of holdout trials (N=100, 5% of cases withheld) resulting in non‐significant p‐value (>.05)e x2 results from 1000 simulations comparing model to GLM with same fixed effects; based on methods in Bolker 2009 f Results from 1000 simulations with one positive case and five negative cases randomly excludedfrom the fitting of the model. Histogram on left shows average prediction for negative and positive cases. Histogram on right shows number of trials in which the model yielded higher predicted probabilities for zero (0%) to five (100%) of the negative cases compared to the positive case.
Tests of model fit Observed values Holdout simulations g
Negative Cases Positive Cases Predicted Values Performance
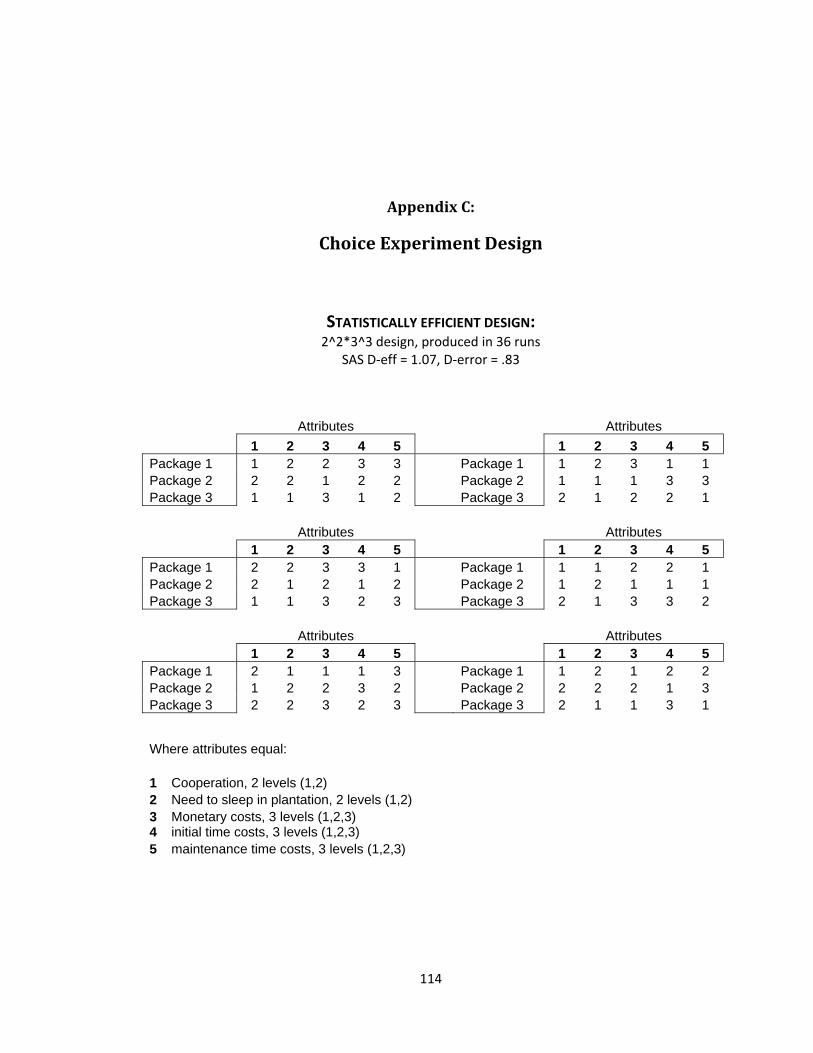
114
Appendix C:
Choice Experiment Design
STATISTICALLY EFFICIENT DESIGN: 2^2*3^3 design, produced in 36 runs
SAS D‐eff = 1.07, D‐error = .83
Attributes Attributes 1 2 3 4 5 1 2 3 4 5 Package 1 1 2 2 3 3 Package 1 1 2 3 1 1 Package 2 2 2 1 2 2 Package 2 1 1 1 3 3 Package 3 1 1 3 1 2 Package 3 2 1 2 2 1 Attributes Attributes 1 2 3 4 5 1 2 3 4 5 Package 1 2 2 3 3 1 Package 1 1 1 2 2 1 Package 2 2 1 2 1 2 Package 2 1 2 1 1 1 Package 3 1 1 3 2 3 Package 3 2 1 3 3 2 Attributes Attributes 1 2 3 4 5 1 2 3 4 5 Package 1 2 1 1 1 3 Package 1 1 2 1 2 2 Package 2 1 2 2 3 2 Package 2 2 2 2 1 3 Package 3 2 2 3 2 3 Package 3 2 1 1 3 1
Where attributes equal: 1 Cooperation, 2 levels (1,2) 2 Need to sleep in plantation, 2 levels (1,2) 3 Monetary costs, 3 levels (1,2,3) 4 initial time costs, 3 levels (1,2,3) 5 maintenance time costs, 3 levels (1,2,3)

115
EMPIRICALLY IMPROVED DESIGN: (FINAL DESIGN)
WARM UP 0 1 2 3 4 5 Status quo 1 0 0 0 0 0 Package 1 0 0 0 2 2 2 Package 2 0 1 2 3 3 3 Package 3 0 0 0 1 1 1
0 1 2 3 4 5 0 1 2 3 4 5 Status quo 1 0 0 0 0 0 Status quo 1 0 0 0 0 0 Package 1 0 1 2 2 3 3 Package 1 0 1 2 3 1 1 Package 2 0 2 2 1 2 2 Package 2 0 1 1 1 3 3 Package 3 0 1 1 3 1 2 Package 3 0 2 1 2 2 1
0 1 2 3 4 5 0 1 2 3 4 5
Status quo 1 0 0 0 0 0 Status quo 1 0 0 0 0 0 Package 1 0 2 2 3 3 1 Package 1 0 1 1 2 2 1 Package 2 0 2 1 2 1 2 Package 2 0 1 2 1 1 1 Package 3 0 1 1 3 2 3 Package 3 0 2 1 3 3 2
0 1 2 3 4 5 0 1 2 3 4 5
Status quo 1 0 0 0 0 0 Status quo 1 0 0 0 0 0 Package 1 0 2 1 1 1 3 Package 1 0 1 2 1 2 2 Package 2 0 1 2 2 3 2 Package 2 0 2 2 2 1 3 Package 3 0 2 2 3 2 3 Package 3 0 2 1 1 3 1
Where attributes equal: 0 Crop-raiding, 2 levels (1=yes, 0=no) 1 Cooperation, 2 levels (1,2) 2 Need to sleep in plantation, 2 levels (1,2) 3 Monetary costs, 3 levels (1,2,3) 4 initial time costs, 3 levels (1,2,3) 5 maintenance time costs, 3 levels (1,2,3)

116
Appendix D: Community and mobility questionaires

117
IRB approval: B05‐00008961‐I