moving produced water from a waste to a resource - eia.gov · classification: dcl-internal. who we...
TRANSCRIPT
Classification: DCL-Internal
Moving Produced Water From A Waste to a Resource
RICK MCCURDYSENIOR ENGINEERING ADVISOR

Classification: DCL-Internal
AGENDA
• Chesapeake Energy
• Water Use In Oil & Gas Operations
• Water Intensity of Various Energy Sources
• Water Use in Value Creation
• Water Reporting in Oil and Gas Operations˃ What are we doing well?
˃ Where can we improve?
• Case Study – Industry Partnering With a State to Reduce Fresh Water Demand
Moving Produced Water From a Waste to a Resource– June 5, 2018 2

Classification: DCL-Internal
WHO WE ARE
Moving Produced Water From a Waste to a Resource– June 5, 2018 3
Data taken from 2017 CHK Annual Report
Utica Shale938,000 net acres
Eagle Ford Shale245,000 net acres
Marcellus Shale577,000 net acres
Haynesville Shale358,000 net acres
Mid-Continent1,044,000 net acresOklahoma City
Powder River Basin275,000 net acres
• 2nd largest US Natural Gas Producer• 13th largest US Crude Oil Producer

Classification: DCL-Internal
AGENDA
• Chesapeake Energy
• Water Use In Oil & Gas Operations
• Water Intensity of Various Energy Sources
• Water Use in Value Creation
• Water Reporting in Oil and Gas Operations˃ What are we doing well?
˃ Where can we improve?
• Case Study – Industry Partnering With a State to Reduce Fresh Water Demand
Moving Produced Water From a Waste to a Resource– June 5, 2018 4
Classification: DCL-Internal
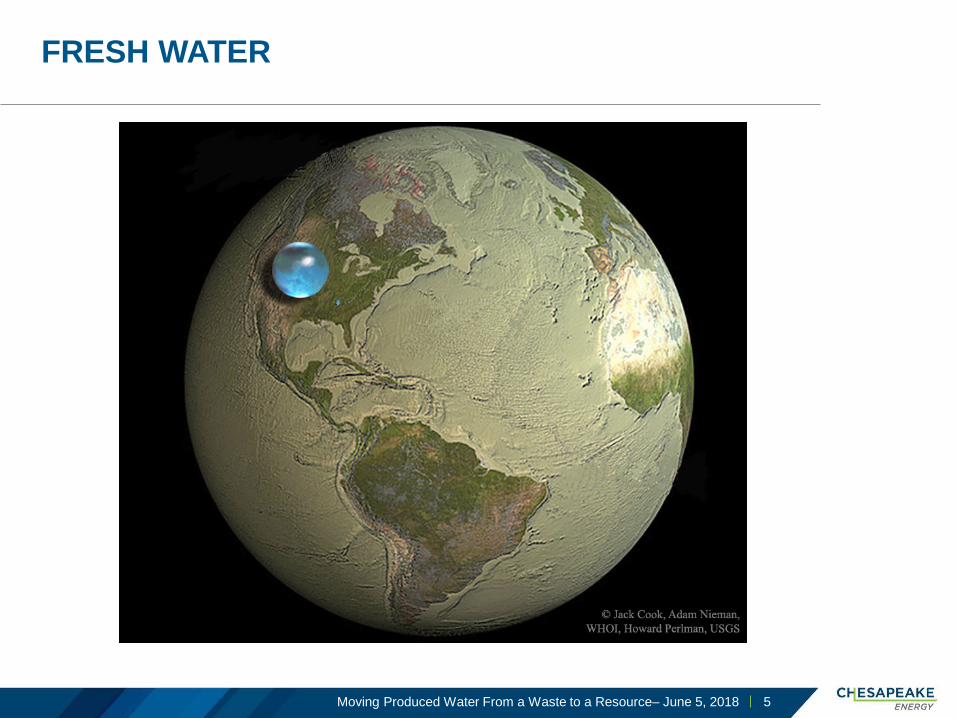
FRESH WATER
Moving Produced Water From a Waste to a Resource– June 5, 2018 5
Classification: DCL-Internal
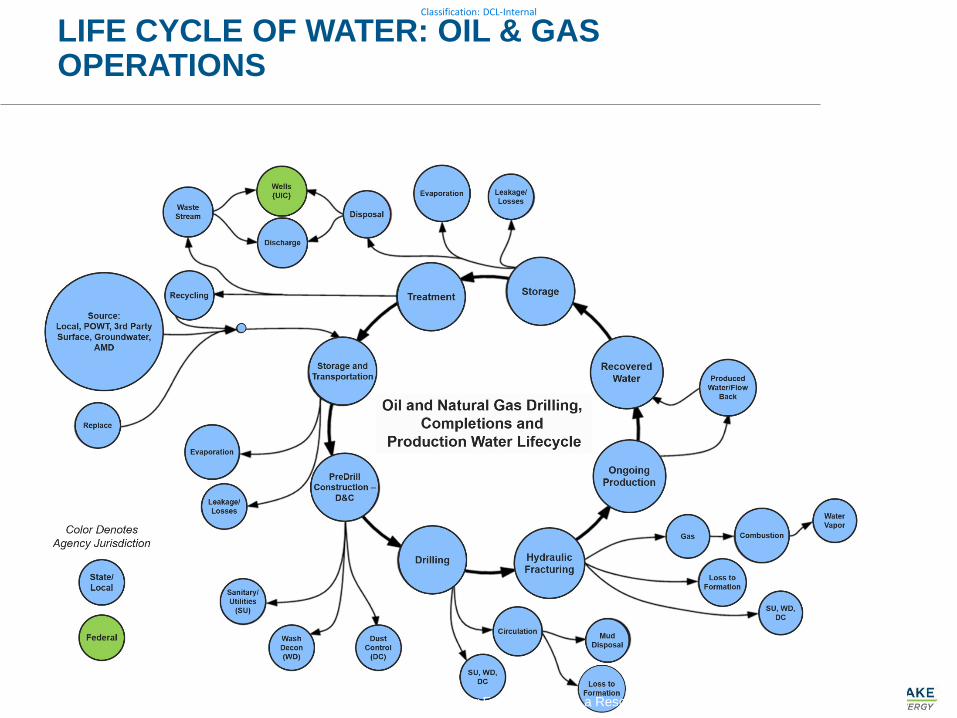
LIFE CYCLE OF WATER: OIL & GAS OPERATIONS
6Moving Produced Water From a Waste to a Resource– June 5, 2018
Classification: DCL-Internal
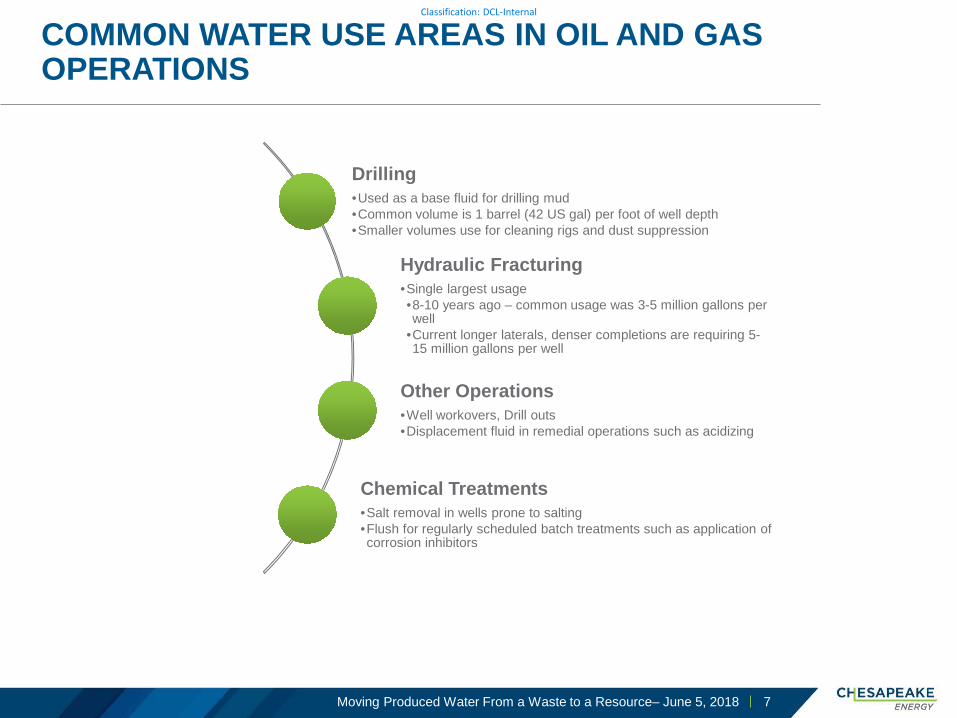
Drilling•Used as a base fluid for drilling mud•Common volume is 1 barrel (42 US gal) per foot of well depth•Smaller volumes use for cleaning rigs and dust suppression
Hydraulic Fracturing•Single largest usage•8-10 years ago – common usage was 3-5 million gallons per well
•Current longer laterals, denser completions are requiring 5-15 million gallons per well
Other Operations•Well workovers, Drill outs•Displacement fluid in remedial operations such as acidizing
Chemical Treatments•Salt removal in wells prone to salting•Flush for regularly scheduled batch treatments such as application of corrosion inhibitors
COMMON WATER USE AREAS IN OIL AND GAS OPERATIONS
Moving Produced Water From a Waste to a Resource– June 5, 2018 7
Classification: DCL-Internal
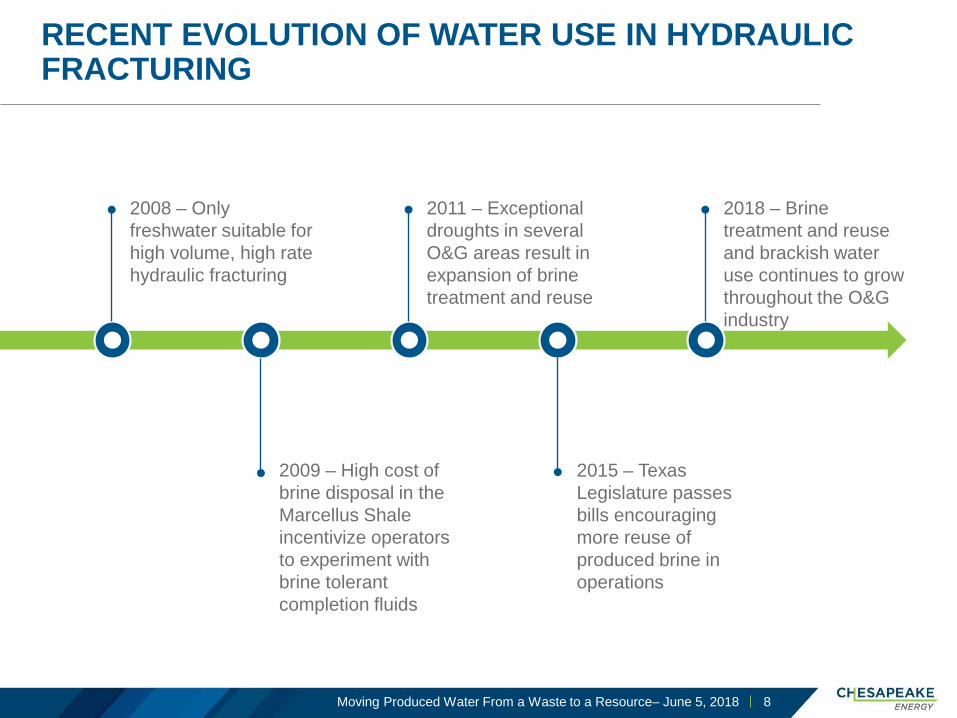
RECENT EVOLUTION OF WATER USE IN HYDRAULIC FRACTURING
Moving Produced Water From a Waste to a Resource– June 5, 2018 8
2008 – Only freshwater suitable for high volume, high rate hydraulic fracturing
2011 – Exceptional droughts in several O&G areas result in expansion of brine treatment and reuse
2018 – Brine treatment and reuse and brackish water use continues to grow throughout the O&G industry
2009 – High cost of brine disposal in the Marcellus Shale incentivize operators to experiment with brine tolerant completion fluids
2015 – Texas Legislature passes bills encouraging more reuse of produced brine in operations
Classification: DCL-Internal
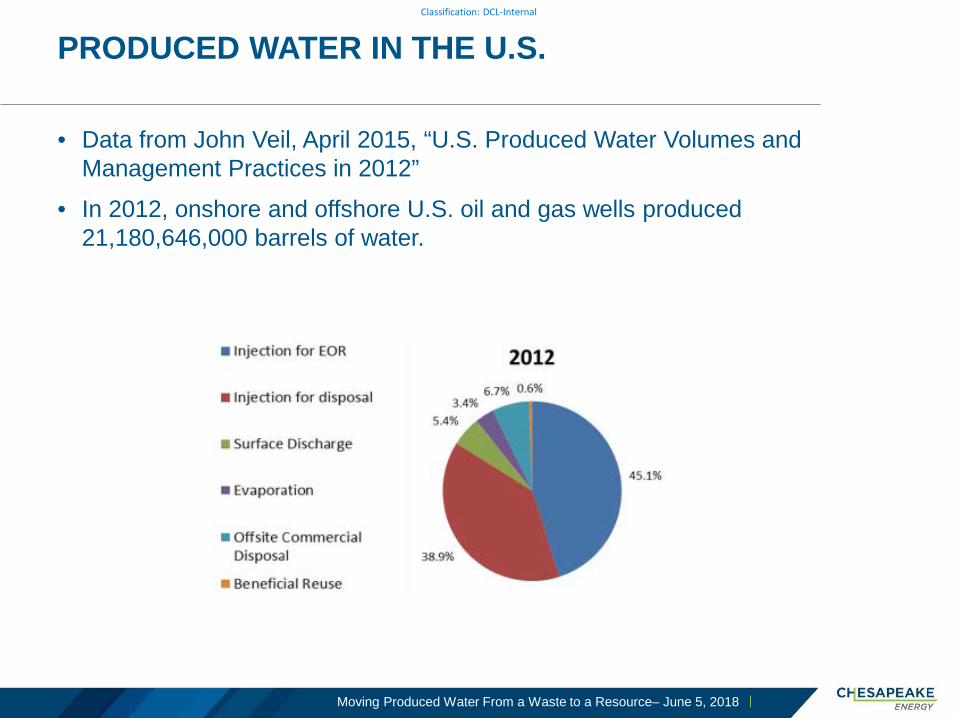
PRODUCED WATER IN THE U.S.
• Data from John Veil, April 2015, “U.S. Produced Water Volumes and Management Practices in 2012”
• In 2012, onshore and offshore U.S. oil and gas wells produced 21,180,646,000 barrels of water.
Moving Produced Water From a Waste to a Resource– June 5, 2018

Classification: DCL-Internal
AGENDA
• Chesapeake Energy
• Water Use In Oil & Gas Operations
• Water Intensity of Various Energy Sources
• Water Use in Value Creation
• Water Reporting in Oil and Gas Operations˃ What are we doing well?
˃ Where can we improve?
• Case Study – Industry Partnering With a State to Reduce Fresh Water Demand
Moving Produced Water From a Waste to a Resource– June 5, 2018 10
Classification: DCL-Internal
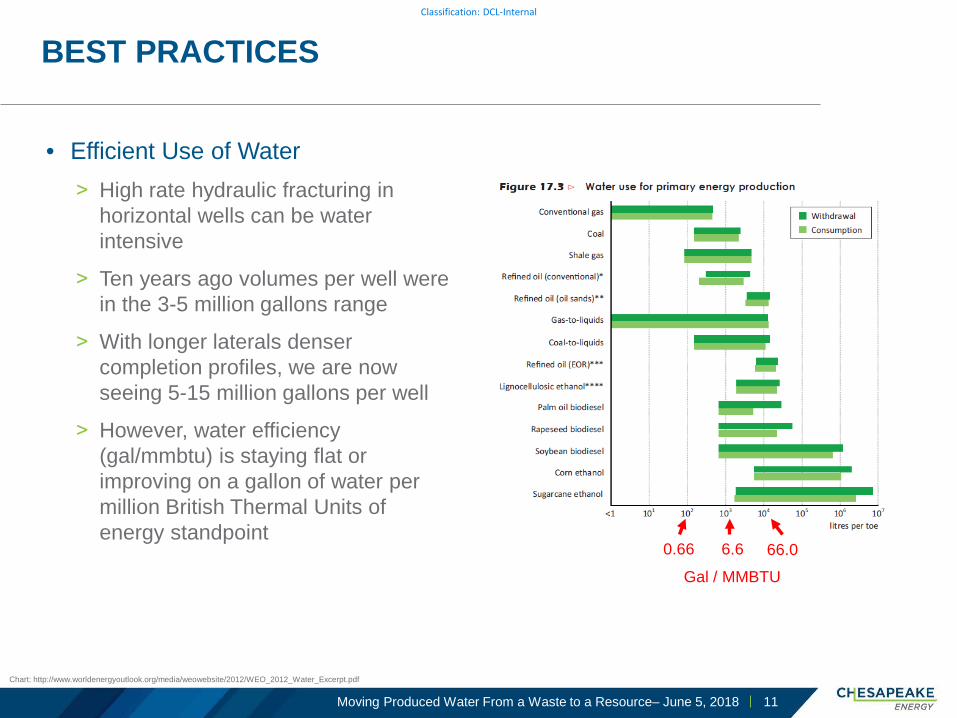
BEST PRACTICES
• Efficient Use of Water˃ High rate hydraulic fracturing in
horizontal wells can be water intensive
˃ Ten years ago volumes per well were in the 3-5 million gallons range
˃ With longer laterals denser completion profiles, we are now seeing 5-15 million gallons per well
˃ However, water efficiency (gal/mmbtu) is staying flat or improving on a gallon of water per million British Thermal Units of energy standpoint
Chart: http://www.worldenergyoutlook.org/media/weowebsite/2012/WEO_2012_Water_Excerpt.pdf
0.66 6.6 66.0
Gal / MMBTU
Moving Produced Water From a Waste to a Resource– June 5, 2018 11
Classification: DCL-Internal
AGENDA
• Chesapeake Energy
• Water Use In Oil & Gas Operations
• Water Intensity of Various Energy Sources
• Water Use in Value Creation
• Water Reporting in Oil and Gas Operations˃ What are we doing well?
˃ Where can we improve?
• Case Study – Industry Partnering With a State to Reduce Fresh Water Demand
Moving Produced Water From a Waste to a Resource– June 5, 2018 12

Classification: DCL-Internal
Moving Produced Water From a Waste to a Resource– June 5, 2018 13
Gabrielle Collins, J.D., Baker Institute for Public Policy, Rice University, “How Much Water Does It Take To Produce a Billion Dollars of Economic output?”

Classification: DCL-Internal
Moving Produced Water From a Waste to a Resource– June 5, 2018 14
Gabrielle Collins, J.D., Baker Institute for Public Policy, Rice University, “How Much Water Does It Take To Produce a Billion Dollars of Economic output?”

Classification: DCL-Internal
Moving Produced Water From a Waste to a Resource– June 5, 2018 15
Gabrielle Collins, J.D., Baker Institute for Public Policy, Rice University, “How Much Water Does It Take To Produce a Billion Dollars of Economic output?”

Classification: DCL-Internal
AGENDA
• Chesapeake Energy
• Water Use In Oil & Gas Operations
• Water Intensity of Various Energy Sources
• Water Use in Value Creation
• Water Reporting in Oil and Gas Operations˃ What are we doing well?
˃ Where can we improve?
• Case Study – Industry Partnering With a State to Reduce Fresh Water Demand
Moving Produced Water From a Waste to a Resource– June 5, 2018 16

Classification: DCL-Internal
WHAT ARE WE DOING WELL?
• Water Usage on Hydraulic Fracturing Activities˃ Usually Required by States or BLM
• FracFocus™˃ Created and maintained by GWPC
˃ Initially, voluntary submissions by Operators but many States now mandate its use
˃ Data submitted includes• Water volume for completion
• Sand (proppant) volume
• Chemical composition and quantity for each HF additive
Photo courtesy of BJ Services Company
Moving Produced Water From a Waste to a Resource– June 5, 2018 17

Classification: DCL-Internal
WHAT CAN WE IMPROVE?
• More Transparency in Base Fluid for Completions˃ Produced water
˃ Brackish groundwater
˃ Municipal effluent streams
˃ Industrial wastewater
˃ FracFocus reporting
˃ States request
Moving Produced Water From a Waste to a Resource– June 5, 2018 18

Classification: DCL-Internal
WHAT CAN WE IMPROVE?
• Spill Reporting˃ Required by States and BLM
˃ Reporting requirements vary
˃ Many Operators track more stringently• You cant improve what you don’t track!
˃ Industry discussion in incubation phase regarding a universally acceptable, more robust method
Photo property of Alaska Department of Environmental Quality
Moving Produced Water From a Waste to a Resource– June 5, 2018 19
Classification: DCL-Internal
AGENDA
• Chesapeake Energy
• Water Use In Oil & Gas Operations
• Water Intensity of Various Energy Sources
• Water Use in Value Creation
• Water Reporting in Oil and Gas Operations˃ What are we doing well?
˃ Where can we improve?
• Case Study – Industry Partnering With a State to Reduce Fresh Water Demand
Moving Produced Water From a Waste to a Resource– June 5, 2018 20

Classification: DCL-Internal
TEXAS WATER DEVELOPMENT BOARDBRACKISH AQUIFER CHARACTERIZATION SYSTEM (BRACS)
Moving Produced Water From a Waste to a Resource– June 5, 2018 21

Classification: DCL-Internal
Moving Produced Water From A Waste to a Resource
RICK MCCURDYSENIOR ENGINEERING ADVISOR