movr - scientiamobile.com · movr 5 top smartphones • new to the list this quarter are the apple...
TRANSCRIPT

The first step in a great mobile experience
MOVRMobile Overview ReportJanuary – March 2017
The first step in a great mobile experience
The first step in a great mobile experience2
TBD
The first step in a great mobile experience3
TBD
Q4 2016 to Q1 2017Comparisons
MOVR5
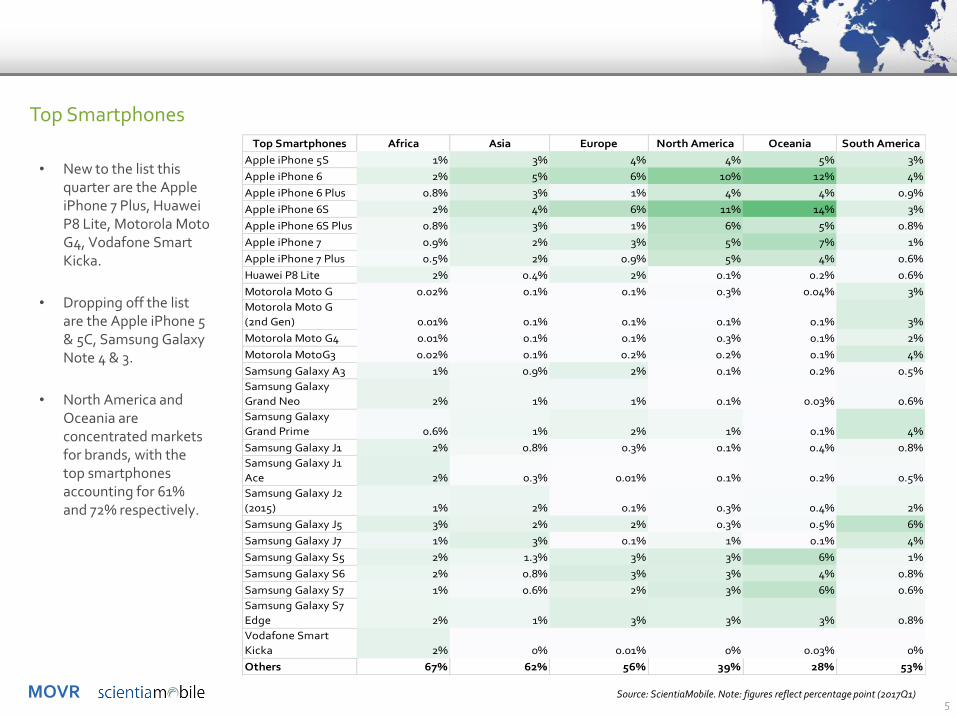
Top Smartphones
• New to the list this quarter are the Apple iPhone 7 Plus, Huawei P8 Lite, Motorola Moto G4, Vodafone Smart Kicka.
• Dropping off the list are the Apple iPhone 5 & 5C, Samsung Galaxy Note 4 & 3.
• North America and Oceania are concentrated markets for brands, with the top smartphones accounting for 61% and 72% respectively.
Top Smartphones Africa Asia Europe North America Oceania South America
Apple iPhone 5S 1% 3% 4% 4% 5% 3%
Apple iPhone 6 2% 5% 6% 10% 12% 4%
Apple iPhone 6 Plus 0.8% 3% 1% 4% 4% 0.9%
Apple iPhone 6S 2% 4% 6% 11% 14% 3%
Apple iPhone 6S Plus 0.8% 3% 1% 6% 5% 0.8%
Apple iPhone 7 0.9% 2% 3% 5% 7% 1%
Apple iPhone 7 Plus 0.5% 2% 0.9% 5% 4% 0.6%
Huawei P8 Lite 2% 0.4% 2% 0.1% 0.2% 0.6%
Motorola Moto G 0.02% 0.1% 0.1% 0.3% 0.04% 3%
Motorola Moto G
(2nd Gen) 0.01% 0.1% 0.1% 0.1% 0.1% 3%
Motorola Moto G4 0.01% 0.1% 0.1% 0.3% 0.1% 2%
Motorola MotoG3 0.02% 0.1% 0.2% 0.2% 0.1% 4%
Samsung Galaxy A3 1% 0.9% 2% 0.1% 0.2% 0.5%
Samsung Galaxy
Grand Neo 2% 1% 1% 0.1% 0.03% 0.6%
Samsung Galaxy
Grand Prime 0.6% 1% 2% 1% 0.1% 4%
Samsung Galaxy J1 2% 0.8% 0.3% 0.1% 0.4% 0.8%
Samsung Galaxy J1
Ace 2% 0.3% 0.01% 0.1% 0.2% 0.5%
Samsung Galaxy J2
(2015) 1% 2% 0.1% 0.3% 0.4% 2%
Samsung Galaxy J5 3% 2% 2% 0.3% 0.5% 6%
Samsung Galaxy J7 1% 3% 0.1% 1% 0.1% 4%
Samsung Galaxy S5 2% 1.3% 3% 3% 6% 1%
Samsung Galaxy S6 2% 0.8% 3% 3% 4% 0.8%
Samsung Galaxy S7 1% 0.6% 2% 3% 6% 0.6%
Samsung Galaxy S7
Edge 2% 1% 3% 3% 3% 0.8%
Vodafone Smart
Kicka 2% 0% 0.01% 0% 0.03% 0%
Others 67% 62% 56% 39% 28% 53%
Source: ScientiaMobile. Note: figures reflect percentage point (2017Q1)
MOVR6
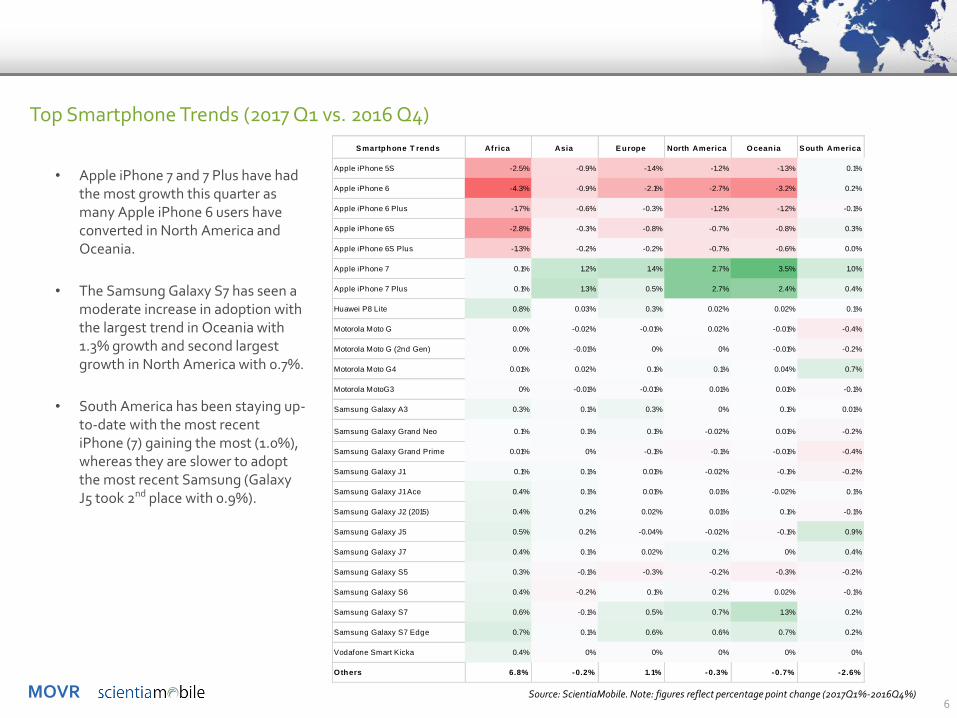
Top Smartphone Trends (2017 Q1 vs. 2016 Q4)
Source: ScientiaMobile. Note: figures reflect percentage point change (2017Q1%-2016Q4%)
• Apple iPhone 7 and 7 Plus have had the most growth this quarter as many Apple iPhone 6 users have converted in North America and Oceania.
• The Samsung Galaxy S7 has seen a moderate increase in adoption with the largest trend in Oceania with 1.3% growth and second largest growth in North America with 0.7%.
• South America has been staying up-to-date with the most recent iPhone (7) gaining the most (1.0%), whereas they are slower to adopt the most recent Samsung (Galaxy J5 took 2nd place with 0.9%).
S martphone T rends Africa Asia E urope North America Oceania S outh America
Apple iPhone 5S -2.5% -0.9% -1.4% -1.2% -1.3% 0.1%
Apple iPhone 6 -4.3% -0.9% -2.1% -2.7% -3.2% 0.2%
Apple iPhone 6 Plus -1.7% -0.6% -0.3% -1.2% -1.2% -0.1%
Apple iPhone 6S -2.8% -0.3% -0.8% -0.7% -0.8% 0.3%
Apple iPhone 6S Plus -1.3% -0.2% -0.2% -0.7% -0.6% 0.0%
Apple iPhone 7 0.1% 1.2% 1.4% 2.7% 3.5% 1.0%
Apple iPhone 7 Plus 0.1% 1.3% 0.5% 2.7% 2.4% 0.4%
Huawei P8 Lite 0.8% 0.03% 0.3% 0.02% 0.02% 0.1%
Motorola Moto G 0.0% -0.02% -0.01% 0.02% -0.01% -0.4%
Motorola Moto G (2nd Gen) 0.0% -0.01% 0% 0% -0.01% -0.2%
Motorola Moto G4 0.01% 0.02% 0.1% 0.1% 0.04% 0.7%
Motorola MotoG3 0% -0.01% -0.01% 0.01% 0.01% -0.1%
Samsung Galaxy A3 0.3% 0.1% 0.3% 0% 0.1% 0.01%
Samsung Galaxy Grand Neo 0.1% 0.1% 0.1% -0.02% 0.01% -0.2%
Samsung Galaxy Grand Prime 0.01% 0% -0.1% -0.1% -0.01% -0.4%
Samsung Galaxy J1 0.1% 0.1% 0.01% -0.02% -0.1% -0.2%
Samsung Galaxy J1 Ace 0.4% 0.1% 0.01% 0.01% -0.02% 0.1%
Samsung Galaxy J2 (2015) 0.4% 0.2% 0.02% 0.01% 0.1% -0.1%
Samsung Galaxy J5 0.5% 0.2% -0.04% -0.02% -0.1% 0.9%
Samsung Galaxy J7 0.4% 0.1% 0.02% 0.2% 0% 0.4%
Samsung Galaxy S5 0.3% -0.1% -0.3% -0.2% -0.3% -0.2%
Samsung Galaxy S6 0.4% -0.2% 0.1% 0.2% 0.02% -0.1%
Samsung Galaxy S7 0.6% -0.1% 0.5% 0.7% 1.3% 0.2%
Samsung Galaxy S7 Edge 0.7% 0.1% 0.6% 0.6% 0.7% 0.2%
Vodafone Smart Kicka 0.4% 0% 0% 0% 0% 0%
Others 6.8% -0.2% 1.1% -0.3% -0.7% -2.6%
MOVR7
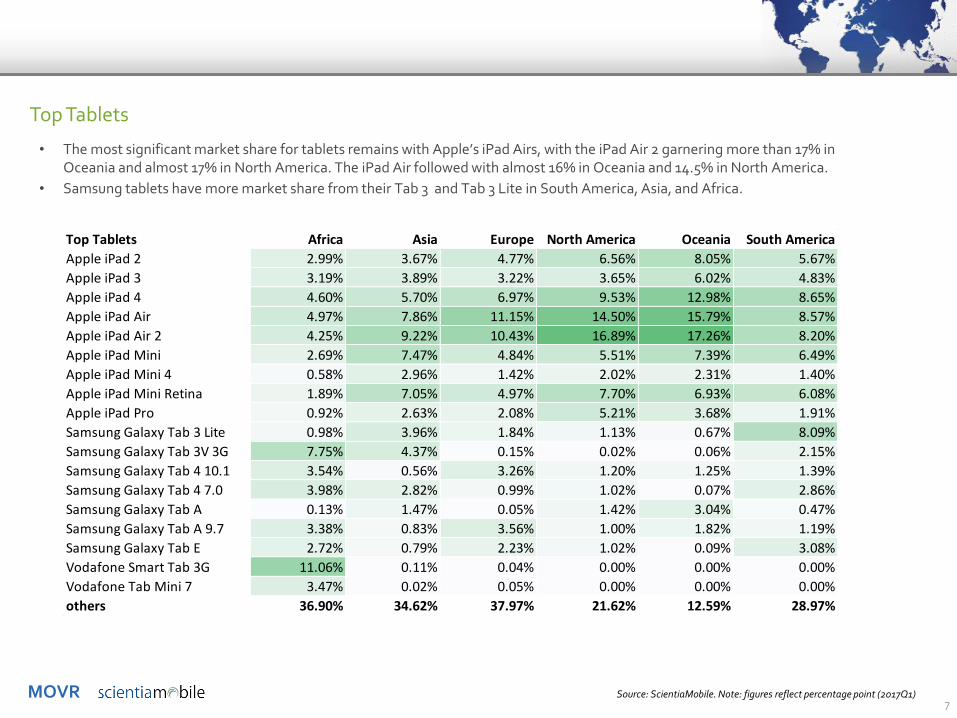
Top Tablets
• The most significant market share for tablets remains with Apple’s iPad Airs, with the iPad Air 2 garnering more than 17% in Oceania and almost 17% in North America. The iPad Air followed with almost 16% in Oceania and 14.5% in North America.
• Samsung tablets have more market share from their Tab 3 and Tab 3 Lite in South America, Asia, and Africa.
Top Tablets Africa Asia Europe North America Oceania South America
Apple iPad 2 2.99% 3.67% 4.77% 6.56% 8.05% 5.67%
Apple iPad 3 3.19% 3.89% 3.22% 3.65% 6.02% 4.83%
Apple iPad 4 4.60% 5.70% 6.97% 9.53% 12.98% 8.65%
Apple iPad Air 4.97% 7.86% 11.15% 14.50% 15.79% 8.57%
Apple iPad Air 2 4.25% 9.22% 10.43% 16.89% 17.26% 8.20%
Apple iPad Mini 2.69% 7.47% 4.84% 5.51% 7.39% 6.49%
Apple iPad Mini 4 0.58% 2.96% 1.42% 2.02% 2.31% 1.40%
Apple iPad Mini Retina 1.89% 7.05% 4.97% 7.70% 6.93% 6.08%
Apple iPad Pro 0.92% 2.63% 2.08% 5.21% 3.68% 1.91%
Samsung Galaxy Tab 3 Lite 0.98% 3.96% 1.84% 1.13% 0.67% 8.09%
Samsung Galaxy Tab 3V 3G 7.75% 4.37% 0.15% 0.02% 0.06% 2.15%
Samsung Galaxy Tab 4 10.1 3.54% 0.56% 3.26% 1.20% 1.25% 1.39%
Samsung Galaxy Tab 4 7.0 3.98% 2.82% 0.99% 1.02% 0.07% 2.86%
Samsung Galaxy Tab A 0.13% 1.47% 0.05% 1.42% 3.04% 0.47%
Samsung Galaxy Tab A 9.7 3.38% 0.83% 3.56% 1.00% 1.82% 1.19%
Samsung Galaxy Tab E 2.72% 0.79% 2.23% 1.02% 0.09% 3.08%
Vodafone Smart Tab 3G 11.06% 0.11% 0.04% 0.00% 0.00% 0.00%
Vodafone Tab Mini 7 3.47% 0.02% 0.05% 0.00% 0.00% 0.00%
others 36.90% 34.62% 37.97% 21.62% 12.59% 28.97%
Source: ScientiaMobile. Note: figures reflect percentage point (2017Q1)
MOVR8
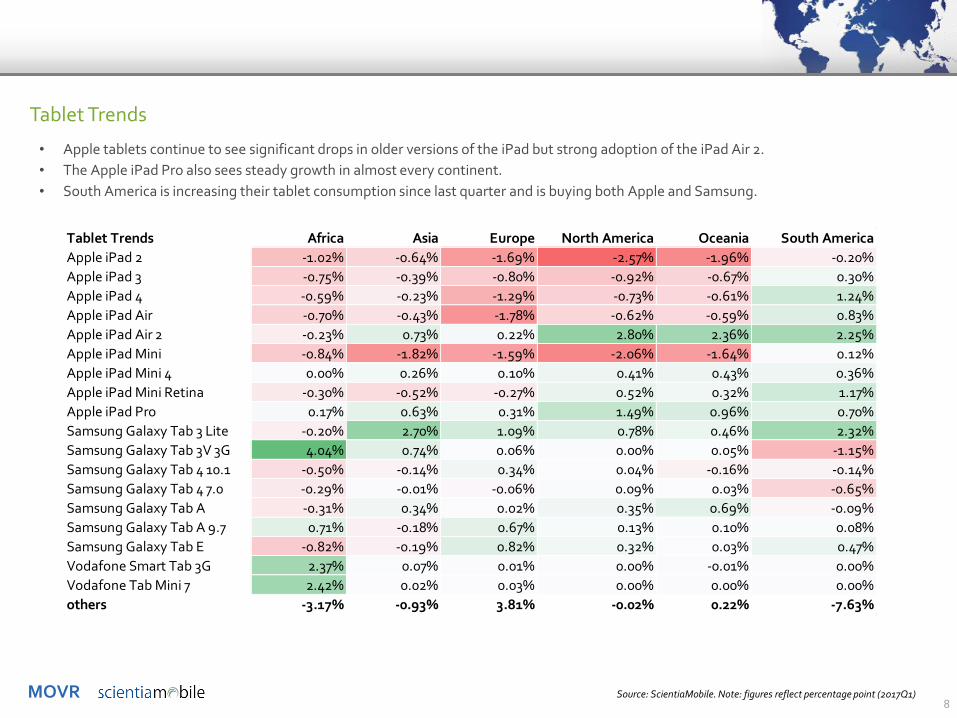
Tablet Trends
• Apple tablets continue to see significant drops in older versions of the iPad but strong adoption of the iPad Air 2.
• The Apple iPad Pro also sees steady growth in almost every continent.
• South America is increasing their tablet consumption since last quarter and is buying both Apple and Samsung.
Tablet Trends Africa Asia Europe North America Oceania South America
Apple iPad 2 -1.02% -0.64% -1.69% -2.57% -1.96% -0.20%
Apple iPad 3 -0.75% -0.39% -0.80% -0.92% -0.67% 0.30%
Apple iPad 4 -0.59% -0.23% -1.29% -0.73% -0.61% 1.24%
Apple iPad Air -0.70% -0.43% -1.78% -0.62% -0.59% 0.83%
Apple iPad Air 2 -0.23% 0.73% 0.22% 2.80% 2.36% 2.25%
Apple iPad Mini -0.84% -1.82% -1.59% -2.06% -1.64% 0.12%
Apple iPad Mini 4 0.00% 0.26% 0.10% 0.41% 0.43% 0.36%
Apple iPad Mini Retina -0.30% -0.52% -0.27% 0.52% 0.32% 1.17%
Apple iPad Pro 0.17% 0.63% 0.31% 1.49% 0.96% 0.70%
Samsung Galaxy Tab 3 Lite -0.20% 2.70% 1.09% 0.78% 0.46% 2.32%
Samsung Galaxy Tab 3V 3G 4.04% 0.74% 0.06% 0.00% 0.05% -1.15%
Samsung Galaxy Tab 4 10.1 -0.50% -0.14% 0.34% 0.04% -0.16% -0.14%
Samsung Galaxy Tab 4 7.0 -0.29% -0.01% -0.06% 0.09% 0.03% -0.65%
Samsung Galaxy Tab A -0.31% 0.34% 0.02% 0.35% 0.69% -0.09%
Samsung Galaxy Tab A 9.7 0.71% -0.18% 0.67% 0.13% 0.10% 0.08%
Samsung Galaxy Tab E -0.82% -0.19% 0.82% 0.32% 0.03% 0.47%
Vodafone Smart Tab 3G 2.37% 0.07% 0.01% 0.00% -0.01% 0.00%
Vodafone Tab Mini 7 2.42% 0.02% 0.03% 0.00% 0.00% 0.00%
others -3.17% -0.93% 3.81% -0.02% 0.22% -7.63%
Source: ScientiaMobile. Note: figures reflect percentage point (2017Q1)
MOVR
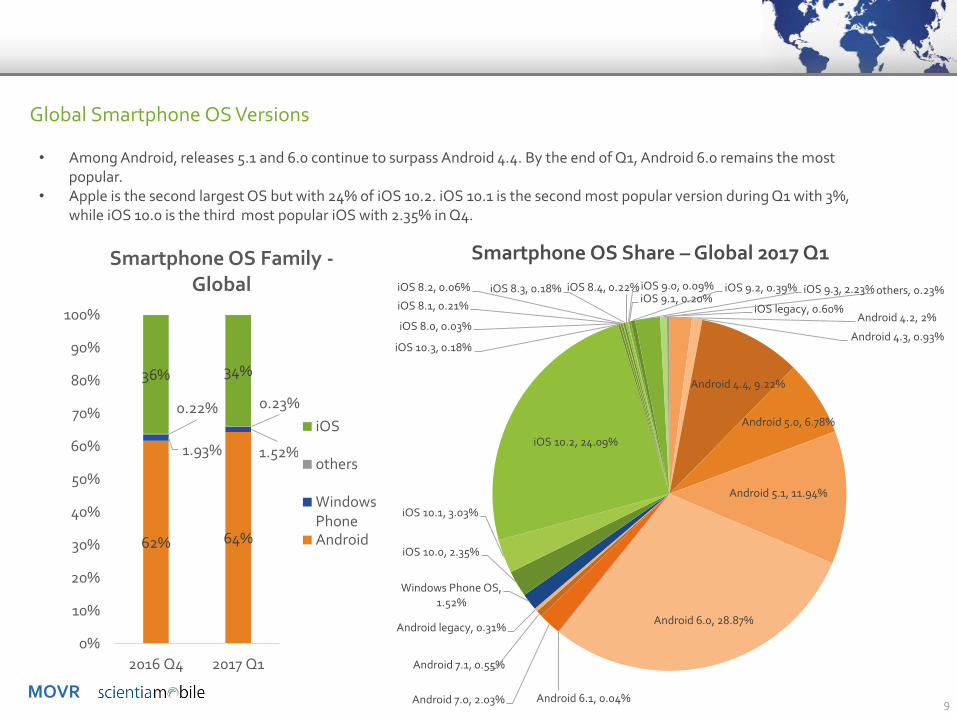
Global Smartphone OS Versions
• Among Android, releases 5.1 and 6.0 continue to surpass Android 4.4. By the end of Q1, Android 6.0 remains the most popular.
• Apple is the second largest OS but with 24% of iOS 10.2. iOS 10.1 is the second most popular version during Q1 with 3%, while iOS 10.0 is the third most popular iOS with 2.35% in Q4.
9
Smartphone OS Share –Global 2017 Q1
Android 4.2, 2%
Android 4.3, 0.93%
Android 4.4, 9.22%
Android 5.0, 6.78%
Android 5.1, 11.94%
Android 6.0, 28.87%
Android 6.1, 0.04%Android 7.0, 2.03%
Android 7.1, 0.55%
Android legacy, 0.31%
Windows Phone OS, 1.52%
iOS 10.0, 2.35%
iOS 10.1, 3.03%
iOS 10.2, 24.09%
iOS 10.3, 0.18%
iOS 8.0, 0.03%
iOS 8.1, 0.21%
iOS 8.2, 0.06% iOS 8.3, 0.18% iOS 8.4, 0.22%iOS 9.0, 0.09%iOS 9.1, 0.20%
iOS 9.2, 0.39% iOS 9.3, 2.23%
iOS legacy, 0.60%
others, 0.23%
62% 64%
1.93% 1.52%
0.22% 0.23%
36% 34%
0%
10%
20%
30%
40%
50%
60%
70%
80%
90%
100%
2016 Q4 2017 Q1
Smartphone OS Family -Global
iOS
others
WindowsPhoneAndroid
MOVR10
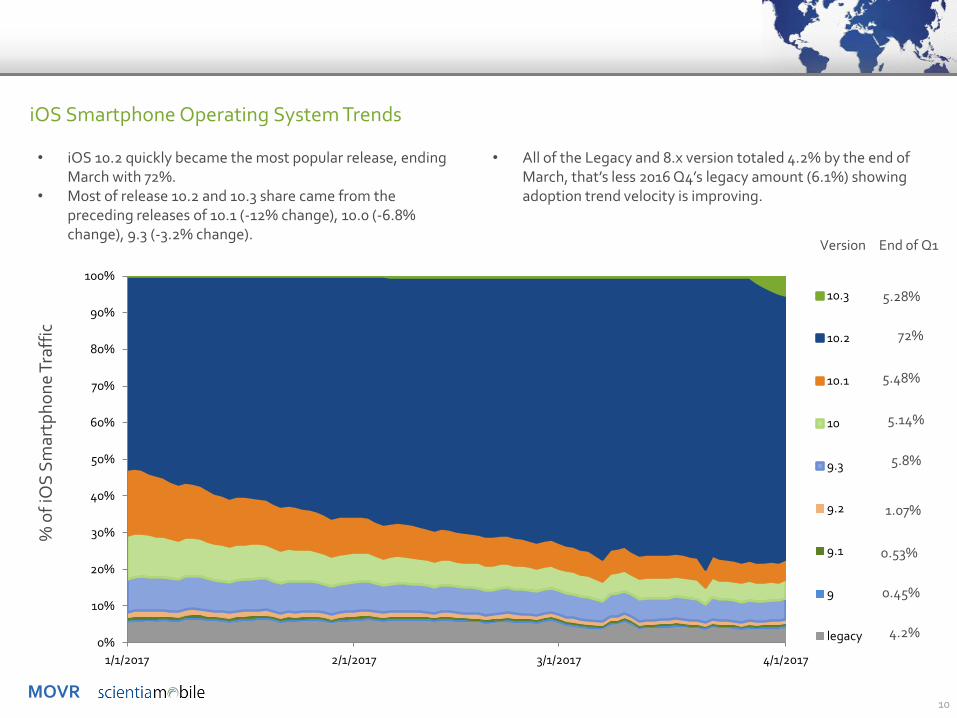
iOS Smartphone Operating System Trends
• iOS 10.2 quickly became the most popular release, ending March with 72%.
• Most of release 10.2 and 10.3 share came from the preceding releases of 10.1 (-12% change), 10.0 (-6.8% change), 9.3 (-3.2% change).
• All of the Legacy and 8.x version totaled 4.2% by the end of March, that’s less 2016 Q4’s legacy amount (6.1%) showing adoption trend velocity is improving.
% o
f iO
S S
mar
tph
on
e Tr
affi
c
5.14%
1.07%
5.48%
Version End of Q1
0%
10%
20%
30%
40%
50%
60%
70%
80%
90%
100%
1/1/2017 2/1/2017 3/1/2017 4/1/2017
10.3
10.2
10.1
10
9.3
9.2
9.1
9
legacy
5.28%
72%
0.53%
0.45%
4.2%
5.8%
MOVR11
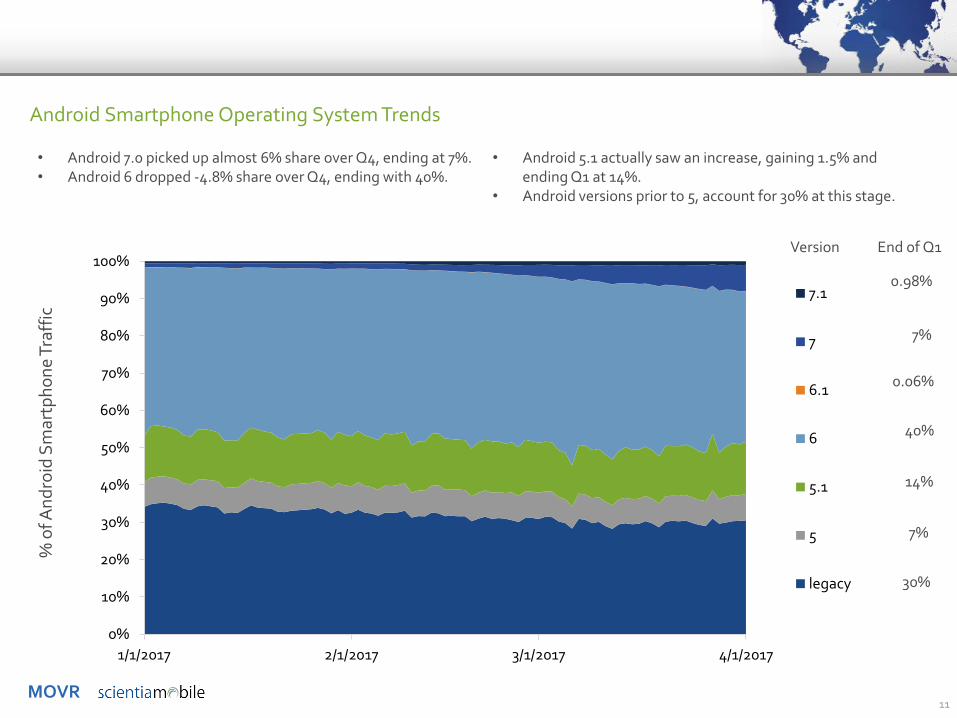
Android Smartphone Operating System Trends
• Android 7.0 picked up almost 6% share over Q4, ending at 7%.• Android 6 dropped -4.8% share over Q4, ending with 40%.
• Android 5.1 actually saw an increase, gaining 1.5% and ending Q1 at 14%.
• Android versions prior to 5, account for 30% at this stage.
% o
f An
dro
id S
mar
tph
on
e Tr
affi
c
0.98%
7%
0.06%
40%
End of Q1Version
0%
10%
20%
30%
40%
50%
60%
70%
80%
90%
100%
1/1/2017 2/1/2017 3/1/2017 4/1/2017
7.1
7
6.1
6
5.1
5
legacy
14%
7%
30%
MOVR
0.0%
2.0%
4.0%
6.0%
8.0%
10.0%
12.0%
14.0%
16.0%
Sep-14 Nov-14 Jan-15 Mar-15 May-15 Jul-15 Sep-15 Nov-15 Jan-16 Mar-16 May-16 Jul-16 Sep-16 Nov-16 Jan-17 Mar-17
Galaxy S5
Galaxy S6
Galaxy S7
Galaxy S8 Launch
12
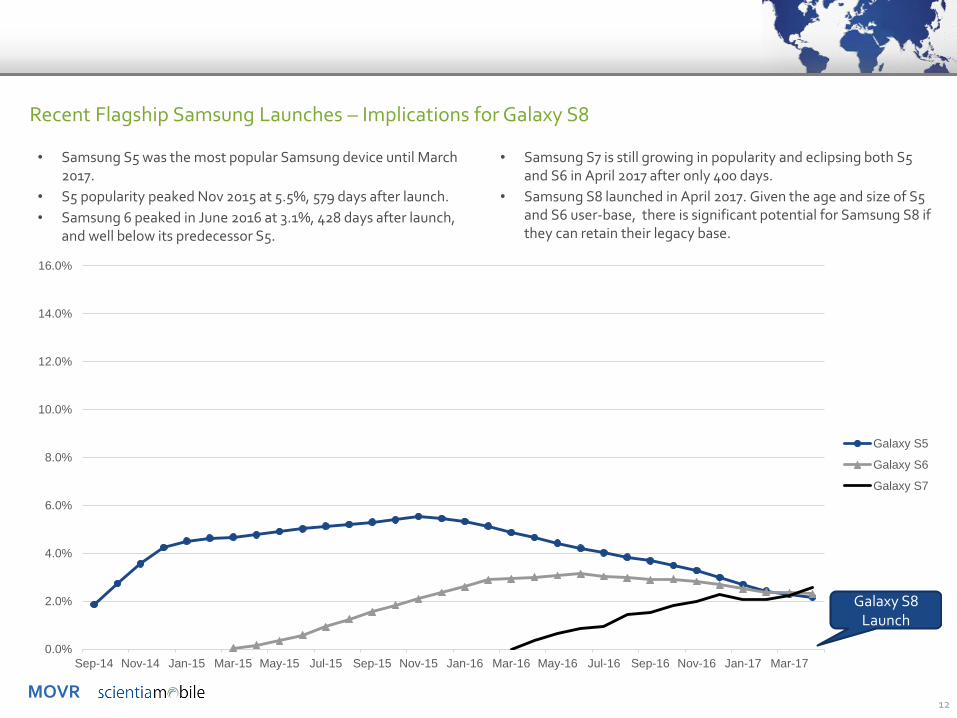
Recent Flagship Samsung Launches – Implications for Galaxy S8
• Samsung S5 was the most popular Samsung device until March 2017.
• S5 popularity peaked Nov 2015 at 5.5%, 579 days after launch.
• Samsung 6 peaked in June 2016 at 3.1%, 428 days after launch, and well below its predecessor S5.
• Samsung S7 is still growing in popularity and eclipsing both S5 and S6 in April 2017 after only 400 days.
• Samsung S8 launched in April 2017. Given the age and size of S5 and S6 user-base, there is significant potential for Samsung S8 if they can retain their legacy base.
MOVR13
0.0%
2.0%
4.0%
6.0%
8.0%
10.0%
12.0%
14.0%
16.0%
Sep-14 Nov-14 Jan-15 Mar-15 May-15 Jul-15 Sep-15 Nov-15 Jan-16 Mar-16 May-16 Jul-16 Sep-16 Nov-16 Jan-17 Mar-17
iPhone 5S
iPhone 6
iPhone 6S
iPhone 7
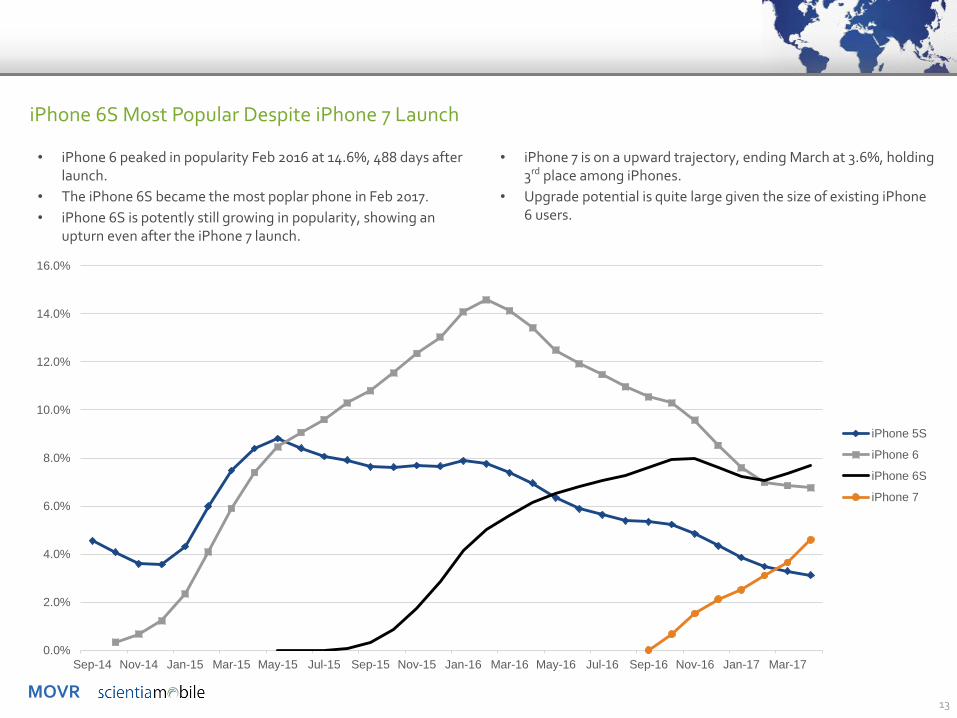
iPhone 6S Most Popular Despite iPhone 7 Launch
• iPhone 6 peaked in popularity Feb 2016 at 14.6%, 488 days after launch.
• The iPhone 6S became the most poplar phone in Feb 2017.
• iPhone 6S is potently still growing in popularity, showing an upturn even after the iPhone 7 launch.
• iPhone 7 is on a upward trajectory, ending March at 3.6%, holding 3rd place among iPhones.
• Upgrade potential is quite large given the size of existing iPhone 6 users.
MOVR14
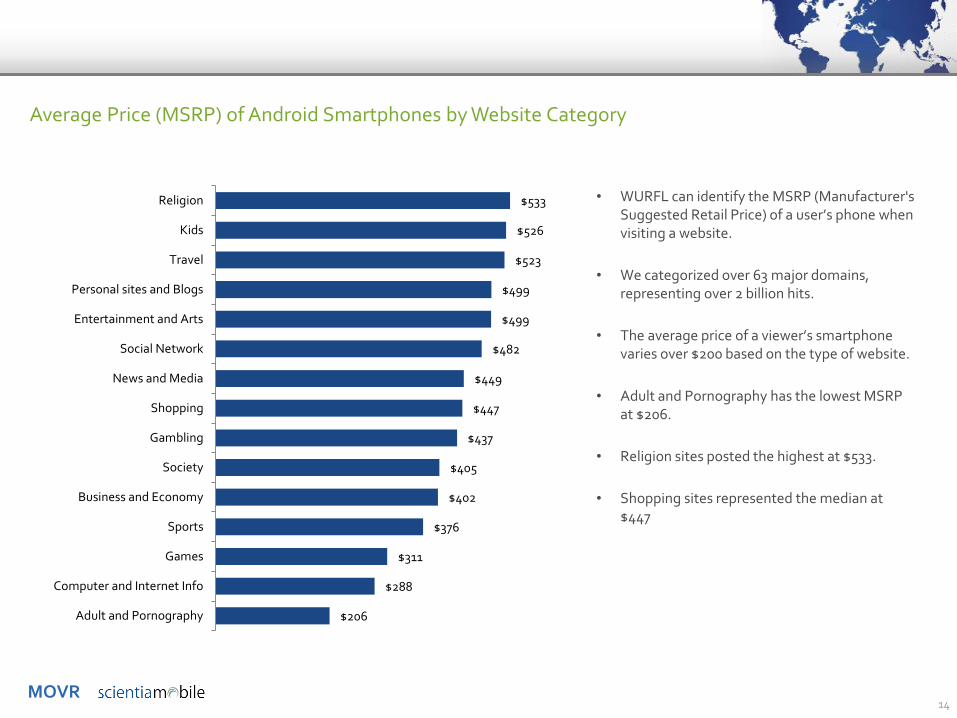
$206
$288
$311
$376
$402
$405
$437
$447
$449
$482
$499
$499
$523
$526
$533
Adult and Pornography
Computer and Internet Info
Games
Sports
Business and Economy
Society
Gambling
Shopping
News and Media
Social Network
Entertainment and Arts
Personal sites and Blogs
Travel
Kids
Religion • WURFL can identify the MSRP (Manufacturer's Suggested Retail Price) of a user’s phone when visiting a website.
• We categorized over 63 major domains, representing over 2 billion hits.
• The average price of a viewer’s smartphone varies over $200 based on the type of website.
• Adult and Pornography has the lowest MSRP at $206.
• Religion sites posted the highest at $533.
• Shopping sites represented the median at $447
Average Price (MSRP) of Android Smartphones by Website Category
MOVR15
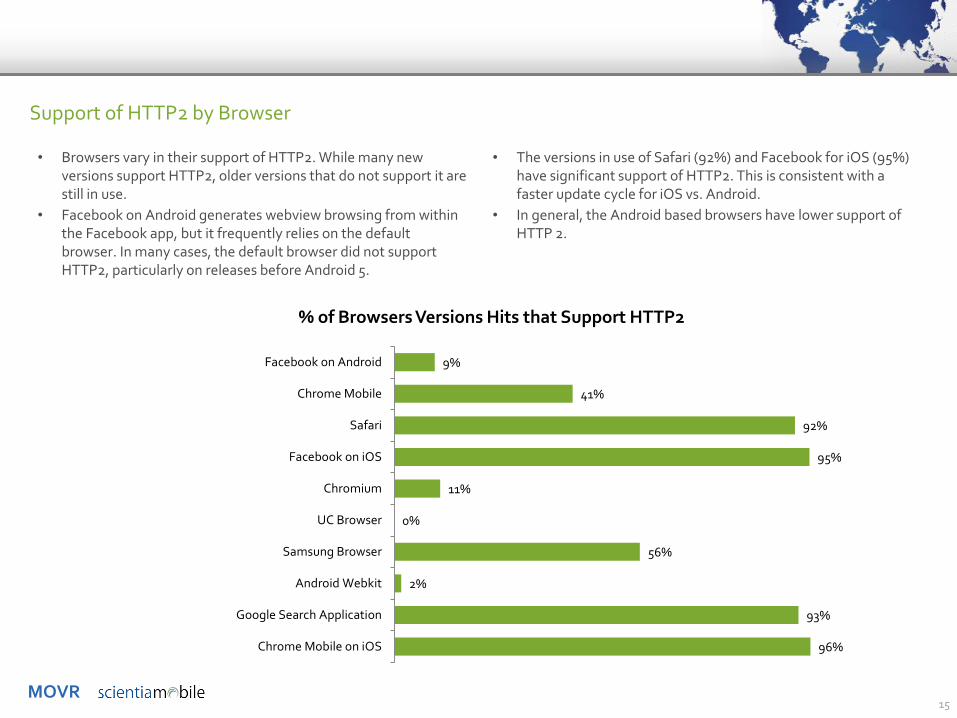
Support of HTTP2 by Browser
9%
41%
92%
95%
11%
0%
56%
2%
93%
96%
Facebook on Android
Chrome Mobile
Safari
Facebook on iOS
Chromium
UC Browser
Samsung Browser
Android Webkit
Google Search Application
Chrome Mobile on iOS
% of Browsers Versions Hits that Support HTTP2
• Browsers vary in their support of HTTP2. While many new versions support HTTP2, older versions that do not support it are still in use.
• Facebook on Android generates webview browsing from within the Facebook app, but it frequently relies on the default browser. In many cases, the default browser did not support HTTP2, particularly on releases before Android 5.
• The versions in use of Safari (92%) and Facebook for iOS (95%) have significant support of HTTP2. This is consistent with a faster update cycle for iOS vs. Android.
• In general, the Android based browsers have lower support of HTTP 2.
MOVR16
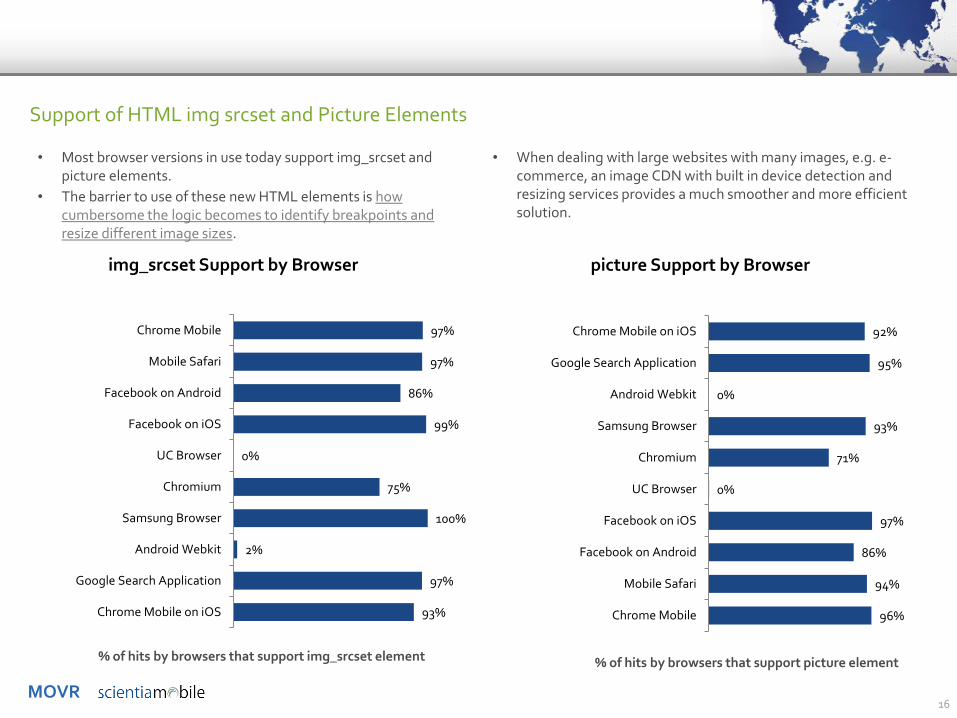
Support of HTML img srcset and Picture Elements
97%
97%
86%
99%
0%
75%
100%
2%
97%
93%
Chrome Mobile
Mobile Safari
Facebook on Android
Facebook on iOS
UC Browser
Chromium
Samsung Browser
Android Webkit
Google Search Application
Chrome Mobile on iOS
img_srcset Support by Browser
96%
94%
86%
97%
0%
71%
93%
0%
95%
92%
Chrome Mobile
Mobile Safari
Facebook on Android
Facebook on iOS
UC Browser
Chromium
Samsung Browser
Android Webkit
Google Search Application
Chrome Mobile on iOS
picture Support by Browser
% of hits by browsers that support picture element
• Most browser versions in use today support img_srcset and picture elements.
• The barrier to use of these new HTML elements is how cumbersome the logic becomes to identify breakpoints and resize different image sizes.
• When dealing with large websites with many images, e.g. e-commerce, an image CDN with built in device detection and resizing services provides a much smoother and more efficient solution.
% of hits by browsers that support img_srcset element

17
Spotlight: Israel
MOVR
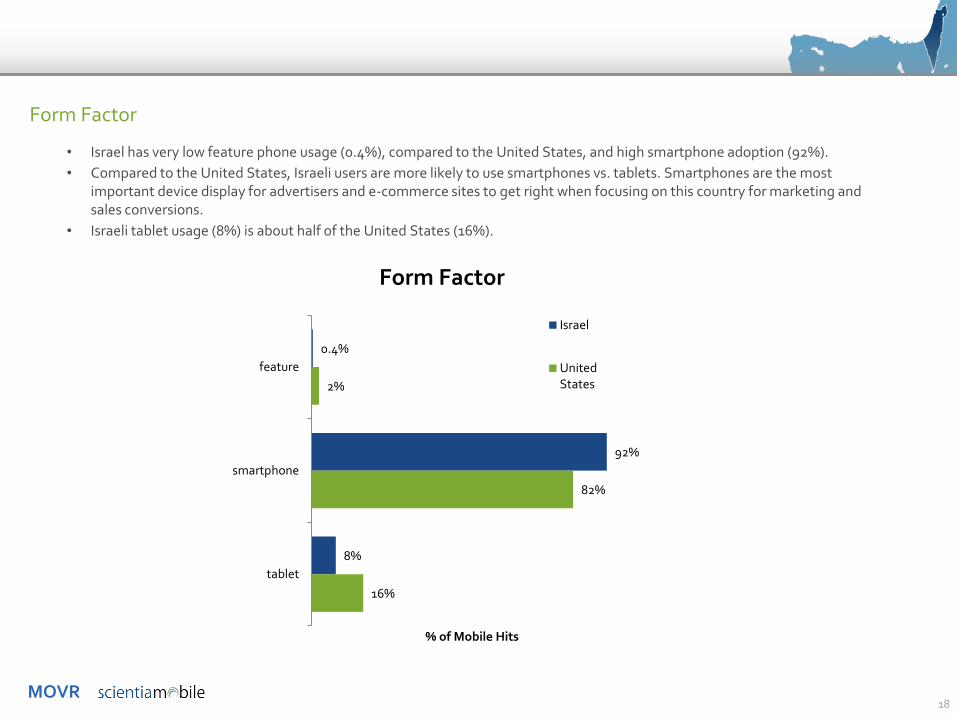
Form Factor
• Israel has very low feature phone usage (0.4%), compared to the United States, and high smartphone adoption (92%).
• Compared to the United States, Israeli users are more likely to use smartphones vs. tablets. Smartphones are the most important device display for advertisers and e-commerce sites to get right when focusing on this country for marketing and sales conversions.
• Israeli tablet usage (8%) is about half of the United States (16%).
18
0.4%
92%
8%
2%
82%
16%
feature
smartphone
tablet
% of Mobile Hits
Form Factor
Israel
UnitedStates
MOVR
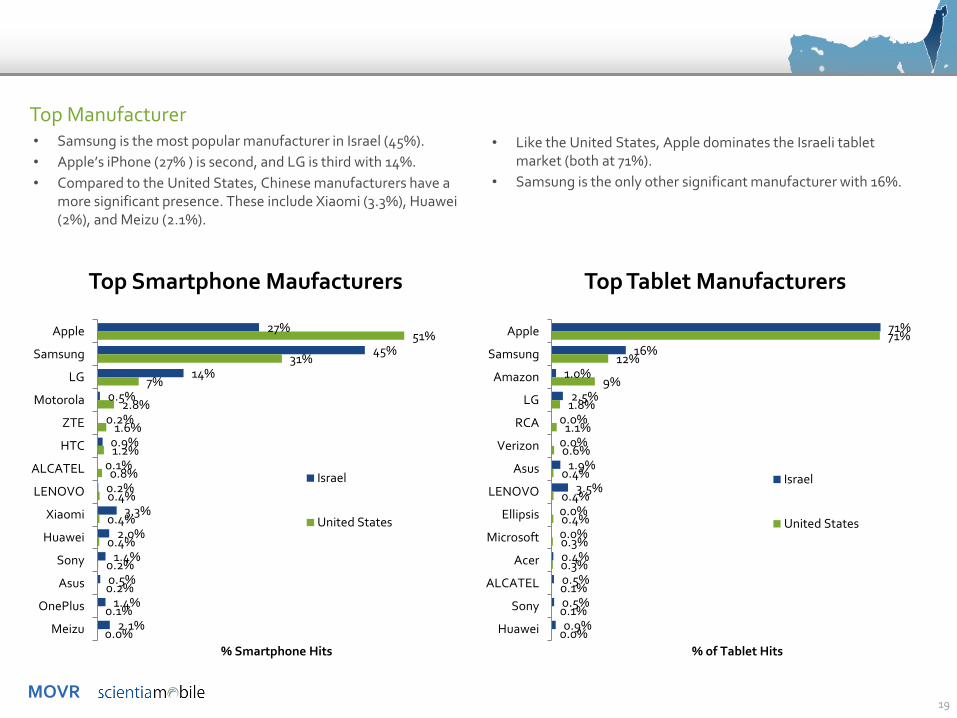
Top Manufacturer• Samsung is the most popular manufacturer in Israel (45%).
• Apple’s iPhone (27% ) is second, and LG is third with 14%.
• Compared to the United States, Chinese manufacturers have a more significant presence. These include Xiaomi (3.3%), Huawei (2%), and Meizu (2.1%).
19
• Like the United States, Apple dominates the Israeli tablet market (both at 71%).
• Samsung is the only other significant manufacturer with 16%.
27%
45%
14%
0.5%
0.2%
0.9%
0.1%
0.2%
3.3%
2.0%
1.4%
0.5%
1.4%
2.1%
51%
31%
7%
2.8%
1.6%
1.2%
0.8%
0.4%
0.4%
0.4%
0.2%
0.2%
0.1%
0.0%
Apple
Samsung
LG
Motorola
ZTE
HTC
ALCATEL
LENOVO
Xiaomi
Huawei
Sony
Asus
OnePlus
Meizu
% Smartphone Hits
Top Smartphone Maufacturers
Israel
United States
71%
16%
1.0%
2.5%
0.0%
0.0%
1.9%
3.5%
0.0%
0.0%
0.4%
0.5%
0.5%
0.9%
71%
12%
9%
1.8%
1.1%
0.6%
0.4%
0.4%
0.4%
0.3%
0.3%
0.1%
0.1%
0.0%
Apple
Samsung
Amazon
LG
RCA
Verizon
Asus
LENOVO
Ellipsis
Microsoft
Acer
ALCATEL
Sony
Huawei
% of Tablet Hits
Top Tablet Manufacturers
Israel
United States
MOVR
Top Devices
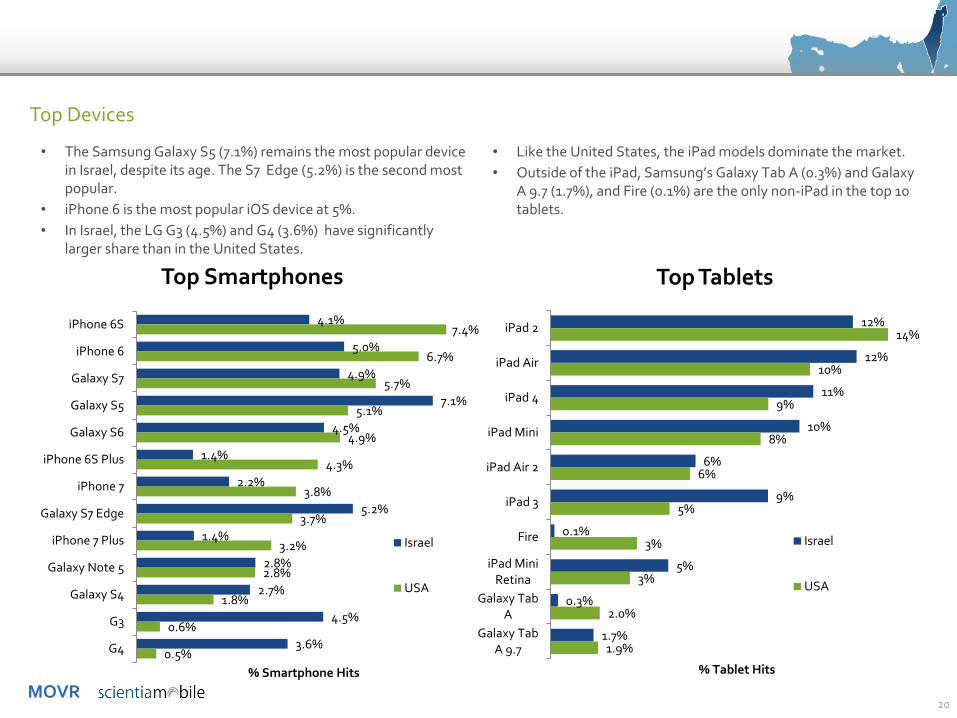
• The Samsung Galaxy S5 (7.1%) remains the most popular device in Israel, despite its age. The S7 Edge (5.2%) is the second most popular.
• iPhone 6 is the most popular iOS device at 5%.
• In Israel, the LG G3 (4.5%) and G4 (3.6%) have significantly larger share than in the United States.
20
• Like the United States, the iPad models dominate the market.
• Outside of the iPad, Samsung’s Galaxy Tab A (0.3%) and Galaxy A 9.7 (1.7%), and Fire (0.1%) are the only non-iPad in the top 10 tablets.
12%
12%
11%
10%
6%
9%
0.1%
5%
0.3%
1.7%
14%
10%
9%
8%
6%
5%
3%
3%
2.0%
1.9%
iPad 2
iPad Air
iPad 4
iPad Mini
iPad Air 2
iPad 3
Fire
iPad MiniRetina
Galaxy TabA
Galaxy TabA 9.7
% Tablet Hits
Top Tablets
Israel
USA
4.1%
5.0%
4.9%
7.1%
4.5%
1.4%
2.2%
5.2%
1.4%
2.8%
2.7%
4.5%
3.6%
7.4%
6.7%
5.7%
5.1%
4.9%
4.3%
3.8%
3.7%
3.2%
2.8%
1.8%
0.6%
0.5%
iPhone 6S
iPhone 6
Galaxy S7
Galaxy S5
Galaxy S6
iPhone 6S Plus
iPhone 7
Galaxy S7 Edge
iPhone 7 Plus
Galaxy Note 5
Galaxy S4
G3
G4
% Smartphone Hits
Top Smartphones
Israel
USA
MOVR
OS Smartphones
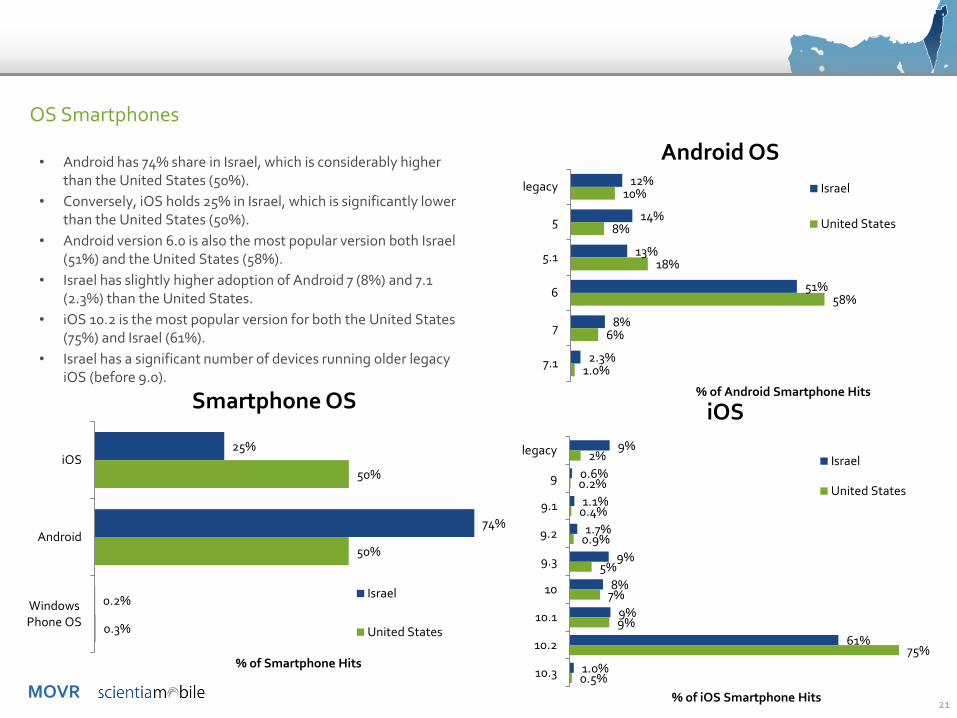
• Android has 74% share in Israel, which is considerably higher than the United States (50%).
• Conversely, iOS holds 25% in Israel, which is significantly lower than the United States (50%).
• Android version 6.0 is also the most popular version both Israel (51%) and the United States (58%).
• Israel has slightly higher adoption of Android 7 (8%) and 7.1 (2.3%) than the United States.
• iOS 10.2 is the most popular version for both the United States (75%) and Israel (61%).
• Israel has a significant number of devices running older legacy iOS (before 9.0).
21
25%
74%
0.2%
50%
50%
0.3%
iOS
Android
WindowsPhone OS
% of Smartphone Hits
Smartphone OS
Israel
United States
9%
0.6%
1.1%
1.7%
9%
8%
9%
61%
1.0%
2%
0.2%
0.4%
0.9%
5%
7%
9%
75%
0.5%
legacy
9
9.1
9.2
9.3
10
10.1
10.2
10.3
% of iOS Smartphone Hits
iOS
Israel
United States
12%
14%
13%
51%
8%
2.3%
10%
8%
18%
58%
6%
1.0%
legacy
5
5.1
6
7
7.1
% of Android Smartphone Hits
Android OS
Israel
United States

How to:Make WURFL.js work for you

MOVR23
Add iPhone Models To Google Analytics with WURFL.js Business Edition
With Business Edition, You Get:• Accurate identification of iPhone and iPad
models • Integrate with Google Analytics• Over 20 of WURFL’s most popular capabilities
• Easy-to-use JavaScript snippet works with ScientiaMobile’s cloud-based DDR
• SLA and high reliability• Helpdesk support
About this Report & Resources
MOVR
• Purpose of Report
– ScientiaMobile publishes MOVR to provide the mobile Web community with timely information on mobile Web device usage.
– Our goal is to stimulate interest in mobile device trends, device capabilities, and tools for analyzing and managing device fragmentation.
• Sources of Data and Filtering
– The information in this report is based on a representative sample of a larger data set. The sample size is over 39.7 billion requests from April 2014 to end of December 2016.
– MOVR focuses on mobile devices, consisting of smartphones, tablets, and feature phones.
– While the data set includes desktops, laptops, smart TVs, game consoles, apps, and robots, we have excluded them, unless otherwise noted.
– We have used an Equivalent Weighted Sites (EWS) methodology that indexes the traffic at each site and assigns an equal weight to each site.
– Samples sizes for Africa and Oceania are small enough that we have a low level of confidence that these figures are representative. However, the source data from these continents continues to grow. Over time, we will improve the quality of these figures. In the meantime, we feel that more information is better than less for people looking for insights in these continents.
– To download the data files supporting MOVR, or subscribe to future publications of MOVR, please visit us at www.scientiamobile.com/movr
25
Report Specifications
Definitions
• What is a “hit”? Each time a user visits a Web page and a user agent (UA) is generated and tested by WURFL (through a number of mechanisms), a “hit” is recorded in the ScientiaMobile dataset. All data reported in MOVR reflects hits, not the count of physical devices generating the hit.
• What is a smartphone? A smartphone must meet several criteria: it must be a wireless device, have a touch screen with horizontal resolution greater than or equal to 320px, and not be considered a tablet.
• What is a tablet? Criteria for a tablet include: a wireless device, larger than 6 inch screen, and running a mobile or tablet OS. One exception is that a full version of Windows running on a tablet is considered to be a laptop.
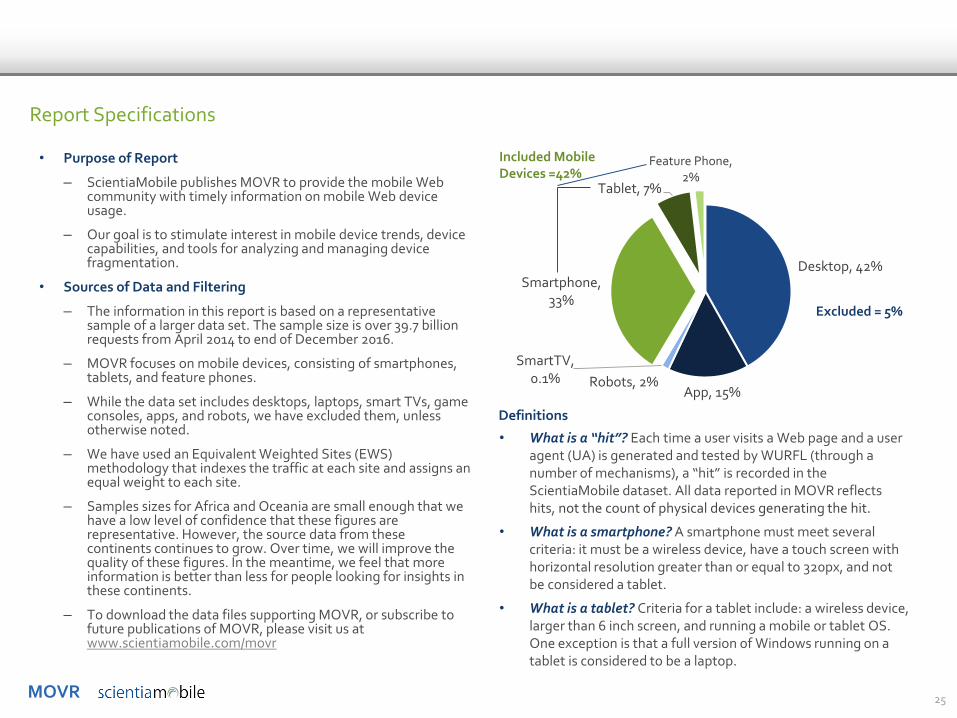
Desktop, 42%
App, 15%Robots, 2%
SmartTV, 0.1%
Smartphone, 33%
Tablet, 7%
Feature Phone, 2%
Excluded = 5%
Included Mobile Devices =42%
MOVR
• What is a feature phone? It is a wireless device that falls into one of the three categories: classic feature phones, modern feature phones, and old smartphones.
– Classic feature phone: Typically a bar, slide, or clamshell form factor with limited possibilities to install apps and a proprietary OS. Other criteria include a physical keyboard and a low price range. Examples are Nokia Series 30 and 40 or Motorola Razr devices.
– Modern feature phone: These phones also have a low price range. They are “smartphone-like”, but targeted at the classic feature phone market. They may have a smartphone OS. They borrow features from classic feature phones, such as size or screen size. Examples are Nokia Asha series or Samsung Galaxy Pocket.
– Old smartphones: These smartphones are older. Classic Blackberry devices and Symbian-based devices fall into this category. More recent devices with a touch screen, but with older hardware or older versions of Android, iOS or Windows Phone also fall into this category.
• What is MNO Traffic? Traffic originating from Mobile Network Operators (MNO). It is defined, in our research method, as the connection type provided by the browser navigator.connection API.
26
Definitions (continued) About WURFL
• ScientiaMobile uses its WURFL products to collect and analyze the device intelligence contained in the MOVR report. WURFL is a Device Description Repository (DDR) that integrates an API and XML to provide an always-updated source for detecting devices and their capabilities. For more than 10 years, WURFL has been the industry standard for device detection. Today, ScientiaMobile offers a number of WURFL products to match a range of needs, from small developers to large enterprises.
• WURFL OnSite and WURFL InFuze provide businesses with high performance server-side device detection solutions.
• WURFL.js and WURFL.js Business Edition provide front-end developers with access to device detection through JavaScript snippets.
• WURFL InSight provides business intelligence analysts with a table-based device detection tool that will integrate easily with data analysis tools.
• ImageEngine combines mobile device detection with image resizing, image file optimization, and Content Delivery Network (CDN)-type delivery. It provides significantly faster downloads, especially on mobile devices.
MOVR
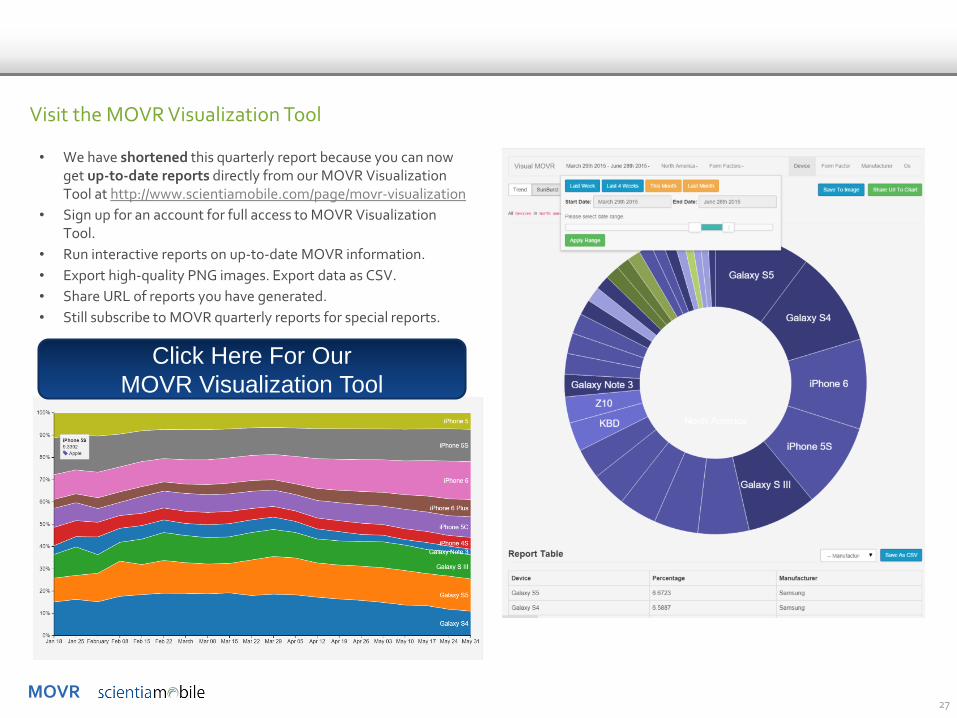
• We have shortened this quarterly report because you can now get up-to-date reports directly from our MOVR Visualization Tool at http://www.scientiamobile.com/page/movr-visualization
• Sign up for an account for full access to MOVR Visualization Tool.
• Run interactive reports on up-to-date MOVR information.
• Export high-quality PNG images. Export data as CSV.
• Share URL of reports you have generated.
• Still subscribe to MOVR quarterly reports for special reports.
27
Visit the MOVR Visualization Tool
Click Here For Our
MOVR Visualization Tool
MOVR
• ScientiaMobile provides the industry’s most accurate and flexible device detection solution, helping customers deliver great web experiences and manage the increasingly fragmented mobile device ecosystem. ScientiaMobile sells WURFL, a constantly-updated repository that catalogues thousands of devices and their capabilities and provides access to them via range of API languages. The WURFL framework enables many organizations, including Fortune 500 companies, to effectively design and analyze web experiences for an ever-growing range of smartphones, tablets, smart TVs, and game consoles.
• For more information about ScientiaMobile and its commercial products, please visit us at: www.scientiamobile.com
• WURFL.io offers a number of free tools for device detection and image tailoring.
• To subscribe to MOVR, please visit us at www.scientiamobile.com/page/movr-mobile-overview-report
• To speak to us about our products and licenses, please complete this form at www.scientiamobile.com/license
• MOVR is the Copyright of ScientiaMobile, Inc. and is made available under the terms of the Creative Commons Attribution-NonCommercial-NoDerivatives 4.0 International License.
28
About ScientiaMobile
Disclaimer
• While ScientiaMobile, Inc. has used reasonable efforts accurately to prepare this report and the other data and information here (together the "Report") from data it and its affiliates have collected, this Report is made available to the public on an "AS IS" basis without warranty of any kind. SCIENTIAMOBILE, INC. AND ITS AFFILIATES MAKE NO REPRESENTATION AND DISCLAIM ALL EXPRESS, IMPLIED AND STATUTORY WARRANTIES OF ANY KIND TO ANY RECIPIENT OF THIS REPORT OR ANY OTHER THIRD PARTY, INCLUDING ANY WARRANTIES OF ACCURACY, TIMELINESS, COMPLETENESS, MERCHANTABILITY AND FITNESS FOR A PARTICULAR PURPOSE. The Report is limited to data collected from certain services offered by ScientiaMobile, Inc. and its affiliates – a self-selected sample pool that may not reflect the greater internet user community – and consequently no conclusion should be drawn from this Report regarding the internet user base as a whole. The entire risk as to the quality (or lack thereof), completeness and your use of this Report is with you, the user of the Report. In no event will ScientiaMobile, Inc. or its affiliates be liable for any direct, indirect, incidental, special, consequential, or other damages, including loss of profit, arising out of the use of this Report, even if advised of the possibility of such damages.
• Any excerpts to, or use of this Report to reach new conclusions and/or analysis, should indicate ScientiaMobile, Inc. as its source, but derived conclusions and analyses generated from these Reports should be clearly attributed solely to their author.