mr. abdillah ahsan - demographic institute - faculty of
TRANSCRIPT
Mr. Abdillah Ahsan - Demographic Institute - Faculty of Economics, University of Indonesia and SITT Indonesia CoordinatorMs. Titissari - Demographic Institute - Faculty of Economics, University of Indonesia Dr. Ulysses Dorotheo - SITT Project DirectorMs. Raphaella Prugsamatz - SITT Project CoordinatorMs. Jennie Lyn Reyes - SITT Project Coordinator
IndonesiaTaxReportCard.indd 1 6/17/10 11:18 PM
Indonesia Tobacco Tax Report Card, June 20102
So
uth
ea
st A
sia
In
itia
tive
on
To
ba
cc
o T
ax
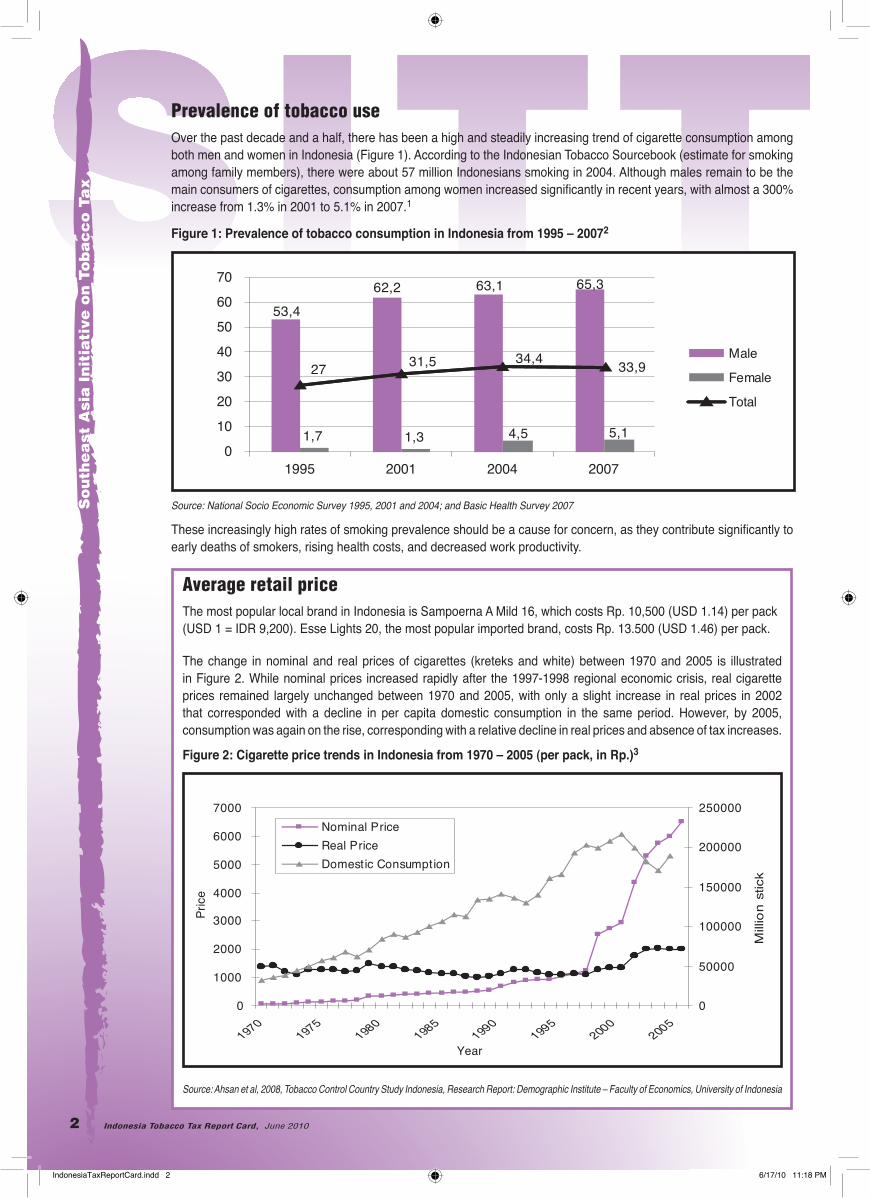
Prevalence of tobacco useOver the past decade and a half, there has been a high and steadily increasing trend of cigarette consumption among both men and women in Indonesia (Figure 1). According to the Indonesian Tobacco Sourcebook (estimate for smoking among family members), there were about 57 million Indonesians smoking in 2004. Although males remain to be the main consumers of cigarettes, consumption among women increased signifi cantly in recent years, with almost a 300% increase from 1.3% in 2001 to 5.1% in 2007.1
Figure 1: Prevalence of tobacco consumption in Indonesia from 1995 – 20072
Source: National Socio Economic Survey 1995, 2001 and 2004; and Basic Health Survey 2007
These increasingly high rates of smoking prevalence should be a cause for concern, as they contribute signifi cantly to early deaths of smokers, rising health costs, and decreased work productivity.
Average retail priceThe most popular local brand in Indonesia is Sampoerna A Mild 16, which costs Rp. 10,500 (USD 1.14) per pack (USD 1 = IDR 9,200). Esse Lights 20, the most popular imported brand, costs Rp. 13.500 (USD 1.46) per pack.
The change in nominal and real prices of cigarettes (kreteks and white) between 1970 and 2005 is illustrated in Figure 2. While nominal prices increased rapidly after the 1997-1998 regional economic crisis, real cigarette prices remained largely unchanged between 1970 and 2005, with only a slight increase in real prices in 2002 that corresponded with a decline in per capita domestic consumption in the same period. However, by 2005, consumption was again on the rise, corresponding with a relative decline in real prices and absence of tax increases.
Figure 2: Cigarette price trends in Indonesia from 1970 – 2005 (per pack, in Rp.)3
Source: Ahsan et al, 2008, Tobacco Control Country Study Indonesia, Research Report: Demographic Institute – Faculty of Economics, University of Indonesia
IndonesiaTaxReportCard.indd 2 6/17/10 11:18 PM
Indonesia Tobacco Tax Report Card, June 2010 3
So
uth
ea
st Asia
Initia
tive o
n To
ba
cc
o Ta
x
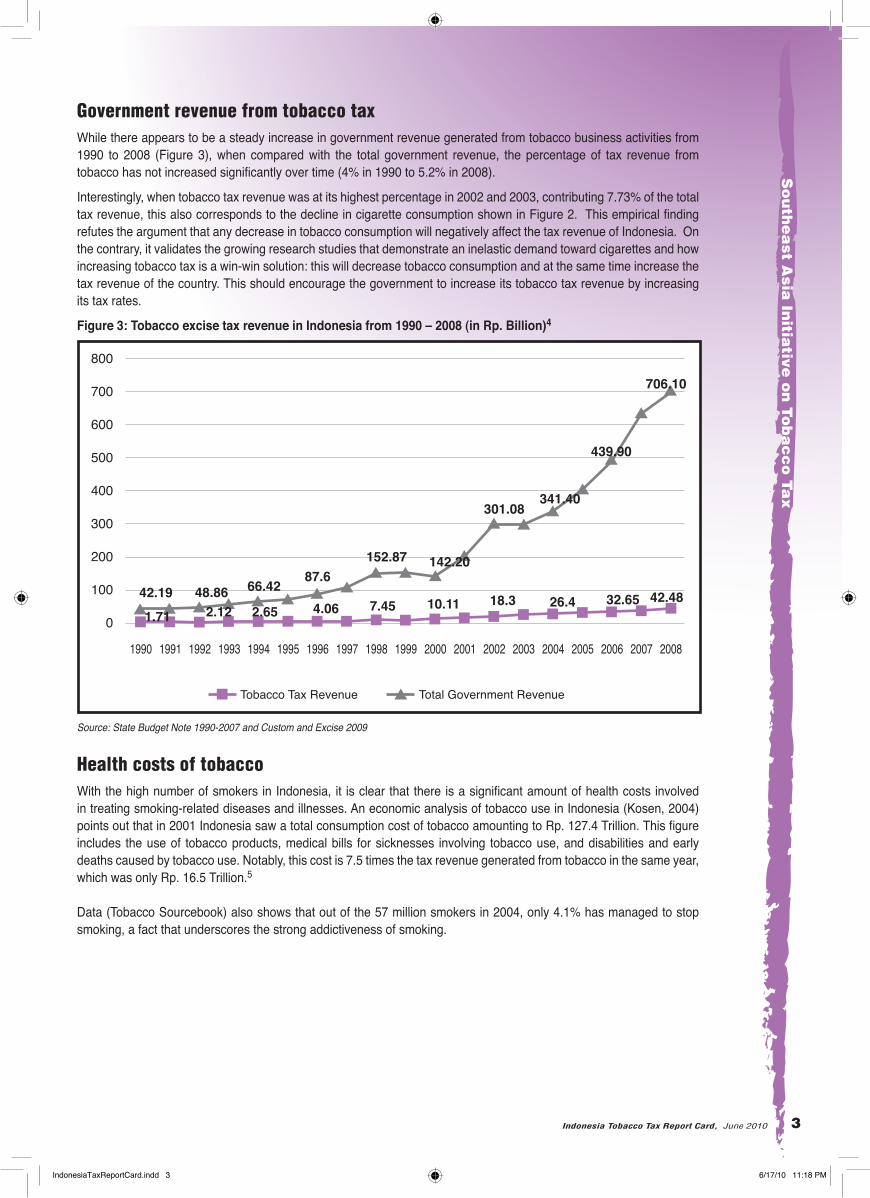
Government revenue from tobacco taxWhile there appears to be a steady increase in government revenue generated from tobacco business activities from 1990 to 2008 (Figure 3), when compared with the total government revenue, the percentage of tax revenue from tobacco has not increased signifi cantly over time (4% in 1990 to 5.2% in 2008).
Interestingly, when tobacco tax revenue was at its highest percentage in 2002 and 2003, contributing 7.73% of the total tax revenue, this also corresponds to the decline in cigarette consumption shown in Figure 2. This empirical fi nding refutes the argument that any decrease in tobacco consumption will negatively affect the tax revenue of Indonesia. On the contrary, it validates the growing research studies that demonstrate an inelastic demand toward cigarettes and how increasing tobacco tax is a win-win solution: this will decrease tobacco consumption and at the same time increase the tax revenue of the country. This should encourage the government to increase its tobacco tax revenue by increasing its tax rates.
Figure 3: Tobacco excise tax revenue in Indonesia from 1990 – 2008 (in Rp. Billion)4
Source: State Budget Note 1990-2007 and Custom and Excise 2009
Health costs of tobaccoWith the high number of smokers in Indonesia, it is clear that there is a signifi cant amount of health costs involved in treating smoking-related diseases and illnesses. An economic analysis of tobacco use in Indonesia (Kosen, 2004) points out that in 2001 Indonesia saw a total consumption cost of tobacco amounting to Rp. 127.4 Trillion. This fi gure includes the use of tobacco products, medical bills for sicknesses involving tobacco use, and disabilities and early deaths caused by tobacco use. Notably, this cost is 7.5 times the tax revenue generated from tobacco in the same year, which was only Rp. 16.5 Trillion.5
Data (Tobacco Sourcebook) also shows that out of the 57 million smokers in 2004, only 4.1% has managed to stop smoking, a fact that underscores the strong addictiveness of smoking.
IndonesiaTaxReportCard.indd 3 6/17/10 11:18 PM

Indonesia Tobacco Tax Report Card, June 20104
So
uth
ea
st A
sia
In
itia
tive
on
To
ba
cc
o T
ax
Description of the current tobacco tax systemTobacco taxes in Indonesia are subject to individual brands, so the amount of tax generated by tobacco will be linear to the number of brands that use it. The tax amount will also depend on the type of tobacco and the companies that produce tobacco products.
Through PMK No. 203/PMK 011/2008, the Treasury Secretary made signifi cant changes in taxes for tobacco products in Indonesia, some of which are summed up in Table 1 and detailed in Table 2.
Table 1 : Changes in the taxation system for tobacco products in Indonesia from 2008 – 20096
NO. MATERIAL 2008 2009
1 Tax tariff system Combination (ad valorem and specifi c) Specifi c
2 Specifi c tariff MMC, HC, WHC, FHC All HT
3 Categories of MMC and WMC Three classes Two classes
4 TIS categories Three classes No classes
5 WHC categories KLB & KLM HC
6 WFHC categories KLB & KLM WFHC
7 HT for employees and third party HJE = 50% HJE normal Nulled
8 Export tariff incentive Normal tariff minus 4% Nulled
Source : Customs Agency, 2009 *Note: Harga Jual Eceran (HJE) = retail price; HT / TC = Tobacco Commodity; KLB / KLM = hand-rolled clove cigarette using cornhusk leaf as wrapper; TIS = Tembakau Iris (sliced tobacco)
The changes include
• a shift from applying both ad valorem (percentage of the retail price per stick) and specifi c (specifi ed amount per stick) taxes to the application of only specifi c tax for all tobacco products;
• the simplifi cation of categories for Machine Made Clove Cigarette (MMC/SKM) and White Machine Made Cigarette (WMC/SPM) from three categories to two: category 1 for producers that produce more than 2 billion sticks per year and category 2 for those who produce less than 2 billion sticks per year.
• categorizing White Handmade Cigarette (WHC/SPT) in the same tax category with Handmade Clove Cigarette (HC/SKT);
• categorizing the White Filtered Handmade Cigarette (WFHC/SPTF) in the same tax category as the Filtered Handmade Clove Cigarette (FHC/SKTF); and
• the nullifi cation of export tariff incentives.
The new rules also introduced subcategories according to the retail price range of each category (three HJE range subcategories for all production categories except HC category 3, which has only one HJE range) so producers can choose which range to operate in.
On average cigarette excise tax has risen 15%, from 38% to 44% of HJE, with the highest increase (63%) in HC category 3 and the lowest increase (7%) for MMC and WMC category 1. The average total tax burden of cigarettes, including Value Added Tax (8.4%), is thus 52.4%.
While this policy was adopted to narrow the range of consolidated tax ranges, the HC/WHC category still has the lowest tax rates compared to MMC and WMC, showing that the government still favors small producers. This pattern probably exists as part of the government’s efforts to help small industries and their workers, but this reasoning is fl awed as most of the cigarette production and its tax revenue is generated by MMC category 1, and this “leveling of the playing fi eld” may actually be disadvantageous to small-scale producers. The widening tax cost for MMC, WMC and HC will also lessen the effectiveness of this policy to control cigarette consumption. Thus there is a need for further simplifi cation of the tobacco tax system today.
IndonesiaTaxReportCard.indd 4 6/17/10 11:18 PM
Indonesia Tobacco Tax Report Card, June 2010 5
So
uth
ea
st Asia
Initia
tive o
n To
ba
cc
o Ta
x
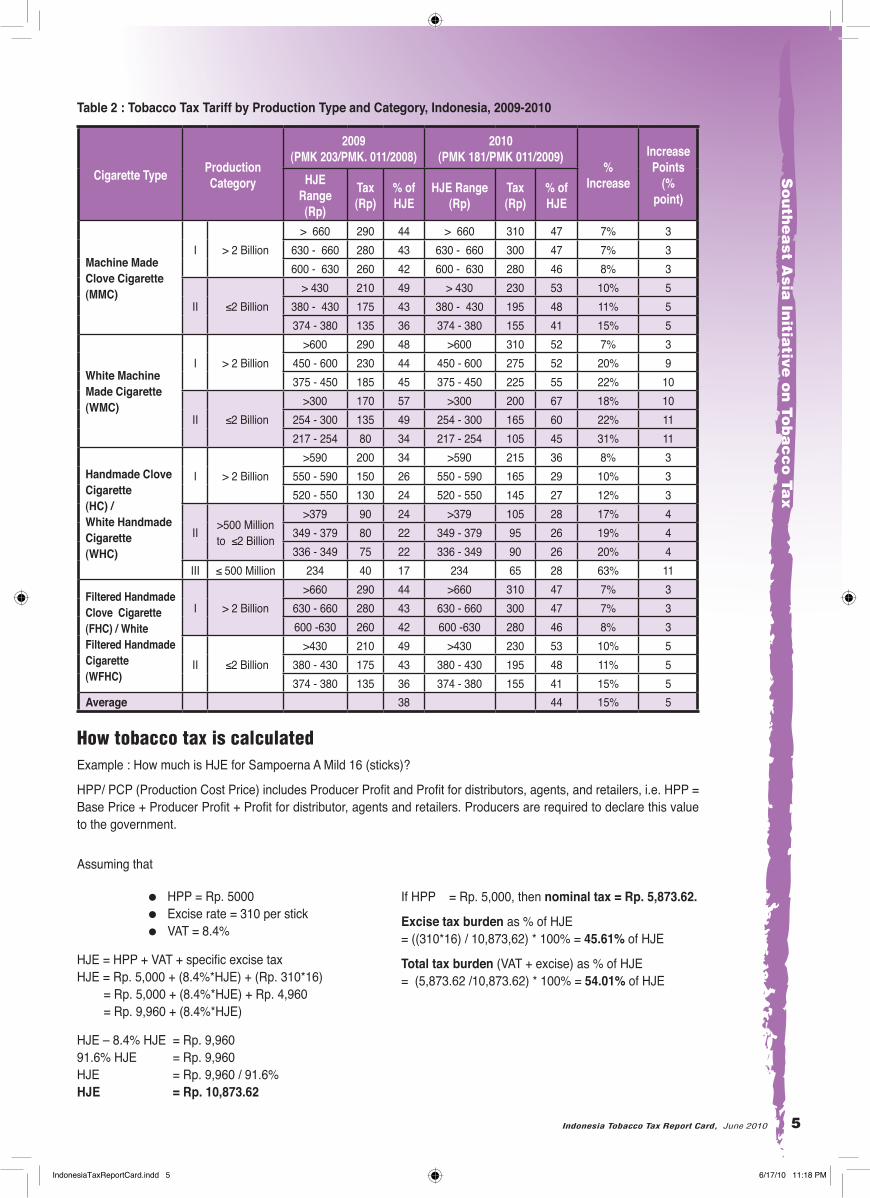
Table 2 : Tobacco Tax Tariff by Production Type and Category, Indonesia, 2009-2010
Cigarette Type Production Category
2009(PMK 203/PMK. 011/2008)
2010(PMK 181/PMK 011/2009)
%Increase
Increase Points
(% point)
HJE Range(Rp)
Tax(Rp)
% ofHJE
HJE Range(Rp)
Tax(Rp)
% ofHJE
Machine Made Clove Cigarette (MMC)
I > 2 Billion > 660 290 44 > 660 310 47 7% 3
630 - 660 280 43 630 - 660 300 47 7% 3600 - 630 260 42 600 - 630 280 46 8% 3
II ≤2 Billion> 430 210 49 > 430 230 53 10% 5
380 - 430 175 43 380 - 430 195 48 11% 5374 - 380 135 36 374 - 380 155 41 15% 5
White Machine Made Cigarette(WMC)
I > 2 Billion >600 290 48 >600 310 52 7% 3
450 - 600 230 44 450 - 600 275 52 20% 9375 - 450 185 45 375 - 450 225 55 22% 10
II ≤2 Billion >300 170 57 >300 200 67 18% 10
254 - 300 135 49 254 - 300 165 60 22% 11217 - 254 80 34 217 - 254 105 45 31% 11
Handmade Clove Cigarette (HC) /White Handmade Cigarette (WHC)
I > 2 Billion >590 200 34 >590 215 36 8% 3
550 - 590 150 26 550 - 590 165 29 10% 3520 - 550 130 24 520 - 550 145 27 12% 3
II >500 Million to ≤2 Billion
>379 90 24 >379 105 28 17% 4349 - 379 80 22 349 - 379 95 26 19% 4336 - 349 75 22 336 - 349 90 26 20% 4
III ≤ 500 Million 234 40 17 234 65 28 63% 11
Filtered Handmade Clove Cigarette(FHC) / White Filtered Handmade Cigarette(WFHC)
I > 2 Billion>660 290 44 >660 310 47 7% 3
630 - 660 280 43 630 - 660 300 47 7% 3600 -630 260 42 600 -630 280 46 8% 3
II ≤2 Billion>430 210 49 >430 230 53 10% 5
380 - 430 175 43 380 - 430 195 48 11% 5374 - 380 135 36 374 - 380 155 41 15% 5
Average 38 44 15% 5
How tobacco tax is calculated Example : How much is HJE for Sampoerna A Mild 16 (sticks)?
HPP/ PCP (Production Cost Price) includes Producer Profi t and Profi t for distributors, agents, and retailers, i.e. HPP = Base Price + Producer Profi t + Profi t for distributor, agents and retailers. Producers are required to declare this value to the government.
Assuming that
• HPP = Rp. 5000 • Excise rate = 310 per stick • VAT = 8.4%
HJE = HPP + VAT + specifi c excise tax HJE = Rp. 5,000 + (8.4%*HJE) + (Rp. 310*16) = Rp. 5,000 + (8.4%*HJE) + Rp. 4,960 = Rp. 9,960 + (8.4%*HJE)
HJE – 8.4% HJE = Rp. 9,96091.6% HJE = Rp. 9,960HJE = Rp. 9,960 / 91.6%HJE = Rp. 10,873.62
If HPP = Rp. 5,000, then nominal tax = Rp. 5,873.62.
Excise tax burden as % of HJE = ((310*16) / 10,873,62) * 100% = 45.61% of HJE
Total tax burden (VAT + excise) as % of HJE = (5,873.62 /10,873.62) * 100% = 54.01% of HJE
IndonesiaTaxReportCard.indd 5 6/17/10 11:18 PM
Indonesia Tobacco Tax Report Card, June 20106
So
uth
ea
st A
sia
In
itia
tive
on
To
ba
cc
o T
ax
Description of the process for tobacco tax to be imposed and increasedState revenue target from tobacco excise MOF estimate using recent excise rate à increase and/or simplify tobacco excise to reach the target all have to syncronize with Tobacco Excise Roadmap based on the Tobacco Industry Roadmap
Early in 2007, the Government of Indonesia led by the Ministry of Industry released “The Roadmap of Tobacco Products Industry and Excise Policy”, whose three aims are listed in Table 3.
Table 3 : Government timetable based on the Tobacco Industry Roadmap
No. Period Priority Target
1. 2007-2010 Priority on employment, government revenue and health
2. 2010-2015 Priority on government revenue, health and employment
3. 2015-2020 Priority on health, employment and government revenue
It is proposed to achieve these targets by increasing cigarette production to only 260 billion sticks by 2020. The plan is supported by the Ministry of Manpower and Transmigration, the Ministry of Agriculture, and the cigarette manufacturers associations (GAPPRI and GAPRINDO).
While the government states that this roadmap is in line with the philosophy of implementing excise tax to reduce consumption and promote healthy communities, this plan is fl awed in several ways.
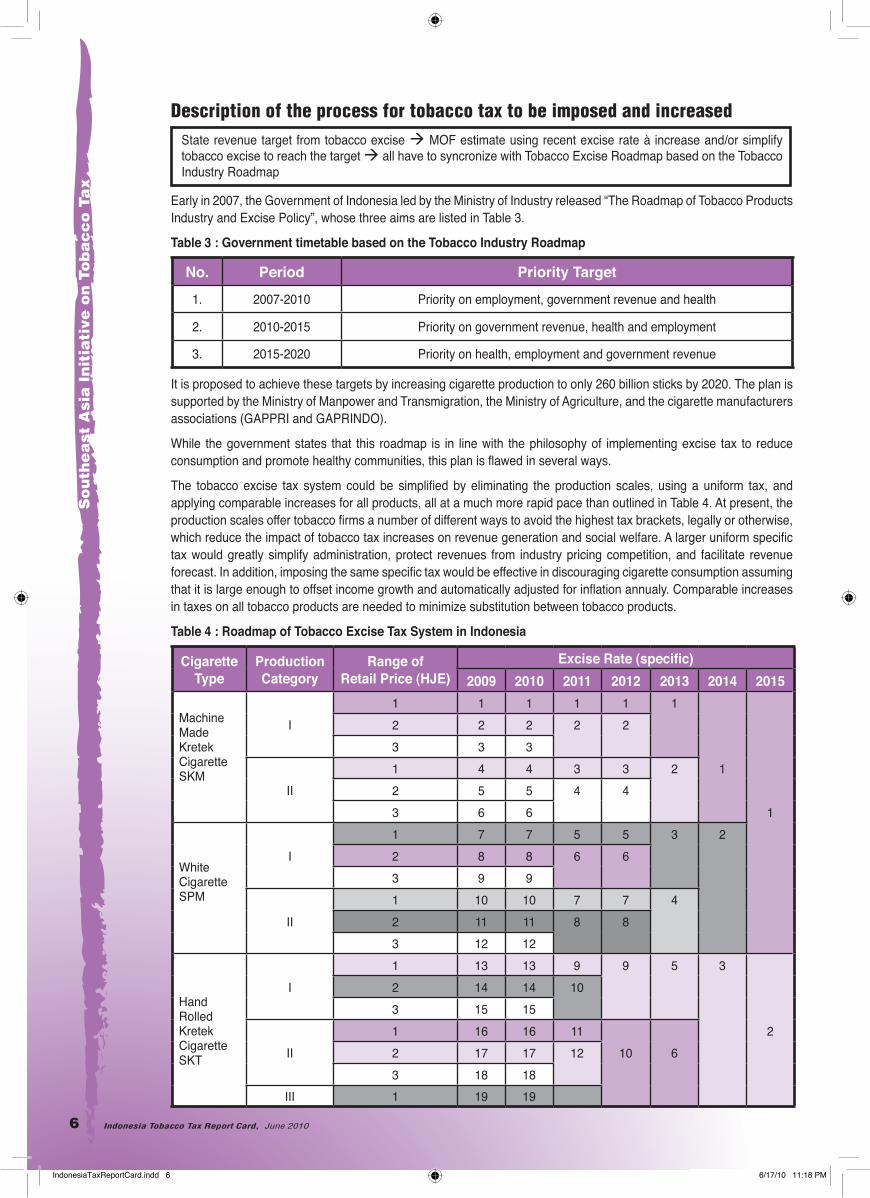
The tobacco excise tax system could be simplifi ed by eliminating the production scales, using a uniform tax, and applying comparable increases for all products, all at a much more rapid pace than outlined in Table 4. At present, the production scales offer tobacco fi rms a number of different ways to avoid the highest tax brackets, legally or otherwise, which reduce the impact of tobacco tax increases on revenue generation and social welfare. A larger uniform specifi c tax would greatly simplify administration, protect revenues from industry pricing competition, and facilitate revenue forecast. In addition, imposing the same specifi c tax would be effective in discouraging cigarette consumption assuming that it is large enough to offset income growth and automatically adjusted for infl ation annualy. Comparable increases in taxes on all tobacco products are needed to minimize substitution between tobacco products.
Table 4 : Roadmap of Tobacco Excise Tax System in Indonesia
Cigarette Type
ProductionCategory
Range ofRetail Price (HJE)
Excise Rate (specifi c)2009 2010 2011 2012 2013 2014 2015
Machine Made Kretek Cigarette SKM
I1 1 1 1 1 12 2 2 2 23 3 3
II1 4 4 3 3 2 12 5 5 4 4
3 6 6 1
White Cigarette SPM
I1 7 7 5 5 3 22 8 8 6 63 9 9
II1 10 10 7 7 42 11 11 8 83 12 12
Hand Rolled Kretek Cigarette SKT
I1 13 13 9 9 5 32 14 14 103 15 15
II1 16 16 11 22 17 17 12 10 63 18 18
III 1 19 19
IndonesiaTaxReportCard.indd 6 6/17/10 11:18 PM
Indonesia Tobacco Tax Report Card, June 2010 7
So
uth
ea
st Asia
Initia
tive o
n To
ba
cc
o Ta
x
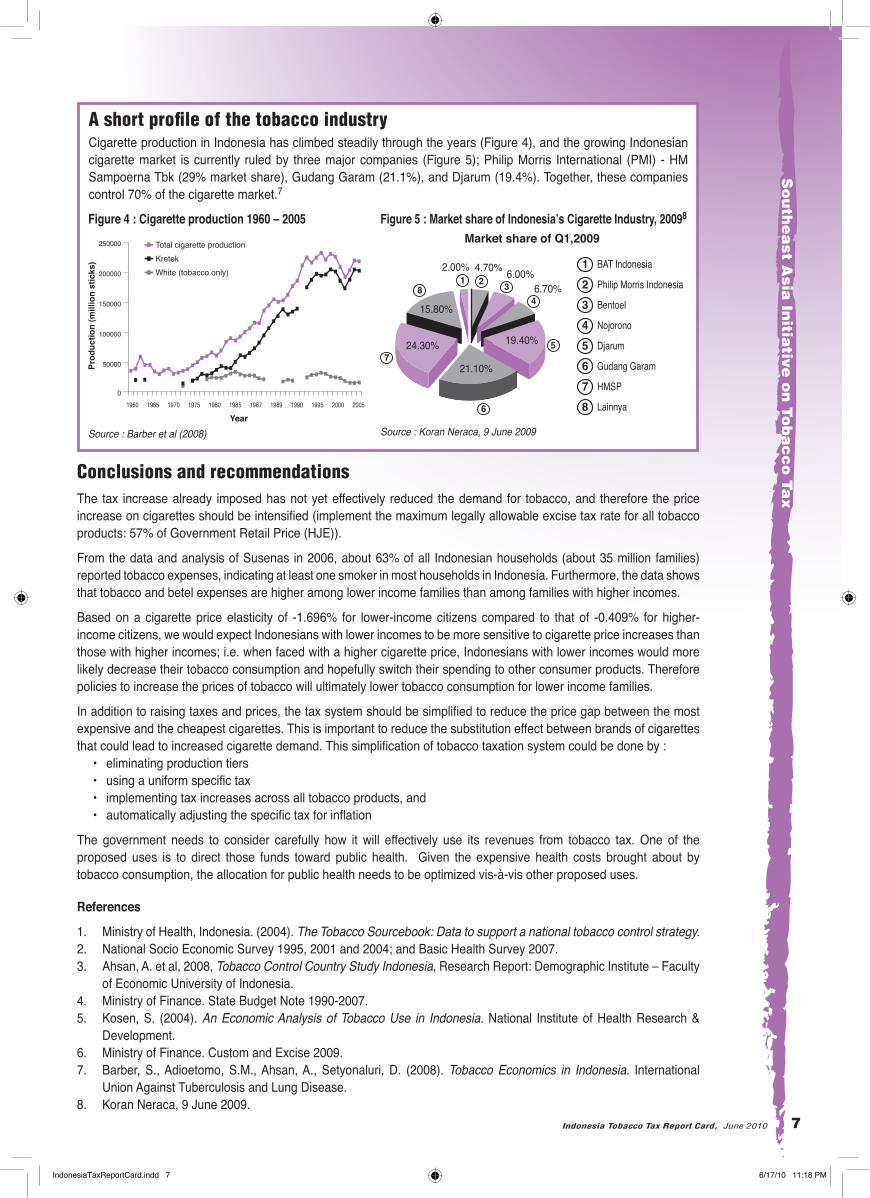
A short profi le of the tobacco industryCigarette production in Indonesia has climbed steadily through the years (Figure 4), and the growing Indonesian cigarette market is currently ruled by three major companies (Figure 5); Philip Morris International (PMI) - HM Sampoerna Tbk (29% market share), Gudang Garam (21.1%), and Djarum (19.4%). Together, these companies control 70% of the cigarette market.7
Figure 4 : Cigarette production 1960 – 2005
Source : Barber et al (2008)
Figure 5 : Market share of Indonesia’s Cigarette Industry, 20098
Source : Koran Neraca, 9 June 2009
Conclusions and recommendationsThe tax increase already imposed has not yet effectively reduced the demand for tobacco, and therefore the price increase on cigarettes should be intensifi ed (implement the maximum legally allowable excise tax rate for all tobacco products: 57% of Government Retail Price (HJE)).
From the data and analysis of Susenas in 2006, about 63% of all Indonesian households (about 35 million families) reported tobacco expenses, indicating at least one smoker in most households in Indonesia. Furthermore, the data shows that tobacco and betel expenses are higher among lower income families than among families with higher incomes.
Based on a cigarette price elasticity of -1.696% for lower-income citizens compared to that of -0.409% for higher-income citizens, we would expect Indonesians with lower incomes to be more sensitive to cigarette price increases than those with higher incomes; i.e. when faced with a higher cigarette price, Indonesians with lower incomes would more likely decrease their tobacco consumption and hopefully switch their spending to other consumer products. Therefore policies to increase the prices of tobacco will ultimately lower tobacco consumption for lower income families.
In addition to raising taxes and prices, the tax system should be simplifi ed to reduce the price gap between the most expensive and the cheapest cigarettes. This is important to reduce the substitution effect between brands of cigarettes that could lead to increased cigarette demand. This simplifi cation of tobacco taxation system could be done by : • eliminating production tiers • using a uniform specifi c tax • implementing tax increases across all tobacco products, and • automatically adjusting the specifi c tax for infl ation
The government needs to consider carefully how it will effectively use its revenues from tobacco tax. One of the proposed uses is to direct those funds toward public health. Given the expensive health costs brought about by tobacco consumption, the allocation for public health needs to be optimized vis-à-vis other proposed uses.
References
1. Ministry of Health, Indonesia. (2004). The Tobacco Sourcebook: Data to support a national tobacco control strategy. 2. National Socio Economic Survey 1995, 2001 and 2004; and Basic Health Survey 2007.3. Ahsan, A. et al, 2008, Tobacco Control Country Study Indonesia, Research Report: Demographic Institute – Faculty
of Economic University of Indonesia.4. Ministry of Finance. State Budget Note 1990-2007.5. Kosen, S. (2004). An Economic Analysis of Tobacco Use in Indonesia. National Institute of Health Research &
Development.6. Ministry of Finance. Custom and Excise 2009.7. Barber, S., Adioetomo, S.M., Ahsan, A., Setyonaluri, D. (2008). Tobacco Economics in Indonesia. International
Union Against Tuberculosis and Lung Disease.8. Koran Neraca, 9 June 2009.
IndonesiaTaxReportCard.indd 7 6/17/10 11:18 PM
The Southeast Asia Initiative on Tobacco Tax (SITT) is SEATCA’s project to institute effective tax increases and to allow for sustainable funding mechanisms for tobacco control in Indonesia, Cambodia, Lao PDR, Philippines and Vietnam, in line with Article 6 of the WHO Framework Convention on Tobacco Control.
IndonesiaTaxReportCard.indd 8 6/17/10 11:18 PM