mr. aurangzeb firoz mr. kashif-ul-hassan shah mr. muhammad...
TRANSCRIPT


AT-TAHUR LIMITED
COMPANY’S INFORMATION Board of Directors Mr. Ijaz Nisar (Chairman) Mr. Rasikh Elahi (Chief Executive Officer) Mr. Amar Zafar Khan Mr. Aurangzeb Firoz Mr. Kashif-ul-Hassan Shah Mr. Muhammad Ijaz Hussain Awan Mr. Shabbi Zahid Ali Company Secretary & Chief Financial Officer Humza Chaudhry Audit Committee Mr. Aurangzeb Firoz (Chairman) Mr. Amar Zafar Khan (Member) Mr. Shabbi Zahid Ali (Member) Human Resource & Remuneration Committee Mr. Ijaz Nisar (Chairman) Mr. Rasikh Elahi (Member) Mr. Shabbi Zahid Ali (Member) Share Registrar Corplink (Pvt.) Ltd. Wings Arcade, 1- K Commercial, Model Town, Lahore Auditors Riaz Ahmad & Company Chartered Accountants
Project Locations Kotli Rai Abubakar, District Kasur
Bank Islami Pakistan Limited
Bankers MCB Islamic Bank Limited Allied Bank Limited Silk Bank Limited Al -Baraka Bank (Pakistan) Limited Meezan Bank Limited Dubai Islamic Bank Pakistan Limited National Bank of Pakistan
Registered Office 182 Abu Bakar Block,
New Garden Town, Lahore Ph: +92-42- 111 666 647
Fax: +92-423-5845525 Email: [email protected] Web: www.at-tahur.com

AT-TAHUR LIMITED
DIRECTORS’ REPORT
The Directors of At-Tahur Limited are pleased to present the un-audited accounts of the Company for the
half year ended December 31, 2018.
The Companies revenue grew by 26% for the period despite difficult economic conditions. The Company
managed to record an increase of 95% in its operating profit margin despite higher input and energy cost and foreign currency devaluation which collectively increase raw material prices.
The financial performances for half year ended 31 December 2018 is summarized below:
PKR Million 31 December
2018
31 December
2017
Change (YOY)
Revenue 704.44 560.04 26%
Gross Profit margin 379.88 265.85 43%
% of sales 53.9% 47.5%
Operating Profit margin 116.78 59.87 95%
% of sales 16.6% 10.7%
Net Profit before tax 103.32 55.05 88%
% of sales 14.7% 9.8%
Net Profit after tax 125.66 80.04 57%
% of sales 17.8% 14.3%
Basic Earnings per share 0.88 0.73 21%
Sales:
The sales revenue grew by PKR 144.40 million, yielded a growth of 26% largely driven by volume, launch
of new products and penetration into new markets like Multan and Sargodha.
Gross Profit: Gross margin reported for the six months was 53.9%. The major reasons behind the increase were increase
in sales, increase in per cow milk yield and forex devaluation resulting in increase in gains arising from changes in fair value less costs to sell of dairy livestock.
Operating Profit: Operating profit reported for six months was 16.6%. The increase is mainly resulted from increase in gross
profit.
Net Profit after tax:
Net profit after tax increased by 57% mainly due to deferred tax asset and gross profit.
Future Outlook: Despite the uncertainties in the economy, the Company remains focused on meeting customer needs
through portfolio innovation and optimization of value chain / supply chain to ensure sustainable profitable
growth. The Company is working on new value-added products along with untapped market region.
We are grateful to our customers for their continued patronage of our products and which to acknowledge the efforts of the entire At-Tahur Team, including our staff, vendors, dealers and all business partners for
their untiring efforts in these challenging times and look forward to their continued support.
__________________ _________________
Rasikh Elahi Shabbi Zahid Ali Chief Executive Director
February 25,2019

AT-TAHUR LIMITEDڈائریکٹرز رپورٹ
کے لئے کمپنی کے غیر آڈٹ شده اکاؤنٹس کو ے آدھے سال کو ختم ہونے وال2018، 31دسمبرور لمیٹڈ کے ڈائریکٹرزہم الطہ.پیش کرتے ہیں
کمپنی نے اپنے آپریٹنگ منافع مارجن میں . فیصد تک اضافہ ہوا ہے26مشکل معاشی حاالت کے باوجود کمپنی کی آمدنی میں فیصد اضافہ ریکارڈ کیا ہے۔ یہ اضافہ زیاده کاروباری الگت ، توانائی کے اخراجات میں اضافے، ملکی کرنسی کی ویلیو میں کمی 95
کی وجہ سے خام مال کی قیمت میں اضافے کے باوجود ہوا ہے۔
:لئے مالیاتی کارکردگی ذیل میں دی گئی ہےکےے آدھے سال ونے والکو ختم ہ2018، 31دسمبر
)YOY(تبدیلی 2017دسمبر201831دسمبر31ملین روپے
آمدنیمجموعی منافع مارجن
فروخت کا فیصدآپریٹنگ منافع مارجن
فروخت کا فیصدٹیکس سے پہلے خالص منافع
فروخت کا فیصدٹیکس کے بعد خالص منافع
فیصدفروخت کافی شیئر بنیادی آمدنی
704.44379.8853.9%116.7816.6%103.3214.7%125.6617.8%0.88
560.04265.8547.5%59.87
10.71%55.059.8%80.0414.3%0.79
26%43%
95%
88%
57%
21%
سیلز
فیصد رہی جو کہ کاروبار کے حجم میں نئی مصنوعات کے 26ملین روپے اضافہ ہوا، مجموعی بڑھوتری144.40سیلز آمدنی میںوجہ سے ہوئی۔ ملتان اور سرگودھا میں سیل کیآغاز اور
مجموعی منافع
افہ اور غیر جس کی وجہ سیل میں اضافہ ، گائے کی دودھ کی پیداوار میں اض. فیصد رہا53.3تین مہینوں کا مجموعی منافع ے پیدا ہونے والی آمدنی میں اضافہ رہا۔میں تبدیلی ستملکی کرنسی کی قیم
:آپریٹنگ منافع
.جس کی وجہ مجموعی منافع میں اضافہ ہے. فیصد رہا16.6تین ماه کا آپریٹنگ منافع
ٹیکس کے بعد خالص منافع
۔ جس کی بنیادی وجہ ڈیفرڈ ٹیکس اثاثہ جات ہیں۔افیصد رہ57اضافہخالص منافع میں
مستقبل پر نظر
/ معاشی حاالت کے باوجود کمپنی پائیدار منافع بخش ترقی کو یقینی بنانے کے لئے پورٹ فولیو اور قیمت منسلک غیر یقینی کمپنی نئی مصنوعات اور نئے عالقوں . سپالئی سلسلہ کے ذریعے کسٹمر کی ضروریات کو پورا کرنے پر توجہ مرکوز کر رہی ہے
کر رہی ہے۔میں مارکیٹنگ کے ذریعے اپنی آمدن بڑھانے پر کام
ہم اپنے گاہکوں کے شکر گزاروں ہیں کہ وه ہماری مصنوعات کا استعمال جاری رکھے ہوئے ہے، اور ہم پوری الطہور ٹیم کی کوششوں کو تسلیم کرتے ہیں، بشمول ہمارے عملے، وینڈرز، ڈیلرز اور تمام کاروباری شراکت داروں کی مسلسل حمایت اور
ار ہیں اور مستقبل میں اسی طرح کے تعاون کی امید کرتے ہیں۔انتہائی کوششوں کے لئے شکر گز
بورڈ آف ڈائریکٹرز کی جانب سے
__________________ _________________راسخ الہیشبیہ زاہد علی
چیف ایگزیکیٹو ڈائریکٹر


AT-TAHUR LIMITED
Un-audited Audited Un-audited Audited
31 December 2018 30 June 2018 31 December 2018 30 June 2018
NOTE Rupees Rupees NOTE Rupees Rupees
EQUITY AND LIABILITIES ASSETS
SHARE CAPITAL AND RESERVES NON-CURRENT ASSETS
Property, plant and equipment 6 963,809,260 860,853,461
Authorized share capital Biological assets 7 846,404,559 682,411,604
150,000,000 (30 June 2018: 150,000,000) ordinary Long term security deposits 14,050,035 7,908,635 shares of Rupees 10 each 1,500,000,000 1,500,000,000 Deferred income tax asset 8 115,266,443 91,432,523
1,939,530,297 1,642,606,223
Issued, subscribed and paid-up share capital
146,667,000 (30 June 2018: 110,000,000) ordinary
shares of Rupees 10 each 1,466,670,000 1,100,000,000
Reserves 800,878,166 331,663,877
Total equity 2,267,548,166 1,431,663,877
CURRENT ASSETS
Share deposit money - 419,199,666 Stores 3,868,865 3,010,987
Inventories 100,695,579 84,734,314
LIABILITIES Biological assets 7 662,785 1,238,766
Trade debts 70,109,094 74,527,057
NON-CURRENT LIABILITIES Short term advances and other receivables 69,729,792 75,736,942
Short term security deposits 3,356,129 8,678,559
Employees' retirement benefit 33,994,645 28,077,763 Short term prepayment 1,041,383 926,556
Liabilities against assets subject to finance lease 35,010,558 21,309,695 Advance income tax 72,210,533 71,343,806
Long term financing 4 44,464,092 180,207,375 Sales tax recoverable 66,098,770 68,980,268
113,469,295 229,594,833 Cash and bank balances 384,620,008 464,915,451
CURRENT LIABILITIES 772,392,938 854,092,706
Trade and other payables 122,270,212 161,197,949 Short term borrowings 150,000,000 127,547,806
Accrued mark-up 1,534,313 4,927,831 Current portion of non-current liabilities 54,516,566 110,308,136
Provision for taxation 2,584,683 12,258,831
330,905,774 416,240,553
Total liabilities 444,375,069 645,835,386
CONTINGENCIES AND COMMITMENTS 5
TOTAL EQUITY AND LIABILITIES 2,711,923,235 2,496,698,929 TOTAL ASSETS 2,711,923,235 2,496,698,929
The annexed notes form an integral part of these condensed interim financial statements.
___________________
CHIEF EXECUTIVE
CONDENSED INTERIM STATEMENT OF FINANCIAL POSITION AS AT 31 DECEMBER 2018
______________ ___________________________
DIRECTOR CHIEF FINANCIAL OFFICER

AT-TAHUR LIMITED
NOTE
31 December
2018
31 December
2017
31 December
2018
31 December
2017
Rupees Rupees Rupees Rupees
SALES 704,440,188 560,038,118 365,903,585 280,753,448
GAIN ARISING ON INITIAL RECOGNITION OF
MILK AT FAIR VALUE LESS COSTS TO SELL AT
THE TIME OF MILKING359,602,492 215,343,040 184,315,547 120,138,678
GAINS ARISING FROM CHANGES IN FAIR
VALUE LESS COSTS TO SELL OF DAIRY
LIVESTOCK 7 212,834,875 110,345,038 136,013,504 67,165,821
1,276,877,555 885,726,196 686,232,636 468,057,947
OPERATING COSTS 9 (897,000,042) (619,874,623) (488,772,003) (335,473,773)
379,877,513 265,851,573 197,460,633 132,584,174
ADMINISTRATIVE AND GENERAL EXPENSES (78,285,529) (48,141,192) (39,006,333) (23,145,749)
SELLING AND MARKETING EXPENSES (109,542,033) (92,029,143) (54,642,649) (47,154,529)
OTHER EXPENSES (86,521,563) (70,875,317) (46,348,055) (35,664,348)
(274,349,125) (211,045,652) (139,997,037) (105,964,626)
105,528,388 54,805,921 57,463,596 26,619,548
OTHER INCOME 11,252,583 5,064,469 5,026,244 2,301,773
PROFIT FROM OPERATIONS 116,780,971 59,870,390 62,489,840 28,921,321
FINANCE COST (13,455,580) (4,821,912) (2,280,716) (2,786,061)
PROFIT BEFORE TAXATION 103,325,391 55,048,478 60,209,124 26,135,260
TAXATION 22,337,056 24,989,334 26,617,118 (133,726)
PROFIT AFTER TAXATION 125,662,447 80,037,812 86,826,242 26,001,534
EARNINGS PER SHARE - BASIC AND DILUTED 0.88 0.73 0.59 0.24
The annexed notes form an integral part of these condensed interim financial statements.
CHIEF EXECUTIVE DIRECTOR CHIEF FINANCIAL OFFICER
CONDENSED INTERIM STATEMENT OF PROFIT OR LOSS (UN-AUDITED)
FOR THE HALF YEAR ENDED 31 DECEMBER 2018
HALF YEAR ENDED QUARTER ENDED
___________________ _____________ __________________________
AT-TAHUR LIMITED
31 December
2018
31 December
2017
31 December
2018
31 December
2017Rupees Rupees Rupees Rupees
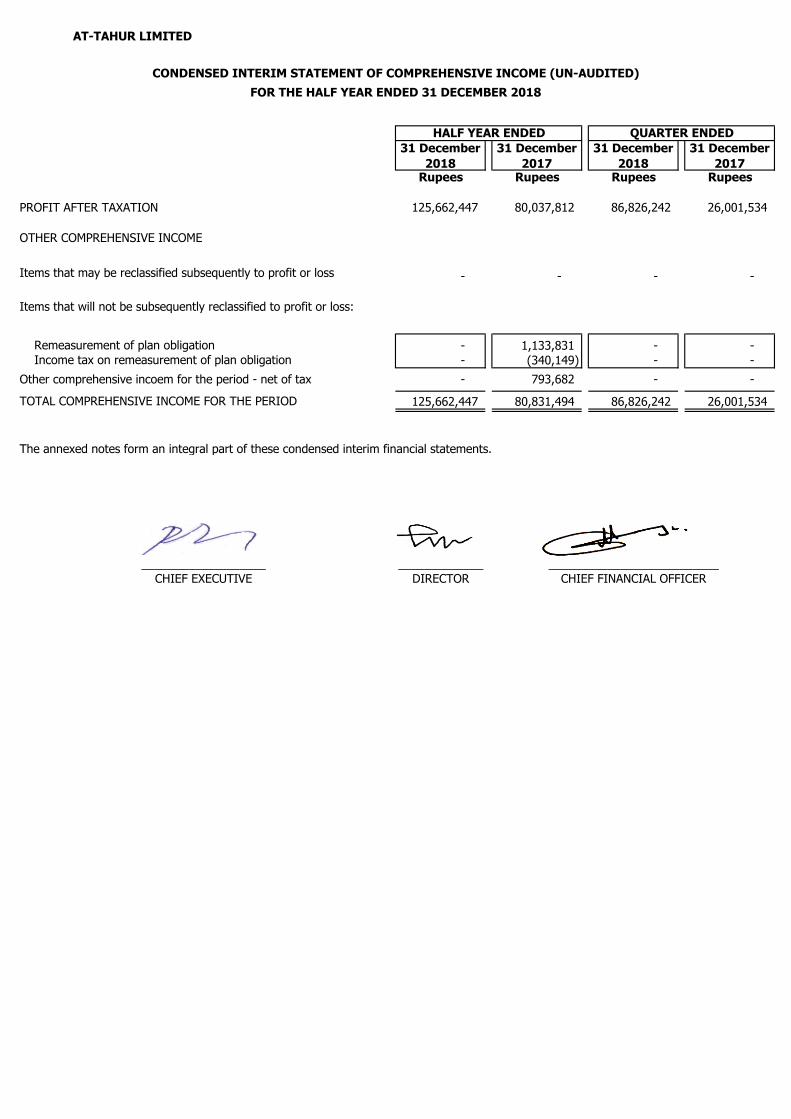
PROFIT AFTER TAXATION 125,662,447 80,037,812 86,826,242 26,001,534
OTHER COMPREHENSIVE INCOME
Items that may be reclassified subsequently to profit or loss - - - -
Items that will not be subsequently reclassified to profit or loss:
Remeasurement of plan obligation - 1,133,831 - - Income tax on remeasurement of plan obligation - (340,149) - -
Other comprehensive incoem for the period - net of tax - 793,682 - -
TOTAL COMPREHENSIVE INCOME FOR THE PERIOD 125,662,447 80,831,494 86,826,242 26,001,534
___________________
CHIEF EXECUTIVE
_____________ __________________________
DIRECTOR CHIEF FINANCIAL OFFICER
CONDENSED INTERIM STATEMENT OF COMPREHENSIVE INCOME (UN-AUDITED)
FOR THE HALF YEAR ENDED 31 DECEMBER 2018
HALF YEAR ENDED QUARTER ENDED
The annexed notes form an integral part of these condensed interim financial statements.
AT-TAHUR LIMITED
CAPITAL REVENUE
Share premiumUn-appropriated
profit
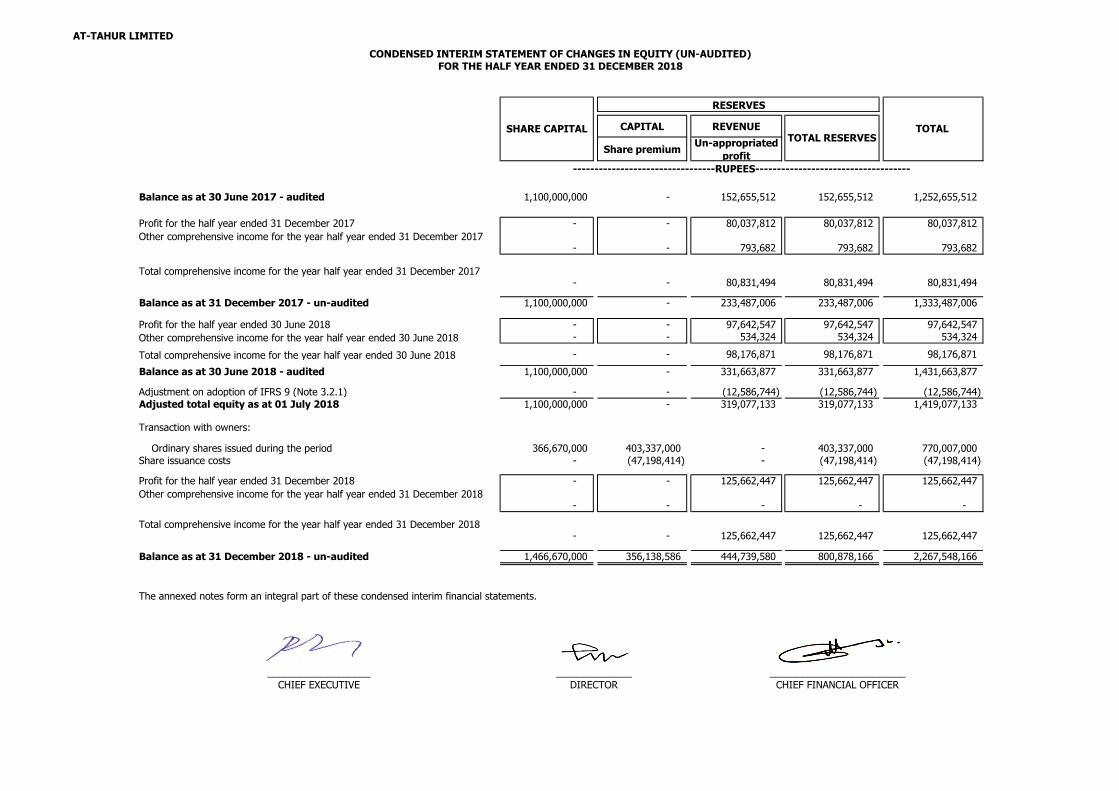
Balance as at 30 June 2017 - audited 1,100,000,000 - 152,655,512 152,655,512 1,252,655,512
Profit for the half year ended 31 December 2017 - - 80,037,812 80,037,812 80,037,812
Other comprehensive income for the year half year ended 31 December 2017- - 793,682 793,682 793,682
Total comprehensive income for the year half year ended 31 December 2017- - 80,831,494 80,831,494 80,831,494
Balance as at 31 December 2017 - un-audited 1,100,000,000 - 233,487,006 233,487,006 1,333,487,006
Profit for the half year ended 30 June 2018 - - 97,642,547 97,642,547 97,642,547
Other comprehensive income for the year half year ended 30 June 2018 - - 534,324 534,324 534,324
Total comprehensive income for the year half year ended 30 June 2018 - - 98,176,871 98,176,871 98,176,871
Balance as at 30 June 2018 - audited 1,100,000,000 - 331,663,877 331,663,877 1,431,663,877
Adjustment on adoption of IFRS 9 (Note 3.2.1) - - (12,586,744) (12,586,744) (12,586,744)
Adjusted total equity as at 01 July 2018 1,100,000,000 - 319,077,133 319,077,133 1,419,077,133
Transaction with owners:
Ordinary shares issued during the period 366,670,000 403,337,000 - 403,337,000 770,007,000
Share issuance costs - (47,198,414) - (47,198,414) (47,198,414)
Profit for the half year ended 31 December 2018 - - 125,662,447 125,662,447 125,662,447
Other comprehensive income for the year half year ended 31 December 2018- - - - -
Total comprehensive income for the year half year ended 31 December 2018- - 125,662,447 125,662,447 125,662,447
Balance as at 31 December 2018 - un-audited 1,466,670,000 356,138,586 444,739,580 800,878,166 2,267,548,166
___________________
CHIEF EXECUTIVE
CONDENSED INTERIM STATEMENT OF CHANGES IN EQUITY (UN-AUDITED)
FOR THE HALF YEAR ENDED 31 DECEMBER 2018
______________ _________________________
DIRECTOR CHIEF FINANCIAL OFFICER
SHARE CAPITAL
RESERVES
TOTAL TOTAL RESERVES
---------------------------------RUPEES------------------------------------
The annexed notes form an integral part of these condensed interim financial statements.

AT-TAHUR LIMITED
31 December
2018 31 December 2017
Rupees Rupees
CASH FLOWS FROM OPERATING ACTIVITIES
Profit before taxation 103,325,391 55,048,478
Adjustments for non-cash charges and other items:
Depreciation 29,878,175 18,524,375
Loss / (gain) on sale of operating fixed assets 1,034,272 (666,478)
(212,834,875) (110,345,038) Loss on sale of dairy livestock - net 36,844,681 37,900,229 Loss due to death of dairy livestock 38,675,449 30,057,241
Profit on bank deposits (6,772,573) (12,097) Provision for doubtful trade debts 4,800,891 -
Provision for employees' retirement benefit 5,916,882 5,568,794
Amortization of deferred income - (2,903,028)
Finance cost 13,455,580 4,821,912
Cash generated from operating activities before working capital changes 14,323,873 37,994,388
(Increase) / decrease in current assets:
Inventories (15,961,265) 11,690,834
Stores (857,878) 313,463
Trade debts (12,969,672) (6,254,328)
Short term advances and other receivables 6,007,150 (23,349,458)
Short term prepayment (114,827) (359,754)
Sales tax recoverable 2,881,498 (3,268,656)
Increase in current liabilities:
Trade and other payables (38,927,737) (15,073,064)
(59,942,731) (36,300,963)
Cash (used in) / generated from operations (45,618,858) 1,693,425
Finance cost paid (16,849,098) (4,133,446)
Income tax paid (12,037,739) (12,720,285)
Net (increase) / decrease in security deposits (818,970) 304,800
Net cash used in operating activities (75,324,665) (14,855,506)
CASH FLOWS FROM INVESTING ACTIVITIES
Capital expenditure on property, plant and equipment (152,868,246) (84,846,630)
Purchase of dairy livestock (36,885,000) -
Proceeds from sale of property, plant and equipment 19,000,000 1,215,000
Proceeds from sale of dairy livestock 10,782,771 21,648,530
Return on bank deposits 6,772,573 12,097
Net cash used in investing activities (153,197,902) (61,971,003)
CASH FLOWS FROM FINANCING ACTIVITIES
Short term borrowings - net 22,452,194 (12,162,434)
Liabilities against assets subject to finance lease 12,824,010 (9,463,642)
Long term financing obtained - 59,000,000
Repayment of long term financing (190,658,000) -
Proceeds from issue of ordinary shares - net of share issuance costs 303,608,920 -
Net cash from financing activities 148,227,124 37,373,924
Net decrease in cash and cash equivalents (80,295,443) (39,452,585)
Cash and cash equivalents at the beginning of the period 464,915,451 65,391,323
Cash and cash equivalents at the end of the period 384,620,008 25,938,738
The annexed notes form an integral part of these condensed interim financial statements.
_____________________ ______________
CHIEF EXECUTIVE DIRECTOR
____________________________
CHIEF FINANCIAL OFFICER
CONDENSED INTERIM STATEMENT OF CASH FLOWS (UN-AUDITED)
FOR THE HALF YEAR ENDED 31 DECEMBER 2018
HALF YEAR ENDED
Gains arising from changes in fair value less costs to sell of dairy livestock

AT-TAHUR LIMITED
1 THE COMPANY AND ITS OPERATIONS
1.1
1.2
2. BASIS OF PREPARATION
2.1
2.2
3 ACCOUNTING POLICIES
3.1 CRITICAL ACCOUNTING ESTIMATES AND JUDGEMENTS
The Company had issued prospectus on 13 June 2018 for Initial Public Offer (IPO) of 36,667,000 ordinary shares of Rupees
10 each at a floor price of Rupees 20 per share including share premium of Rupees 10 per share. Details regarding utilization
of IPO proceeds for dairy farm and plant expansion have been fully explained in the prospectus. Out of the total issue of
36,667,000 ordinary shares, 27,500,000 shares were offered to High Net Worth Individuals (HNWI) and Institutional
Investors before 30 June 2018 which were fully subscribed at a strike price of Rupees 21 per share determined through book
building process. Remaining 9,167,000 ordinary shares were offered to General Public and were fully subscribed at Rupees
21 per share during the period. On 18 July 2018, shares have been duly allotted to all shareholders. On 23 July 2018,
Pakistan Stock Exchange Limited has approved the Company’s application for formal listing of ordinary shares and trading of
shares has started on 30 July 2018.
SELECTED NOTES TO THE CONDENSED INTERIM FINANCIAL STATEMENTS (UN-AUDITED)
FOR THE HALF YEAR ENDED 31 DECEMBER 2018
At-Tahur Limited (“the Company”) is a public limited Company incorporated on 16 March 2007 in Pakistan under the
Companies Ordinance, 1984 (Now Companies Act, 2017). The Company was incorporated as a private limited Company and
subsequently converted into a public limited Company with effect from 28 September 2015. On 23 July 2018, the Company
was formally listed on Pakistan Stock Exchange Limited. The principal activity of the Company is to run dairy farm for the
production and processing of milk and dairy products. The registered office of the Company is situated at 182-Abu Bakar
Block, New Garden Town, Lahore.
The preparation of these condensed interim financial statements in conformity with the approved accounting standards
requires the use of certain critical accounting estimates. It also requires the management to exercise its judgment in the
process of applying the Company's accounting policies. Estimates and judgments are continually evaluated and are based on
historical experience and other factors, including expectations of future events that are believed to be reasonable under the
circumstances.
During preparation of these condensed interim financial statements, the significant judgments made by the management in
applying the Company’s accounting policies and the key sources of estimation and uncertainty were the same as those that
applied in the preceding annual audited financial statements of the Company for the year ended 30 June 2018.
These condensed interim financial statements have been prepared in accordance with the accounting and reporting
standards as applicable in Pakistan for interim financial reporting. The accounting and reporting standards as applicable in
Pakistan for interim financial reporting comprise of:
• International Accounting Standard (IAS) 34, Interim Financial Reporting, issued by the International Accounting Standards
Board (IASB) as notified under the Companies Act, 2017; and
• Provisions of and directives issued under the Companies Act, 2017.
Where the provisions of and directives issued under the Companies Act, 2017 differ with the requirements of IAS 34, the
provisions of and directives issued under the Companies Act, 2017 have been followed.
These condensed interim financial statements do not include all the information and disclosures required in annual financial
statements and should be read in conjunction with the annual audited financial statements of the Company for the year
ended 30 June 2018. These condensed interim financial statements are un-audited, however, have been subjected to limited
scope review by the auditors and are being submitted to the shareholders as required by the Listed Companies (Code of
Corporate Governance) Regulations, 2017 and Section 237 of the Companies Act, 2017.
The accounting policies and methods of computations adopted for the preparation of these condensed interim financial
statements are the same as applied in the preparation of the preceding annual audited financial statements of the Company
for the year ended 30 June 2018 except for the changes in accounting policies as stated in note 3.2 to these condensed
interim financial statements.

AT-TAHUR LIMITED
3.2
3.2.1 IFRS 9 “Financial Instruments”
i) Classification and measurement of financial instruments
CHANGES IN ACCOUNTING POLICIES DUE TO APPLICABILITY OF CERTAIN INTERNATIONAL FINANCIAL
REPORTING STANDARDS (IFRS)
The following changes in accounting policies have taken place effective from 01 July 2018:
The Company has adopted IFRS 9 “Financial Instruments” from 01 July 2018. The standard introduced new classification and
measurement models for financial assets. A financial asset shall be measured at amortised cost if it is held within a business
model whose objective is to hold assets in order to collect contractual cash flows which arise on specified dates and that are
solely principal and interest. A debt investment shall be measured at fair value through other comprehensive income if it is
held within a business model whose objective is to both hold assets in order to collect contractual cash flows which arise on
specified dates that are solely principal and interest as well as selling the asset on the basis of its fair value. All other financial
assets are classified and measured at fair value through profit or loss unless the Company makes an irrevocable election on
initial recognition to present gains and losses on equity instruments in other comprehensive income. Despite these
requirements, a financial asset may be irrevocably designated as measured at fair value through profit or loss to reduce the
effect of, or eliminate, an accounting mismatch. For financial liabilities designated at fair value through profit or loss, the
standard requires the portion of the change in fair value that relates to the Company's own credit risk to be presented in
other comprehensive income (unless it would create an accounting mismatch). New simpler hedge accounting requirements
are intended to more closely align the accounting treatment with the risk management activities of the Company. New
impairment requirements use an 'expected credit loss' ('ECL') model to recognise an allowance. Impairment is measured
using a 12-month ECL method unless the credit risk on a financial instrument has increased significantly since initial
recognition in which case the lifetime ECL method is adopted. For receivables, a simplified approach to measuring expected
credit losses using a lifetime expected loss allowance is available.
The Company has adopted IFRS 9 by generally without restating the prior year results.
Key changes in accounting policies resulting from application of IFRS 9
IFRS 9 largely retains the existing requirements in IAS 39 “Financial Instruments: Recognition and Measurement” for the
classification and measurement of financial liabilities. However, it replaces the previous IAS 39 categories for financial assets
i.e. loans and receivables, fair value through profit or loss (FVTPL), available for sale and held to maturity with the categories
such as amortised cost, fair value through profit or loss (FVTPL) and fair value through other comprehensive income
(FVTOCI).
Investments and other financial assets
a) Classification
From 01 July 2018, the Company classifies its financial assets in the following measurement categories:
· those to be measured subsequently at fair value (either through other comprehensive income, or through profit or
· those to be measured at amortised cost
The classification depends on the Company’s business model for managing the financial assets and the contractual terms of
the cash flows.
For assets measured at fair value, gains and losses will either be recorded in statement of profit or loss or statement of
comprehensive income. For investments in debt instruments, this will depend on the business model in which the investment
is held. For investments in equity instruments, this will depend on whether the Company has made an irrevocable election at
the time of initial recognition to account for the equity investment at fair value through other comprehensive income. The
Company reclassifies debt investments when and only when its business model for managing those assets changes.

AT-TAHUR LIMITED
Debt instruments
b) Measurement
At initial recognition, the Company measures a financial asset at its fair value plus, in the case of a financial asset not at fair
value through profit or loss, transaction costs that are directly attributable to the acquisition of the financial asset.
Transaction costs of financial assets carried at fair value through profit or loss are expensed in statement of profit or loss.
Financial assets with embedded derivatives are considered in their entirety when determining whether their cash flows are
solely payment of principal and interest.
Subsequent measurement of debt instruments depends on the Company’s business model for managing the asset and the
cash flow characteristics of the asset. There are three measurement categories into which the Company classifies its debt
instruments:
Amortised cost
Financial assets that are held for collection of contractual cash flows where those cash flows represent solely payments of
principal and interest are measured at amortised cost. Interest income from these financial assets is included in other
income using the effective interest rate method. Any gain or loss arising on derecognition is recognised directly in
statement of profit or loss and presented in other income / (other expenses) together with foreign exchange gains and
losses. Impairment losses are presented as separate line item in the statement of profit or loss.
Fair value through other comprehensive income (FVTOCI)
Financial assets that are held for collection of contractual cash flows and for selling the financial assets, where the assets’
cash flows represent solely payments of principal and interest, are measured at FVTOCI. Movements in the carrying
amount are taken through statement of comprehensive income, except for the recognition of impairment losses (and
reversal of impaiment losses), interest income and foreign exchange gains and losses which are recognised in statement of
profit or loss. When the financial asset is derecognised, the cumulative gain or loss previously recognised in statement of
comprehensive income is reclassified from equity to statement of profit or loss and recognised in other income / (other
expenses). Interest income from these financial assets is included in other income using the effective interest rate method.
Foreign exchange gains and losses are presented in other income/ (other expenses) and impairment losses are presented
as separate line item in the statement of profit or loss.
Fair value through profit or loss (FVTPL)
Assets that do not meet the criteria for amortised cost or FVTOCI are measured at FVTPL. A gain or loss on a debt
instrument that is subsequently measured at FVTPL is recognised in profit or loss and presented net within other income /
(other expenses) in the period in which it arises.
Equity instruments
The Company subsequently measures all equity investments at fair value for financial instruments quoted in an active
market, the fair value corresponds to a market price (level 1). For financial instruments that are not quoted in an active
market, the fair value is determined using valuation techniques including reference to recent arm’s length market
transactions or transactions involving financial instruments which are substantially the same (level 2), or discounted cash
flow analysis including, to the greatest possible extent, assumptions consistent with observable market data (level 3).
Fair value through other comprehensive income (FVTOCI)
Where the Company’s management has elected to present fair value gains and losses on equity investments in statement
of comprehensive income, there is no subsequent reclassification of fair value gains and losses to statement of profit or
loss. Impairment losses (and reversal of impairment losses) on equity investments measured at FVTOCI are not reported
separately from other changes in fair value.

AT-TAHUR LIMITED
ii)
iii)
iv)
Financial assets (01 July 2018)
74,527,057 -
(74,527,057) 74,527,057
- Recognition of expected life time credit losses on trade debts - (12,586,744)
- 61,940,314
Effect on
un-appropriated
profit
Effect on total
equity
331,663,877 1,431,663,877
(12,586,744) (12,586,744)
319,077,134 1,419,077,134
Fair value through profit or loss (FVTPL)
Changes in the fair value of equity investments at fair value through profit or loss are recognised in other income/ (other
expenses) in the statement of profit or loss as applicable.
Dividends from such investments continue to be recognised in statement of profit or loss as other income when the
Company’s right to receive payments is established.
Impairment
From 01 July 2018, the Company assesses on a forward looking basis the expected credit losses associated with its debt
instruments carried at amortised cost and FVTOCI. The impairment methodology applied depends on whether there has been
a significant increase in credit risk.
For trade debts and other receivables, the Company applies the simplified approach permitted by IFRS 9, which requires
expected lifetime losses to be recognised from initial recognition of the receivables.
Hedge accounting
IFRS 9 requires that hedge accounting relationships are aligned with its risk management objectives and strategy and to
apply a more qualitative and forward-looking approach to assessing hedge effectiveness.
There is no impact of the said change on these condensed interim financial statements as there is no hedge activity carried
on by the Company during the period ended 31 December 2018.
Impacts of adoption of IFRS 9 on these condensed interim financial statements as on 01 July 2018
On 01 July 2018, the Company's management has assessed which business models apply to the financial assets held by the
Company at the date of initial application of IFRS 9 (01 July 2018) and has classified its financial instruments into appropriate
IFRS 9 categories. The main effects resulting from this reclassification are as follows:
Trade debts categorized as
Loans and
receivablesAmortised cost
Opening balance (after reclassification)
- - - - - - - Rupees- - - - - - -
Opening balance (before reclassification)
Adjustment on adoption of IFRS 9:
- Reclassification of trade debts
Opening balance (after reclassification)
The impact of these changes on the Company’s un-appropriated profit and equity is as follows:
Reserves and equity (01 July 2018)
- - - - - - - Rupees- - - - - - -
Opening balance (before reclassification)
Adjustment on adoption of IFRS 9 due to recognition of expected life time credit
losses on trade debts

AT-TAHUR LIMITED
Original New Original New Difference
(IAS 39) (IFRS 9)
Non-current financial assets
Long term security deposits Loans and
receivables Amortised cost 7,908,635 7,908,635 -
Current financial assets
Trade debts Loans and
receivables Amortised cost 74,527,057 61,940,314 12,586,744
Short term advances and other
receivables
Loans and
receivables Amortised cost 8,001,931 8,001,931 -
Short term security deposits Loans and
receivables Amortised cost 8,678,559 8,678,559 -
Cash and bank balances Loans and
receivables Amortised cost 464,915,451 464,915,451 -
Non-current financial liabilities
Liabilities against assets subject to
finance lease Amortised cost Amortised cost 21,309,695 21,309,695 -
Long term financingAmortised cost Amortised cost
180,207,375 180,207,375 -
Current financial liabilities
Trade and other payablesAmortised cost Amortised cost
134,912,804 134,912,804 -
Short term borrowingsAmortised cost Amortised cost
127,547,806 127,547,806 -
Accrued mark-upAmortised cost Amortised cost
4,927,831 4,927,831 -
Current portion of non-current
liabilities Amortised cost Amortised cost 110,308,136 110,308,136 -
3.2.2
Reclassifications of financial instruments on adoption of IFRS 9
As on 01 July 2018, the classification and measurement of financial instruments of the Company were as follows:
Measurement category Carrying amounts
- - - - - - - - - - Rupees - - - - - - - - - -
IFRS 15 'Revenue from Contracts with Customers'
The Company has adopted IFRS 15 from 01 July 2018. The standard provides a single comprehensive model for revenue
recognition. The core principle of the standard is that an entity shall recognise revenue to depict the transfer of promised
goods or services to customers at an amount that reflects the consideration to which the entity expects to be entitled in
exchange for those goods or services. The standard introduced a new contract-based revenue recognition model with a
measurement approach that is based on an allocation of the transaction price. This is described further in the accounting
policies below. Credit risk is presented separately as an expense rather than adjusted against revenue. Contracts with
customers are presented in a Company's statement of financial position as a contract liability, a contract asset, or a
receivable, depending on the relationship between the Company's performance and the customer's payment. Customer
acquisition costs and costs to fulfil a contract can, subject to certain criteria, be capitalised as an asset and amortised over
the contract period.

AT-TAHUR LIMITED
i)
a) Sale of goods
b) Interest
c) Other revenue
3.2.3 Trade and other receivables
The Company recognises revenue as follows:
The Company has adopted IFRS 15 by applying the modified retrospective approach according to which the Company is not
required to restate the prior year results.
Key changes in accounting policies resulting from application of IFRS 15
Revenue from contracts with customers
Revenue is recognised at an amount that reflects the consideration to which the Company is expected to be entitled in
exchange for transferring goods or services to a customer. For each contract with a customer, the Company: identifies the
contract with a customer; identifies the performance obligations in the contract; determines the transaction price which takes
into account estimates of variable consideration and the time value of money; allocates the transaction price to the separate
performance obligations on the basis of the relative stand-alone selling price of each distinct good or service to be delivered;
and recognises revenue when or as each performance obligation is satisfied in a manner that depicts the transfer to the
customer of the goods or services promised.
Variable consideration within the transaction price, if any, reflects concessions provided to the customer such as discounts,
rebates and refunds, any potential bonuses receivable from the customer and any other contingent events. Such estimates
are determined using either the 'expected value' or 'most likely amount' method. The measurement of variable consideration
is subject to a constraining principle whereby revenue will only be recognised to the extent that it is highly probable that a
significant reversal in the amount of cumulative revenue recognised will not occur. The measurement constraint continues
until the uncertainty associated with the variable consideration is subsequently resolved. Amounts received that are subject
to the constraining principle are initially recognised as deferred revenue in the form of a separate refund liability.
Revenue from the sale of goods is recognised at the point in time when the customer obtains control of the goods, which is
generally at the time of delivery.
Interest income is recognised as interest accrues using the effective interest method. This is a method of calculating the
amortised cost of a financial asset and allocating the interest income over the relevant period using the effective interest
rate, which is the rate that exactly discounts estimated future cash receipts through the expected life of the financial asset to
the net carrying amount of the financial asset.
Other revenue is recognised when it is received or when the right to receive payment is established.
Trade receivables are initially recognised at fair value and subsequently measured at amortised cost using the effective
interest method, less any allowance for expected credit losses.
The Company has applied the simplified approach to measuring expected credit losses, which uses a lifetime expected loss
allowance. To measure the expected credit losses, trade receivables have been grouped based on days overdue.
Other receivables are recognised at amortised cost, less any allowance for expected credit losses.

AT-TAHUR LIMITED
Un-audited Audited
31 December
201830 June 2018
Rupees Rupees
4 LONG TERM FINANCING
From banking company - secured
Opening balance 180,207,375 -
Add: Obtained during the period / year - 239,207,375
Less: Payment during the period / year 131,658,000 -
48,549,375 239,207,375
Less: Current Portion 4,085,283 59,000,000
Closing balance 44,464,092 180,207,375
5 CONTINGENCIES AND COMMITMENTS
5.1 Contingencies
5.1.1
5.1.2
5.1.3
5.1.4
5.2 Commitments
5.2.1 Letters of credit other than for capital expenditure of the Company are of Rupees 6,015,530 (30 June 2018: Rupees
11,233,288).
Deputy Commissioner Inland Revenue (DCIR) passed an order under sections 122(1) / 122(5) / 177 read with section 122(9)
of the Income Tax Ordinance, 2001 for tax year 2013 and made additions and disallowances of Rupees 111.822 million
under various heads resulting in reduction of tax losses of the Company. Being aggrieved, the Company filed an appeal
before Commissioner Inland Revenue (Appeals) [CIR(A)] who deleted some of the additions made by DCIR, remanded back
some of the additions and disallowances with favorable comments and confirmed an addition and levy of workers' welfare
fund. The Company has filed an appeal before Appellate Tribunal Inland Revenue (ATIR) against the order of CIR(A) which is
yet to be heard. The management of the Company, based on advice of the legal counsel, is confident of favorable outcome
of its appeal, hence no provision against additions and disallowances of Rupees 86.451 million, disallowance of tax credit of
Rupees 1.796 million and levy of workers' welfare fund of Rupees 0.484 million has been made in these condensed interim
financial statements.
Deputy Commissioner Inland Revenue (DCIR) and Assistant Commissioner Inland Revenue (ACIR) had rejected sales tax
refunds of the Company amounting to Rupees 35.269 million for various tax periods based on their interpretation of SRO
549(I)/2008 dated 11 June 2008 and SRO 670(I)/2013 dated 18 July 2013. As a result, the Company filed an appeal before
Commissioner Inland Revenue (Appeals) [CIR(A)] against the aforesaid rejections. CIR(A) has given the decision in favor of
the Company for the sales tax refunds amounting to Rupees 28.472 million. The management of the Company, based on
advice of the legal counsel, is confident of favorable outcome of its appeal in connection with the remaining amount, hence
no provision against the aforesaid rejections has been made in these condensed interim financial statements.
The Sindh High Court ('the Court') in the case of 'Kasim Textile' in its order of 07 May 2013 has held that benefit of carry
forward of minimum tax under section 113 of the Income Tax Ordinance, 2001 is only available if tax payable in a tax year is
less than minimum tax paid. If in a tax year, no tax is payable by a company due to assessed losses, the company forgoes
the right to carry forward minimum tax paid in that year. In the light of this order, the Company is not entitled to carry
forward minimum tax of Rupees 29.183 million. However, the management, based on advice of legal counsel, is of the view
that the verdict has been challenged in the Supreme Court and favorable final outcome is expected.
The Competition Commission of Pakistan (“CCP”) has initiated a formal enquiry under the provisions of the Competition Act,
2010 (“the Act”) on complaint against the Company by Pakistan Dairy Association (“Association”) for adopting deceptive
marketing practices in contravention of section 10 of the Act. It has also been prayed by Association to CCP to impose a
penalty of 10% of the annual turnover of the Company or Rupees 75 million, as CCP may deem appropriate. The Company
has submitted a detail reply before the CCP through their advocates, rejecting the contents of filed compliant, and expects a
favorable outcome of the matter. Hence, no provision for penalty has been recognized in these condensed interim financial
statements.

AT-TAHUR LIMITED
5.2.2
Un-audited Audited
31 December
201830 June 2018
Rupees Rupees
Not later than one year 5,896,048 15,222,799 ,
Later than one year and not later than five years 385,440 1,380,373
6,281,488 16,603,172
6 PROPERTY, PLANT AND EQUIPMENT
Operating fixed assets:
Owned (Note 6.1) 788,537,460 554,743,525
Leased (Note 6.2) 90,332,489 75,130,871
878,869,949 629,874,396
Capital work-in-progress (Note 6.3) 84,939,311 230,979,065
963,809,260 860,853,461
6.1 Operating fixed assets - owned
Opening net book value 554,743,525 524,099,523
Add: Cost of additions during the period / year (Note 6.1.1) 278,170,982 44,767,864
Add: Book value of transfer from leased assets (Note 6.2.2) - 18,870,080
Less: Book value of deletions during the period / year (Note 6.1.2) (20,034,272) (548,522)
Less: Depreciation charged during the period / year (24,342,775) (32,445,420)
Closing net book value 788,537,460 554,743,525
6.1.1 Cost of additions during the period / year
Building on freehold land 188,494,224 907,382
Plant and machinery 45,823,462 39,442,733
Electric installations 10,403,429 60,289
Office equipment 201,750 574,567
Tools and equipment 6,666,120 181,950
Vehicles 26,382,277 3,421,744
Furniture 167,700 23,799
Computers 17,520 34,000
Arms and ammunition 14,500 121,400
278,170,982 44,767,864
6.1.2 Book value of deletions during the period / year
Cost
- Vehicles 20,034,272 1,855,370
Less: Accumulated depreiciation - (1,306,848)
Book value of deletions during the period / year 20,034,272 548,522
6.2 Operating fixed assets - leased
Opening net book value 75,130,871 33,724,318
Add: Cost of additions during the period / year (Note 6.2.1) 20,737,018 66,615,024
Less: Book value of transfer to operating fixed assets (Note 6.2.2) - (18,870,080)
Less: Depreciation charged during the period / year (5,535,400) (6,338,391)
Closing net book value 90,332,489 75,130,871
The Company has obtained vehicles and machinery under ijarah arrangements from Al Baraka Bank (Pakistan) Limited and
BankIslami (Pakistan) Limited for a period of three years. The total future monthly Ujrah payments under Ijarah are as
follows:

AT-TAHUR LIMITED
Un-audited Audited
31 December
201830 June 2018
Rupees Rupees
6.2.1 Cost of additions during the period / year
Plant and machinery 502,538 61,000,134
Vehicles 20,234,480 5,614,890
20,737,018 66,615,024
6.2.2 Book value of transfer to operating fixed assets
Cost
- Plant and machinery - 21,132,000
Less: Accumulated depreiciation - 2,261,920
Book value of transfer during the period / year - 18,870,080
6.3 Capital work-in-progress
Building on freehold land 74,861,867 144,008,858
Plant and machinery 9,938,725 10,217,930
Advance to contractor for civil works 138,719 37,000,000
Advances against plant and machinery - 39,752,277
84,939,311 230,979,065
7 BIOLOGICAL ASSETS
Dairy livestock:
Mature 648,871,839 541,672,232
Immature 198,195,505 141,978,138
847,067,344 683,650,370
Non-current 846,404,559 682,411,604
Current 662,785 1,238,766
847,067,344 683,650,370
7.1 Reconciliation of carrying amount of dairy livestock:
Carrying amount at the beginning of the period / year 683,650,370 477,546,086
Purchases during the period / year 36,885,000 160,211,123
Fair value gain due to new births 15,389,040 12,215,620
197,445,835 193,045,257
212,834,875 205,260,877
Decrease due to deaths (38,675,449) (49,312,680)
Decrease due to sales (47,627,452) (110,055,036)
847,067,344 683,650,370
Gain arising from changes in fair value less costs to sell
attributable to physical and price changes
Carrying amount at the end of the period / year, which
approximates the fair value less costs to sell

AT-TAHUR LIMITED
7.2
7.3
8 DEFERRED INCOME TAX ASSET
31 December
2018
31 December
2017
31 December
2018
31 December
2017
Rupees Rupees Rupees Rupees
9 OPERATING COSTS
Raw milk consumed 375,327,381 299,236,831 184,146,510 155,858,114
Forage consumed 245,044,584 140,070,442 146,360,631 78,196,317
Stores consumed 1,105,426 - 523,807 -
Packing materials consumed 84,247,667 73,467,951 43,389,262 38,010,426
Salaries, wages and other benefits 43,314,636 37,721,363 20,351,963 18,506,851
Oil and lubricants 41,939,486 23,496,667 23,818,301 20,589,651
Utilities 8,866,536 8,943,436 3,945,490 3,329,397
Insurance 417,005 605,518 272,860 310,635
Repair and maintenance 8,479,677 6,402,803 5,808,299 2,669,152
Artificial insemination supplies consumed 1,141,000 210,000 1,141,000 -
Dairy livestock medication consumed 9,684,705 - 4,899,111 -
Dairy supplies consumed 16,372,701 1,012,950 8,584,247 897,900
Chemicals consumed 1,074,106 628,817 962,414 133,746
Vehicles' running 5,042,154 1,517,366 3,031,156 730,726
Depreciation 19,719,593 12,226,084 10,670,718 6,172,996
Miscellaneous 35,397,626 15,237,967 30,156,248 10,127,008
897,174,283 620,778,195 488,062,017 335,532,919
Finished / manufactured goods
Opening inventory 2,936,442 3,697,797 3,820,669 4,542,223
Closing inventory (3,110,683) (4,601,369) (3,110,683) (4,601,369)
(174,241) (903,572) 709,986 (59,146)
897,000,042 619,874,623 488,772,003 335,473,773
As at 31 December 2018, the Company held 1,525 (30 June 2018: 1,348) mature assets able to produce milk and 936 (30
June 2018: 789) immature assets that are being raised to produce milk in the future. During the period, the Company
produced approximately 6,053,914 (30 June 2018: 7,816,366) gross litres of milk from these biological assets. As at 31
December 2018, the Company also held 21 (30 June 2018: 50) immature male calves.
The valuation of dairy livestock as at 31 December 2018, has been carried out by independent valuers. In this regard, the
valuers examined the physical condition of the livestock, assessed the key assumptions and estimates and relied on the
representations made by the Company as at 31 December 2018. Further, in the absence of an active market of the
Company's dairy livestock in Pakistan, market and replacement values of similar livestock from active markets in Europe and
Australia, have been used as basis of valuation by the independent valuers. The cost of transportation to Pakistan is also
considered.
The Company has an aggregate amount of recognized deferred income tax asset of Rupees 115,266,443 (30 June 2018:
Rupees 91,432,523) which represents management's best estimate of the probable benefits expected to be realized in future
years in the form of reduced tax liability as the Company would be able to set off the profits earned in those years against
losses carried forward. The Company has prepared five years financial projections for future taxable profits, which have been
approved by the Board of Directors of the Company, to assess the recoverability of deferred income tax assets. The
projections involve certain key management assumptions underlying the estimation of future taxable profits. The
determination of future taxable profits is most sensitive to certain key assumptions such as recent capital injections, growth
of herd, increase in milk yield, etc. Any significant changes in such assumptions may have an effect on the recoverability of
deferred income tax asset. Management believes that it is probable that the Company will be able to achieve the profits and,
consequently, the deferred income tax asset will be fully realized in future.
Un-audited Un-audited
HALF YEAR ENDED QUARTER ENDED

AT-TAHUR LIMITED
10 RECOGNIZED FAIR VALUE MEASUREMENTS - FINANCIAL INSTRUMENTS
(i) Fair value hierarchy
11 RECOGNIZED FAIR VALUE MEASUREMENTS - NON-FINANCIAL ASSETS
(i) Fair value hierarchy
Biological assets - 847,067,344 - 847,067,344
Total non-financial assets - 847,067,344 - 847,067,344
Biological assets - 683,650,370 - 683,650,370
Total non-financial assets - 683,650,370 - 683,650,370
Certain financial assets and financial liabilities are not measured at fair value if the carrying amounts are a reasonable
approximation of fair value. Due to short term nature, carrying amounts of certain financial assets and financial liabilities are
considered to be the same as their fair value. For the majority of the non-current receivables, the fair values are also not
significantly different from their carrying amounts. Judgements and estimates are made in determining the fair values of the
financial instruments that are recognised and measured at fair value in these condensed interim financial statements. To
provide an indication about the reliability of the inputs used in determining fair value, the Company classify its financial
instruments into the following three levels. However, as at the reporting date, the Company has no such type of financial
instruments which are required to be grouped into these levels. These levels are explained as under:
Level 1: The fair value of financial instruments traded in active markets (such as publicly traded derivatives, and trading and
equity securities) is based on quoted market prices at the end of the reporting period. The quoted market price used for
financial assets held by the Company is the current bid price. These instruments are included in level 1.
Level 2: The fair value of financial instruments that are not traded in an active market (for example, over-the-counter
derivatives) is determined using valuation techniques which maximise the use of observable market data and rely as little as
possible on entity-specific estimates. If all significant inputs required to fair value an instrument are observable, the
instrument is included in level 2.
Level 3: If one or more of the significant inputs is not based on observable market data, the instrument is included in level
3. This is the case for unlisted equity securities.
Judgements and estimates are made for non-financial assets that are recognized and measured at fair value in these
condensed interim financial statements. To provide an indication about the reliability of the inputs used in determining fair
value, the Company has classified its non-financial assets into the following three levels.
At 31 December 2018 Level 1 Level 2 Level 3 Total
----------------------------- Rupees --------------------------
At 30 June 2018 Level 1 Level 2 Level 3 Total
----------------------------- Rupees --------------------------
The Company’s policy is to recognise transfers into and transfers out of fair value hierarchy levels as at the end of the
reporting period.
There were no transfers between levels 1 and 2 for recurring fair value measurements during the period. Further, there was
no transfer in and out of level 3 measurements.

AT-TAHUR LIMITED
(ii) Valuation techniques used to determine level 2 fair values
Valuation processes
12 UTILIZATION OF THE PROCEEDS OF THE INITIAL PUBLIC OFFER (IPO)
Total funds
available
Total funds
utilized till 31
December 2018
Plant and machinery 133,002,950 87,105,762
Farm civil works 206,552,161 206,552,161
Milking Parlor 49,700,000 17,531,225
Cows 267,500,000 207,096,123
Utilities 24,000,000 -
Miscellaneous farm expenses 49,600,000 40,298,266
Working capital requirement 215,000,000 208,587,617
Excess IPO funds:
- Repayment of long term debt facility 14,666,800 14,666,800
- Finance working capital 11,000,100 -
- Any other activity relating to company's ongoing
operations. Decision to be taken by BOD 11,000,100 -
Total 982,022,111 781,837,954
12.1 IPO proceeds utilization: Rupees
Net proceeds from IPO 770,007,000
Profit on deposit 5,656,841
Debt financing 212,015,111
Total funds 987,678,952
Less: Funds utilized till 31 December 2018 781,837,954
Un-utilized funds as on 31 December 2018 205,840,998
Changes in fair values are analysed between the chief financial officer and the valuer. As part of this discussion the team
presents a report that explains the reason for the fair value movements.
The fair value of these assets is determined by an independent valuer. Fair value of biological assets has been determined
using a replacement cost approach, whereby, current cost of similar dairy cattle in the international market has been
adjusted for transportation costs to arrive at fair value.
The Company engages external and independent valuers to determine the fair value of the Company’s biological assets at the
end of every half yearly reporting period. As at 31 December 2018, the fair value of the biological assets was determined by
M/s Sadruddin Associate (Private) Limited and M/s Anderson Consulting (Private) Limited.
Till 31 December 2018, the Company has utilized the proceeds of the initial public offer of 36,667,000 ordinary shares for the
purposes mentioned under heading 4.9 ‘Expansion Plan’ in prospectus dated 13 June 2018, as per the following detail:
-------------------Rupees--------------------

AT-TAHUR LIMITED
13
(i) Transactions:
31 December
2018
31 December
2017
31 December
2018
31 December
2017
Rupees Rupees Rupees Rupees
21,421,103 1,275,866 18,421,103 -
Common facilities cost charged 3,000,000 6,000,000 - 3,000,000
Un-audited Audited
As at
31 December
2018
As at
30 June 2018
Rupees Rupees
(ii) Period end balances
Bahera (Private) Limited - associated company
Short term advances and other receivable 9,000,000 19,953,188
Trade and other payable 67,915 -
14
15
16 CORRESPONDING FIGURES
TRANSACTIONS WITH RELATED PARTIES
Related parties comprise associated company, other related parties and key management personnel. The Company in the
normal course of business carries out transactions with various related parties. Details of transactions with related parties are
as follows:
Un-audited Un-audited
Corresponding figures have been re-arranged, wherever necessary, for the purpose of comparison, however, no significant re-
arrangements have been made.
HALF YEAR ENDED QUARTER ENDED
Bahera (Private) Limited - associated
company
Purchase of goods
FINANCIAL RISK MANAGEMENT
The Company's financial risk management objectives and policies are consistent with those disclosed in the preceding annual
audited financial statements of the Company for the year ended 30 June 2018.
DATE OF AUTHORIZATION FOR ISSUE
These condensed interim financial statements were approved by the Board of Directors and authorized for issue on February
25, 2018.
In order to comply with the requirements of International Accounting Standard (IAS) 34 'Interim Financial Reporting', the
condensed interim statement of financial position and the condensed interim statement of changes in equity have been
compared with the balances of annual audited financial statements of preceding financial year, whereas, the condensed
interim statement of profit or loss, condensed interim statement of comprehensive income and condensed interim statement
of cash flows have been compared with the balances of comparable period of immediately preceding financial year.
____________________ ______________ __________________________
CHIEF EXECUTIVE DIRECTOR CHIEF FINANCIAL OFFICER

