mr. bekemeyer supply, demand, market disruptions ... · pdf filemr. bekemeyer supply, demand,...
TRANSCRIPT
Economics Mr. Bekemeyer
Supply, Demand, Market Disruptions & EEEElasticity [Unit III Exam -- Practice Problems (ANSWERS)]
1. If Manchester United tickets are an inferior good, an increase in income will result in
D) a decrease in the demand for Manchester United tickets. 2. An increase in the price of Disneyland admission tickets will cause the demand curve for hotels near Disneyland to shift in which direction?
B) To the left, because Disneyland admission tickets and hotels near Disneyland are complements 3. Assume that coal is a normal good. If the price of coal increases and the quantity sold increases, which of the following is consistent with these observations?
A) The price of oil increased, oil and coal being substitutes. 4. Which of the following will not change the demand for oranges?
C) A change in the price of oranges 5. If there is an increase in demand for a good, what will most likely happen to the price and quantity of the good exchanged?
Price Quantity
B) Increase Increase 6. During a Roseville Raider soccer match, it starts to rain and the temperature drops. The RAHS Senior Class, which runs the concession stand and is taking AP Microeconomics, raises the price of coffee from 50 cents to 75 cents a cup. They sell more than ever before. Which answer explains this?
D) The demand for coffee increased.

Exam Practice # ________
7. Assume that the demand for apples is downward sloping. If the price of apples falls from $.80 per pound to $.65 per pound, which of the following will occur?
B) A larger quantity of apples will be demanded. 8. Which of the following will not cause the demand curve for Adidas Predator soccer boots to shift?
E) A decrease in the price of Adidas Predator soccer boots 9. During the 1990s, the price of VCRs fell by about 30 percent, and quantity sold decreased by the same amount. The demand for VCRs must
D) have shifted to the left. 10. Which of the following will occur if a legal price floor is placed on a good below its free-market equilibrium?
D) The equilibrium price will ration the good. 11. A marketing survey shows that gate receipts would increase if the price of tickets to a summer rock concert increased, even though the number of tickets sold would fall. What does this imply about the price elasticity of demand for concert tickets?
A) Demand is inelastic. 12. Compare 2012 with 2013. Which of the following statements is (are) true? Year Quantity Sold Price 2012 30,000 $10 2013 50,000 $20 I. Demand has increased. II. Quantity demanded has increased. C) I, II, IV, only III. Supply has increased. IV. Quantity supplied has increased. V. Supply has decreased.
13. If the price of lunch at the San Pedro Café in Hudson, Wisconsin increases and San Pedro Café revenue remains constant, the elasticity of demand for an amazing lunch in Hudson, Wisconsin must be
C) unit elastic. 14. If the price of soccer balls increases and consumer expenditures on soccer balls also increase, which of the following is necessarily true?
E) The demand for soccer balls is inelastic.
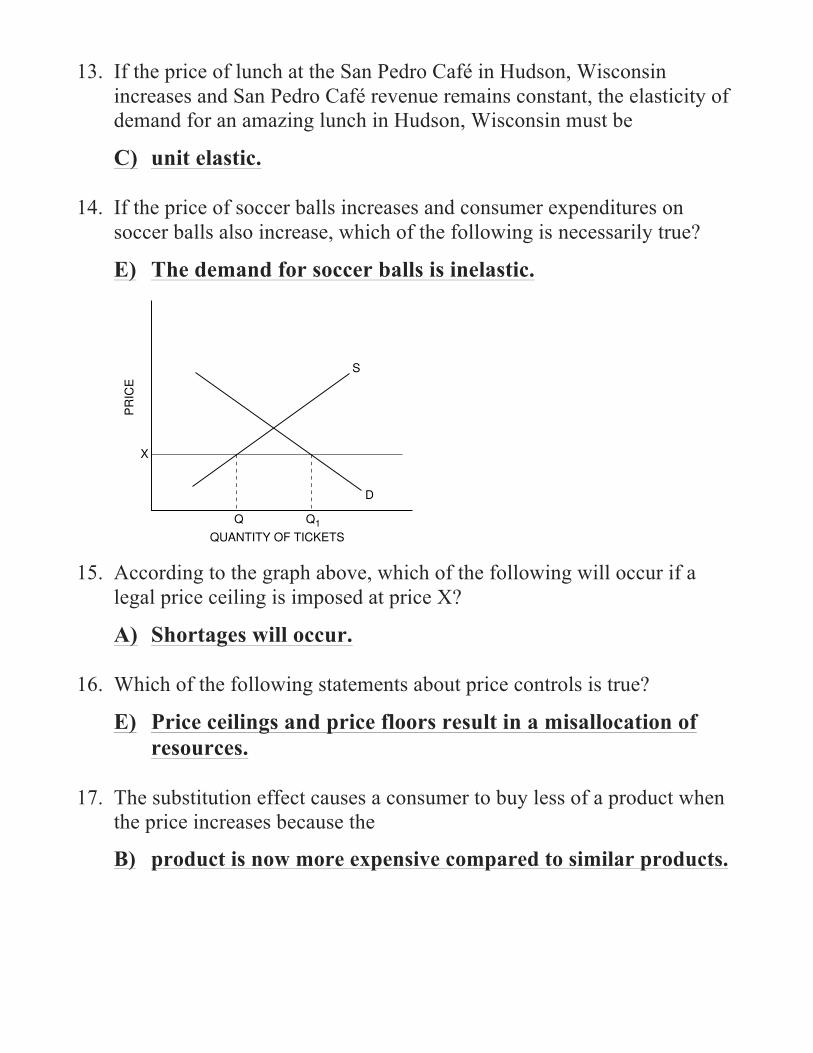
15. According to the graph above, which of the following will occur if a legal price ceiling is imposed at price X?
A) Shortages will occur. 16. Which of the following statements about price controls is true?
E) Price ceilings and price floors result in a misallocation of resources. 17. The substitution effect causes a consumer to buy less of a product when the price increases because the
B) product is now more expensive compared to similar products.
114 Advanced Placement Economics Microeconomics: Student Activities © National Council on Economic Education, New York, N.Y.
18. According to the graph above, which of the fol-lowing will occur if a legal price ceiling isimposed at price X?
(A) Shortages will occur.
(B) Surpluses will occur.
(C) Demand will increase.
(D) Q1 will be purchased.
(E) Supply will decrease.
19. Which of the following statements about pricecontrols is true?
(A) A price ceiling causes a shortage if the ceil-ing price is above the equilibrium price.
(B) A price floor causes a surplus if the pricefloor is below the equilibrium price.
(C) A price ceiling causes an increase indemand if the ceiling price is set below theequilibrium price.
(D) A price ceiling causes a decrease in demandif the price floor is set above the equilibri-um price.
(E) Price ceilings and price floors result in amisallocation of resources.
20. If the price of lunch at the school cafeteriaincreases and cafeteria revenue remains con-stant, the elasticity of demand for a schoollunch must be
(A) elastic.
(B) perfectly elastic.
(C) unit elastic.
(D) inelastic.
(E) perfectly inelastic.
21. If an excise tax is imposed on a product, con-sumer surplus and producer surplus for thisgood will most likely change in which of thefollowing ways?
Consumer Surplus Producer Surplus(A) Decrease Decrease
(B) Decrease Increase
(C) Decrease Not change
(D) Not change Increase
(E) Not change Not change
22. If the price of paperback books increases andconsumer expenditures on paperback booksalso increase, which of the following is neces-sarily true?
(A) Paperback books are normal goods.
(B) Paperback books are inferior goods.
(C) The demand for paperback books is unitelastic.
(D) The demand for paperback books is elastic.
(E) The demand for paperback books is inelas-tic.
2 Microeconomics SAMPLE QUESTIONS MULTIPLE-CHOICE
UNIT
(continued)
Q Q1
S
D
X
QUANTITY OF TICKETS
PR
ICE

% Change % Change in Product in Income Quantity A +5 +5 B +5 -5 C -10 -10 D -10 +10
18. Based on the information in the table above, which product(s) is / are inferior?
E) Product B and D only 19. If the price of a good decreases by 3 percent and total revenue increases, the elasticity of demand for the good could possibly be
A) 1.3 20. Advocates of higher minimum wages for unskilled labor defend their position by arguing that
A) low-income workers deserve to earn incomes above the poverty level. 21. During the first years of the French Revolution, Jacques Necker, Joseph Mounier, Gérard de Lally-Tollendal, and other leaders ordered price controls placed on all essential items in order to help the peasants pay for these important necessities. The result of this was that many peasants starved. Once the National Constituent Assembly convened after successfully defending the revolution, it passed a law which,
D) overrode previous laws and repealed the price controls. 22. Which of the following will shift the demand curve for milk?
A) change in the income of buyers of milk 23. A shift in the demand curve for sailboats resulting from an increase in incomes will lead to
A) higher prices for sailboats.
24. Last year, 1,000 cases of elixir were sold at $10; this year, 1,200 cases were sold at $12. The most probable interpretation of these data is that the
D) demand curve has shifted to the right, with no change in supply. 25. The Bluefin Bay Resort in Northern Minnesota charges $99 per room in the winter ski season and $94 during the summer months. The number of rooms and operating costs are constant year round. These prices indicate
B) a rightward shift in demand in the winter. Short Response 1. I sit in the back row of the barbers’ union where they are discussing a proposal to raise the price of haircuts from $18 to $20. The argument gets nowhere, and someone suggests asking me, as an economist, whether it is a good idea or not. I reply, “Many studies have shown that the demand for haircuts is elastic.” What are they to make of this? Why? Be as brief as possible in making the major point that the barbers ought to see in this situation. If the demand for haircuts is elastic, total revenue would fall if the price were raised. 2. True, false or uncertain, and explain why? “Other things being the same, the surplus of workers associated with a price floor will be greater the greater the elasticity of both supply and demand.” Discuss this statement. Use graphs to illustrate your explanation. The more elastic the supply and demand curves, the greater the surplus.
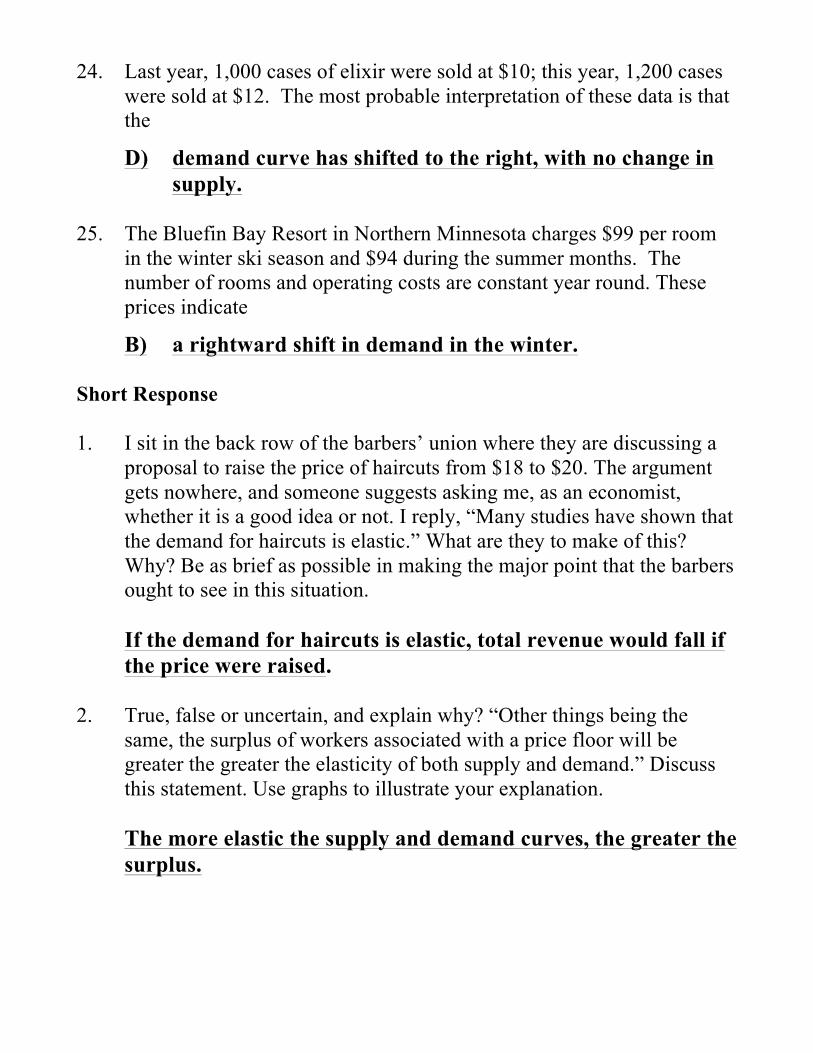
3. A news paper headline says, “The Coldest Winter in 20 Years Brings Record Prices for Heating Oil.”
(A) Using a graph of home heating oil, show and explain how price changed.
The record cold increases the demand for heating oil to run heaters, so the demand increases, raising the price and quantity sold.
(B) What other factors could cause the price of heating oil to increase?
Any factor that increased demand could increase price and quantity. Any factor that decreased supply could increase price and decrease quantity.
Advanced Placement Economics Teacher Resource Manual © National Council on Economic Education, New York, N.Y. 115
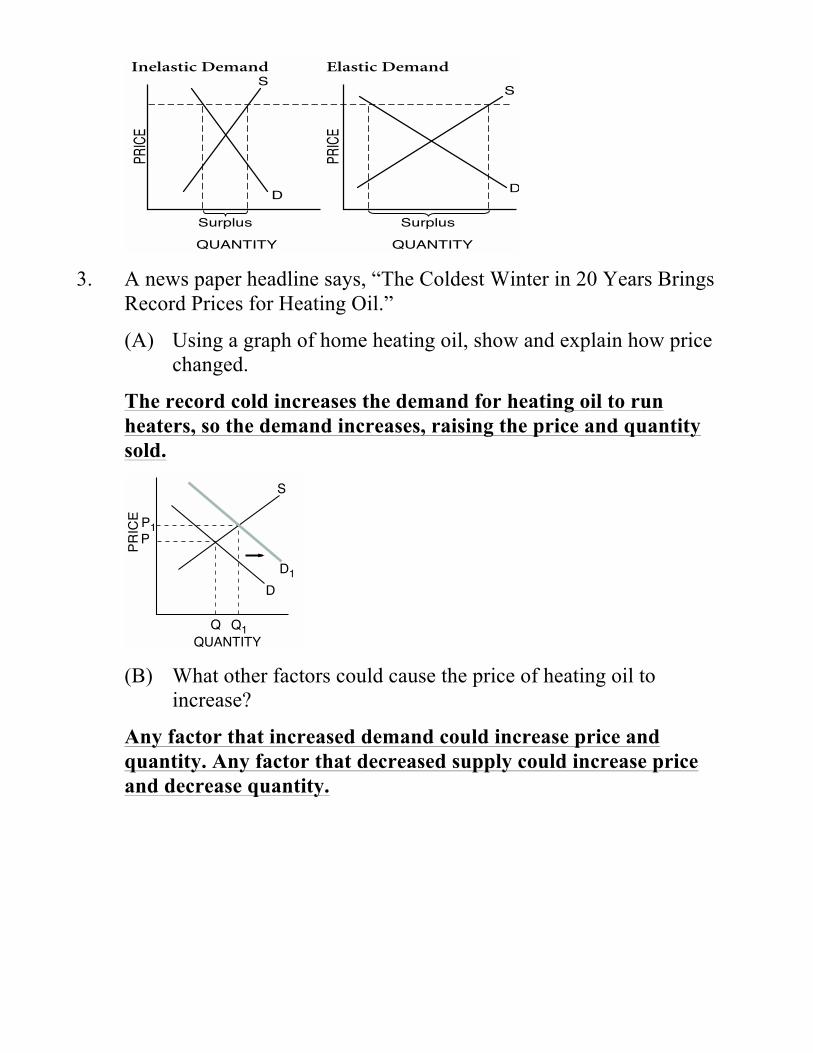
4. True, false or uncertain, and explain why? “Other things being the same, the surplus of workersassociated with a price floor will be greater the greater the elasticity of both supply and demand.”Discuss this statement. Use graphs to illustrate your explanation.The more elastic the supply and demand curves, the greater the surplus.
*5. An arena holds a maximum of 40,000 people, as indicated in the graph above. Each year the cir-cus holds eight performances, all of which are sold out.
(A) Analyze the effect on each of the following of the addition of a fantastic new death-defyingtrapeze act that increases the demand for tickets.(i) The price of tickets(ii) The quantity of tickets sold
The trapeze act will cause an increase in demand (shift right in the demand curve) increasingthe price, but the quantity will remain the same because the quantity is fixed at 40,000 seats.
Grading Rubric: Part (A) = 2 pointsPrice increases as a result of the demand increases (1 point)Quantity remains the same (1 point)
2 Microeconomics SHORT FREE-RESPONSESAMPLE QUESTIONS
AnswerKey
UNIT
S
D
QUANTITY
PRICE
S
D
QUANTITY
Surplus Surplus
Inelastic Demand Elastic Demand
PRICE
40,000
S
D
$5.00
QUANTITY OF TICKETS
PRICE
* Actual free-response question from a past AP test. Reprinted by permission of the College Entrance Examination Board, the copy-right owner. For limited use by NCEE.
116 Advanced Placement Economics Teacher Resource Manual © National Council on Economic Education, New York, N.Y.
(B) The city of Toledo institutes an effective price ceiling on tickets. Explain where the price ceil-ing would be set. Explain the impact of the ceiling on each of the following:
(i) The quantity of tickets demanded
(ii) The quantity of tickets supplied
The price ceiling must be set below the equilibrium price with the new trapeze act (1 point).The quantity demanded will increase (1/2 point), however the quantity supplied will remainthe same (fixed at 40,000) (1/2 point).
Grading Rubric: Part (B) = 2 pointsSetting the price ceiling below the equilibrium price (1 point)Quantity demand increases (1/2 point)Quantity supplied unchanged (1/2 point)
(C) Will everyone who attends the circus pay the ceiling price set by the city of Toledo? Why orwhy not?
No, a secondary market or reselling of tickets or scalping of tickets will have some circus goerspaying more than the ceiling price (1 point).
Grading Rubric: Part (C) = 1 point (some version of the above)(Note: Radio give-aways, coupons and employees do not change with the existence of a priceceiling; therefore that type of answer is incorrect.)
6. A newspaper headline says, “The Coldest Winter in 20 Years Brings Record Prices for Heating Oil.”
(A) Using a graph of home heating oil, show and explain how price changed.The record cold increases the demand for heating oil to run heaters, so the demand increases,raising the price and quantity sold.
(B) What other factors could cause the price of heating oil to increase?Any factor that increased demand could increase price and quantity.Any factor that decreased supply could increase price and decrease quantity.
S
D1D
P
QUANTITY
PRICE
Q1Q
P1
2 Microeconomics SHORT FREE-RESPONSESAMPLE QUESTIONS
AnswerKey
UNIT
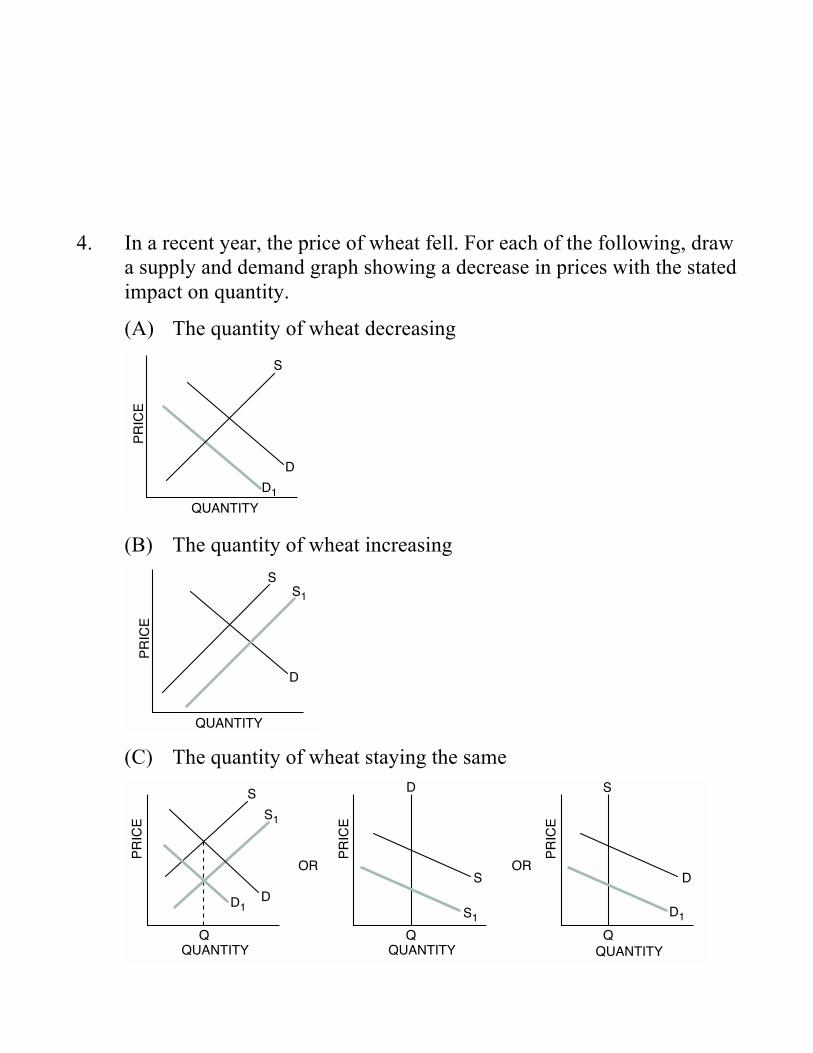
4. In a recent year, the price of wheat fell. For each of the following, draw a supply and demand graph showing a decrease in prices with the stated impact on quantity.
(A) The quantity of wheat decreasing
(B) The quantity of wheat increasing
(C) The quantity of wheat staying the same
Advanced Placement Economics Teacher Resource Manual © National Council on Economic Education, New York, N.Y. 117
7. In a recent year, the price of wheat fell. For each of the following, draw a supply and demandgraph showing a decrease in prices with the stated impact on quantity.
(A) The quantity of wheat decreasing
(B) The quantity of wheat increasing
(C) The quantity of wheat staying the same
S
D1
D
QUANTITY
PRICE
SS1
D
QUANTITY
PRICE
Q
S
OR OR
S1
D
QUANTITY
PRICE
Q
D
S1
S
QUANTITY
PRICE
Q
S
D1D1
D
QUANTITY
PRICE
2 Microeconomics SHORT FREE-RESPONSESAMPLE QUESTIONS
AnswerKey
UNIT

5. An arena holds a maximum of 40,000 people, as indicated in the graph above. Each year the circus holds eight performances, all of which are sold out.
(A) Analyze the effect on each of the following of the addition of a fantastic new death-defying trapeze act that increases the demand for tickets.
(i) The price of tickets
(ii) The quantity of tickets sold
The trapeze act will cause an increase in demand (shift right in the demand curve) increasing the price, but the quantity will remain the same because the quantity is fixed at 40,000 seats. (B) The city of Roseville institutes an effective price ceiling on tickets. Explain where the price ceiling would be set. Explain the impact of the ceiling on each of the following:
(i) The quantity of tickets demanded
(ii) The quantity of tickets supplied
The price ceiling must be set below the equilibrium price with the new trapeze act. The quantity demanded will increase, however the quantity supplied will remain the same (fixed at 40,000). (C) Will everyone who attends the circus pay the ceiling price set by the city of Roseville? Why or why not?
No, a secondary market or reselling of tickets or scalping of tickets will have some circus goers paying more than the ceiling price.
118 Advanced Placement Economics Microeconomics: Student Activities © National Council on Economic Education, New York, N.Y.
4. True, false or uncertain, and explain why? “Other things being the same, the surplus of workersassociated with a price floor will be greater the greater the elasticity of both supply and demand.”Discuss this statement. Use graphs to illustrate your explanation.
*5. An arena holds a maximum of 40,000 people, as indicated in the graph above. Each year the cir-cus holds eight performances, all of which are sold out.
(A) Analyze the effect on each of the following of the addition of a fantastic new death-defyingtrapeze act that increases the demand for tickets.
(i) The price of tickets
(ii) The quantity of tickets sold
2 Microeconomics SAMPLE QUESTIONS SHORT FREE-RESPONSE
UNIT
(continued)
* Actual free-response question from a past AP test. Reprinted by permission of the College Entrance Examination Board, the copy-right owner. For limited use by NCEE.
40,000
S
D
$5.00
QUANTITY OF TICKETS
PR
ICE

6. The market for many commodities is seasonal in nature. Their sales (equilibrium quantity) increase dramatically during certain times of the year. Poofy prom dresses and fresh strawberries, are two examples. Poofy prom dress sales increase during the last three months of the school year, and the sales of fresh strawberries increase during the summer months. But the (equilibrium) price movement of these two commodities is quite different during their peak sales season: Poofy prom dresses increase in price during the last three months of the school year, where as strawberries decrease in price during the summer.
(A) Show on the graph below how there can be an increase in the equilibrium quantity and an increase in the equilibrium price of Poofy prom dresses during the last three months of the school year, and briefly explain what has happened.
With other things constant, there is an increase in the demand for Poofy prom dresses in the last three months of the school year. This causes a rightward shift of demand and causes the price and quantity sold to increase.
Advanced Placement Economics Microeconomics: Student Activities © National Council on Economic Education, New York, N.Y. 121
8. The market for many commodities is seasonal in nature. Their sales (equilibrium quantity)increase dramatically during certain times of the year. Christmas cards and fresh strawberries, atleast in the North, are two examples. Christmas-card sales increase during the last three months ofthe year, and the sales of fresh strawberries in the North increase during the summer months. Butthe (equilibrium) price movement of these two commodities is quite different during their peaksales season: Christmas cards increase in price during the last three months of the year, whereasstrawberries decrease in price during the summer.
(A) Show on the graph below how there can be an increase in the equilibrium quantity and anincrease in the equilibrium price of Christmas cards during the last three months of the year,and briefly explain what has happened.
(B) Change the graph for fresh strawberries in the North to show how there can be an increase inthe equilibrium quantity and a decrease in the equilibrium price of strawberries in the sum-mer, and briefly explain what has happened.
2 Microeconomics SAMPLE QUESTIONS SHORT FREE-RESPONSE
UNIT
(continued)
Q
S
D
P
QUANTITY
PR
ICE
Christmas Card Market
Q
S
D
P
QUANTITY
PR
ICE
Strawberry Market in the North
118 Advanced Placement Economics Teacher Resource Manual © National Council on Economic Education, New York, N.Y.
8. The market for many commodities is seasonal in nature. Their sales (equilibrium quantity)increase dramatically during certain times of the year. Christmas cards and fresh strawberries, atleast in the North, are two examples. Christmas-card sales increase during the last three months ofthe year, and the sales of fresh strawberries in the North increase during the summer months. Butthe (equilibrium) price movement of these two commodities is quite different during their peaksales season: Christmas cards increase in price during the last three months of the year, whereasstrawberries decrease in price during the summer.
(A) Show on the graph below how there can be an increase in the equilibrium quantity and anincrease in the equilibrium price of Christmas cards during the last three months of the year,and briefly explain what has happened.
With other things constant, there is an increase in the demand for Christmas cards in the lastthree months of the year. This causes a rightward shift of demand and causes the price andquantity sold to increase.
(B) Change the graph for fresh strawberries in the North to show how there can be an increase inthe equilibrium quantity and a decrease in the equilibrium price of strawberries in the sum-mer, and briefly explain what has happened.
Other things constant, there is an increase in the supply of fresh strawberries in the northernareas of the United States in the warmer months when the berries are harvested in the northernareas. This causes a rightward shift in the supply curve and causes the price to fall and thequantity sold to increase.
Q1Q
S
D
P1P
QUANTITY
PRICE
D1
Christmas Card Market
Q1Q
SS1
D
P1P
QUANTITY
PRICE
Strawberry Market in the North
2 Microeconomics SHORT FREE-RESPONSESAMPLE QUESTIONS
AnswerKey
UNIT
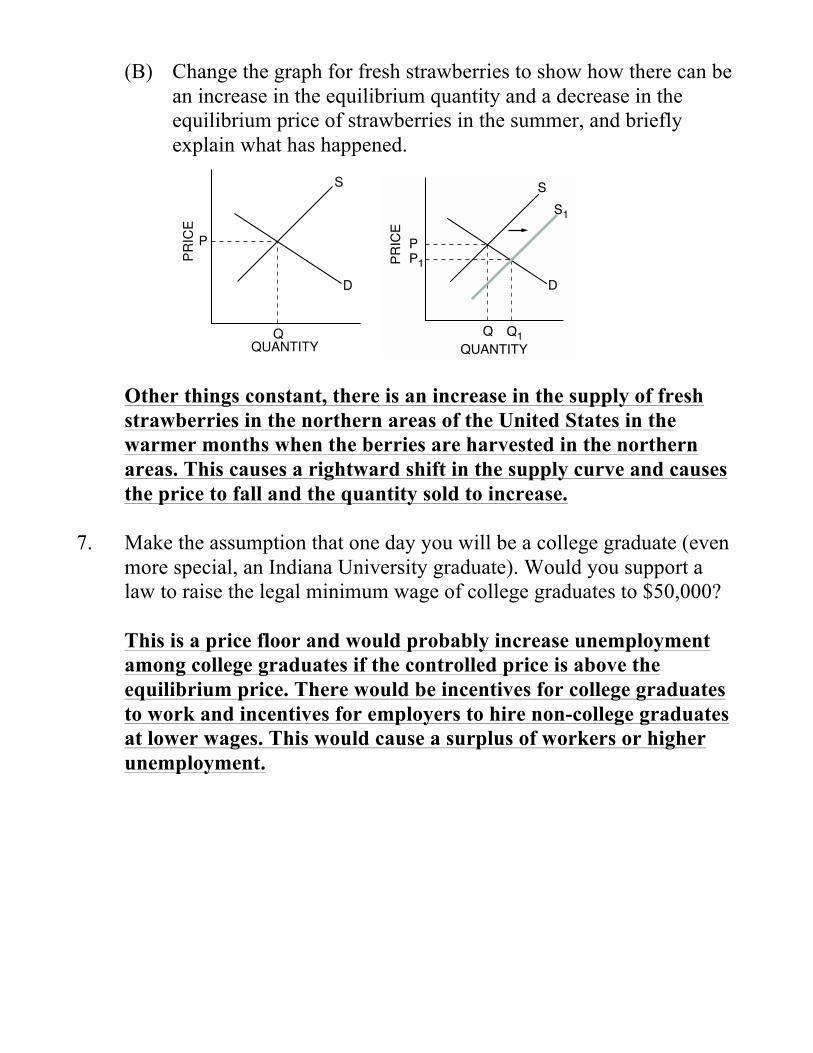
(B) Change the graph for fresh strawberries to show how there can be an increase in the equilibrium quantity and a decrease in the equilibrium price of strawberries in the summer, and briefly explain what has happened.
Other things constant, there is an increase in the supply of fresh strawberries in the northern areas of the United States in the warmer months when the berries are harvested in the northern areas. This causes a rightward shift in the supply curve and causes the price to fall and the quantity sold to increase. 7. Make the assumption that one day you will be a college graduate (even more special, an Indiana University graduate). Would you support a law to raise the legal minimum wage of college graduates to $50,000? This is a price floor and would probably increase unemployment among college graduates if the controlled price is above the equilibrium price. There would be incentives for college graduates to work and incentives for employers to hire non-college graduates at lower wages. This would cause a surplus of workers or higher unemployment.
Advanced Placement Economics Microeconomics: Student Activities © National Council on Economic Education, New York, N.Y. 121
8. The market for many commodities is seasonal in nature. Their sales (equilibrium quantity)increase dramatically during certain times of the year. Christmas cards and fresh strawberries, atleast in the North, are two examples. Christmas-card sales increase during the last three months ofthe year, and the sales of fresh strawberries in the North increase during the summer months. Butthe (equilibrium) price movement of these two commodities is quite different during their peaksales season: Christmas cards increase in price during the last three months of the year, whereasstrawberries decrease in price during the summer.
(A) Show on the graph below how there can be an increase in the equilibrium quantity and anincrease in the equilibrium price of Christmas cards during the last three months of the year,and briefly explain what has happened.
(B) Change the graph for fresh strawberries in the North to show how there can be an increase inthe equilibrium quantity and a decrease in the equilibrium price of strawberries in the sum-mer, and briefly explain what has happened.
2 Microeconomics SAMPLE QUESTIONS SHORT FREE-RESPONSE
UNIT
(continued)
Q
S
D
P
QUANTITY
PR
ICE
Christmas Card Market
Q
S
D
P
QUANTITY
PR
ICE
Strawberry Market in the North
118 Advanced Placement Economics Teacher Resource Manual © National Council on Economic Education, New York, N.Y.
8. The market for many commodities is seasonal in nature. Their sales (equilibrium quantity)increase dramatically during certain times of the year. Christmas cards and fresh strawberries, atleast in the North, are two examples. Christmas-card sales increase during the last three months ofthe year, and the sales of fresh strawberries in the North increase during the summer months. Butthe (equilibrium) price movement of these two commodities is quite different during their peaksales season: Christmas cards increase in price during the last three months of the year, whereasstrawberries decrease in price during the summer.
(A) Show on the graph below how there can be an increase in the equilibrium quantity and anincrease in the equilibrium price of Christmas cards during the last three months of the year,and briefly explain what has happened.
With other things constant, there is an increase in the demand for Christmas cards in the lastthree months of the year. This causes a rightward shift of demand and causes the price andquantity sold to increase.
(B) Change the graph for fresh strawberries in the North to show how there can be an increase inthe equilibrium quantity and a decrease in the equilibrium price of strawberries in the sum-mer, and briefly explain what has happened.
Other things constant, there is an increase in the supply of fresh strawberries in the northernareas of the United States in the warmer months when the berries are harvested in the northernareas. This causes a rightward shift in the supply curve and causes the price to fall and thequantity sold to increase.
Q1Q
S
D
P1P
QUANTITY
PRICE
D1
Christmas Card Market
Q1Q
SS1
D
P1P
QUANTITY
PRICE
Strawberry Market in the North
2 Microeconomics SHORT FREE-RESPONSESAMPLE QUESTIONS
AnswerKey
UNIT

8. You are a member of the city council and are considering a law to control rents below the free- market rent. Answer the following questions, and use a graph in your explanation.
(A) What would be the effect of this rent-control law in the short run? Why?
(B) What would be the effect of this rent-control law in the long run? Why?
(A) In the short run, this would cause a shortage. There is no time to sell or convert apartments. Quantity supplied (Qs) stays the same, but quantity demanded increases to Qd. A shortage from Qs to Qd exists.
(B) In the long run, the shortage would be more acute because there would be fewer incentives to build more apartments. Apartments would be converted to condominiums or sold for other businesses. Quantity supplied would move to Q. Also, underground markets could develop, and creative apartment owners could actually charge a price of Pum.
Advanced Placement Economics Teacher Resource Manual © National Council on Economic Education, New York, N.Y. 119
Sample Long Free-Response Questions1. You are a member of the city council and are considering a law to control rents below the free-
market rent. Answer the following questions, and use a graph in your explanation.
(A) What would be the effect of this rent-control law in the short run? Why?
(B) What would be the effect of this rent-control law in the long run? Why?
(A) In the short run, this would cause a shortage. There is no time to sell or convert apartments.Quantity supplied (Qs ) stays the same, but quantity demanded increases to Qd . A shortagefrom Qs to Qd exists.
(B) In the long run, the shortage would be more acute because there would be fewer incentives tobuild more apartments. Apartments would be converted to condominiums or sold for otherbusinesses. Quantity supplied would move to Q. Also, underground markets could develop,and creative apartment owners could actually charge a price of Pum .
*2. In a perfectly competitive market in long-run equilibrium, what would be the immediate resultsof imposing and enforcing a price ceiling below the equilibrium price of the product? Whatwould be the long-run effect of continuing to enforce the ceiling price, assuming undergroundmarkets don’t develop? Be sure to explain why the predicted effects will occur.A price ceiling would cause a shortage. Quantity demanded would increase and quantity suppliedwould decrease. The shortage would be greater in the long run. This is because supply and demandare both more elastic in the long run. This could also be shown by shifting the supply curveleftward in the long run.
QsQ Qd
Ceiling
D
S
Pum
Pc
Pe
Note: In the figure, Pum stands for “Price – underground market.”
* Actual free-response question from a past AP test. Reprinted by permission of the College Entrance Examination Board, the copy-right owner. For limited use by NCEE.
2 Microeconomics LONG FREE-RESPONSESAMPLE QUESTIONS
AnswerKey
UNIT

9. In a perfectly competitive market in long run equilibrium, what would be the immediate results of imposing and enforcing a price ceiling below the equilibrium price of the product? What would be the long- run effect of continuing to enforce the ceiling price, assuming underground markets don’t develop? Be sure to explain why the predicted effects will occur.
A price ceiling would cause a shortage. Quantity demanded would increase and quantity supplied would decrease. The shortage would be greater in the long run. This is because supply and demand are both more elastic in the long run. This could also be shown by shifting the supply curve leftward in the long run.
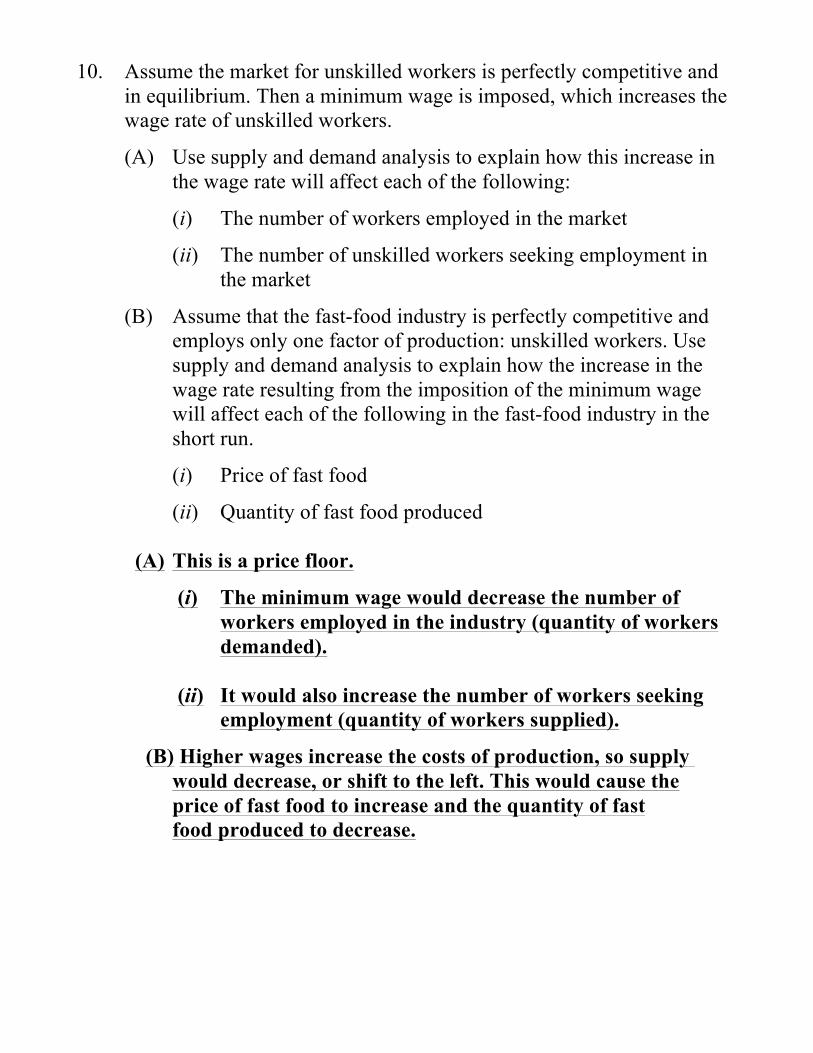
10. Assume the market for unskilled workers is perfectly competitive and in equilibrium. Then a minimum wage is imposed, which increases the wage rate of unskilled workers.
(A) Use supply and demand analysis to explain how this increase in the wage rate will affect each of the following:
(i) The number of workers employed in the market
(ii) The number of unskilled workers seeking employment in the market
(B) Assume that the fast-food industry is perfectly competitive and employs only one factor of production: unskilled workers. Use supply and demand analysis to explain how the increase in the wage rate resulting from the imposition of the minimum wage will affect each of the following in the fast-food industry in the short run.
(i) Price of fast food
(ii) Quantity of fast food produced
(A) This is a price floor.
(i) The minimum wage would decrease the number of workers employed in the industry (quantity of workers demanded). (ii) It would also increase the number of workers seeking employment (quantity of workers supplied).
(B) Higher wages increase the costs of production, so supply would decrease, or shift to the left. This would cause the price of fast food to increase and the quantity of fast food produced to decrease.

11. A consumer group believes the prices of necessities such as food, housing, energy and medical care should be controlled by the government. “People can afford higher prices for luxuries,” they reason, “but all of us, and especially the poor, suffer when the prices of necessities rise.” Evaluate the effects of this plan. This is a price ceiling and will probably cause a shortage of necessities. This, of course, will happen only if the administered controlled price is lower than the equilibrium price. This administered price will provide incentives for consumers to buy more necessities (an increase in quantity demanded) and incentives for producers to produce less (a decrease in quantity supplied). 12. State Senator John Marty feels that Minnesota can raise revenue 500 percent by increasing license plate and registration fees by 500 percent. Will the government increase its revenue by 500 percent? Why or why not? Senator Marty is wrong. The demand for license plates is inelastic but not perfectly inelastic. Therefore, a 500 percent rise in price would not yield 500 percent more revenue. There are substitutes for cars, such as carpooling and use of mass transit.

13. Recently the price of beef rose. Use graphs to show that the increase in price could be consistent with the following. (Be sure to draw a graph and provide a brief explanation for each situation.)
(A) The quantity of beef consumed falls.
A decrease in supply
(B) The quantity of beef consumed rises.
An increase in demand
(C) The quantity of beef consumed stays the same.
A perfectly inelastic demand curve, a perfectly inelastic supply curve or a simultaneous increase in demand and decrease in supply.
Advanced Placement Economics Teacher Resource Manual © National Council on Economic Education, New York, N.Y. 111
5. Recently the price of beef rose. Use graphs to show that the increase in price could be consistentwith the following. (Be sure to draw a graph and provide a brief explanation for each situation.)
(A) The quantity of beef consumed falls.
A decrease in supply
(B) The quantity of beef consumed rises.
An increase in demand
(C) The quantity of beef consumed stays the same.
A perfectly inelastic demand curve, a perfectly inelastic supply curve or a simultaneousincrease in demand and decrease in supply. Students have the most trouble with this concept.This question also illustrates that the reason for a price change is more complicated than manyarmchair economists think.
2 Microeconomics LESSON 6 ■ ACTIVITY 23AnswerKey
UNIT
QQ1
S
S1
D
P1P
QUANTITY
PRICE
Q Q1
S
D1D
P1P
QUANTITY
PRICE
Q
SS1
D
P1
P
QUANTITY
PRICE
Q
S
D1
D
P1
P
QUANTITY
PRICE
Q
S
S1
D1D
P1
P
QUANTITY
PRICE

14. You stumble across a heated debate in the cafeteria. It seems that a bunch of friends just bought concert tickets from Ticketmaster, a ticket-handling agency, and paid a $4.00 surcharge for each ticket. “It’s outrageous! It’s not like they actually do anything worth $4.00,” complains a friend. Comment on her complaint. Ticketmaster brought buyers and sellers together. If Ticketmaster didn’t provide a service, people wouldn’t pay the $4.00 fee. Evidently, both the concert promoter and the consumer are willing to pay for the service of bringing buyers and sellers together.

15. You learn that a prominent economist is going to give a lecture, and you rush to get tickets. At the lecture the economist says, “We economists don’t know much, but we know how to create shortages and surpluses.” (At this moment, the large Target Center crowd bursts into loud, raucous laugher.)
(A) How can government create a shortage in a competitive market? Illustrate this with a graph. Can you provide examples of this?
Have an administered maximum price below market equilibrium. Rent controls and price freezes are examples.
(B) How can government produce a surplus in a competitive market? Illustrate this with a graph. Can you provide examples of this? Have an administered minimum price above market equilibrium. Examples are minimum-wage laws and farm-price supports.

16. I.M. Politico, a candidate for the state legislature, is proposing a large increase in the tax on cigarettes and liquor. He says, “I’m not proposing these taxes to raise revenue but to discourage reckless drinking and the filthy smoking habit. If the prices of cigarettes and liquor go up, most people will quit using them. After all, no one needs to drink or smoke.”
(A) I.M. is wrong. (B) He assumes that demand for these products is elastic, but it is not. He therefore falsely concludes that a tax increase on cigarettes and liquor will curb their consumption a great deal. In fact, taxes on these commodities will curb their consumption very little. 17. U.R. Kool, a candidate for Congress, proposes freezing the price of gasoline. “There is no substitute for gasoline,” he says “People have to get from one place to another. Economists who say higher prices will discourage people from buying as much gas as before don’t live in the real world.”
(A) U.R. is wrong. (B) There are many methods of saving gasoline, including driving cars with smaller engines, car pooling and using public transportation. In fact, following the huge increases in price of gasoline in 1973, people conserved on the use of gas, and sales were lower than they would have been if prices had not risen. 18. Councilman Vic Acqua opposed a price increase for water during a recent drought. He claimed that there is no substitute for water. He believes an increase in the price of water (water taxes) will result in the same quantity of water used as before the price went up.
(A) Vic is wrong. (B) Demand for water is inelastic, but raising its price will curb consumption somewhat.

19. Sky King, world traveler, says if the airlines want to increase total revenue, they should lower fares for business travelers as well as for vacationers. Both groups should respond equally to a price decrease.
(A) Sky is wrong (B) He assumes that both business travelers and vacationers have an elastic demand for air travel. Business travelers’ demand for air travel is inelastic because they cannot easily postpone or give up their air travel. Vacationers con postpone their air travel, use other means of transportation or change their destination so as not to require air travel or to require less of it.