mr. graham - 2 - 6 march 2013 margaret comotto, calrecycle ... · pdf filemr. graham - 2 - 6...
TRANSCRIPT

Mr. Graham - 2 - 6 March 2013 Recology Yuba-Sutter Margaret Comotto, CalRecycle, Sacramento Scott Pardini, Recology Yuba-Sutter, Marysville Bryan Clarkson, Recology, Dixon Jim Crenshaw, California Sportfishing Protection Alliance, Woodland


Recology Yuba-Sutter Landfill, Marysville, CA Page 2 of 9 6 March 2013 On 26 September 2012 Water Board staff requested an amended ROWD since the information submitted in an Engineering Feasibility Study (EFS Report) by the Discharger in response to the 17 May 2012 letter was determined to be inadequate and outdated. On 18 October 2012 a meeting was held with Recology representatives and their consultant in Rancho Cordova to clarify and discuss the deliverables requested in Water Board staff’s 26 September 2012 letter. In the meeting Water Board staff presented a summary table of Volatile Organic Compound (VOC) detections at the landfill since November 1997 (See Attachment 1). The table depicted how the same VOCs: 1,1-dichloroethane, 1,2-dichrlorobenzene, 1,4-dichlorobenzene, acetone, benzene, chlorobenzene, cis-1,2-dichloroethene, methylene chloride, toluene, and vinyl chloride amongst others detected in the Leachate Collection and Removal System (LCRS) at Waste Management Unit (WMU) LF-3 were also being detected in groundwater monitoring wells around the three WMUs at the landfill. More, importantly detections around the unlined WMU LF-1 were significantly higher where a composting operation and an Integrated Waste Recovery Facility (IWRF) were actively operating on top of the landfill closure cover, than detections around partially lined LF-2 WMU, and fully lined LF-3 WMU. In the meeting Water Board staff reiterated their concerns that active operations above a closed landfill WMU may be contributing to degradation of water quality and that current operations above LF-1 are not in compliance with current laws and regulations pertaining to protection of water quality. On 30 November 2012 an inspection of the Recology Yuba-Sutter Landfill (Discharger) facility at 3001 N. Levee Road, Marysville was performed to view the present conditions at the site before revising the WDRs. 2. Weather Conditions: Sutter County Department of Agriculture located in Yuba City at 142 Garden Highway operates the Agriculture Weather Station which recorded 1.67 inches of rain on the day of inspection with daily temperatures ranging from 57.8 to 61.8 degrees F and an average wind velocity of 11.6 mph. The 100-year, 24-hour precipitation event at the landfill is estimated to be 5.80 inches, based on the National Oceanic and Atmospheric Administration (NOAA 2012) Atlas 14, Volume 6, Version 2. It should be noted that the expected 100-year 24-hour precipitation event is approximately 3.5 times what was actually experienced on the day of the site visit. Thus worse conditions pertaining to ponding, erosion, and runoff should be expected during a 100-year 24-hour precipitation event than what was observed on the day of inspection. 3. Site Inspection: A site inspection was performed on 30 November 2012, which included photographs and water quality sampling. On 29 November 2012 laboratory quality sampling bottles were picked up from ExcelChem, the laboratory contracted to analyze the samples. Based on the analysis to be performed the laboratory provide the proper container type, quantity of containers, and sample preservative to maintain the integrity of the sample. A YSI Incorporated Model 650MDS Data Display and Logging System with Model 600XLM-S Sondes was calibrated for pH measurements by Tasha Ditto prior to departure to the site. The data logger would be used to measure pH, temperature, Electrical Conductivity (EC), and
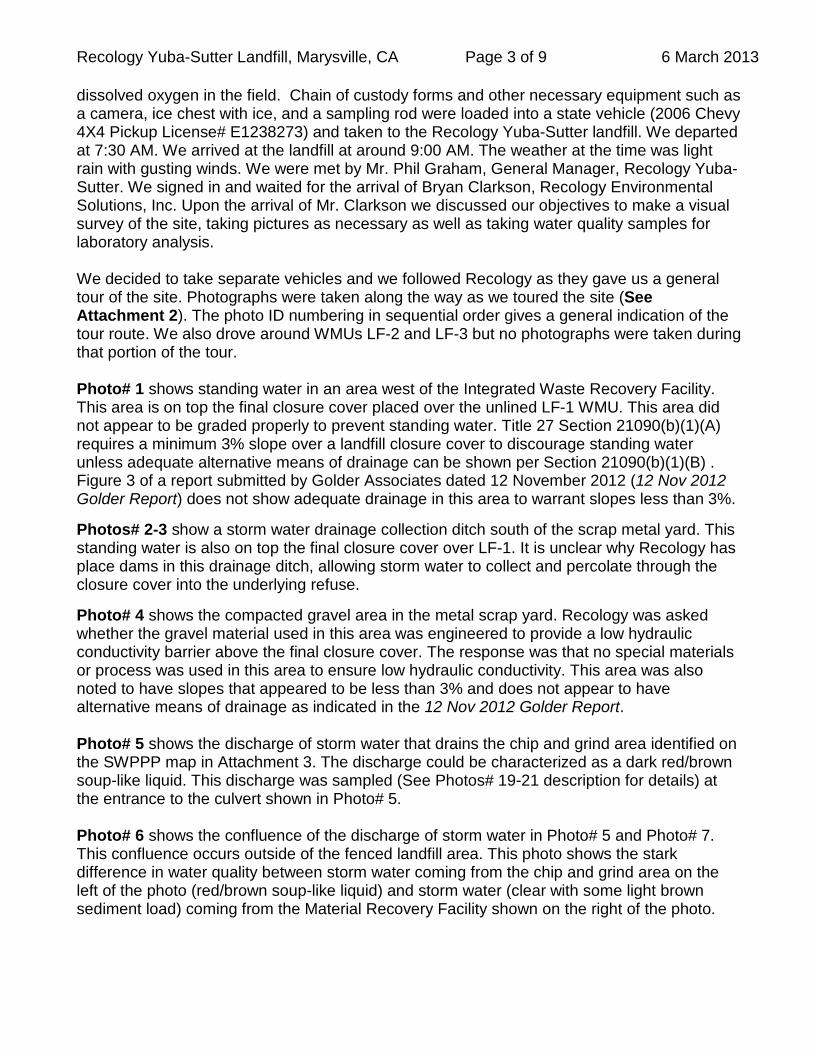
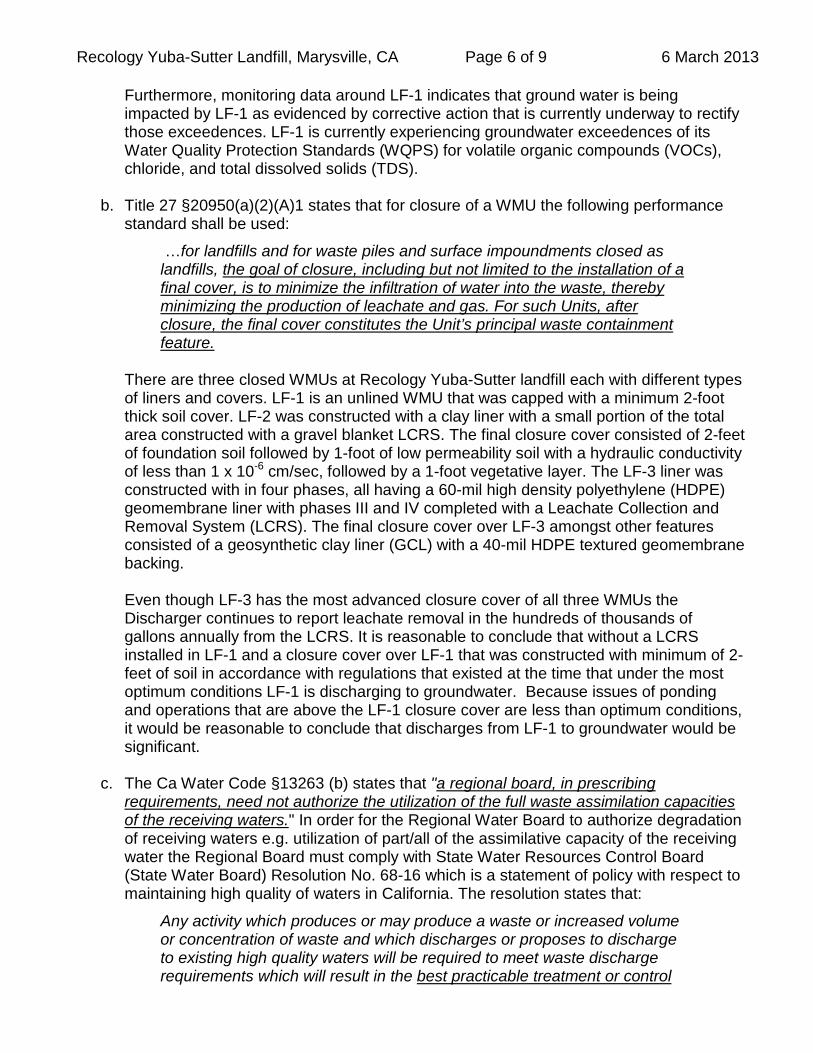
Recology Yuba-Sutter Landfill, Marysville, CA Page 3 of 9 6 March 2013 dissolved oxygen in the field. Chain of custody forms and other necessary equipment such as a camera, ice chest with ice, and a sampling rod were loaded into a state vehicle (2006 Chevy 4X4 Pickup License# E1238273) and taken to the Recology Yuba-Sutter landfill. We departed at 7:30 AM. We arrived at the landfill at around 9:00 AM. The weather at the time was light rain with gusting winds. We were met by Mr. Phil Graham, General Manager, Recology Yuba-Sutter. We signed in and waited for the arrival of Bryan Clarkson, Recology Environmental Solutions, Inc. Upon the arrival of Mr. Clarkson we discussed our objectives to make a visual survey of the site, taking pictures as necessary as well as taking water quality samples for laboratory analysis. We decided to take separate vehicles and we followed Recology as they gave us a general tour of the site. Photographs were taken along the way as we toured the site (See Attachment 2). The photo ID numbering in sequential order gives a general indication of the tour route. We also drove around WMUs LF-2 and LF-3 but no photographs were taken during that portion of the tour. Photo# 1 shows standing water in an area west of the Integrated Waste Recovery Facility. This area is on top the final closure cover placed over the unlined LF-1 WMU. This area did not appear to be graded properly to prevent standing water. Title 27 Section 21090(b)(1)(A) requires a minimum 3% slope over a landfill closure cover to discourage standing water unless adequate alternative means of drainage can be shown per Section 21090(b)(1)(B) . Figure 3 of a report submitted by Golder Associates dated 12 November 2012 (12 Nov 2012 Golder Report) does not show adequate drainage in this area to warrant slopes less than 3%. Photos# 2-3 show a storm water drainage collection ditch south of the scrap metal yard. This standing water is also on top the final closure cover over LF-1. It is unclear why Recology has place dams in this drainage ditch, allowing storm water to collect and percolate through the closure cover into the underlying refuse. Photo# 4 shows the compacted gravel area in the metal scrap yard. Recology was asked whether the gravel material used in this area was engineered to provide a low hydraulic conductivity barrier above the final closure cover. The response was that no special materials or process was used in this area to ensure low hydraulic conductivity. This area was also noted to have slopes that appeared to be less than 3% and does not appear to have alternative means of drainage as indicated in the 12 Nov 2012 Golder Report. Photo# 5 shows the discharge of storm water that drains the chip and grind area identified on the SWPPP map in Attachment 3. The discharge could be characterized as a dark red/brown soup-like liquid. This discharge was sampled (See Photos# 19-21 description for details) at the entrance to the culvert shown in Photo# 5. Photo# 6 shows the confluence of the discharge of storm water in Photo# 5 and Photo# 7. This confluence occurs outside of the fenced landfill area. This photo shows the stark difference in water quality between storm water coming from the chip and grind area on the left of the photo (red/brown soup-like liquid) and storm water (clear with some light brown sediment load) coming from the Material Recovery Facility shown on the right of the photo.

Recology Yuba-Sutter Landfill, Marysville, CA Page 4 of 9 6 March 2013 Photo# 7 is described in Photo# 6. The storm water appearance was clear with some light brown sediment load. It appeared as one would expect storm water to appear exiting an industrial facility. Photos# 8-9 show the storm water discharges shown in Photo# 6 discharging into the Storm Water Storage Pond (Also called Big Pond on the SWPPP map). This pond is located within the Yuba River flood plain. FEMA map 06115C0345D identifies this area within the 100-year flood zone. We observed that a huge diameter culvert that had connected the pond to the Yuba River flood plain had been recently removed. The Recology stated that the surface water hydraulic connection through the culvert was removed because of ongoing litigation with the California Sportfishing Protection Alliance (CSPA) over their NPDES industrial storm water permit. Photo# 10 shows the entrance to the chip and grind area. This is where the public can enter to drop off green waste. The entrance area had severe settling and ponding. Photos# 11-14 show the active composting area. Photos 12-14 were taken from the road along the LF-2 WMU looking north-westerly down the rows of composting material. The photos show ponding. Leachate from the composting piles flows away from where the pictures were taken towards Levee Road. The leachate is then directed towards the Hog Farm Area as shown on the SWPPP map. This is where it is disposed of as shown in Figure 2b of the SWPPP map. Photo# 15 shows the leachate pond at the toe of a composting pile. From this pond Sample S-1 was taken. This photo shows the decomposed state of the compost and the visible color of the leachate. Recology also took a sample of the discharge. Photos# 16-18 show composting piles that appear to be finished product. The composting material was finely chopped and dark brown to black in color. Photo# 17 shows a large leachate pond at the toe of one composting pile. Photo# 18 is a close-up of the leachate to show the color and nature of the composting leachate generated at the site. Photos# 19-21 show the vegetative swale that runs between the chip and grind area and the paved area north of the Material Recovery Facility. Photo#19 shows the quality of water coming off of the paved areas. It appeared to be typical storm water that is murky due to soil sediments (light brown in color). Photo# 20 shows the collection ditch where storm water from the paved areas passes through a vegetative filter strip and enters the collection ditch on the right of the photo. Storm water entering from the left into the ditch is drainage from the chip and grind area (dark brown in color). The photo clearly shows a visible difference in the water from the chip and grind area and the Material Recovery Facility. Sample S-2 was taken from this collection ditch. Photo# 21 shows the vegetative swale that is supposed to filter storm water from the chip and grind area prior to entrance into the collection ditch. Discharge from the collection ditch is shown in Photo# 5. Recology also took a sample of the discharge. Photos# 22-25 show the ponding of water on the paved area north of the Material Recovery Facility. Photo#22 and #24 shows how the paved surface has cracked and has been repaired in some areas.

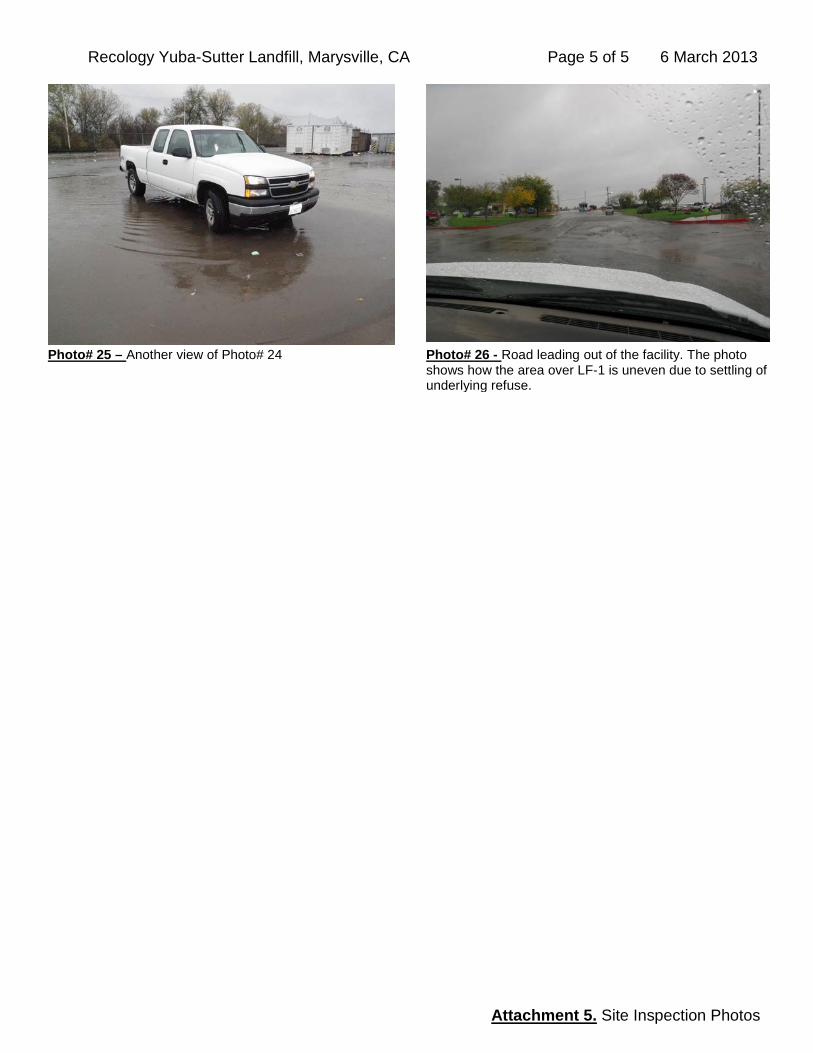
Recology Yuba-Sutter Landfill, Marysville, CA Page 5 of 9 6 March 2013 Photo# 26 shows the road leading out of the facility. The photo shows how the area over LF-1 is uneven due to settling of underlying refuse. The photo also shows mature trees growing on top of the final closure cover. It is unclear how Recology prevents the roots of the trees from penetrating the final closure cover which if not deterred provides preferred pathways for precipitation to enter the underlying refuse. Photo#26 was taken at the end of the tour. Upon completion we turned in our safety vests and exited the facility. We drove directly to ExcelChem to drop off the samples. We arrived at ExcelChem where we relinquished custody of the two samples we had taken. The chain of custody indicates that the samples were logged in at their facility at 12:37 PM. We arrived back at the Rancho Cordova office at 2:30 PM. On 6 December 2012 an email was sent to ExcelChem requesting additional analysis of the samples taken. The SIC codes ( #4953 Refuse Systems, #5093 Scrap & Waste Materials Recycling, and #4212 Local Trucking without Storage) identified in the Industrial NPDES Storm Water Permit require sampling for metals and Total Suspended Solids (TSS). Therefore, analysis of iron, lead, zinc, aluminum, and copper was requested. 4. Laboratory Results: The laboratory results for samples S-1 and S-2 are shown in Attachment 4. The results were compared against water quality objectives and criteria to protect beneficial uses in receiving waters (groundwater and surface water) as identified in the Basin Plan. The beneficial uses for ground water are municipal and domestic water supply (MUN) and agricultural supply (AGR). Some of the beneficial uses for surface water are agricultural supply (AGR), fish migration (MIGR), fish spawning (SPWN), wildlife habitat (WILD), and fresh water aquatic life (WARM and COLD). Furthermore, USEPA storm water benchmarks for multisector industrial operations were compared against the laboratory results. Laboratory results that exceeded either the Basin Plan objectives/criteria or the USEPA benchmarks were flagged in red. Objectives/Criteria or benchmarks that were exceeded were highlighted in red as well. 5. Findings:
a. LF-1 was closed prior to the revision of Ca Code Title 23, Chapter 3, Subchapter 15 Regulations on 27 November 1984. In discussions, Recology has suggested that due to LF-1’s closure prior to Title 27 regulations its closure cover is not subject to current regulatory prescriptive or performance standards. However, Title 27 §20950(a)1 states:
If a portion of a Unit was completely closed in accordance with an approved closure plan by November 27, 1984, the cover over the closed portion does not need to be modified to conform to the SWRCB's additional closure requirements in these regulations, unless monitoring data indicate impairment of beneficial uses of ground water.
The results from MW-2 have shown impairment of beneficial uses of groundwater. This impairment is indicated by the sampling analysis from MW-2, which frequently exceeding the recommended secondary Maximum Contaminant Level (MCL) of 500 mg/L for Total Dissolved Solids (TDS), and repeatedly detected benzene above the California public health goal of 0.15 ug/l, as well as methylene chloride and vinyl chloride above the USEPA MCL goal of zero.
Recology Yuba-Sutter Landfill, Marysville, CA Page 6 of 9 6 March 2013
Furthermore, monitoring data around LF-1 indicates that ground water is being impacted by LF-1 as evidenced by corrective action that is currently underway to rectify those exceedences. LF-1 is currently experiencing groundwater exceedences of its Water Quality Protection Standards (WQPS) for volatile organic compounds (VOCs), chloride, and total dissolved solids (TDS).
b. Title 27 §20950(a)(2)(A)1 states that for closure of a WMU the following performance standard shall be used:
…for landfills and for waste piles and surface impoundments closed as landfills, the goal of closure, including but not limited to the installation of a final cover, is to minimize the infiltration of water into the waste, thereby minimizing the production of leachate and gas. For such Units, after closure, the final cover constitutes the Unit’s principal waste containment feature.
There are three closed WMUs at Recology Yuba-Sutter landfill each with different types of liners and covers. LF-1 is an unlined WMU that was capped with a minimum 2-foot thick soil cover. LF-2 was constructed with a clay liner with a small portion of the total area constructed with a gravel blanket LCRS. The final closure cover consisted of 2-feet of foundation soil followed by 1-foot of low permeability soil with a hydraulic conductivity of less than 1 x 10⁻⁶ cm/sec, followed by a 1-foot vegetative layer. The LF-3 liner was constructed with in four phases, all having a 60-mil high density polyethylene (HDPE) geomembrane liner with phases III and IV completed with a Leachate Collection and Removal System (LCRS). The final closure cover over LF-3 amongst other features consisted of a geosynthetic clay liner (GCL) with a 40-mil HDPE textured geomembrane backing. Even though LF-3 has the most advanced closure cover of all three WMUs the Discharger continues to report leachate removal in the hundreds of thousands of gallons annually from the LCRS. It is reasonable to conclude that without a LCRS installed in LF-1 and a closure cover over LF-1 that was constructed with minimum of 2-feet of soil in accordance with regulations that existed at the time that under the most optimum conditions LF-1 is discharging to groundwater. Because issues of ponding and operations that are above the LF-1 closure cover are less than optimum conditions, it would be reasonable to conclude that discharges from LF-1 to groundwater would be significant.
c. The Ca Water Code §13263 (b) states that "a regional board, in prescribing requirements, need not authorize the utilization of the full waste assimilation capacities of the receiving waters." In order for the Regional Water Board to authorize degradation of receiving waters e.g. utilization of part/all of the assimilative capacity of the receiving water the Regional Board must comply with State Water Resources Control Board (State Water Board) Resolution No. 68-16 which is a statement of policy with respect to maintaining high quality of waters in California. The resolution states that:
Any activity which produces or may produce a waste or increased volume or concentration of waste and which discharges or proposes to discharge to existing high quality waters will be required to meet waste discharge requirements which will result in the best practicable treatment or control

Recology Yuba-Sutter Landfill, Marysville, CA Page 7 of 9 6 March 2013
of the discharge necessary to assure that (a) a pollution or nuisance will not occur and (b) the highest water quality consistent with maximum benefit to the people of the State will be maintained.
State Water Board Resolution No. 68-16 requires the implementation of best practicable treatment or control (BPTC) of waste or activities at LF-1 if Recology intends to continue operations above closed WMU LF-1. This includes limiting, minimizing, or eliminating activity above the final closure cover where such activities are contrary to BPTC.
d. The second point in the Basin Plan (page III-1.00) says:
The second point is that achievement of the objectives depends on applying them to controllable water quality factors. Controllable water quality factors are those actions, conditions, or circumstances resulting from human activities that may influence the quality of the waters of the State, that are subject to the authority of the State Water Board or the Regional Water Board, and that may be reasonably controlled. Controllable factors are not allowed to cause further degradation of water quality in instances where uncontrollable factors have already resulted in water quality objectives being exceeded.
Controllable factors at LF-1 include minimizing, limiting, and/or eliminating current operations above LF-1 that are causing or contributing to degradation of underlying groundwater as indicated by exceedences of water quality criteria/objectives in groundwater monitoring wells.
e. Composting operations amongst other activities currently ongoing above the final closure cover at LF-1 appear to be inconsistent with BPTC measures typically used to maintain the integrity of final closure covers over the life of the post-closure maintenance period. Regional Board staff considers the prescriptive requirements specified in §Title 27 §21090(a)4 as minimum BPTC measures required to maintain the integrity of the closure cover over the post-closure maintenance period.
Title 27 provides prescriptive standards for groundwater protection at a closed landfill. Prescriptive standards noted in the inspection to be violated include:
1. Final closure cover maximum hydraulic conductivity shall not exceed 1x10⁻⁶ cm/sec per Title 27 § 21090(a)(2). Photo# 26 shows mature trees growing on the closure cover. The roots of the trees provide preferred pathways for liquids to underlying refuse that defeats the purpose of a low hydraulic conductivity final cover.
2. Minimum 3% slope required over closed WMU to promote drainage per Title 27 § 21090(b)(1)(A). Photos# 1-4, 22-26 show areas where the closure cover grade is less than 3%.
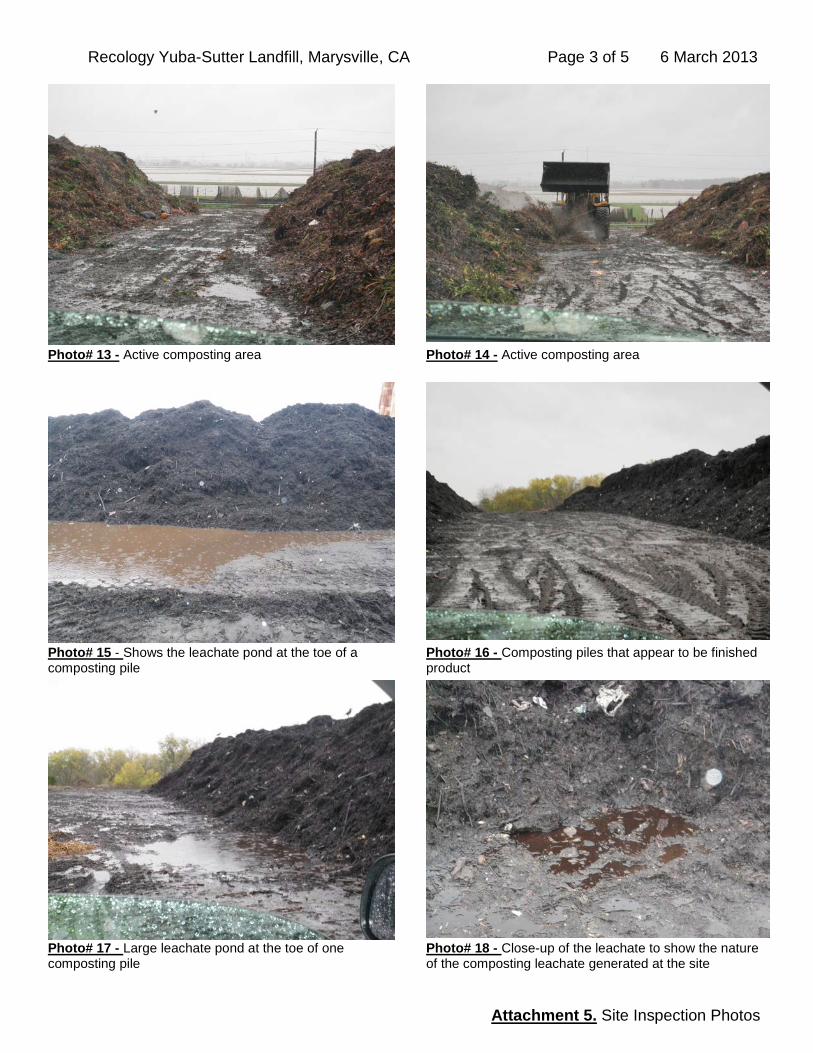
3. Waste shall not continue to be placed in a closed landfill that promotes generation of landfill gas per Title 27 §21090(a)(3)(1)(a). Photos# 13-18 and #21 shows waste that generates leachate high in TOC and COD as analyzed in Attachment 4. High TOC and COD is a waste that is desirable in digesters for methane gas production.

Recology Yuba-Sutter Landfill, Marysville, CA Page 8 of 9 6 March 2013
4. Discharges of liquid to the cover shall not exceed the moisture holding capacity of the landfill per Title 27 §21090(a)(5) and §20200(d)(3). The photographs that show ponding above the LF-1 closure cover increases the flux of liquids through the closure cover which will eventually exceed the moisture holding capacity of underlying waste, causing flows through the waste to groundwater. Evidence of this occurring is seen through higher levels of TDS and chloride in LF-1 monitoring wells MW-1 and MW-2 than in background wells MW-5 thru MW-7.
5. Designated waste shall be placed in a minimum Class II surface impoundment per Title 27 §20210. Photos# 8-9 shows an unlined pond that accepts waste with elevated levels of pollutants from the composting facility.
6. Landfill gas shall be actively removed to prevent migration of VOCs in landfill gas to groundwater per Title 27 §20917 et seq. Attachment 2 does not show landfill gas extraction wells (depicted by red dots) distributed over LF-1. Recology is currently implementing corrective action for excessive methane gas levels (exceeds 5%) in gas probe GP-14.
7. Postclosure land use at the site shall not interfere with the function of gas monitoring and control systems per Title 27 §20921(e). Attachment 2 shows numerous buildings and roadways that may interfere with the installation of a gas control system over LF-1.
8. Addition of moisture to closure cover only for dust control or irrigation of the vegetative layer per Title 27 §21090(a)(5). Photos# 13-18 show composting piles that require the addition of moisture during non-precipitation periods to facilitate composting.
9. Settling and ponding over closed landfill shall be repaired expeditiously to maintain proper drainage per Title 27 §21090(a)(4)(C) and §21090(c)(1). Photos# 1, 4, 15, 19, 23, 24-26 show ponding above the LF-1 final closure cover that has not been repaired prior to the rainy season.
f. Water Code Section 13173(b) defines designated waste as:
…waste that consists of, or contains, pollutants that, under ambient environmental conditions at a waste management unit, could be released in concentrations exceeding applicable water quality objectives or that could reasonably be expected to affect beneficial uses of the waters of the state as contained in the appropriate state water quality control plan. (See also Title 27 Section 20220(a))
Laboratory analysis of samples S-1 and S-2 shown in Attachment 4 indicates that leachate from the composting area and the chip and grind area is likely designated waste. Designated waste is required to be managed per Title 27 Section 20240 et seq. requirements for siting and design of Class II surface impoundments.
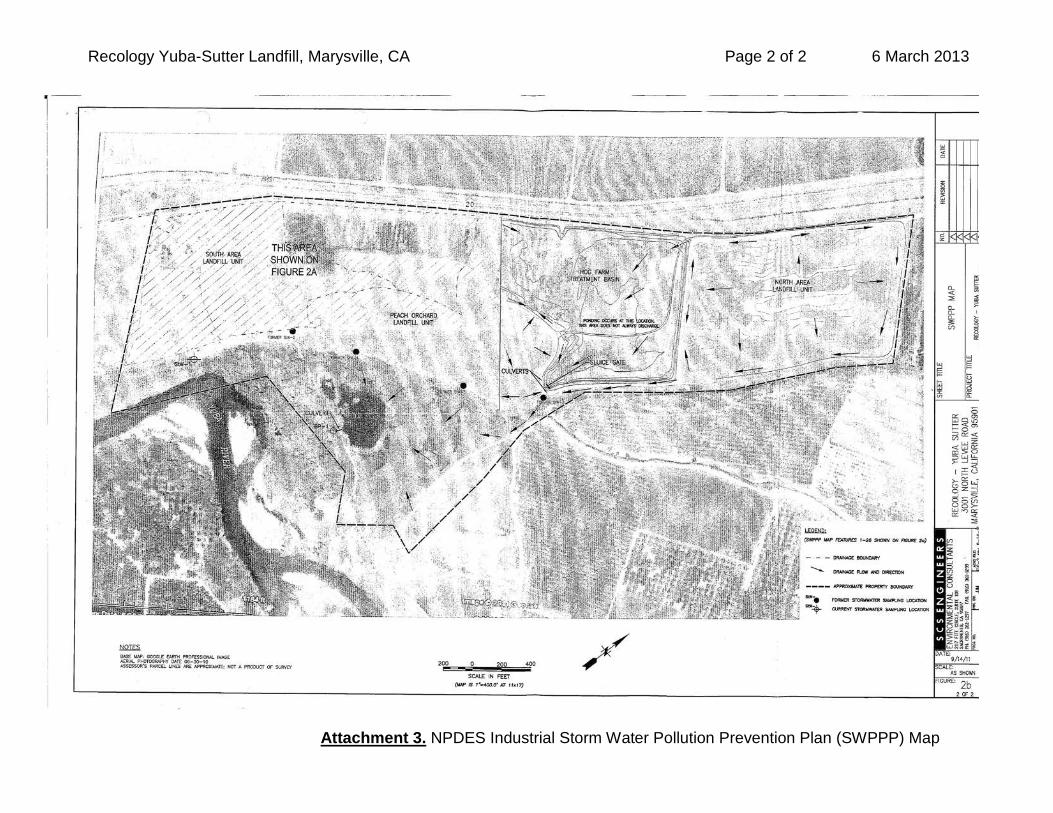
g. The discharge of leachate from the composting area is to the “Hog Farm Treatment
Basin” identified in Attachment 3. Page 2 of Attachment 3 indicates that ponding occurs within the Hog Farm area which discharges periodically to the Big Pond. Recology indicates that leachate from the composting are is currently being treated within the Hog Farm area. In order to claim treatment of the composting leachate Recology must show that leachate nutrients are being applied at agronomic rates to Hog Farm vegetation that is protective of groundwater from excessive application of nitrogen (from ammonia+nitrate+nitrite), TDS, or TOC.


Recology Yuba-Sutter Landfill, Marysville, CA Page 1 of 1 6 March 2013
Attachment 1. Historical VOC Detection Summary Table
# VOC Hits in# VOC Hits in Background # VOC Hits in LF-1 # VOC Hits in LF-2 # VOC Hits in LF-3
# VOC Hits in Surface Water Monitoring Points
LF-3 LCRS Leachate Sampling Upgradient Wells Downgradient Wells Downgradient Wells Downgradient Wells Upgradient DowngradientVOC S-2 S-3 S-4 S-5 MW-5 MW-6 MW-7 MW-1 MW-2 MW-10 MW-3 MW-4 MW-9 MW-8 MW-11 MW-12 MW-13 SW-5 SW-2 SW-3 SW-4
1,1-Dichloroethane 16 11 17 15 - - - - 11 - 1 5 1 18 - 8 - - - - -1,2,4-Trimethylbenzene 3 1 1 2 - - - - - - 2 1 - - - - - - - - -1,2-Dichlorobenzene 6 8 7 6 - - - - 28 1 4 - - - - - - - - - -1,2-Dichloroethane 7 3 11 3 - - - - 1 - - - - - - - - - - - -1,2-Dichloropropane 2 - 1 - 3 - - - - - - - - - - - - - - - -1,3,5-Trimethylbenzene 1 1 1 - - - - - - - - - - - - - - - - - -1,4-Dichlorobenzene 20 14 19 18 - - - 17 55 48 38 - - - - - 2 - - - -1,4-Dioxane 1 1 1 1 - - - - - - - - - - - - - - - - -2-Butanone 4 4 4 5 - - - 1 1 - 1 1 - - - - - - - 6 -2-Hexanone 2 2 - - - - - - - - - - - - - - - - - 1 12-Methylphenol 1 - - - - - - - - - - - - - - - - - - - -3- & 4-Methylphenol 1 1 1 1 - - - - - - - - - - - - - - - - -4-Methyl-2-pentanone 1 2 1 1 - - - - - - 1 - - - - - - - - 7 1Acetone 17 15 16 15 2 2 2 9 11 7 8 11 3 6 5 5 3 - 2 10 5Benzene 19 14 20 19 - 1 - - 30 10 5 - 1 - - - - - - 1 -Benzyl alcohol 1 1 - 1 - - - - - - - - - - - - - - - - -Bromoform - - - - - - - 1 - - - - - 1 1 - - - 1 1 1Bromomethane - - - - - - - 1 1 - - - 1 - - - - - - - -Chlorobenzene 9 10 10 10 - - - 33 37 4 22 - - - - - 1 - - - -Chloroethane 9 3 18 14 - - - - - - - - - 6 2 - - - - - -Chloroform - 1 1 2 - - - 1 1 2 2 2 1 1 3 3 2 - - - -Chloromethane - 1 1 1 - - - - 2 2 1 3 1 - 1 1 1 - 1 1 2cis-1,2-Dichloroethene 7 3 10 7 - - - 29 34 15 12 - - 13 - 1 - - - - -Dibromochloromethane - - - - - - - 1 - 1 1 - - 1 1 - - - 1 1 2Dichlorodifluoromethane - - 1 - - - - 1 - 1 - - - 2 - 1 - - - - -Diethyl phthalate 1 1 1 - - - - 1 - - 1 - - - - - - - - - -Ethanol 1 1 1 - - - - - - - - - - - - - - - - - -Ethylbenzene 12 9 13 15 - - - - - - 1 - - - - - - - - - -Iodomethane - - 1 - - - 1 - - 1 1 1 1 - 1 1 1 - 1 - 1Isobutanol 1 1 1 - - - - - - - - - - - - - - - - - -Isopropyl benzene 1 - - - - - - - - - 1 - - - - - - - - - -m/p-Xylene 1 - 1 1 - - - - - - - - - - - - - - - - -Methyl ethyl ketone 1 1 1 - - - - - - - - - - - - - - - - - -Methyl isobutyl ketone - 1 1 - - - - - - - - - - - - - - - - - -Methyl t-butyl ether 1 1 1 1 - - - - - - - - - - - 1 - - - - -Methylene chloride 3 1 6 3 2 1 1 7 5 3 5 4 1 6 2 3 1 - - 1 -Naphthalene 4 3 2 2 - - - - 6 - - - - - - - - - - - -n-Butylbenzene - 1 - - - - - - - - - - - - - - - - - - -n-Propylbenzene 1 1 1 - - - - - - - - - - - - - - - - - -o-Xylene 2 1 2 1 - - - - 1 - 1 - - - - - - - - - -p- & m-Xylenes 1 1 1 1 - - - - - - 1 - - - - - - - - - -Phenol 1 1 1 1 - - - - - - - - - - - - - - - - -sec-Butylbenzene - - - - - - - - - 3 - - - - - - - - - - -Styrene 2 4 2 2 - - - 1 1 1 1 1 - - - - - - - 1 1Tetrachloroethene 1 1 - - - - - - - - - - - - - - - - - - -Toluene 18 14 19 19 - 1 - 2 7 - 1 - - - - - - - - 9 6Total Xylenes 2 2 2 2 - - - - - - 1 - - - - - - - - - -Trichloroethene 1 1 2 1 - - - - 1 - 1 - - - - 1 - - - - -Trichlorofluoromethane - - - - - - - - - - - - - - - 1 2 - - 2 -Vinyl acetate - - 1 - - - - - 1 - - - - - - - - - - - -Vinyl chloride 12 - 16 14 - - - 20 41 - 5 - - - - 2 - - - - -Xylenes 18 14 16 17 - - - - 1 - 2 - - - - - - - - 2 -Subtotals (# VOC Hits) 212 156 233 201 7 5 4 125 276 99 120 29 10 54 16 28 13 0 6 43 20
Leachate Monitoring Total # VOC Hits= 802
Upgradient Wells Total # VOC
Hits= 16Downgradient LF-1 Total # VOC Hits= 500
Downgradient LF-2 Total # VOC Hits= 159
Downgradient LF-3 Total # VOC Hits= 111
Upgradient Surface Water
Total # VOC Hits= 0
Downgradient Surface Water
Total # VOC Hits= 69
Note: VOC hits equals # trace hits (between MDL and PQL) plus # quantifiable hits (above PQL)
Recology Yuba-Sutter Landfill, Marysville, CA Page 1 of 1 6 March 2013
Attachment 2. Photograph and Sampling Locations
1
4
2
3
5,6 7
8
9
11
10
17
12 13 14 15
16,18
19-21
22,23
24,25
26
Storm Water Storage Pond

Recology Yuba-Sutter Landfill, Marysville, CA Page 1 of 2 6 March 2013
Attachment 3. NPDES Industrial Storm Water Pollution Prevention Plan (SWPPP) Map
Attachment 2. Photograph and Sampling Locations
Recology Yuba-Sutter Landfill, Marysville, CA Page 2 of 2 6 March 2013
Attachment 3. NPDES Industrial Storm Water Pollution Prevention Plan (SWPPP) Map
Recology Yuba-Sutter Landfill, Marysville, CA Page 1 of 1 6 March 2013
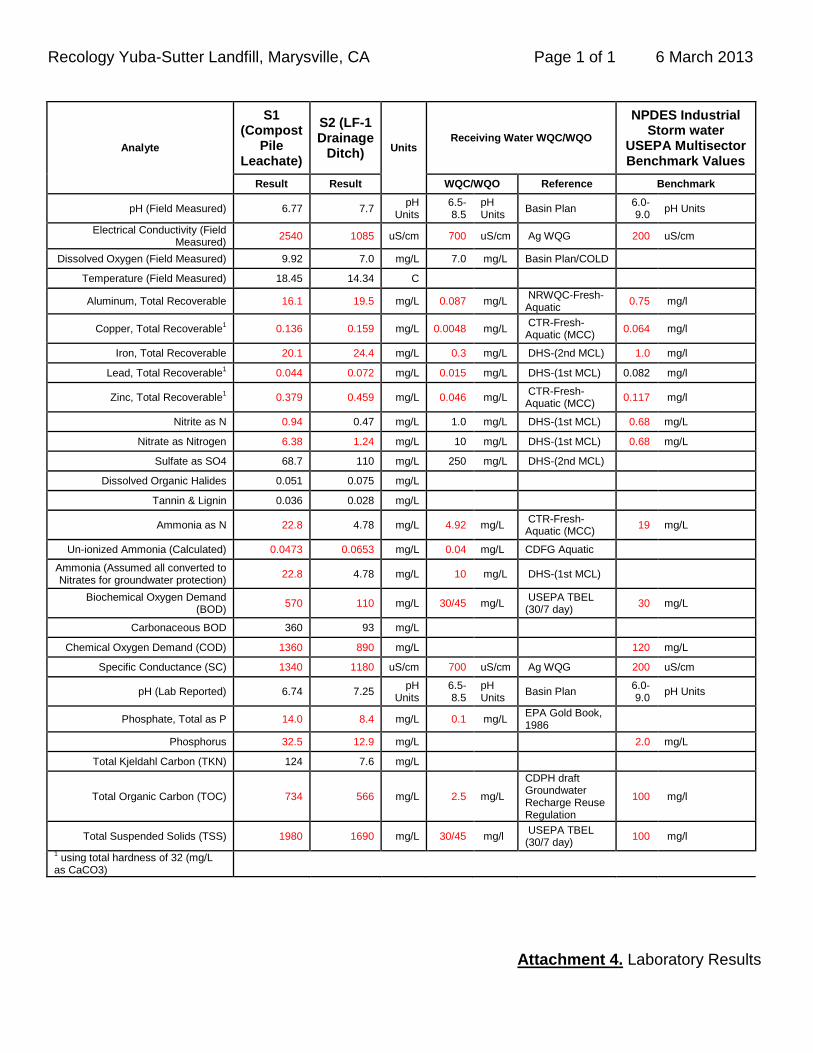
Attachment 4. Laboratory Results
Analyte
S1 (Compost
Pile Leachate)
S2 (LF-1 Drainage
Ditch) Units Receiving Water WQC/WQO
NPDES Industrial Storm water
USEPA Multisector Benchmark Values
Result Result WQC/WQO Reference Benchmark
pH (Field Measured) 6.77 7.7 pH Units
6.5-8.5
pH Units Basin Plan 6.0-
9.0 pH Units
Electrical Conductivity (Field Measured) 2540 1085 uS/cm 700 uS/cm Ag WQG 200 uS/cm
Dissolved Oxygen (Field Measured) 9.92 7.0 mg/L 7.0 mg/L Basin Plan/COLD
Temperature (Field Measured) 18.45 14.34 C
Aluminum, Total Recoverable 16.1 19.5 mg/L 0.087 mg/L NRWQC-Fresh-Aquatic 0.75 mg/l
Copper, Total Recoverable1 0.136 0.159 mg/L 0.0048 mg/L CTR-Fresh-Aquatic (MCC) 0.064 mg/l
Iron, Total Recoverable 20.1 24.4 mg/L 0.3 mg/L DHS-(2nd MCL) 1.0 mg/l
Lead, Total Recoverable1 0.044 0.072 mg/L 0.015 mg/L DHS-(1st MCL) 0.082 mg/l
Zinc, Total Recoverable1 0.379 0.459 mg/L 0.046 mg/L CTR-Fresh-Aquatic (MCC) 0.117 mg/l
Nitrite as N 0.94 0.47 mg/L 1.0 mg/L DHS-(1st MCL) 0.68 mg/L
Nitrate as Nitrogen 6.38 1.24 mg/L 10 mg/L DHS-(1st MCL) 0.68 mg/L
Sulfate as SO4 68.7 110 mg/L 250 mg/L DHS-(2nd MCL)
Dissolved Organic Halides 0.051 0.075 mg/L
Tannin & Lignin 0.036 0.028 mg/L
Ammonia as N 22.8 4.78 mg/L 4.92 mg/L CTR-Fresh-Aquatic (MCC) 19 mg/L
Un-ionized Ammonia (Calculated) 0.0473 0.0653 mg/L 0.04 mg/L CDFG Aquatic
Ammonia (Assumed all converted to Nitrates for groundwater protection) 22.8 4.78 mg/L 10 mg/L DHS-(1st MCL)
Biochemical Oxygen Demand (BOD) 570 110 mg/L 30/45 mg/L USEPA TBEL
(30/7 day) 30 mg/L
Carbonaceous BOD 360 93 mg/L
Chemical Oxygen Demand (COD) 1360 890 mg/L 120 mg/L
Specific Conductance (SC) 1340 1180 uS/cm 700 uS/cm Ag WQG 200 uS/cm
pH (Lab Reported) 6.74 7.25 pH Units
6.5-8.5
pH Units Basin Plan 6.0-
9.0 pH Units
Phosphate, Total as P 14.0 8.4 mg/L 0.1 mg/L EPA Gold Book, 1986
Phosphorus 32.5 12.9 mg/L 2.0 mg/L
Total Kjeldahl Carbon (TKN) 124 7.6 mg/L
Total Organic Carbon (TOC) 734 566 mg/L 2.5 mg/L
CDPH draft Groundwater Recharge Reuse Regulation
100 mg/l
Total Suspended Solids (TSS) 1980 1690 mg/L 30/45 mg/l USEPA TBEL (30/7 day) 100 mg/l
1 using total hardness of 32 (mg/L as CaCO3)

Recology Yuba-Sutter Landfill, Marysville, CA Page 1 of 5 6 March 2013
Attachment 5. Site Inspection Photos
Photo# 1 - Standing water in an area west of the Integrated Waste Recovery Facility (IWRF)
Photo# 2 - Storm water drainage collection ditch south of the scrap metal yard
Photo# 3 - Storm water drainage collection ditch south of the scrap metal yard
Photo# 4 - Compacted gravel area in the metal scrap yard
Photo# 5 - Discharge of storm water that drains the chip and grind area
Photo# 6 - Confluence of the discharge of storm water in Photo# 5 and Photo# 7. This confluence occurs outside of the fenced landfill area

Recology Yuba-Sutter Landfill, Marysville, CA Page 2 of 5 6 March 2013
Attachment 5. Site Inspection Photos
Photo# 7 – Same location as Photo #6. The storm water appearance was clear with some light brown sediment load
Photo# 8 - Shows storm water discharges shown in Photo# 6 discharging to Storm Water Storage Pond
Photo# 9 - Shows storm water discharges shown in Photo# 6 discharging to Storm Water Storage Pond
Photo# 10 - Entrance to the chip and grind area where the public can proceed to drop off green waste.
Photo# 11 – Road through active composting area Photo# 12 - Active composting area
Recology Yuba-Sutter Landfill, Marysville, CA Page 3 of 5 6 March 2013
Attachment 5. Site Inspection Photos
Photo# 13 - Active composting area Photo# 14 - Active composting area
Photo# 15 - Shows the leachate pond at the toe of a composting pile
Photo# 16 - Composting piles that appear to be finished product
Photo# 17 - Large leachate pond at the toe of one composting pile
Photo# 18 - Close-up of the leachate to show the nature of the composting leachate generated at the site

Recology Yuba-Sutter Landfill, Marysville, CA Page 4 of 5 6 March 2013
Attachment 5. Site Inspection Photos
Photo# 19 - Vegetative swale between chip and grind area and paved area north of Material Recovery Facility
Photo# 20 - Vegetative swale between chip and grind area and paved area north of Material Recovery Facility
Photo# 21 - Vegetative swale that is supposed to filter storm water from the chip and grind area prior to entrance into the collection ditch
Photo# 22 - Ponding of water on the paved area north of the Material Recovery Facility
Photo# 23 - Ponding of water on the paved area north of the Material Recovery Facility.
Photo# 24 - Ponding of water on the paved area north of the Material Recovery Facility.
Recology Yuba-Sutter Landfill, Marysville, CA Page 5 of 5 6 March 2013
Attachment 5. Site Inspection Photos
Photo# 25 – Another view of Photo# 24 Photo# 26 - Road leading out of the facility. The photo
shows how the area over LF-1 is uneven due to settling of underlying refuse.