mrc annual meeting december 12, 2012 welcome mrc bod election results preliminary fy2013 budget perc...
TRANSCRIPT
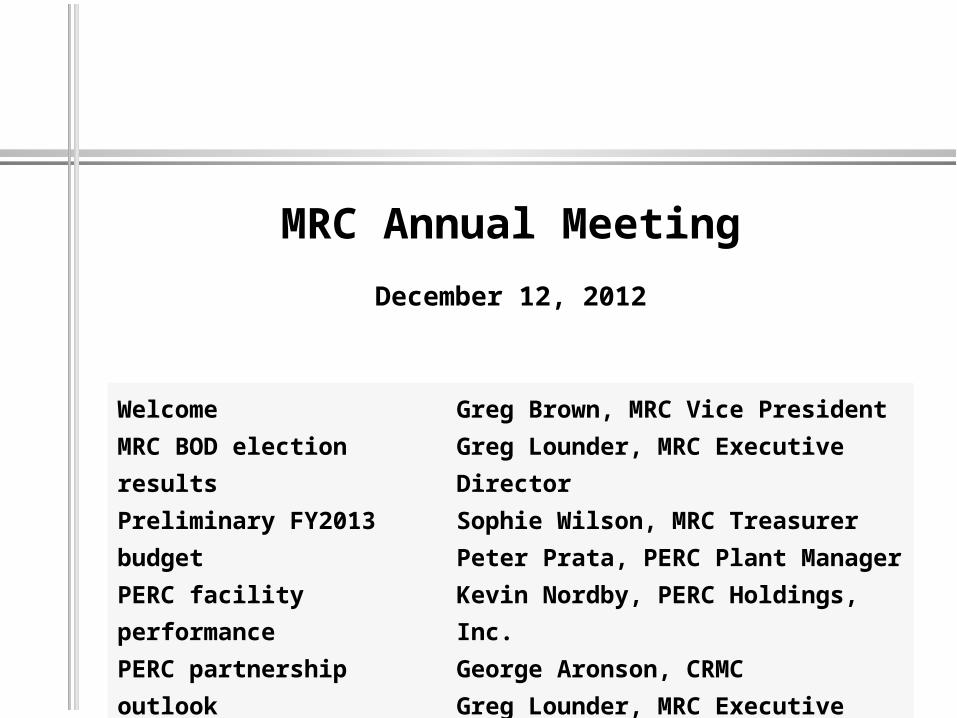
MRC Annual Meeting
December 12, 2012
WelcomeMRC BOD election resultsPreliminary FY2013 budgetPERC facility performancePERC partnership outlook MRC financial resultsKey MRC issues for 2013 and post-2018 planning
Greg Brown, MRC Vice PresidentGreg Lounder, MRC Executive DirectorSophie Wilson, MRC Treasurer Peter Prata, PERC Plant ManagerKevin Nordby, PERC Holdings, Inc.George Aronson, CRMCGreg Lounder, MRC Executive Director
Ensure affordable, long-term,
and environmentally sound
disposal of municipal solid waste
2
THE MRC MISSION:
MRC Annual Meeting, December 12, 2012

MRC Annual Meeting, December 12, 2012
3
Represent Charter Municipalities in their roles as MSW providers to and public partners in the PERC facility
• Contract compliance (Waste Disposal Agreements)• Facility technical and environmental performance; operating and
major maintenance/capital costs (Oversight Committee)• Regional solid waste markets • Legislative and regulatory activities
Manage Charter Municipality assets, including:• Limited partnership shares in PERC• Performance Credits and cash distributions from PERC• Tip Fee and Operating Budget Stabilization Funds
Prepare for MSW management after 2018
MRC Ongoing Activities

MRC Operating Budget, Calendar Year 2013, proposedMRC Annual Meeting, December 12, 2012
4
MRC PROPOSED OPERATING BUDGET for calendar year 2013FY 2012 FY 2012 Year-End FY 2013Budget Estimate Budget
REVENUES
Member dues $1.25/ton, 181,500t in 2012, 181,000t in 2013 $ 229,375 $ 229,115 $ 226,250 Post-2018 planning (budget amendment (per 9-28-12 vote) $ 90,000 $ 18,000Undesignated Fund Balance Transfer $ 64,845 $ 64,630 $ 5,100BHE Parity Deal Monitoring Agreement $ 53,600 $ 55,843 $ 55,800 Budget Stabilization Fund Transfer $ 70,000 $ 70,000 $ 175,000PERC Oversight Committee Reimbursement $ 9,700 $ 9,850 $ 9,850Legislative Advocacy/Communications Reimbursement $ 45,000 $ 22,500 TOTAL REVENUES $ 562,520 $ 469,938 $ 472,000
EXPENSES Legislative Advocacy/Communications (Preti, Eaton Peabody) $ 90,000 $ 61,000 $ 66,000 Administrative Services (Ex Dir, outside services) $ 135,000. $ 141,000 $ 145,000.Technical Consultant (CommonWealth) $ 115,520 $ 114,000 $ 119,000Legal Services (Eaton Peabody-General) $ 15,000 $ 15,000 $ 15,000 Legal Services (Eaton Peabody-Specialized) $ 45,000 $ 54,335 $ 45,000 Audits (Loiselle, Goodwin & Hinds) $ 10,500 $ 10,500 $ 11,000Insurance (General liability, D&O) $ 6,000 $ 5,313 $ 5,500Secretary of State & Misc. $ 500 $ 790 $ 500 Post-2018 Planning Contingency $ 45,000 $ 50,000 $ 55,000Contingency Fund $ 10,000 $ 10,000 Post-2018 planning (per 9-28-12 vote) $ 90,000 $ 18,000TOTAL EXPENSES $ 562,520 $ 469,938 $ 472,000
Audited Undesignated Fund Balance, December 31, 2011 $115,459 Estimated Undesignated Fund Balance, December 31, 2012 $ 50,829 Projected Undesignated Fund Balance, December 31, 2013 $ 46,229
Note: $16,000 legislative advocacy expense approved for Nov. and Dec. 2012
Note: Post- 2018 planning contingency for 2012 includes $25,000 for CommonWealth, $15,000 legal, $10,000 other

PERC Facility operating performanceMRC Annual Meeting, December 12, 2012
5
PERC 2013 Operating Budget: revenues
2013 Budget 2012 Budget VarianceMSW deliveries (tons) Charter Muni 182,000 182,000 0 Other muni 11,965 10,950 1,015 Commercial 90,098 86,768 3,330 In-state other 3,755 3,249 506 Out-of-state 16,919 17,133 (214) Total received 304,737 300,100 4,637 Total tip fee revenues $ 17,832,131 $17,182,545 $649,586 Weighted average tip fee $58.52/ton $57.26/ton $1.26/ton Power Plant Production Capacity factor 86.18% 85.90% 0.87% Full load hours 7567 7226 341 One boiler hours 713 1522 (809) Black plant hours 480 36 444 Total generation (MWh) 159,747 159,668 78,377 Total electricity revenues $24,249,762 $23,291,106 $958,656 Weighted average $/MWh $151.80/MWh $145.87/MWh $5.93/MWh

PERC Facility operating performanceMRC Annual Meeting, December 12, 2012
6
PERC 2013 Operating Budget: performance assumptions 2013 Budget 2012 Budget VarianceRDF Heat Input % 94.1% 92.7% 1.5%#2 oil heat input % 1.5% 1.5% 0.0%Wood chip heat input % 4.4% 4.9% -9.1% RDF processing yield % 79.3% 79.3% 0.0%RDF consumed Tons 241,563 237,973 3,591Ferrous processing yield % 3.0% 3.0% 0.0%Ferrous production Tons 9,142 9,003 39Glass and grit yield % 17.2% 17.2% 0.0%Glass and grit produced Tons 52,508 51,624 884 Non-processable yield % 0.5% 0.5% 0.0%Non-processables Tons 1,524 1,501 23 Non-processables grinding Tons 13,713 13,505 218Ash yield % 23.0% 23.1% 0.1%Ash produced Tons 56,662 55,948 714 Wood chip cost $/ton 7.14 17 Wood chips requirement Tons 13,793 15,170 (1,377)Wood chip expense $ 98,519 272,886 (174,366) Fuel oil cost $/gallon $ 3.75 $ 3.50 $ 0.25- Fuel oil requirement Tons 308,083 307,932 151Fuel expense $ 1,155,311 1,077,761 77,550 Lime use Tons 4,596 4,557 39Lime cost $/ton $ 204.09 $ 196.24 $ 7.85 Lime expense $ 938,030 894,173 43,857
PERC Facility CMRA projectsMRC Annual Meeting, December 12, 2012
7
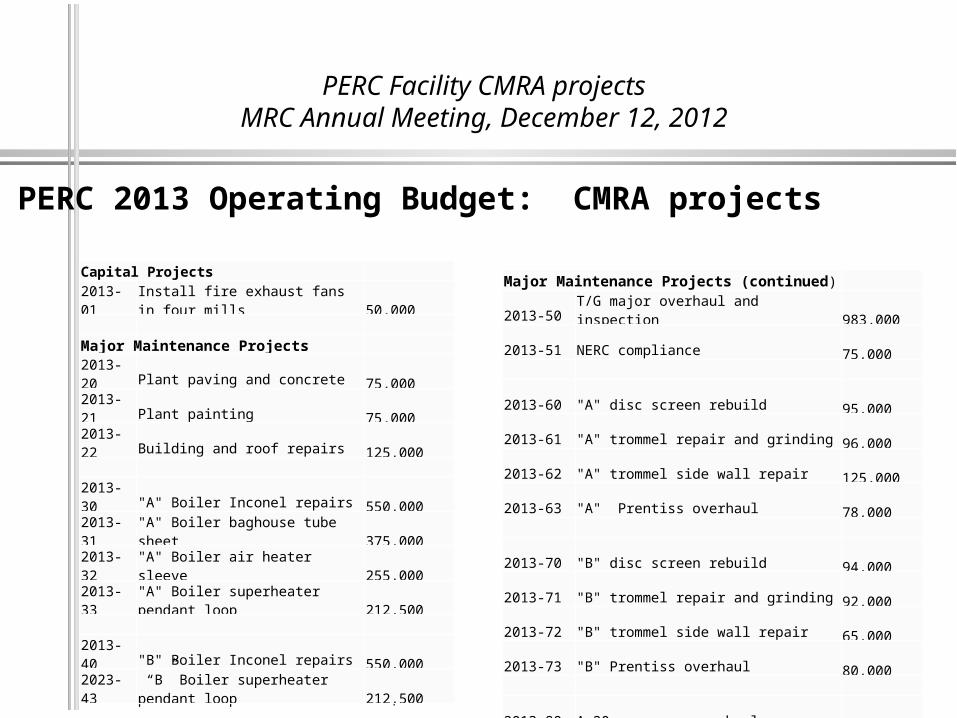
PERC 2013 Operating Budget: CMRA projects
Capital Projects
2013-01 Install fire exhaust fans in four mills 50,000
Major Maintenance Projects
2013-20 Plant paving and concrete 75,000
2013-21 Plant painting 75,000
2013-22 Building and roof repairs 125,000
2013-30 "A" Boiler Inconel repairs 550,000
2013-31 "A" Boiler baghouse tube sheet 375,000
2013-32 "A" Boiler air heater sleeve 255,000
2013-33 "A" Boiler superheater pendant loop 212,500
2013-40 "B" Boiler Inconel repairs 550,000
2023-43 “B” Boiler superheater pendant loop 212,500
Major Maintenance Projects (continued)
2013-50 T/G major overhaul and inspection 983,000
2013-51 NERC compliance 75,000
2013-60 "A" disc screen rebuild 95,000
2013-61 "A" trommel repair and grinding 96,000
2013-62 "A" trommel side wall repair 125,000
2013-63 "A" Prentiss overhaul 78,000
2013-70 "B" disc screen rebuild 94,000
2013-71 "B" trommel repair and grinding 92,000
2013-72 "B" trommel side wall repair 65,000
2013-73 "B" Prentiss overhaul 80,000
2013-80 A-20 conveyor overhaul 300,000
2013-81 A-21 conveyor overhaul 100,000
4,665,000
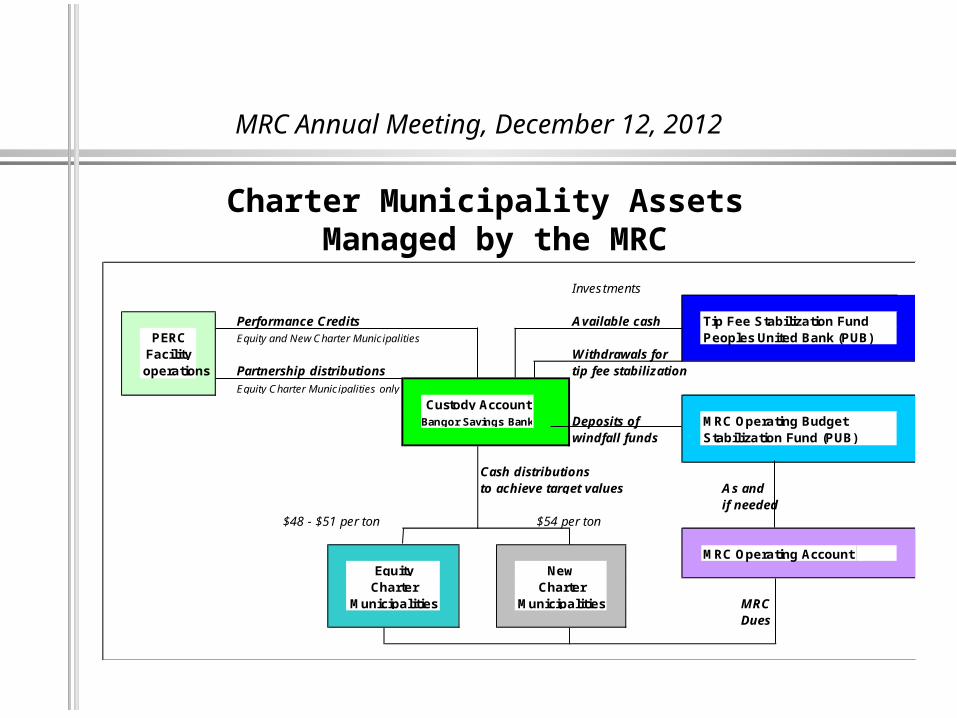
Charter Municipality Assets Managed by the MRC
8
Investments
Performance Credits Available cash Tip Fee Stabilization FundEquity and New Charter Municipalities Peoples United Bank (PUB)
Withdrawals foroperations Partnership distributions tip fee stabilization
Equity Charter Municipalities only
Deposits of MRC Operating Budgetwindfall funds
Cash distributionsto achieve target values As and
if needed$48 - $51 per ton $54 per ton
MRC Operating Account
MRCDues
Equity NewCharter Charter
Municipalities Municipalities
PERCFacility
Custody AccountBangor Savings Bank
Stabilization Fund (PUB)
MRC Annual Meeting, December 12, 2012
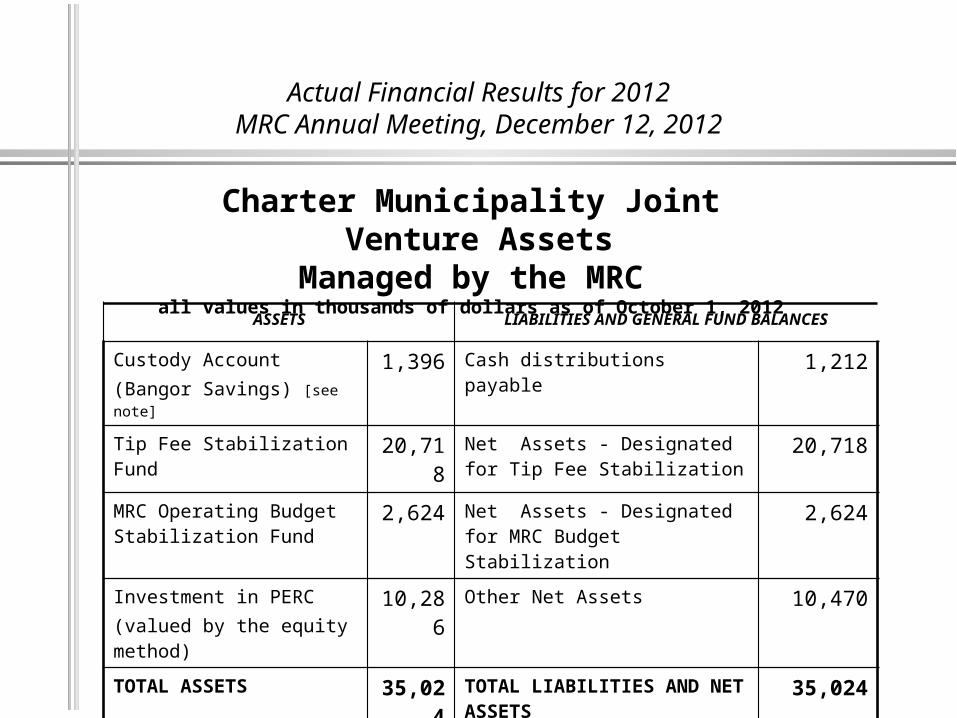
Charter Municipality Joint Venture Assets Managed by the MRC
all values in thousands of dollars as of October 1, 2012
ASSETS LIABILITIES AND GENERAL FUND BALANCES
Custody Account (Bangor Savings) [see note]
1,396 Cash distributions payable 1,212
Tip Fee Stabilization Fund 20,718 Net Assets - Designated for Tip Fee Stabilization
20,718
MRC Operating Budget Stabilization Fund
2,624 Net Assets - Designated for MRC Budget Stabilization
2,624
Investment in PERC (valued by the equity method)
10,286 Other Net Assets 10,470
TOTAL ASSETS 35,024 TOTAL LIABILITIES AND NET ASSETS
35,024
9
Actual Financial Results for 2012MRC Annual Meeting, December 12, 2012

Actual Financial Results for 2012MRC Annual Meeting, December 12, 2012
10
2012 Q1 2012 Q2 2012 Q3 2012 Q4
$-
$15
$30
$45
$60
$75
$90
$76.50 $73.00 $73.00 $74.00
$30.50 $25.00 $25.00 $26.00
$46.00 $48.00 $48.00 $48.00
Tipping Fees, Cash Rebates and Target Values, Equity Charter Municipalities, Calendar Year 2012
Tipping Fee
Average ECM Cash Rebate
Target Value
$ p
er t
on
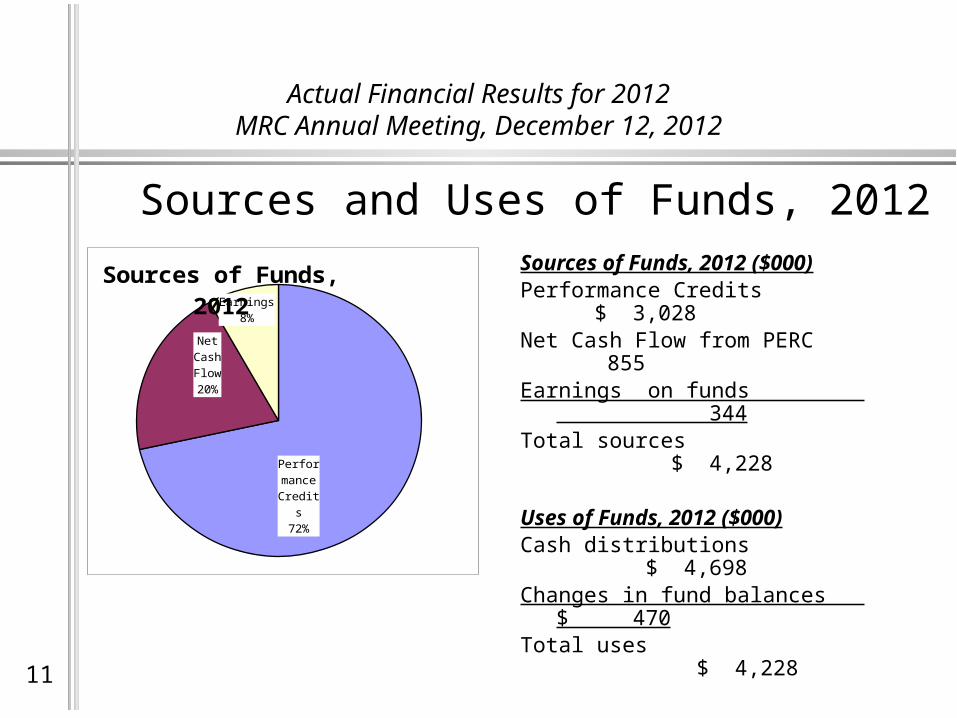
Sources and Uses of Funds, 2012Sources of Funds, 2012 ($000)Performance Credits $ 3,028Net Cash Flow from PERC 855Earnings on funds 344Total sources $ 4,228
Uses of Funds, 2012 ($000)Cash distributions $ 4,698Changes in fund balances $ 470Total uses $ 4,228
11
Actual Financial Results for 2012MRC Annual Meeting, December 12, 2012
Per-for-
mance Credits
72%
Net Cash Flow20%
Earnings8%
Sources of Funds, 2012

Actual Financial Results for 2012MRC Annual Meeting, December 13, 2012
Joint Venture Financial Highlights in 2012(Actual through December 1, 2012; projected through December 31, 2012)
· Cash distributions ($4.698 M) exceeded cash received from Performance Credits, distributions from PERC and earnings ($4.228 M)
· Raised target value on July 1, 2012, to prepare for 2018· Maintained Tip Fee Stabilization Fund at $21 million· Used reserve funds from PERC re-financing to increase
Operating Budget Stabilization Fund to $2.624 million· Distributed $48.2M to Charter Municipalities since 1998
12

Forecasted Financial Results for 2012MRC Annual Meeting, December 13, 2012
13 2013 Q1 2013 Q2 2013 Q3 2013 Q4 $-
$15
$30
$45
$60
$75 $75.18 $77.56 $77.88 $77.27
$27.18 $26.56 $26.88 $26.27
$48.00 $51.00 $51.00 $51.00
Projected Tipping Fees, Cash Rebates and Target Values,Equity Charter Municipalities, Calendar Year 2013
Tipping Fees
Average ECM Cash Rebate
Target Value
$ p
er
ton

Projected Sources and Uses of Funds, 2013
14
Forecasted Financial Results for 2013MRC Annual Meeting, December 13, 2012
Sources of Funds, 2013 ($000)Performance Credits $ 2,705Net Cash Flow from PERC 766Earnings on funds 346Subtotal $ 3,817Net fund withdrawals 910Total sources $ 4,727
Uses of Funds, 2013 ($000)Cash distributions $ 4,727
Per-for-
mance Credits
71%
Net Cash Flow20%
Earnings8%
Sources of Cash for 2013 Dis-tributions to the CMs

Target Value Increase PlanApproved by the MRC Board on 27 October 2010
First increase went into effect on 1 July 2011
MRC Annual Meeting, December 13, 2011
2010 2011 2012 2013 2014 2015 2016 2017 $40
$45
$50
$55
$60
$65
$70
Target Value IncreasesEquity Charters
New Charters
Year AddTarget value
as of 7/1
2010 $45
2011 $1 $46
2012 $2 $48
2013 $3 $51
2014 $4 $55
2015 $4 $59
2016 $4 $63
2017 $4 $67
15

MRC Annual Meeting, December 13, 2012
16Actual <= [] => Projected
2000 2001 2002 2003 2004 2005 2006 2007 2008 2009 2010 2011 2012 2013 2014 2015 2016 2017
$-
$5
$10
$15
$20
$25
$30
$35
$40
$45
$50
$55
$60
$65
$70
$75
$80
$85
$90
$95
Equity Charter Municipality Tip Fees and Cash Distributions to 2017
Promissory Note Payments
Performance Credits
Net Cash Flow
Fund withdrawals
Stabilized tip fee
$ p
er t
on

MRC Annual Meeting, December 13, 2012
17
-
5,000
10,000
15,000
20,000
25,000
Stabilization Fund Closing Balance
Tho
usan
ds o
f do
llars

Challenges for 2012 and beyondMRC Annual Meeting, December 13, 2012
18
2002 2003 2004 2005 2006 2007 2008 2009 2010 2011 2012 150,000
160,000
170,000
180,000
190,000
200,000
210,000
Charter Municipality Deliveries of MSW to the PERC Facility
Tons
per
yea
r
Deliveries continued to decline in 2012
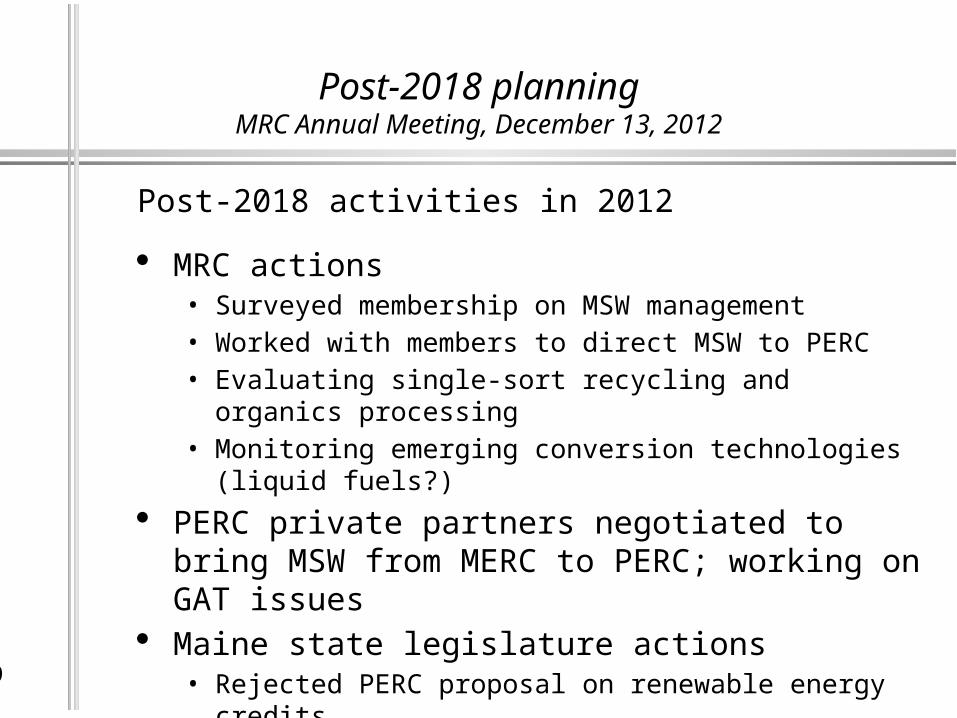
Post-2018 activities in 2012
· MRC actions• Surveyed membership on MSW management• Worked with members to direct MSW to PERC• Evaluating single-sort recycling and organics processing • Monitoring emerging conversion technologies (liquid fuels?)
· PERC private partners negotiated to bring MSW from MERC to PERC; working on GAT issues
· Maine state legislature actions• Rejected PERC proposal on renewable energy credits• Allowed new expansions of commercial landfills
Post-2018 planningMRC Annual Meeting, December 13, 2012
19

Post-2018 activities in 2012: findings
· The PERC partnership: still the preferred disposal option for 2018 and beyond
· MSW management: less MSW is better all-around, but PERC needs a steady MSW supply
· Economics: the affordability of PERC tip fees after 2018 is a key concern
· Options: the MRC is investigating contingency plans in the event PERC might not be affordable
Post-2018 planningMRC Annual Meeting, December 13, 2012
20

Post-2018 activities in 2013
· PERC will get more Maine MSW after MERC closes· MRC will intervene in the DEP review of the permit
application to allow MSW into Juniper Ridge LF· MRC is monitoring closely:
• Charter Muni post-2018 disposal needs after enhanced MSW reduction, recycling and composting
• Cost for MSW collection, transfer and transportation
· MRC is formulating contingency plans to advance the MRC mission beyond 2018
Post-2018 planningMRC Annual Meeting, December 13, 2012
21