mrf operational assessment and optimization guide · mrf operational assessment final report and...
TRANSCRIPT
MATERIALS RECOVERY FACILITIESOPERATIONAL ASSESSMENT FINAL REPORT
AND OPTIMIZATION GUIDE
Prepared For
Minnesota Office of Environmental Assistance520 Lafayette Road NorthSt. Paul, Minnesota 55155
Prepared By
Tim Goodman & Associates2337 Texas Avenue South
St. Louis Park, Minnesota 55426
August 11, 2003

MRF Operational Assessment Final Report and Optimization Guide
Tim Goodman & Associates | August 2003 i
ACKNOWLEDGEMENTS
This document has been written for materials recovery facility (MRF) owners and operators whowant to improve operating efficiencies at their facilities. The project manager and primaryauthor of this guide is Tim Goodman of Tim Goodman & Associates. The following individualsprovided comments and suggestions:
• Mr. Richard Andre, Minnesota Office of Environmental Assistance• Mr. Bob Meier, Minnesota Office of Environmental Assistance• Ms. Tina Patton, Minnesota Office of Environmental Assistance• Mr. Sigurd Scheurle, Minnesota Office of Environmental Assistance• Ms. Laura Blackadar, Earth Tech Canada, Inc.
This manual could not have been completed without the participation of the MRFowners/operators who participated in earlier phases of the project. To maintain theconfidentiality of the data received from the managers and operators of those MRFs, individualscannot be specifically credited. To those individuals a special thanks goes out and it is hoped theresults of the project will be of benefit to them and other facilities throughout the state and acrossthe country.

MRF Operational Assessment Final Report and Optimization Guide
Tim Goodman & Associates | August 2003 ii
TABLE OF CONTENTS
1.0 INTRODUCTION.........................................................................................................1
2.0 SUMMARY OF COMPLETED MRF ASSESSMENTS.............................................22.1 GENERAL FACILITY DESCRIPTIONS AND COMPARISONS......................................22.2 COST REDUCTION AND REVENUE ENHANCEMENT EXAMPLES...........................11
2.2.1 Facility A ................................................................................................122.2.2 Facility B.................................................................................................132.2.3 Facility C ................................................................................................152.2.4 Facility D ................................................................................................162.2.5 Facility E.................................................................................................17
3.0 OPTIMIZING EFFICIENCIES IN MRF DESIGN AND OPERATIONS...............193.1 LOCATION, SITE CHARACTERISTICS, AND DESIGN EFFICIENCY
CONSIDERATIONS ............................................................................................... 203.2 MATERIALS RECEIVING AND STORAGE .............................................................243.3 MATERIALS SORTING CONSIDERATIONS............................................................26
3.3.1 Manual Sorting of Materials..................................................................263.3.2 Mechanical Sorting of Materials............................................................30
3.4 MATERIALS BALING...........................................................................................323.5 GLASS RECOVERY AND PROCESSING .................................................................343.6 PRODUCT STORAGE, TRANSPORTATION, AND MARKETING...............................35
4.0 HEALTH AND SAFETY CONSIDERATIONS........................................................39
5.0 CONCLUSION............................................................................................................41
MRF Operational Assessment Final Report and Optimization Guide
Tim Goodman & Associates | August 2003 1
1.0 INTRODUCTION
The purpose and intent of this guide is to help those Minnesota counties, cities and businessesthat own/operate materials recovery facilities (MRFs) to evaluate their operations and to instituteBest Management Practices (BMPs) that will improve processing efficiencies, reduce operatingcosts, and increase the revenues these facilities receive for the materials they recover. In light ofrecent budget deficits and the reduction in the SCORE funds the state distributes to county wastereduction and recycling programs it is anticipated that this guide could help publicly ownedMRFs, especially those in greater Minnesota, in adapting to lower levels of state funding.
Earlier phases of the overall MRF optimization project focused on improving the operations ofspecific MRFs across the state. To accomplish this, the Minnesota Office of EnvironmentalAssistance (MOEA) provided a grant to fund a portion of each specific MRF assessmentconducted. The participants also contributed toward the assessments either monetarily orthrough a combination of a monetary contribution and in-kind labor.
Prior to starting the optimization project the focus was expanded to cover preliminary designwork for public entities that expressed interest in constructing new MRF’s that would capturerecyclables from the mixed municipal solid waste stream. These types of facilities are alsoreferred to as front-end processing facilities or “dirty MRFs”. Including them in this projectallows for processing efficiencies to be designed into a MRF from the beginning rather thanmaking such modifications after the facility was constructed and in operation.
Ultimately seven (7) public entities participated in the study. Four of these are existing MRF’s(all in greater Minnesota), one is a recyclables consolidation facility (e.g., limited sorting andprocessing of materials prior to delivery to market), and two participants are planning new, dirtyMRFs to capture recyclables in the mixed municipal solid waste (MSW) stream. Eachparticipating entity received a report specific to their facility as to the efficiency improvementsthat could be made to the current operations or the design of a new facility.
The results of these assessments are summarized in Section 2.0. To maintain the confidentialityof the facilities the summarized data conceals the identity of each but provides insight into whatwas found in the individual MRF assessments. Section 3.0 takes the findings of the individualassessments, as well as other documented BMPs from other MRFs and industry sources, and laysout the concepts and practices that contribute to improved processing efficiencies, reducedoperating costs, and increased revenues from the sale of recovered materials. Though notapplicable to all situations most MRFs using this guide should find useful ideas and practicesthat will help improve their overall operations.

MRF Operational Assessment Final Report and Optimization Guide
Tim Goodman & Associates | August 2003 2
2.0 SUMMARY OF COMPLETED MRF ASSESSMENTS
2.1 GENERAL FACILITY DESCRIPTIONS AND COMPARISONS
The five existing facilities participating in this study had annual recovery amounts ranging fromapproximately 2,000 tons of materials up to approximately 6,300 tons of materials. All arepublicly owned facilities. Table 2.1 summarizes the general facility characteristics of the fiveexisting facilities.
Table 2.1General Facility Characteristics
Existing Facilities ReviewedPhysical &Operational
Characteristics A B C D ERecoveredTons/Yr.1
1,950 2,070 4,350 5,260 6,315
Type/Percent ofMaterial Recovered
Fibers (74%)Containers (26%)
Fibers (97%)Containers (3%)
Fibers (71%)Containers (29%)
Fibers (80%)Containers (20%)
Fibers (91%)Containers (9%)
Ownership Public Public Public Public PublicOperation DAC2 Public Public Private/DAC3 DACOperating Schedule 1 Shift
5 Days/WeekI Shift
5 Days/Week1 Shift
5 Days/Week1 Shift
5 ½ Days/Week1 Shift
5 ½ Days/WeekNumber and Typeof Sort Lines
Two- Fibers
- Containers
Two- Fibers
- Containers
One- Fibers &Containers
One- Containers
One- Fibers
Operating Staff - Sorters (8 – 10)- Equipment Operators (2)
- Sorters & Equipment Operators (5)
- Sorters (5)- Equipment Operators (3)
- Sorters (7 – 9)- Equipment Operators (3)
- Sorters (10 – 15)- Equipment Operators (4)
No. of LoadingDocks
Four Two Six4 Three5 Five
Type and Numberof Balers
Horizontal (2)Vertical (1)
Vertical (7)6 Horizontal (2) Horizontal (1)Vertical (1)
Horizontal (2)
Other NotableProcessingEquipment
- Hydraulic Lifts for Gaylords (3)- Glass Crusher- Magnetic Head Pulley- Plastics Granulator
- Can Crusher- Hydraulic Lifts for Gaylords (2)
- Overhead Magnet on Sort Line
- Overhead Magnet on Sort Line- Below Grade Compactor for MSW Transfer
- Glass Crusher- Magnetic Head Pulley- Hydraulic Lift for Gaylords
1 Tonnage data for Facilities A and B are for FY 2002. Tonnage data for Facilities C, D & E are for FY 2001.2 DAC stands for Developmental Achievement Center. These centers typically employ and provide training formentally and/or physically challenged individuals.3 A private contractor is responsible for the facility operation. The contractor’s employees are responsible foroperating baling equipment and rolling stock (forklifts, front-end loaders, etc.). The contractor utilizes individualsfrom the local DAC for sorting materials.4 Four of the loading docks are in the MRF. The other two loading docks are in an attached building used for thelocal household hazardous waste program. These latter two loading docks, however, are occasionally used forshipping materials to markets.5 Two of the three loading docks are outside and not enclosed.6 Though all seven of the vertical balers are owned by the facility, five of them are located off-site in buildingsserviced by this facility.

MRF Operational Assessment Final Report and Optimization Guide
Tim Goodman & Associates | August 2003 3
Facility A was constructed in 1989 at a cost of approximately $1.0 million. Materials acceptedfor recycling include old corrugated containers (OCC), old newsprint (ONP), office paper, otherfiber, glass containers, steel cans, aluminum cans, and HDPE and PET plastic containers.Approximately 48% of the materials recovered in 2002 were ONP with all fiber types making upapproximately 74% of the recovered materials.
Materials are delivered to the facility from five (5) residential curbside collection programs aswell as from fifteen (15) drop-off sites scattered throughout the service area. In addition to theresidential curbside collection programs and drop-off sites a pilot program for approximately 100businesses and schools has been implemented.
Operation of the MRF is contracted to a local Developmental Achievement Center (DAC) whichprovides training and employment to mentally challenged individuals. The DAC provides 8 to10 sorters as well as two staff members who operate equipment and supervise the sorters.
Materials delivered to the facility are unloaded from the vehicles into Gaylords. OCC is taken toa designated area where it is baled in a vertical baler. Other fibers are taken to a fiber sortingline where various grades of paper are pulled from the line while the ONP is negatively sortedinto a dedicated baler. Food and beverage containers delivered to the facility arrive in twostreams – metals/glass and plastic containers. Each of these streams is sorted separately on acontainers line. The metals/glass stream is sorted into aluminum cans, steel cans, and threecolors of glass. Plastic containers are sorted into PET, pigmented HDPE, natural HDPE, andPVC. Plastic film and other contaminants are negatively sorted by falling off the end of thesorting conveyor into a bin.
Once sorted all materials are further processed prior to shipment to market. As noted previously,OCC is baled in a dedicated vertical baler and ONP is baled in a dedicated horizontal baler.Fibers, aluminum, steel, PET, and pigmented HDPE are also baled. A second horizontal baler isused for baling these materials. The color-separated glass is crushed and loaded into roll-offcontainers. Natural HDPE is granulated and put into Gaylords for shipment to market. Amagnetic head pulley is used to do a final cleanup on the sorted aluminum prior to baling. Thesorting lines and the multi-material horizontal baler each have their own hydraulic lifts to feedGaylords of materials onto the line or into the baler’s infeed conveyor hopper.
The owner/operator of Facility B refers to their operation as a “consolidation” facility rather thanas a MRF although for purposes of this report it is considered a MRF. They do very littleprocessing of materials and most of the day-to-day operations involve consolidating likematerials into cages or Gaylords and shipping these as is to their market. Only OCC andoccasionally shredded office paper are baled prior to shipment. Materials handled at the facilityinclude OCC, office paper, mixed paper, glass containers, metal containers (both aluminum andsteel), and HDPE and PET containers. Facility operations are performed by in-house staff (nocontract labor or DAC labor).
OCC delivered to the facility is usually segregated from other fibers and is baled in one of thetwo vertical balers at the facility. Some OCC is delivered already baled, as there are five othervertical balers located at buildings serviced by the facility. A significant amount of the officepaper delivered to the facility is also segregated and is either set aside for shipment or may be
MRF Operational Assessment Final Report and Optimization Guide
Tim Goodman & Associates | August 2003 4
run across the fibers line for a quick clean up. Mixed paper, also in significant amounts, isgenerally run across the fibers line and may go through a quick sort to pull out obviouscontaminants if the facility is going to sell it as a mixed paper grade or go through a moreextensive sort if the idea is to upgrade this material to a ledger grade.
Other types and grades of fiber are also received and sorted at the facility including telephonebooks, hardcover books, and soft-cover books. Depending on the source of the fiber delivered tothe facility some of this material is categorized as confidential paper (CP). In this case, thedesignated loads are immediately taken to an area of the facility where the CP is emptied into aGaylord utilizing a hydraulic lift mechanism. This Gaylord is then sealed prior to delivery tomarket. Once delivered to the market it is directly fed into a paper pulping vat. All fibersincluding the OCC are sold to the same paper market.
Containers (aluminum cans, steel cans, glass containers, and PET and HDPE plastic containers)are delivered to the facility mixed together. A specially designed and constructed containersorting line was being used to separate these materials into four separate streams (glass, plastics,aluminum, and steel) but due to the low volumes of these materials received, as well as the costof separating the mixed containers, the sorting line is no longer used. Instead, these materials arenow transferred from the two-wheeled carts they are collected in to larger four-wheeled carts.Once a number of these larger carts are filled a call is made to the facility’s solid waste haulerand they send a truck to pickup these materials and deliver them to their MRF for sorting,processing, and marketing.
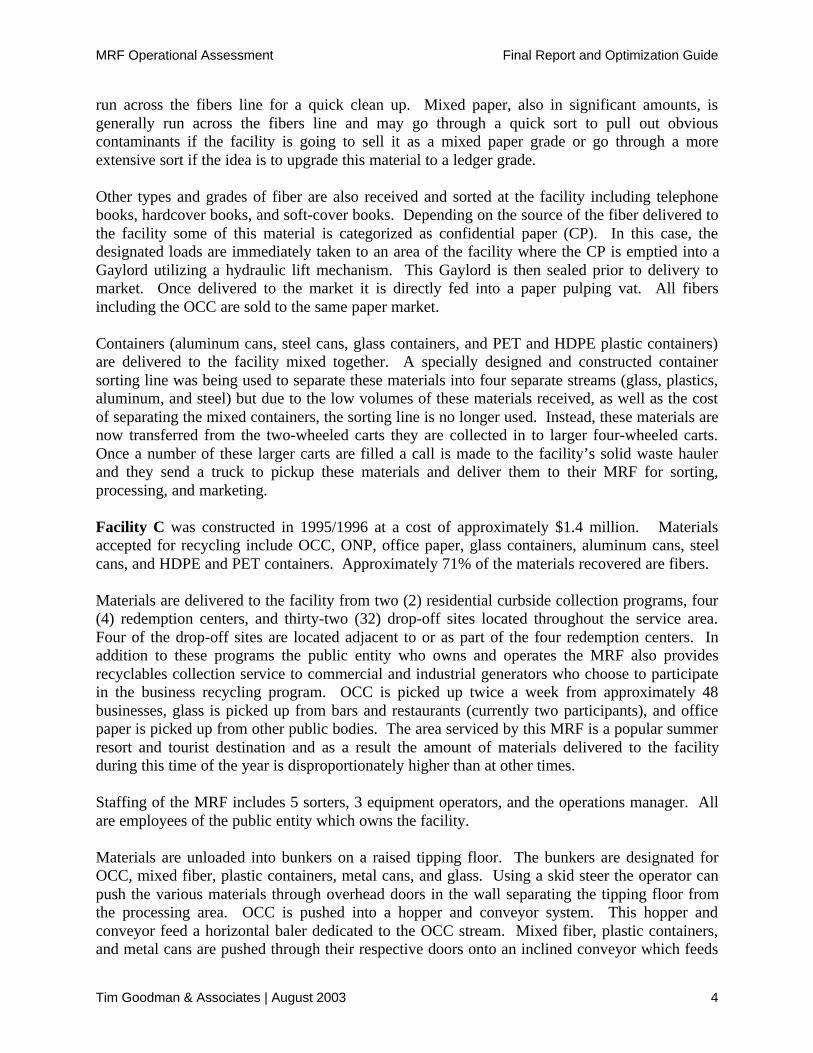
Facility C was constructed in 1995/1996 at a cost of approximately $1.4 million. Materialsaccepted for recycling include OCC, ONP, office paper, glass containers, aluminum cans, steelcans, and HDPE and PET containers. Approximately 71% of the materials recovered are fibers.
Materials are delivered to the facility from two (2) residential curbside collection programs, four(4) redemption centers, and thirty-two (32) drop-off sites located throughout the service area.Four of the drop-off sites are located adjacent to or as part of the four redemption centers. Inaddition to these programs the public entity who owns and operates the MRF also providesrecyclables collection service to commercial and industrial generators who choose to participatein the business recycling program. OCC is picked up twice a week from approximately 48businesses, glass is picked up from bars and restaurants (currently two participants), and officepaper is picked up from other public bodies. The area serviced by this MRF is a popular summerresort and tourist destination and as a result the amount of materials delivered to the facilityduring this time of the year is disproportionately higher than at other times.
Staffing of the MRF includes 5 sorters, 3 equipment operators, and the operations manager. Allare employees of the public entity which owns the facility.
Materials are unloaded into bunkers on a raised tipping floor. The bunkers are designated forOCC, mixed fiber, plastic containers, metal cans, and glass. Using a skid steer the operator canpush the various materials through overhead doors in the wall separating the tipping floor fromthe processing area. OCC is pushed into a hopper and conveyor system. This hopper andconveyor feed a horizontal baler dedicated to the OCC stream. Mixed fiber, plastic containers,and metal cans are pushed through their respective doors onto an inclined conveyor which feeds
MRF Operational Assessment Final Report and Optimization Guide
Tim Goodman & Associates | August 2003 5
a transfer conveyor which transfers these materials onto an elevated sorting line. These streams(mixed fiber, plastic containers and metal cans) are processed separately so that when one type ofmaterial is being sorted the overhead doors for the other two types of materials are closed.
Materials are sorted manually except for steel cans which are recovered by an overhead magnetlocated toward the end of the sorting line. Sorted materials are thrown down chutes to cages andbins located directly below the sorting line. Each stream has one material that is negativelysorted and feeds directly into a second horizontal baler at the end of the sorting line. For themixed fiber stream, the plastic containers stream, and the metal cans stream these materials areONP, HDPE containers, and aluminum cans, respectively. A gate at the end of the sorting lineprior to the infeed hopper of the baler can be activated to divert these materials to cages belowthe line.
Once sufficient quantities of caged materials become available these are dumped into a hopperand inclined conveyor system that feeds the multi-material horizontal baler from the oppositeend of this unit. This is typically how office paper, PET plastic containers, steel cans, and othersorted materials are baled.
Glass containers are pushed from the bunkers on the tipping floor into a separate hopper andinclined conveyor system that travels out one wall of the MRF and dumps these materials into aroll-off box located outside of the building. This material is used locally as a roadbed aggregateand for other similar uses.
Facility D was constructed in 1991 at a cost of approximately $700,000. Originally designed asboth a MRF and a MSW transfer station it now serves exclusively as a MRF to the localcommunity. Materials accepted for recycling include OCC, ONP, magazines, glass containers,steel cans, aluminum cans, and HDPE and PET plastic containers. A textile recycling programhas been started recently although current amounts of textiles recovered is estimated to beapproximately one to two tons annually. Approximately 80% of the materials recovered arefibers.
Materials delivered to the facility come from seven (7) residential curbside collection programsand a system of thirty-three (33) drop-off sites dispersed throughout the service area. A smallamount of recyclables (primarily OCC) is purchased from area haulers who service commercialaccounts.
Much like Facility C, the area serviced by this MRF is a popular summer resort and touristdestination and as a result the amount of materials delivered to the facility during this time of theyear is disproportionately higher than at other times. Additionally, the main transportationcorridor linking this region to the Minneapolis/St. Paul metro area is seeing a large amount ofgrowth. As a result, the population in this portion of the MRF’s service area is growing which inturn is increasing the amount of both MSW and recyclables generated along this corridor.
MRF operation is contracted out to a private company who staffs the facility with a combinationof company employees (approximately 3 for the MRF operation) along with seven to nineindividuals from the local DAC. Company employees are responsible for operating baling
MRF Operational Assessment Final Report and Optimization Guide
Tim Goodman & Associates | August 2003 6
equipment and rolling stock (forklift, front-end loaders, etc.) while the DAC employees areresponsible primarily for sorting materials.
Recyclable materials delivered to the facility are dumped in one of three areas on a raised tippingfloor. These include a corner of the tipping floor designated for mixed fiber, a bunker for OCC,and a bunker for mixed containers. The OCC bunker contains an overhead door where thematerial is pushed into the processing area falling onto an inclined conveyor feeding the facilitiesonly horizontal baler. Once OCC is cleaned out of the bunker, the stockpiled mixed fiber ispushed into the bunker and through the overhead doors where it also falls onto the baler’sinclined, infeed conveyor.
Mixed containers are pushed into a feed chute located in the mixed containers bunker. The feedchute empties these materials onto a sorting conveyor the other side of the wall in the processingarea where the material is manually sorted into a variety of material streams. The onlymechanization on the sorting line is an overhead magnet which pulls the steel cans off the lineand deposits them in a bin. Glass is hand-sorted by color (clear and amber) with green andmixed broken glass falling off the end of the line. Once sufficient quantities of specific materialsare accumulated (i.e., aluminum, steel cans, HDPE, PET, etc.) these materials are dumped intothe side of the inclined, infeed conveyor and baled.
A vertical baler sitting in one corner of the facility is dedicated to textiles. Additionally, thebelow grade compactor that was being utilized for the MSW transfer station operation will beused in the future for compacting either OCC or mixed fiber for delivery to market thus freeingup some tipping floor space as well as time the horizontal baler can be used for other materials.
Materials accepted for recycling at Facility E include OCC, ONP, magazines, office paper, othermixed paper, aluminum cans, steel cans, glass containers, and HDPE and PET plastic containers.Approximately 91% of the materials recovered in 2002 were various grades of fibers.
Materials processed at the MRF come from two (2) residential curbside collection programs aswell as a series of drop-off sites dispersed around the service area. Some recyclables comingfrom commercial sources are delivered to the MRF from private haulers. Operation of the MRFis contracted to a local DAC. The DAC provides 10 to 15 sorters as well as three equipmentoperators and a MRF manager.
Upon delivery of materials OCC is taken directly to a dedicated baler where it is dumped on thefloor. Using a skid-steer these materials are pushed onto an inclined conveyor which feeds thematerials to the baler. Other materials are emptied from the delivery trucks into Gaylords whichare taken to the sorting area of the MRF. Using a hydraulic lift the Gaylords of fibers are tippedonto a sorting conveyor where individuals sort the materials into other Gaylords.
Prior to the optimization study, various types of container materials (plastics, cans, and glass)were hand sorted into specific categories directly from the Gaylords of mixed containers intoempty Gaylords. For example, Gaylords of mixed plastics were hand sorted into HDPE andPET; metals were hand sorted into aluminum and steel, etc. These materials are now sorted offthe sorting conveyor when it is not being used for fibers. Additional processing of materials(prior to baling) includes running aluminum cans through a magnetic head pulley for a final
MRF Operational Assessment Final Report and Optimization Guide
Tim Goodman & Associates | August 2003 7
clean up and crushing the color-separated glass. Once sufficient quantities of specific materialshave been accumulated they are taken to a second horizontal baler for final preparation beforemarketing.
Table 2.2 shows a general financial overview comparison between Facilities A, B, C, and D.Facility E is not included in Table 2.2 as the assessment of this facility was conducted in anearlier phase of the project and detailed financial data was not obtained for this facility. Thegross annual operating costs of the four facilities included in Table 2.2 covered a range ofapproximately $241,000 per year up to $650,500 per year. These costs represent only theoperating costs for the MRFs. Collection costs are not included in these numbers.
Table 2.2Facility Financial Overview Comparison1
Existing Facilities ReviewedFinancialCharacteristics A B C D
Cost of Operation2 $240,910 $650,526 $470,858 $466,788Notable Cost Categories &Percent of Annual Budget3
Operations Labor $132,000 (55%) $206,919 (32%) $263,418 (56%) $210,232 (45%)Mgmt./Admin. Labor $29,370 (12%) $171,137 (26%) $59,952 (13%) Not Broken Out
Space Rental ---- $130,270 (18%) ---- ----Materials Transportation ---- ---- $45,595 (10%) $72,870 (16%)
Capital Equipment $28,200 (12%) ---- ---- ----Equipment Rental/Leasing ---- ---- ---- $54,400 (12%)
Annual Revenues $133,163 $82,383 $411,685 $246,535Net Cost of Operation $107,747 $568,143 $59,173 $220,253Processing Cost Per Tonof Materials Recovered
Gross Cost Per Ton $123.54 $314.26 $108.24 $88.74Net Cost Per Ton $55.25 $274.47 $13.60 $41.87
Because of the unique characteristics of each facility it is difficult to make accurate comparisonsrelated to their operating costs. The costs of operations will be effected by a number of variablesincluding the types and quantities of materials processed at the facility, the collection methodsused for delivering the materials to the facility, the type and level of processing used forpreparing the materials for markets, the level and type of staffing used at the facility, etc.
The budget categories that represent significant operational costs are highlighted in Table 2.2. Inall cases the cost of operations labor make up a substantial amount of the annual operatingbudgets ranging from almost one-third to over half of the total annual facility costs. Other costcenters that stand out, depending on the facility, include space rental, transportation of materialsto market, capital equipment purchases, and equipment rental or leasing. In conducting an
1 Financial data for Facilities A and B are for FY 2002. Financial data for Facilities C and D are for FY 2001.2 Cost of operation is for MRF operations only. Cost of materials collection is not included in these numbers.3 Only those cost categories that make up 10% or more of the respective facility’s operating budget are reported. Alllabor numbers include benefits. The Materials Transportation category is the cost for shipping finished product tomarket. The shipping cost for Facility A is less than 5% of their total operating costs and is therefore not reported inthis table. The markets for Facility B are local and pick the materials up at the facility. There is no cost for thispickup service, however the revenue received for the materials is reduced accordingly.
MRF Operational Assessment Final Report and Optimization Guide
Tim Goodman & Associates | August 2003 8
operational efficiency assessment the cost centers that represent over 10% of a facility’s annualoperating budget are good places to start for identifying efficiency changes that could result indecreased operating costs. Other cost centers below 10% of a facility’s annual operating budget,however, could also yield improved operating efficiencies and reduced cost. For example,Facility A’s electricity consumption was consistently 200 kWh per month higher than their 5,000kWh monthly base load. This additional 200 kWh was costing them as much if not more thantheir 5,000 kWh base load. By finding ways to reduce energy consumption or replace existing,inefficient equipment with newer, more energy efficient equipment, reducing the monthly energyconsumption to below the 5,000 kWh base load was relatively easy and inexpensive to do.
Table 2.2 also shows the annual revenues received for marketed materials from each of the fourMRFs. The amount of revenues will also depend on a number of variables including the typeand quantities of materials marketed, the markets the materials are sold to, the distance thematerials need to be transported to markets, and the preparation and quality of the materials sentto markets. For example, much of the recovered fiber marketed by Facility B was a medium tohigh quality product. However, because it was shipped to market loose and not baled Facility Breceived a reduced price for the materials. Additionally, some of the highest quality materialswere generated in very small quantities such that the premium prices paid for this material wasoffset by the cost of handling and upgrading this material to meet those market specifications.
Section 2.2 will provide some examples of the recommended facility improvements that couldimprove efficiencies, decrease operating costs, and enhance revenues obtained for the recoveredmaterials.
After taking into account the gross operating costs, annual revenues generated from the sale ofrecovered materials, the net operating costs, and the quantities of materials recovered annually,Table 2.2 shows the net cost per ton for facility operations. As can be seen in this table the netcost per ton ranges from $13.60 per ton up to $274.47 per ton.
As noted earlier, two of the study participants expressed interest in improving the recovery ofmaterials from the waste stream through front-end processing (FEP) of MSW to removerecyclables still in the waste stream. Though both public and private recycling programs serveboth communities they viewed such a facility as a way to complement the already existingrecycling system. To that extent the project team worked with these entities to developpreliminary designs for FEP facilities that would incorporate design and operational efficienciesinto the facility.
These two study participants, both public entities, own and operate waste-to-energy (WTE)facilities with annual throughputs of 21,000 tons and 93,000 tons, respectively. Table 2.3 showsthe general characteristics of the WTE facilities and the community recycling programs thatserve these two entities.
Facility F is a modular mass-burn WTE facility with a design capacity of 72 tons/day of MSWalthough they are currently processing about 82 tons/day of MSW. Their interest in the designand construction of a FEP facility is driven by three considerations including recovering morematerials from the MSW for recycling, reducing WTE facility air emissions, and reducing WTEfacility maintenance costs.

MRF Operational Assessment Final Report and Optimization Guide
Tim Goodman & Associates | August 2003 9
Based on information provided by the publicly owned recycling center serving the regionapproximately 3,027 tons of materials were recovered in their operation in 2000. With theproposed FEP facility it is estimated that an additional 1,673 tons of recyclables (primarilymetals and OCC) could be recovered annually.
Table 2.3General Characteristics of the
Solid Waste and Recycling ProgramsFor Study Participants F and G
Study ParticipantsPhysical/Operational Characteristics F GRecovered (Recycled) Tons/Yr.1 3,027 32,902Type/Percent of Materials Recovered Fibers (77%)
Containers (22%)Textiles (1%)
Fibers (78%)Containers (16%)
Textiles (3%)Food Waste (3%)
Annual Throughput of WTE Facility (tons)2 21,000 93,000WTE Facility Ownership/Operation Public/Public Public/PublicType of WTE Facility Modular Mass-Burn
(72 ton/day design capacity)Field Erected Mass-Burn
(200 ton/day design capacity)Types/Estimated Annual Tons of RecyclablesRecovered Through the FEP Facility
Ferrous Metals (270)Aluminum (169)
OCC (1,234)
Ferrous Metals (1,130)Aluminum (460)
OCC (2,840)Overall Proposed Configuration andEquipment for the FEP Facility
Hopper/Inclined ConveyorRaised Sorting Platform
(3-sort configuration)Two-Section Trommel Screen
Overhead Belt MagnetEddy Current Separator
Reclaim Conveyor & BalerVarious Transfer Conveyors
Roll-Off Containers/BinsFork Lift
Truck & Hoist
Stationary Crane & ClamshellHopper/Inclined Conveyor
Raised Sorting Platform(3-sort configuration)
Two-Section Trommel ScreenOverhead Belt MagnetEddy Current Separator
Reclaim Conveyor & BalerVarious Transfer Conveyors
Roll-Off Containers/BinsFront End Loader
Fork LiftTruck & Hoist
Preliminary Capital Cost Estimate forFEP Facility and Associated Rolling Stock
$3,990,000 $5,082,000
Gross Annual Operating Cost Estimate3 $670,000 $1,333,000Estimated Potential RevenuesFrom Recovered Materials
$157,000 $584,000
Net Annual Operating Cost Estimate $518,000 $749,000
Estimated Gross Cost Per Processed Ton4 $31.90 $14.33
Estimated Net Cost Per Processed Ton4 $24.67 $8.05
1 Reported recycled tons for Facility F and Facility G are for calendar years 2000 and 1999, respectively. Reportedrecycled tons for both facilities are only for those materials managed through the publicly owned recycling centers.2 Reported MSW tonnages for both facilities are for calendar year 1999.3 Includes annual debt service payments.4 Based on 1999 WTE facility reported throughputs.

MRF Operational Assessment Final Report and Optimization Guide
Tim Goodman & Associates | August 2003 10
The FEP facility, using a combination of manual and mechanical sorting, would allow theremoval of recyclables and bulky, non-combustible materials from the waste stream. Byincorporating a trommel screen into the design of the FEP facility, a variety of smaller inertmaterials, some of which could cause spikes in air emissions or heavy metals in the ash (e.g.,button batteries) would be diverted away from the WTE facility. Once these items were pulledfrom the waste stream the remaining materials would be diverted back to the tipping floor forcombustion in the WTE facility.
The preliminary capital cost for the FEP facility, including rolling stock, was estimated atapproximately $4.0 million. It should be cautioned that this is a very preliminary cost estimatebased on a conceptual facility design. A more accurate cost estimate will be prepared shouldFacility F move ahead with the project. The estimated gross operating cost, including annualdebt service payments, is approximately $670,000 annually. Revenue from the sale of recoveredmaterials was estimated at approximately $157,000 annually, based on market conditions at thetime, leaving a net annual operating cost of approximately $518,000.
Based on these estimates the net cost per processed ton (assuming an annual throughput of21,000 tons per year) is estimated to be approximately $25 per ton.
Facility G is a field-erected mass-burn WTE facility with a design capacity of 200 tons/day.Their interest in the design and construction of a FEP facility is four-fold. In addition to thesame three reasons given by Facility F, Facility G is currently bypassing a significant amount ofMSW to land disposal because of lack of processing capacity. The additional recovery ofmaterials and the removal of non-combustible or problem materials from the MSW will increasetheir ability to combust a greater quantity of more homogenous MSW. This increased quantity,however, may be limited due to the increased BTU content of the processed MSW andlimitations on the combustion equipment.
Based on information provided by the publicly owned recycling center serving the regionapproximately 32,902 tons of materials were recovered in their operation in 1999. With theproposed FEP facility it is estimated that an additional 4,430 tons of recyclables (primarilymetals and OCC) could be recovered annually.
The FEP facility, using a combination of manual and mechanical sorting, would allow theremoval of recyclables and bulky, non-combustible materials from the waste stream. Byincorporating a trommel screen into the design of the FEP facility a variety of smaller inertmaterials, some of which could cause spikes in air emissions or heavy metals in the ash (e.g.,button batteries) would be diverted away from the WTE facility. Once these items were pulledfrom the waste stream the remaining materials would be diverted back to the tipping floor forcombustion in the WTE facility. Other than the obvious processing capacity differences the onlyother significant distinction between the FEP facilities for Facility F and Facility G is astationary crane and clamshell in the latter facility which would put materials into the belowgrade, infeed hopper/inclined conveyor system.
MRF Operational Assessment Final Report and Optimization Guide
Tim Goodman & Associates | August 2003 11
The preliminary capital cost for the FEP facility, including rolling stock, was estimated atapproximately $5.1 million. It should be cautioned that this is a very preliminary cost estimatebased on a conceptual facility design. A more accurate cost estimate will be prepared should thisfacility move ahead with the project. The estimated gross operating cost, including annual debtservice payments, is approximately $1,333,000 annually. Revenue from the sale of recoveredmaterials was estimated at approximately $584,000 annually, based on market conditions at thetime, leaving a net annual operating cost of approximately $749,000. Based on these estimatesthe net cost per processed ton (assuming an annual throughput of 93,000 tons per year) isestimated to be approximately $8 per ton.
The preliminary designs for the FEP facilities being considered by these two WTE facilities wereprepared with efficient processing in mind. Logical process flow, safe and ergonomically soundequipment layout and design, compact facility footprints, and facility orientation in relation tothe site and the existing WTE facilities were some of the factors considered in developing thesedesigns. Section 3.0 addresses a variety of efficiency considerations in siting and designingMRFs and FEP facilities.
2.2 COST REDUCTION AND REVENUE ENHANCEMENT EXAMPLES
Though the five existing MRFs participating in this study are all publicly owned and process lessthan 25 tons/day of materials the similarities end there. Each is unique in a variety of waysincluding type of operator/staffing arrangements, number of operational staff (including sorters),number and type of sorting lines, other processing equipment used, and type of end productproduced for sale to markets. Efficiency improvements were identified in all facilities, somemore so than others. Additionally, virtually all of the facilities had a need for upgrading oradding one or more pieces of equipment. In some cases the capital cost for the equipment wasnot offset by a corresponding reduction in operating cost or increase in revenue in the short-term.However, in these cases facility management recognized that the long-term operations wouldbenefit with such investments.
What follows are examples of some of the improvements recommended for each of the facilities.In some cases they will be unique to a particular facility while in other cases they could beapplicable to most of the participating MRFs as well as to other MRFs in general. It should alsobe pointed out that while the examples presented below may be applicable to other facilities thespecific financial implications would vary on a case-by-case basis.
Finally, many of the recommendations made for each of the facilities, not all of which arepresented in the tables or narrative below, could result in reduced costs associated with energyusage, equipment maintenance costs, reductions in facility staffing, and reductions in processingtime. Some recommended operational improvements could also result in increasing the quantityof materials recovered or in improving the quality of materials recovered resulting in increasedrevenue generation. Quantifying a reduction in cost or increase in revenue related to a specificoperational change, however, can be difficult and in some cases almost impossible without amore detailed financial analysis. The examples given below represent some of the efficiencyimprovements that readily lent themselves to quantifying the cost savings or additional revenuegeneration resulting from implementation of the recommended actions.
MRF Operational Assessment Final Report and Optimization Guide
Tim Goodman & Associates | August 2003 12
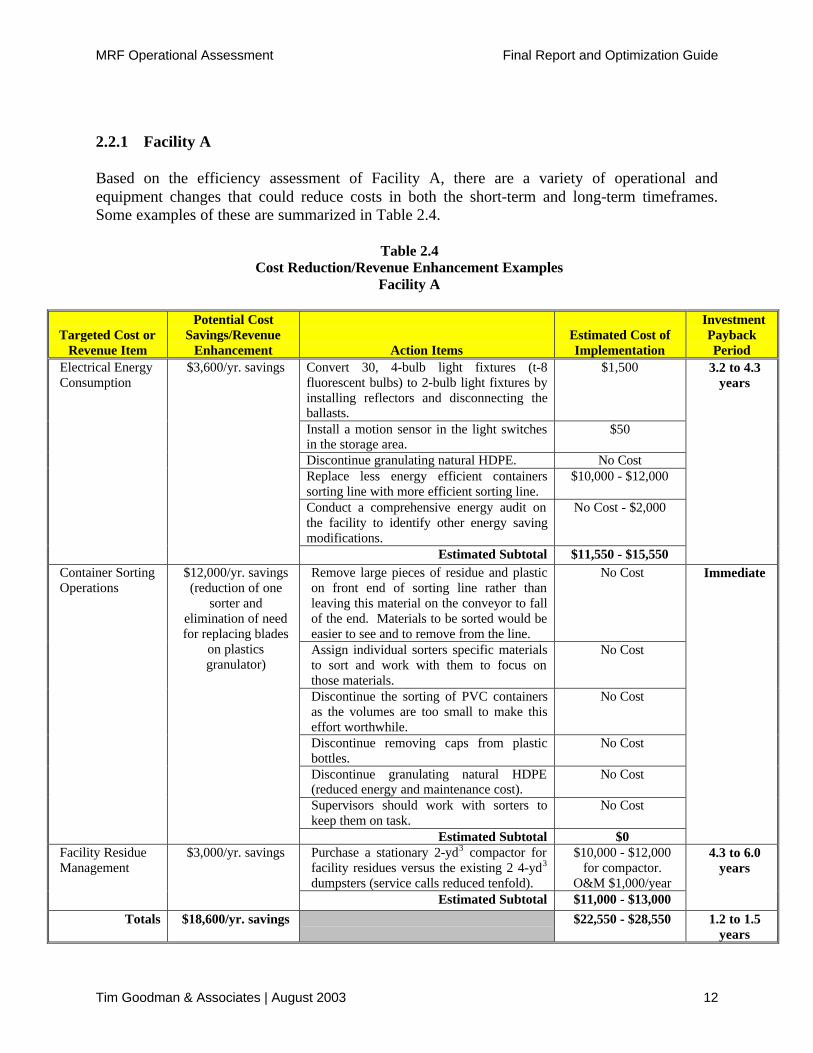
2.2.1 Facility A
Based on the efficiency assessment of Facility A, there are a variety of operational andequipment changes that could reduce costs in both the short-term and long-term timeframes.Some examples of these are summarized in Table 2.4.
Table 2.4Cost Reduction/Revenue Enhancement Examples
Facility A
Targeted Cost orRevenue Item
Potential CostSavings/Revenue
Enhancement Action ItemsEstimated Cost ofImplementation
InvestmentPaybackPeriod
Convert 30, 4-bulb light fixtures (t-8fluorescent bulbs) to 2-bulb light fixtures byinstalling reflectors and disconnecting theballasts.
$1,500
Install a motion sensor in the light switchesin the storage area.
$50
Discontinue granulating natural HDPE. No CostReplace less energy efficient containerssorting line with more efficient sorting line.
$10,000 - $12,000
Conduct a comprehensive energy audit onthe facility to identify other energy savingmodifications.
No Cost - $2,000
Electrical EnergyConsumption
$3,600/yr. savings
Estimated Subtotal $11,550 - $15,550
3.2 to 4.3years
Remove large pieces of residue and plasticon front end of sorting line rather thanleaving this material on the conveyor to fallof the end. Materials to be sorted would beeasier to see and to remove from the line.
No Cost
Assign individual sorters specific materialsto sort and work with them to focus onthose materials.
No Cost
Discontinue the sorting of PVC containersas the volumes are too small to make thiseffort worthwhile.
No Cost
Discontinue removing caps from plasticbottles.
No Cost
Discontinue granulating natural HDPE(reduced energy and maintenance cost).
No Cost
Supervisors should work with sorters tokeep them on task.
No Cost
Container SortingOperations
$12,000/yr. savings(reduction of one
sorter andelimination of needfor replacing blades
on plasticsgranulator)
Estimated Subtotal $0
Immediate
Purchase a stationary 2-yd3 compactor forfacility residues versus the existing 2 4-yd3
dumpsters (service calls reduced tenfold).
$10,000 - $12,000for compactor.
O&M $1,000/year
Facility ResidueManagement
$3,000/yr. savings
Estimated Subtotal $11,000 - $13,000
4.3 to 6.0years
Totals $18,600/yr. savings $22,550 - $28,550 1.2 to 1.5years

MRF Operational Assessment Final Report and Optimization Guide
Tim Goodman & Associates | August 2003 13
For example, as noted earlier Facility A’s electricity consumption averages 200 kWh per monthhigher than their 5,000 kWh monthly base load. This additional 200 kWh per month is costingthem as much if not more than their 5,000 kWh base load. By reducing the consumption ofelectricity by 200 kWh per month Facility A could save $3,600 annually. Severalrecommendations were made that if implemented could likely reduce their consumption by aminimum of 200 kWh per month including facility lighting adaptations, discontinuing a plasticsgranulation operation, and replacing old equipment with newer, more energy efficient systems.
The estimated timeframe for recovering costs for implementing these changes (the InvestmentPayback Period or IPP) is approximately 3 to 4 ½ years. If new equipment is not purchased therewill be less annual energy savings but also less cost in implementation. In that situation it maybe possible to reduce the IPP down to a 2 to 3 year timeframe though other potential savingsassociated with repair and maintenance of the existing sorting conveyor (not taken into accounthere) would likely not be realized.
Other cost reduction recommendations for Facility A involve improving sorting efficiencies tothe extent that a reduction in sorting labor can be realized. As Facility A’s contract with it’soperator is based on number of staff and hours worked by improving efficiencies on the sortingline it may be possible to eliminate one position thus saving approximately $10,000 annually.The action items recommended include removing larger pieces of residue and film plastic on thefront end of the containers sorting line, assigning individual sorters specific items to sort, anddiscontinuing some of the activities associated with the existing containers sorting operation (i.e.,sorting two streams of HDPE containers, sorting PVC containers, removing caps from plasticbottles, etc.). Additionally, a savings of approximately $2,000 per year in maintenance costscould be realized by discontinuing the granulating of natural HDPE before shipping it to market.By baling and marketing this material along with the pigmented HDPE, granulator bladereplacement costs can be eliminated while having a minimal impact on the revenue received forthe natural HDPE.
Residue management costs can also be reduced resulting in an approximate $3,000 per yearpotential savings but taking approximately 4 to 6 years to recover the capital and operating costof a stationary compactor necessary to achieve the annual savings. If the compactor is leased,however, the IPP timeframe could be less.
Implementing all recommendations outlined in Table 2.4 would cost approximately $22,550 to$28,550 and could save approximately $18,600 annually in operating costs. The estimated IPP isapproximately 1 to 1 ½ years.
2.2.2 Facility B
Examples of some of the recommended operational improvements that for reducing operatingcosts or improving revenues received for processed materials for Facility B are summarized inTable 2.5. Though there were a number of recommendations made for improving operationalefficiencies the ones listed in Table 2.5 probably have the biggest impact.
A significant annual operating cost for Facility B is labor ($378,056). Approximately 45% of thelabor cost is for administrative personnel. In reviewing position duties and responsibilities it was

MRF Operational Assessment Final Report and Optimization Guide
Tim Goodman & Associates | August 2003 14
determined that there was considerable overlap of duties between different positions and thatmany administrative duties could be eliminated, consolidated or moved to other personnel withinother departments. In doing so one administrative position could be eliminated resulting in asavings conservatively estimated at $40,000 annually including benefits.
Table 2.5Cost Reduction/Revenue Enhancement Examples
Facility B
Targeted Costor Revenue
Item
Potential CostSavings/Revenue
Enhancement Action ItemsEstimated Cost ofImplementation
InvestmentPaybackPeriod
ProgramLabor/Staffing
$40,000/yr. savings(reduction of one
administrative staff)
Reduce administrative staff byone.
No Cost Immediate
Purchase a horizontal balerand bale recovered fibersversus shipping materials tomarket loose.
$61,000 (capital)$27,000/yr. O&M Cost
FacilityRevenues
$100,000/yr. addedrevenue
Estimated Subtotal $35,1601
0.4 Years
Provide more bins to somecustomers and reduce thenumber of trips in servicingthese customers.
No Cost
Purchase two additionalvertical balers to put inlocations where OCC isgenerated in large quantities.Servicing these locationscould become less frequentand will improve theefficiencies in transportingmaterials back to the MRFwhen the sites are serviced.
$15,000 - $20,000
Negotiate an agreement withanother publicly owned MRF(using the same collectionmethods) to accept materialsfrom servicing locationswhich are geographicallycloser to that MRF.
No Cost
MaterialsCollection
$7,400/yr. savings(10% reduction incollection costs)
Estimated Subtotal $15,000 - $20,000
2.0 – 2.7 years
Totals $47,400/yr. savings$100,000/yr. added
revenue
$50,160 - $55,160 1.1 – 1.2 years(based on savings
only)
< 6 months(including added
revenue)
1 In this example the capital cost of the horizontal baler ($61,000) is amortized over a 10-year period with an interestrate of 6%. Annual amortized cost is approximately $8,160. Adding the annual O&M costs results in a cost ofapproximately $35,160 per year.
MRF Operational Assessment Final Report and Optimization Guide
Tim Goodman & Associates | August 2003 15
Facility revenues could be increased by a conservative $100,000 annually if Facility B were tobale its fiber versus selling and shipping it loose to market. Based on discussions with otherMRFs in the region, as well as with several local markets, a higher price is paid for baledmaterials versus loose. Depending on the type of fiber, the quality of the material beingmarketed, the local broker/market purchasing the materials, and market conditions, anywherefrom $10 to $70/ton more revenue can be obtained for baled versus loose material. If Facility Bwere to purchase a horizontal, single-ram, manual-tie baler, it is estimated that the additionalrevenue received for the materials would offset the capital and annual O&M costs of the baler inapproximately five months. This is assuming the capital cost of the baler is amortized over a ten-year period. If the cost of the baler is all taken in one year the IPP is closer to one year.
Like many of the other MRFs participating in this study, the public entity, which owns FacilityB, also runs a collection program for the materials processed at the MRF. Unlike these otherentities, a preliminary evaluation of the collection efficiencies of this program were incorporatedinto the study. Several of the recommendations made for Facility B’s collection program arealso included in Table 2.5.
Facility B pays an hourly rate of $42.25 for the cost of a driver and truck. With theimplementation of these recommendations, which center around improving route efficiencies andincreasing the intervals between collection runs, an estimated reduction in collection time ofapproximately 175 hours annually may be achievable. This equates to approximately $7,400 peryear in savings.
Implementing all recommendations outlined in Table 2.5, Facility B could see a savings ofapproximately $47,400 annually and $100,000 per year in additional revenue. This equates to anIPP of approximately one year on cost savings alone. Including the $100,000 additional revenuethe payback on investment is less than six months.
2.2.3 Facility C
Though a variety of efficiency improvements were identified for Facility C only one would havean almost immediate bottom-line impact on the facility. Five sorters are employed to sortmaterials year round. Due to the impact of tourism during the summer months, and the increasedthroughput of materials processed during this time, five individuals working the sort line canbarely keep up with the flow. However, during the winter and spring (and during the on-siteassessment period in the Fall of 2002) a compliment of three to four sorters is sufficient forsorting all streams of material delivered to the facility.
The fifth sorter (used only during the fiber sorting operation) sorted at a rate significantly lessthan the other four individuals and was observed often times having very little to sort. Onaverage the fifth sorter sorted approximately 200 pieces/hour as compared to a range of 600 to900 pieces/hour for the other sorters. By reclassifying one sorting position as seasonal andemploying this individual six months of the year an estimated annual savings of approximately$15,000 (including benefits) could be realized.
In conjunction with this, modifications to the conveyors that move materials to the sorting lineare recommended in order to reduce the burden depth and even out the flow of materials moving

MRF Operational Assessment Final Report and Optimization Guide
Tim Goodman & Associates | August 2003 16
across the sorting line. These modifications will help improve the efficiencies of the sortingoperation and allow sorters to increase the per hour sorting rate. Such modifications areestimated to cost from $2,500 up to approximately $6,000. Implementation of thisrecommendation is anticipated to have an IPP of less than six months.
2.2.4 Facility D
Table 2.6 summarizes several of the efficiency improvements recommended for Facility D.Again, a number of efficiency improvements were identified but many of them have eitherlonger payback periods or are difficult to quantify in terms of dollars saved.
Table 2.6Cost Reduction/Revenue Enhancement Examples
Facility D
Targeted Costor Revenue
Item
Potential CostSavings/Revenue
Enhancement Action ItemsEstimated Cost ofImplementation
InvestmentPaybackPeriod
Raise the header for the overheaddoor at the south end of the tippingfloor and replace the 16’ highoverhead door with a 24’ highoverhead door.
$8,000
Replace and move the 10’ by 10’overhead door between the OCCbunker and the processing areafrom the tipping floor side of thewall to the processing area side ofthe wall. Door control mechanismshould also be relocated.
$1,500
Extend concrete push wall alongthe north wall of the tipping floorto allow for greater storage area formixed paper.
$2,000
Tipping FloorO&M
$4,000 - $11,000/yr.savings
Estimated Subtotal $11,500
1.0 – 2.9 years
Purchase a glass crusher and crushthe recovered glass for improvedtransportation efficiencies whenmoving the glass to market.
$6,000GlassRecyclingOperation
$5,000 - $6,000/yr.savings
Estimated Subtotal $6,000
1.0 – 1.2 years
Totals $9,000 - $17,000/yr. $17,500 1.0 – 1.9 years
The receiving and management of materials on Facility D’s tipping floor is one of the areaswhere operational improvements could help reduce cost and improve efficiencies. For example,two overhead doors (one providing egress out of the facility and the other separating the OCCstorage bunker from the processing area) are regularly damaged by vehicles and equipmentoperating on the tipping floor. Repairs to these doors and the building structure itself have beenrunning from $4,000 to $11,000 annually. By making a one-time investment of approximately$10,000 these doors and associated structural components could be redesigned and rebuilt togreatly reduce, if not eliminate, the need for annual repairs in the future. Making the investment

MRF Operational Assessment Final Report and Optimization Guide
Tim Goodman & Associates | August 2003 17
in these operational improvements, along with some added concrete work to expand the storagearea for mixed paper, has an estimated IPP of from approximately one to three years.
Another operational recommendation that has the potential to reduce annual operating costs is toadd a glass crusher to the glass recovery operation. Currently, sorted glass (amber and clear) isplaced into 30-yd3 roll-off containers for transport to the glass market 350 miles away.Approximately 25 to 30 loads per year of glass are delivered to the glass market with averageover-the-road payloads being approximately ten tons of material. In the best case the revenuereceived for a load of glass just covers the transportation cost.
By purchasing a glass crusher and crushing the glass prior to loading it into the roll-offcontainers the over-the-road payloads can be almost doubled resulting in less trips to market andmore materials delivered to market per trip. With a cost savings of approximately $5,000 to$6,000 annually and an investment of approximately $6,000 for a glass crusher the estimated IPPon implementing this recommendation is approximately one year.
Implementing all the recommendations outlined in Table 2.6 is estimated to cost approximately$17,500 annually and result in an estimated annual savings of $9,000 to $17,000 per year with anoverall IPP of one to two years.
2.2.5 Facility E
The assessment of Facility E was conducted in an earlier phase of the study (at the same timethat the preliminary FEP facility designs were prepared for Facilities F & G) and unlike thosefacilities that were assessed in later phases of the study, a financial analysis of the annualoperating costs and revenues was not conducted. The focus of the Facility E assessment wasmore on qualitative efficiency improvements (i.e., sorting more materials in less time, improvingergonomics in sorting activities, etc.). The recommendations coming out of the assessmentincluded:
• Utilizing the fibers sorting conveyor for sorting containers as well as the fibers. At the timeof the assessment the sorting conveyor was only being used for sorting fibers. Mixedcontainers were in Gaylords and were hand-sorted from the common Gaylord into Gaylordsspecifically designated for HDPE, PET, and mixed metal containers. This was not only timeconsuming but posed severe ergonomic issues.
• Moving the Gaylords used for segregating specific grades of fibers adjacent to the sortingconveyor. Pre-assessment the Gaylords designated for specific fibers were situated in backof the sorters standing at the sorting conveyor. Again this resulted in both inefficiencies andergonomic issues in the fibers sorting process.
• Adding a sorting station on the main baler infeed line. Staff responsible for quality control inthe OCC baling operation would stand on the floor or in the infeed hopper of the inclinedconveyor feeding the baler to sort out contaminants. By adding an elevated sorting platformapproximately five feet above the floor the workers could remove contaminants more easily,safely, and efficiently than the current methods used.
MRF Operational Assessment Final Report and Optimization Guide
Tim Goodman & Associates | August 2003 18
There is no cost for implementing the first two recommendations. The cost for constructing theelevated sorting station and making the necessary modifications to the sidewall of the inclinedconveyor was estimated at approximately $5,000.
As a result of the methodology used in assessing Facility E, documented cost savings inimplementing the recommended operational changes were not determined. However, becausesorter productivity could be increased in implementing the recommendations, it’s surmised that areduction in staff may be achievable. As this facility pays its contract operator based on theskills and capacity of the sorters, reducing the staff complement is contractually possible. Actualoperational savings in doing this, however, are not known.
Additionally, it is surmised that the facility throughput could be increased resulting in morerecovered materials and an increase in annual revenues. This is assuming, of course, that morematerials could be diverted to the facility for processing.

MRF Operational Assessment Final Report and Optimization Guide
Tim Goodman & Associates | August 2003 19
3.0 OPTIMIZING EFFICIENCIES IN MRF DESIGN AND OPERATIONS
From the outset of this study one of the goals was to take the knowledge gained in the facilityassessments, combine it with other “best management practices” from within the industry, anddevelop a guide that other facilities, both public and private, can use in making operationalimprovements. It is hoped this Optimization Guide will assist MRF owners and operators inthree ways – improving operational efficiencies, effectiveness, and adaptability. All three ofthese concepts are crucial to a successful MRF operation.
Operational efficiency centers on the use of resources (labor and capital) in sorting andprocessing materials delivered to the MRF. Operational efficiency focuses on reducing sortingand processing costs while still maintaining (or increasing) the desired throughput of materials.Improved efficiencies can be implemented with a short-term return on investment in mind(removing plastic film at the beginning of a sort line to aid in seeing and capturing morerecoverable materials down the line) or with a more long-term return on investment in mind(purchasing a baler to achieve a higher revenue for the materials sold and to reducetransportation costs for getting materials to market).
Producing the desired result and meeting customer expectations is an example of operationaleffectiveness. As it applies to a MRF this can be equated to maintaining or improving theproduct quality of materials sold to markets. Often this translates to higher revenues, positivelong-term relationships with markets, and a decreased potential for a reduction in marketrevenues or having materials rejected. Operational effectiveness can also be applied on a microlevel within an operation. For example, training line workers to do a good job in sorting willimprove the quality of the materials sent to the baler. This in turn will help improve theefficiencies in the baling operation with less time spent sorting contaminants out of materialsbeing baled or having to re-bale materials due to the “dirtiness” of the end product.
Finally, operational adaptability refers to the ability to adapt to changing customer or businessneeds. A good example from the experiences of many of the facilities looked at in the study isthe availability of markets for segregated HDPE and PET plastic containers which pay a higherprice for these materials versus markets that deal primarily with a mixed plastic product. Inmany cases, the price differential in marketing HDPE and PET as separate products was worththe added effort of separating plastic containers into these two grades versus combining theminto a mixed grade.
The following subsections address various components of MRF siting, design and operationalprocedures from the perspective of concepts, principles, and practices that help improve theefficiency, effectiveness, and adaptability of MRF operations. As noted previously, theinformation presented below comes from both the insights and thoughts derived from observingthe MRFs participating in this study as well as other best management practices from within theindustry. Though not every item discussed below will be applicable in all situations or for thatmatter be the most appropriate for optimization improvements in all facilities it is the hope andintent of the MOEA and the project team that all facilities receiving this Optimization Guide willfind some useful suggestions to help them improve the operational efficiency, effectiveness oradaptability of their facility.

MRF Operational Assessment Final Report and Optimization Guide
Tim Goodman & Associates | August 2003 20
3.1 LOCATION, SITE CHARACTERISTICS, AND DESIGN EFFICIENCY CONSIDERATIONS
Siting and designing a materialsrecovery facility or a front-endprocessing facility should beundertaken with efficiency andoperational safety considerationsin mind. This means addressingsuch issues as location, sitecharacteristics, facility design andlayout, characteristics of existingbuildings if a MRF is going to beplaced into an existing structure oradded onto a transfer station orWTE facility, process/operationalflow, and employee/visitor safety.
Incorporating these issues into the planning process will provide both short-term and long-termeconomic and safety benefits. The location, site characteristics and design efficiencyconsiderations discussed below are not all inclusive nor will they be applicable in all situations.However, the considerations outlined in Table 3.1 will hopefully provide some guidelines in theupfront planning process when a MRF or FEP facility is being considered.
Table 3.1MRF Location, Site Characteristics, and Design
Efficiency Considerations
Concepts/Principles/Practices Potential Benefits/Comments
The facility should be located in close proximity topopulation centers and the collection sources.
Minimizes transportation distances to and from thecollection sources. This leads to less time spent servicingroutes, a reduction in vehicle fuel consumption in gettingmaterials from generation sources to the processingfacility, and less wear and tear on collection vehicles.This concept is particularly valid when the same entitythat owns the facility provides for collection services butis also valid for merchant facilities that want to attract thebusiness of others providing the collection service.
The facility or site for a proposed facility should belocated off of major highways or other transportationarterials, and provide for easy access/egress to thefacility.
Location on major transportation routes and having easyaccess/egress to site will add to convenience and efficientdelivery of materials to the site as well as shipment ofprocess materials to market. Additional benefits mayinclude less road weight and vehicle restrictions, and lessconfusing, easier access for emergency vehicles in caseof fire, police, or health emergencies.
On-site roadway system should minimize the numberof traffic intersections and merges. To the extentpossible keep personal vehicle traffic, materialdelivery traffic, and tractor-trailer traffic separate.
Efficiently moves traffic on and off site and will add tosafety of site personnel, customers, and visitors.
The site and/or building should meet local zoningrequirements and fit in with surrounding land uses.
Less time and cost involved in obtaining local permitsand approvals.
MRF Operational Assessment Final Report and Optimization Guide
Tim Goodman & Associates | August 2003 21
Table 3.1MRF Location, Site Characteristics, and Design
Efficiency Considerations (continued)
Concepts/Principles/Practices Potential Benefits/Comments
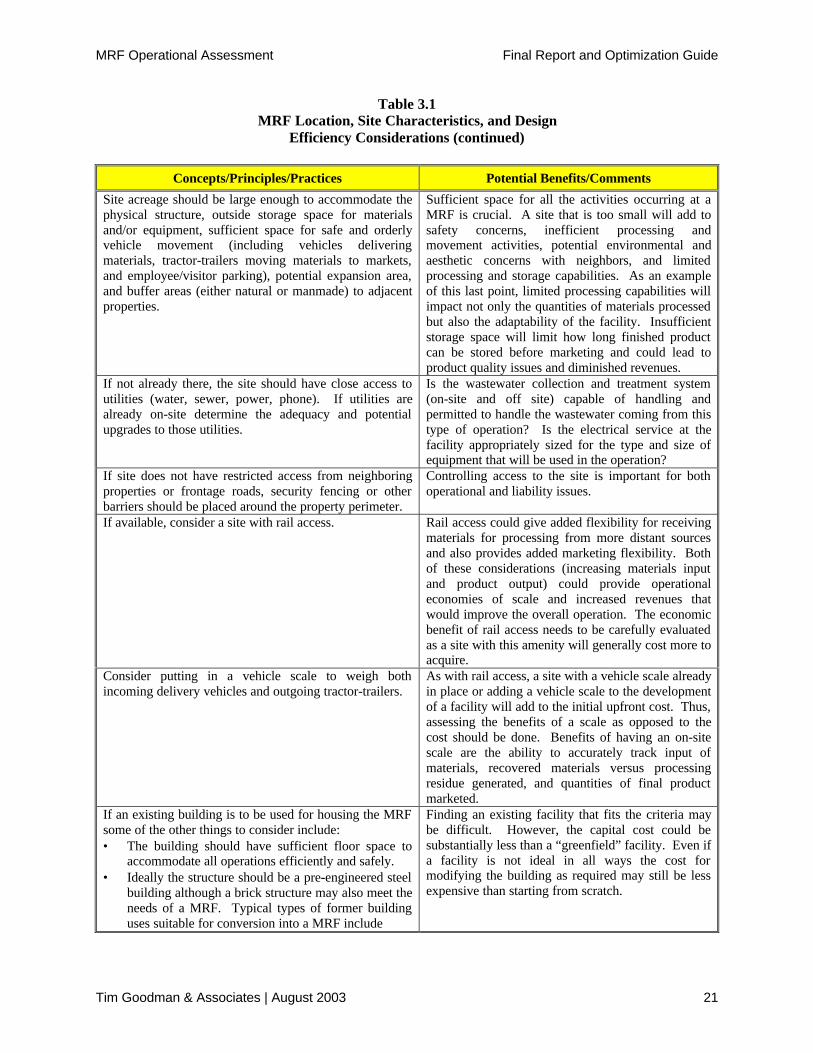
Site acreage should be large enough to accommodate thephysical structure, outside storage space for materialsand/or equipment, sufficient space for safe and orderlyvehicle movement (including vehicles deliveringmaterials, tractor-trailers moving materials to markets,and employee/visitor parking), potential expansion area,and buffer areas (either natural or manmade) to adjacentproperties.
Sufficient space for all the activities occurring at aMRF is crucial. A site that is too small will add tosafety concerns, inefficient processing andmovement activities, potential environmental andaesthetic concerns with neighbors, and limitedprocessing and storage capabilities. As an exampleof this last point, limited processing capabilities willimpact not only the quantities of materials processedbut also the adaptability of the facility. Insufficientstorage space will limit how long finished productcan be stored before marketing and could lead toproduct quality issues and diminished revenues.
If not already there, the site should have close access toutilities (water, sewer, power, phone). If utilities arealready on-site determine the adequacy and potentialupgrades to those utilities.
Is the wastewater collection and treatment system(on-site and off site) capable of handling andpermitted to handle the wastewater coming from thistype of operation? Is the electrical service at thefacility appropriately sized for the type and size ofequipment that will be used in the operation?
If site does not have restricted access from neighboringproperties or frontage roads, security fencing or otherbarriers should be placed around the property perimeter.
Controlling access to the site is important for bothoperational and liability issues.
If available, consider a site with rail access. Rail access could give added flexibility for receivingmaterials for processing from more distant sourcesand also provides added marketing flexibility. Bothof these considerations (increasing materials inputand product output) could provide operationaleconomies of scale and increased revenues thatwould improve the overall operation. The economicbenefit of rail access needs to be carefully evaluatedas a site with this amenity will generally cost more toacquire.
Consider putting in a vehicle scale to weigh bothincoming delivery vehicles and outgoing tractor-trailers.
As with rail access, a site with a vehicle scale alreadyin place or adding a vehicle scale to the developmentof a facility will add to the initial upfront cost. Thus,assessing the benefits of a scale as opposed to thecost should be done. Benefits of having an on-sitescale are the ability to accurately track input ofmaterials, recovered materials versus processingresidue generated, and quantities of final productmarketed.
If an existing building is to be used for housing the MRFsome of the other things to consider include:• The building should have sufficient floor space to
accommodate all operations efficiently and safely.• Ideally the structure should be a pre-engineered steel
building although a brick structure may also meet theneeds of a MRF. Typical types of former buildinguses suitable for conversion into a MRF include
Finding an existing facility that fits the criteria maybe difficult. However, the capital cost could besubstantially less than a “greenfield” facility. Even ifa facility is not ideal in all ways the cost formodifying the building as required may still be lessexpensive than starting from scratch.
MRF Operational Assessment Final Report and Optimization Guide
Tim Goodman & Associates | August 2003 22
Table 3.1MRF Location, Site Characteristics, and Design
Efficiency Considerations (continued)
Concepts/Principles/Practices Potential Benefits/Comments
warehouses and distribution centers, maintenance shops, and light industrial manufacturing facilities.• Eave heights should be a minimum of 25 feet to
accommodate the tipping of roll-of containers andother self-dumping vehicles.
• Overhead doors providing access and egress to thefacility should be of sufficient height and width toaccommodate the types of vehicles and equipmentanticipated to use them.
• Sufficient loading dock space should be available toaccommodate delivery of supplies as well as thestaging/loading of several tractor-trailers. Four to sixloading docks are ideal.
• HVAC, lighting, and electrical service should beadequate for the building and equipment used.
• Adequate space within the building should beavailable to design a process layout/materials flowthat is logical, efficient, and minimizes backtrackingor multiple handling of materials.
Design the MRF (materials receiving, sorting, processing,and storage functions) to meet anticipated throughputsand market specifications (quality and delivery). Asnoted above, layout the process flow to limit the handlingof materials while still meeting market specifications.
A processing and equipment layout that follows alogical sequence, flows in a straight line, and limitsthe backtracking and repeated handling of materialswill minimize the inefficient use of resources andenergy.
Provide sufficient space for all operations including pre-processing materials storage and post-processing productstorage. If there are seasonal variations in the amounts ofincoming materials delivered to the facility receiving,storage, sorting and processing functions should bedesigned for the high volume periods.
See comments above under site acreage potentialbenefits and comments.
Design flexibility into the facility layout that can quicklyadapt to changes in incoming material amounts, materialquality, or market specifications.
Changes in incoming materials, fluctuations inquantities (both seasonal and over time), regulatoryrequirements, product specification changes, pricing,and new markets are all things that could cause theneed for flexibility.
When it can be done safety and with minimal productdamage take advantage of gravity and free fall to movematerials (i.e., tipping floors at higher grades than infeedhoppers, falls of a few feet from transfer conveyors tosorting conveyors or bins/roll-off containers).
Examples of the potential benefits of doing thisinclude:• Easier and quicker to push materials into hopper
than to lift materials and dump into hoppers.• Free fall of paper from transfer conveyors onto
sorting conveyors will breakup up slugs ofmaterials and help regulate burden depth forsorting.
• Free fall of recovered glass from conveyors intobins or roll-off containers will help break theglass improving densities and weights fordelivery to markets.

MRF Operational Assessment Final Report and Optimization Guide
Tim Goodman & Associates | August 2003 23
Table 3.1MRF Location, Site Characteristics, and Design
Efficiency Considerations (continued)
Concepts/Principles/Practices Potential Benefits/Comments
Incorporate energy conservation principles into thedesign, layout and equipment specifications for the MRF.This includes building and site considerations such asbuilding orientation on site as well as procuring high-quality, energy efficient equipment.
Over a 15, 20 or more years operating life, the costof energy in facility operations can be a significantcost. It is likely that this will be even more so in thefuture. Some of the concepts, principles andpractices under this category include:• Utilize site geography and building placement to
minimize heat loss in winter by avoiding doors(or minimizing their usage) on the north side ofbuildings or in the direction of prevailing winds.This last point is especially relevant if a drive-through concept is used for the tipping floor(design to avoid wind tunnel effects).
• Utilize natural barriers (pine trees, hills, berms,etc.) to protect facility from prevailing winds.
• If possible, enclose sorting areas (modularshells) to minimize the amount of heat or airconditioning needed to maintain a comfortableand safe working environment for sorters.
• As an alternative to this last point, isolate areaswhere doors leading to the outside environmentmay be open much of the time (receiving areasand shipping areas) from areas where workersare sorting materials or operating otherprocessing equipment.
• Spec out and purchase equipment that has a highenergy efficiency rating. The capital cost maybe a little more but the long term operating costswill be less.
• Purchase equipment that is properly sized for thepeak throughputs of materials. A higher ratedcapacity baler will likely have a higher energyefficiency rating, a quicker cycling time, andwill not be operating as much as a baler that isundersized for the facility’s throughput.
• Make sure materials being baled are of aconsistent quality and have little or nocontamination, and use baling wire strongenough to hold the bales together of whatevermaterial is being baled. This will reduce theamount of material that needs to be rebaled. Anadded benefit is the improved marketability ofthe finished product.
• Minimize unnecessary handling/processing ofmaterials.
Incorporate ergonomic principles (people/equipmentinterface) and health and safety considerations into thedesign.
A facility designed with proper worker ergonomicsin mind will help in reducing worker strain, workercompensation claims, and lost time (workerproductivity).

MRF Operational Assessment Final Report and Optimization Guide
Tim Goodman & Associates | August 2003 24
3.2 MATERIALS RECEIVING AND STORAGE
The materials receiving and storage area(tipping floor) design, layout andoperations will first be dependent on thetype of materials received at the facilityand how those materials are delivered tothe facility. At a FEP facility thereceiving and storage function will bemore straight forward as the feedstock isMSW. The need for segregatedreceiving and storage areas will not be asgreat encompassing perhaps two storageareas – one for the raw MSW and onefor bulky and non-processible items. If
the FEP facility is incorporated into an existing transfer station or WTE facility utilizing theexisting materials receiving area or at least tying the FEP facility’s receiving area into theexisting one will take advantage of existing receiving functions and be much more cost-effectivethan managing a separate tipping floor.
The receiving and storage area for a MRF may include as few as one tipping area for mixedfibers and rigid containers (single-stream collection and delivery), two separate tipping areas onthe tipping floor – one for fibers and one for rigid containers (co-mingled collection anddelivery), or up to five or more separate tipping areas/bunkers for various combinations of co-mingled or source separated collection and delivery.
Whatever the facility type (FEP facilityor MRF) and whatever the deliverymechanism (single-stream, co-mingled,or source separated) the majorconsiderations in running an efficientreceiving and storage operation include:
• Move delivery vehicles in and out ofthe tipping area as quickly and easilyas possible. Getting deliveryvehicles in and out will minimizetipping floor congestion. This willhelp in maintaining a safer workingenvironment for the operators anddrivers on the tipping floor as well as allow for quicker and more efficient movement ofmaterials from receiving to storage to processing;
• Provide sufficient segregation between the various delivered materials streams to avoid orminimize cross-contamination. By minimizing cross-contamination of material streams fromthe beginning less time and cost will be spent on sorting and processing materials.
MRF Operational Assessment Final Report and Optimization Guide
Tim Goodman & Associates | August 2003 25
• Move materials off the tipping floor and into sorting/processing in a timely manner. Thiswill avoid backlogs of materials that could increase the sorting and processing inefficiencies(i.e., increases in burden depths on the sorting line, decreased recovery of materials andincreased production of residues, overtime labor in sorting and processing functions, etc.).Additionally, if there is an issue with dirt, mud and other such contaminants getting mixed inwith materials sitting on the tipping floor or in pre-processing storage material revenuescould be negatively impacted.
• Provide enough incoming materials storage space to allow for at least two days of storage inpeak delivery periods. This will allow for extended storage over weekends/holidays or whenequipment downtime (scheduled or unscheduled) shuts down the processing line.
Table 3.2 outlines these and some of the other concepts, principles and practices that can aid inefficient operations of the materials receiving and storage function.
Table 3.2Materials Receiving and Storage
Efficiency Considerations
Concepts/Principles/Practices Potential Benefits/Comments
Provide for a minimum of two days of incomingmaterials storage at peak flows.
Allows for storage over extended weekends or when processingis halted due to equipment repair or maintenance.
Provide for segregation of incoming materialsby the use of material bunkers or specified areaswhere certain types of materials are dumped.
Minimizes cross-contamination of materials making it easier tosort by material types and grades (i.e., metal food and beveragecontainers, plastic containers, OCC, other fibers, etc.).
If necessary, contain separation of incomingmaterials at peak flows by using portable trafficbarriers.
Potential benefits include:• Minimizes interference with vehicles maneuvering around
the tipping floor and unloading their contents.• Minimizes cross-contamination of incoming materials,
which could add to the time and effort involved in sortingoperations.
Provide for safe, quick and easy traffic controlto move vehicles on to and off of the tippingfloor. This could include a one-way drivethrough concept with traffic entering throughone door and exiting through another.
A good traffic flow and control plan will keep vehicles andmaterials moving in a safe and efficient manner. If consideringthe one-way drive through concept, take into account suchthings as the potential for wind tunnel effects and the ability ofvehicles to maneuver on the tipping floor.
If the facility will serve the general public aswell as commercial and public haulers considera separate drop-off area on-site for the public.
The benefit in doing this is to minimize congestion on thetipping floor by designating it for larger volume deliveries aswell as to provide for a safe tipping area for the general public.
Provide for safe, quick and easy unloading ofvehicles on the tipping floor.
The goal is to minimize the time vehicles are on the tippingfloor and to provide for an unloading plan that will quickly andsafely move materials from vehicle to pre-processing storage.
Keep tipping floors and receiving areas awayfrom other facility functions such as materialssorting, materials baling, and product storage.
When a variety of facility operational components share thesame space or are adjacent to each other without sufficientbarriers or buffer areas there is a loss of efficiency due tooperational congestion. Additionally, with more cross trafficand greater points of interface between vehicles, equipment, andpedestrians facility safety becomes compromised.
If possible utilize gravity and free fall to movematerials from storage to processing.
The use of higher-grade tipping floors or below-grade conveyorsystems minimize the handling of materials and make it easierto move materials out of storage.
MRF Operational Assessment Final Report and Optimization Guide
Tim Goodman & Associates | August 2003 26
Table 3.2Materials Receiving and Storage
Efficiency Considerations (continued)
Concepts/Principles/Practices Potential Benefits/Comments
If utilizing gravity and free fall to movematerials from storage to processing take stepsto minimize glass breakage if glass is to be colorsorted.
Minimizing glass breakage will result in safer, more efficientsorting operations, increase glass recovery, and decrease residueamounts requiring disposal. Ways to do this include:• If sorting mixed containers have glass collected and
dumped along with plastics to help cushion the glass duringdumping.
• Adding deflection ramps and rubber baffles at impactpoints.
• Utilizing drop chutes that reduce drop distances andencourage glass containers to roll rather than break.
Move materials off the tipping floor and intosorting/processing in a timely manner.
Operational efficiencies will be improved by reducing thequantities of materials in storage and minimizing the potentialfor processing bottlenecks due to pre-processing materialsstorage. Sorting and processing efficiencies will also beimproved in that material flows and burden depth on sortingconveyors may be more easily controlled resulting in morerecovered materials, less processing residues generated, and adecreased potential for worker overtime in sorting andprocessing functions.
3.3 MATERIALS SORTING CONSIDERATIONS
The sorting of materials at a MRF is the heart of the MRF. Without this function the materialscoming in and the materials going out have little to no value. Whether the sorting process isaccomplished manually, mechanically, or through a combination of the two it can be theoperational component of the MRF that is the largest cost center and offers the greatest potentialfor both short-term and long-term savings. The following subsections provide some insight intoimproving efficiencies in both manual and mechanical sorting functions. As this optimizationguide is targeted to smaller MRFs, many of which are located in rural or small town areas, thediscussion will focus mainly on manual sorting techniques. Though there are opportunities inthese types of operations to add equipment that will improve overall sorting efficiencies andoffer long-term savings, due to the smaller throughput of materials at these MRFs the applicationof mechanical sorting techniques may be limited and cost prohibitive for some facilities.
3.3.1 Manual Sorting of Materials
When we talk about improving the efficiencies of manual sorting it is more than just propertraining of the workforce and providing a safe and comfortable work environment for the sorters.Though this is obviously part of the equation it also involves providing the right equipment andprocedures to make the sorting process more effective. Productivity levels can be significantlyenhanced with the right combination of personnel training, procedures, and equipment.
Some of the factors that will contribute to increased efficiencies in manual sorting include suchitems as:
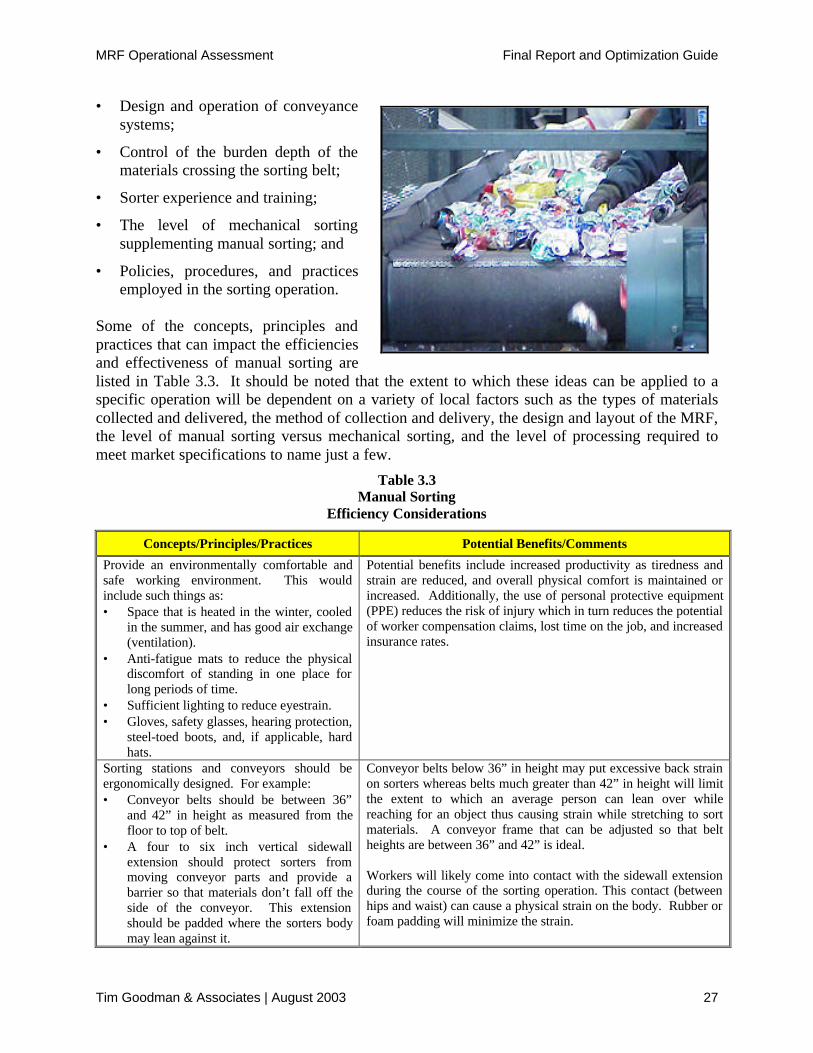
MRF Operational Assessment Final Report and Optimization Guide
Tim Goodman & Associates | August 2003 27
• Design and operation of conveyancesystems;
• Control of the burden depth of thematerials crossing the sorting belt;
• Sorter experience and training;
• The level of mechanical sortingsupplementing manual sorting; and
• Policies, procedures, and practicesemployed in the sorting operation.
Some of the concepts, principles andpractices that can impact the efficienciesand effectiveness of manual sorting arelisted in Table 3.3. It should be noted that the extent to which these ideas can be applied to aspecific operation will be dependent on a variety of local factors such as the types of materialscollected and delivered, the method of collection and delivery, the design and layout of the MRF,the level of manual sorting versus mechanical sorting, and the level of processing required tomeet market specifications to name just a few.
Table 3.3Manual Sorting
Efficiency Considerations
Concepts/Principles/Practices Potential Benefits/Comments
Provide an environmentally comfortable andsafe working environment. This wouldinclude such things as:• Space that is heated in the winter, cooled
in the summer, and has good air exchange(ventilation).
• Anti-fatigue mats to reduce the physicaldiscomfort of standing in one place forlong periods of time.
• Sufficient lighting to reduce eyestrain.• Gloves, safety glasses, hearing protection,
steel-toed boots, and, if applicable, hardhats.
Potential benefits include increased productivity as tiredness andstrain are reduced, and overall physical comfort is maintained orincreased. Additionally, the use of personal protective equipment(PPE) reduces the risk of injury which in turn reduces the potentialof worker compensation claims, lost time on the job, and increasedinsurance rates.
Sorting stations and conveyors should beergonomically designed. For example:• Conveyor belts should be between 36”
and 42” in height as measured from thefloor to top of belt.
• A four to six inch vertical sidewallextension should protect sorters frommoving conveyor parts and provide abarrier so that materials don’t fall off theside of the conveyor. This extensionshould be padded where the sorters bodymay lean against it.
Conveyor belts below 36” in height may put excessive back strainon sorters whereas belts much greater than 42” in height will limitthe extent to which an average person can lean over whilereaching for an object thus causing strain while stretching to sortmaterials. A conveyor frame that can be adjusted so that beltheights are between 36” and 42” is ideal.
Workers will likely come into contact with the sidewall extensionduring the course of the sorting operation. This contact (betweenhips and waist) can cause a physical strain on the body. Rubber orfoam padding will minimize the strain.

MRF Operational Assessment Final Report and Optimization Guide
Tim Goodman & Associates | August 2003 28
Table 3.3Manual Sorting
Efficiency Considerations (continued)
Concepts/Principles/Practices Potential Benefits/Comments
• Sorting conveyors should be between 30”and 36” wide if sorting from one side of theconveyor.
• Sorting conveyors should have variablefrequency drives (VFDs) to allow foradjusting the speed of the conveyor.Sorting conveyor belt speeds are generallyset to run between 10’ and 60’ per minutedepending on the particular circumstancesgoverning the sorting line.
Being able to comfortably reach across the width of theconveyor to remove items will increase the amount of materialsrecovered while reducing “missed items” that end up in theresidue stream. If sorting from one side of the conveyor a 36”stretch is about the furthest one can reach without causing undophysical strain. If sorters are working both sides of theconveyor belt widths of up to 60” are acceptable.
Sorting conveyors whose speeds can be adjusted will improvesorting efficiencies. If sorters are having trouble keeping up thebelt can be slowed down. If they have too much slack time thebelt can be sped up. Being able to increase and decrease theconveyor speed will better control burden depth (see below).
Perform periodic sorter efficiency studies todetermine at what rate (throws/hour orpounds/hour) various sorters/stations on thesorting line are performing.
By conducting such observations various adjustments to thesorting operation can be done. Examples include:• Reassigning sorters specific materials to concentrate on as a
way to improve recovery rates.• Adjusting belt speeds as needed to improve sorting rates,
reduce slack time, and reduce “missed items”.• May allow for decreases in staffing the sorting line or show
the need for increasing staffing on the sorting line.Control burden depth of materials crossing thesorting belt. The burden depth of fibers, as anexample, should be no more than 18” deep. Avariety of methods can be used to control burdendepth and the amount of materials presented tosorters for sorting. These include such things as:• Slow down or speed up the rate at which
materials are fed into hoppers or ontoinclined conveyors.
• Design inclined conveyors to have no morethan a 400 pitch (rate of incline). Inclinesgreater than this can cause tumbling or fallback of materials causing alternating highand low flow of materials crossing the belt.
• On fiber lines allow for a drop from oneconveyor to the next of two to three feet.This helps break up clumps of materials.
• Adjust speed of conveyor belts to eitherincrease the amount of materials presentedto a sorter or decrease the amount ofmaterials presented to a sorter. As a rule ofthumb, to decrease burden depth a sortingconveyor should run at a higher speed thanthe conveyor feeding it.
• Utilize other physical or mechanical meanssuch as hanging chains or rotating cleateddrums to help knockdown or breakup largeslugs of materials traveling up a conveyor.
Problems with controlling burden depth were an issue in threeof the five MRFs assessed in the study. Without adequatecontrols for monitoring and adjusting burden depth a variety ofefficiency issues can occur including:• Overwhelming workers to the point where they need to
push materials back up the line or stop the line altogether inorder to catch up.
• Decreasing the amount of recoverable materials capturedwhile increasing the amount of process residue requiringdisposal.
• Allowing contaminant levels to increase in recoveredproducts resulting in lower revenues for recovered productsor rejection of recovered products.
• Resorting of materials in order to capture more product orclean product up.
• Periods of very low levels of materials passing by sorterswhich have them sorting at very low rates or not sorting atall due to the lack of anything on the sorting belt(sometimes referred to as “black belt”).
Items to the left are all methods that have been employed toadjust burden depths and equalize the flow of materials acrossthe sorting belt. Implementing these methods could helpachieve peak efficiencies in the sorting operation.

MRF Operational Assessment Final Report and Optimization Guide
Tim Goodman & Associates | August 2003 29
Table 3.3Manual Sorting
Efficiency Considerations (continued)
Concepts/Principles/Practices Potential Benefits/Comments
Remove film plastic and other large materialsthat could cover up recyclables at the beginningof a sorting line.
Removing plastic film at the front end would not only makematerials more visible to downstream sorters but would alsoreduce the amount of double or triple handling of this materialas it travels down the line.
On mixed container lines sequence the sorting ofmaterials by sorting out the highest volumematerials first (usually natural HDPE) and allowresidues to fall off the end as a negative sort.
Like the concept of plastic film covering up materials to besorted high volume materials such as natural HDPE containerscan also cover up smaller containers such as PET, metal cans, orglass bottles. Allowing residues to fall off the end is moreefficient than trying to sort them out plus it minimizes productcontamination.
On a mixed fibers line (excluding OCC)negative sort the highest volume of materials(usually ONP or a mixed paper grade).
With fibers especially, allowing the highest volume of materialto flow off the end as a negative sort will minimize the amountand effort of trying to sort this material. Sorting efficiencieswill be improved.
Sorters should be throwing forward into abunker/bin/Gaylord and not pulling materialsback off the belt.
This causes less strain (ergonomically correct) and increasessorting rates.
Assign sorters specific items to sort rather thanhaving all sorters on a line sort all materials.
Sorting efficiencies and recovery rates will improve if sortershave fewer materials they have to concentrate on sorting.Additionally, if materials are sorted into bins or Gaylords sittingaround the sorting conveyor less of these will be required thuseasing congestion and improving overall operation of the sortingline.
Discontinue conducting activities on the sortingline that provide little to no value and aren’tdirectly related to materials sorting (e.g.,removing caps from plastic bottles).
Sorting rates will be improved and the amount of materialsrecovered may increase if less time is spent on “no value added”activities such as this. In this example, if the goal of removingthe plastic caps is to prevent trapped air from reducing balingdensities purchasing a plastics perforator and perforating theplastics prior to baling will likely be more cost effective in thelong-term.
If quantities of some recovered materials arevery low (even with relatively high prices) theeconomics of sorting these materials off the lineshould be reviewed and consideration given todiscontinuing sorting these items. Examplesfrom some of the MRFs assessed include:• Groundwood computer printouts (7 tons/yr.
for total revenue of $273).• Colored ledger (1 ton/yr. for a total revenue
of $44).• Glossy ledger (1 ton/yr. for a total revenue
of $27).• PVC plastic tubs (1 ton/yr. for no revenue).
In this last example the MRF had a market thatwould take it for free and they pulled the PVCout simply because it came in with the otherplastic containers.
The cost of sorting, preparing, and marketing a given productneeds to be balanced with the additional revenues received forrecovery or upgrading of that material.
As an example, the fibers noted on the left generated totalrevenue of $344. Marketed along with the mixed paper thismaterial would have generated $135 in revenue (conservativeestimate). If this were the case the cost of handling thesematerials separately would have to have been approximately$210 (annual cost) just to break even. The added cost forhandling was likely much more than this.
The PVC plastics are another good example. Had this materialended up in the processing residues generated at the MRF thecost for managing it as a residue (collection and disposal) isestimated at less than $300. Again, the added cost for sorting,baling and marketing this material is estimated at considerablymore than this.
MRF Operational Assessment Final Report and Optimization Guide
Tim Goodman & Associates | August 2003 30
3.3.2 Mechanical Sorting of Materials
Mechanical sorting methods commonlyemployed at MRFs include such thingsas screens (trommel screens, diskscreens, star screens, vibrating or shakerscreens); air classifiers, magnets(suspended magnets, magnetic drums,magnetic head pulleys both stationaryand portable units), and eddy currentseparators. These methods of sortingvarious feedstock and material streamsare typically based on one of threeseparation techniques – size, weight, ormagnetic properties. A fourth type of
automated sorting method involves optical or chemical scanning devices used primarily for glassor plastic containers. The scanners sort out materials based on color, material densities, or resintype. For all but the largest MRFs these systems are currently not cost effective.
Though some level of manual sorting is still required, mechanical sorting methods cansupplement the hand sorting of materials. In many situations mechanical sorting of incomingmaterials, especially at the front end of the processing line, can be very effective in breakingdown the feedstock into smaller components that can be efficiently sorted manually. This canlead to reductions in the labor needed to manually sort materials and the associated reduction inlabor related costs (wages, benefits, insurance, and worker comp claims, etc.). On the otherhand, mechanical sorting equipment can have a high capital cost as well as ongoing operationalcosts associated with maintenance, repairs, energy usage, and downtime due to mechanicalfailure.
Whether or not to employ mechanical sorting methods in a MRF, and to what extent mechanicalsorting should be implemented, will depend on a number of factors including, but not limited to:
• Facility throughput;
• Marketed materials specifications and anticipated revenues;
• Design/layout of the facility; and
• Available labor pool and area wage rates.
As an example of this last point, one of the MRFs examined in this study had an annual cost forstaffing the sorting line of approximately $24,000. The local DAC, who provides the sortinglabor, also picks up all benefits and workers compensation coverage. This cost center makes upapproximately 5% of the annual facility budget.
With the exception of some form of mechanical separation of metals none of the MRFs reviewedutilized mechanical sorting systems. Four of the five MRF’s participating in the study used someform of mechanical sorting for the removal and or separation of metal containers. Two facilities
MRF Operational Assessment Final Report and Optimization Guide
Tim Goodman & Associates | August 2003 31
use self-cleaning suspended magnets for sorting ferrous directly off the line while two facilitiesuse portable magnetic head pulleys as a supplement to hand sorting of ferrous and aluminum. Inthis latter case the facilities ran the hand-sorted aluminum fraction through the portable units toremove any ferrous containers that may have been missorted. None of the participating MRFswere utilizing eddy current separators for the recovery of aluminum.
Some of the things to consider when looking at the use of mechanical methods for the sorting ofmetals are summarized in Table 3.4
Table 3.4Mechanical Sorting of Metals
Efficiency Considerations
Concepts/Principles/Practices Potential Benefits/Comments
When using a self-cleaning suspended magnet topull ferrous metals from mixed containersflowing across a sorting belt, remove large items(plastic film, bagged materials, bulky HDPEplastic containers) prior to the magnet.
This will prevent larger materials from jamming the conveyorunder the magnet’s head, expose more metal for recovery by thesuspended magnet, and increase the ferrous recovery rate.
The ideal installation of a suspended magnet isover the trajectory of material discharged from aconveyor belt. In this position the material ismoving directly toward the magnetic face and itsmomentum increases the recovery of the ferrous.
This assumes a rapid belt speed. As the belt speed decreases thetrajectory of the material becomes more nearly vertical. Thisrequires the repositioning of the magnet back over the headpulley in a vertical position.
Providing a clearance height of 12” to 15” frommagnet head to top of belt should allow non-ferrous items such as aluminum, glass andresidue to pass under the unit without interferingwith the recovery of ferrous containers.
The pulling strength of many suspended magnets can beadjusted to compensate for various clearance heights. Doing sowill allow for the effective recovery of ferrous containerspassing under the magnet.
When using a suspended magnet, the effectivemagnetic width of the device should provide fullcoverage of the sorting belt.
If the effective magnetic width of the magnet doesn’t cover theentire width of the sorting belt, recovery rates could be less.
If the sorting conveyor used for sortingcontainers is also used for sorting fibers,consider mounting the suspended magnet on aceiling track or on a swinging arm or gate.
During sorting of fibers or of segregated container streams (i.e.,all plastics, all glass, etc.), moving the magnet out of the waywill make the sorting process much more efficient.
When sorting fibers or segregated containerstreams, turn the magnet off.
Reduces energy consumption.
As aluminum beverage containers are generallythe most valuable commodity recovered at afacility on a per ton basis, running sortedaluminum through a portable magnetic headpulley unit could improve product quality andrevenues at little extra cost.
Increases recovered product quality which could increaserevenue received for the materials. A cost/benefit analysisshould be performed before hand however to determine if theextra time and cost are worth it.
Though not generally cost-effective in a smallMRF, the addition of an eddy current separatormay be cost effective in larger facilities or inFEP facilities where MSW is the feedstock.
Due to the high cost of eddy current separators and the relativelylow volumes of aluminum recovered at small MRFs, it isdifficult to justify the upfront cost in these applications.
If putting in an eddy current separator, install theunit as close to the end of the line as possibleand conduct most of the other screening andsorting prior to this stage.
As noted previously, eddy current separators are expensivepieces of equipment. By limiting the tonnage of materials goingto the unit (through screening and sorting efforts) you can savesome expense by going to a smaller eddy current unit.

MRF Operational Assessment Final Report and Optimization Guide
Tim Goodman & Associates | August 2003 32
3.4 MATERIALS BALING
Baling of sorted fibers, metals, and plastics offers a wide variety of advantages in the operationof a MRF. Among these are improved on-site storage, improved efficiencies in getting materialsto market, and, in most cases, wider marketability and higher pricing. In determining the bestbaler for a specific application or facility there are a number of important considerations thatneed to be taken into account including:
• Type and characteristics of thematerials being baled. Will the balerbe used strictly for OCC or will it beused for baling other fibers as well?How about other materials such asmetals or plastics? These factors willdetermine how much compression(force) is required, what plane ofcompression is utilized (vertical orhorizontal), and the requirement formaterials conditioning (fluffing ofpaper, as an example) prior to baling.
• Volumes and desired throughput of materials. How fast will the baler run (cycle time) inorder to process the volumes of materials anticipated?
• Size of material being fed to the baler. The hopper opening needs to be big enough tohandle the type of material you’re baling or bridging of material could become a continuousproblem.
• Physical size of the baler in relation to the space it’s placed in. For example, a baler mayphysically fit into a space with a 12-foot ceiling height but if it needs a 14-foot clearance atthe top for loading the hopper it won’t be functional. Additionally, space needs to befactored in for the ejection and handling of bales. Baling up against a short wall with nospace for material handling equipment will also impact the baler’s functionality.
• Size and densities of the bales produced. Will the bale produced meet the physicalspecifications of the markets you are selling to?
Knowing the type and volume of materialrequiring baling, along with any spacelimitations, will help in determiningwhether a horizontal baler or a verticalbaler would be the appropriate choice for agiven application. Typically, with morethroughput, and the need to handle morevaried materials, a horizontal baler willlikely be the best choice.

MRF Operational Assessment Final Report and Optimization Guide
Tim Goodman & Associates | August 2003 33
Vertical balers are often used in applications where space is tight, materials less varied, andthroughput is low. There have been applications, however, where a small MRF has been able toproduce a variety of marketable products using several vertical balers, each dedicated to aspecific material, in their operations.
Table 3.5 provides examples of some of the concepts, principles and practices that willcontribute to improved efficiencies in baling operations.
Table 3.5Materials Baling
Efficiency Considerations
Concepts/Principles/Practices Potential Benefits/Comments
For added long-term cost savings, utilize aconveyor system to move materials into the balerhopper.
Upfront cost may be higher but there is likely to be a quickpayback related to reduced labor needs. Additionally, aconveyor system will have a faster feed rate than manualloading resulting in the baler performing closer to its rated cycletime (i.e., 10 bales/hour, 20 bales/hour, etc.).
Develop and maintain a preventive maintenanceprogram/schedule for each baler.
Benefits include less costly repairs and maintenance over thelong-term, potential longer life of equipment, and long-termhigh levels of performance and efficiency.
For balers that are used for a variety of materials,don’t feed materials into the baler until you haveenough for a successive run of bales. The moreconstant the feed the more productive the machine.
Loading materials into a baler and storing them there untilsufficient quantities are available to produce a bale will result inthe baler remaining idle when it could be used for baling othermaterials.
When buying a new baler, consider a morepowerful machine that makes denser bales.
If you can take the same amount of material that went into 20bales and fit it into 13 bales this could reduce handling costs, thespace needed for bale storage, and over-the-road transportationcosts (maximize truck loads for a reduced cost per ton mile).
Consider motor size (HP) and energy efficiencyratings in selecting a baler.
Energy usage is one of the biggest costs in baling operations.Using energy efficient equipment will help reduce this cost.
The type of material being baled, the size anddensity of the bales, and the type of baling wireused all have an impact on the amount of balingwire used. When wiring paper bales a lightergauge wire is adequate (14 to 12 gauge). Becauseplastics have more memory (e.g., they expandmore to their original shape after baling), a heavierwire (9 gauge) is usually recommended. It is alsorecommended to wire plastic bales with non-corrosive, galvanized baling wire especially if thebales will be stored outdoors.
The cost of baling wire is another large cost in balingoperations. Obtaining good densities and using the right typeand amount of wire for the product being baled can help controlwire usage costs.
Not only will this result in less wire required when a material isfirst baled, it will also reduce the need for rebaling materials thathave broken apart because of the incorrect type or amount ofwire used.
When baling plastics, the use of a perforator priorto baling can increase densities up to 20%.
As noted previously, increased bale densities could reduce thenumber of bales that need to be made, handling costs, spaceneeded for bale storage, and over-the-road transportation costs.
For infeed quality control checks instead ofstationing pickers adjacent to below gradeconveyor hoppers or standing on above gradehopper frames, construct safe and secure elevatedplatforms along the inclined conveyors forretrieval/removal of contaminants or for breakingup bulky slugs that could cause bridging.
An elevated platform will eliminate the need for excessivebending, stretching, and balancing on structures being used forpurposes other than what they were designed for. This in turnshould lead to an improved efficiency and effectiveness in thequality control operation.

MRF Operational Assessment Final Report and Optimization Guide
Tim Goodman & Associates | August 2003 34
3.5 GLASS RECOVERY AND PROCESSING
MRF’s in rural areas often face agreater challenge in recovering andmarketing glass. Though the pricepaid for container glass does notfluctuate significantly there is only onemajor glass reprocessor in the state andthat market is located in theMinneapolis/St. Paul metro area.Generally, large volumes of glass arenot generated by Greater MinnesotaMRFs and the glass that does comethrough these MRFs is often brokenand contaminated with other materials.
Additionally, the weight of glass and the distance from generation to the major markets directlyimpacts the economics of transportation to markets.
A variety of the MRFs participating in the study have found ways to improve the economics oftheir glass recovery operation though the gross revenue they receive for their glass ranges from0% up to 6% of the annual revenues they receive. Based on the recovery and processingmethods utilized by these MRFs, Table 3.6 provides some examples of concepts, principles andpractices that can be considered.
Table 3.6Glass Recovery and Processing
Efficiency Considerations
Concepts/Principles/Practices Potential Benefits/Comments
As noted previously take steps to minimize glassbreakage such as having glass stored in bunkerswith other materials such as plastic containers toprovide cushioning, adding deflection ramps andrubber baffles at impact points, and utilizingdrop chutes that reduce drop distances andencourage glass bottles to roll rather than break.
Increases the amount of glass that can be effectively andefficiently recovered and decreases the amount of residuerequiring disposal.
If distances to major glass markets are too greatconsider alternative local markets such asmunicipal highway departments, gravel pitoperations, and sandblasting companies.
May not have to color sort glass or remove all contaminants.Transportation costs may also be reduced. Glass crushing mayor may not be necessary depending on the local market.
Conduct an analysis to determine if crushing theglass prior to shipment to market could reducelong-term transportation costs.
In one example, a community is not crushing its glass prior todelivery to market. Revenues received for the glass do not evencover the cost of transportation. Crushing before hand couldimprove over-the-road weights and transportation costs resultingin net revenue for materials. The investment payback period forpurchase and operation of a glass crusher was estimated atapproximately one year.
If there is little to no difference in the pricereceived for color sorted glass (green andamber) and mixed glass, do not color sort.
Improves sorting efficiencies and materials handling in movingcontainers of sorted glass around.

MRF Operational Assessment Final Report and Optimization Guide
Tim Goodman & Associates | August 2003 35
Table 3.6Glass Recovery and Processing
Efficiency Considerations (continued)
Concepts/Principles/Practices Potential Benefits/Comments
If no markets are available for certain categoriesof glass (i.e., green glass, mixed glass) minimizeits handling by negatively sorting it off the endof the conveyor with other residues going todisposal.
Reduces handling costs.
Additional glass containers can be recovered byhaving a bin nearby while sorting othermaterials (i.e., fibers, metals, plastics) andthrowing the occasional glass container in thebin.
One facility has a specially fabricated chute toward the front oftheir sorting line. When sorting these other materials the firstsorter will pull out the occasional glass container and throw itdown the chute which empties into a designated bin for glassjust below the elevated sorting line.
If the identified glass markets do not requirecolor sorting or crushing eliminate theseactivities to minimize the handling of glass asmuch as possible.
An example observed at one facility demonstrates this point.The glass stream, which comes in to the facility as a separatestream, is pushed into a bunker that empties into an inclinedconveyor hopper. The material travels up the conveyor and outthe sidewall of the facility. From there it drops 10 feet into aroll-off box which is delivered to the local highway departmentfor use as roadbed aggregate. In this case the drop of 10 feetinto the roll-off box breaks up the glass and helps improve thetransportation costs by increasing the over-the-road weight ofthe load.
If glass is crushed prior to marketing consider afeed system that will automatically feed theglass to the crusher with minimal laborinvolvement. An example is a speciallydesigned container that the glass is thrown intoduring the sorting process. The container isdesigned so that it fits in the hopper of the glasscrusher and has a manually operated trap doortoward the bottom of the container. Using aforklift the container is positioned in the crusherhopper and the operator pulls a cord to lift thetrap door. The glass self-feeds into the hopper.
Quicker, safer, and more efficient than hand feeding glasscontainers into the glass crusher.
3.6 PRODUCT STORAGE, TRANSPORTATION, AND MARKETING
Once incoming materials have been received and processed they go into product storage to awaitdelivery to markets. Having adequate storage space for final product that will also protect theproduct from degradation while awaiting delivery to market is crucial. If such storage space isnot provided a variety of problems can occur including selling product prematurely (when notenough has accumulated to provide a full load or to take advantage of rising commodity prices)and receiving low prices or having loads rejected due to poor quality and product contamination.This last issue can lead to further problems with markets not wanting to purchase products froma particular MRF or purchasing materials only on a spot market basis.
Preferably all materials awaiting marketing should be stored inside or at least under cover. Thisis especially true of fibers, which will absorb moisture when wet resulting in a degraded product.
MRF Operational Assessment Final Report and Optimization Guide
Tim Goodman & Associates | August 2003 36
Those materials that are stored outside shouldbe stored in such a way as to minimizecontamination (i.e., away from other materialsthat could contaminate the stored product, onconcrete pads to minimize the accumulation ofdirt and mud, etc.) and should be delivered tomarket in as short a time period as possible. If aproduct will be in storage for an extended periodof time it should not be stored outside. Forexample, ferrous will rust over time when wetand HDPE plastics will be degraded whenexposed to ultra-violet light for several weeks.Some commodities such as glass are moreweather resistant but even then the outsidestorage of uncovered bins or roll-off containersof glass will be prone to collection of dirt andother contaminants.
Likewise, having a secure long-term market for materials is crucial to operating efficiencies at aMRF in that those markets will dictate how much and what kind of processing is required as wellas providing an outlet for processed materials and the necessary revenue for continued operationof the MRF.
Materials to be marketed should be prepared in such a way as to meet delivery specifications tothe market (i.e., bales of a certain size and density, clean, minimal to zero contaminants, etc.).Regardless of whether materials are sold to local markets (e.g., insulation manufacturer), directlyto larger regional or national markets (e.g., paper mills, glass cullet markets), or to a variety ofmarkets via a commodity broker having a written contract will offer some protection fromfluctuating prices or from having the market reject loads without good reasons.
The conditions and requirements that can beaddressed in a marketing agreement willvary widely depending on a number offactors such as the specific material andquantities of the material being sold, thelevel of processing provided by the MRF,specific requirements of the market buyingthe materials, and many other potentialconditions and requirements to numerous tomention. Items that should be addressed ina marketing agreement, though certainly notall-inclusive, include such things as:
• Material specifications that need to bemet by the processor (definition ofcommodity, definition of contaminants,
MRF Operational Assessment Final Report and Optimization Guide
Tim Goodman & Associates | August 2003 37
allowable percentage of contaminants, preparation specifications, etc.)
• Minimum quantities and frequency of collections/deliveries;
• Delivery or pickup site;
• Price to be paid for materials and, if applicable, the formula used to determine the price to bepaid;
• Minimum per unit revenue (floor price) seller will receive for materials;
• What to do when value of commodity falls below the floor price;
• What party arranges for and pays for loading and transportation of materials to markets;
• Procedures for handling rejected loads; and
• Term of contract.
Some of the things to consider when looking at product storage, transportation, and marketingare summarized in Table 3.7.
Table 3.7Product Storage, Transportation, and Marketing Considerations
Concepts/Principles/Practices Potential Benefits/Comments
Keep final product storage area free of unprocessedmaterials and accumulated supplies and equipment.
Among other things this will reserve space for productstorage during the intervals between shipping to marketsand it will improve storing/loading efficiencies if othermaterials don’t need to be moved or gone around during thestorage/loading process.
Make market arrangements to have a tractor-trailer orother appropriate delivery vehicle staged on-site and storematerials to be transported directly into the tractor-trailer.
Storage space will be preserved for other commodities.Double handling of materials during the storage/marketingoperation will be reduced or eliminated.
Store materials that have the quickest turnaround timefrom storage to market nearest the loading dock.
Operational efficiencies in loading materials for delivery tomarket will be improved.
If availability of indoor storage space is an issue considerstoring market ready materials in trailers staged on-site.
Reduces the potential for contamination from weather andmud. If the tractor-trailers are roadworthy and can be usedfor transporting materials to market this will also reduce theneed for double handling of materials.
Materials that are stored outside should be:• Stored on a concrete pad or other impervious surface
to minimize contact with dirt/mud (surface should beslightly sloped to promote positive drainage).
• Covered to protect against degradation frommoisture or light.
• Limited to materials that have a quick turnaroundtime from storage to market (a month or less)
Reduces the potential for product contamination ordegradation. This in turn can lead to higher prices formaterials and a lessened potential for rejected loads.
As noted previously consider baling materials to improvedensities.
The benefits of baling include:• Baled materials typically generate a higher per unit
revenue ($/ton) than loose materials.• Baled materials take up less room in storage.• Baling allows more weight per volume to be shipped
translating to a reduced over-the-road transportationcost.

MRF Operational Assessment Final Report and Optimization Guide
Tim Goodman & Associates | August 2003 38
Table 3.7Product Storage, Transportation, and Marketing Considerations (continued)
Concepts/Principles/Practices Potential Benefits/Comments
Maximize material shipments delivered to market. Inaddition to increasing load densities by baling (i.e.,fibers, plastics, aluminum, etc.) or crushing (i.e., glass)attention should be paid to how the transport vehicle isloaded to ensure loads are “full” loads.
In addition to improved over-the-road transportation costsmany markets have a minimum load weight requirement. Notmeeting this requirement can often lead to a financial penaltyresulting in reduced revenue.
If insufficient quantities of materials are recovered tointerest potential markets consolidating those materialswith materials from other counties or municipalitiescould help attract the necessary markets. Thisapproach is termed “cooperative marketing” and isexemplified in Minnesota by the Southeast MinnesotaRecyclers Exchange (SEMREX).
The concept of cooperative marketing has been very effectivein a variety of locations (southern Minnesota being one) andhas given smaller generators of recyclables more leverage inobtaining secure markets and relatively stable prices.
If the economics associated with traditional markets areunattractive (i.e., too costly to process materials tomeet specifications, too costly to transport materials todistant markets, etc.) consider developing localalternative markets for some of the recoveredmaterials.
Historically examples of alternative markets have includedanimal bedding or local cellulose insulation manufacturers(newspaper) or roadbed aggregate (glass). Though therevenue received for these materials is generally low, if any atall, the processing and transportation costs are also generallylow and there is a cost avoidance of having to dispose of thismaterial.
Balance marketing decisions for specific materials onquantity of materials recovered, processing cost, andrevenue received.
For example, if the additional revenue generated frommarketing natural HDPE recovered in an operation is $3,000more than if it was marketed along with the pigmented HDPEbut it costs $4,000 to sort and process this material the addedeffort is not worth the added revenue.
Considering the types and quantities of materialsgenerated assess the advantages and disadvantages ofmarketing directly to an end-market versus a broker.
There are a variety of advantages and disadvantages in goingdirectly to an end-market versus going through a broker.Some of these include:• An end-market, such as a paper mill, is likely to give you
a higher price for a specific grade(s) of material if youcan guarantee the quality and the quantity they demand.Going through a broker will usually result in a lowerprice per ton since the broker takes a portion of therevenue to cover his operation.
• Going through a broker will generally offer a widervariety of markets (market diversity) and as a result theycan shop around for the best price. Selling directly to amill may limit the grades of paper they will be willing topurchase and the price they can pay for that paper.
Determine what you need in a contract and what youcan live with and then negotiate based on that.Checking with other operations to see how theircontracts are structured and what their markets offer inthe way of service is recommended.
As noted previously there are a variety of conditions anditems that should be addressed in a market contract to protectthe seller from wild fluctuations in the price paid for a specificcommodity. Understanding what specifications need to bemet, what recourse a seller has if a load is downgraded orrejected, who is responsible for arranging and paying fortransportation to market, and a host of other conditions andcontingencies should be addressed in the contract to offershared risk (and reward) between the parties. Seeking theadvice of an attorney with expertise in this area should beconsidered.
MRF Operational Assessment Final Report and Optimization Guide
Tim Goodman & Associates | August 2003 39
4.0 HEALTH AND SAFETY CONSIDERATIONS
Health and safety are crucial components in all aspects of MRF operations. The day-to-dayoperations of a MRF has a variety of potential safety hazards including:
• Tipping floor operations where people are working in close proximity to vehicles deliveringmaterials and mobile equipment pushing and carrying materials into processing areas orshort-term storage.
• Handling of a wide variety of materials, which have the potential for cuts, abrasions, sticks,and injuries associated with heavy items falling.
• Sorting operations where in addition to those injuries noted above there is a potential forphysical strain, getting caught in material transfer and conveying equipment, or exposed toother biological or chemical hazards.
• Baling and other processing equipment operations where there is a potential for injury, orworse, when safe operating procedures are not practiced.
• Injury due to unsafe materials storage and loading procedures.
From the delivery and tipping of materials on the floor through processing and on to storage,loading and transporting of recovered materials attention to health and safety issues should be inthe forefront of all operational functions.
The scope of the MRF operations optimization study addressed efficiency issues and equipmentneeds. It was never intended to address health and safety issues. However, during the course ofthe project a number of health and safety related issues were observed and were brought to theattention of facility management. Examples of some of these health and safety observationsincluded improper and unsafe procedures for clearing jams in balers and conveying equipment,unsafe operation of mobile equipment, and workers not using the appropriate personal protectiveequipment.
Rather than list and discuss all the recommended safety practices which should be routinelyapplied in the operation of a MRF, the reader is recommended to a couple of sources for detailedinformation on BMPs as it relates to safe MRF operations.
The Minnesota Occupational Safety and Health Administration (MNOSHA) offers a non-regulatory assessment service. Using the Department of Labor and Industry’s free consultationservice, MNOSHA Workplace Safety Consultation, any workplace can find out about potentialhazards at their locations. Employers that request this service must commit themselves tocorrecting serious job safety and health hazards and may be able to apply for a safety grant of upto $10,000 to abate safety hazards. This program is completely separate from the OSHAcompliance inspection activities and no citations are issued as part of a consultation visit. Formore information on this program, contact MNOSHA Workplace Safety Consultation at 651-284-5060 or call toll-free at 1-800-657-3776. They can also be contacted via e-mail [email protected].
MRF Operational Assessment Final Report and Optimization Guide
Tim Goodman & Associates | August 2003 40
The Environmental Industry Associations (EIA) has published a Manual of RecommendedSafety Practices. The intended purpose of the manual is to familiarize the reader with OSHAand USDOT regulations that are related to waste service operations, related safety standards suchas the ANSI Z245 standards for waste and recycling equipment, and to provide some guidance inimproving the safety programs at waste service facilities.
The manual covers such areas as safety basics, core practices, mobile operations, processingequipment operations, landfill operations, transfer station operations, and MRF operations. Thesection dealing with MRF operations (Section VIII) addresses such topics as training, personalprotective equipment, vehicular traffic management and tipping floor operations, processingoperations, and restricted work areas.
The Waste Equipment Technology Association (WASTEC), a member organization of EIA,holds the Secretariat for the American National Standards Institute (ANSI) Z245 Committee.This Committee develops all of the safety standards for the waste industry and sets outrequirements for manufacturers, distributors, installers, maintenance personnel, employers, andemployees. The six ANSI safety requirements dealing with the waste services industry include:
• ANSI Z245.1 – Mobile Wastes and Recyclable Materials Collection, Transportation, andCompaction Equipment.
• ANSI Z245.2 – Stationary Compactors.
• ANSI Z245.30 – Waste Containers.
• ANSI Z245.41 – Facilities for the Processing of Commingled Recyclable Materials.
• ANSI Z245.5 – Baling Equipment.
• ANSI Z245.60 – Waste Containers (Compatibility Dimensions).
To obtain more information on the Manual of Recommended Safety Practices and the ANSIZ245 equipment safety requirements, or to order a copy of the manual and/or the ANSI Z245requirements, the EIA can be contacted at 1-800-424-2869 or through their website atwww.envasns.org.
MRF Operational Assessment Final Report and Optimization Guide
Tim Goodman & Associates | August 2003 41
5.0 CONCLUSION
This MRF Optimization Guide is just a beginning in identifying ways that MRFs can improveefficiencies in their operations. Not all concepts and practices listed in this guide will beapplicable to all MRFs though it is hoped that most MRFs will find some useful information inthe concepts and practices discussed. Additionally it should be noted that the informationpresented in this guide are by no means the only methods MRFs can use to optimize theiroperations.
Each MRF using this guide will have unique conditions associated with quantities and types ofmaterials accepted and processed, the design/layout of the MRF, the type of sorting andprocessing methods used, and the markets to which they’re selling their recovered materials.There’s little doubt that other methods for improving efficiencies can be identified in assessingoperations in a specific MRF. Based on the experience of the MRFs participating in this studythere were a number of common operational areas that were recommended to be examined forefficiency improvements. These areas included:
• Materials Receiving: Provide adequate space and efficient procedures for unloading materialsfrom collection vehicles. Move unloaded materials to processing or incoming materialsstorage as quickly and safely as possible while minimizing cross-traffic with otheroperations. Overall flow of materials starts with materials receiving. Flow of materialsthrough the MRF should proceed in a logical, orderly fashion minimizing backtracking ormultiple handling of materials.
• Materials Sorting: In small MRFs that are not heavily mechanized the efficient use of laborwill be critical in the overall sorting operation. Provide training to all sorters. Adjust transferconveyors, sorting line conveyors, and other related equipment so that materials to be sortedare easy to see and sort. Find the optimum conveyor speeds to control burden depth andmaximize sorting efficiencies. When it’s economical to do so add automation to the sortingprocedures (e.g. screens and magnets) as a way to reduce labor costs.
• Materials Processing: The types and quantities of materials to be processed along with thematerials specifications of the markets being sold to will determine the type and size of theprocessing equipment needed. High quality equipment that can meet the productspecifications required by your markets is a must. Undersized, underpowered equipment willadd to overall operating costs such as labor and energy usage. Oversized equipment maylead to that equipment being idle much of the time. Match the equipment to the quantitiesand flow of materials so it is in use much of the time but still has the capacity to meet peakflows when needed.
• Product Storage: Provide efficient procedures for moving finished product to storage andstored product into trailers or other containers for delivery to markets. Adequate indoorstorage space should be available to keep product susceptible to degradation from exposureto the elements, dirt, and other contaminants. Adequate storage space should also beavailable to ensure full loads of materials are available for shipment to markets as well as toriding out poor market conditions.
MRF Operational Assessment Final Report and Optimization Guide
Tim Goodman & Associates | August 2003 42
• Product Marketing: Viable, long-term markets should be available for all materialsrecovered. Ensure that market contracts are structured to provide a fair price for allcommodities and protection against falling prices (i.e., floor price received for materials,ability to wait out market conditions without being penalized for not shipping in a givenmonth, etc.). When possible diversify markets to allow flexibility in marketing materials.This can be accomplished a number of ways including contracts with multiple markets,moving materials through a broker, or participating with others in cooperative marketingefforts.
• Health and Safety Considerations: Make health and safety considerations an overriding issuein MRF operations. Provide the necessary health and safety training to all employees as wellas the appropriate personal protective equipment. Operating a MRF with health and safety inmind will improve efficiencies and help control costs associated with workers comp claims,rising insurance rates, lost productivity, and regulatory/legal issues.
Though the MRFs participating in the operations optimization study were all located inMinnesota, and all under 25 tons per day in throughput, many of the concepts and practices listedin this guide will likely be applicable to small MRFs nationwide. From that perspective thisguide should prove helpful for those similar facilities located outside of Minnesota.