mri anatomy and positioning series - hitachimed.com...mri anatomy and positioning series | module 8:...
TRANSCRIPT
MRI Anatomy and Positioning Series
Module 8: Cardiac Imaging

Table of Contents Introduction .................................................................................................................................................. 4
Cardiac Anatomy ........................................................................................................................................... 5
General Anatomy ...................................................................................................................................... 5
Pericardium ............................................................................................................................................... 6
Heart Walls ................................................................................................................................................ 7
Heart Chambers ........................................................................................................................................ 7
Heart Valves .............................................................................................................................................. 8
Great Vessels ........................................................................................................................................... 11
Coronary Arteries .................................................................................................................................... 14
Cardiac Veins ........................................................................................................................................... 16
Nerves of the Heart ................................................................................................................................. 18
Cardiac Physiology ...................................................................................................................................... 20
Blood Flow through the Heart ................................................................................................................ 20
Coronary Systole and Diastole ................................................................................................................ 22
The Cardiac Cycle .................................................................................................................................... 23
Conduction System of the Heart ............................................................................................................. 24
Electrocardiogram (ECG or EKG) ......................................................................................................... 25
Cardiovascular Pathology............................................................................................................................ 28
Heart Attack vs. Cardiac Arrest ............................................................................................................... 28
Coronary Artery Disease ......................................................................................................................... 28
Cardiac Arrhythmias................................................................................................................................ 29
Valve Diseases ......................................................................................................................................... 30
Congenital Heart Defects ........................................................................................................................ 31
Cardiomyopathy ...................................................................................................................................... 34
Carditis .................................................................................................................................................... 35
Cardiovascular Treatments ......................................................................................................................... 38
Cardiac MRI ................................................................................................................................................. 46
Cardiac Sequences .................................................................................................................................. 46
Cardiac Gating ......................................................................................................................................... 51
MRI Studies ............................................................................................................................................. 52

Heart Structure Evaluation ................................................................................................................. 53
Cardiac Function ................................................................................................................................. 55
Phase Contrast Imaging ...................................................................................................................... 58
Myocardial Perfusion and Delayed Enhancement .............................................................................. 59
Coronary MRI ...................................................................................................................................... 61
Cardiac Devices in MRI ............................................................................................................................ 62
Stents and Valves ................................................................................................................................ 64
Pacemakers and ICDs .......................................................................................................................... 66
MRI Coils for Cardiac Imaging ..................................................................................................................... 70
Oasis Open MRI System .......................................................................................................................... 70
Coils and Positioning ........................................................................................................................... 72
RAPID Body Coil .............................................................................................................................. 73
Flex Body Coil .................................................................................................................................. 73
Echelon OVAL MRI System ...................................................................................................................... 74
Coils and Positioning ........................................................................................................................... 77
WIT Torso Coil ................................................................................................................................. 78
WIT Cardiac Coil .............................................................................................................................. 79
Echelon MRI System................................................................................................................................ 80
Coils and Positioning ........................................................................................................................... 82
RAPID Torso/Body Coil .................................................................................................................... 82
Scan Setups ................................................................................................................................................. 84
Vertical Long Axis .................................................................................................................................... 84
Short Axis ................................................................................................................................................ 85
Horizontal Long Axis ................................................................................................................................ 87
Three Chamber View .............................................................................................................................. 88
Relationship of Basic Views..................................................................................................................... 89
Aortic View .............................................................................................................................................. 89
Interactive Scan Control .......................................................................................................................... 91
Coronary Artery Imaging ......................................................................................................................... 92
Quantitative Analysis .............................................................................................................................. 94
Appendix A: References for Cardiac Seminar ............................................................................................. 95
Appendix B: References for Anatomy Pictures ......................................................................................... 100

MRI Anatomy and Positioning Series | Module 8: Cardiac Imaging
4
Introduction
Welcome to the Hitachi Medical Systems America, Inc. MRI Anatomy and Positioning Series. We offer teaching modules to allow users of Hitachi MRI scanners to review anatomy that will be seen on various MRI exams, and to enhance their positioning skills. Competent positioning ensures the best possible image quality for your studies.
In this eighth module, we will examine the anatomy of the heart, including the chambers, valves, great vessels, coronary arteries, cardiac veins, and the nerves to the heart. We will discuss cardiac physiology, incorporating blood flow through the heart, coronary systole and diastole, the events that occur during the cardiac cycle, the conduction system that keeps the heart beating, and an explanation of the waves seen on an EKG. We will explore some of the more common cardiovascular pathologies, such as coronary artery disease, arrhythmias, valve issues, congenital defects, cardiomyopathy, and various types of carditis. We will briefly review some of the treatments available for cardiovascular disease, such as balloon and stent angioplasty, CABG, ablation, pacemakers, valve replacement, ICD and VAD, and medications.
Our discussion of cardiac MRI will focus on the types of sequences that result in black blood or bright blood images, and those used for delayed enhancement and phase contrast sequences. We will review cardiac gating and examine the variety of uses for MRI in studies of heart structure, cardiac function, and coronary artery studies. The main cardiac imaging planes and their resultant images are presented. A discussion of various cardiac devices and their MRI safety issues is also included.
We will consider the various coils available for cardiac examinations and review ECG gating on the Oasis, Echelon OVAL, and Echelon MRI systems. Discussions are included concerning patient positioning on each system with attention to safety details. RF coil cables should always be routed in a manner that will avoid contact with the patient. Table and accessory pads should be used to assist in eliminating, or at least minimizing, the amount of each patient’s skin-to-skin, skin-to-bore, or skin-to-cable contact. Reducing the amount of each of the aforementioned contacts reduces the patient’s chances of thermal injury. Please refer to the MR Patient warming Prevention Plan published by Hitachi Medical Systems America, Inc. for more information concerning the prevention of patient warming.
CAUTION: Always route coil cables away from the patient, using pads and/or cable covers to eliminate or minimize the chances of contact between the coil cable and the patient. Failure to do so could result in a thermal injury.
CAUTION: Always use the pads that are provided to eliminate or minimize the patient’s skin-to-skin, skin-to-bore, and skin-to-cable contact. Failure to do so could result in a thermal injury.

MRI Anatomy and Positioning Series | Module 8: Cardiac Imaging
5
Cardiac Anatomy
General Anatomy
The heart is a muscular organ, about the size of a closed fist, which functions as the body’s circulatory pump. The heart pumps blood through the network of arteries and veins that make up the circulatory system. Together, the heart and circulatory system comprise the cardiovascular system.
The heart is located in the thoracic cavity, medial to the lungs, and posterior to the sternum (Figure 1). The true position of the heart in the body is oblique. The base of the heart is the superior portion, which is attached to the aorta, pulmonary arteries and veins, and the venae cavae. The base portion is turned upwards, and projects slightly on the right of the sternum. The inferior, narrow end of the heart is called the apex, which rests just superior to the diaphragm. The apex is turned downwards and projects to the left of the sternum. Because of its oblique orientation, approximately 1/3 of the heart’s mass is on the right side of the body, and 2/3 of the heart’s mass is on the left. The heart’s oblique orientation also affects the locations of the heart chambers relative to each other (Figure 2). The most superior and posterior chamber is the left atrium. The right ventricle is the most anterior chamber. The most inferior chamber is the left ventricle, as its superficial portion forms the apex of the heart (Figure 3).
Figure 1 Anterior view of chest showing location of heart
Figure 2 Inferior CT image of heart showing oblique orientations of atria and ventricles
Figure 3 Posterior view showing chamber orientations
R L

MRI Anatomy and Positioning Series | Module 8: Cardiac Imaging
6
Pericardium
The heart sits within a fluid-filled double-layered sac called the pericardium, which also surrounds the proximal ends of the aorta, vena cava, and pulmonary artery. Functions of the pericardium include keeping the heart contained in the chest cavity, preventing the heart from over expanding when blood volume increases, and limiting heart motion. The pericardium is divided into three layers, which are the visceral, parietal, and fibrous pericardium (Figure 4). The visceral pericardium, also called the epicardium, is the innermost layer of the sac, as well as the outer layer of the wall of the heart. The parietal pericardium lies between the visceral and fibrous pericardium. The fibrous pericardium is the outermost layer, which is strongly attached to the sternum, the great vessels, and the diaphragm. It is both fibrous and fatty, and serves to keep the twisting, contracting, squeezing heart within the middle mediastinum. Between the visceral and parietal pericardium lies the pericardial cavity, which is filled with pericardial fluid. This fluid is secreted by the serous visceral pericardium, and serves as a shock absorber by reducing friction between the pericardial membranes. The pericardial cavity of a healthy adult typically holds 15-50 ml. of this clear, straw-colored fluid. An abnormal accumulation of fluid in the pericardial cavity can result in a pericardial effusion. This fluid accumulation can lead to increased intrapericardial pressure, which can negatively affect heart function. Pericardial effusions can also be caused by pericarditis, which is an inflammation of the pericardium. Causes of pericarditis include viral or bacterial infections, kidney failure, and heart attack.
Figure 4 Layers of pericardium and heart wall

MRI Anatomy and Positioning Series | Module 8: Cardiac Imaging
7
Heart Walls
Like the pericardium, the wall of the heart is made up of three layers: the endocardium, the myocardium, and the epicardium (Figure 4). The endocardium is the simple squamous endothelium layer that lines the inside of the heart. It is very smooth, and is responsible for keeping blood from sticking to the inside of the heart, where it could form potentially deadly blood clots. The myocardium is the muscular middle layer of the heart wall that contains the cardiac muscle tissue. It makes up the majority of the thickness and mass of the heart wall, and is the part of the heart responsible for pumping blood. The epicardium is the outermost layer of the heart wall, also referred to as the visceral layer, or the innermost layer, of the pericardium. It is a thin layer of serous membrane that helps to lubricate and protect the outside of the heart. The thickness of the heart wall varies in different chambers of the heart, depending on the functions of each chamber.
Heart Chambers
The heart consists of four chambers; the two smaller upper chambers are the right and left atria, and the two larger lower chambers are the right and left ventricles. An internal wall of tissue called the septum divides the right and left atria and ventricles (Figure 5). The area of the septum that divides the atria is called the atrial or interatrial septum, while the area dividing the ventricles is called the ventricular or interventricular septum. The atria of the heart have a very thin myocardium, as they act as receiving chambers for blood, and are only required to pump blood to the nearby ventricles. The atria are connected to the veins that carry blood to the heart, with the right atrium receiving deoxygenated blood from the venae cavae, while the left atrium receives oxygenated blood from the pulmonary veins.
Figure 5 Atria, ventricles, and septa of the heart
The ventricles have a very thick myocardium, as they act as pumping chambers for blood and must send blood greater distances than the atria. The right ventricle has less myocardium in its walls compared to the left ventricle, as it pumps blood only to the lungs, which is done at a pressure of approximately 22 mm Hg. The left ventricle must pump blood to the entire body, and does so at a pressure of approximately 120 mm Hg. The ventricles are connected to arteries that carry blood away from the

MRI Anatomy and Positioning Series | Module 8: Cardiac Imaging
8
heart, with the right ventricle pumping deoxygenated blood to the pulmonary arteries, and the left ventricle pumping oxygenated blood to the aorta.
The right atrium and ventricle are considered the “pulmonary heart,” as they pump deoxygenated blood to the pulmonary circulatory loop. The left atrium and ventricle are termed the “systemic heart,” as they pump oxygenated blood to the arteries of the systemic circulatory loop. Both chambers on the right side of the heart are smaller and have less myocardium in their walls when compared to the left side of the heart. This size difference is related to their functions and the size of the two circulatory loops.
Heart Valves
The heart’s system of one-way valves prevents the regurgitation of blood. There are two basic types of heart valves: atrioventricular valves (inlet valves) and semilunar valves (outlet valves) (Figure 6). The atrioventricular (AV) valves are located in the middle of the heart between the atria and ventricles, with cusps or flaps that only allow blood to flow in one direction, from the atria into the ventricles. The AV valve between the right atrium and ventricle is the tricuspid valve, which is made up of three cusps or flaps. The AV valve separating the left atrium and ventricle is the bicuspid, or mitral valve, which has two cusps. The cusps separate to allow blood to pass through them into the ventricles, and connect to block regurgitation of blood. Opening and closing of the cusps of the AV valves is controlled by the papillary muscles, which attach to the lower portion of the interior wall of the ventricles (Figure 7). The papillary muscles are linked to the AV valve cusps by tendons called the chordae tendineae. These tendons are somewhat string-like in appearance, and are sometimes referred to as “heart strings.” As the papillary muscles decrease or increase tension on the AV valve cusps, the valves open or close. The papillary muscles contract with the ventricular muscles, which increases tension on the chordae tendinae. The chordae tendinae pull on the AV valve cusps to keep them from folding backwards, which closes the AV valves. During this contraction process, the AV valves look like domed parachutes, with the chordae tendineae acting as the ropes holding the parachutes taut (Figure 8). When the papillary muscles relax, tension is decreased on the chordae tendinae, and the AV valves open.
Figure 6 Bicuspid, tricuspid and semilunar valves; papillary muscles and chordae tendineae

MRI Anatomy and Positioning Series | Module 8: Cardiac Imaging
9
Figure 7 Functioning of atrioventricular valves
Figure 8 Functioning of papillary muscles and chordae tendineae

MRI Anatomy and Positioning Series | Module 8: Cardiac Imaging
10
The semilunar valves, so named for the crescent moon shape of their three cusps, are located between the ventricles and the arteries that carry blood away from the heart. The pulmonary valve is the semilunar valve found on the right side of the heart, which prevents the backflow of blood from the pulmonary trunk into the right ventricle. The semilunar valve on the left side of the heart is the aortic valve, which prevents the regurgitation of blood from the aorta back into the left ventricle. The semilunar valves are smaller than the atrioventricular valves, and do not have chordae tendineae to hold them in place. Instead, the three cusps of the semilunar valves are cup-shaped, to catch regurgitating blood. The pulmonary and aortic valves are open when the ventricles contract, to allow blood to flow out of the ventricles (Figure 9). Both of these valves use the blood’s pressure to snap shut, so they are closed when the ventricles relax, preventing blood from returning to the heart.
Figure 9 Functioning of semilunar valves

MRI Anatomy and Positioning Series | Module 8: Cardiac Imaging
11
Great Vessels
The great vessels include the five large vessels that bring blood to and from the heart: the superior vena cava, the inferior vena cava, the pulmonary arteries, the pulmonary veins, and the aorta (Figure 10). The superior and inferior venae cavae bring deoxygenated blood from the body to the heart, emptying into the right atrium. The superior vena cava brings blood from the head and upper body, entering the right atrium from an anterior position alongside the aorta. The inferior vena cava is fed by blood from the legs and lower torso, and enters the right atrium from a posterior position, inferior to the right pulmonary veins.
Figure 10 Anterior view of heart showing great vessels

MRI Anatomy and Positioning Series | Module 8: Cardiac Imaging
12
Pulmonary circulation disproves the concepts that all arteries carry oxygen-rich blood and all veins carry deoxygenated blood. It is more accurate to classify arteries as vessels that carry blood away from the heart, and veins as vessels that carry blood to the heart, as this is true for the case of the pulmonary arteries and veins (Figure 11). The pulmonary trunk exits the right ventricle on the anterior aspect of the heart, bifurcating into the right and left pulmonary arteries just inferior to the aortic arch. The pulmonary arteries transport the deoxygenated blood from the right ventricle to the lungs, projecting branches within the lungs. Four pulmonary veins transport oxygen-rich blood from the lungs back to the left atrium. Typically, there are both superior and inferior pulmonary veins emerging from each lung hilum, but this number can vary between a total of three and five veins. The right pulmonary veins pass behind the right atrium and superior vena cava. The left pulmonary veins pass in front of the descending thoracic aorta.
Figure 11 Pulmonary and systemic circuits

MRI Anatomy and Positioning Series | Module 8: Cardiac Imaging
13
The aorta is the largest single blood vessel in the body, with a diameter approximately equal to the thumb. It distributes oxygenated blood to all parts of the body through the systemic circulation, originating from the left ventricle of the heart and arching superiorly, before extending down to the abdomen. The aorta is typically divided into sections for anatomic review, which includes the ascending aorta, the aortic arch, the thoracic aorta, and the abdominal aorta (Figure 12).
Figure 12 Divisions of aorta
The ascending aorta begins at the opening of the aortic valve at the heart, running through a common pericardial sheath along with the pulmonary trunk. The aorta starts out posterior to the pulmonary trunk, but ends on its right and anterior side. At the interior root of the ascending aorta are the aortic sinuses or sinuses of Valsalva. They are three little pockets, found between the cusps of the aortic valve and the wall of the aorta, which give rise to the right and left coronary arteries.
The aortic arch loops over the right pulmonary artery and the bifurcation of the pulmonary trunk. It has three major branches, which include the brachiocephalic trunk, the left common carotid artery, and the left subclavian artery. The brachiocephalic trunk is the most anterior branch, supplying the right side of the head and neck, as well as the right arm and chest wall. The left common carotid artery is in the middle, and the left subclavian artery is the most posterior branch from the arch. The latter two vessels supply the same regions as the brachiocephalic trunk on the left side. Between the fourth and fifth thoracic vertebrae, the aortic arch ends and the descending aorta begins.
The descending thoracic aorta gives rise to intercostal as well as subcostal arteries, left bronchial arteries, and variable branches to the esophagus, mediastinum, and pericardium. Its lowest pairs of branches are the superior phrenic arteries, which supply the diaphragm, and the subcostal arteries for the twelfth rib.
The abdominal aorta gives rise to lumbar and musculophrenic arteries, renal arteries, and visceral arteries, such as the celiac trunk and superior and inferior mesenteric arteries. It ends in a bifurcation into the left and right common iliac arteries, as well as a smaller branch called the median sacral artery.

MRI Anatomy and Positioning Series | Module 8: Cardiac Imaging
14
Coronary Arteries
The coronary arteries are the network of blood vessels that carry oxygen- and nutrient-rich blood to the cardiac muscle tissue (Figure 13). Both the right and left coronary arteries arise from the aortic sinuses, which are small openings just above the three aortic valve cusps. The left aortic, or left-coronary, sinus contains the origin of the left coronary artery, and the right aortic, or right-coronary, sinus gives rise to the right coronary artery. The posterior aortic sinus does not give rise to a coronary artery, so it is also known as the non-coronary sinus. Since the coronary arteries emerge from the beginning of the aorta, they are receiving the oxygen- and nutrient-rich blood that is pumped from the left ventricle. The flow is greatest during ventricular diastole, when the ventricular chamber relaxes. The arteries lie in grooves or sulci, often covered by the epicardium, and sometimes by the myocardium as well. The left coronary artery is typically larger than the right, and the flow rate through the left is typically greater than that through the right during the cardiac cycle. There may be considerable differences in the anastomotic pattern of the left and right arterial branches. These branches penetrate the heart muscle, terminating in multitudes of arterioles that supply the vast capillary network among the muscle fibers. In the capillaries, the red blood cells provide oxygen and nutrients to the cardiac muscle tissue, and bond with carbon dioxide and other metabolic waste products to take them away from the heart for disposal through the lungs, kidneys, and liver. The apparent multiple communications among the left and right coronary arteries serve to protect the heart tissue from injury. The collateral circulation consists of a network of tiny blood vessels that are not open under normal conditions. If the coronary arteries narrow to a point where blood flow to the heart muscle is limited, as in coronary artery disease, collateral vessels may enlarge and become active. This allows blood to flow around the blocked artery to another artery nearby, or to the same artery past the blockage, to continue supplying the cardiac muscle tissue. If the blood supply to a portion of the heart is significantly reduced or cut off entirely, or if the energy demands of the heart become much greater than its blood supply, a myocardial infarction or heart attack, may occur. This can result in permanent damage to the heart muscle.
Figure 13 Coronary arteries

MRI Anatomy and Positioning Series | Module 8: Cardiac Imaging
15
The initial segment of the left coronary artery is called the left main coronary. It is less than an inch long and approximately the width of a soda straw. It quickly branches into two slightly smaller arteries, which are the left anterior descending and circumflex arteries. The left coronary artery and its branches supply the majority of the oxygenated blood to the ventricular myocardium, as well as to the left atrium left atrial appendage, pulmonary artery, and aortic root.
The left anterior descending artery (LAD) is embedded in the surface of the anterior aspect of the heart. It appears to be a direct continuation of the left coronary artery, and descends into the anterior interventricular groove. Branches of this artery enter the septal myocardium to supply the anterior two-thirds of the interventricular septum. It also supplies the anterior, lateral, and apical wall of the left ventricle, most of the right and left bundle branches, and the anterior papillary muscle of the bicuspid valve in the left ventricle. The LAD also provides collateral circulation to the anterior right ventricle, the posterior part of the interventricular septum, and the posterior descending artery. It is the most commonly occluded of the coronary arteries.
The circumflex artery circles around the left side of the heart, and embeds in the surface of the posterior aspect of the heart. It supplies blood to the left atrium, the posterior and lateral free walls of the left ventricle, and part of the anterior papillary muscle. The circumflex may give off a variable number of left marginal branches to supply the left ventricle, with the largest of these branches typically being the terminal branch. In approximately 40-50% of hearts, the circumflex artery supplies the artery to the SA node, which is involved in electrical conduction.
The right coronary artery emerges from the aorta into the atrioventricular groove, which is the area of separation between the atria and ventricles. Within millimeters, it gives off two branches: the conus artery, which runs to the right ventricular outflow tract, and the atrial branch, which gives off the SA nodal artery. The SA nodal artery runs along the anterior right atrium to the superior vena cava, encircling it before reaching the SA node, which is involved in the heart’s conduction system. The right coronary artery continues in the AV groove, giving off a variable number of branches to the right atrium and right ventricle. The most prominent branch is the right marginal branch, which runs down the right margin of the heart, supplying this part of the right ventricle. The right coronary artery curves posteriorly and descends downward on the posterior surface of the heart, giving off the posterior descending, or posterior interventricular branch. The posterior descending branch, along with branches of the circumflex artery, runs across the surface of the heart’s underside, supplying the inferior portion of the left ventricle and posterior aspect of the septum.
MRI Anatomy and Positioning Series | Module 8: Cardiac Imaging
16
Cardiac Veins
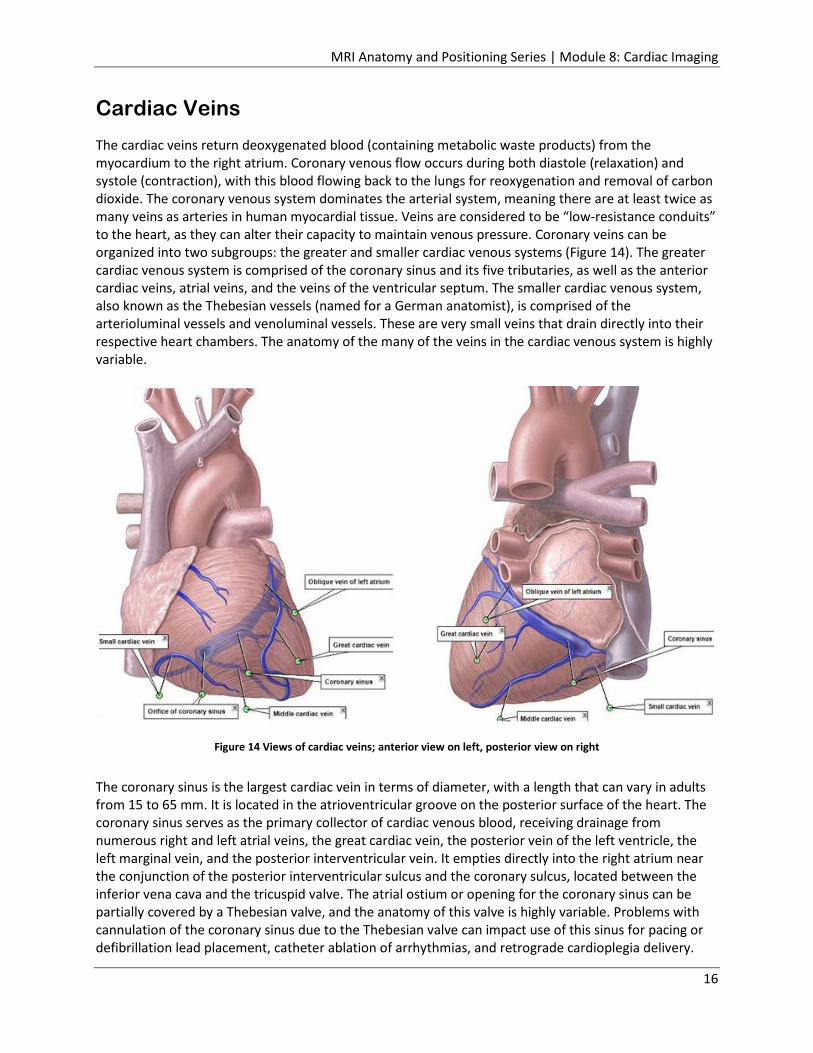
The cardiac veins return deoxygenated blood (containing metabolic waste products) from the myocardium to the right atrium. Coronary venous flow occurs during both diastole (relaxation) and systole (contraction), with this blood flowing back to the lungs for reoxygenation and removal of carbon dioxide. The coronary venous system dominates the arterial system, meaning there are at least twice as many veins as arteries in human myocardial tissue. Veins are considered to be “low-resistance conduits” to the heart, as they can alter their capacity to maintain venous pressure. Coronary veins can be organized into two subgroups: the greater and smaller cardiac venous systems (Figure 14). The greater cardiac venous system is comprised of the coronary sinus and its five tributaries, as well as the anterior cardiac veins, atrial veins, and the veins of the ventricular septum. The smaller cardiac venous system, also known as the Thebesian vessels (named for a German anatomist), is comprised of the arterioluminal vessels and venoluminal vessels. These are very small veins that drain directly into their respective heart chambers. The anatomy of the many of the veins in the cardiac venous system is highly variable.
Figure 14 Views of cardiac veins; anterior view on left, posterior view on right
The coronary sinus is the largest cardiac vein in terms of diameter, with a length that can vary in adults from 15 to 65 mm. It is located in the atrioventricular groove on the posterior surface of the heart. The coronary sinus serves as the primary collector of cardiac venous blood, receiving drainage from numerous right and left atrial veins, the great cardiac vein, the posterior vein of the left ventricle, the left marginal vein, and the posterior interventricular vein. It empties directly into the right atrium near the conjunction of the posterior interventricular sulcus and the coronary sulcus, located between the inferior vena cava and the tricuspid valve. The atrial ostium or opening for the coronary sinus can be partially covered by a Thebesian valve, and the anatomy of this valve is highly variable. Problems with cannulation of the coronary sinus due to the Thebesian valve can impact use of this sinus for pacing or defibrillation lead placement, catheter ablation of arrhythmias, and retrograde cardioplegia delivery.

MRI Anatomy and Positioning Series | Module 8: Cardiac Imaging
17
Many clinical cardiac procedures make use of the coronary sinus and other cardiac veins, as they are typically free of atherosclerotic plaques. However, venous valves within the coronary venous system may hinder advancement of guide wires, catheters, or pacing leads.
The great cardiac vein, the longest venous vessel of the heart, consists of the anterior interventricular vein and its continuation along the atrioventricular groove. It follows the left atrioventricular groove around the left side of the heart, continuing until it merges with the coronary sinus. The cardiac vein returns deoxygenated blood from the anterior surfaces of the left ventricle.
The lateral veins, also known as the left marginal veins or the obtuse marginal veins, course along the left side of the heart and drain the lateral wall of the left ventricular myocardium into the great cardiac vein or coronary sinus. They are commonly located in an inferior position at an obtuse angle of the heart. Left heart pacing can be achieved by placing leads into the left marginal vein, as this is often the region of latest ventricular depolarization in the diseased heart.
The inferior vein, also known as the posterior vein of the left ventricle, originates from the lateral and inferior aspects of the left ventricle, where it drains the lateral walls. The course of the inferior vein runs between the great cardiac vein and the middle cardiac vein, with drainage into the coronary sinus. Left heart pacing can also be achieved by placing leads into this vein.
The middle cardiac vein, also referred to as the posterior interventricular vein, is a major coronary vein that typically originates near the apex and usually ascends in or near the posterior interventricular sulcus. It returns deoxygenated blood from the right and left ventricles, and drains into the coronary sinus or directly into the right atrium.
The oblique vein of the left atrium, also referred to as Marshall’s vein (named for John Marshall), delivers deoxygenated blood from the lateral and inferior regions of the left atrium to the atrioventricular groove. The termination of this vein is an anatomical landmark for the origin of the coronary sinus and the end of the great cardiac vein.
The small cardiac vein, also known as the right cardiac vein, drains the inferior and lateral wall of the right ventricle. It is smaller in comparison to the previously mentioned veins, and is not always present in the human cardiac venous system. It courses the base of the right ventricle, typically emptying into the coronary sinus, but sometimes draining into the middle cardiac vein or directly into the right atrium.

MRI Anatomy and Positioning Series | Module 8: Cardiac Imaging
18
Nerves of the Heart
The heart is innervated by fibers from both the sympathetic and parasympathetic branches of the autonomic nervous system (Figure 15). The sympathetic and parasympathetic systems act together to control the heart rate in a “push-pull” manner; when sympathetic activity increases, parasympathetic decreases, and vice versa. Without any stimulation at all, the natural heart rate would be higher than normal, approximately 100 beats per minute. This suggests that, under normal resting conditions, the parasympathetic division dominates over the sympathetic division.
Figure 15 Sympathetic and parasympathetic nerves to the heart
The sympathetic branch is involved in the stimulation of activities that prepare the body for action, generally considered the fight-or-flight responses. Two chemicals that are influenced by the sympathetic system are epinephrine and norepinephrine, which increase heart rate, contractibility, automaticity, and atrioventricular (AV) node conduction. All four heart chambers are richly endowed with sympathetic nerves that serve as a link between the brain and contracting heart muscle. Nerve terminals that store the sympathetic neurotransmitter norepinephrine are found throughout the heart, wherever their presence could count, in the sinoatrial and atrioventricular nodes, in the Purkinje system, and in the atrial and ventricular myocardia. Like other organs innervated by sympathetic nerves, the heart can readily extract norepinephrine from the blood stream. However, research now shows that 90% of the norepinephrine present in the heart is manufactured there. One can think of the heart as an endocrine

MRI Anatomy and Positioning Series | Module 8: Cardiac Imaging
19
gland that synthesizes and releases a hormone, norepinephrine, as needed to allow the circulation to respond appropriately to changing metabolic demands of body tissues. Norepinephrine acting on the sinoatrial node increases the rate of diastolic depolarization, and thus speeds the heart rate. Norepinephrine acting on the atrioventricular node increases the velocity of conduction and diminishes the period during which the AV node is unresponsive to stimuli from the atrium. It can significantly improve myocardial contractility, but can also induce ventricular tachycardia and other arrhythmias.
The parasympathetic branch activates tranquil functions, such as stimulating secretion of saliva or digestive enzymes into the stomach. It also releases acetylcholine, which helps transmit nerve impulses. The vagus nerves are parasympathetic nerves that originate in the brain stem (one on the right side and one on the left), and extend down into the chest and abdomen. They help control the muscles of the throat and larynx, and are involved in regulation of the heart rate. Sudden stimulation of a vagus nerve can produce a vasovagal reflex, which consists of a sudden drop in blood pressure, and a slowing of the heart rate. This reflex can be triggered by gastrointestinal illness, or in response to pain, fright or sudden stress. People that are particularly prone to this reflex may experience vasovagal syncope, where they lose consciousness due to pronounced blood pressure and heart rate changes.

MRI Anatomy and Positioning Series | Module 8: Cardiac Imaging
20
Cardiac Physiology
Blood Flow through the Heart
Deoxygenated blood returning from the body enters the right atrium of the heart from the venae cavae. The superior vena cava returns blood from the head, chest, and upper extremities, while the inferior vena cava brings blood from all parts below the diaphragm (Figure 16). From the right atrium, the blood is pumped through the atrioventricular tricuspid valve into the right ventricle. From the right ventricle, the blood is pumped through the pulmonary semilunar valve into the pulmonary trunk. The pulmonary trunk bifurcates into the right and left pulmonary arteries, which carry the deoxygenated blood to the lungs. The blood releases carbon dioxide and absorbs oxygen in the lungs, and is brought back to the heart via the pulmonary veins. The right and left pulmonary veins return the oxygenated blood to the left atrium, which pumps the blood through the atrioventricular bicuspid (mitral) valve into the left ventricle. The left ventricle pumps the blood through the aortic semilunar valve into the aorta. At this point, some of the oxygenated blood enters the coronary arteries to nourish the heart muscle itself. The majority of the blood exits through the aorta and enters the systemic circulation. The blood will circulate throughout the body tissues, until it returns to the heart via the venae cavae, and this cycle repeats.
Figure 16 (a) Blood flow through the heart; (b) flow chart of blood flow through the heart
MRI Anatomy and Positioning Series | Module 8: Cardiac Imaging
21
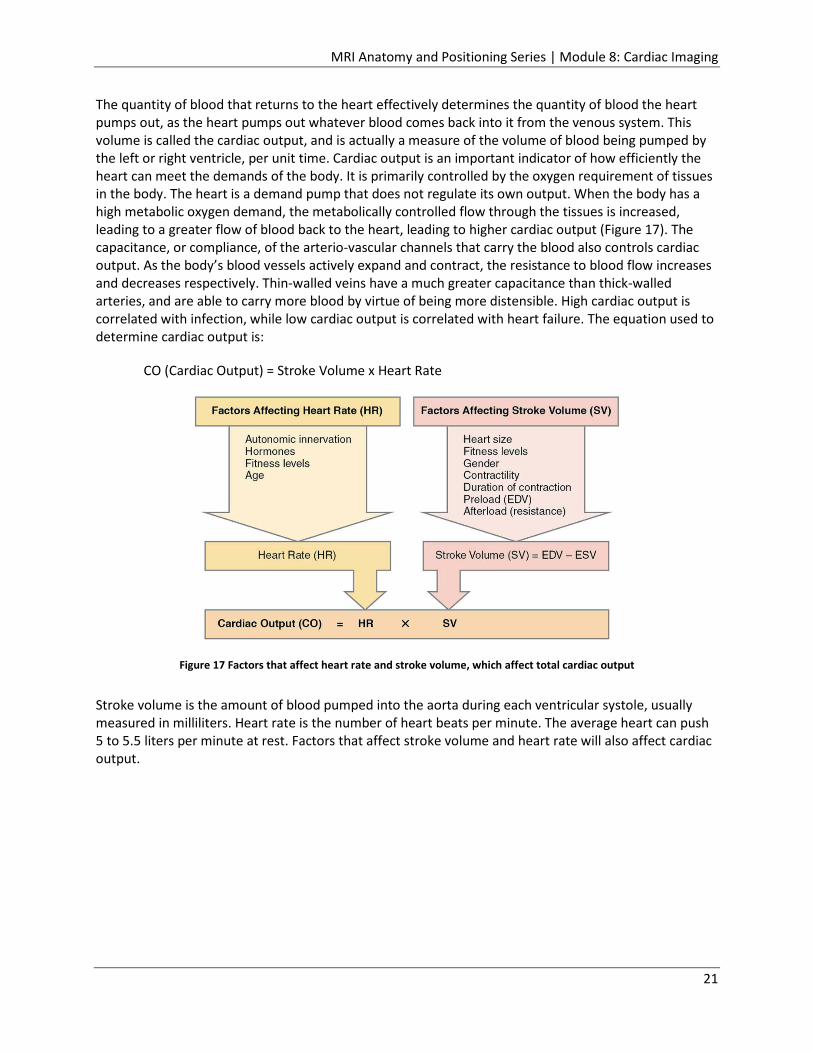
The quantity of blood that returns to the heart effectively determines the quantity of blood the heart pumps out, as the heart pumps out whatever blood comes back into it from the venous system. This volume is called the cardiac output, and is actually a measure of the volume of blood being pumped by the left or right ventricle, per unit time. Cardiac output is an important indicator of how efficiently the heart can meet the demands of the body. It is primarily controlled by the oxygen requirement of tissues in the body. The heart is a demand pump that does not regulate its own output. When the body has a high metabolic oxygen demand, the metabolically controlled flow through the tissues is increased, leading to a greater flow of blood back to the heart, leading to higher cardiac output (Figure 17). The capacitance, or compliance, of the arterio-vascular channels that carry the blood also controls cardiac output. As the body’s blood vessels actively expand and contract, the resistance to blood flow increases and decreases respectively. Thin-walled veins have a much greater capacitance than thick-walled arteries, and are able to carry more blood by virtue of being more distensible. High cardiac output is correlated with infection, while low cardiac output is correlated with heart failure. The equation used to determine cardiac output is:
CO (Cardiac Output) = Stroke Volume x Heart Rate
Figure 17 Factors that affect heart rate and stroke volume, which affect total cardiac output
Stroke volume is the amount of blood pumped into the aorta during each ventricular systole, usually measured in milliliters. Heart rate is the number of heart beats per minute. The average heart can push 5 to 5.5 liters per minute at rest. Factors that affect stroke volume and heart rate will also affect cardiac output.

MRI Anatomy and Positioning Series | Module 8: Cardiac Imaging
22
Another parameter related to stroke volume is ejection fraction (EF). This is the fraction of blood that is ejected by the left ventricle during the contraction or ejection phase (systole) of the cardiac cycle. During the filling, or diastole phase, the left ventricle is filled with blood to the capacity known as end diastolic volume (EDV). During systole, the left ventricle contracts and ejects blood until it reaches its minimum capacity, which is known as end systolic volume (ESV). The left ventricle does not completely empty. End diastolic volume and end systolic volume are involved in the calculation of stroke volume, which is then part of the ejection fraction calculation. Ultimately, the ejection fraction and the end diastolic volume impact overall cardiac output.
SV (Stroke Volume) = EDV (End Diastolic Volume) – ESV (End Systolic Volume)
EF (Ejection Fraction) = SV/EDV x 100%
CO (Cardiac Output) = SV x HR
CO (Cardiac Output) = EF x EDV x HR/100%
There are a variety of methods used to calculate cardiac output that are both invasive and non-invasive. The medical field has been moving towards less invasive and more accurate technologies for the monitoring of cardiac hemodynamics.
Coronary Systole and Diastole
At any given time, the chambers of the heart may be found in one of two states- systole or diastole. During systole, the cardiac muscle tissue is contracting to push blood out of the chambers. During diastole, the cardiac muscle cells relax to allow the chambers to fill with blood (Figure 18).
Figure 18 Atria and ventricles in systole and diastole
(a) Cardiac diastole: all chambers are relaxed, and blood flows into the heart
(b) Atrial systole, ventriculardiastole: atria contract,pushing blood into the ventricles
(c) Atrial diastole, ventricular systole: after the atria relax,the ventricles contract, pushing blood out of the heart

MRI Anatomy and Positioning Series | Module 8: Cardiac Imaging
23
Blood pressure increases in the major arteries during ventricular systole (contraction), and decreases during ventricular diastole (relaxation). The two numbers associated with blood pressure readings refer to the arterial pressure in the systemic circulation. When displayed as a fraction, such as 120/80, the number on top (120) is the systolic blood pressure, while the number on the bottom (80) is the diastolic blood pressure. More attention is typically given to the top number (systolic blood pressure) as a major risk factor for cardiovascular disease for people over age fifty. Systolic blood pressure rises steadily with age due to increasing stiffness of large arteries, long-term build-up of plaque in arteries, and increased incidence of cardiac and vascular disease.
The Cardiac Cycle
The cardiac cycle includes all of the events that take place during one heartbeat. These events are dependent on healthy valves that open and close in exact coordination with the pumping action of the atria and ventricles. There are three phases to this cycle: atrial systole, ventricular systole, and relaxation (diastole) (Figure 19).
The cardiac pumping cycle begins when blood that is low in oxygen returns from the body through the superior and inferior venae cavae, and fills the right atrium. Once the right atrium is full of blood, it contracts, the tricuspid valve opens, and blood is pumped to the right ventricle. This phase is called atrial systole. Once the right ventricle is full of blood, the tricuspid valve closes, to prevent blood from flowing back into the right atrium, and the right ventricle contracts. The pulmonary semilunar valve opens, and the blood is pumped into the pulmonary arteries, and on to the lungs. This phase is called ventricular systole. The pulmonary valve closes quickly to prevent backflow, since the right ventricle will be rapidly refilling with deoxygenated blood from the right atrium. Oxygenated blood returns from the lungs through the pulmonary veins, and fills the left atrium. The left atrium contracts when it is full, the mitral valve opens, and the blood pumps into the left ventricle. Again, this phase is termed atrial systole, and occurs at the same time as a new contraction is taking place in the heart’s right atrium. Once the left ventricle is full of blood, the mitral valve closes, to prevent blood from flowing back into the left atrium, and the left ventricle contracts. The aortic semilunar valve opens, and the oxygen-rich blood is pumped into the aorta, and on to the rest of the body. The aortic valve closes quickly to prevent backflow, since the left ventricle will be rapidly refilling with oxygenated blood from the left atrium. Again, this phase is called ventricular systole, and occurs at the same time as a new contraction is taking place in the heart’s right ventricle.
During cardiac diastole, or the relaxation phase, all four chambers of the heart are relaxed, as blood flows into the heart from the veins. The ventricles fill to about 75% capacity during this phase, and will be completely filled only after the atria enter systole, or their contraction phase. Because the atria are much smaller than the ventricles, they only fill about 25% of the ventricles during atrial systole. During this relaxation phase, the atrioventricular valves are open to allow blood to flow freely into the ventricles. The semilunar valves are closed to prevent the regurgitation of blood from the great arteries into the ventricles. When atrial systole occurs, both atria contract and push blood through the open atrioventricular valves into the ventricles. The ventricles are both in ventricular diastole, or a relaxed phase, with their semilunar valves to the great vessels closed. Once the ventricles are full, the atrioventricular valves close, which produces the monosyllabic “lub” sound that is typically heard through a stethoscope. The atria go into their diastolic phase and relax, while the ventricles go into systole, contracting to push the blood out of the heart through the open semilunar valves. The semilunar valves close once the blood has been pushed out into the pulmonary arteries and the aorta, which produces the monosyllabic “dub” sound heard through a stethoscope.

MRI Anatomy and Positioning Series | Module 8: Cardiac Imaging
24
Conduction System of the Heart
The coordination of the cardiac cycle is performed by electrical signals that cause the heart muscles to contract and relax, allowing the heart to beat over 100,000 times per day. The heart can set its own rhythm, and conduct the signals necessary to maintain and coordinate this rhythm throughout its structures. The pumping of the heart is a function of the cardiac muscle cells, or cardiomyocytes, that make up the heart muscle. They are distinctive muscle cells that are striated like skeletal muscle but pump rhythmically and involuntarily like smooth muscle. Cardiomyocytes are connected by interposed disks, which are exclusive to cardiac muscle. These cells are self-stimulated for a period of time; isolated cardiomyocytes will beat if given the correct balance of nutrients and electrolytes. Only about 1% of the cardiac muscle cells in the heart are responsible for forming the conduction system that sets the pace for the rest of the cardiac muscle cells.
The heart’s internal pacemaker uses electrical signals to time the beating of the heart, and regulate the autonomous beating of cardiac muscle cells. The heart’s electrical signals and mechanical actions are intimately intertwined. The internal pacemaker starts at the sinoatrial (SA) node, a small bundle of cells located in the wall of the right atrium inferior to the superior vena cava (Figure 19). The SA node is responsible for setting the pace of the heart as a whole, and is referred to as the heart’s natural pacemaker. Your pulse, or heart rate, is the number of signals the SA node produces per minute. Signal is generated as the right atrium fills with blood from the venae cavae. The signal spreads across the cells of the heart’s right atrium via the atrial tracts, and through the left atrium by way of the Bachmann’s bundles, causing the atria to contract. The blood is pushed from both atria into both ventricles through the open atrioventricular valves. The signal from the SA node is picked up by another mass of conductive tissue known as the atrioventricular (AV) node. This node is located on the interatrial septum, close to the tricuspid valve. The signal slows here for an instant, waiting for the completion of atrial emptying and ventricular filling. This allows the cardiac muscle to stretch to its fullest for peak cardiac output. The signal is released, and moves along a pathway called the Bundle of His, which splits into left and right bundle branches in the interventricular septum. The left bundle branch activates the left ventricle for contraction, while the right bundle branch activates the right ventricle. The left bundle branch is short, and splits into the left anterior and posterior fascicles. The left posterior fascicle transmits impulses to the papillary muscles, leading to mitral valve closure. Since the left posterior fascicle is shorter and broader than the right, impulses reach the papillary muscles just prior to contraction of the left ventricle myocardium. This allows for pre-tensioning of the chordae tendinae, the connections between the papillary muscle and the mitral valve, which increases the resistance to flow through the mitral valve during left ventricular contraction. The left and right bundle branches taper out to produce numerous Purkinje fibers. These fibers rapidly conduct electrical impulses through the muscle to assist in depolarization and contraction of the heart’s left and right ventricles, with the left ventricle contracting just an instant before the right ventricle. As the signal passes, the walls of the ventricles relax and await the next signal, which continues the process.

MRI Anatomy and Positioning Series | Module 8: Cardiac Imaging
25
Figure 19 SA and AV node functions with systole and diastole
Electrocardiogram (ECG or EKG)
An electrocardiogram measures and monitors the electrical activity of the heart through the skin. It produces a distinctive waveform in response to the electrical changes taking place within the heart. The heart’s electrical activities cause the muscular activities that keep it pumping continuously. By understanding the electrical changes in the heart, including when and where they are occurring, it becomes easier to understand the heart muscle’s responses to these electrical impulses.
There are two types of cardiac cells: myocardial and electrical. The myocardial cells are the “working” cells, found in the muscular walls of the atria and ventricles. They contain contractile filaments that slide together when electrically stimulated. This stimulation causes contraction of the myocardial cells, which leads to contraction of the atrial and ventricular chambers. This is how we get our pulse and blood pressure, which are readings concerned with the mechanical activity of the heart. The electrical cells make up the conduction system of the heart. They are distributed in an orderly fashion through the heart, and possess special properties, namely automaticity, excitability, and conductivity. Automaticity means that the cells have the ability to spontaneously generate and discharge an electrical impulse. Excitability means that the cells have the ability to respond to an electrical impulse. Conductivity means that the cells have the ability to transmit an electrical impulse from one cell to the next.
Depolarization and repolarization are electrical activities that involve the electrical cells and their special properties, which trigger the heart’s muscular activity. In a cardiac cell, sodium and potassium are the two primary chemicals that provide the electrical charges. When cardiac cells are at rest, sodium is mostly on the outside of the cells, while potassium is mostly on the inside. The interiors of the cardiac cells are mostly negative, so they are considered to be polarized when at rest, meaning there is no electrical activity taking place. The electrical cells generate electrical impulses by automaticity, which causes movement of sodium and potassium across the cell membranes. Sodium moves to the inside of the cells, and potassium moves to the outside. The cell interiors become positively charged or depolarized, and the cardiac cells contract. Depolarization moves as a wave through the myocardium,
(a) Cardiac diastole: all chambers are relaxed, and blood flows into the heart
(c) Atrial systole, ventricular diastole: after the atria relax, the ventricles contract, pushing blood out of the heart
(b) Atrial diastole, ventricularsystole: atria contract,pushing blood into the ventricles

MRI Anatomy and Positioning Series | Module 8: Cardiac Imaging
26
stimulating the heart’s cells and causing them to contract. The cell-to-cell conduction of depolarization through the myocardium is carried by the fast-moving sodium ions. Repolarization is the return of the ions to their previous resting state, which corresponds with relaxation of the myocardial muscle. This electrical activity is what is detected on an EKG.
The first part of the EKG wave, called the P wave, is a small upward deflection of the baseline voltage, corresponding to the firing of the SA node, and depolarization of the atria during atrial systole (Figures 20, 21). When the impulse leaves the atria and travels to the AV node, it encounters a slight delay. The tissues of the AV node do not conduct impulses as fast as the other cardiac electrical tissues, so the wave of depolarization will take a longer time to get through the AV node. This is represented on the ECG by a short period of electrical inactivity called the PR interval. This interval is marked from the beginning of the P wave (beginning of atrial depolarization) to the onset of the QRS complex (beginning of ventricular depolarization). Changes in conduction through the AV node are the most common cause of changes in the PR interval, which can be indicative of heart blocks. The Q, R, and S waves are referred to as the QRS complex. Together, they represent the electrical depolarization of the ventricles. The Q wave features a small drop in voltage and downward deflection, indicating when the signal is released by the AV node on its way to the apex of the heart. The impulse enters the Bundle of His, and moves on to the right and left bundle branches. The signal leaves the bundle branches through Purkinje fibers and spreads across the walls of the ventricles, which contract. The R wave marks contraction of the left ventricle with a large voltage peak, while the S wave marks contraction of the right ventricle, with a small drop in voltage. The amplitude of the QRS complex is much higher than that of the P wave, as ventricular depolarization involves a greater muscle mass and creates a large complex when compared to depolarization of the atria. The QRS complex is also the time when the atria repolarize, but they have almost no effect on the EKG waveforms because they are so much smaller than the ventricles. The ST segment begins at the end of the S complex and ends with the onset of the T wave. It represents the early part of repolarization of the ventricles, and normally sits on the baseline. The T wave represents ventricular repolarization during the relaxation phase of the cardiac cycle. The T wave begins at the point where the slope of the ST segment appears to become gradually or abruptly steeper, and ends when it returns to the baseline. Variations in the waveforms and distances between the waves of the EKG can be used clinically to diagnose the effects of heart attacks, congenital heart problems, and electrolyte imbalances.

MRI Anatomy and Positioning Series | Module 8: Cardiac Imaging
27
Figure 20 EKG and electrical conduction in the heart; active portion of EKG indicated by purple marking; (a) P-wave; (b) R interval; (c) Q-wave; (d) R- and S-waves
Figure 21 EKG explanation

MRI Anatomy and Positioning Series | Module 8: Cardiac Imaging
28
Cardiovascular Pathology
Cardiovascular pathology includes a wide variety of diseases, disorders, and conditions that affect the functioning or structure of the heart and blood vessels.
Heart Attack vs. Cardiac Arrest
Heart disease is the number one cause of death in the United States, with a heart attack known as a common result of heart disease. A heart attack, or myocardial infarction, results from a circulation problem, where there is a lack of oxygenated blood to the heart muscle, causing death of heart muscle cells and permanent heart damage (Figure 22). Prognosis depends on the person’s health, extent of damage to the heart muscle, and treatment given. A heart attack is a leading cause of cardiac arrest, which is a cardiac event of a different nature. Cardiac arrest is the sudden loss of heart function due to an electrical system or “pump” malfunction, also referred to as sudden cardiac death. CPR, or cardiopulmonary resuscitation, is performed in situations of cardiac arrest to manually restore at least partial circulation of oxygenated blood to the brain and heart. Typically, an electric shock to the subject’s heart, termed defibrillation, is necessary in order to restore a viable or “perfusing” heart rhythm. Symptoms of cardiac arrest are sudden and drastic, usually leading to a poor prognosis.
Figure 22 Peracute myocardial infarction in postmortem MRI; T2-weighted short axis image presents with local hypointensity within lateral wall without hyperintense edematous margin (yellow arrow); dissection of coronary artery
system revealed fresh soft-plaque rupture with intimal hemorrhage within circumflex coronary artery
Coronary Artery Disease
The most common form of heart disease is coronary artery disease, which is generally defined as the gradual narrowing of the lumen of the coronary arteries due to atherosclerosis (Figure 23). Atherosclerosis is a condition that involves a buildup of cholesterol, calcium, and blood clotting material on the arterial walls. This material is referred to as plaque. Plaque may become calcified, increase in size, and eventually cause significant stenosis. Stenotic vessels have increased vascular resistance relative to healthy vessels. In addition, plaques can rupture, in which case platelets come to the area and blood clots form around the plaques. These blood clots can cause a steady decrease in arterial cross-sectional area, leading to complete blockage of the artery. When complete blockage occurs, the oxygen and nutrient supply to the myocardium decreases below the level of demand, and the myocardium that is downstream from the occluded artery becomes ischemic. Myocardial ischemia not only impairs the electrical and mechanical function of the heart, but also commonly results in intense,

MRI Anatomy and Positioning Series | Module 8: Cardiac Imaging
29
debilitating chest pain known as angina pectoris. If the coronary artery disease is not detected and treated in a timely manner, a heart attack, or myocardial infarction, may occur, resulting in death of a portion of the heart muscle. Myocardial infarction can lead to cardiac arrest, or sudden cardiac death. Problems resulting from coronary artery disease vary, depending on the number and location of coronary arteries that are affected. Blockage of the right coronary artery can lead to conduction abnormalities, as this is the branch that supplies the sinus and atrioventricular nodes. The most commonly occluded coronary artery is the left anterior descending (LAD) artery. It provides the major blood supply to the interventricular septum, and thus the bundle branches of the conducting system. Blockage of the LAD can lead to impairment or death of the conducting system. This resulting “block” of impulse conduction between the atria and the ventricles is known as “right/left bundle branch block.” Healing of the heart muscle begins soon after a heart attack and takes approximately eight weeks. A scar forms in the damaged area of the heart, but this scar tissue is not able to contract like normal heart muscle. Therefore, the heart’s pumping ability is decreased after a heart attack, with the amount of lost pumping ability dependent on the size and location of the scar tissue.
Figure 23 Top picture displays two-vessel disease involving the distal left anterior descending artery (pink arrow) and the distal left circumflex artery (yellow arrow);
bottom picture displays normal distal right coronary arteries including distal segments and side branches
Cardiac Arrhythmias
Cardiac arrhythmias are abnormal heart rhythms. Arrhythmias can affect how well the heart works, as they may impact the heart’s ability to pump enough blood to meet the body’s needs. An EKG demonstrating a normal sinus rhythm is shown below, for comparison purposes with various arrhythmias (Figure 24). The heart can beat too slowly, a condition called bradycardia, which is less than 60 beats per minute. The heart can beat too fast, a condition called tachycardia, which is more than 100 beats per minute (Figure 25). The heart can also beat irregularly due to ectopic beats, or because of atrial or ventricular fibrillation. Ectopic heartbeats are small changes in a heartbeat that is otherwise normal, leading to extra or skipped heartbeats. The most common types of ectopic heartbeats are premature ventricular contractions (PVC), and premature atrial contractions (PAC). Most ectopic heartbeats do not require treatment, unless the symptoms are severe, or the extra beats occur too often. Atrial fibrillation (AFib) is a condition in which the atria fire abnormal signals, causing these upper chambers of the heart to quiver rapidly (Figure 26). This causes the lower chambers to beat irregularly as well, resulting in irregular contractions that can cause a fast, irregular heart rate of 100-175 beats per minute. When the heart is not pumping as it should, blood can pool and may form a clot, which can then

MRI Anatomy and Positioning Series | Module 8: Cardiac Imaging
30
travel in the bloodstream to the brain and cause a stroke. People with AFib are five times more likely to have a stroke than those without this condition. Ventricular fibrillation (Vfib) is the most serious cardiac rhythm disturbance, as it affects the ventricles, which are the lower pumping chambers of the heart (Figure 27). The heart’s electrical activity becomes disordered, causing the ventricles to contract in a rapid, unsynchronized way. The ventricles are fibrillating, rather than beating, so the heart can pump little or no blood. Cardiac arrest typically follows, with the patient requiring immediate medical help, including CPR and defibrillation.
Figure 24 Normal sinus rhythm
Figure 25 Sinus tachycardia
Figure 26 Atrial fibrillation
Figure 27 Ventricular fibrillation
Valve Diseases
The function of the four heart valves is to maintain the free flow of blood in a forward direction with no backward leakage. Diseases and disorders of the valves may prevent this from occurring to varying degrees. Valvular stenosis inhibits a heart valve from fully opening due to stiff or fused leaflets (Figure 28). The narrowed opening may cause the heart to have to work very hard to pump blood through the valve, leading to heart failure and other cardiac problems. Stenosis can occur in any of the four valves, where it is then referred to as tricuspid, pulmonic, mitral, or aortic stenosis. Valvular insufficiency, also known as regurgitation, incompetence, or “leaky valve,” occurs when a valve does not close tightly. Blood can then leak backwards across the valve, which causes the heart to work harder, and may decrease the blood flow to the rest of the body. Like stenosis, valvular insufficiency can occur in any valve, and is then referred to as tricuspid, pulmonary, mitral, or aortic regurgitation. Valve disease can be congenital or acquired. Congenital valve disease most often affects the aortic or pulmonic valve, resulting in the valves being the wrong size, having malformed leaflets, or having leaflets that are not attached correctly. Bicuspid aortic valve disease is congenital and results in the aortic valve having only two leaflets or cusps, rather than the normal number of three cusps. Without the third cusp, the valve may be stenotic, or allow regurgitation. Acquired valve disease may involve changes in the structure of a normal valve due to disease or infection. Rheumatic fever is an untreated bacterial infection that occurs in children and causes inflammation of the heart valves. Symptoms associated with the inflammation may not appear for 20-40 years. However, its incidence has decreased dramatically with the introduction of antibiotics in the 1950s. Endocarditis occurs when bacteria enter the bloodstream and attack the valves, causing growths and/or holes in the valves and scarring, which can lead to leaky valves. Bacteria can enter the blood during dental procedures, surgery, IV drug use, or with severe infections. People with valve disease can be at higher risk for developing endocarditis. Additional changes in the heart that can affect the valves include stretching or tearing of the chordae tendinae or papillary muscles, dilation of the annulus of the valve, or fibrotic or calcified valve leaflets. One to two

MRI Anatomy and Positioning Series | Module 8: Cardiac Imaging
31
percent of the population is affected by mitral valve prolapse, in which the leaflets of the mitral valve flop back into the left atrium during the heart’s contraction. This prolapse also causes the tissues of the valve to become abnormal and stretchy, causing the valve to leak. However, this condition rarely causes symptoms, and usually doesn’t require treatment. Additional causes of valve disease include coronary artery disease, heart attack, cardiomyopathy, syphilis, high blood pressure, aortic aneurysms, and connective tissue diseases.
Figure 28 Patient with severe aortic stenosis and bicuspid aortic valve; arrowheads indicate thickened aortic valve; small arrows point to left
ventricular hypertrophy
Congenital Heart Defects
Congenital heart defects are structural problems arising from abnormal formation of the heart or major blood vessels. Progress in diagnosis and treatment has made repair of many of these defects possible. Stenosis of the aortic or pulmonary valves was mentioned in the previous section in the discussion of heart valves. Atrial septal defect (ASD) is a defect in the septum that separates the right and left atria, allowing oxygen-rich blood to leak into the oxygen-poor blood chambers (Figure 29). Ventricular septal defect (VSD) is the same type of problem, but it affects the ventricles, or pumping chambers (Figure 30). A hole between the ventricles may cause higher pressure in the heart, or reduced oxygen to the body. Coarctation of the aorta (CoA) is a narrowing of the aorta (Figure 31). It affects blood flow to the arteries in the rest of the body, and can cause high blood pressure or heart damage. Complete atrioventricular canal defect (CAVC) is a large opening in the center of the heart that affects all four chambers where they would normally be divided. A CAVC allows oxygen-rich and oxygen-poor blood to mix, which causes the chambers and valves to not properly route the blood to each station of circulation. D-transposition of the great arteries is a condition in which the pulmonary arteries and aorta are reversed. The blood flow cycle either never routes blood to the lungs for oxygen, or does not deliver oxygen to the body. This condition would necessitate fairly immediate surgery. I-transposition of the great arteries is actually a malformation of the heart that causes a reversal in the right and left ventricles. This transposition is less dangerous than the d-transposition, because the great arteries are also reversed. This double reversal allows the body to still receive oxygen rich blood, and the lungs to still receive oxygen-poor blood. Patent ductus arteriosus (PDA) is an unclosed hole in the aorta (Figure 32). The ductus arteriosus is a hole in the fetus’s aorta that allows the blood to skip the circulation to the lungs, as this step is not necessary prior to birth. Once a baby is born, the ductus arteriosus is supposed to close, so the blood will travel to the lungs to receive oxygen. PDA means that this hole has remained open, which requires repair. Tetralogy of Fallot is a heart defect with four problems: a hole between the chambers of the

MRI Anatomy and Positioning Series | Module 8: Cardiac Imaging
32
heart, an obstruction from the heart to the lungs, the aorta lying over the hole in the ventricles, and overly thickened muscle surrounding the right ventricle (Figures 33, 34). Total anomalous pulmonary venous connection (TAPVC) is a defect in which the veins leading from the lungs to the heart attach to the heart in abnormal positions. This means that oxygenated blood enters or leaks into the wrong chamber. Truncus arteriosus involves only one large artery leaving the heart, rather than separate arteries to carry blood to the lungs, and from the heart back out to the body. There is no specific arterial path to the lungs for oxygenation before blood returns to the heart and delivers oxygen to the body. Various single ventricle defects are less common, but can cause one of the ventricles to be smaller, underdeveloped, or missing a valve. In hypoplastic left heart syndrome (HLHS) the left side of the heart is underdeveloped. The aorta and left ventricle are too small, and the holes in the artery and septum do not properly mature and close. Pulmonary atresia/intact ventricular septum means that the pulmonary valve does not exist, and the only blood receiving oxygen is the blood that is diverted to the lungs through openings that normally close during development. With tricuspid atresia, there is no tricuspid valve in the heart, so blood cannot flow from the body into the heart in the normal way. The blood will not be properly re-oxygenated.
Figure 29 Atrial septal defect; blood from pulmonary veins enters left atrium, some crosses atrial septal defect
into right atrium and ventricle
Figure 30 Ventricular septal defect; left ventricle contracts, sending some blood across ventricular septal
defect into right ventricle and pulmonary artery

MRI Anatomy and Positioning Series | Module 8: Cardiac Imaging
33
Figure 31 Coarctation causes severe obstruction of blood flow in descending thoracic aorta; collateral channels
from axillary and internal thoracic arteries through intercostal arteries help with perfusion
Figure 32 Patent ductus arteriosus; blood from aorta crosses ductus arteriosus and flows into the pulmonary
artery
Figure 33 Tetralogy of Fallot, characterized by large ventricular septal defect, an aorta that overrides the left and right ventricles, obstruction of the right ventricular outflow tract, and right ventricular hypertrophy; arrow
indicates blood being shunted from right to left
Figure 34 MRI shows right ventricular dilatation after Tetratology of Fallot repair; RA- right atrium, LA- left
atrium, RV- right ventricle, LV- left ventricle

MRI Anatomy and Positioning Series | Module 8: Cardiac Imaging
34
Cardiomyopathy
Cardiomyopathy refers to diseases of the heart muscle. These diseases have a variety of causes, symptoms, and treatments, and can be acquired or inherited. They cause the heart muscle to become enlarged, thick, or rigid. In rare cases, the muscle tissue in the heart is replaced with scar tissue. As cardiomyopathy worsens, the heart becomes weaker, and is less able to pump blood through the body and maintain a normal electrical rhythm. This can lead to heart failure or arrhythmia. Heart failure can become “congestive,” with fluid building up in the lungs, ankles, feet, legs, or abdomen. This weakening of the heart can cause other severe complications, such as heart valve problems. The four main types of cardiomyopathy include dilated, hypertrophic, and restrictive cardiomyopathy, and arrhythmogenic right ventricular dysplasia (ARVD) (Figure 35). Dilated cardiomyopathy is the most common type of the disease, occurring mainly in adults aged 20 to 60, and more often in men than women. This disease often starts in the left ventricle, which is the heart’s main pumping chamber. The heart muscle begins to dilate, causing the inside of the chamber to enlarge. The problem often spreads to the right ventricle, and on to the atria as the disease worsens. When the chambers dilate, the muscle doesn’t contract normally, so the heart can’t pump blood well. Over time, the heart becomes weaker and heart failure can occur. Dilated cardiomyopathy can also lead to heart valve problems, arrhythmias, and blood clots in the heart. Hypertrophic cardiomyopathy is also common, affecting people of any age, and affecting men and women equally. This disease is the most common cause of sudden cardiac arrest in young people, including young athletes. It occurs when the walls of the ventricles thicken (usually the left ventricle). In its obstructive form, hypertrophic cardiomyopathy may block blood flow out of the ventricle. The septum may also thicken and bulge into the left ventricle. As a result of these blockages, the ventricle must work harder to pump blood out to the body. The heart’s mitral valve may also be affected, allowing blood to leak backward through the valve. In its nonobstructive form, the thickened heart muscle does not block blood flow. However, the thickened muscle that occurs in both forms of hypertrophic cardiomyopathy results in the inside of the left ventricle being smaller, so it holds less blood. The walls of the ventricle may also stiffen, so the ventricle is less able to relax and fill with blood. These changes cause increased blood pressure in the ventricles and the blood vessels of the lungs. Changes also occur to the cells in the damaged heart muscle. This may disrupt the heart’s electrical signals and lead to arrhythmias. It is rare to have hypertrophic cardiomyopathy with no symptoms, as well as it is rare to have this type of cardiomyopathy causing sudden cardiac arrest during very vigorous physical activity. Restrictive cardiomyopathy typically affects older adults, with the ventricles becoming stiff and rigid due to abnormal tissue, such as scar tissue, replacing the normal heart muscle. This increased stiffness does not allow the ventricles to relax normally and fill with blood, causing the atria to become enlarged. Over time, blood flow in the heart is reduced, which can lead to problems such as heart failure or arrhythmias. Arrhythmogenic right ventricular dysplasia (ARVD) is a rare type of cardiomyopathy that occurs when the muscle tissue in the right ventricle dies and is replaced with scar tissue (Figure 36). This process disrupts the heart’s electrical signals and causes arrhythmias. It usually affects teens or young adults, and can cause sudden cardiac arrest in young athletes, but such deaths are rare.

MRI Anatomy and Positioning Series | Module 8: Cardiac Imaging
35
Figure 35 Three types of cardiomyopathies; A- ischemic cardiomyopathy, which typically demonstrates a subendocardial rim of enhancement consistent with a known
coronary territory, otherwise known as an infarct; B- dilated cardiomyopathy, with enhancement which is typically focal and located deep within the middle layer of the
myocardium, and in conjunction with a dilated ventricular cavity; C- hypertrophic cardiomyopathy with typically focal enhancement, and in conjunction with a thickened ventricular wall
Figure 36 Axial end-diastolic bright-blood image from patient with ARVD showing right ventricular dilatation; diameter of right ventricle (6.5 cm) is greater than left ventricle (4.9 cm) at mid-ventricular level
Carditis
Carditis, or inflammation of the heart, is typically broken down into three categories: pericarditis, myocarditis, and endocarditis. Pericarditis is an inflammation of the fibroserous sac enclosing the heart (Figures 37, 38). It manifests itself as one of three types, as a result of the body’s reaction to the infecting agent. Acute serofibrinous pericarditis is the result of virus infection. Acute purulent pericarditis is the result of bacterial infection, with the exception of tuberculosis. Chronic pericarditis is the result of infection by mycobacterium tuberculosis or fungi. In most cases, the infecting microorganism reaches the pericardium via the circulatory system. The organism colonizes the pericardium and stimulates an inflammatory reaction, which can result in destruction of heart tissue. The inflammatory reaction can also result in the accumulation of serous or purulent exudate, which may in turn cause cardiac tamponade, exerting pressure or compression on the heart, and resulting in circulatory failure. In general, all types of pericarditis may result in abnormal heart sounds, other than those due to pericardial friction, and pericardial effusion. Myocarditis is an infection of the myocardium, or muscle of the heart (Figure 39). Viruses are the most important infectious agents, with enteroviruses as the single most important group. The virus is ingested in fecally-contaminated water and/or food and eventually reaches the heart. It invades the muscle cells and causes necrosis of the cells, as well as
A B C

MRI Anatomy and Positioning Series | Module 8: Cardiac Imaging
36
clinical effects. In infants and young children, the disease progresses rapidly. Cardiac failure may be evident within a few days of onset of the illness. In older children and adults, the illness usually progresses more slowly, with generalized manifestations of viral infections, and myocardial involvement manifesting one or two weeks after the initial illness. Endocarditis is an inflammation of the membrane lining the chambers of the heart and covering the cusps of the various valves. It can be caused directly by microbial colonization of the endocardium, or indirectly by induction of autoimmunity, as in acute rheumatic fever. Direct colonization is termed infective endocarditis, and is caused by microorganisms physically present in endocardial lesions known as vegetations. Endocarditis can be either acute or chronic. Eighty percent of cases are caused by streptococci or staphylococci. Relatively avirulent microorganisms derived from the normal flora of the body cause most cases of infective carditis. They gain access to the blood intermittently, as a result of minor trauma to the oropharynx, GI tract or GU tract. These transient bacteremias usually occur without ill effects, but will lead to endocarditis in patients with an underlying cardiovascular lesion, or a suppressed immune system. Blood-borne organisms are deposited on the downstream side of the valves, where they colonize and cause disease. IV drug abusers commonly have infective endocarditis due to Staphylococcus aureus from contaminated needles. As bacteria colonize the endocardium, they form vegetations which vary in size from tiny bodies to masses large enough to occlude valve orifices (Figures 40-42). They can break off easily to form arterial emboli. The interval between the colonization of the endocardium and the onset of symptoms is two weeks. Death can occur about six weeks after colonization if the disease goes untreated.
Figure 37 Constrictive pericarditis in 13-year old patient with otherwise
structurally normal heart
Figure 38 Axial and coronal black-blood images of patient with constrictive pericarditis after coronary artery bypass graft (CABG);
arrows point to thickened pericardium

MRI Anatomy and Positioning Series | Module 8: Cardiac Imaging
37
Figure 39 Acute myocarditis with myocardial edema; A- Double IR FSE sequence displays inferolateral subepicardial and intramyocardial signal hyperintensity (white arrow) due
to myocardial edema; B- late enhancement sequence after gadolinium injection shows mild to moderate inferolateral subepicardial and
intramyocardial intensity enhancement, indicative of a degree of myocardial necrosis (white arrow)
Figure 40 Vegetation on valves due to endocarditis
Figure 41 Transesophageal echocardiography, 4-chamber view, shows multiple vegetations on the tricuspid valve
(long arrow) and pacing leads (short arrow)
Figure 42 Reconstruction of CT in coronal plane shows large vegetation on the anterior leaflet of the mitral valve (white arrows)
A B

MRI Anatomy and Positioning Series | Module 8: Cardiac Imaging
38
Cardiovascular Treatments
The types and numbers of treatments available for cardiac disease are almost as numerous as the types of diseases and pathologies themselves. A heart attack caused by coronary artery disease may necessitate angioplasty with or without subsequent stents, and/or surgical coronary artery bypass grafting (Figure 43). Percutaneous transluminal coronary angioplasty is a procedure during which a balloon catheter is introduced into the narrowed portion of the coronary artery lumen and inflated to reopen the artery to allow the return of normal blood flow. Some of the newer stents may also be used for the target delivery of drugs. A coronary stent may also be placed such that restenosis of the artery is delayed. Stents are typically made of a wire mesh that provides scaffolding to support the wall of the artery and keep its lumen open and free from the buildup of plaque. Balloon angioplasty and coronary stents may prevent patients from having to undergo coronary artery bypass graft surgery, which is much more invasive. During coronary bypass surgery, a vessel, typically from elsewhere in the patient’s body, is used to bypass the narrowed artery (Figure 44). One end of the vessel is typically attached to the aortic root or left subclavian artery. The other end is attached distal to the narrowed portion of the coronary artery. When the occluded coronary region is bypassed, oxygenated blood can once again reach the given part of the myocardium.
Figure 43 Balloon and stent angioplasty; balloons compress the plaque and are then removed, while stents remain in place to help keep the artery open

MRI Anatomy and Positioning Series | Module 8: Cardiac Imaging
39
Figure 44 Usage of vein and artery grafts for Coronary Artery Bypass Graft (CABG)
Arrhythmias can be treated through medication, cardioversion, ablation, or through the use of a pacemaker or ICD (Implantable Cardioverter Defibrillator). Medications can be used to help regulate the heart rhythm, as well as to keep the heart from beating too fast. Aspirin and anti-clotting medications can help reduce the risk of stroke that may accompany some arrhythmias. Cardioversion involves the use of electricity or drugs to convert tachycardia or a cardiac arrhythmia to a normal rhythm. It can be performed at a specific moment in the cardiac cycle, in which case it is called synchronized electrical cardioversion, or at a random moment in the cardiac cycle, when it is termed defibrillation. If medication and cardioversion can’t control arrhythmia symptoms, cardiac ablation may be pursued. Ablation involves the use of radiofrequency energy to scar small areas in the heart that may be causing rhythm problems (Figure 45). The small scarred area prevents abnormal electrical signals or rhythms from moving through the heart. A pacemaker sends electrical impulses to the heart to help it pump properly when the heart’s natural pacemaker, the sinoatrial node, is not functioning correctly (Figure 46). Pacemakers are used to correct for bradycardia, tachycardia, and irregular rhythms. An Implantable Cardioverter Defibrillator (ICD) is useful in preventing sudden death in patients with known sustained ventricular tachycardia or fibrillation (Figure 47). When the heartbeat is too fast or chaotic, it gives defibrillation shocks to stop the abnormal rhythm.

MRI Anatomy and Positioning Series | Module 8: Cardiac Imaging
40
Figure 45 Diagnostic and ablation catheters in place for catheter ablation
Figure 46 A- Double lead pacemaker, with electrodes in right atrium and ventricle; B- Firing of electrode to stimulate heart muscle;
C- Single lead pacemaker with electrode pictured in right ventricle only, can also be right atrium only

MRI Anatomy and Positioning Series | Module 8: Cardiac Imaging
41
Figure 47 Implantable Cardioverter Defibrillator (ICD) with electrode in right ventricle
Treatment for valve disease includes three goals: protecting the valve from further damage, lessening symptoms, and repairing or replacing valves (Figure 48). Having valve disease, or having a valve surgically repaired or replaced, puts one at higher risk for developing endocarditis. Antibiotics may be prescribed prior to any procedures that may cause bleeding, such as dental work, invasive tests, and minor or major surgery. Various medications may be prescribed to treat symptoms, and lessen the chance of further valve damage. Valve repair procedures can be performed to fuse valve leaflets or flaps to widen the valve opening (commissurotomy), to remove calcium deposits so the leaflets are more flexible and close properly (decalcification), to patch or reshape leaflets, as well as to reshape or tighten the ring of tissue that supports the valve (annulus support) (Figure 49). Aortic or pulmonic heart valve disease usually involves valve replacement. This can be performed using a mechanical valve, which is made totally of mechanical parts that are well tolerated by the body. Other valve replacement choices include a biological valve, which is made of human or animal tissue, or a homograft valve, which is from a donated human heart (Figure 50).
Figure 48 Bicuspid aortic valve (should be tricuspid) in diastole (A) and systole (B); turbulence through the valve is seen as white
A B

MRI Anatomy and Positioning Series | Module 8: Cardiac Imaging
42
Figure 49 CT performed for measurements before aortic annulus reconstruction; sagittal plane (top left), coronal plane (bottom left), axial plane (right); use of some devices may be restricted to certain measurements
Figure 50 Prosthetic heart valves; A- Bileaflet mechanical valve; B- monoleaflet mechanical valve; C- caged ball valve; D- stented porcine bioprosthesis; E- stented pericardial bioprosthesis;
F- stentless porcine bioprosthesis; G- percutaneous bioprosthesis expanded over a balloon; H- expandable percutaneous bioprosthesis

MRI Anatomy and Positioning Series | Module 8: Cardiac Imaging
43
Treatment for congenital heart defects may include surgery, cardiac catheterization, or heart transplant. If open heart surgery is required, patients are put on a cardiopulmonary bypass machine so the blood can bypass the heart and be oxygenated using the machine, then pumped back into the body. When the heart is emptied of blood, medication is given to make the heart stop pumping so it can be opened and repairs can be made. Once the repairs are completed, the heart is closed and allowed to refill with blood, and resume its pumping action. Interventional cardiac catheterization can be used to repair atrial and ventricular septal defects, widen stenotic vessels, loosen stiff valves, or close abnormal blood vessels (Figure 51). This method is much less invasive than surgery, and offers faster recovery times. In cases of irreversible heart failure due to congenital defects with a single ventricle, or long-standing valve obstruction or leakage, a heart transplant may be required.
Figure 51 Red arrow and asterisk in image on left indicate multiple holes in ventricular septal defect, allowing blood to go from left ventricle to right ventricle, instead of going to aorta;
image on right was taken one year after repair; red arrows indicate where two devices were implanted, and asterisks indicate where there is no longer blood flow through the septal defect

MRI Anatomy and Positioning Series | Module 8: Cardiac Imaging
44
Cardiomyopathy treatments vary depending on the type of the disease the patient is suffering with. Dilated cardiomyopathy patients may benefit from medications to improve the heart’s pumping ability, but also may require an Implantable Cardioverter-Defibrillator (ICD) or pacemaker to control the heart’s rhythm and coordinate ventricular contractions. Hypertrophic cardiomyopathy can also be treated with medications and/or an ICD, but the thickened ventricular walls characteristic of this type of cardiomyopathy may necessitate surgery. A septal myectomy may be performed, in which part of the thickened ventricular septum is removed to improve blood flow through the heart and reduce mitral valve regurgitation. Another surgical option is a septal ablation, in which a small portion of the thickened ventricle is purposefully destroyed by placing alcohol in the septal artery. Treatment for restrictive cardiomyopathy is aimed at improving symptoms, and treating any underlying disease that may be found. Arrhythmogenic right ventricular dysplasia may also be treated with medications and/or an ICD. If abnormal heart rhythms are not controlled, radiofrequency ablation may be necessary, in which energy is transmitted to a small spot of abnormal heart tissue to damage it to end an abnormal heart rhythm. If less invasive treatments are not successful, a cardiomyopathy patient may receive a Ventricular Assist Device (VAD) (Figure 52). It is used to help blood circulate through the heart and help the heart with its pumping functions. A VAD can be used for long-term treatment, or short-term treatment while waiting for a heart transplant, which is the treatment used in cases of end-stage heart failure.
Figure 52 Left ventricular assist device (LVAD) is implanted under the skin; it helps pump blood from the left ventricle to the rest of the body; control unit and battery packs are worn outside the body,
connected to the LVAD through a port in the skin

MRI Anatomy and Positioning Series | Module 8: Cardiac Imaging
45
Similar to cardiomyopathy treatments, treatment for carditis, or inflammation of the heart, depends on the cause of the inflammation. In cases of pericarditis, treatment includes control of pain with non-steroidal anti-inflammatory agents, and anti-microbial therapy based on the species of the infecting agent (viral, bacterial, or fungal). Since viruses are the most important infectious agents for myocarditis, it is typically a mild disease, and responds well to bed rest. Appropriate antibiotics can be used for treatment in cases of bacterial, fungal, or protozoan myocarditis. Eighty percent of cases of endocarditis are caused by streptococci or staphylococci, with direct microbial colonizations called vegetations. A combination of antibiotics is recommended, based on the species of the etiologic agent, the patient’s age, and the extent of the disease. If antibiotic therapy is not successful, surgical removal of the infected endocardium may be necessary. This is especially true with fungal infections, and when the patient has an intracardiovascular prosthesis (Figure 53).
Figure 53 Prosthetic valve endocarditis- staph epidermis
Various drugs exist to treat the many different problems associated with cardiovascular disease. Diuretics, commonly referred to as “water pills,” help to remove extra fluid from the tissues and bloodstream, thereby lessening the symptoms of heart failure. Anti-arrhythmic medications help to control the heart’s rhythm. Vasodilators lessen the heart’s work by dilating arterial blood vessels, which decreases blood pressure, and increasing the flow of blood due to a decrease in vascular resistance. They also encourage the blood to flow in a forward direction, rather than backwards through a leaky valve. ACE inhibitors, or angiotensin-converting-enzyme inhibitors, are used primarily for the treatment of hypertension and congestive heart failure. They cause relaxation of the blood vessels, as well as decreased blood volume, leading to lower blood pressure and decreased oxygen demand from the heart. ACE inhibitors prevent an enzyme in the body from producing angiotensin II, which is a substance that affects the cardiovascular system by narrowing the blood vessels, and releasing hormones that can raise the blood pressure. Beta blockers, also called beta-adrenergic blocking agents, work by blocking the effects of the hormone epinephrine, also known as adrenaline. They cause the heart to beat more slowly and with less force, thereby reducing blood pressure. Beta blockers also help blood vessels open up to improve blood flow. Certain brands will mainly affect the heart, while others affect both the heart and blood vessels. Anticoagulants, commonly referred to as “blood thinners,” prolong the clotting time of the blood. They are used therapeutically for atrial fibrillation, pulmonary embolism, deep vein thrombosis, venous thromboembolism, congestive heart failure, stroke, myocardial infarction, and genetic or acquired hypercoagulability.

MRI Anatomy and Positioning Series | Module 8: Cardiac Imaging
46
Cardiac MRI
Both cardiac anatomy and cardiac function can be visualized simultaneously through the use of cardiac magnetic resonance. For clinical purposes, cardiac MR can be used to:
• Quantify coronary blood flow in coronary artery disease • Accurately measure left and right ventricular volumes, ventricular wall thickness, mass, and
diameters of the great vessels • Characterize myocardial viability • Quantify myocardial infarction size • Measure blood flow in the myocardium as well as the great vessels
Cardiac MR is considered the “gold” standard for the noninvasive characterization of cardiac function and viability, primarily due to its high spatial resolution and 3D capabilities. It has proven to be an invaluable tool for the diagnosis of complex cardiomyopathies.
Cardiac Sequences
A variety of sequences are used to build a cardiac protocol, which may include dark blood and bright blood sequences, triple inversion recovery, delayed myocardial enhancement, and phase contrast. These basic cardiac sequences can be combined with precise cardiac imaging planes to build cardiac protocols designed for specific diagnoses, such as viability studies, congenital heart disease evaluations, etc.

MRI Anatomy and Positioning Series | Module 8: Cardiac Imaging
47
Black blood techniques used in cardiac imaging are typically Spin Echo sequences. They display less artifact from metal, but have longer acquisition times than Gradient Echo sequences. They are used primarily to study the anatomy of the heart and mediastinum, as well as the thoracic aorta and great vessels. Double Inversion Recovery sequences can be used to further null the signal from blood (Figure 54). These sequences can be Fast Spin Echo, where each image is acquired in a separate breath hold, or single shot, in which multiple images are acquired in one breath hold. They are typically EKG gated to remove cardiac motion from the images. Triple Inversion Recovery sequences are double inversion recovery sequences, with a third inversion pulse that is used to null fat signal (Figure 55). Edema and fluid are bright, so these sequences are used to look for myocardial edema from myocarditis or active inflammatory disease. These sequences are EKG gated and are typically run pre-contrast.
Figure 54 Double IR FSE sequence with FatSat displays black blood
Figure 55 Triple IR FSE sequence also displays black blood, with third inversion pulse used to null fat

MRI Anatomy and Positioning Series | Module 8: Cardiac Imaging
48
Bright blood techniques for cardiac imaging involve Gradient Echo sequences. They are considered the “workhorses” of cardiac imaging, due to their speed and versatility, but they are more susceptible to metal-induced artifacts. Gradient echo images are used for the assessment of ventricular function and valvular disease, blood velocity and flow measurements, myocardial perfusion, delayed enhanced imaging, and MRA. A variation of Gradient Echo sequences are the steady state sequences, which offer high temporal resolution and excellent contrast. Hitachi’s BASG (Balanced SARGE) steady state produces bright blood images with excellent contrast between the myocardium and blood within the heart, or blood pool (Figures 56, 57). BASG is a fast acquisition, and has excellent signal to noise and contrast to noise ratios but is very dependent on the homogeneity of the magnetic field. These sequences are used for the evaluation of wall motion and volumetric measurement, due to their clear delineation between myocardium and blood pool. They are also the backbone of cine cardiac MR imaging.
Figure 56 BASG (gradient echo) 4 chamber cine sequence displaying bright blood
Figure 57 BASG short axis cine sequence displaying bright blood

MRI Anatomy and Positioning Series | Module 8: Cardiac Imaging
49
Delayed Myocardial Enhancement is a post-contrast sequence used to evaluate for myocardial scar or pathology (Figure 58). Normal myocardium enhances and washes out, while myocardial scar enhances late. An inversion recovery pulse is used to null the signal from normal myocardium, making it dark, in contrast to the enhanced abnormal myocardium. The optimal inversion time (TI) is different for each patient, and is determined by the technologist and manually entered into the sequence parameters to optimize results. The delayed images are obtained 10-15 minutes after contrast injection to give the scar time to enhance, using a T1-weighted ultrafast gradient echo or steady state gradient echo sequence. Delayed enhancement can signify:
• An ischemic edema (myocardial infarction in the acute phase) • An inflammatory or infectious pathology (myocarditis) • Fibrous reorganization (sequelae of infarct, cardiomyopathies) • A tumorous lesion
Figure 58 Distribution of delayed enhancement in A- 4-chamber view, B- 2-chamber view, C- midventricular short-axis view, and D- apical short-axis view in patient with anterior wall infarct;
black arrows indicate subendocardial delayed enhancement in anterior wall from apex to mid ventricle; enhancement is confined to left anterior descending coronary artery distribution and proceeds from endocardial to epicardial, which is
expected in myocardial infarction
A B C D

MRI Anatomy and Positioning Series | Module 8: Cardiac Imaging
50
Phase Contrast involves a Gradient Echo sequence that is used to measure blood velocity (VENC or Velocity Encoded). The maximum velocity of the blood in the vessel being imaged must be estimated prior to running the sequence. By measuring the phase shift that occurs as protons in the blood move through a magnetic field, the velocity and direction of the blood can be obtained (Figure 59). Velocity measurements can be calculated, and are used to estimate pressure gradients. Volume flows are used to calculate stroke volumes, estimate shunt fractions (by comparing pulmonary versus systemic flow), and to assess the severity of valvular insufficiency (by measuring regurgitant fractions) (Figure 60).
Figure 59 Left is a gradient echo cine of a patient with pulmonary valve regurgitation; perpendicular line is drawn through proximal pulmonary artery to designate the plane for the VENC cine (right); in VENC cine, stationary tissue appears gray, with tissue moving through the plane appearing as shades of either white or black, depending on the direction; the more white or black the tissue is, the faster it is moving; during systole, there is white signal due to blood flowing towards the pulmonary arteries; however, as the cardiac cycle progresses, signal becomes black in diastole due to regurgitant blood
flowing back into the right ventricle
Figure 60 Graphic representation of flow in pulmonary artery for case presented in Figure 59; it is positive early in the cardiac cycle, but becomes negative during diastole due to regurgitant flow

MRI Anatomy and Positioning Series | Module 8: Cardiac Imaging
51
Cardiac Gating
Performing cardiac MR means dealing with some unique issues, due to the fact that the heart is moving throughout the cardiac cycle, and the lungs are moving during the respiratory cycle.
Respiratory motion can be alleviated with breath holding during imaging. MR imaging techniques exist that can generate an image of the heart in a fraction of a heartbeat, thus allowing for real-time imaging. However, most clinical images require high spatial resolution or good tissue contrast, which requires several heartbeats to generate an image. Cardiac MR scans can be timed, or gated, to the patient’s ECG, capturing a small portion of the image per heartbeat. Data is acquired only during a specified portion of the cardiac cycle, typically during diastole, when the heart is not moving. Through the use of ECG gating, one can obtain a clear image of the heart, and minimize or eliminate distortion or blurring from cardiac motion.
MRI-safe electrodes and leads are used for ECG gating. A skin preparation gel should be placed on the skin prior to placement of the electrodes for improved functioning. Electrode placement should follow one of the patterns pictured below, with the ECG leads attached to the corresponding color-coded electrodes (Figure 61).
Figure 61 Placement of MR-safe electrodes and color-coordinated MR-safe leads
The induction cord and gating cables should not touch the skin directly, and should be arranged to lay straight, with no loops. The wireless module used for gating on the Echelon OVAL should be placed out of the FOV, and should be placed on a cushioned surface to absorb some of the MR vibrations.
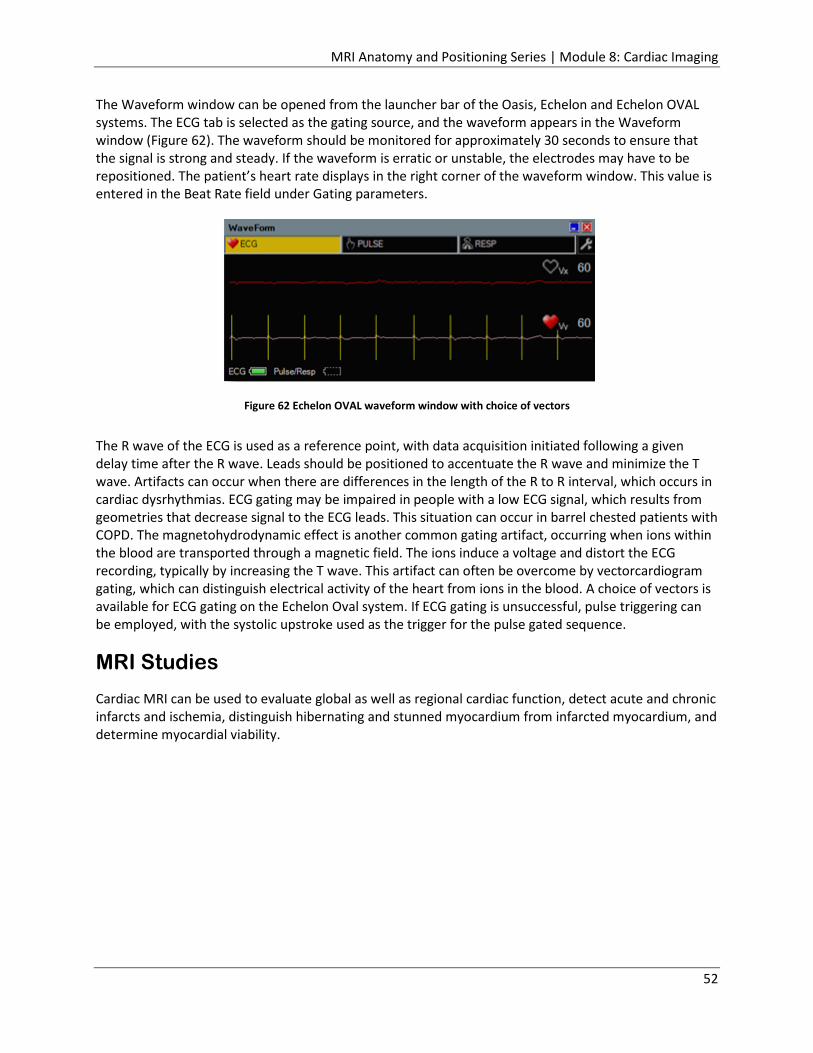
MRI Anatomy and Positioning Series | Module 8: Cardiac Imaging
52
The Waveform window can be opened from the launcher bar of the Oasis, Echelon and Echelon OVAL systems. The ECG tab is selected as the gating source, and the waveform appears in the Waveform window (Figure 62). The waveform should be monitored for approximately 30 seconds to ensure that the signal is strong and steady. If the waveform is erratic or unstable, the electrodes may have to be repositioned. The patient’s heart rate displays in the right corner of the waveform window. This value is entered in the Beat Rate field under Gating parameters.
Figure 62 Echelon OVAL waveform window with choice of vectors
The R wave of the ECG is used as a reference point, with data acquisition initiated following a given delay time after the R wave. Leads should be positioned to accentuate the R wave and minimize the T wave. Artifacts can occur when there are differences in the length of the R to R interval, which occurs in cardiac dysrhythmias. ECG gating may be impaired in people with a low ECG signal, which results from geometries that decrease signal to the ECG leads. This situation can occur in barrel chested patients with COPD. The magnetohydrodynamic effect is another common gating artifact, occurring when ions within the blood are transported through a magnetic field. The ions induce a voltage and distort the ECG recording, typically by increasing the T wave. This artifact can often be overcome by vectorcardiogram gating, which can distinguish electrical activity of the heart from ions in the blood. A choice of vectors is available for ECG gating on the Echelon Oval system. If ECG gating is unsuccessful, pulse triggering can be employed, with the systolic upstroke used as the trigger for the pulse gated sequence.
MRI Studies
Cardiac MRI can be used to evaluate global as well as regional cardiac function, detect acute and chronic infarcts and ischemia, distinguish hibernating and stunned myocardium from infarcted myocardium, and determine myocardial viability.

MRI Anatomy and Positioning Series | Module 8: Cardiac Imaging
53
Heart Structure Evaluation
In morphological cardiac MR, which is the study of the structure of the heart, the main priority is to clearly delineate the heart chambers and vascular lumen. This is accomplished using dark-blood imaging, which is based on fast spin echo and double and/or triple inversion recovery sequences (Figure 63). Due to the anatomy and spatial disposition of the heart, specific slice planes are routinely used for cardiac MR exams. The typical planes would include a 4 chamber view, a left ventricle long-axis view, and a left ventricle short-axis view. Complementary slices may be performed on the right ventricle and/or the cardiac valves, depending on the indication for the examination.
Figure 63 Double IR FSE black blood image on left, Triple IR FSE black blood image on right
Cardiac MR has been used to characterize changes in structure and anatomy for various cardiovascular disorders including:
• Hypertrophic/Dilatative cardiomyopathy • Ventricular aneurysms • Aortic dissection • Cardiac tumors • Congenital defects

MRI Anatomy and Positioning Series | Module 8: Cardiac Imaging
54
Cardiac MR can also provide an accurate measure of global anatomical “remodeling” parameters that are important in the diagnosis and prognosis of heart failure, as well as the prognosis for patients with heart disease (Figure 64). These parameters include:
• Left and right ventricular mass (LVM and RVM) • End-diastolic volume (EDV) • End-systolic volume (ESV) • Left ventricular and right ventricular dimensions
Heart size, and overall myocardial thickness and function can be monitored for conditions that require repeat interval assessments of these parameters (e.g. valve disease, cardiomyopathy, chemotherapy, etc.). Structures immediately around the heart, such as the aorta, pericardium, and pulmonary arteries, can also be assessed.
Figure 64 Patient recently diagnosed with dilated cardiomyopathy (left ventricular ejection fraction of 20%); mid-ventricular short-axis view (A) and vertical long-axis view (B) show a remodeled, dilated left ventricle and inferior wall thinning (white arrows in A and B); late contrast-enhanced images in the same planes show transmural enhancement of the basal and mid inferior wall (arrows in C, D) and of the mid inferomedial right ventricle, suggesting an old inferior MI with right ventricle
involvement (arrowhead in C)
A B
C D

MRI Anatomy and Positioning Series | Module 8: Cardiac Imaging
55
Cardiac Function
Cine gradient echo imaging has made MRI the technique of choice for the dynamic study of cardiac motion and cardiac contractile function. Cine images are short movies that show heart motion throughout the cardiac cycle (Figure 65). They are obtained with ECG triggered segmented imaging, which divides the cardiac cycle, or R-R interval, into 10-20 segments or frames. Each image in the resulting cine is composed of information acquired during the same segment over several heartbeats. Cine images are useful for the evaluation of cardiac wall motion, ventricular volumes, ventricular mass, valvular function, and movement of blood through the heart. Ventricular cines performed in the cardiac short-axis or long-axis can also provide an accurate estimation of functional parameters such as ejection fraction and systolic wall thickening.
Figure 65 Functional analysis of short axis cine MRI; contouring of endo- and epicardial borders of this stack of images at end-diastole and end-systole provides global functional
parameters (end diastolic volume, end systolic volume, ejection fraction, etc.)

MRI Anatomy and Positioning Series | Module 8: Cardiac Imaging
56
Myocardial tagging is a cardiac MR method used to measure regional myocardial strain. It “tags” the myocardium by saturating the spins of the hydrogen atoms in specific slabs of the tissue in the shape of a grid. Saturation of the spins attenuates the MR signal, thus creating black lines in the images. The saturated spins become a local “property” of the tissue during the pulse sequence, so the tags or lines move with the tissue during the cardiac cycle. With tagging, the deformation of the myocardium (strain) can be measured at any point in the cardiac cycle (Figure 66). Strain tagging is an important imaging technique in identifying regional myocardial disorders, such as a myocardial infarction. It can identify scars or regions in the myocardium which are not contracting, as the systolic circumferential strain in scarred or infarcted regions will be depressed.
Figure 66 Myocardial tagging; 2D tagging analysis in short axis (A, B) and horizontal long axis (C, D); end diastolic time frames on left, end systolic time frames on right; grid intersections are indicated
in red on short axis views (A, B); intersections of the tags with endo- and epicardial borders indicated in red on long axis views (C, D) allow for analysis of local myocardial deformation
Myocardial ischemia can lead to myocardial dysfunction. The extent of the ischemia may not be realized until the heart is stressed, and there is an increased demand for oxygen. A pharmacological cardiac MR stress test uses a drug to simulate the heart’s response to exercise and stress. It can be used in cases where patients cannot exercise, or when their heart rate does not increase sufficiently with exercise. This test can be performed to:
• Determine if there is adequate blood flow to the heart during increasing levels of activity • Evaluate the effectiveness of heart medications to control angina and ischemia • Determine the likelihood of having coronary heart disease and need for further evaluation • Check effectiveness of procedures done to improve blood flow within heart vessels in patients
with coronary heart disease • Identify abnormal heart rhythms • Assess function of heart valves if they are not functioning properly
End-diastolic frames End-systolic frames
A B
C D

MRI Anatomy and Positioning Series | Module 8: Cardiac Imaging
57
The most common pharmacologic agents used for cardiac MR stress tests include adenosine, dipyridamole, regadenoson, and dobutamine. Adenosine, dipyridamole, and regadenoson are cardiac vasodilators. They dilate coronary vessels, which causes increased blood velocity and flow rate in normal vessels, and less of a response in stenotic vessels (Figure 67). In cases of severe stenosis or total vessel occlusion with compensatory collateral circulation, a decrease in coronary blood flow may occur in the diseased coronary artery, which induces ischemia via a coronary steal phenomenon. Dilated healthy arteries have decreased resistance, so blood is encouraged to flow to them, rather than to the stenotic arteries. The healthy tissue “steals” blood from the already deprived ischemic coronary tissue.
Figure 67 Stress perfusion study in patient with suspected mid left anterior descending coronary artery in-stent stenosis; midventricular short axis time frames of first pass perfusion during dipyridamole vasodilatatory stress show gadolinium
contrast successively enhancing the right and left chambers and myocardium (images from left to right); transmural perfusion defect in the anterior and lateral walls is seen (white arrows); catheterization confirmed 90% in-stent stenosis,
treated with drug eluting stent placement
Dobutamine is a synthetic catecholamine that elicits the same response from the heart that would occur from exercise. It causes a dose-related increase in heart rate, blood pressure, and myocardial contractility. It is considered by some to be the agent of choice when evaluating for stress induced wall motion abnormalities. If the target heart rate is not achieved, atropine can be added to the dobutamine.

MRI Anatomy and Positioning Series | Module 8: Cardiac Imaging
58
Phase Contrast Imaging
Velocity encoded (VENC) phase contrast imaging is an MR technique for quantifying flowing blood. It enables the measurement of blood flow velocity across the cardiac valves and the great vessels with high temporal and spatial resolution. The velocity and direction of the blood can be obtained by measuring the phase shift that occurs as protons in the blood move through a magnetic field. The precessional frequency of the hydrogen atoms in the blood changes, which results in a dephasing effect on the magnetization of the atoms. The net dephasing of the spins is a function of the velocity of the blood flow as well as the direction. In order to obtain accurate measurements from a VENC image, a plane must be selected that is perpendicular to the path of the flowing blood. Velocity encoded images for multiple phases of the heart cycle are acquired, and create a cine movie. In the resultant cine, stationary tissue will appear gray, while tissue moving through the plane appears as shade of either white or black, depending on the direction. The more white or black the tissue is, the faster it is moving. Hitachi MR systems use a post-processing task called Velocity Analysis for quantification of blood flow (Figure 68). Regions of interest are drawn on the input VENC image, and parameters can be set to create various graphs:
• Absolute Graph- Velocity (Absolute value) vs. Delay Time • Ratio Graph- Velocity (Ratio) vs. Delay Time • Acceleration Graph- Velocity (Variation rate) vs. Delay Time
Figure 68 Velocity Analysis window on Hitachi MR systems
Input Image Absolute Graph- Velocity
(Absolute value) vs. Delay Time
Ratio Graph- Velocity (Ratio) vs. Delay Time Velocity Analysis Table
Acceleration Graph- Velocity (Variation rate) vs. Delay time

MRI Anatomy and Positioning Series | Module 8: Cardiac Imaging
59
Phase contrast imaging is useful in the diagnosis of valvular regurgitation and aortic stenosis, as well as determining the relative flows in the systemic and pulmonary systems when evaluating a cardiac shunt and determining pressure gradients across a stenotic valve.
Myocardial Perfusion and Delayed Enhancement
Perfusion and delayed enhancement imaging are both performed after the bolus injection of an MR contrast agent (Gadolinium chelate). The contrast agent can be used to characterize myocardial viability, as myocardial perfusion correlates with function. The first pass, or early perfusion MRI, examines myocardial tissue perfusion, also termed “wash in.” The delayed enhancement imaging looks for anomalies in the kinetics of contrast agent elimination, or the “wash out”. When gadolinium is first injected into the systemic circulation, the contrast agent will appear bright in the MR image, as contrast agents have altered T1 and T2 relaxation times in comparison to blood. Within a few heartbeats, the contrast will perfuse throughout the ventricles and into the myocardium. The distribution of contrast enhancement in the regional myocardium can be used to determine the uniformity of perfusion, as well as the rate (Figure 69). Regions in the image that appear dim may suffer from an obstruction in the microvasculature, or may indicate an occluded coronary artery.
Delayed enhanced imaging can assess the presence and extent of a myocardial infarction. In normal myocardium, contrast media quickly washes in and out of the myocardial interstitium. Abnormal myocardium retains the contrast agent, which is demonstrated as enhancement on delayed imaging (Figure 70). The delay time is typically 10-15 minutes after the intravenous administration of the gadolinium contrast agent. An inversion recovery sequence is used, in which normal myocardium is nulled to accentuate the delayed enhancement. Delayed hyperenhancement may be seen in both acute and chronic infarcts, and both may demonstrate wall motion abnormalities in the regions of infarction. Acute infarction may show increased signal on T2-weighted imaging due to edema. In severe acute infarctions, a non-enhancing area of subendocardium may be present surrounded by an area of enhancement. This pattern represents microvascular obstruction, in which the ischemia is severe enough to necrose blood vessels as well as myocytes. Contrast media is never able to reach this area, due to the necrotic blood vessels. This finding usually resolves by 2 weeks, leaving an area of delayed enhancement. The presence of microvascular obstruction on delayed enhanced images is indicative of a poor clinical prognosis. In chronic infarcts, delayed washout is a result of scar tissue that is retaining contrast media. This retention occurs because the cell death and tissue edema that occur after an infarction and subsequent scarring alter the wash-in and wash-out kinetics of the extracellular contrast agent. The normal evolution of a myocardial infarction is progressive thinning of the myocardium in the region of the infarction, with hypertrophy of the non-infarcted myocardium, as well as ventricular dilation. Ventricular thrombus may form adjacent to akinetic myocardium after infarction. Thrombus does not enhance on delayed enhanced images, and is within the left ventricle, separating it from microvascular obstruction, which involves the subepicardium.

MRI Anatomy and Positioning Series | Module 8: Cardiac Imaging
60
Figure 69 Myocardial delayed enhancement patterns vary by type of pathology; ischemic heart disease is commonly associated with subendocardial (A) and transmural (B) types of enhancement patterns; midwall or central
enhancement (C) is often seen in late stages of heart failure or dilated cardiomyopathy; no hyperenhancement (D) is seen in both healthy tissue and diffuse fibrosis
Figure 70 Extensive lateral myocardial infarction studied 1 week and 4 months after the actual event; cine MR in horizontal long axis shows thickened left ventricle lateral wall due to myocardial edema and inflammation in the acute phase (a),
followed by marked wall thinning at 4 months (d); horizontal long axis and midventricular short axis late CE-MRI show an extensive subendocardial no reflow zone at 1 week (arrows in b and c), and transmural enhancement of the lateral wall (arrowheads in b, c, e, f); at follow-up, strong homogeneous enhancement of the scarred myocardium (arrowheads in e)
Blood flow can be restored to the myocardium in the setting of chronic ischemia through revascularization procedures such as coronary artery bypass grafting (CABG) and percutaneous transluminal angioplasty (PTA). However, before these procedures are performed, it is important to determine if the myocardium has any viable myocytes remaining, or if the area is entirely infarcted and scarred. Regions in which there is abnormal wall motion in a coronary distribution at rest without delayed hyperenhancement represent “hibernating” myocardium, and are most likely to recover function after revascularization. Regions with wall motion and delayed hyperenhancement ranging from 1%-25% transmural thickness are likely to regain function after revascularization. Areas with 25%-50% transmural delayed hyperenhancement may recover function, while those with 50%-100% transmural delayed hyperenhancement are unlikely to recover function.
In addition to myocardial infarctions, delayed enhancement can signify an inflammatory or infectious pathology, such as myocarditis. It can also indicate a tumorous lesion and fibrous reorganization, which can be due to an infarct or cardiomyopathy.

MRI Anatomy and Positioning Series | Module 8: Cardiac Imaging
61
Coronary MRI
Partial or total occlusion of a coronary artery leads to insufficient delivery of oxygen to the myocardium, which can result in myocardial ischemia. This leads to dysfunction of the myocardium, and can result in myocardial infarction, if the ischemia is severe and sustained. Infarction of the myocardium usually results from rupture of an atherosclerotic plaque in a coronary artery, which leads to thrombus formation in that artery. The subendocardium is most vulnerable to ischemia. After total occlusion of coronary blood flow, an infarct may expand from the subendocardium to the subepicardium, where the impact from ischemic damage is even more severe. After an ischemic event, reperfusion may occur spontaneously, or secondary to intervention. Depending on the type of injury, the myocardial response following reperfusion can be categorized in three different zones:
• Cells in the peripheral zone can be protected from ischemia by opening collateral vessels • Cells in a slightly deeper area may have experienced ischemia, but are improved by
reperfusion • The core of myocardium where ischemia has caused necrosis of blood vessels (microvascular
obstruction)cannot be salvaged by reperfusion, and is termed the “no-reflow” territory
Myocardial dysfunction that leads to ischemia may appear in cardiac cine MR images as a regional wall motion abnormality. The extent of the myocardial dysfunction is dependent on the vascular distribution of the stenotic vessel. As previously mentioned, ischemia due to a stenosis may not be realized until the heart is stressed and there is an increased demand for oxygen. The dobutamine stress test is useful in demonstrating stress induced ischemia of the coronary artery territories.
Coronary artery disease can also be detected by evaluating myocardial perfusion (Figure 71). While at rest, the coronary bed is often able to vasodilate distal to a subcritical stenosis, which compensates for the stenosis and maintains adequate blood flow. Prior to the performance of perfusion imaging, adenosine can be administered to maximally vasodilate the entire coronary bed, which will uncover regional differences in blood flow due to a stenosis. Ischemic areas are identified by decreased enhancement during first pass imaging after the intravenous administration of gadolinium and adenosine. Rest images are then acquired by repeating this technique without the adenosine. If a perfusion defect persists on rest images, it may represent an infarction, which can be confirmed with delayed enhanced images.
Figure 71 Dobutamine-atropine stress study; midventricular cardiac short axis cine MRI at end-diastole (A), end-systole (B), and isovolumic relaxation (C); at maximal stress during systole, ischemic myocardium in anterior wall is akinetic (white
arrows in B); during isovolumic relaxation, while non-ischemic regions start to relax, myocardial thickening can be seen in anterior left ventricular wall (white arrows in C), which is post-systolic contraction of the ischemic myocardium; coronary
angiography showed significant stenosis in the proximal left anterior descending coronary artery
A B C

MRI Anatomy and Positioning Series | Module 8: Cardiac Imaging
62
The degree of ischemia caused by coronary artery disease influences the classification of myocardium as to whether it is considered to be “stunned” or “hibernating.” Stunned myocardium has normal or near normal blood flow, but depressed contractile function, and an absence of delayed enhancement (Figure 72). It represents transient myocardial dysfunction after acute ischemia, with restoration of blood flow. Myocardium that is recovering after revascularization surgery or angioplasty may be classified as stunned. Hibernating myocardium typically displays poor function, low resting perfusion, and an absence of delayed enhancement. It represents chronic ischemia, but not infarction. The myocardium actually undergoes a downward turn in its metabolic needs. Care must be taken to distinguish hibernating myocardium from myocardial dysfunction due to necrotic or scarred myocardium.
Figure 72 Stress perfusion cardiac MRI at mid-ventricular level shows ischemia involving anterior and anteroseptal left ventricle (white arrows in A); at rest, ischemia appears to be partially reversible (white arrows in B); delayed enhancement
does not show contrast uptake in ischemic territories, compatible with stunned but not infarcted myocardium (C)
Anomalous coronary arteries are the most likely cause of myocardial ischemia in patients under the age of 25, rather than an atherosclerotic plaque. The most serious coronary anomaly involves the left main coronary artery arising from the right coronary sinus. It then courses between the aorta and pulmonary artery, where it can be squeezed, resulting in myocardial ischemia due to reduced blood flow. This situation typically involves correction through bypass surgery. The right coronary artery can arise from the left coronary sinus, and also pass between the aorta and pulmonary artery. However, this anomaly is only treated if symptoms warrant.
Cardiac Devices in MRI
It is beyond the scope of this document to provide guidelines and/or information for every cardiovascular device. Devices are tested under very specific circumstances, as to magnetic field strength, RF energy levels, etc. Devices may undergo manufacturing modifications while retaining the same basic name, and new devices are constantly introduced into the market. Technologists are encouraged to refer to detailed sources for safety information, such as the manufacturer’s product information, dedicated websites, reference manuals, and published and online documents.
The three distinct mechanisms related to risks in MR imaging include:
• Static magnetic field • RF energy • Gradient magnetic fields
The greatest risk from the main magnetic field is attraction of a ferromagnetic object into the scanner. A device may be moved, rotated, dislodged, or accelerated toward the magnet at high velocity and with high force. Device function may also be altered or negated as a result of interactions with the static
A B C

MRI Anatomy and Positioning Series | Module 8: Cardiac Imaging
63
magnetic field. Although many currently implanted cardiovascular devices are either nonferromagnetic or weakly ferromagnetic, the higher the static magnetic field strength of the MR system, the greater the resultant ferromagnetic forces on weakly or overtly ferromagnetic materials.
RF energy is pulsed into the body to generate the MR image. Certain metallic devices, such as leads, can act as antennae and concentrate this energy, leading to excessive local heating. Wires or leads that form large loops can become electrically conductive. The concentration of RF energy is frequency dependent, and changes for a given device in different field strengths. In addition, the RF energies used during MR imaging can induce electrical currents in wires and leads, which could induce arrhythmias.
The rapidly changing magnetic fields from the gradients can also induce electrical currents in conductive devices and cause arrhythmias. The flow of electrically conductive blood in the presence of static magnetic fields produces small voltages that may produce ECG issues, such as elevation of the ST segment, T-wave abnormalities, and the appearance of arrhythmias. These issues can complicate monitoring of the heart rhythm during scanning, and lead to inappropriate inhibition of pacemaker function.
In general, a nonferromagnetic passive implant (no electronically or magnetically activate component) made from a nonferromagnetic material with no concerns of MR-related heating can be scanned immediately after implantation. The recommendation for weakly ferromagnetic devices is a six-week waiting period, as the tissue healing process that occurs may provide an additional degree of device anchoring.

MRI Anatomy and Positioning Series | Module 8: Cardiac Imaging
64
Stents and Valves
Most coronary artery stents are composed of either stainless steel or nitinol. Most exhibit nonferromagnetic or weakly ferromagnetic characteristics. Implantation of the stent against the vessel wall provides for immediate anchoring of the stent. It is generally believed that additional anchoring of the stent into the vessel wall occurs over 6-8 weeks due to tissue ingrowth. Drug-eluting stents are now used on a widespread basis (upwards of 80%) in patients with coronary artery disease, as they prevent restenosis that tends to occur when “bare” metal stents are used (Figure 73). Testing on some of the more common drug-eluting stents demonstrated a lack of ferromagnetic interactions at 3T that would pose a risk for stent migration. The effect of the MR examination on heating of the drug or polymer coating used in drug-eluting stents is unknown, although heating of the stent , and possible resultant effects on the drug/polymer coating, might be somewhat mitigated by flowing blood.
Most coronary stents that have been tested have been labeled as “MR safe”, with the remainder labeled “MR conditional.” Tested coronary artery stents, including tested drug-eluting coronary stents, that are nonferromagnetic can be safely scanned at 3T or less any time after implantation. Safety documentations note that MR imaging quality may be compromised if the area of interest is in the exact same area or relatively close to the position of the stent.
Figure 73 Various types of stents; A- Relative size of stents;
B- Drug-eluting stent; drugs may be eluted up to a one year period to help slow down artery re-narrowing; C- Bioresorbable drug-eluting stent; has dual properties of drug-eluting and stent breakdown after one year; stent
bio-degrades, leaving no permanent stent footprint in the artery
A B C

MRI Anatomy and Positioning Series | Module 8: Cardiac Imaging
65
Many heart valve prostheses (see Figure 50) and annuloplasty rings (Figure 74) have been evaluated for MR issues, with exposure to MR systems operating at field strengths as high as 4.7T. The majority displayed measurable yet relatively minor magnetic field interactions. The actual attractive forces exerted on the heart valve prostheses and annuloplasty rings were minimal compared to the force exerted by the beating heart. MR procedures at 3T are not considered to be hazardous, and heating has not been shown to reach substantial levels. Some heart valves contain metallic disks or leaflets, and may be affected by the “Lenz effect.” This phenomenon states that any metal moving through a magnetic field will develop another magnetic field that opposes the primary magnetic field. In theory, resistive pressure may develop with the potential to inhibit both the opening and closing aspects of the mechanical heart valve prosthesis. The Lenz effect is proportional to the strength of the static magnetic field, suggesting that patients with heart valves with metal leaflets could have problems at field strengths greater than 1.5T. However, this phenomenon has not been observed in association with MR procedures.
Figure 74 US Physio II annuloplasty ring used in mitral valve repair; disease may cause valve to have abnormal size and/or shape; annuloplasty ring helps return valve to normal size and shape

MRI Anatomy and Positioning Series | Module 8: Cardiac Imaging
66
Pacemakers and ICDs
Implanted pacemakers have historically been considered a contraindication to MRI. Major MRI-related pacemaker malfunctions include:
• Heating at the lead tip and lead tissue interface • Current flow through lead, resulting in overheating and thermal damage of cardiac tissue or
myocardial perforation • Force and torque on the device • Image distortion • Alteration of programming with potential damage to pacemaker circuitry • Rapid atrial pacing • Pacing at multiples of the radiofrequency pulse and associated rapid ventricular pacing • Reed switch malfunction • Asynchronous pacing • Inhibition of pacing output • Induction of ventricular fibrillation • Electrical reset • Component damage • Death
These potentially harmful effects have mainly been identified in older pacemaker and lead technology. In recent decades, devices are being made smaller, with less magnetic material and improved electromagnetic interference protection. There is a real and urgent need for safe MRI-conditional devices—safe by design, rather than by chance.

MRI Anatomy and Positioning Series | Module 8: Cardiac Imaging
67
The increased demand for MRI on patients with implanted pacemakers has prompted device manufacturers to develop specifically designed pacemakers and lead systems that have been tested for safe use in the MRI environment. The first pacing system to receive FDA approval (in early 2011) for safe but conditional usage was the Medtronic Revo MRI SureScan pacemaker and CapSureFix MRI leads (Figure 75). Approval came with many conditions, including:
• Patient cannot have previously implanted active or abandoned medical devices or leads • SureScan pacemaker must be implanted in right or left pectoral region for minimum of 6
weeks • Scanning can be performed on 1.5T systems only; isocenter cannot be between C1 and T12 • Health professionals with cardiology and radiology SureScan training must be present during
scanning; pre-exam functioning level must be confirmed after scans
Figure 75 Medtronic Revo MRI SureScan pacemaker

MRI Anatomy and Positioning Series | Module 8: Cardiac Imaging
68
Medtronic received FDA approval for a second generation MRI-friendly pacemaker system in February 2013. This system, named the Advisa, had improvements to the pacemaker itself, but was still limited by the isocenter area restriction. Biotronik, another device manufacturer, has received FDA approval for two different pacemaker systems. The Entovis system was approved in May 2014, and includes both single- and dual-chamber devices. In March 2015, the ProMRI Eluna pacemaker system was approved (Figure 76). This system also includes single- and dual-chamber devices, and allows patients to undergo full-body MRI scans. In 2012, Boston Scientific received approval in Europe for two MRI-safe cardiac rhythm management systems, which include pacemakers, called the Ingenio and the Advantio. Studies were under way in 2013 to gain FDA approval for use of these systems in the U.S. They include a programmable MRI timer designed to return pacemaker settings back to normal after the scan. St. Jude Medical offers the Accent MRI pacemaker and Tendril MRI leads that have been tested for full-body scans. They gained approval in Europe and Japan in 2013. The FDA gave St. Jude conditional investigational device exemption approval to begin clinical studies on the Accent system in the U.S. in 2012, with studies ongoing in 2014. The Accent system also includes an “activator” device, which is a handheld remote used to wirelessly switch the implant to an MRI-safe mode. Numerous pacemaker systems may be labelled as MR conditional, but different MRI guidelines exist for different countries. Pacemakers that have been approved in Europe may not have FDA approval in the U.S.
Figure 76 Biotronik's ProMRI Eluna pacemaker
ICDs, or Implantable Cardioverter Defibrillators, are devices designed to automatically detect and treat episodes of ventricular fibrillation, ventricular tachycardias, bradycardia, and other conditions. When a problem is identified, the device can deliver defibrillation, cardioversion, antitachycardia pacing, bradycardia pacing, or other therapy. Some of the basic components of ICDs are similar to pacemaker components. Therefore, exposure to an MR system or MR procedure has similar effects on an ICD as those described on a pacemaker. ICDs have some unique aspects that preclude safe MR scanning, including inherent risks associated with the electrodes, which are placed in the myocardium. Potential problems for patients with ICDs undergoing MR procedures include:
• Movement and/or vibration of the pulse generator or leads • Temporary or permanent modification of the function of the device, which may damage it • Inappropriate sensing, triggering, or activation of the device • Excessive heating of the leads • Induced currents in the leads • Electromagnetic interference

MRI Anatomy and Positioning Series | Module 8: Cardiac Imaging
69
Similar to cardiac pacemakers, it is anticipated that safety criteria may be determined for “modern-day” ICDs that may entail using specialized programming, monitoring procedures and MR conditions to allow patients to safely undergo MR examinations. Numerous ICDs have received conditional labelling, with the stipulation that specific guidelines or recommendations must be followed, information for the specific ICD should be reviewed, and the manufacturer should be consulted for the latest safety information. As previously mentioned for pacemakers, different guidelines exist for ICDs in different countries. Those ICDs that are approved in Europe may not have FDA approval in the U.S. Extreme caution must be exercised when scanning patients with ICDs.
As of September 14, 2015, Medtronic received the first FDA approval for an ICD system for use with MRI scans. The Medtronic Evera MRI SureScan ICD system was approved for MRI scans on any part of the body, without positioning restrictions (Figure 77). The system must be used in conjunction with Sprint Quattro Secure MRI SureScan DF4 leads to be considered MR-conditional. The Evera MRI ICD system underwent software and hardware enhancements, while maintaining the same longevity, proven shock reduction, and physiological size and shape of the original Evera ICD. FDA approval was based on safety and efficacy data from the Evera MRI Clinical Trial, a controlled clinical trial that enrolled 275 patients around the world. Biotronik, manufacturer of the Iforia ICD, has submitted study data to the FDA to support approval of their product for safe use with MRI.
Figure 77 Medtronic's Evera MRI SureScan ICD

MRI Anatomy and Positioning Series | Module 8: Cardiac Imaging
70
MRI Coils for Cardiac Imaging
Coils and ECG gating equipment appropriate for cardiac imaging are supplied with each of Hitachi’s MRI systems. Proper patient positioning and immobilization, along with isocenter or near-isocenter positioning of the selected coil will result in excellent quality cardiac imaging, whether for routine scans, or more advanced applications.
The Oasis is a vertical field magnet, and is equipped with laser lights for positioning purposes in all three planes or directions: head-to-foot (horizontal plane), right-to-left (longitudinal plane), and anterior-to-posterior (coronal plane) (Figure 78). The Echelon OVAL and the Echelon systems are both horizontal field magnets, which have laser lights for positioning purposes in the longitudinal and horizontal planes.
Figure 78 Caution for laser lights that are used for patient positioning
Oasis Open MRI System
Proper patient positioning, with both the coil and the anatomy at isocenter in all three planes, results in improved image quality on an open MRI system. Body habitus will play a key role in both coil selection and table pad choices on the Oasis system. The coil of choice for cardiac imaging is the RAPID body coil. For larger patients, the Flex Body coil and the inherent Transmit/Receive Body coil are available. However, parameter adjustments should be made if either of these coils will be used. One must remain aware of how the use of trough pads, table pads, or no pads will affect the coronal positioning of both the patient and the coil. Hitachi also offers an extensive inventory of accessory pads and sponges for patient stability, comfort, and safety. The cardiac anatomy and the coil should be centered in the laser lights in all three directions: head-to-foot (axial or transverse plane), right-to-left (sagittal plane), and anterior-to- posterior (coronal plane).

MRI Anatomy and Positioning Series | Module 8: Cardiac Imaging
71
ECG gating is used for cardiac exams. Before placing the ECG electrodes on the patient, wipe the skin on the chest where the electrodes will be placed with a skin preparation gel. Peel the backing from the electrodes, and place them on the chest in the pattern pictured below (Figure 79). The electrodes should be placed to the left of midline, and centered approximately halfway between the sternal notch and the xiphoid process. The center points of the electrodes should not be placed directly over the patient’s ribs. The ECG leads from the induction cord are then attached to the appropriate electrodes; the leads are labeled and color-coded.
Figure 79 Electrode placement and color-coordinated ECG leads
The induction cord should be placed in a straight position alongside the patient’s body (Figure 80). It should not form a loop or contact the patient’s skin directly. The induction cord is plugged into the ECG connector on the PMM module, which is located on the left side of the gantry.
Figure 80 Placement of induction cord on left; arrow indicates the ECG connector on gantry on right

MRI Anatomy and Positioning Series | Module 8: Cardiac Imaging
72
Before scanning begins, select the Waveform button from the Oasis launcher bar to open the Waveform window (Figure 81). Select the ECG tab, and monitor the waveform for approximately one minute to ensure a strong, steady signal. The heart rate that appears in the Waveform window is entered in the Beat Rate parameter field in the Gating section of the scan parameters.
Figure 81 Waveform window; arrow indicates ECG tab
Coils and Positioning
• 6 Channel RAPID Body Coil
• 2 Channel Flex Body Coil

MRI Anatomy and Positioning Series | Module 8: Cardiac Imaging
73
RAPID Body Coil
The recommended coil for a cardiac study is the RAPID body coil. Fit the base of the coil into the table trough. The longitudinal center mark on the coil will be centered at the midline of the table. The horizontal center of the coil should be between the marking on the patient table and the end of the table nearest the magnetic field. This will allow for sufficient table travel while still achieving isocenter positioning. Patients are typically positioned supine, entering the magnet head first, with their arms over their head to minimize artifacts (Figure 82). If this position cannot be maintained, the arms can be placed at the patient’s sides inside the coil. The patient should be positioned on the base portion of the coil so that the horizontal center mark on the coil passes through the mid-sternum (approximately T4 level). The coil pad and additional table pads can be adjusted to help achieve coronal centering of the cardiac region. The upper portion of the coil is then placed on the base and pushed firmly into place to lock the coil. The midline of the patient’s body should be aligned with the longitudinal center mark on the upper portion of the coil. If patient size permits, offset the patient slightly towards their right side to better position the heart in the center of the coil. The patient should now be centered in all three planes- centered on the cardiac region in the coronal and axial planes, and centered midline in the sagittal plane. Sponges and cushions can be added as needed for additional support, comfort, and safety. Use appropriate precautions with gating cords and coil cables.
Figure 82 Patient positioned in the RAPID Body coil; far right arrows indicate positioning marks
Flex Body Coil
The flexible body coil(s) can be used to accommodate larger patients for cardiac scanning. However, these coils do not have RAPID capabilities, and should not be used with protocols that are labeled as “RAPID.” Trough and/or table pads should be placed on the table to help center the flexible coil in the coronal plane. The horizontal center of the coil should be between the marking on the patient table and the end of the table nearest the magnetic field. This will allow for sufficient table travel while still achieving isocenter positioning. Patients are typically positioned supine, entering the magnet head first, with their arms over their head to minimize artifacts (Figure 83). If this position cannot be maintained, the arms can be placed at the patient’s sides inside the coil. The longitudinal center of the coil should be aligned with the sagittal laser light. Position the patient on the flexible coil so that the horizontal center mark on the coil passes through the mid-sternum (approximately T4 level). Depending on the patient’s body habitus, table and/or accessory pads may need to be adjusted to maintain coronal centering. Close the flexible body coil around the patient and secure the latches. Accessory pads can be placed between the flex coil and the patient to maintain the anterior portion of the coil in a level position, which will minimize stress on the latches. The midline of the patient’s body should be aligned with the longitudinal center mark on the anterior aspect of the coil. If patient size permits, offset the patient slightly towards

MRI Anatomy and Positioning Series | Module 8: Cardiac Imaging
74
their right side to better position the heart in the center of the coil. The patient should now be centered in all three planes: centered on the cardiac region in the coronal and axial planes, and centered midline, or slightly to the right, in the sagittal plane. Sponges and cushions can be added as needed for additional support, comfort, and safety. Use appropriate precautions with gating cords and coil cables.
Figure 83 Patient positioned in the Flex Body coil
Echelon OVAL MRI System
The Echelon OVAL system incorporates the WIT (Workflow Integrated Technology) RF coils for scanning, which are integrated in the table. The WIT Spine coils, which have RAPID capabilities, are used in combination with the WIT Torso coil or WIT Cardiac coil (optional coil) to provide optimal coverage of the chest and cardiac regions. The Echelon OVAL system incorporates table pads that are always in place between the integrated WIT Spine coils and the patient’s body. Pads should also be placed between the WIT Torso or WIT Cardiac coils and the patient. Numerous positioning pads, sponges, and straps are furnished with the OVAL system, and should be used for patient comfort and safety.

MRI Anatomy and Positioning Series | Module 8: Cardiac Imaging
75
ECG gating is used for cardiac exams. The Echelon OVAL is equipped with wireless modules for all gating (Figure 84). The wECG Wireless Module requires a battery from the Wireless Module Battery Charger. The charger is typically located in the console area, as the charger cannot remain in the scan room. The battery slides into the back of the wECG Wireless Module and latches. Check for solid green lights on the front of the wireless module, indicating that the battery power and communication status are both in good working order.
Figure 84 Wireless Module Battery Charger and wECG Wireless Module
Before placing the ECG electrodes on the patient, wipe the skin on the chest where the electrodes will be placed with a skin preparation gel. Peel the backing from the electrodes, and place them on the chest in one of the patterns pictured below (Figure 85). The electrodes should be placed to the left of midline, and centered approximately halfway between the sternal notch and the xiphoid process. The center points of the electrodes should not be placed directly over the patient’s ribs. The ECG leads from the induction cord are then attached to the appropriate electrodes; the leads are labeled and color-coded.
Figure 85 Electrode placement and color-coordinated ECG leads

MRI Anatomy and Positioning Series | Module 8: Cardiac Imaging
76
The induction cord should be arranged so that it has minimal direct contact with the skin (Figure 86). The thicker part of the cord that is covered by a white tube can touch the skin directly. The cord should lay straight without making any loops. The wireless module should remain outside the scanning field of view, and should be placed on a cushioned surface, in order to absorb some of the MR system vibrations.
Figure 86 Placement of induction cord
The waveform can be checked at the Echelon OVAL gantry, as it is equipped with a WIT Monitor (Figure 87). Turn the WIT Monitor on, and select the Enter button to access the waveform window. Use the monitor keypad to select either the Vx or Vy waveform vector for use, depending on which vector has the best display. Monitor the waveform for approximately 30 seconds to ensure a strong, steady signal. The patient’s heartrate will also be displayed in the waveform window on the WIT Monitor.
Figure 87 WIT gating monitor on Echelon OVAL gantry

MRI Anatomy and Positioning Series | Module 8: Cardiac Imaging
77
The WIT Monitor is not enabled during scanning, so the Waveform window on the OVAL console must be used. Select the Waveform button from the launcher bar to open the Waveform window (Figure 88). Select the ECG tab, and monitor the waveform for 30 seconds to ensure a strong, steady signal. The heart rate that appears in the Waveform window is entered in the Beat Rate parameter field in the Gating section of the scan parameters.
Figure 88 Waveform window on Echelon OVAL console; arrows indicate ECG tab, waveform vectors, and heart rate
Coils and Positioning
• WIT Torso Coil
• WIT Cardiac Coil

MRI Anatomy and Positioning Series | Module 8: Cardiac Imaging
78
WIT Torso Coil
The WIT Torso coil will probably be used most often for cardiac studies, as it is one of the standard coils for the Echelon OVAL. Before proceeding with a cardiac study, both of the WIT Spine coils should be plugged into the table. The appropriate fitted spine coil pads and table pads should be placed over the spine coils. The patient should be positioned supine on the table, entering the magnet feet first, with their cardiac region (mid-sternum) centered horizontally on the spine coils. Their arms should be placed over their head, without interlocking their fingers (Figure 91). If this position cannot be maintained, their arms can be placed at their sides. The pad that accompanies the torso coil should be placed on the patient’s chest. The WIT Torso coil is placed on top of the pad, with the plug exiting towards the patient’s feet. There are two methods for securing the WIT Torso coil to the WIT Spine coils, depending on whether or not the spine coils have “wings” (Figures 89, 90). If the system has spine coils with wings, the system straps should be used to secure the torso coil to the wings of the spine coils. If the system has spine coils without wings, the system straps should be used to secure the torso coil to the tabs of the spine coils. The center of the torso coil should be aligned longitudinally with the midline of the patient. Sponges and cushions can be added as needed for additional support, comfort, and safety. Arrange the ECG gating induction cord to be as straight as possible alongside the patient’s body, and out of the scanning field of view. Plug the torso coil in to the nearest table connector and cover the coil cable with the cylindrical cable cover padding.
Figure 89 WIT Spine coils, with and without wings
Figure 90 Patient positioned in the WIT Torso coil with arms down, and torso coil secured to the WIT Spine coil
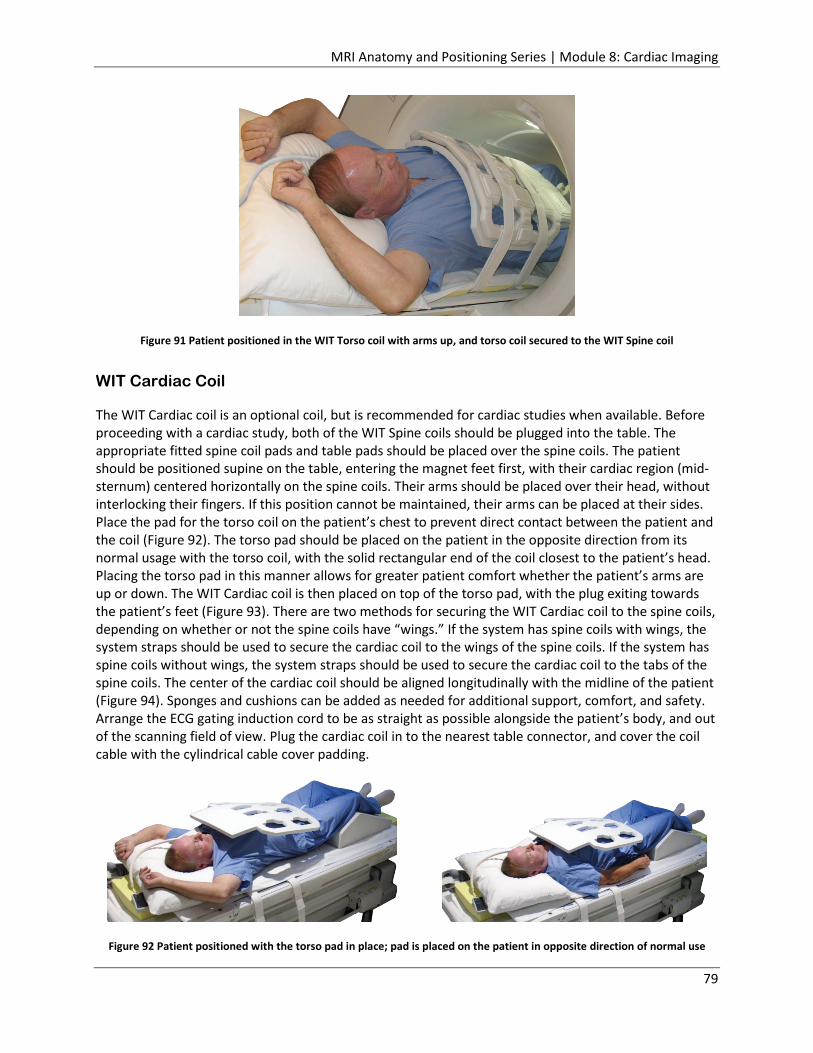
MRI Anatomy and Positioning Series | Module 8: Cardiac Imaging
79
Figure 91 Patient positioned in the WIT Torso coil with arms up, and torso coil secured to the WIT Spine coil
WIT Cardiac Coil
The WIT Cardiac coil is an optional coil, but is recommended for cardiac studies when available. Before proceeding with a cardiac study, both of the WIT Spine coils should be plugged into the table. The appropriate fitted spine coil pads and table pads should be placed over the spine coils. The patient should be positioned supine on the table, entering the magnet feet first, with their cardiac region (mid-sternum) centered horizontally on the spine coils. Their arms should be placed over their head, without interlocking their fingers. If this position cannot be maintained, their arms can be placed at their sides. Place the pad for the torso coil on the patient’s chest to prevent direct contact between the patient and the coil (Figure 92). The torso pad should be placed on the patient in the opposite direction from its normal usage with the torso coil, with the solid rectangular end of the coil closest to the patient’s head. Placing the torso pad in this manner allows for greater patient comfort whether the patient’s arms are up or down. The WIT Cardiac coil is then placed on top of the torso pad, with the plug exiting towards the patient’s feet (Figure 93). There are two methods for securing the WIT Cardiac coil to the spine coils, depending on whether or not the spine coils have “wings.” If the system has spine coils with wings, the system straps should be used to secure the cardiac coil to the wings of the spine coils. If the system has spine coils without wings, the system straps should be used to secure the cardiac coil to the tabs of the spine coils. The center of the cardiac coil should be aligned longitudinally with the midline of the patient (Figure 94). Sponges and cushions can be added as needed for additional support, comfort, and safety. Arrange the ECG gating induction cord to be as straight as possible alongside the patient’s body, and out of the scanning field of view. Plug the cardiac coil in to the nearest table connector, and cover the coil cable with the cylindrical cable cover padding.
Figure 92 Patient positioned with the torso pad in place; pad is placed on the patient in opposite direction of normal use

MRI Anatomy and Positioning Series | Module 8: Cardiac Imaging
80
Figure 93 Patient positioned with cardiac coil in place on top of torso pad; cardiac coil is secured to spine coil
Figure 94 Patient is centered in cardiac coil, which is centered in laser positioning lights
Echelon MRI System
The recommended coil for cardiac imaging is the RAPID Torso/Body coil. For larger patients, the inherent Transmit/Receive Body coil can be used. However, parameter adjustments should be made if this coil is utilized. Hitachi offers an extensive inventory of accessory pads and sponges for patient stability, comfort, and safety. The cardiac anatomy and the coil should be centered in the laser lights in both the head-to-foot (axial or transverse plane) and right-to-left (sagittal plane) directions for the best image quality.

MRI Anatomy and Positioning Series | Module 8: Cardiac Imaging
81
ECG gating is used for cardiac exams. Before placing the ECG electrodes on the patient, wipe the skin on the chest where the electrodes will be placed with a skin preparation gel. Peel the backing from the electrodes, and place them on the chest in the pattern pictured below (Figure 95). The electrodes should be placed to the left of midline, and centered approximately halfway between the sternal notch and the xiphoid process. The center points of the electrodes should not be placed directly over the patient’s ribs. The ECG leads from the induction cord are then attached to the appropriate electrodes; the leads are labeled and color-coded.
Figure 95 Electrode placement and color-coordinated ECG leads
The induction cord should be placed in a straight position alongside the patient’s body. It should not form a loop or contact the patient’s skin directly (Figure 96). The induction cord is plugged into the ECG connector on the PMM module, which is located on the left side of the gantry.
Figure 96 Placement of induction cord on left; arrow indicates ECG connector on gantry on right

MRI Anatomy and Positioning Series | Module 8: Cardiac Imaging
82
Before scanning begins, select the Waveform button from the Echelon launcher bar to open the Waveform window (Figure 97). Select the ECG tab, and monitor the waveform for approximately one minute to ensure a strong, steady signal. The heart rate that appears in the Waveform window is entered in the Beat Rate parameter field in the Gating section of the scan parameters.
Figure 97 Waveform window; arrow indicates ECG tab
Coils and Positioning
• RAPID Torso/Body Coil
RAPID Torso/Body Coil
The recommended coil for a cardiac study on the Echelon is the RAPID Torso/Body coil. Trough and/or table pads are placed on the table as needed, depending on the patient’s size and body habitus. The lower portion of the coil should be positioned in the middle of the table on top of the pads (Figure 98). Patients are typically positioned supine, entering the magnet head first, with their arms over their head to minimize artifacts. If this position cannot be maintained, the arms can be placed at the patient’s sides inside the coil. The patient should be positioned on the lower portion of the coil so that the horizontal center mark on the coil passes through the mid-sternum (approximately T4 level). The patient’s feet should be pointed in the same direction as the coil cables and plugs. The upper portion of the coil is then placed on the patient and secured to the lower portion with the system straps (Figure 99). The midline of the patient’s body should be aligned with the longitudinal center mark on the upper portion of the coil. Sponges and cushions can be added as needed for additional support, comfort, and safety. Plug the coil in to the nearest table connector, and cover the coil cable with the cylindrical cable cover padding. Use appropriate precautions with gating cords.
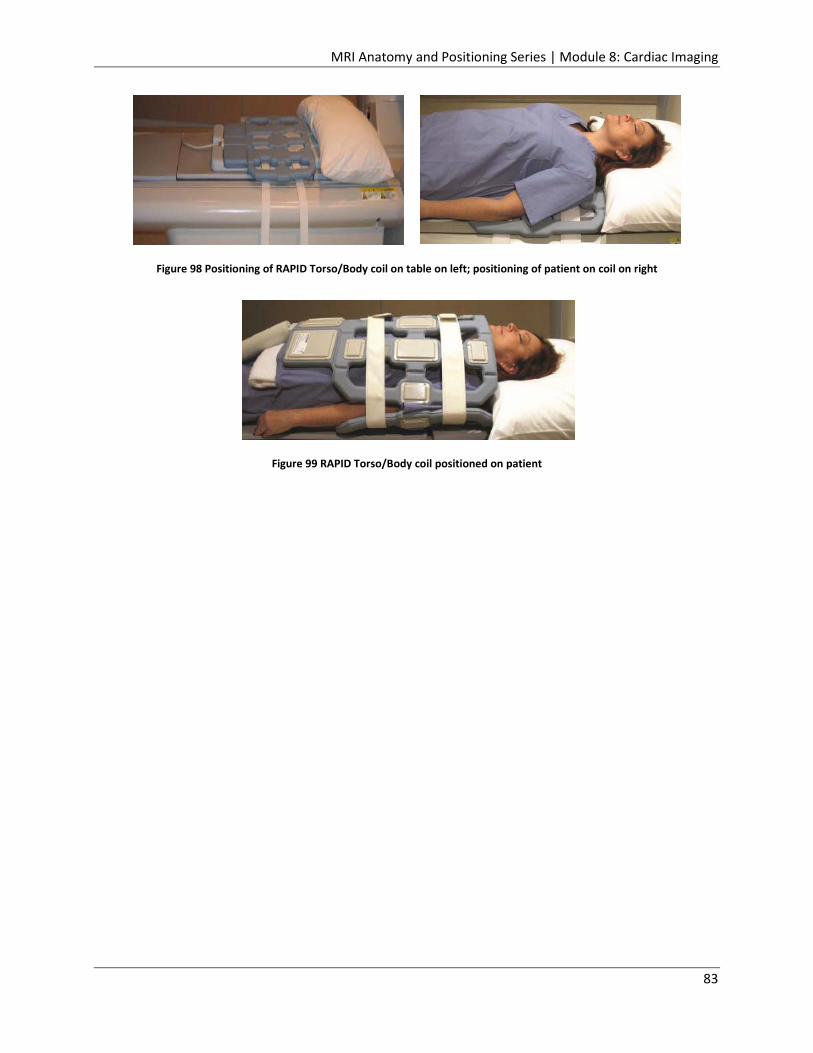
MRI Anatomy and Positioning Series | Module 8: Cardiac Imaging
83
Figure 98 Positioning of RAPID Torso/Body coil on table on left; positioning of patient on coil on right
Figure 99 RAPID Torso/Body coil positioned on patient

MRI Anatomy and Positioning Series | Module 8: Cardiac Imaging
84
Scan Setups
Cardiac imaging planes are typically referred to as horizontal or vertical and short or long axis. Images are also designated as 2 or 4 chamber views. These imaging planes are technically oblique to one another, as the heart is positioned obliquely in the chest cavity. The three main cardiac imaging planes are the vertical long axis, the horizontal long axis, and the short axis. Precise and accurate positioning of these first three views is imperative, as they affect the angulation and positioning of additional cardiac views that may be required. A routine axial scan through the heart should be acquired first, to serve as the basis for the angled vertical long axis and short axis scans. This scan can be set up using a coronal scanogram (Figure 100). The position and number of slices should be adjusted to cover the entire heart, but the slices should not be angled.
Figure 100 Axial slice setup using coronal scanogram; descending aorta, atria and ventricles of heart identified on axial image
Vertical Long Axis
The vertical long axis view, or left ventricle two chamber view, can be set up using a coronal scanogram image and an axial image of the heart (Figure 101). The slice should be positioned through the middle of the left atrium and left ventricle, passing through the center of the mitral valve, and the apex of the heart. The slice should be angled so it is parallel to the interventricular septum.
Figure 101 Vertical long axis slice setup using a coronal scanogram image and an axial image

MRI Anatomy and Positioning Series | Module 8: Cardiac Imaging
85
The vertical long axis view is used for evaluating the anterior and inferior walls and apex of the left ventricle (Figure 102).
Figure 102 Vertical long axis image displays left ventricle
Short Axis
The short axis view of the ventricles can be set up using axial images and the vertical long axis two chamber images (Figure 103). On the axial image, the slices should be positioned perpendicular to the intraventricular septum. On the vertical long axis two chamber images, the slices should be positioned perpendicular to the long axis of the left ventricle, and the slices should cover the entire left ventricle.
Figure 103 Short axis slice setup using an axial image and a vertical long axis image

MRI Anatomy and Positioning Series | Module 8: Cardiac Imaging
86
The short axis view results in a series of cross-sections of the left and right ventricles, which are useful for volumetric measurements (Figure 104). Two important parameters that can be measured with cardiac MRI are Ejection Fraction (EF) and Stroke Volume (SV). These parameters can be calculated using “Simpson’s Rule”, and additional calculations that include End-Diastolic Volume (EDV), and End-Systolic Volume (ESV). The final calculations are:
Stroke Volume (SV) = End-Diastolic Volume (EDV) – End-Systolic Volume (ESV)
Ejection Fraction (EF) = Stroke Volume (SV) / End-Diastolic Volume (EDV)
Figure 104 Short axis image displays cross-section of the right and left ventricles

MRI Anatomy and Positioning Series | Module 8: Cardiac Imaging
87
Horizontal Long Axis
The horizontal long axis view, or four chamber view, can be set up using a vertical long axis two chamber image, and a short axis image (Figure 105). On the two chamber image, the slice should be positioned lengthwise, intersecting the lower third of the mitral valve and the apex of the left ventricle. On the short axis image, the slice should be positioned so it passes through the center of the left ventricle and the apex of the right ventricle.
Figure 105 Horizontal long axis setup using a vertical long axis image and a short axis image
The horizontal long axis view is used to evaluate the septal and lateral walls and apex of the left ventricle, the right ventricular free wall, and chamber sizes (Figure 106). The mitral and tricuspid valves, which are the atrioventricular valves, are well visualized in this plane. This view shows the left and right atria and ventricles of the heart simultaneously, allowing cardiologists to compare the size and features of the two sides during diagnosis. Size and proportions of the heart may be considered healthy, but that does not always relate to good cardiac function.
Figure 106 Horizontal long axis image displays right and left atria and ventricles simultaneously, as well as both atrioventricular valves

MRI Anatomy and Positioning Series | Module 8: Cardiac Imaging
88
Three Chamber View
The three chamber view can be set up using a short axis image, and a coronal scanogram image (Figure 107). On the short axis image, the slice should pass diagonally through the center of the left ventricle. On the coronal scanogram image, the slice should be positioned diagonally through the left ventricle and perpendicular to the aortic valve plane.
Figure 107 Three chamber setup using a short axis image and a coronal scanogram image
The three chamber view shows the aortic root and aortic valve, left ventricular outflow tract, mitral valve, and the anteroseptal and inferolateral walls of the left ventricle (Figure 108).
Figure 108 Three chamber image displays aortic valve and aortic root, mitral valve, and anteroseptal and inferolateral walls of left ventricle

MRI Anatomy and Positioning Series | Module 8: Cardiac Imaging
89
Relationship of Basic Views
The following images may be helpful in better understanding the relationship between the basic views of cardiac imaging, and the manner in which changes to the angulation of the plane of imaging changes the resultant image (Figure 109).
Figure 109 Red arrows indicate axes of slice planes and point to images that result from scanning in each plane
Aortic View
The aortic view, or “candy cane” view, can be set up using coronal and sagittal scanogram images, and axial images (Figure 110). Center the slice on the ascending aorta on the coronal and sagittal images. Position and angle the slice on the axial image so that it passes diagonally through both the ascending and descending aorta.
Figure 110 Aortic view setup using a coronal and a sagittal scanogram image, and an axial image
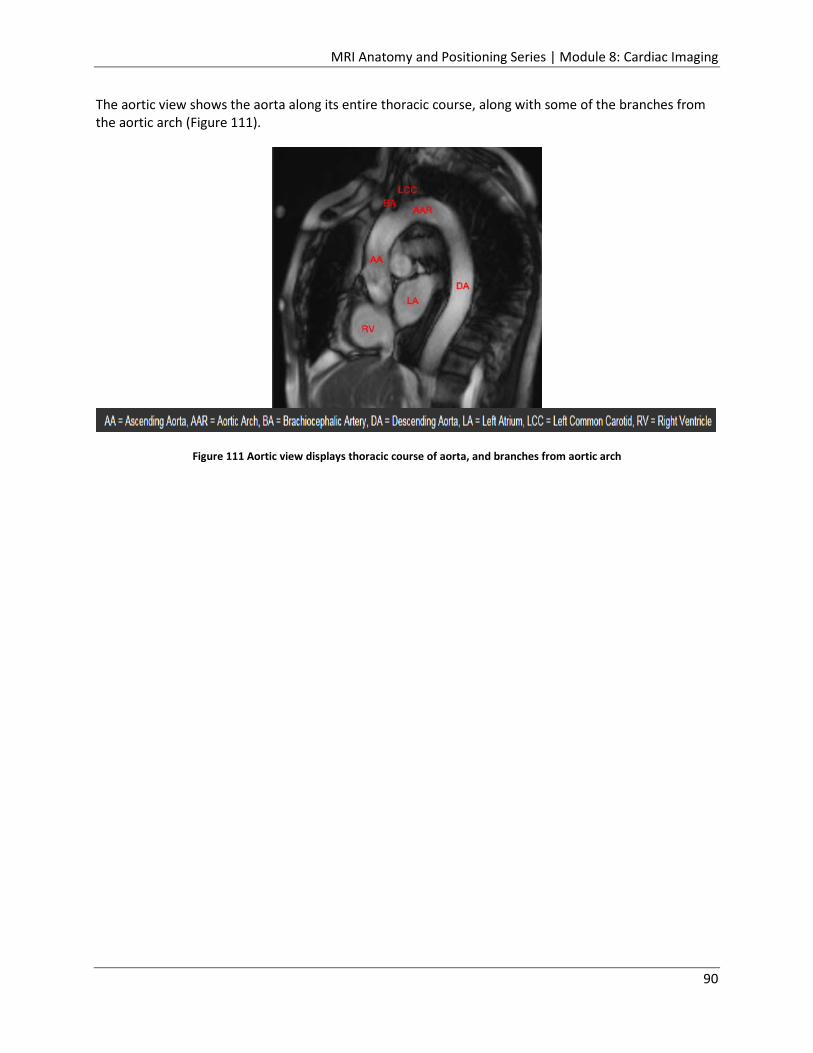
MRI Anatomy and Positioning Series | Module 8: Cardiac Imaging
90
The aortic view shows the aorta along its entire thoracic course, along with some of the branches from the aortic arch (Figure 111).
Figure 111 Aortic view displays thoracic course of aorta, and branches from aortic arch

MRI Anatomy and Positioning Series | Module 8: Cardiac Imaging
91
Interactive Scan Control
Interactive Scan Control is a feature that is available on some Hitachi MRI scanners that allows you to make changes to slice positioning and/or parameters while a scan is running. This is especially beneficial during cardiac scanning, where angulation and coverage of the correct area is very important. This feature uses a Scanogram I-Scan task, and displays images in the Fluoro viewports in the bottom row of the Exam window. Changes can be made to slice positioning by manipulating the slice group in one of the viewports. The changes are immediately reflected in the Fluoro viewport (Figure 112). The Overview window can also be opened while scanning, and parameter changes can be made during a scan acquisition. Fluoro images can be saved to the Output Series area by simply clicking on the Save button in the lower right corner of the Exam window. The Scanogram I-Scan task can be stopped and started multiple times. Each time that images are saved during successive starts, a new series is created in the Output Series area. I-Scan images can be used as reference images, or used to copy slice position in the Copy Option window.
Figure 112 Interactive Scan Control; changes made by manipulating the slice group in the upper viewports are immediately reflected in the Fluoro viewport in the bottom row

MRI Anatomy and Positioning Series | Module 8: Cardiac Imaging
92
Coronary Artery Imaging
As discussed previously, the assessment of coronary artery disease can be performed through a variety of cardiac MRI examinations, including stress tests, myocardial perfusion, and delayed hyperenhancement. The coronary arteries themselves can be indirectly evaluated by assessing myocardial function in the territory perfused by a given artery. The following images display typical perfusion territories as they would be seen in the main cardiac imaging planes (Figure 113).
Figure 113 Indirect evaluation of coronary arteries performed by assessing myocardial function in territory perfused by a given artery

MRI Anatomy and Positioning Series | Module 8: Cardiac Imaging
93
Images that include the coronary arteries can be acquired during coronary MRA studies. The two coronary arteries that arise from the aorta are the right coronary artery (RCA) and the left main coronary artery (LM) (Figure 114). In the image below, the left main artery (LM) can be seen branching into the left anterior descending (LAD) and the left circumflex (LCx ) arteries. The right coronary artery (RCA) can be seen originating from the aortic root.
Figure 114 Image on left displays left main coronary artery branching into left anterior descending and left circumflex arteries; image on right displays right coronary artery originating from aortic root

MRI Anatomy and Positioning Series | Module 8: Cardiac Imaging
94
Quantitative Analysis
Medis QMass is a post-processing analysis program with its own workstation and multiple quantification tools. It offers programs for analyzing cardiovascular dimensions and morphology, myocardial function (LV and RV function analysis), phase contrast blood flow, tissue characterization (late enhancement, T2-weighted edema, T2/T2* mapping, T1 mapping), myocardial perfusion, and MR angiography (Figures 115-118). Reports are available in a variety of formats.
Figure 115 Ventricular function
Figure 116 T-1 mapping
Figure 117 T-2* image
Figure 118 Ventricular function This concludes the Brain Imaging module of the Hitachi Medical Systems America’s MRI Anatomy and Positioning Series. You must complete the post-test for this activity in order to receive your Continuing Education credits.

MRI Anatomy and Positioning Series | Module 8: Cardiac Imaging
95
Appendix A: References for Cardiac Seminar
• University of Minnesota. (Last modified 21July2015). Atlas of Human Cardiac Anatomy. Retrieved from http://www.vhlab.umn.edu/atlas/ index.shtml
• Lin, Eugene, M.D. (Updated 13May2013). Cardiac MRI, Technical Aspects Primer. Retrieved from http://emedicine.medscape.com/article/352250-overview
• National Heart, Lung, and Blood Institute, National Institutes of Health. (Updated 17November2011). What Is the Heart? Retrieved from http://www.nhlbi.nih.gov/health/health-topics/topics/hhw
• Bailey, Regina. (n.d.) . Anatomy of the Heart: Pericardium. Retrieved from http://biology.about.com/od/anatomy/a/aa050407a.htm
• Cleveland Clinic. (n.d.). Your Coronary Arteries. Retrieved from http://my.clevelandclinic.org/services/heart/heart-blood-vessels/coronary-arteries
• Cardiovascular Consultants. (n.d.). Heart Anatomy. Retrieved from http://cardioconsult.com/Anatomy/
• Wikipedia. (Last modified 3December2015). Pulmonary vein. Retrieved from http://en.wikipedia.org/wiki/Pulmonary_vein
• Vena-cava. (n.d.) Dictionary.com Unabridged. Retrieved from http://dictionary.reference.com/browse/vena-cava
• Taylor, Tim. (n.d.). Inner Body- Heart. Retrieved from http://www.innerbody.com/image/card01.html
• Kapit, Wynn, and Lawrence M. Elson. The Anatomy Coloring Book. New York: HarperCollins, 1993.
• Wikipedia. (Last modified 24August2015). Electrical conduction system of the heart. Retrieved from https://en.wikipedia.org/wiki/Electrical_conduction_system_of_the_heart
• WebMD. (Reviewed on 15November2014). Heart Health Center. Retrieved from http://www.webmd.com/heart/picture-of-the-heart
• Christensen, Sonya. (n.d.). Anatomy, Physiology & Electrophysiology. Retrieved from http://www.andrews.edu/~schriste/Course_Notes/Anatomy__Physiology__and_Elect/anatomy__physiology__and_elect.html
• Wikipedia. (Last modified 23November2015). Cardiac action potential. Retrieved from https://en.wikipedia.org/wiki/Cardiac_action_potential
• Great cardiac vein. (n.d.). Mosby’s Medical Dictionary, 8th edition. (2009). Retrieved from http://medical-dictionary.thefreedictionary.com/great+cardiac+vein
• Wikipedia. (Last modified 16November2015). Aorta. Retrieved from https://en.wikipedia.org/wiki/Aorta
• Healthgrades. (Last review 23August2013). Heart Disease. Retrieved from http://www.healthgrades.com/conditions/heart-disease
• American Heart Association. (Last reviewed 18December2014). What is Cardiovascular Disease? Retrieved from

MRI Anatomy and Positioning Series | Module 8: Cardiac Imaging
96
http://www.heart.org/HEARTORG/Caregiver/Resources/WhatisCardiovascularDisease/What-is-Cardiovascular-Disease_UCM_301852_Article.jsp#.Vm8duU3lvs0
• Wikipedia. (Last modified 19April2015). Cardiopulmonary resuscitation. Retrieved from https://en.wikipedia.org/wiki/Cardiopulmonary_resuscitation
• WebMD. (Reviewed 4August2015). A Visual Guide to Atrial Fibrillation. Retrieved from http://www.webmd.com/heart-disease/atrial-fibrillation/ss/slideshow-af-overview?ecd=wgt
• CardioSmart, American College of Cardiology. (n.d.). Cardiac MRI. Retrieved from https://www.cardiosmart.org/News-and-Events/2013/01/Video-Cardiac-MRI
• Akinpelu, M.D., David. (Updated 9February2015). Pharmacologic Stress Testing. Retrieved from http://emedicine.medscape.com/article/1827166-overview
• Wikipedia. (Last modified 16June2015). Cardiac output. Retrieved from https://en.wikipedia.org/wiki/Cardiac_output
• Cleveland Clinic (Reviewed June2015). Cardiac MRI Adenosine Stress Test. Retrieved from http://my.clevelandclinic.org/services/heart/diagnostics-testing/radiographic-tests/cardiac-mri-adenosine-stress-test
• Greenberg, M.D., S. Bruce. (October 2000). Assessment of Cardiac Function: Magnetic Resonance and Computed Tomography. Retrieved from http://journals.lww.com/thoracicimaging/Abstract/2000/10000/Assessment_of_Cardiac_Function__Magnetic_Resonance.4.aspx
• Wikipedia. (Last modified 1November2015). Pericardial fluid. Retrieved from https://en.wikipedia.org/wiki/Pericardial_fluid
• Hoa, Dennis. (n.d.). Delayed Enhancement MRI (DE-MRI). Retrieved from https://www.imaios.com/en/e-Courses/e-MRI/Cardiac-MRI/myocardial-delayed-enhancement
• Associated Press. (23March2015). FDA Approves MRI-Safe Pacemaker. Retrieved from http://www.mdtmag.com/news/2015/03/fda-approves-mri-safe-pacemaker
• Wasserman, Emily. (8May2014). Biotronik scores FDA approval for MRI-safe pacemaker system. Retrieved from http://www.mdtmag.com/news/2015/03/fda-approves-mri-safe-pacemaker
• Santini, M.D., Ph.D. ,Luca, Forleo, M.D., Ph.D., Giovanni B., Santini, M.D., Massimo. (2013). Evaluating MRI-Compatible Pacemakers. Retrieved from http://www.medscape.com/viewarticle/780430
• Wikipedia. (Last modified 19April2015). Cardioversion. Retrieved from https://en.wikipedia.org/wiki/Cardioversion
• Bhola, M.D., Rajesh. (Updated 8April2015). Hibernating and Stunned Myocardium Imaging. Retrieved from http://emedicine.medscape.com/article/352588-overview
• Medtronic. (14September2015). Medtronic First to Receive FDA Approval for MR-Conditional Implantable Cardioverter Defibrillator System. Retrieved from http://multimediacapsule.thomsonone.com/medtronic/medtronic-first-to-receive-fda-approval-for-mr-conditional-implantable-cardioverter-defibrillator-system
• Cleveland Clinic. (n.d.). Your Coronary Arteries. Retrieved from http://my.clevelandclinic.org/services/heart/heart-blood-vessels/coronary-arteries

MRI Anatomy and Positioning Series | Module 8: Cardiac Imaging
97
• Wikipedia. (Last modified 11December2015). Pericardial effusion. Retrieved from https://en.wikipedia.org/wiki/Pericardial_effusion
• What-when-how. (n.d.). The Cardiovascular System (Structure and Function)(Nursing) Part 2. Retrieved from http://what-when-how.com/nursing/the-cardiovascular-system-structure-and-function-nursing-part-2/
• Bookdome. (Last modified 7July2015). The Position of the Heart. Retrieved from http://bookdome.com/health/anatomy/Human-Body/The-Position-Of-The-Heart.html#.VnA0KE3lvs0
• Ho, PhD, S. Yen. (Last modified 7May2013). Cardiac Anatomy. Retrieved from http://textbookofcardiology.org/wiki/Anatomy_of_the_Heart
• MAN anatomy. (n.d.). Anatomy of Heart. Retrieved from http://www.mananatomy.com/body-systems/cardiovascular-system/anatomy-heart
• American Heart Association. (Last reviewed 4August2014). Understanding Blood Pressure Readings. Retrieved from http://www.heart.org/HEARTORG/Conditions/HighBloodPressure/AboutHighBloodPressure/Understanding-Blood-Pressure-Readings_UCM_301764_Article.jsp#
• Boundless. (21July2015). The Cardiac Cycle. Retrieved from https://www.boundless.com/biology/textbooks/boundless-biology-textbook/the-circulatory-system-40/mammalian-heart-and-blood-vessels-226/the-cardiac-cycle-852-12097/
• OpenStax CNX. (n.d.). Circulatory and Respiratory Systems. Retrieved from http://cnx.org/contents/xuaYcQPd@2/Circulatory-and-Respiratory-Sy
• Practical Clinical Skills. (n.d.). ECG Interpretation. Retrieved from http://www.practicalclinicalskills.com/ecg-interpretation.aspx
• Braunwald, Dr. Eugene. (27November2012). The Sympathetic Nervous System in Heart Failure. Retrieved from http://www.icnr.com/articles/sympathetic-nervous-system-and-heart-failure.html
• Fogoros, M.D., Richard N. (Updated 4December, 2014). Vagus Nerve. Retrieved from http://heartdisease.about.com/od/lesscommonheartproblems/g/Vagus-Nerve.htm
• Modesto Junior College. (n.d.). Chapter 13- Cardiac Function. Retrieved from http://droualb.faculty.mjc.edu/Course%20Materials/Physiology%20101/Chapter%20Notes/Fall%202011/chapter_13%20Fall%202011.htm
• Samanka, Dr. (Last updated 24November2013). Difference Between Myocardial Infarction and Cardiac Arrest. Retrieved from http://www.differencebetween.com/difference-between-myocardial-infarction-and-vs-cardiac-arrest/
• WebMD. (Reviewed 11April2015). Heart Attacks and Heart Disease. Retrieved from http://www.webmd.com/heart-disease/guide/heart-disease-heart-attacks
• MedlinePlus. (Update 13May2014). Ectopic heartbeat. Retrieved from https://www.nlm.nih.gov/medlineplus/ency/article/001100.htm
• American Heart Association. (Updated 21August2015). Ventricular Fibrillation. Retrieved from http://www.heart.org/HEARTORG/Conditions/Arrhythmia/AboutArrhythmia/Ventricular-Fibrillation_UCM_324063_Article.jsp#

MRI Anatomy and Positioning Series | Module 8: Cardiac Imaging
98
• WebMD. (Reviewed 22February2014). Heart Valve Disease. Retrieved from http://www.webmd.com/heart-disease/guide/heart-valve-disease
• American Heart Association. (Updated 17August2015). Common Types of Heart Defects. Retrieved from http://www.heart.org/HEARTORG/Conditions/CongenitalHeartDefects/AboutCongenitalHeartDefects/Common-Types-of-Heart-Defects_UCM_307017_Article.jsp#
• Cleveland Clinic. (n.d.). What is Cardiomyopathy? Retrieved from http://my.clevelandclinic.org/services/heart/disorders/hic_What_is_Cardiomyopathy
• A.T. Still University. (n.d.). Carditis. Retrieved from http://www.atsu.edu/faculty/chamberlain/website/lectures/tritzid/carditis.htm
• WebMD. (n.d.). Heart Disease Health Center- Treatment & Care. Retrieved from http://www.webmd.com/heart-disease/guide/heart-disease-treatment-care
• MedlinePlus. (Updated 26October2014). Cardiac ablation procedures. Retrieved from https://www.nlm.nih.gov/medlineplus/ency/article/007368.htm
• American Heart Association. (Reviewed 23October2014). Artificial Pacemaker. Retrieved from http://www.heart.org/HEARTORG/Conditions/Arrhythmia/PreventionTreatmentofArrhythmia/Artificial-Pacemaker_UCM_448480_Article.jsp#
• American Heart Association. (Reviewed 23October2014). Implantable Cardioverter Defibrillator (ICD). Retrieved from http://www.heart.org/HEARTORG/Conditions/Arrhythmia/PreventionTreatmentofArrhythmia/Implantable-Cardioverter-Defibrillator-ICD_UCM_448478_Article.jsp#
• MedicineNet.com. (n.d.). Valve Disease Treatment (Heart Valve Surgery). Retrieved from http://www.medicinenet.com/heart_valve_disease_treatment/article.htm
• American Heart Association. (Updated 26October2015). Cardiac Catheterizations for Heart Defects. Retrieved from http://www.heart.org/HEARTORG/Conditions/CongenitalHeartDefects/CareTreatmentforCongenitalHeartDefects/Cardiac-Catheterizations-for-Heart-Defects_UCM_307730_Article.jsp#
• Mayo Clinic. (17March2015). Diseases and Conditions- Cardiomyopathy. Retrieved from http://www.mayoclinic.org/diseases-conditions/cardiomyopathy/basics/treatment/con-20026819
• Wikipedia. (Last modified 8December2015). Vasodilation. Retrieved from https://en.wikipedia.org/wiki/Vasodilation
• Mayo Clinic. (1February2014). Diseases and Conditions- High blood pressure (hypertension). Retrieved from http://www.mayoclinic.org/diseases-conditions/high-blood-pressure/in-depth/ace-inhibitors/ART-20047480
• Radiology Web Site. (n.d.). CMR Pages- CMR Sequences, CMR Planes. Retrieved from http://radiology.cornfeld.org/CMR/planes.php
• Wikipedia. (Last modified 19November2015). ACE inhibitor. Retrieved from https://en.wikipedia.org/wiki/ACE_inhibitor

MRI Anatomy and Positioning Series | Module 8: Cardiac Imaging
99
• Mayo Clinic. (1February2014). Diseases and Conditions- High blood pressure (hypertension). Retrieved from http://www.mayoclinic.org/diseases-conditions/high-blood-pressure/in-depth/beta-blockers/art-20044522
• Norton, M.D., Patrick T., Nacey, M.D., Nicholas C., Caovan, M.D., Dominique B., Gay, M.D., Spencer B., Kramer, M.D., Christopher M., Jeun, M.D., Bryan S. (2013). Cardiac MRI: The Basics. Retrieved from http://www.med-ed.virginia.edu/courses/rad/cardiacmr/index.html
• Wikipedia. (Last modified 9December2015). Anticoagulant. Retrieved from https://en.wikipedia.org/wiki/Anticoagulant
• WebMD. (Reviewed 28September2014). Heart Disease and Stress Tests. Retrieved from http://www.webmd.com/heart-disease/guide/stress-test
• Hoa, Denis. (n.d.). Cardiac synchronization methods(cardiac gating). Retrieved from https://www.imaios.com/en/e-Courses/e-MRI/Cardiac-MRI/ecg-gating
• Bhola, M.D., Rajesh. (Updated 8April2015). Hibernating and Stunned Myocardium Imaging. Retrieved from http://emedicine.medscape.com/article/352588-overview
• American Heart Association. (19November2007). Scientific Statement- Safety of Magnetic Resonance Imaging in Patients With Cardiovascular Devices. Retrieved from http://circ.ahajournals.org/content/116/24/2878.full
• MRISafety.com. (n.d.). Safety Information Article. Retrieved from http://www.mrisafety.com/SafetyInfov.asp?SafetyInfoID=179
• Santini, M.D.,Ph.D., Luca, Forleo, M.D., Giovanni, Santini, M.D., Massimo. (n.d.). Evaluating MRI-Compatible Pacemakers. Retrieved from http://www.medscape.com/viewarticle/780430
• The Associated Press. (23March2015). FDA Approves MRI-Safe Pacemaker. Retrieved from http://www.mdtmag.com/news/2015/03/fda-approves-mri-safe-pacemaker
• Ferreira, Antonio M., Costa, Francisco, Tralhao, Antonio, Marques, Hugo, Cardim, Nuno, Adragao, Pedro. (7May2014). MRI-conditional pacemakers: current perspectives. Retrieved from http://www.ncbi.nlm.nih.gov/pmc/articles/PMC4019608/
• Salzman, Sony. (27June2013). St. Jude Medical launches MRI-safe pacemaker system in Japan. Retrieved from http://www.massdevice.com/st-jude-medical-launches-mri-safe-pacemaker-system-japan/
• MRISafety.com (n.d.). Safety Information Article- Cardiac Pacemakers, Implantable Cardioverter Defibrillators (ICDs), and Cardiac Monitors. Retrieved from http://www.mrisafety.com/SafetyInfov.asp?SafetyInfoID=167
• O’Riordan, Michael. (14September2015). FDA Approves First ICD Designed to Be MRI Compatible. Retrieved from http://www.medscape.com/viewarticle/850947
• Medtronic. (14September2015). Medtronic First to Receive FDA Approval for MR-Conditional Implantable Cardioverter Defibrillator System. Retrieved from http://newsroom.medtronic.com/phoenix.zhtml?c=251324&p=irol-newsArticle&ID=2087595
• Densford, Fink. (15May2015). HRS 2015: Biotronik’s Iforia ICD safe for MRI. Retrieved from http://www.massdevice.com/hrs-2015-biotroniks-iforia-icd-safe-mri/

MRI Anatomy and Positioning Series | Module 8: Cardiac Imaging
100
Appendix B: References for Anatomy Pictures
• Figure 1 - http://www.oustormcrowd.com/important-details-to-know-the-heart-location/heart-location-in-chest-cavity/
• Figure 2 - http://www.radiologyassistant.nl/en/p48ce14c4dcd2e/cardiac-anatomy.html • Figure 3 -
http://droualb.faculty.mjc.edu/Lecture%20Notes/Unit%204/Heart%20with%20figures.htm • Figure 4 - http://www.knowyourbody.net/serous-pericardium.html • Figure 5 - http://www.uofmchildrenshospital.org/healthlibrary/Article/89102 • Figure 6 - http://www.rci.rutgers.edu/~uzwiak/AnatPhys/Cardiovascular_System.html • Figure 7 - http://anatomyandphysiologyi.com/heart-anatomy-chambers-vessels-valves/ • Figure 8 - http://mvpresource.com/what-are-the-chordae-tendineae/ • Figure 9 - http://www.infobarrel.com/Heart_Valves • Figure 10 - http://anatomyandphysiologyi.com/heart-anatomy-chambers-vessels-valves/ • Figure 11 - http://anatomyandphysiologyi.com/heart-anatomy-chambers-vessels-valves/ • Figure 12 -
https://my.clevelandclinic.org/florida/sitecore/content/sites/clevelandclinic/home/services/heart/heart-blood-vessels/aorta
• Figure 13 - http://www.fastbleep.com/medical-notes/heart-lungs-blood/1/90/572 • Figure 14 - http://pop-anatomy.wikispaces.com/HEART • Figure 15 -
http://droualb.faculty.mjc.edu/Course%20Materials/Physiology%20101/Chapter%20Notes/Fall%202011/chapter_13%20Fall%202011.htm
• Figure 16 - http://circulatorysystemlesson.wikispaces.com/Blood+Flow+Through+the+Heart • Figure 17 - https://en.wikipedia.org/wiki/Cardiac_output • Figure 18 - https://www.boundless.com/biology/textbooks/boundless-biology-textbook/the-
circulatory-system-40/mammalian-heart-and-blood-vessels-226/the-cardiac-cycle-852-12097/ • Figure 19 - http://cnx.org/contents/xuaYcQPd@2/Circulatory-and-Respiratory-Sy • Figure 20 - https://www.boundless.com/biology/textbooks/boundless-biology-textbook/the-
circulatory-system-40/mammalian-heart-and-blood-vessels-226/the-cardiac-cycle-852-12097/ • Figure 21 - http://5starstrong.com/?p=177 • Figure 22 -
http://www.auntminnie.com/index.aspx?sec=sup&sub=mri&pag=dis&itemId=103139 • Figure 23 - http://imaging.onlinejacc.org/article.aspx?articleid=1109824#topLocation • Figure 24 - http://www.practicalclinicalskills.com/ekg-reference-guide-details.aspx?lessonID=1 • Figure 25 - http://www.practicalclinicalskills.com/ekg-reference-guide-details.aspx?lessonID=2 • Figure 26 - http://www.practicalclinicalskills.com/ekg-reference-guide-
details.aspx?lessonID=11 • Figure 27 - http://www.practicalclinicalskills.com/ekg-reference-guide-
details.aspx?lessonID=26

MRI Anatomy and Positioning Series | Module 8: Cardiac Imaging
101
• Figure 28 - https://openi.nlm.nih.gov/detailedresult.php?img=2627207_kjr-9-439-g010&req=4 • Figure 29 -
http://intranet.tdmu.edu.ua/data/kafedra/internal/vnutrmed2/classes_stud/en/med/lik/ptn/Internal%20medicine/5%20course/06.%20Adult%20Congenital%20Heart%20Disease.htm
• Figure 30 - http://intranet.tdmu.edu.ua/data/kafedra/internal/vnutrmed2/classes_stud/en/med/lik/ptn/Internal%20medicine/5%20course/06.%20Adult%20Congenital%20Heart%20Disease.htm
• Figure 31 - http://intranet.tdmu.edu.ua/data/kafedra/internal/vnutrmed2/classes_stud/en/med/lik/ptn/Internal%20medicine/5%20course/06.%20Adult%20Congenital%20Heart%20Disease.htm
• Figure 32 - http://intranet.tdmu.edu.ua/data/kafedra/internal/vnutrmed2/classes_stud/en/med/lik/ptn/Internal%20medicine/5%20course/06.%20Adult%20Congenital%20Heart%20Disease.htm
• Figure 33 - http://intranet.tdmu.edu.ua/data/kafedra/internal/vnutrmed2/classes_stud/en/med/lik/ptn/Internal%20medicine/5%20course/06.%20Adult%20Congenital%20Heart%20Disease.htm
• Figure 34 - http://intranet.tdmu.edu.ua/data/kafedra/internal/vnutrmed2/classes_stud/en/med/lik/ptn/Internal%20medicine/5%20course/06.%20Adult%20Congenital%20Heart%20Disease.htm
• Figure 35 - http://limpeter-mriblog.blogspot.com/2009/10/cardiac-pathology.html • Figure 36 - http://limpeter-mriblog.blogspot.com/2009_12_01_archive.html • Figure 37 - http://emedicine.medscape.com/article/157096-workup#c11 • Figure 38 - http://www.radiologyassistant.nl/en/p4a3ff48cccc37/ischemic-and-non-ischemic-
cardiomyopathy.html • Figure 39 - http://www.elsevier.es/en-revista-radiologia-419-articulo-myocarditis-magnetic-
resonance-imaging-diagnosis-90234822 • Figure 40 - http://mvpresource.com/what-is-infective-endocarditis/ • Figure 41 - http://www.intechopen.com/books/current-issues-and-recent-advances-in-
pacemaker-therapy/device-related-endocarditis-and-infected-leads-extraction-the-dark-side-of-the-moon
• Figure 42 - http://posterng.netkey.at/esr/viewing/index.php?module=viewing_poster&task=viewsection&pi=121908&ti=398225&searchkey
• Figure 43 - http://www.brookhavenheart.com/services/angioplasty-stenting/ • Figure 44 - http://www.mountsinai.org/patient-care/service-areas/heart/areas-of-care/heart-
attack-coronary-artery-disease/treatment • Figure 45 - http://www.mayoclinic.org/diseases-conditions/atrial-fibrillation/multimedia/img-
20096441 • Figure 46 - http://www.dolcera.com/wiki/index.php?title=Cardiac_Pacemakers • Figure 47 - http://www.nhlbi.nih.gov/health/health-topics/topics/icd

MRI Anatomy and Positioning Series | Module 8: Cardiac Imaging
102
• Figure 48 - http://www.scielo.br/scielo.php?pid=S0066-782X2014005040057&script=sci_arttext
• Figure 49 - http://www.medscape.com/viewarticle/814612_11 • Figure 50 - http://circ.ahajournals.org/content/119/7/1034/F1.expansion.html • Figure 51 - http://www.heart.org/idc/groups/heart-
public/@wcm/@hcm/documents/downloadable/ucm_307680.pdf • Figure 52 - http://www.mayoclinic.org/tests-procedures/ventricular-assist-
devices/multimedia/left-ventricular-assist-device-lvad/img-20006714 • Figure 53 - https://quizlet.com/23118891/pathology-exam-2-cvs-flash-cards/ • Figure 54 - Hitachi images • Figure 55 - Hitachi images • Figure 56 - Hitachi images • Figure 57 - Hitachi images • Figure 58 - http://content.onlinejacc.org/article.aspx?articleid=1138120 • Figure 59 - http://www.med-ed.virginia.edu/courses/rad/cardiacmr/Techniques/VENC.html • Figure 60 - http://www.med-ed.virginia.edu/courses/rad/cardiacmr/Techniques/VENC.html • Figure 61 - Hitachi image • Figure 62 - Hitachi image • Figure 63 - Hitachi images • Figure 64 - http://www.medandlife.ro/archive/124-vol-iv-iss-4-oct-dec-2011/reviews-vol-iv-
iss4/318-cardiac-magnetic-resonance-imaging-in-ischemic-heart-disease • Figure 65 - http://www.medandlife.ro/archive/124-vol-iv-iss-4-oct-dec-2011/reviews-vol-iv-
iss4/318-cardiac-magnetic-resonance-imaging-in-ischemic-heart-disease • Figure 66 - http://www.medandlife.ro/archive/124-vol-iv-iss-4-oct-dec-2011/reviews-vol-iv-
iss4/318-cardiac-magnetic-resonance-imaging-in-ischemic-heart-disease • Figure 67 - http://www.medandlife.ro/archive/124-vol-iv-iss-4-oct-dec-2011/reviews-vol-iv-
iss4/318-cardiac-magnetic-resonance-imaging-in-ischemic-heart-disease • Figure 68 - Hitachi image • Figure 69 - http://www.ismrm.org/smrt/JAK/ClinicalExample2.pdf • Figure 70 - http://www.medandlife.ro/archive/124-vol-iv-iss-4-oct-dec-2011/reviews-vol-iv-
iss4/318-cardiac-magnetic-resonance-imaging-in-ischemic-heart-disease • Figure 71 - http://www.medandlife.ro/archive/124-vol-iv-iss-4-oct-dec-2011/reviews-vol-iv-
iss4/318-cardiac-magnetic-resonance-imaging-in-ischemic-heart-disease • Figure 72 -
http://www.auntminnie.com/index.aspx?sec=sup&sub=cto&pag=dis&ItemID=83529 • Figure 73 - http://www.singhealth.com.sg/DoctorsAndHealthcareProfessionals/Medical-
News/2013/Pages/Saving-Limbs-Preserving-Lives.aspx • Figure 74 - http://www.mitralvalverepair.org/content/view/137/ • Figure 75 - http://www.medtronic.com/for-healthcare-professionals/products-
therapies/cardiac-rhythm/pacemakers/revo-mri-pacing-system/index.htm

MRI Anatomy and Positioning Series | Module 8: Cardiac Imaging
103
• Figure 76 - http://www.massdevice.com/bsx-wins-ce-mark-fda-nod-new-s-icd-regulatory-news-week-march-23-2015/
• Figure 77 - http://www.mrisurescan.com/europe/for-radiologists/pacemakers/sure-scan-devices-leads/evera-mri/index.htm
• Figure 78 - Hitachi image • Figure 79 - Hitachi image • Figure 80 - Hitachi image • Figure 81 - Hitachi image • Figure 82 - Hitachi image • Figure 83 - Hitachi image • Figure 84 - Hitachi image • Figure 85 - Hitachi image • Figure 86 - Hitachi image • Figure 87 - Hitachi image • Figure 88 - Hitachi image • Figure 89 - Hitachi image • Figure 90 - Hitachi image • Figure 91 - Hitachi image • Figure 92 - Hitachi image • Figure 93 - Hitachi image • Figure 94 - Hitachi image • Figure 95 - Hitachi image • Figure 96 - Hitachi image • Figure 97 - Hitachi image • Figure 98 - Hitachi image • Figure 99 - Hitachi image • Figure 100 - Left image from Hitachi; right image from http://www.med-
ed.virginia.edu/courses/rad/cardiacmr/Anatomy/Normal.html# • Figure 101 - Hitachi images • Figure 102 - http://www.med-ed.virginia.edu/courses/rad/cardiacmr/Anatomy/Vertical.html • Figure 103 - Hitachi images • Figure 104 - http://www.med-ed.virginia.edu/courses/rad/cardiacmr/Anatomy/Short.html • Figure 105 - Hitachi images • Figure 106 - http://www.med-
ed.virginia.edu/courses/rad/cardiacmr/Anatomy/Horizontal.html • Figure 107 - Hitachi images • Figure 108 - http://www.med-ed.virginia.edu/courses/rad/cardiacmr/Anatomy/Three.html# • Figure 109 - http://www.med-ed.virginia.edu/courses/rad/cardiacmr/Anatomy/Views.html • Figure 110 - Hitachi images

MRI Anatomy and Positioning Series | Module 8: Cardiac Imaging
104
• Figure 111 - http://www.med-ed.virginia.edu/courses/rad/cardiacmr/Anatomy/AorticView.html
• Figure 112 - Hitachi image • Figure 113 - http://www.med-
ed.virginia.edu/courses/rad/cardiacmr/Anatomy/Territory.html# • Figure 114 - http://www.med-ed.virginia.edu/courses/rad/cardiacmr/Anatomy/Coronary.html • Figure 115 - http://www.medis.nl/Products/QMassES • Figure 116 - http://www.medis.nl/Products/QMassES • Figure 117 - http://www.medis.nl/Products/QMassES • Figure 118 - http://www.medis.nl/Products/QMassES