mri brain; basics and radiological anatomy
TRANSCRIPT

MRI BRAINBASICS AND RADIOLOGICAL ANATOMY
IMRAN RIZVI
A brief history• Magnetic Resonance phenomenon first described by Felix
Bloch and Edward Purcell in 1946. In 1952 they were awarded the Nobel Prize.
• 1971 -Raymond Damadian showed that the nuclear magnetic relaxation times of tissues and tumors differed, sparking interest in medical uses
• 1987 –MR angiography developed by Charles Dumoulin.


In short
• The Patient Is Placed In A Magnetic Field.
• A Radio Frequency Wave Is Sent In.
• The Radio Frequency Wave Is Turned Off.
• The Patient Emits A Signal.
• Which Is Received And Used For Reconstruction
Of The Picture.

• MRI is based on the principle of nuclear magnetic
resonance (NMR)
• Two basic principles of NMR
1.Atoms with an odd number of protons or neutrons have
spin
2.A moving electric charge, either positive or negative,
produces a magnetic field
• Body has many such atoms that can act as good MR
nuclei (1H, 13C, 19F, 23Na)
Why Hydrogen ions are used in MRI? Hydrogen nucleus has an unpaired proton which is
positively charged
Every hydrogen nucleus is a tiny magnet which produces small but noticeable magnetic field
Hydrogen is abundant in the body in the form of water and fat
Essentially all MRI is hydrogen (proton) imaging

Body in an external magnetic field (B0)
• In our natural state Hydrogen ions in body are spinning in
a haphazard fashion, and cancel all the magnetism.
• When an external magnetic field is applied protons in the
body align in one direction.

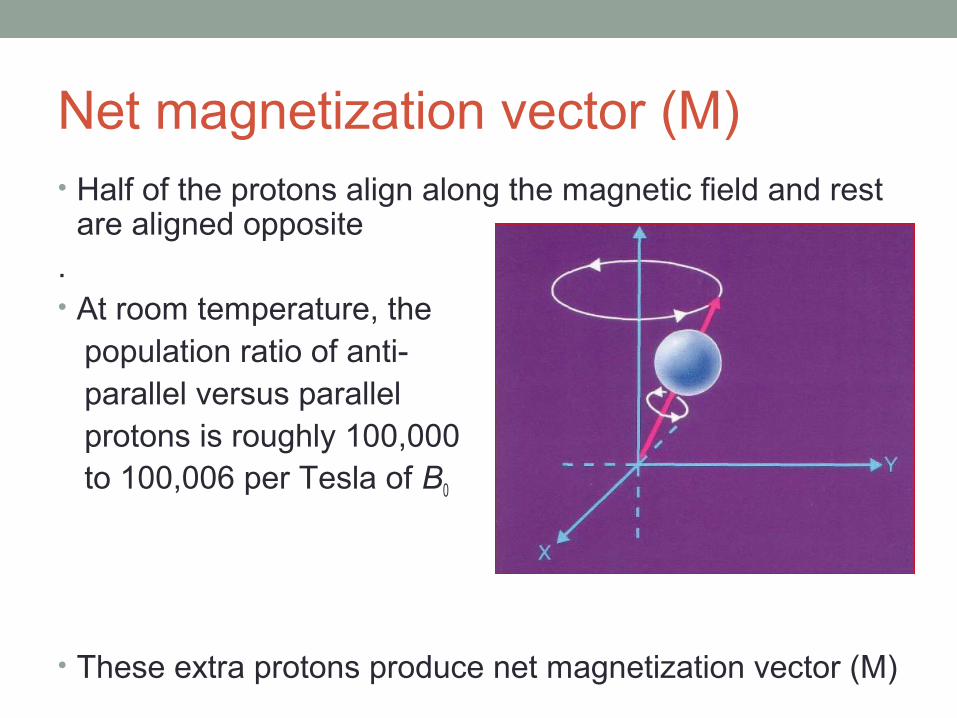
Net magnetization vector (M)• Half of the protons align along the magnetic field and rest
are aligned opposite.• At room temperature, the population ratio of anti- parallel versus parallel protons is roughly 100,000 to 100,006 per Tesla of B0
• These extra protons produce net magnetization vector (M)

Manipulating the net magnetization• RF waves are used to manipulate the magnetization of H
nuclei• the RF pulse causes longitudinal magnetization to
decrease, and establishes a new transversal magnetization.
Turning off the RF wave.
• When RF pulse is stopped higher energy gained by proton is
retransmitted and hydrogen nuclei relax by two mechanisms
• T1 or spin lattice relaxation-
by which original magnetization (longitudinal) begins to
recover.
• T2 relaxation or spin spin relaxation –
by which magnetization in X-Y plane (transversal) decays
towards zero in an exponential fashion.

T1 relaxation (spin-lattice relaxation)After protons are Excited with RF pulse They move out of Alignment .
But once the RF Pulseis stopped they Realign after some Time And this is called t1 relaxation
T1 is defined as the time it takes for the hydrogen nucleus to recover 63% of its longitudinal magnetization
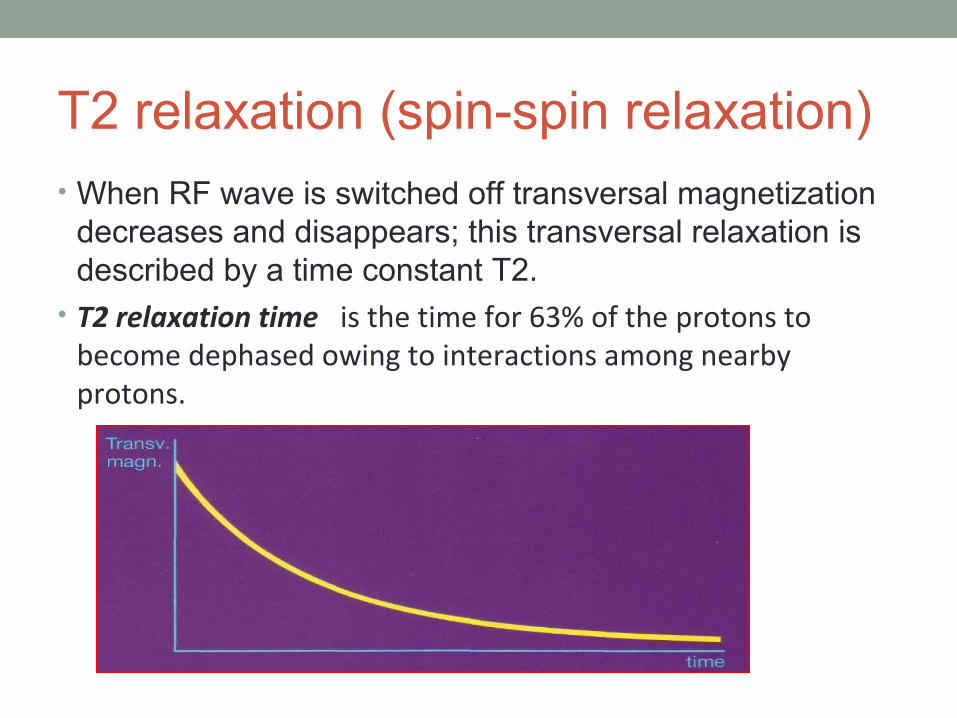
T2 relaxation (spin-spin relaxation)• When RF wave is switched off transversal magnetization
decreases and disappears; this transversal relaxation is described by a time constant T2.
• T2 relaxation time is the time for 63% of the protons to become dephased owing to interactions among nearby protons.

TR & TE• TR (Repetition Time): is the length of time from one 90°
RF pulse to the next 90° RF pulse. • TE (Echo Time): This is the time between an RF
excitation pulse and the collection of the signal.

Short TR+ short TE= T 1 weighted image• In general a short TR (<1000ms) and short TE (<45 ms)
scan is T1WI.

T1 Characteristics• White matter brighter than Gray.
Dark on T 1: CSF, Edema, tumor, infection, inflammation, hemorrhage (hyper acute, chronic), Low proton density, calcification.
Bright on T1: Fat, sub acute hemorrhage, melanin, protein rich fluid, Slowly flowing blood, Paramagnetic substances(gadolinium, copper, manganese).

Long TR+ Long TE= T 2 weighted image• Long TR (>2000ms) and long TE (>45ms) scan is
T2WI.

T 2 Characteristics
• Gray matter brighter than white.
• Bright on T 2: CSF, Edema, tumor, infection, inflammation, subdural collection, Methemoglobin in late sub acute hemorrhage
• Dark on T2: calcification, fibrous tissue, deoxyhemoglobin, methemoglobin (intracellular), iron, hemosiderin, melanin

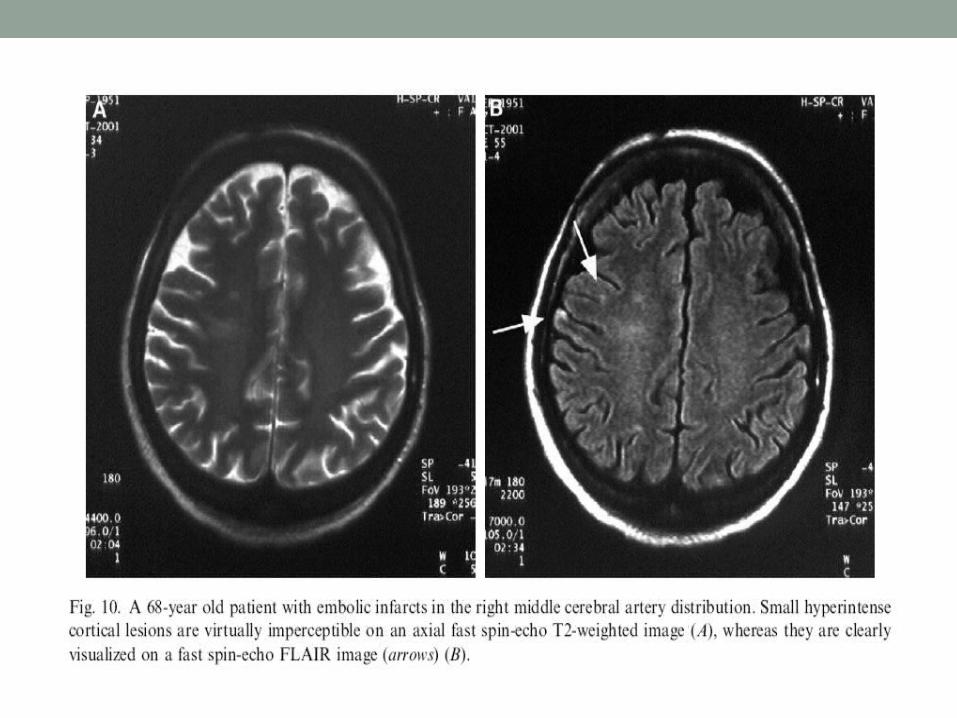
Fluid-attenuated inversion recovery(FLAIR)• T2-weighted imaging is well suited for lesion detection in
the brain because most lesions appear hyperintense with
this sequence.
• However CSF also appears hyperintense on T2-weighted
spin-echo (SE) images.
• Therefore, lesions at CSF interfaces, such as cortical sulci
and ventricles, may be mistaken for extensions of CSF or
partial volume effects.

• The conventional FLAIR technique employs a 180 degree
RF pulse to flip the net magnetization vector 180° and
null the signal from a particular entity (eg, water in tissue).
• When the RF pulse ceases, the spinning nuclei begin to
relax. When the net magnetization vector for water
passes the transverse plane (the null point for that tissue),
the conventional 90° pulse is applied, and the SE
sequence then continues as before.
• The interval between the 180° pulse and the 90° pulse is
the TI ( Inversion Time).

• FLAIR imaging suppresses signal from free water in CSF
and maintains hyperintense lesion contrast.
• FLAIR image have a long TR and TE and an inversion
time (TI) that is tailored to null the signal from CSF.
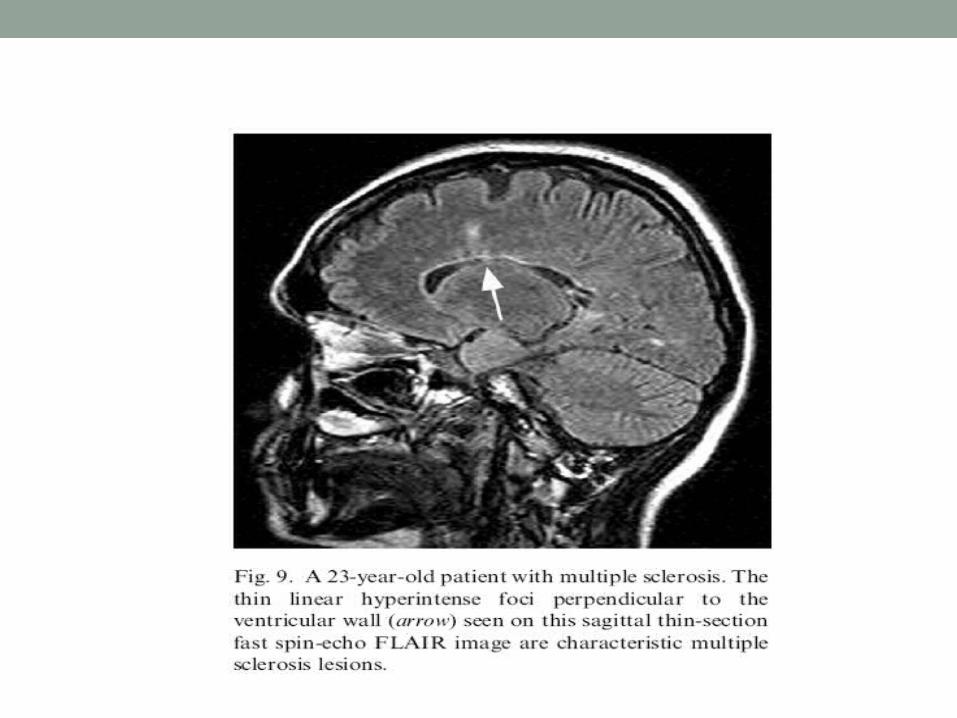
• FLAIR sequences are particularly useful in evaluation of
MS, infarcts, SAH
Bangerter NK et al. J Magn Reson Imaging. 2006;24 : 1426-31

Which scan best defines the abnormalityT1 W Images:Subacute HemorrhageFat-containing structuresAnatomical Details
T2 W Images:EdemaDemyelinationInfarctionChronic Hemorrhage
FLAIR Images:Edema, Demyelination Infarction esp. in Periventricular location

Diffusion-weighted MRI
• Diffusion-weighted MRI is a example of endogenous
contrast, using the motion of protons to produce signal
changes
• DWI images is obtained by applying pairs of opposing
and balanced magnetic field gradients (but of differing
durations and amplitudes)
• The primary application of DW MR imaging has been in
brain imaging, mainly because of its exquisite sensitivity
to early detection of ischemic stroke

• The normal motion of water molecules within living tissues is random (brownian motion).
• In acute stroke, there is an alteration of homeostasis
• Acute stroke causes excess intracellular water accumulation, or cytotoxic edema, with an overall decreased rate of water molecular diffusion within the affected tissue.
• Therefore, areas of cytotoxic edema, in which the motion of water molecules is restricted, appear brighter on diffusion-weighted images because of lesser signal losses


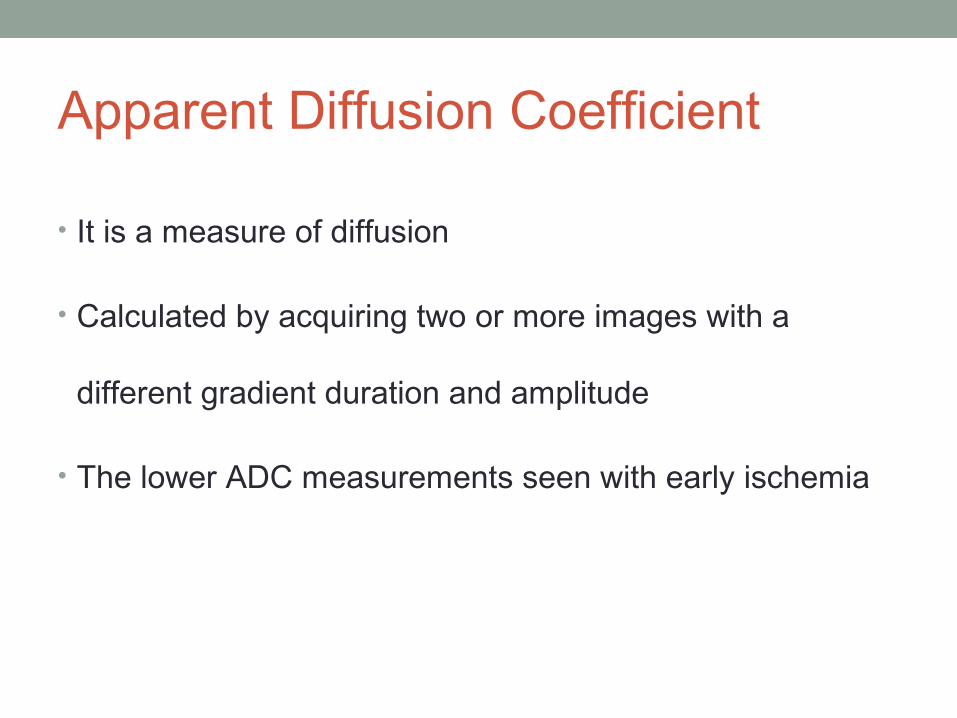
Apparent Diffusion Coefficient
• It is a measure of diffusion
• Calculated by acquiring two or more images with a
different gradient duration and amplitude
• The lower ADC measurements seen with early ischemia

• The ADC may be useful for estimating the lesion age and distinguishing acute from subacute DWI lesions.
• Acute ischemic lesions can be divided into hyperacute lesions (low ADC and DWI-positive) and subacute lesions (normalized ADC).
• Chronic lesions can be differentiated from acute lesions by normalization of ADC and DWI.

65 year male- acute Rt ACA Infarct

Gradient echo (GRE)
• In a GRE sequence, a RF pulse is applied that partly flips
the NMV into the transverse plane (variable flip angle).
• Gradients, as opposed to RF pulses, are used to dephase
(negative gradient) and rephase (positive gradients)
transverse magnetization.
• These gradients do not refocus field inhomogeneities.

• This feature of GRE sequences is exploited- in detection of hemorrhage, as the iron in Hb becomes magnetized locally (produces its own local magnetic field) and thus dephases the spinning nuclei.
• The main clinical application of GRE sequence is detection of hemorrhage, micro bleeds, iron deposition and calcification.

GREFLAIR
Hemorrhage in right parietal lobe

Approaching , MRI FILM• Image Delineation
for normal anatomy –preferred scan is T1W
for any pathology Preferred scan is T2W T1W
Usual Order: Axial> Sagittal>Coronal.• Skull
• Soft tissue• Diploic Spaces
• Ventricles, cisterns & sulci• Size: Hydrocephalus• Shape: Mass Effect• Symmetry.
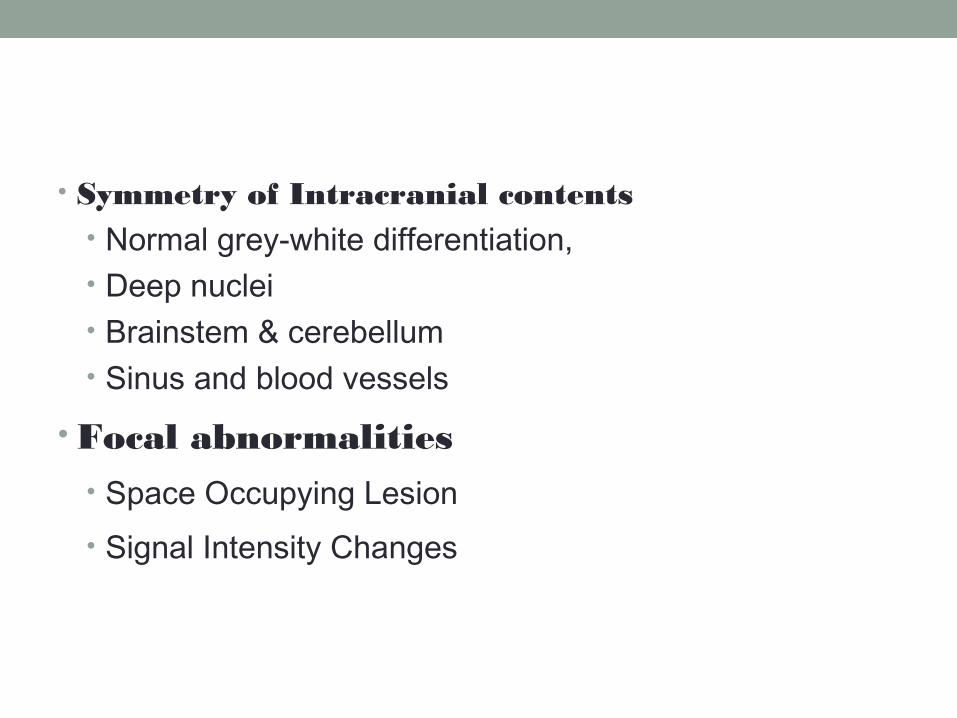
• Symmetry of Intracranial contents• Normal grey-white differentiation, • Deep nuclei• Brainstem & cerebellum • Sinus and blood vessels
• Focal abnormalities• Space Occupying Lesion• Signal Intensity Changes

NORMAL RADIOLOGICAL ANATOMY ON MRI
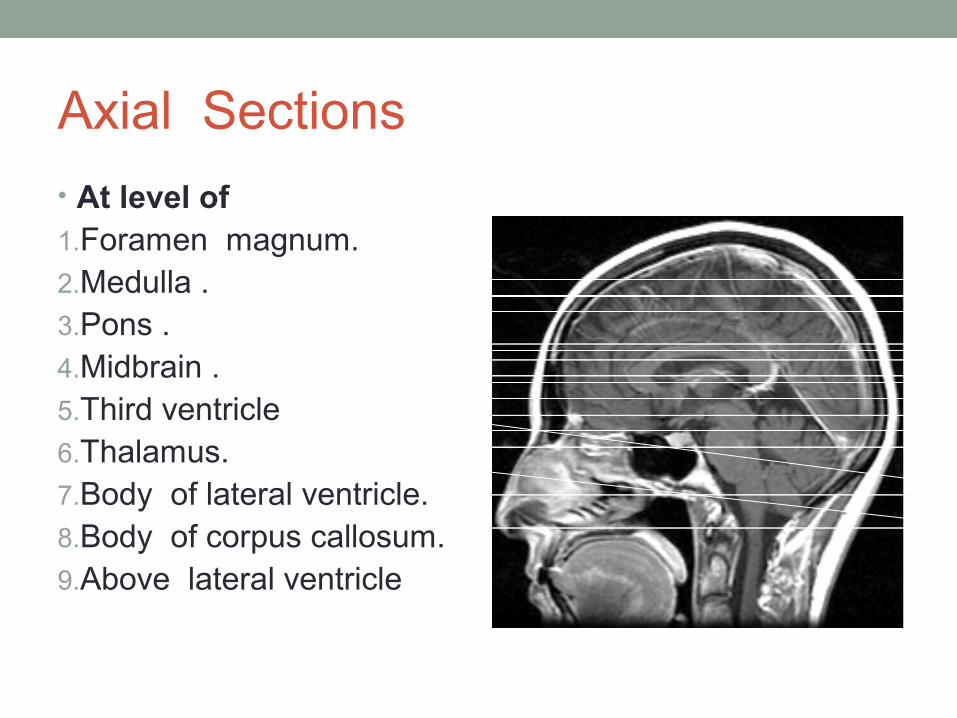
Axial Sections
• At level of 1.Foramen magnum.2.Medulla .3.Pons .4.Midbrain . 5.Third ventricle6.Thalamus.7.Body of lateral ventricle.8.Body of corpus callosum.9.Above lateral ventricle

1
2
3
4
5
Axial T1 Weighted M.R.I. Section at the level of Foramen
Magnum
1. Cisterna Magna2. Cervical Cord3. Nasopharynx4. Mandible5. Maxillary Sinus

At the level of caudal medulla
Maxillary sinus
Flow void of vertebral A.
Medulla oblongata
cerebellum

At the level of rostral medulla
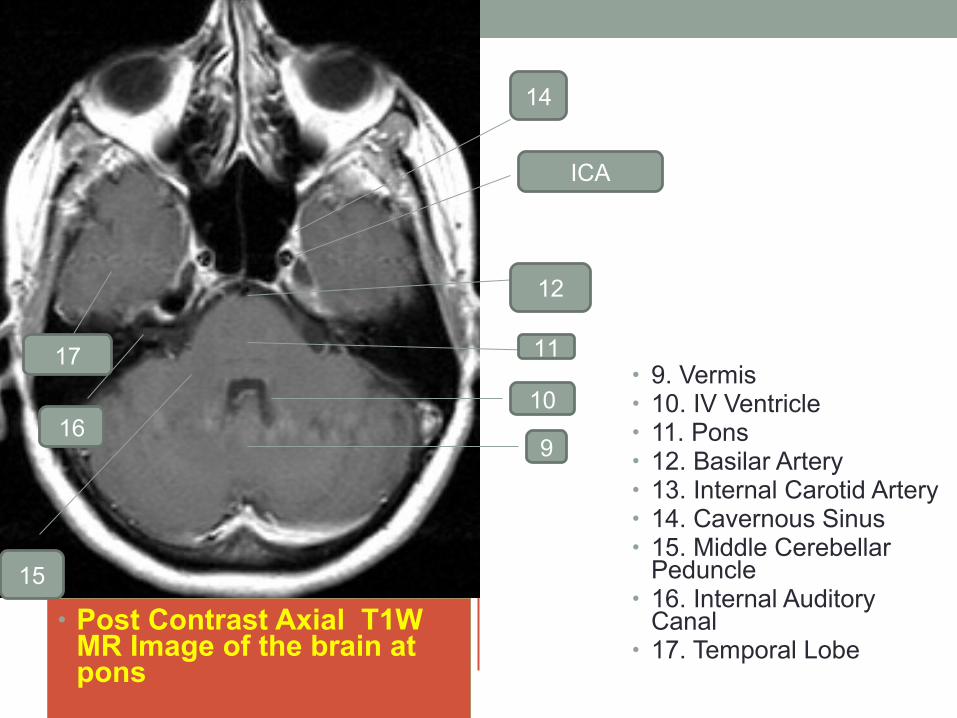
• Post Contrast Axial T1W MR Image of the brain at pons
• 9. Vermis• 10. IV Ventricle• 11. Pons• 12. Basilar Artery• 13. Internal Carotid Artery• 14. Cavernous Sinus• 15. Middle Cerebellar
Peduncle• 16. Internal Auditory
Canal• 17. Temporal Lobe
9
ICA
10
11
12
14
15
16
17

At the level of upper pons

Fig. 1.4 Post Contrast Axial T1W MR Image of the brainAT THE LEVEL OF MID BRAIN
18
19
20
21
22
12 SUP CEREBELLAR CISTERN13 QUADRIGEMINAL CISTERN14 PERIMESENCEPHALIC CIST15 SUPRACELLAR CISTERN16 OPTIC CHIASMA17 INFUNDIBULUM18. Aqueduct of Sylvius19. Midbrain20. Orbits21. Posterior Cerebral Artery22. Middle Cerebral Artery
17
16
15
12
13
14

At the level of mid brain

Post Contrast Axial MR Image of the brainSection at the level of third ventricle
TL
FL
OL
Sylvian Fissure
Temporal horn
Sup cerebellar cistern
Insular cortex
Third ventricle

At the level of thalamus
3
2
1
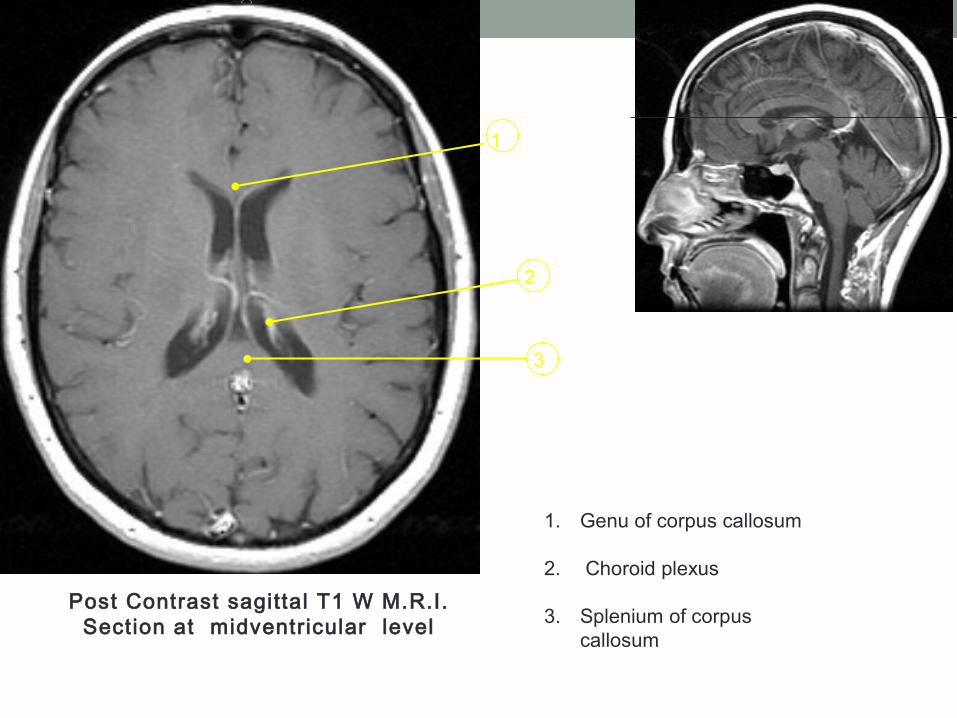
Post Contrast sagittal T1 W M.R.I.Section at midventricular level
1. Genu of corpus callosum
2. Choroid plexus
3. Splenium of corpus callosum

At the level of body of corpus callosum

1
2
Post Contrast sagittal T1 Wtd M.R.I.
Section above the Corpus Callosum
1.Parietal Lobe
2. Frontal Lobe

Coronal sections of brain At the level of-
1. Frontal horns.
2. Third ventricle.
3. Mid-ventricular level.
4. Occipital horn level
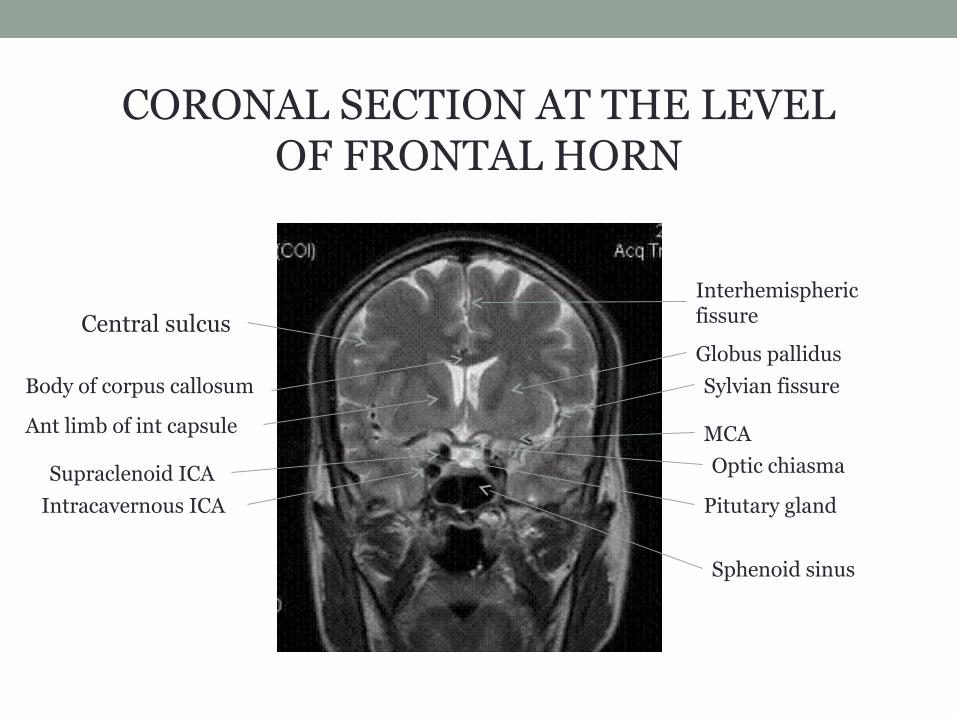
CORONAL SECTION AT THE LEVEL OF FRONTAL HORN
Intracavernous ICA
Supraclenoid ICA
Pitutary gland
Optic chiasma
Sylvian fissureBody of corpus callosum
Central sulcus
Interhemispheric fissure
Globus pallidus
Ant limb of int capsule MCA
Sphenoid sinus


CORONAL SECTION AT MID VENTRICULER LEVEL
Lat ventricle
Sup cerebellar cistern
Syl fissure
Cingulate sulcus
pons
medullacerebellum
splenium
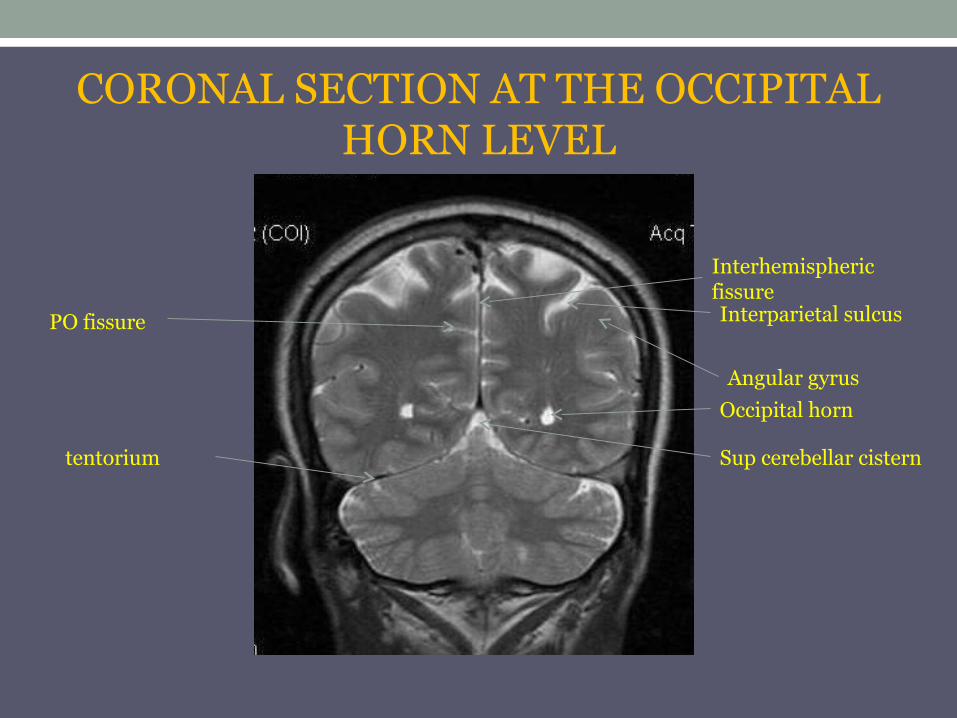
CORONAL SECTION AT THE OCCIPITAL HORN LEVEL
Occipital horn
Sup cerebellar cistern
PO fissure Interparietal sulcus
tentorium
Interhemispheric fissure
Angular gyrus
Sagittal sections
• At the level –
1.Midsagittal
2.Internal capsule
3.Parasagittal
4.Lateral orbital

Sagittal section at mid sagittal level
pons
medulla
4th ventricle
thalamus
3rd ventricle
Corpus callosum
Sup cerebellar cistern
Cisterna magna
Prepontine cistern
Interpeduncular fossa
Supracellar cistern
Genu of CCCingulate gyrus

cerebral peduncle
head of caudate
middle cerebellar peduncle
tentorium cerebelli
Sagittal section at internal capsule level
parieto occipital sulcus
Internal capsule
cerebellum
amygdala

Central sulcus
Lat ventricle
Temporal lobe
Sylvian fissure
At Parasagittal section
Supramarginal gyrus
Angular gyrus

Central sulcus
Syl fissure
TL
Supramarg gyrus
Angular gyrus
Lat occipital gyr
Sagittal section at lateral orbital level
Sup tem gyrus
cerebellum

Contrast agents• Principles of contrast uptake are same in CT and MRI i.e.
enhancement of CNS pathology due to disruption of blood brain barrier
• Unlike contrast agents used in CT which are directly visualized those used in MRI produce local alteration in the magnetic environment that influences the MRI signal intensity.
• It is the effect of proton relaxation that appears on MRI and not the contrast itself

• Gadolinium is a paramagnetic agent responsible for T1 shortening of MR images
• Shortening of T1 leads to higher signal intensity on a T1WI hence areas of gad accumulation appear bright on T1
• Though it also shortens T2, effect is less as compared to T1
• Standard dose of Gad is 0.1 mmol/kg

Normal contrast enhancing structures on MRI brain • Pitutary stalk
• Median eminence
• Dural sinuses and cortial veins
• choroid plexus

Advantages of MRI• No ionizing radiation & no short/long-term effects
demonstrated • Variable thickness, any plane• Better contrast resolution & tissue discrimination• Various sequences to play with to characterize the
abnormal tissue• Many details without I.V contrast• No allergy ( as with Iodine)• Can be used in renal impairment• Pregnancy is not a contraindication

Caveats of MR imaging• Very sensitive to body movements• Produces lots of noise during examination (The noise is
due to the rising electrical current in the wires of the gradient magnets being opposed by the main magnetic field. The stronger the main field, the louder the gradient noise)
• Time taking• Difficult to perform in claustrophobic pts• Expensive • Less sensitive for SAH• Less sensitive for detection of calcification• Relatively insensitive to bony cortical abnormalities• Peoples with metallic implants can not be scanned

THANK YOU

Q&A

The MRI sequence most suitable for viewing Microbleeds is ?A. DWI
B. ADC
C. GRE
D. FLAIR

The MRI Sequence most suitable for commenting upon periventricular lesion isA. DWI
B. GRE
C. FLAIR
D. ADC

SHORT TR+SHORT TE WILL RESULT INA. T1 W
B. T2 W
C. FLAIR
D. PROTON DENSITY IMAGE

T1 image is suitable for all of the following exceptA. Normal anatomy
B. Subacute hemorrhage
C. Chronic hemorrhage
D. Fat containing structure.

The structure marked by arrow is?
A. Optic chiasm
B. Optic radiation
C. Optic tract
D. Mamillary body

The structure marked by arrow is?
A. MCA
B. ACA
C. ICA
D. PCA

The structure marked by the arrow is?
A. Optic chiasm
B. Pitutary gland
C. Infundibulum
D. Cavernous sinus

The structure marked by the arrow is?
A. Sup cerebellar peduncle
B. Middle cp
C. Inferior CP
D. none

The structure marked by the arrow is?
A. Pineal gland
B. Thalamus
C. Midbrain
D. Corpus callosum