ms3d-gridded surfaces to gsm-200201
TRANSCRIPT
7 January 2002
MineSight® Foregroundin the
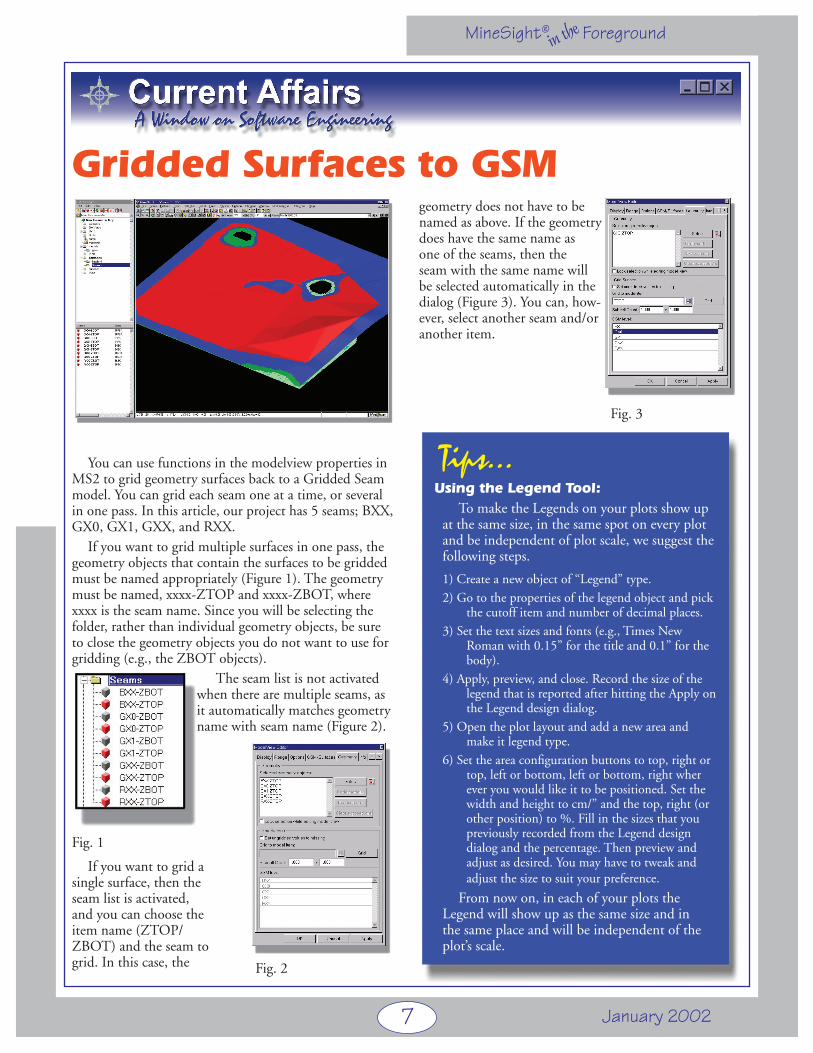
You can use functions in the modelview properties in MS2 to grid geometry surfaces back to a Gridded Seam model. You can grid each seam one at a time, or several in one pass. In this article, our project has 5 seams; BXX, GX0, GX1, GXX, and RXX.
If you want to grid multiple surfaces in one pass, the geometry objects that contain the surfaces to be gridded must be named appropriately (Figure 1). The geometry must be named, xxxx-ZTOP and xxxx-ZBOT, where xxxx is the seam name. Since you will be selecting the folder, rather than individual geometry objects, be sure to close the geometry objects you do not want to use for gridding (e.g., the ZBOT objects).
The seam list is not activated when there are multiple seams, as it automatically matches geometry name with seam name (Figure 2).
Fig. 1
If you want to grid a single surface, then the seam list is activated, and you can choose the item name (ZTOP/ZBOT) and the seam to grid. In this case, the
geometry does not have to be named as above. If the geometry does have the same name as one of the seams, then the seam with the same name will be selected automatically in the dialog (Figure 3). You can, how-ever, select another seam and/or another item.
Fig. 3
Gridded Surfaces to GSM
Fig. 2
Using the Legend Tool:To make the Legends on your plots show up
at the same size, in the same spot on every plot and be independent of plot scale, we suggest the following steps.
1) Create a new object of “Legend” type.2) Go to the properties of the legend object and pick the cutoff item and number of decimal places.3) Set the text sizes and fonts (e.g., Times New Roman with 0.15” for the title and 0.1” for the body).4) Apply, preview, and close. Record the size of the legend that is reported after hitting the Apply on the Legend design dialog.5) Open the plot layout and add a new area and make it legend type.6) Set the area configuration buttons to top, right or top, left or bottom, left or bottom, right wher ever you would like it to be positioned. Set the width and height to cm/” and the top, right (or other position) to %. Fill in the sizes that you previously recorded from the Legend design dialog and the percentage. Then preview and adjust as desired. You may have to tweak and adjust the size to suit your preference.
From now on, in each of your plots the Legend will show up as the same size and in the same place and will be independent of the plot’s scale.
Tips...