msc conservation 2008 remote sensing module: lecture 1
DESCRIPTION
MSc Conservation 2008 Remote sensing module: lecture 1. Dr. Mathias (Mat) Disney UCL Geography Office: 113, 1 st Floor, Pearson Building Tel: 7670 0592 (x30592) Email: [email protected] www.geog.ucl.ac.uk/~mdisney. Module structure. Day 1 AM Lecture: Introduction - PowerPoint PPT PresentationTRANSCRIPT
MSc Conservation 2008
Remote sensing module: lecture 1
Dr. Mathias (Mat) Disney
UCL Geography
Office: 113, 1st Floor, Pearson Building
Tel: 7670 0592 (x30592)
Email: [email protected]
www.geog.ucl.ac.uk/~mdisney
2
• Day 1– AM Lecture: Introduction– PM Practical I: Introduction session in basement UNIX lab (PB 110)
• Day 2– AM Practical I continued.– PM Lecture: Spatial, spectral and temporal information
• Day 3– AM Practical II: Spatial information.– PM Self-directed research: reading, consolidation of practical work.
• Day 4– AM Lecture: Thematic information extraction and accuracy analysis– PM Practical III: Classification
• Day 5– AM Practical III continued & preparation for presentations– PM Presentations of practical III results and analysis
Module structure
3
• Lecture 1– General introduction to remote sensing (RS)/Earth Observation
(EO).......– Definitions, concepts and terms + remote sensing process,
end-to-end
• Lecture 2 (Tues PM)– Information from EO data (spatial & spectral in particular, but
also temporal, angular etc.)
• Lecture 3– Thematic information extraction: classification
• NB access for PB10 UNIX lab 9-5 only
Lecture outline
4
Reading and browsingCampbell, J. B. (2002) Introduction to Remote Sensing (3rd ed.),
London:Taylor and Francis.Jensen, J. R. (2000) Remote Sensing of the Environment: An Earth
Resource Perspective, 2000, Prentice Hall, New Jersey. (Excellent on RS but no image processing).
Jensen, J. R. (2005, 3rd ed.) Introductory Digital Image Processing, Prentice Hall, New Jersey. (Companion to above) BUT mostly available online at http://www.cla.sc.edu/geog/rslab/751/index.html
Lillesand, T. M., Kiefer, R. W. and Chipman, J. W. (2004, 5th ed.) Remote Sensing and Image Interpretation, John Wiley, New York.
Mather, P. M. (1999) Computer Processing of Remotely‑sensed Images, 2nd Edition. John Wiley and Sons, Chichester.
W.G. Rees, 1996. "Physical Principles of Remote Sensing", Cambridge Univ. Press
5
Tutorials• http://rst.gsfc.nasa.gov/• http://www.research.umbc.edu/~tbenja1/umbc7/• http://earth.esa.int/applications/data_util/SARDOCS/spaceborne/Radar_Courses/• http://www.crisp.nus.edu.sg/~research/tutorial/image.htm• http://www.ccrs.nrcan.gc.ca/resource/tutor/fundam/index_e.php• http://octopus.gma.org/surfing/satellites/index.htmlGlossary:• http://www.ccrs.nrcan.gc.ca/glossary/index_e.phpOther resources and data sources• ICEDS at GE @ UCL: http://iceds.ge.ucl.ac.uk/• NASA www.nasa.gov• NASA Visible Earth (source of data): http://visibleearth.nasa.gov/• European Space Agency earth.esa.int• NOAA www.noaa.gov• Remote sensing and Photogrammetry Society UK www.rspsoc.org• IKONOS: http://www.spaceimaging.com/• QuickBird: http://www.digitalglobe.com/• http://rsd.gsfc.nasa.gov/rsd/RemoteSensing.html• Distributed Active Archive Centre: http://edcdaac.usgs.gov/dataproducts.asp• USGS (Landsat data): http://edcimswww.cr.usgs.gov/pub/imswelcome/
Web resources
6
• Remote Sensing of Environment (via Science Direct from within UCL): http://www.sciencedirect.com/science?_ob=JournalURL&_cdi=5824&_auth=y&_acct=C000010182&_version=1&_urlVersion=0&_userid=125795&md5=5a4f9b8f79baba2ae1896ddabe172179
• International Journal of Remote Sensing: http://www.tandf.co.uk/journals/titles/01431161.asp
• IEEE Transactions on Geoscience and Remote Sensing: http://ieeexplore.ieee.org/xpl/RecentIssue.jsp?puNumber=36
• Some introductory articles on conservation applications:– http://www.geog.ucl.ac.uk/~mdisney/teaching/msc_cons/papers
Journals
7
• Remote Sensing and Photogrammetry Society– http://www.rspsoc.org/ – £19 for students + get 1 yr IJRS for £55 and/or RSE for €79
• NERC EO Centres of Excellence– involvement in 3 out of 6 at UCL
– COMET (Centre for the Observation and Modelling of Earthquakes & Tectonics) @ GE http://comet.nerc.ac.uk/
– CPOM (Centre for Polar Observation and Modelling) @ Space and Climate Physics & MSSL http://www.cpom.org/
– CTCD (Centre for Terrestrial Carbon Dynamics) @ Geography http://ctcd.nerc.ac.uk
Miscellaneous
8
The Experts say "Remote Sensing is...”• ...techniques for collecting image or other forms of data about
an object from measurements made at a distance from the object, and the processing and analysis of the data (RESORS, CCRS).
• ”...the science (and to some extent, art) of acquiring information about the Earth's surface without actually being in contact with it. This is done by sensing and recording reflected or emitted energy and processing, analyzing, and applying that information.”
What is remote sensing?
9
The not so experts say "Remote Sensing is...”• Advanced colouring-in.• Seeing what can't be seen, then convincing someone that you're
right.• Being as far away from your object of study as possible and
getting the computer to handle the numbers.• Legitimised voyeurism….
What is remote sensing (II)?
10
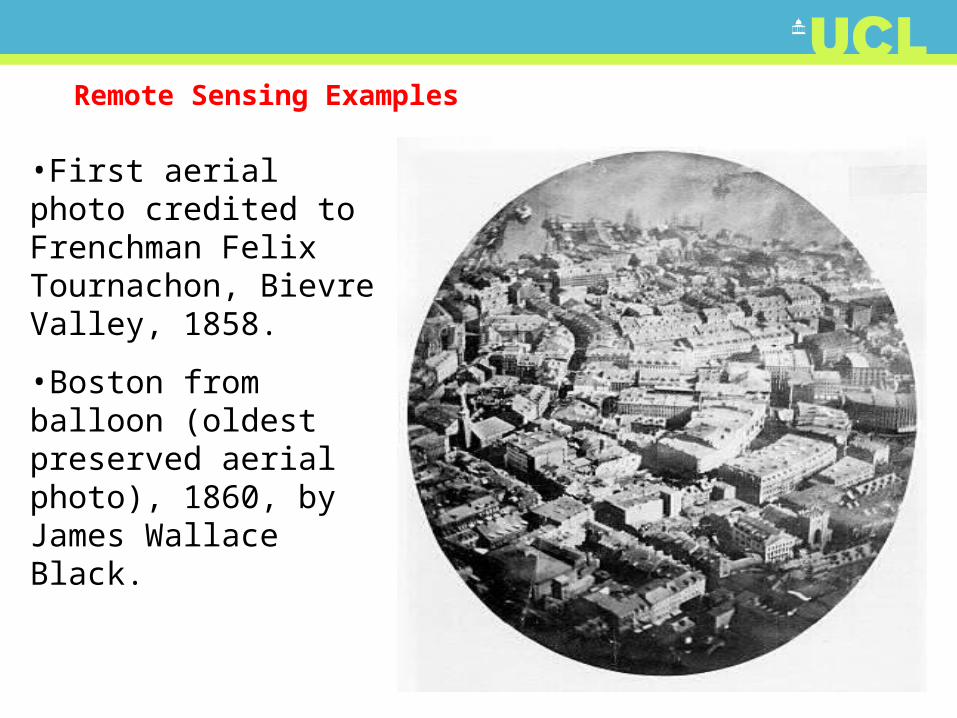
Remote Sensing Examples
•First aerial photo credited to Frenchman Felix Tournachon, Bievre Valley, 1858.
•Boston from balloon (oldest preserved aerial photo), 1860, by James Wallace Black.
11
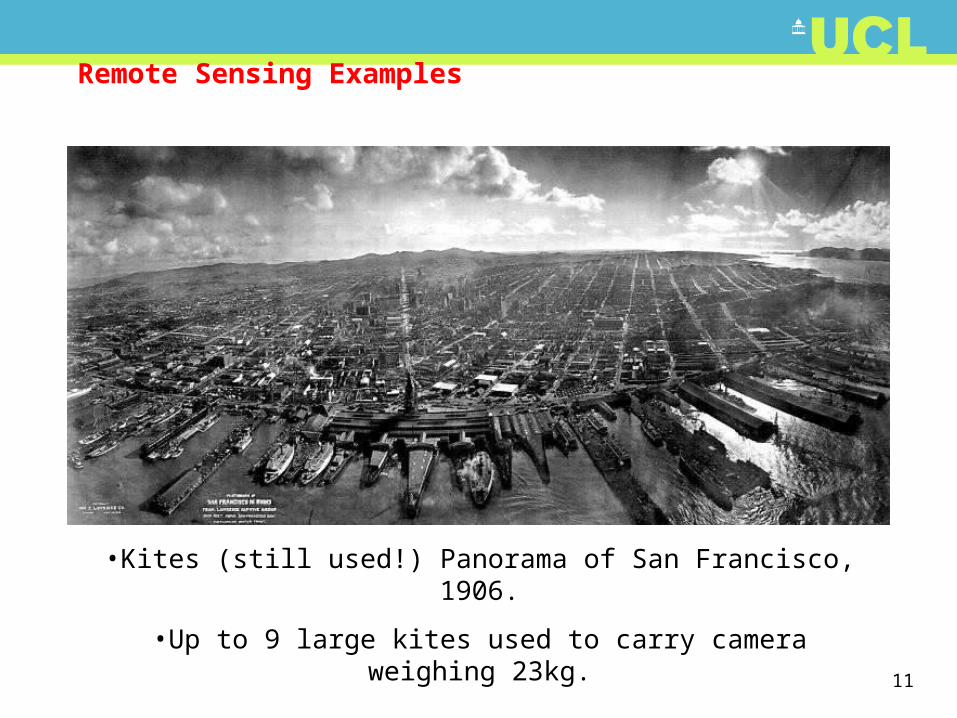
Remote Sensing Examples
•Kites (still used!) Panorama of San Francisco, 1906.
•Up to 9 large kites used to carry camera weighing 23kg.
12
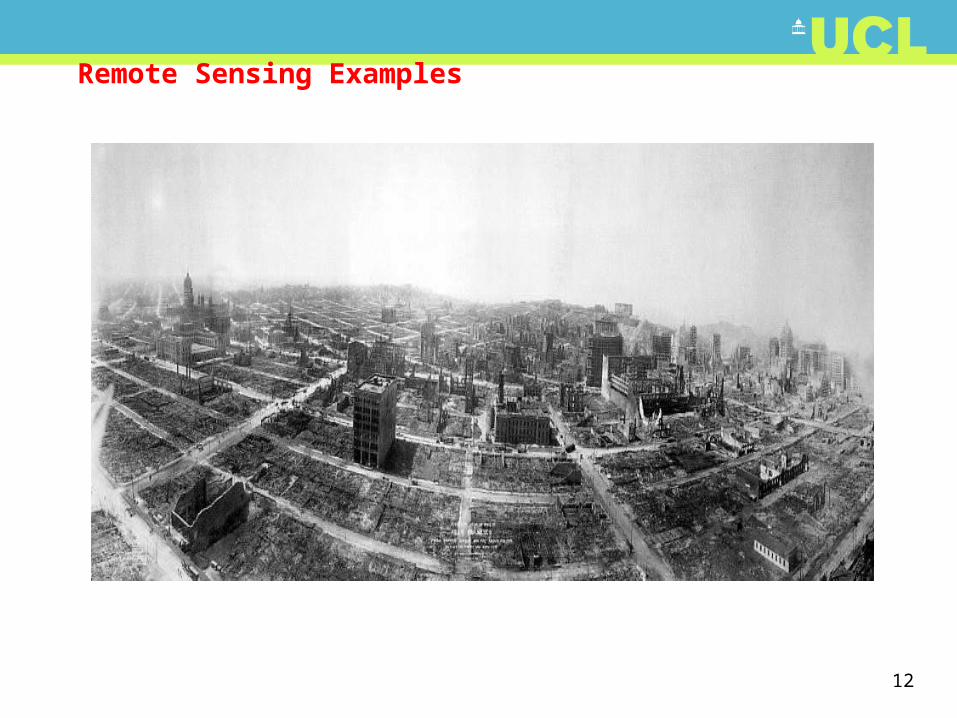
Remote Sensing Examples
13
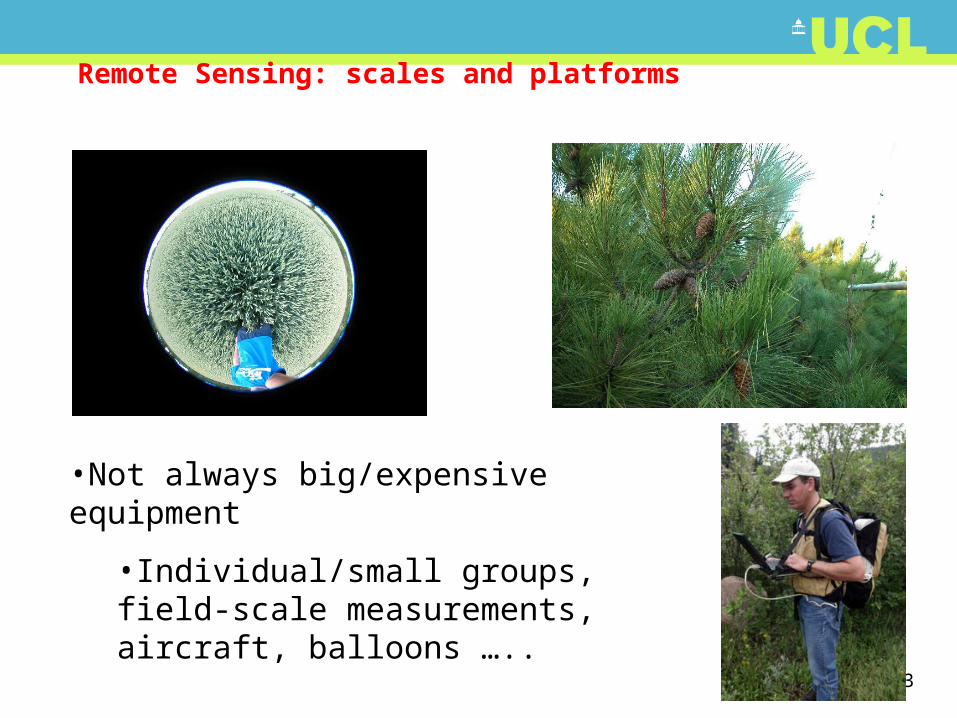
Remote Sensing: scales and platforms
•Not always big/expensive equipment
•Individual/small groups, field-scale measurements, aircraft, balloons …..
14
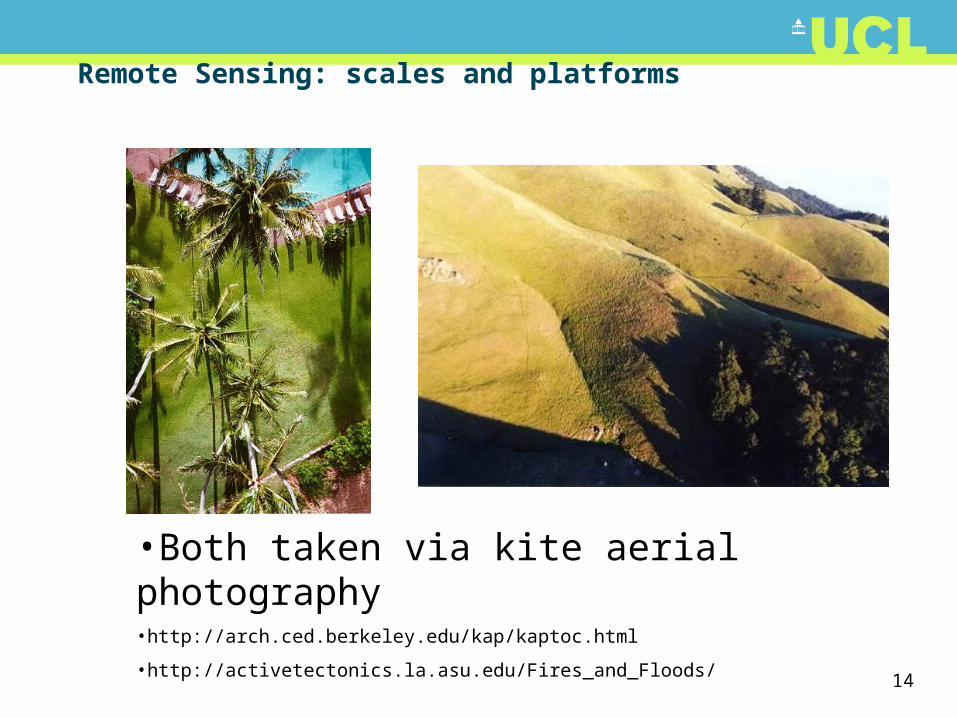
Remote Sensing: scales and platforms
•Both taken via kite aerial photography•http://arch.ced.berkeley.edu/kap/kaptoc.html
•http://activetectonics.la.asu.edu/Fires_and_Floods/
15
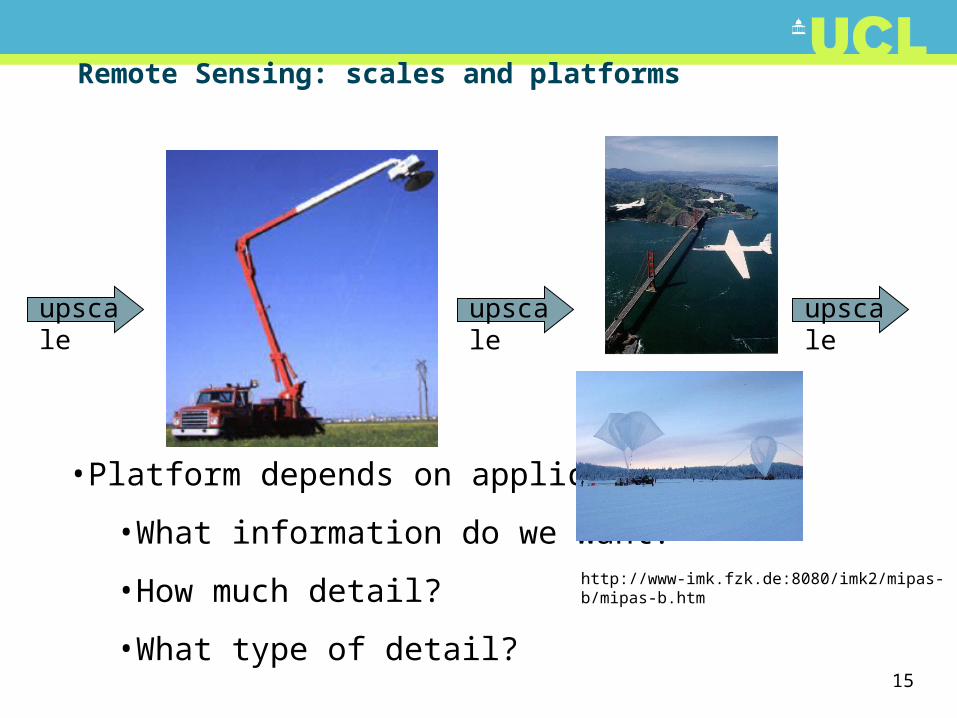
Remote Sensing: scales and platforms
•Platform depends on application
•What information do we want?
•How much detail?
•What type of detail?
upscale
http://www-imk.fzk.de:8080/imk2/mipas-b/mipas-b.htm
upscale upscale
16
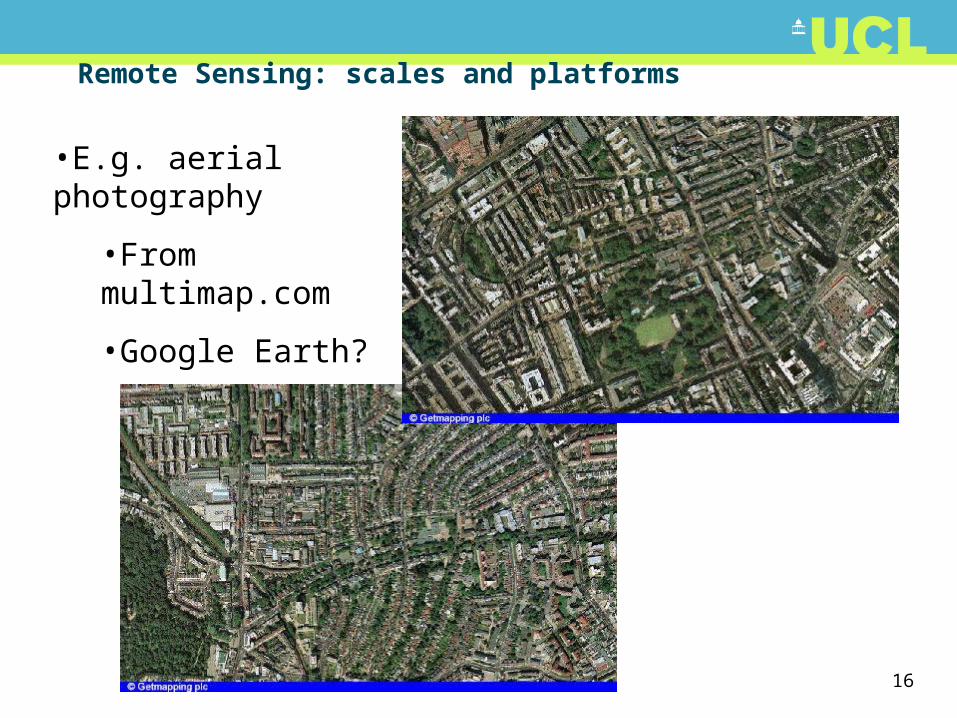
Remote Sensing: scales and platforms
•E.g. aerial photography
•From multimap.com
•Google Earth?
17
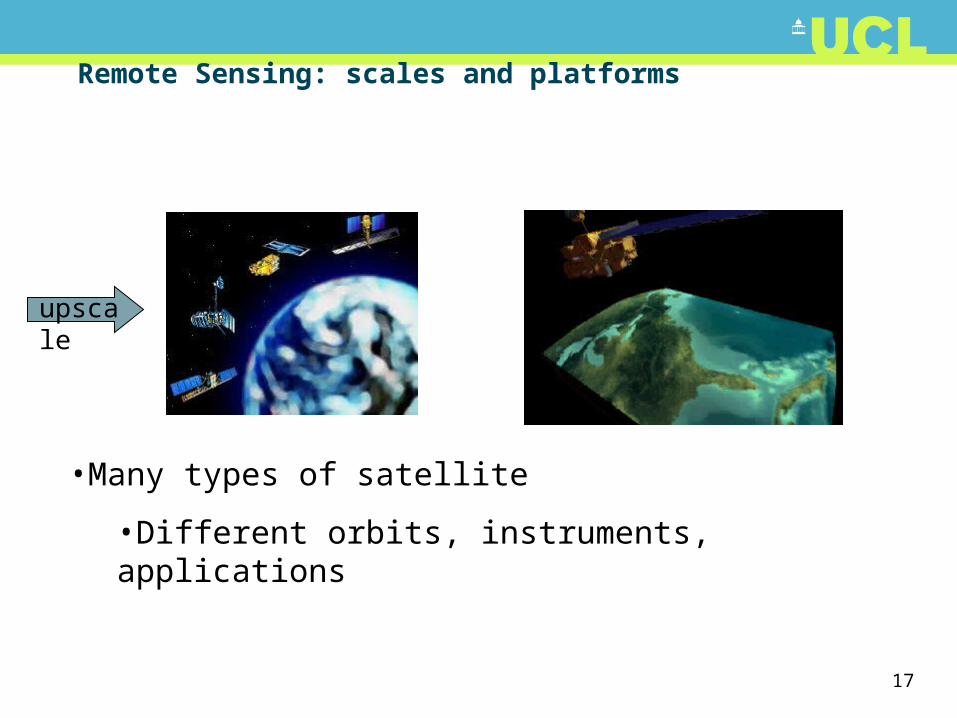
Remote Sensing: scales and platforms
•Many types of satellite
•Different orbits, instruments, applications
upscale
18
Remote sensing applications
•Environmental: climate, ecosystem & habitat mapping, land cover change, hazard mapping and monitoring, vegetation, carbon cycle, oceans, ice ….
•Commercial: telecomms, agriculture, geology and petroleum, mapping
•Military: reconnaissance, mapping, navigation (GPS)
•Weather monitoring and prediction…..
19
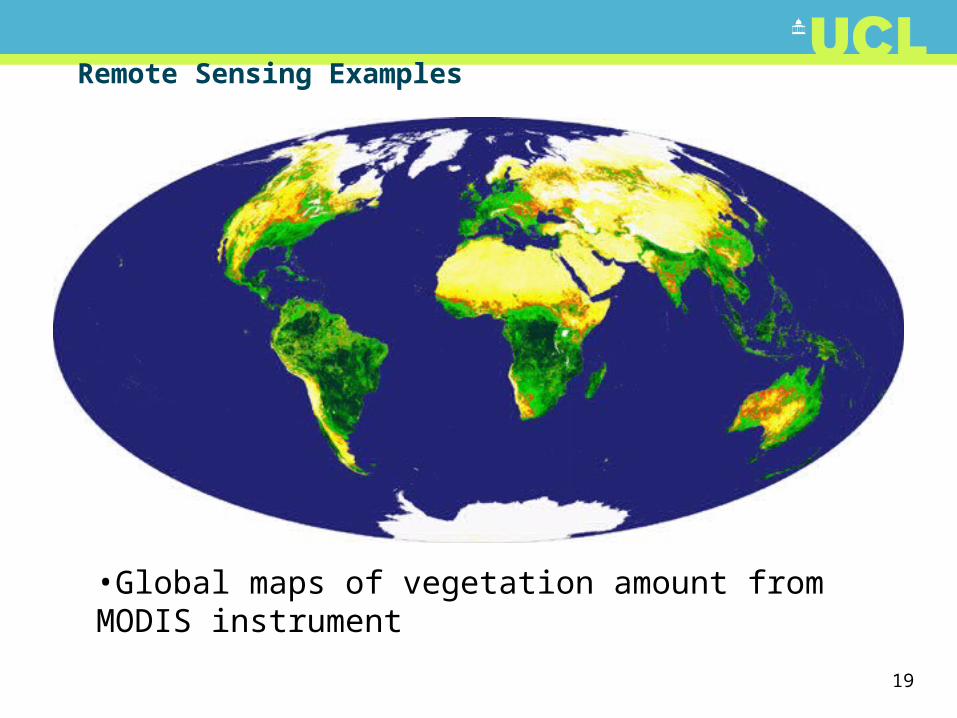
Remote Sensing Examples
•Global maps of vegetation amount from MODIS instrument
20
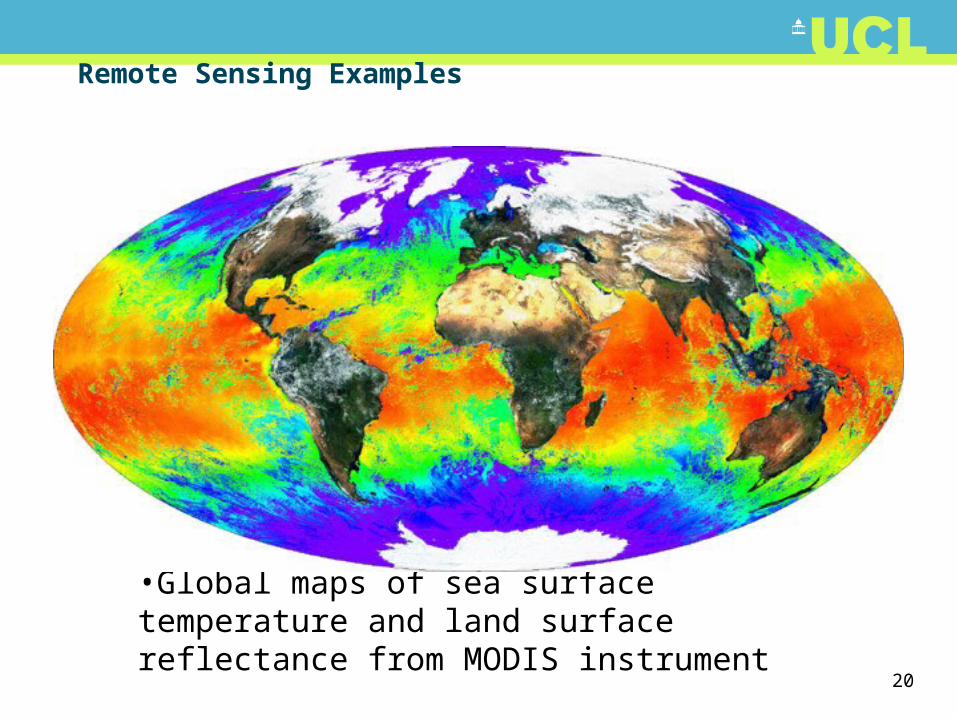
Remote Sensing Examples
•Global maps of sea surface temperature and land surface reflectance from MODIS instrument
21
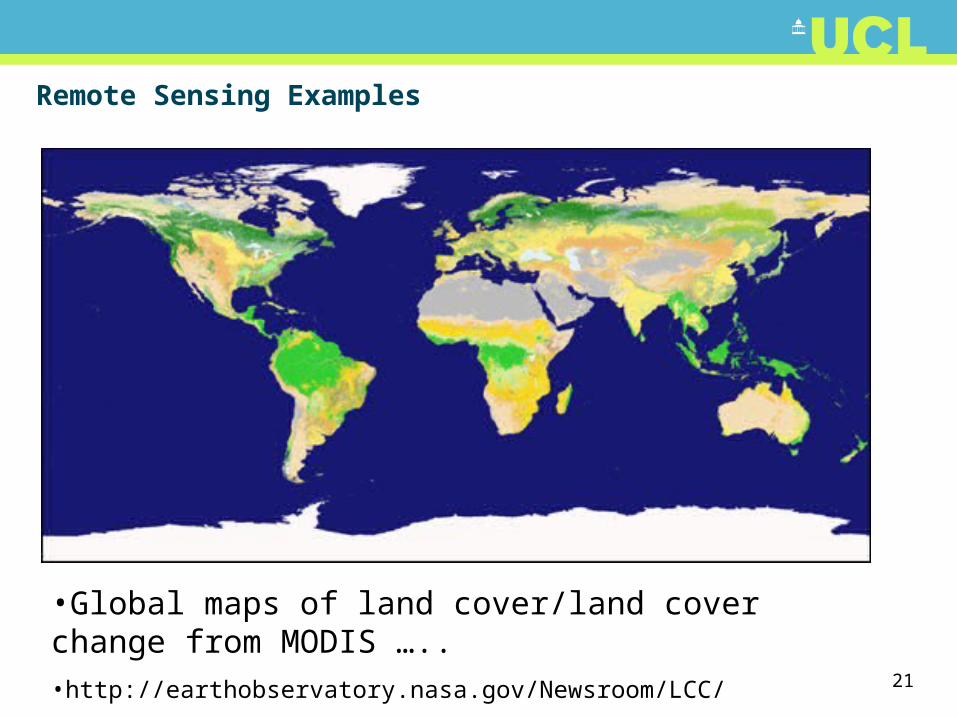
Remote Sensing Examples
•Global maps of land cover/land cover change from MODIS …..•http://earthobservatory.nasa.gov/Newsroom/LCC/
22
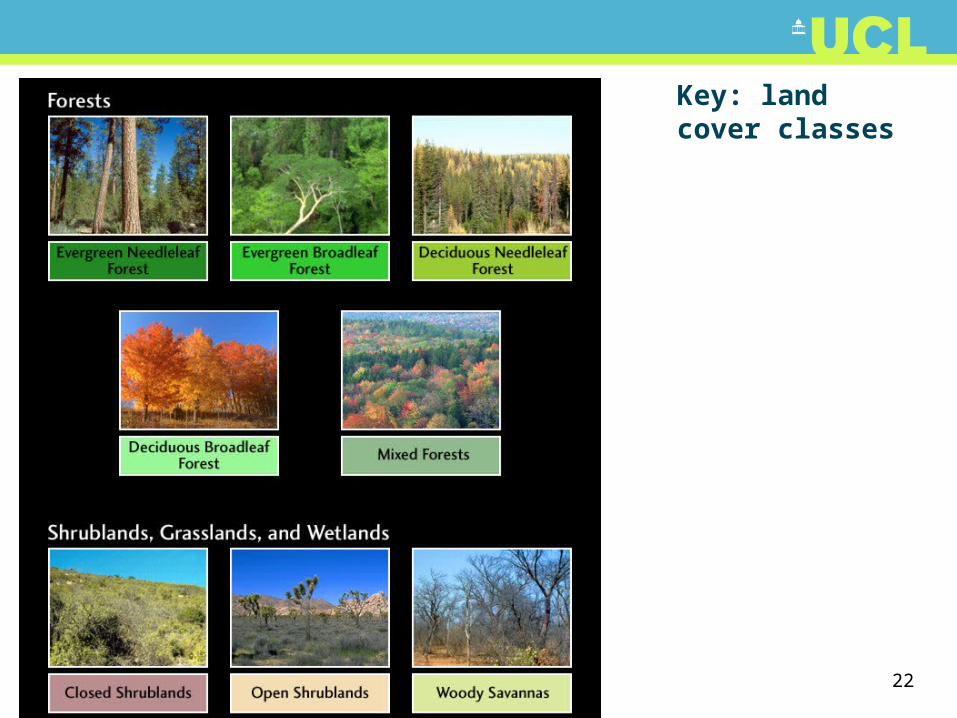
Key: land cover classes
23
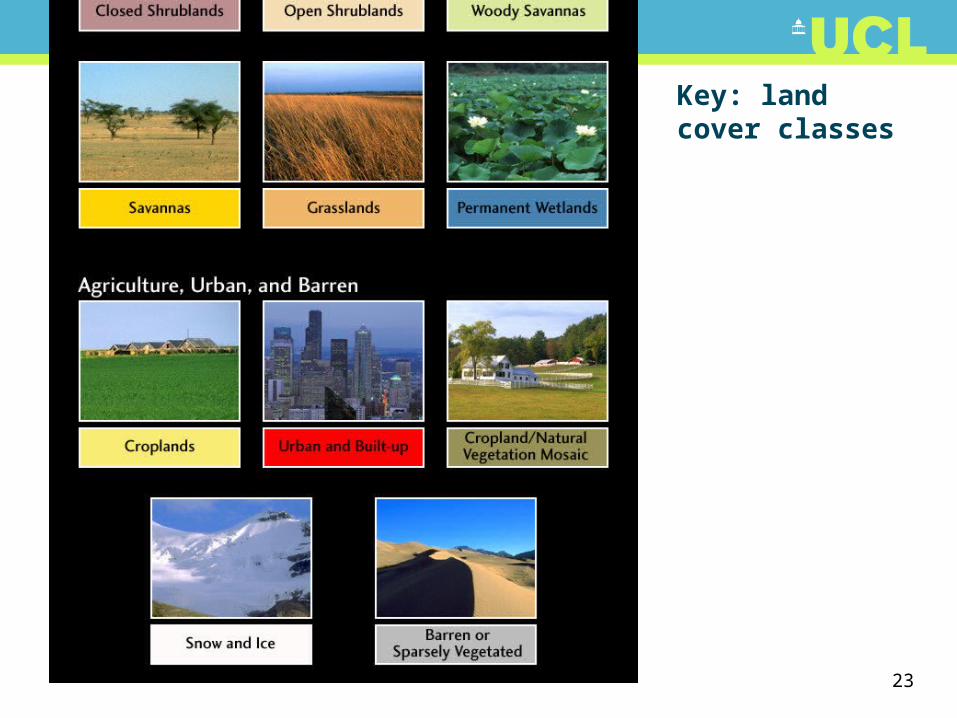
Key: land cover classes
24
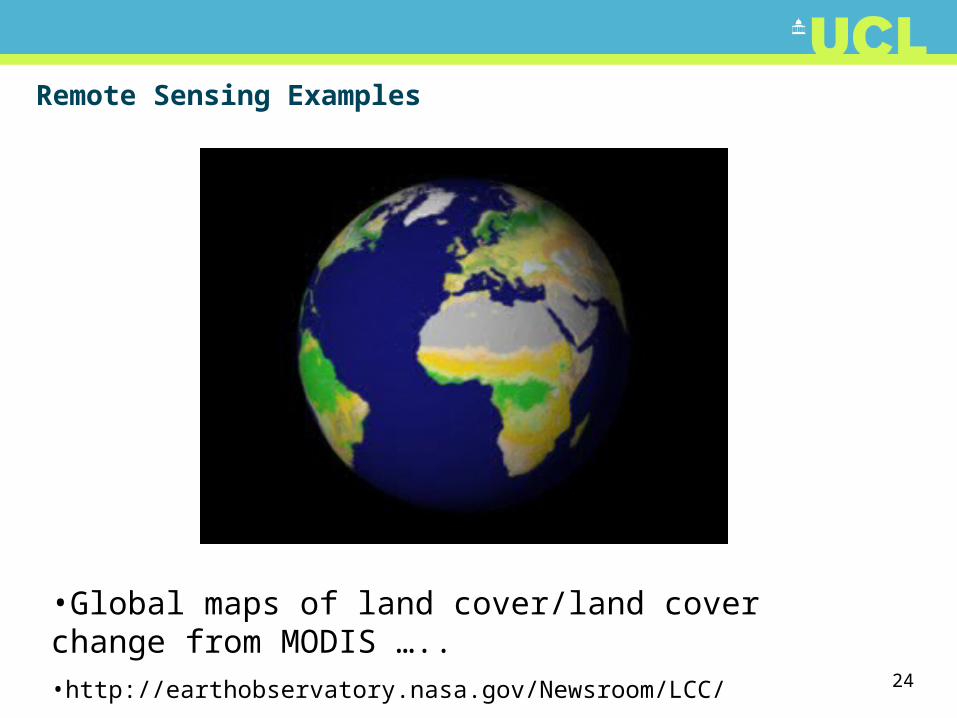
Remote Sensing Examples
•Global maps of land cover/land cover change from MODIS …..•http://earthobservatory.nasa.gov/Newsroom/LCC/
25
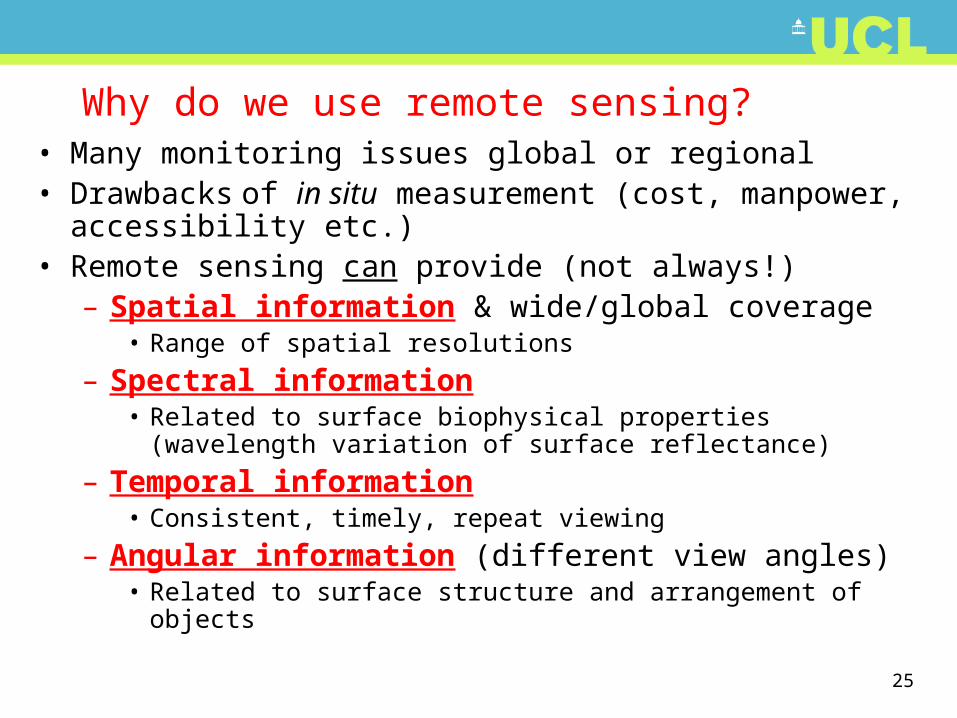
Why do we use remote sensing?• Many monitoring issues global or regional• Drawbacks of in situ measurement (cost, manpower,
accessibility etc.)• Remote sensing can provide (not always!)
– Spatial information & wide/global coverage• Range of spatial resolutions
– Spectral information• Related to surface biophysical properties (wavelength variation
of surface reflectance)
– Temporal information• Consistent, timely, repeat viewing
– Angular information (different view angles)• Related to surface structure and arrangement of objects
26
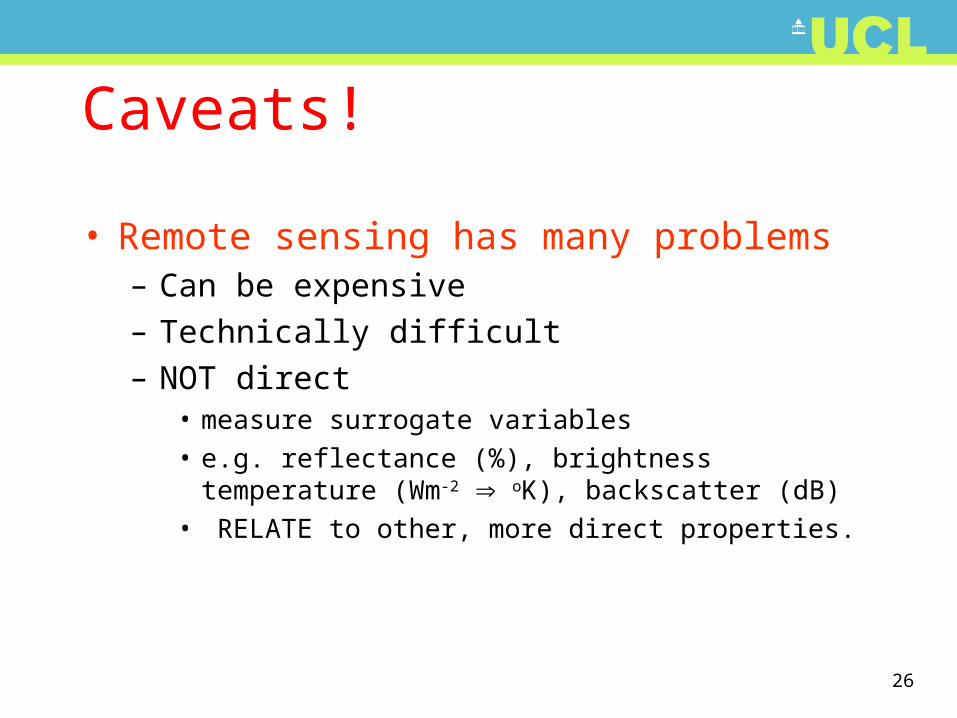
Caveats!
• Remote sensing has many problems– Can be expensive– Technically difficult– NOT direct
• measure surrogate variables• e.g. reflectance (%), brightness temperature (Wm-2
oK), backscatter (dB)• RELATE to other, more direct properties.
27
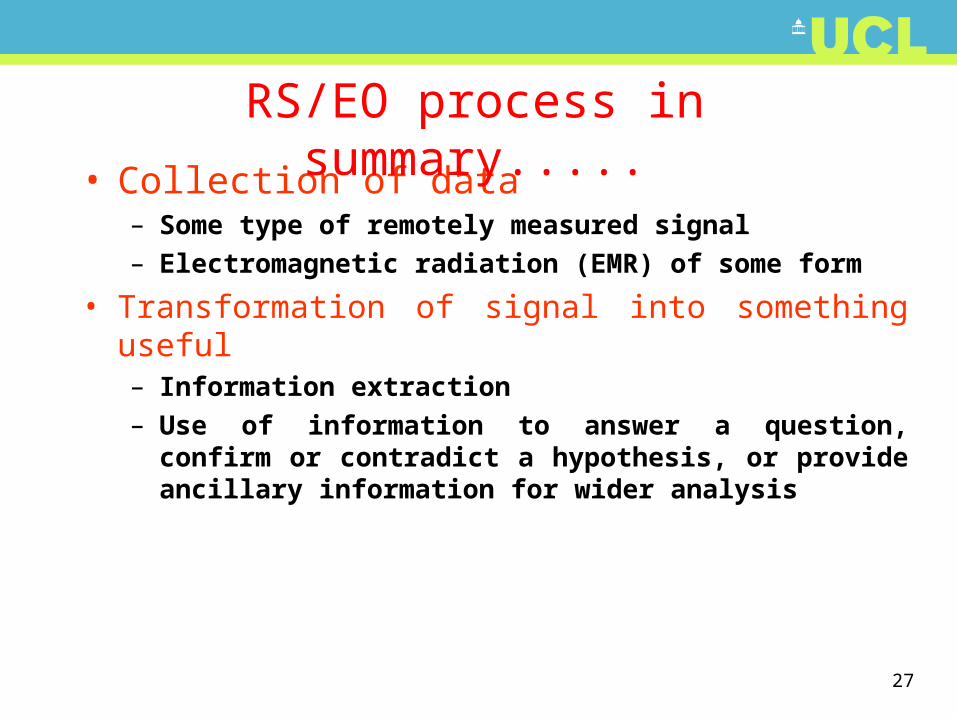
• Collection of data– Some type of remotely measured signal– Electromagnetic radiation (EMR) of some form
• Transformation of signal into something useful– Information extraction– Use of information to answer a question, confirm or
contradict a hypothesis, or provide ancillary information for wider analysis
RS/EO process in summary.....
28
A Remote Sensing System• Energy source
• platform
• sensor
• data recording / transmission
• ground receiving station
• data processing
• expert interpretation / data users
29
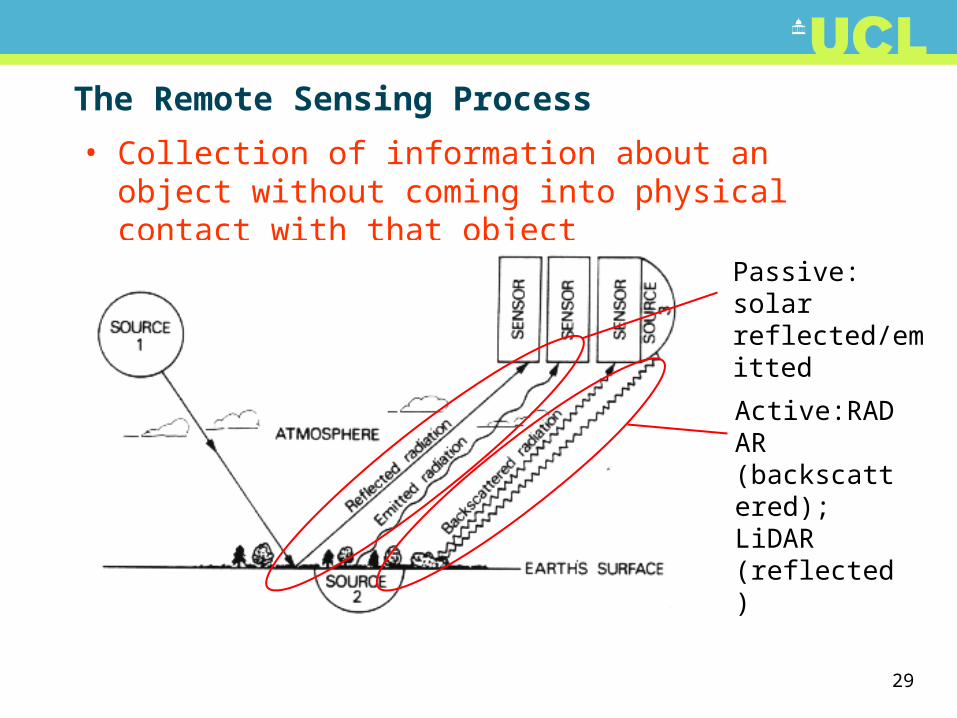
The Remote Sensing Process
• Collection of information about an object without coming into physical contact with that object
Passive: solar reflected/emitted
Active:RADAR (backscattered); LiDAR (reflected)
30
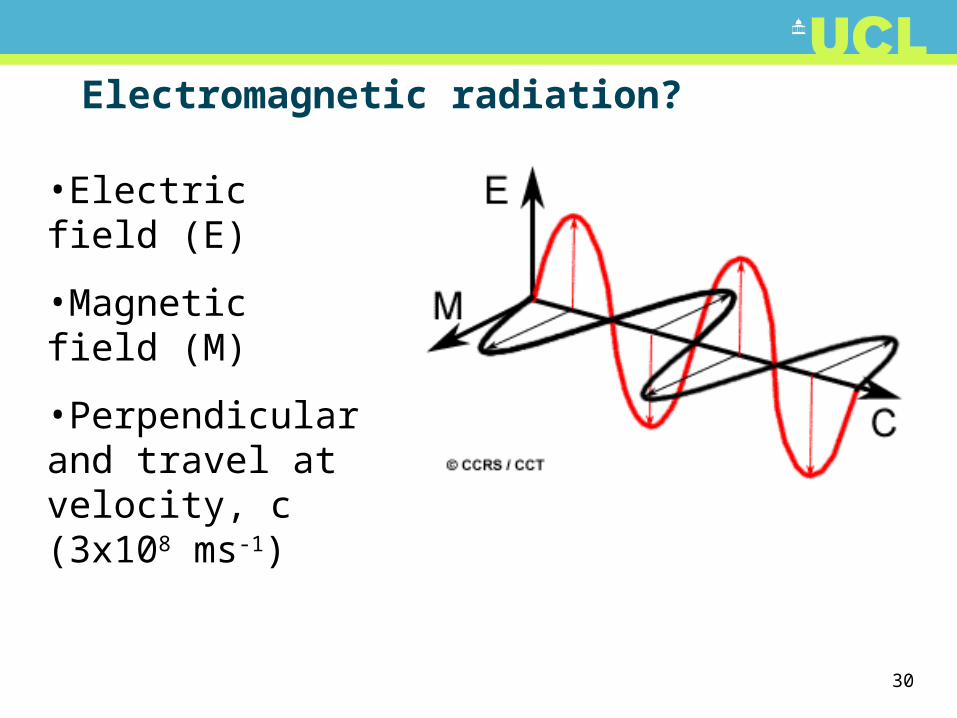
Electromagnetic radiation?
•Electric field (E)
•Magnetic field (M)
•Perpendicular and travel at velocity, c (3x10⁸ ms-1)
31
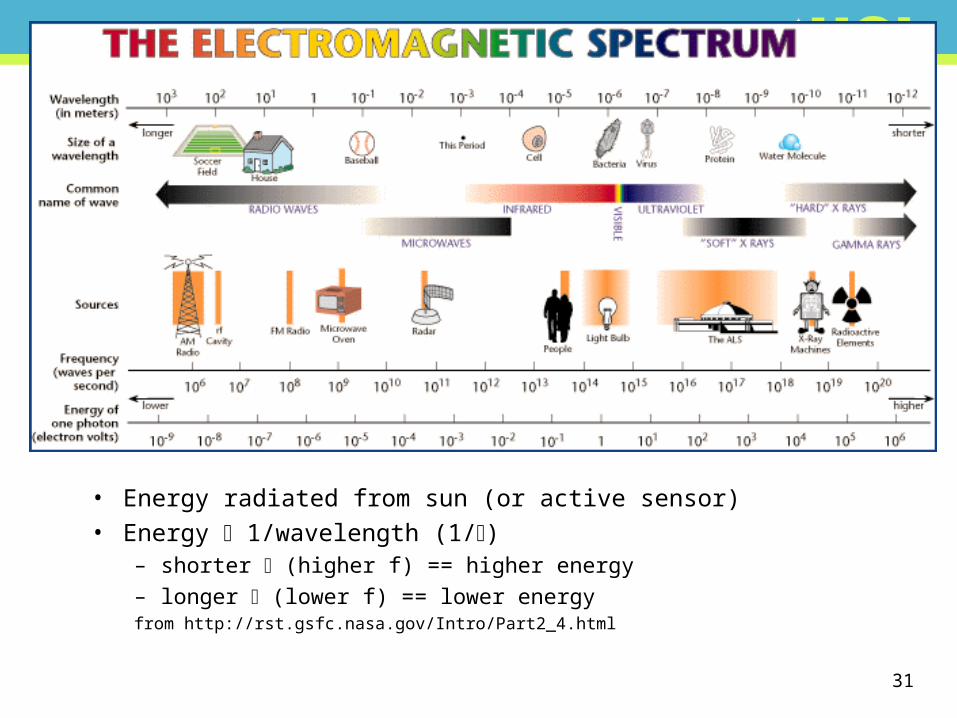
• Energy radiated from sun (or active sensor)• Energy 1/wavelength (1/)
– shorter (higher f) == higher energy
– longer (lower f) == lower energyfrom http://rst.gsfc.nasa.gov/Intro/Part2_4.html
32
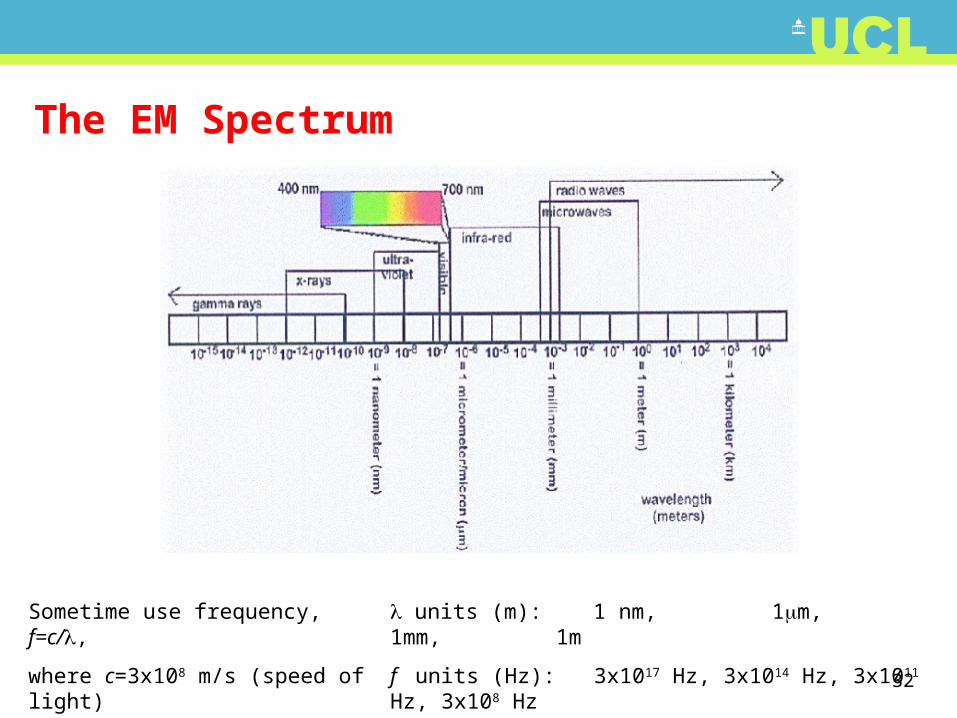
The EM Spectrum
Sometime use frequency, f=c/,
where c=3x10⁸ m/s (speed of light)
units (m): 1 nm, 1m, 1mm, 1m
f units (Hz): 3x10¹⁷ Hz, 3x10¹⁴ Hz, 3x10¹¹ Hz, 3x10⁸ Hz
33
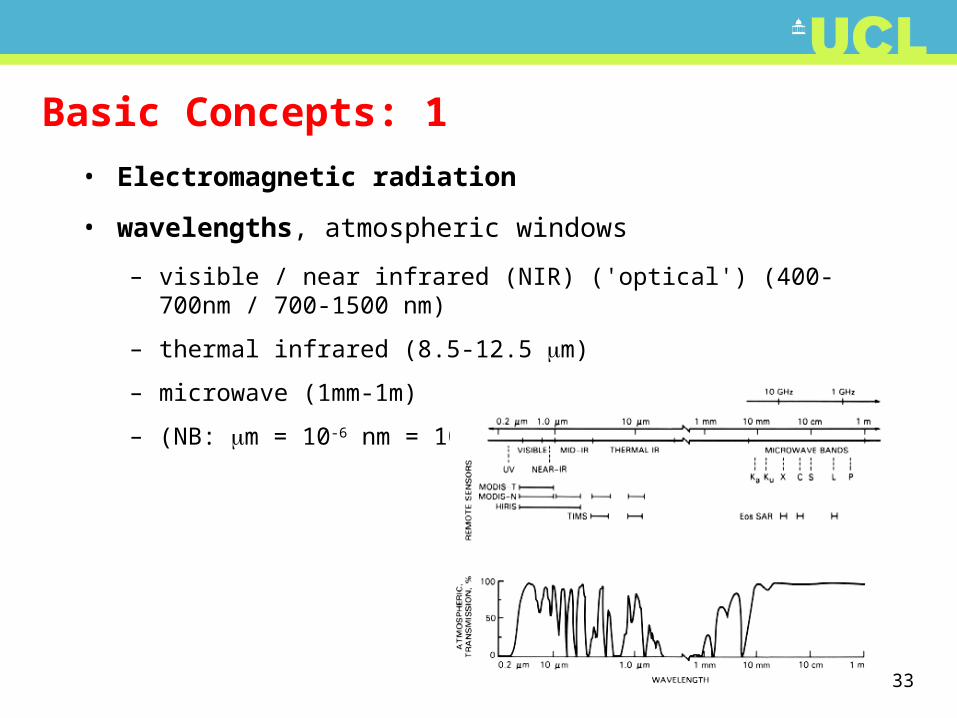
Basic Concepts: 1
• Electromagnetic radiation
• wavelengths, atmospheric windows
– visible / near infrared (NIR) ('optical') (400-700nm / 700-1500 nm)
– thermal infrared (8.5-12.5 m)
– microwave (1mm-1m)
– (NB: m = 10-6 nm = 10-9)
34
Basic Concepts: 2
• Orbits
– geostationary (36 000 km altitude)
– polar orbiting (200-1000 km altitude)
• Spatial resolution
– 10s cm (??) - 100s km
– determined by altitude of satellite (across track), altitude and speed (along track), viewing angle
• Temporal Resolution
– minutes to days
– NOAA (AVHRR), 12 hrs, 1km (1978+)
– MODIS Terra/Aqua, 1-2days, 250m++
– Landsat TM, 16 days, 30 m (1972+)
– SPOT, 26(...) days, 10-20 m (1986+)
– revisit depends on
• latitude
• sensor FOV, pointing
• orbit (inclination, altitude)
• cloud cover (for optical instruments)
35
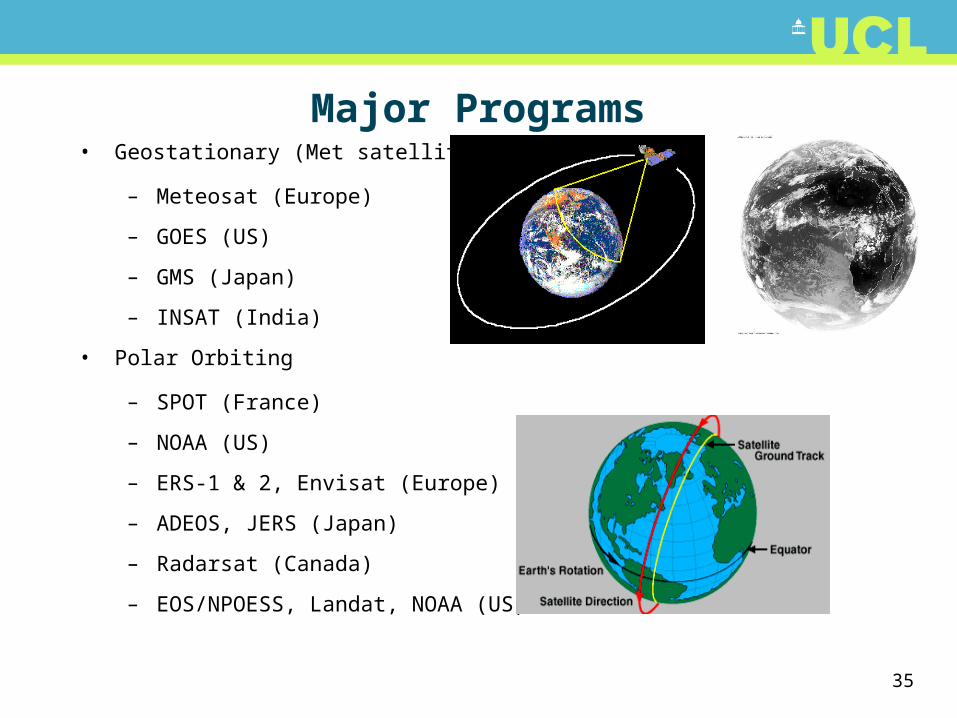
Major Programs• Geostationary (Met satellites)
– Meteosat (Europe)
– GOES (US)
– GMS (Japan)
– INSAT (India)
• Polar Orbiting
– SPOT (France)
– NOAA (US)
– ERS-1 & 2, Envisat (Europe)
– ADEOS, JERS (Japan)
– Radarsat (Canada)
– EOS/NPOESS, Landat, NOAA (US)
36
Physical Basis
• measurement of EM radiation
– scattered, reflected, emitted
• energy sources
– Sun (scattered, reflected), Earth (emitted)
– Artificial (RADAR, LiDAR, sonar…)
• source properties
– vary in intensity AND across wavelengths
37
EM radiation
• emitted, scattered or absorbed
• intrinsic properties (emission, scattering, absorption)
– vary with wavelength
– vary with physical / chemical properties
– can vary with viewing angle
38
Data Acquisition• RS instrument measures energy
received
– 3 useful areas of the spectrum:-
1) Visible / near / mid infrared
– passive
• solar energy reflected by the surface
• determine surface (spectral) reflectance
– active
• LIDAR - active laser pulse
• time delay (height)
• induce fluorescence (chlorophyll)
2) Thermal infrared
– energy measured - temperature of surface and emissivity
3) Microwave
– active
• microwave pulse transmitted
• measure amount scattered back
• infer scattering
– passive
• emitted energy at shorter end of microwave spectrum
39
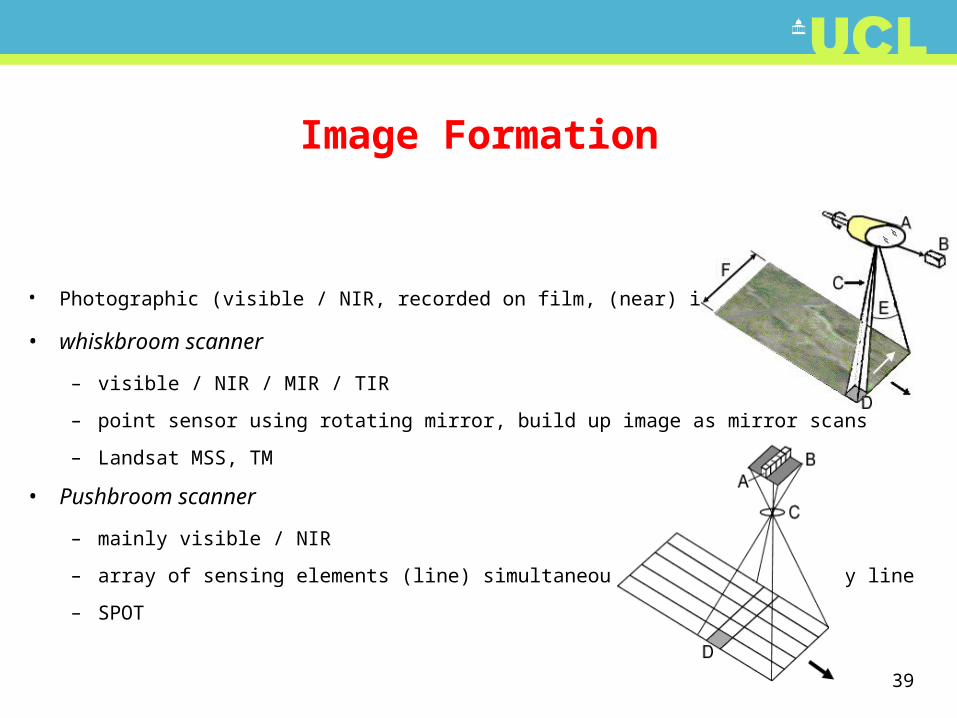
Image Formation
• Photographic (visible / NIR, recorded on film, (near) instantaneous)
• whiskbroom scanner
– visible / NIR / MIR / TIR
– point sensor using rotating mirror, build up image as mirror scans
– Landsat MSS, TM
• Pushbroom scanner
– mainly visible / NIR
– array of sensing elements (line) simultaneously, build up line by line
– SPOT
40
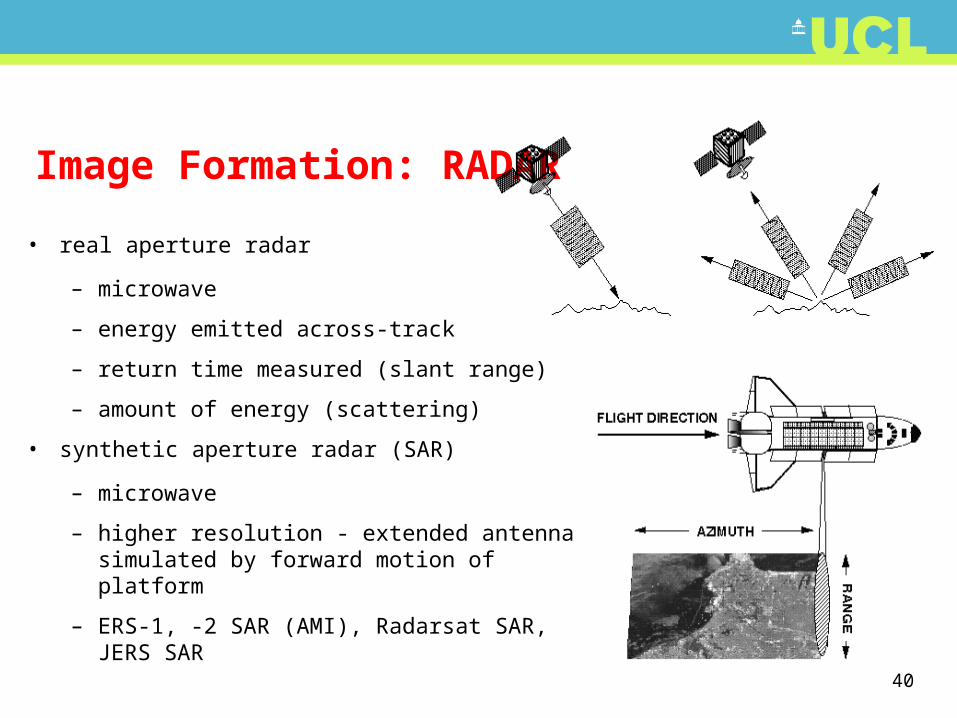
• real aperture radar
– microwave
– energy emitted across-track
– return time measured (slant range)
– amount of energy (scattering)
• synthetic aperture radar (SAR)
– microwave
– higher resolution - extended antenna simulated by forward motion of platform
– ERS-1, -2 SAR (AMI), Radarsat SAR, JERS SAR
Image Formation: RADAR
41
Quantisation
– received energy is a continuous signal (analogue)
– quantise (split) into discrete levels (digital)
– Recorded levels called digital number (DN)
– downloaded to receiving station when in view
– 'bits'... (binary digits)
• 0-1 (1 bit), 0-255 (8 bits), 0-1023 (10 bits), 0-4095 (12 bit)
– quantisation between upper and lower limits (dynamic range)
• not necessarily linear
– DN in image converted back to meaningful energy measure through calibration
• account for atmosphere, geometry, ...
– relate energy measure to intrinsic property (reflectance)
42
Image characteristics
• pixel - DN
• pixels - 2D grid (array)
• rows / columns (or lines / samples)
• 3D (cube) if we have more than 1 channel
• dynamic range
– difference between lowest / highest DN
43
Example Applications
• visible / NIR / MIR - day only, no cloud cover
– vegetation amount/dynamics
– geological mapping (structure, mineral / petroleum exploration)
– urban and land use (agric., forestry etc.)
– Ocean temperature, phytoplankton blooms
– meteorology (clouds, atmospheric scattering)
– Ice sheet dynamics
44
Information
• What type of information are we trying to get at?
• What information is available from RS?– Spatial, spectral, temporal, angular,
polarization, etc.
45
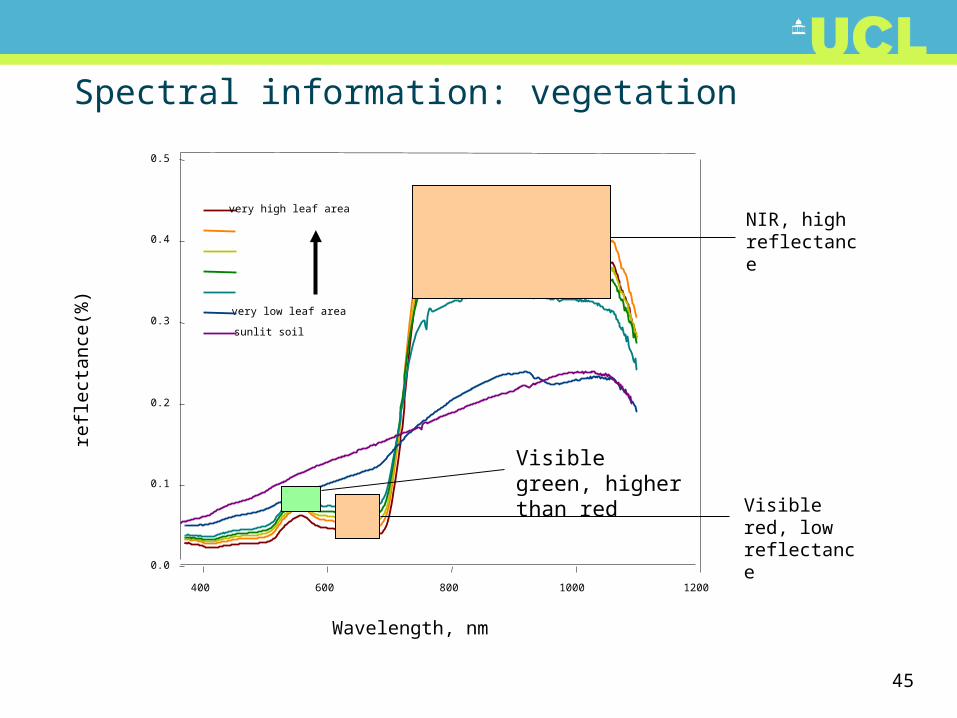
Spectral information: vegetation
Wavelength, nm
400 600 800 1000 1200
refle
ctan
ce(%
)
0.0
0.1
0.2
0.3
0.4
0.5
very high leaf area
very low leaf area
sunlit soil
NIR, high reflectance
Visible red, low reflectance
Visible green, higher than red
46
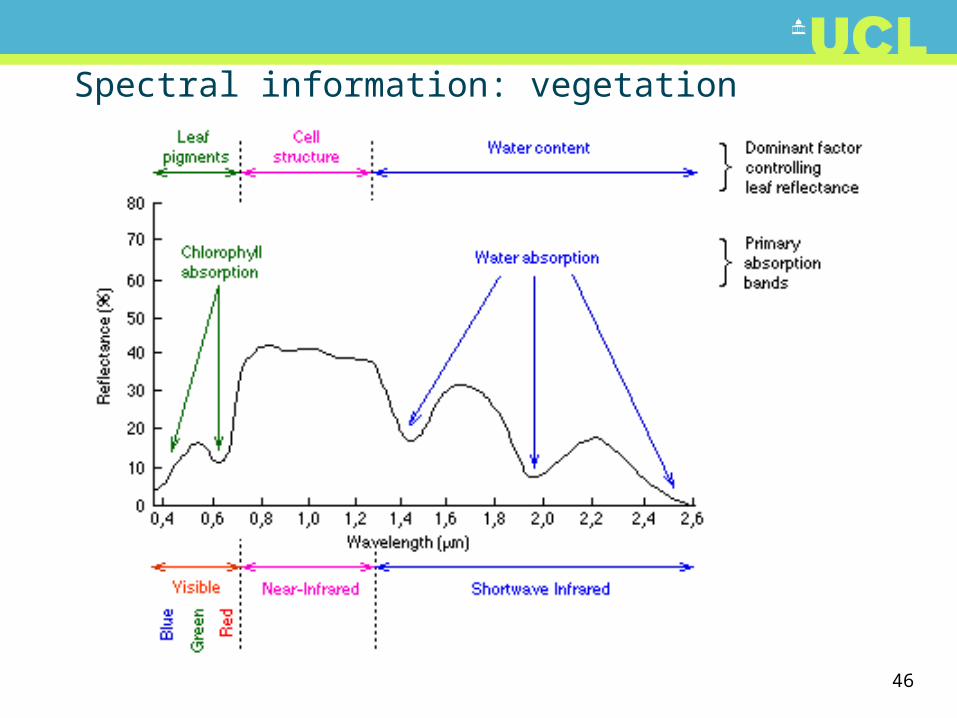
Spectral information: vegetation
47
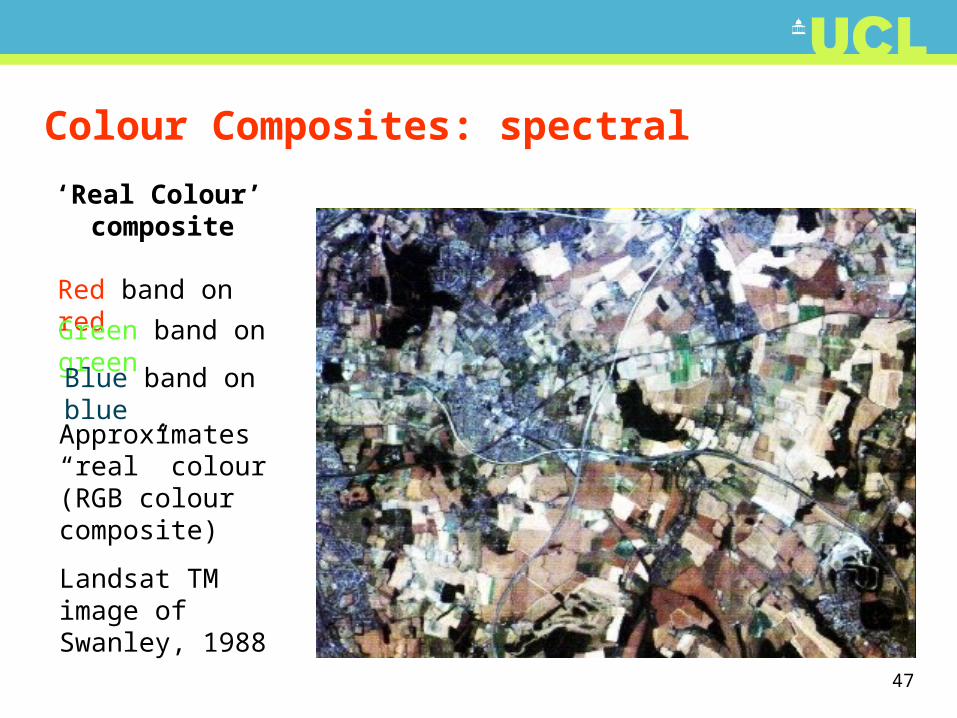
Colour Composites: spectral
‘Real Colour’ composite
Red band on red
Green band on green
Blue band on blue
Approximates “real” colour (RGB colour composite)
Landsat TM image of Swanley, 1988
48
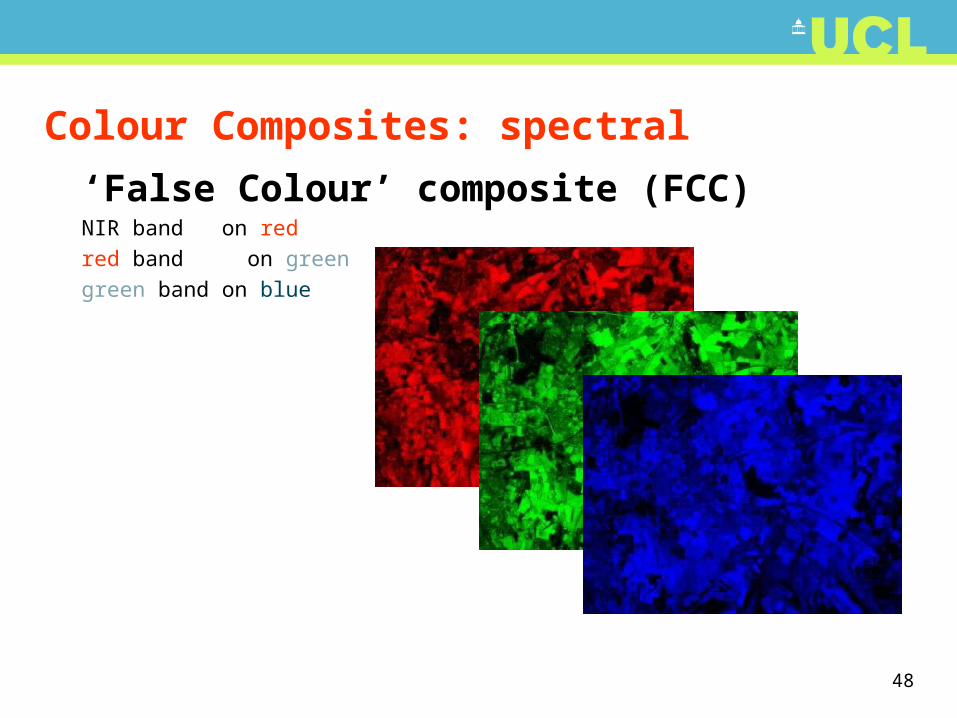
Colour Composites: spectral
‘False Colour’ composite (FCC)NIR band on red
red band on green
green band on blue
49
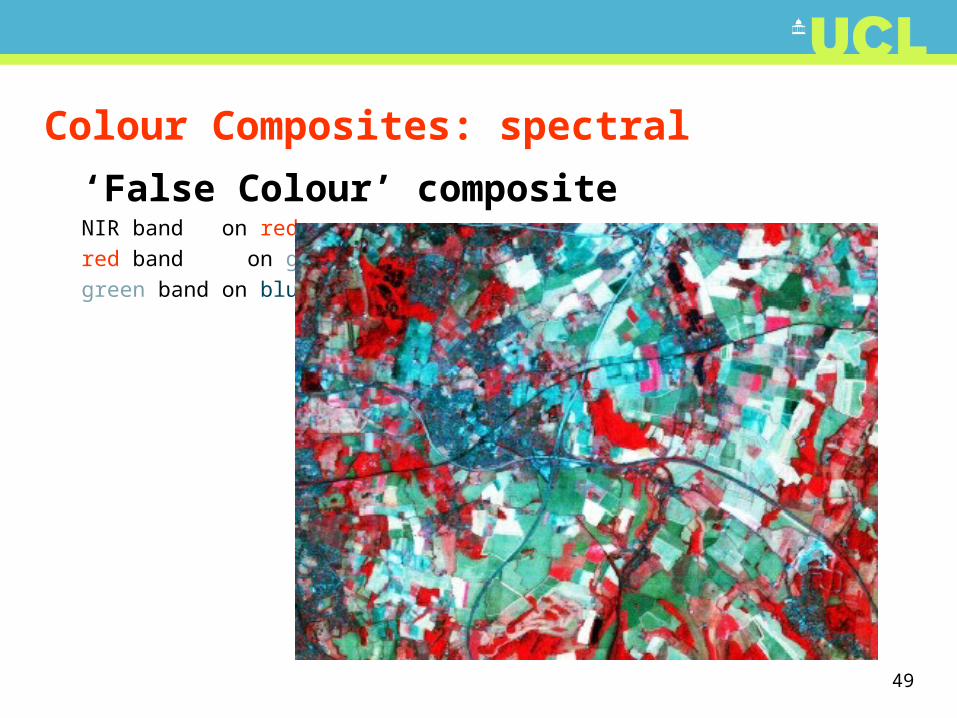
Colour Composites: spectral
‘False Colour’ compositeNIR band on red
red band on green
green band on blue
50
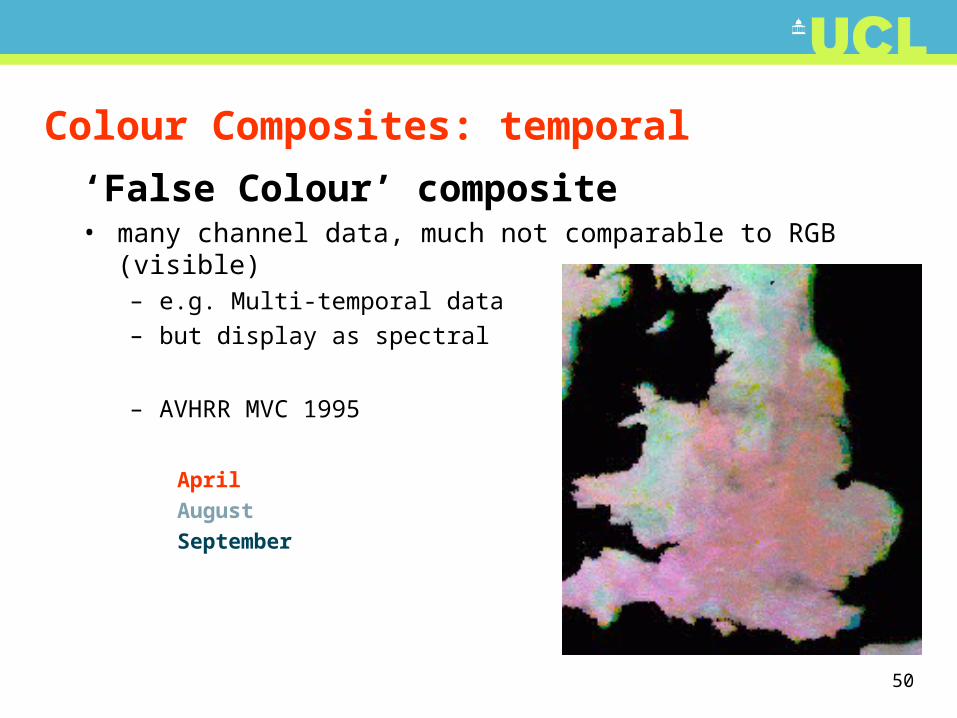
Colour Composites: temporal
‘False Colour’ composite• many channel data, much not comparable to RGB (visible)
– e.g. Multi-temporal data
– but display as spectral
– AVHRR MVC 1995
April
August
September
51
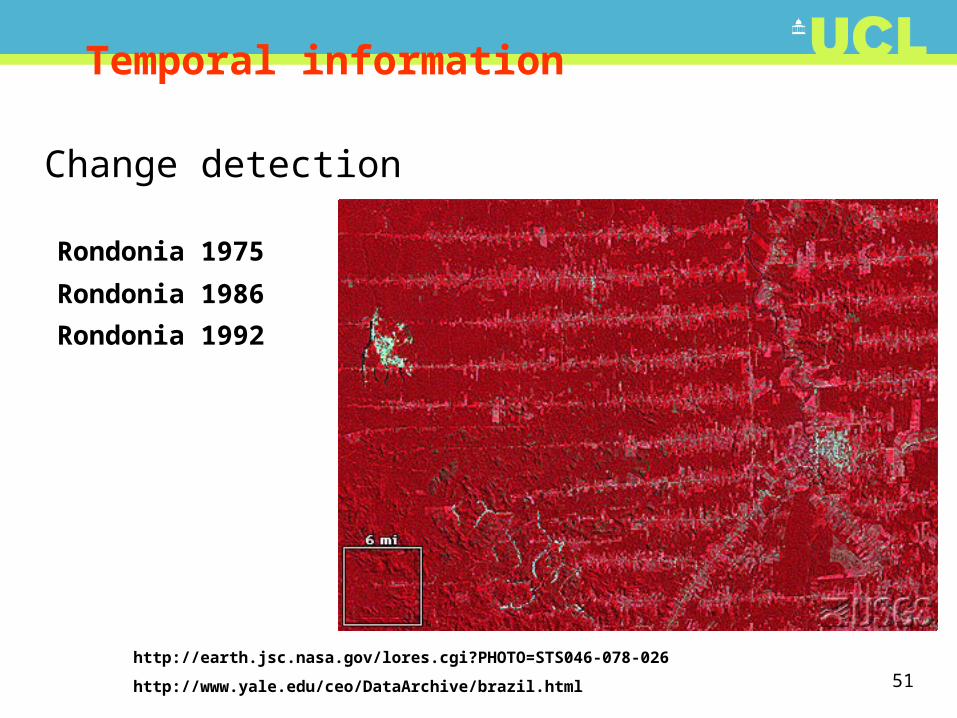
Rondonia 1975
Temporal information
Change detection
http://earth.jsc.nasa.gov/lores.cgi?PHOTO=STS046-078-026
http://www.yale.edu/ceo/DataArchive/brazil.html
Rondonia 1986
Rondonia 1992
52
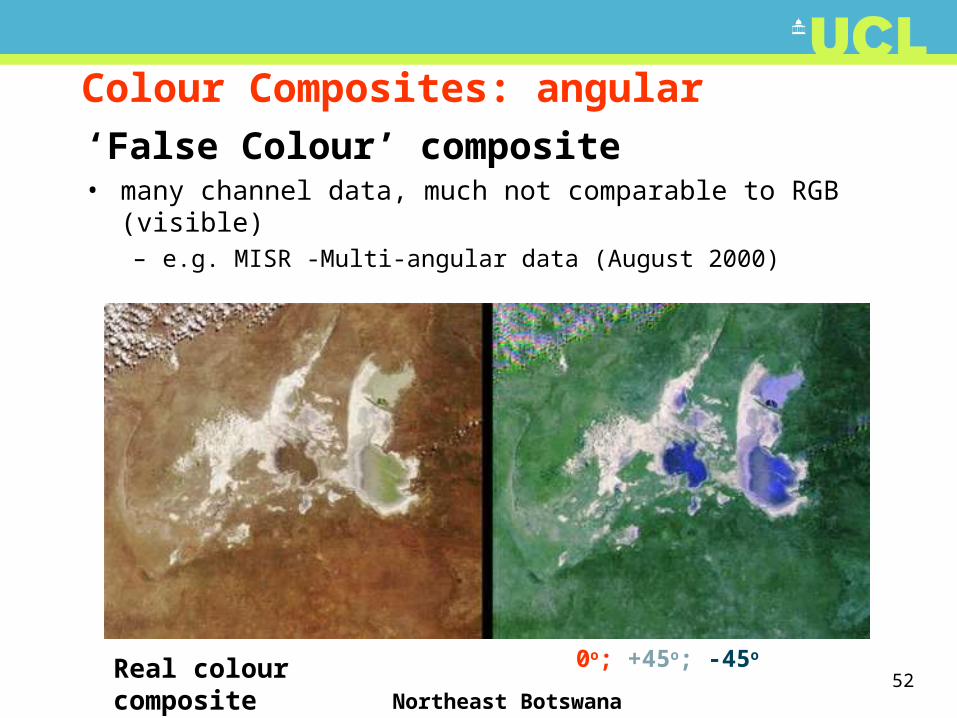
Colour Composites: angular
‘False Colour’ composite• many channel data, much not comparable to RGB (visible)
– e.g. MISR -Multi-angular data (August 2000)
Real colour composite (RCC) Northeast Botswana
0o; +45o; -45o
53
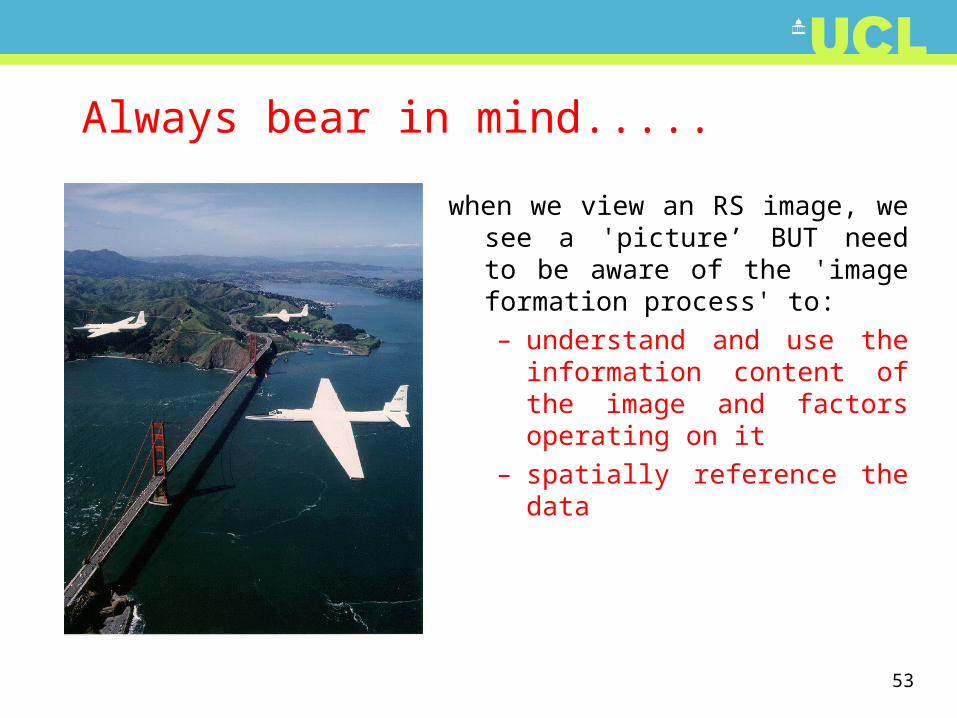
when we view an RS image, we see a 'picture’ BUT need to be aware of the 'image formation process' to:– understand and use the
information content of the image and factors operating on it
– spatially reference the data
Always bear in mind.....
54
Back to the process....
• What sort of parameters are of interest?• Variables describing Earth system....
55
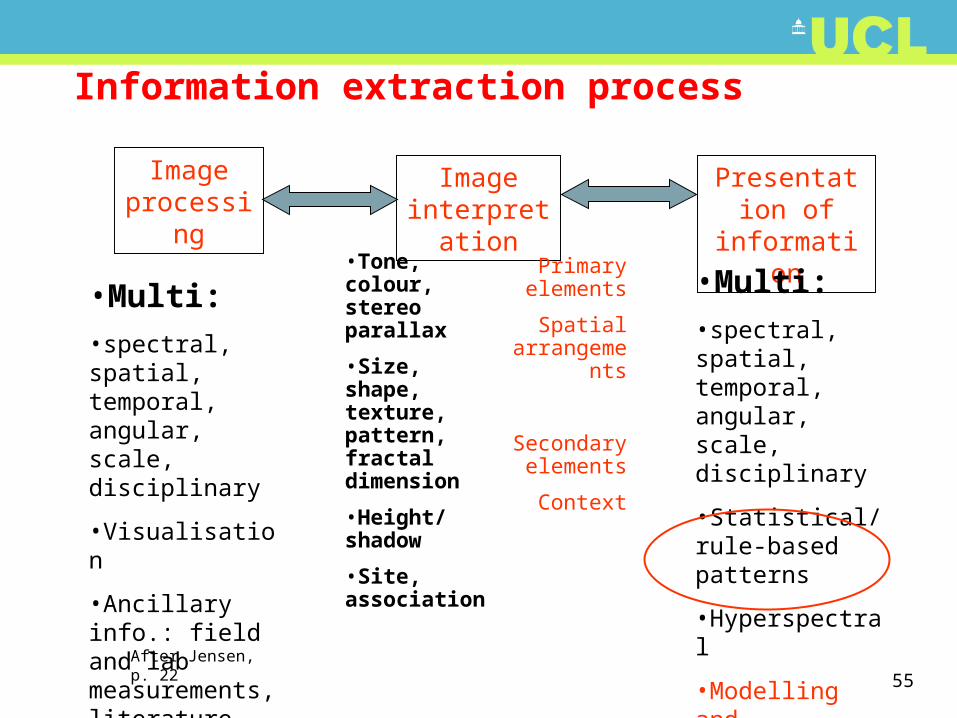
Information extraction process
After Jensen, p. 22
Image interpretation
•Tone, colour, stereo parallax
•Size, shape, texture, pattern, fractal dimension
•Height/shadow
•Site, association
Primary elements
Spatial arrangements
Secondary elements
Context
Image processing
•Multi:•spectral, spatial, temporal, angular, scale, disciplinary
•Visualisation
•Ancillary info.: field and lab measurements, literature etc.
Presentation of information
•Multi:•spectral, spatial, temporal, angular, scale, disciplinary
•Statistical/rule-based patterns
•Hyperspectral
•Modelling and simulation
56
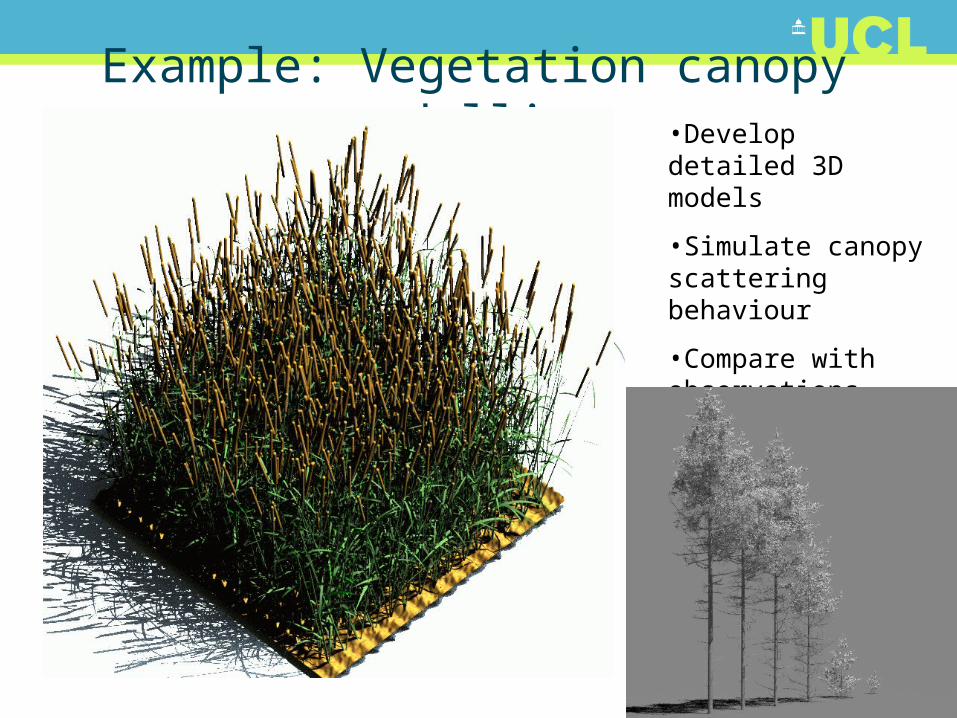
Example: Vegetation canopy modelling•Develop detailed 3D models
•Simulate canopy scattering behaviour
•Compare with observations
57
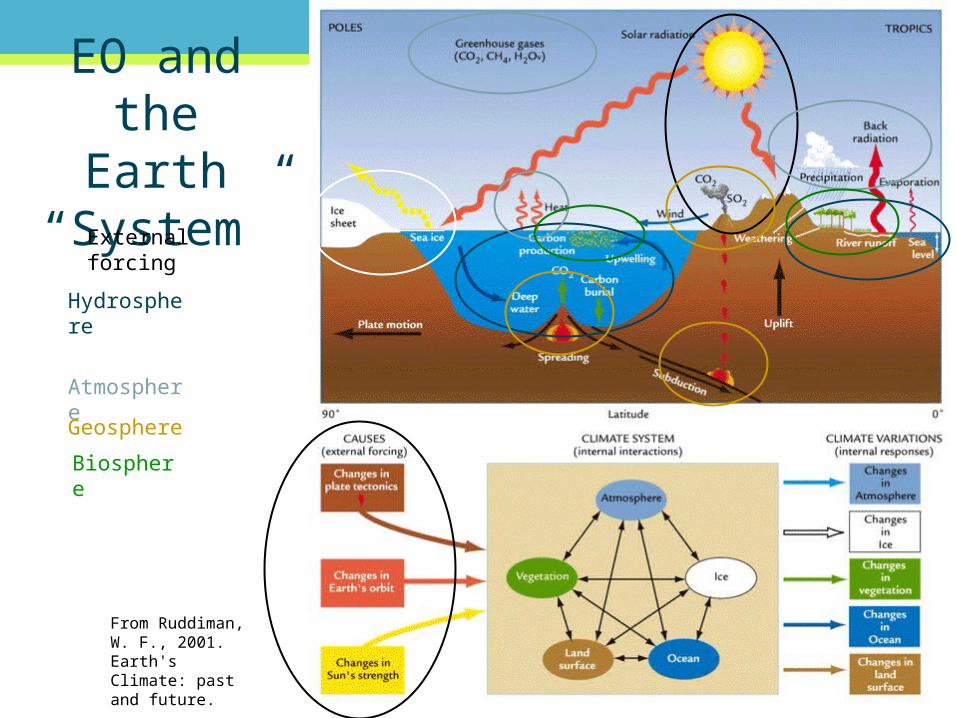
EO and the Earth
“System”
From Ruddiman, W. F., 2001. Earth's Climate: past and future.
External forcing
Hydrosphere
Atmosphere
Geosphere
Cryosphere
Biosphere
58
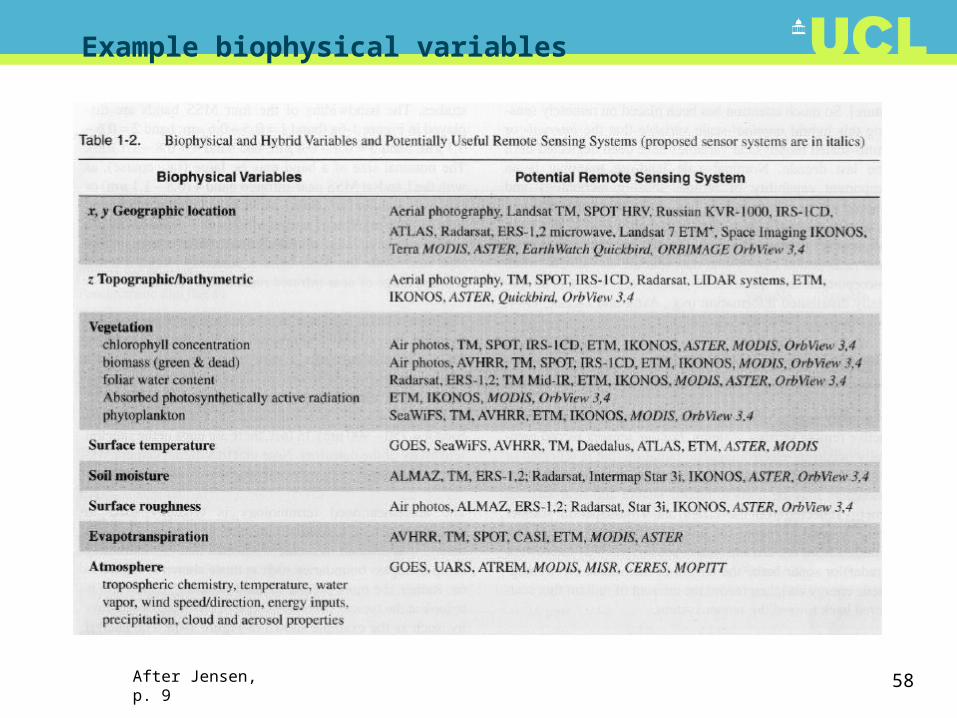
Example biophysical variables
After Jensen, p. 9
59
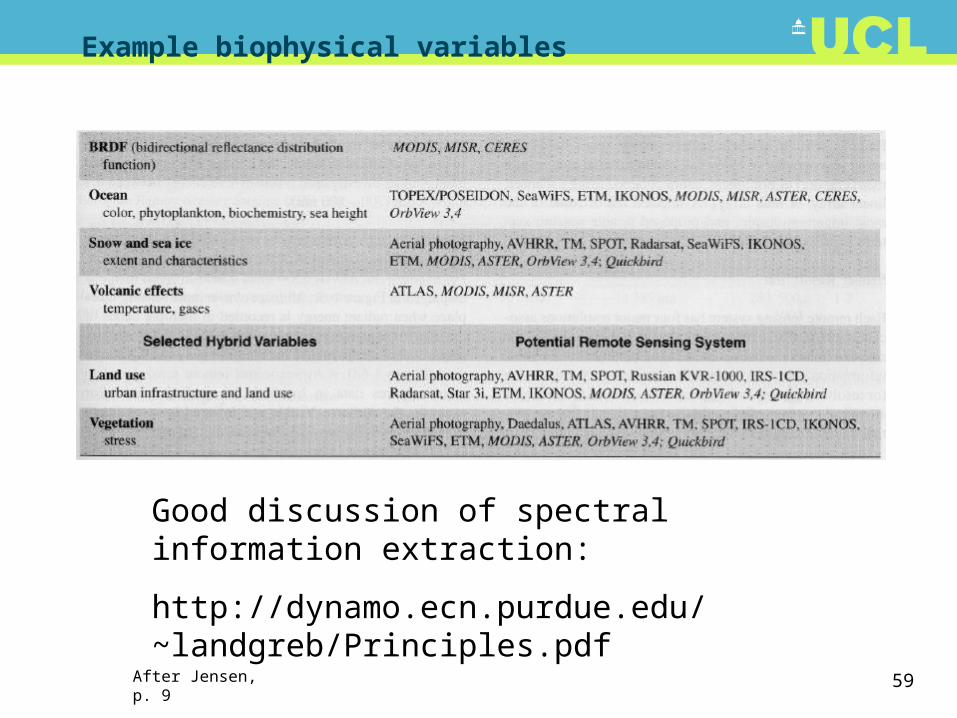
Example biophysical variables
After Jensen, p. 9
Good discussion of spectral information extraction:
http://dynamo.ecn.purdue.edu/~landgreb/Principles.pdf