msc thesis "optimization of emergency departments in the netherlands"
DESCRIPTION
TRANSCRIPT


Optimization of emergency departments in the Netherlands
Which variables influence the efficiency of an emergency department and how can these variables be used to
create the optimal emergency department?
Authors: Femke Lammerts ([email protected])
Elisa van Poelgeest ([email protected])
Dissertation date: January 5th, 2012
Defence date: January 12th, 2012
First reader: Professor Dr. Willem Burggraaf
Second reader: Drs. Hans ten Rouwelaar
Company Supervisor: Professor Dr. Drs. L.H.L. Winter
Straatweg 25
3620 AC Breukelen
The Netherlands
Ziekenhuisweg 100
8233 AA Lelystad
The Netherlands

Femke Lammerts and Elisa van Poelgeest, MSc 19, January 2012
Executive summary
The current healthcare system in the Netherlands is coming under increasing pressure due to
demographic, socio-economic and technological developments within Dutch society. Demand
and costs are rising, leading to savings and reforms in the healthcare sector. Consequently, a
new approach towards acute care, with the focus on emergency departments (EDs) is to be
desired, as outlined in this research paper.
The aim of this research was firstly to investigate which variables contribute to the efficiency of
an emergency department in the Netherlands and secondly how the latter contribute to
developing the optimal emergency department (ED). The variables researched were
infrastructure, technology, service, logistics, employees, financial system and patient satisfaction
within an emergency department (ED). To arrive at recommendations, the following central
research question was posed:
Which variables influence the efficiency of an emergency department and how can these variables be used to create
the optimal emergency department?
Qualitative research was chosen as the research method for different reasons. The nature of the
central research question required descriptive, exploratory and explanatory information
expressed in words, as well as a flexible means of data collection. Qualitative research enabled
the researchers to ask more in-depth questions during interviews and qualitative research was
also preferable, as the aim of this research paper is to develop recommendations based on the
current situation in the twelve individual emergency departments (EDs). The population was
identified as ‘complete’ EDs; 24/7 availability and incorporating eight compulsory
specializations. From the 67 ‘complete’ EDs in the Netherlands, a sample size of 12 was found
willing to co-operate. Location, category and willingness were three of the main selection
criteria.
The most important results were derived from the validation of the posed hypotheses by both
literature and the results of the interviews. Firstly, the layout of an emergency department (ED)
has been shown to have an effect on the long-term success of its processes (throughput time
and reducing overcrowding). The physical layout has an effect on patient satisfaction. Secondly,
the processes within an ED will become more efficient if digitalization, a paperless system and
a software system are applied in a uniform manner throughout the hospital. Thirdly, the
presence of an ED doctor at an ED is two-fold. Benefits include time-savings in terms of
speed and number of diagnostic tests and reduction in waiting and turnaround times.

Femke Lammerts and Elisa van Poelgeest, MSc 19, January 2012
Disadvantages mentioned were the time lost in the supervision of doctor assistants. The
shortage of ED doctors in full ED employment, plus the lack of uniformity in training
programs make it difficult to measure the actual presence of an ED doctor. Fourthly, waiting
time can be reduced to eliminate bottlenecks by using the Theory of Constraints (TOC). The
implementation of this theory can enhance the processes within the ED. Fifthly, it is difficult
to determine the profitability of an ED. EDs are seen as costly, mainly due to the
consequences of their permanent availability function. On the other hand, the ED yields
revenue for the hospital through patient admissions and follow-up consultations. However, no
clear overview of revenues generated by the ED exists as yet. Lastly, verbal communication
with patients in the ED plays an important role in patient satisfaction, especially with regard to
waiting times, the communication of information and the relation between patients and ED
staff. These are areas where major improvements can be made as Patient Centered Care (PCC)
will become increasingly important in the 21st century.
To briefly answer the central research question; literature has shown that the efficiency of an
ED is influenced by seven variables which can lead to optimization of an ED. The optimal ED
does not exist, as factors such as resources, culture and location of the individual ED must be
taken into account when designing the optimal ED. Accordingly, the seven variables must be
applied within an individual ED.
Recommendations for further research would be to conduct more than twelve interviews and
investigating the impact of cultural and regional differences within the Netherlands on the
efficiency of an ED. The variables should also be applied in a practical setting to identify their
effect on efficiency within an ED. Hypotheses that could not be validated by research should
also be further investigated as to their impact on ED efficiency.
The research in this paper was limited by the restrictions in terms of methodology, theoretical
framework and availability of data. Time constraint constituted the most important limitation
as it was not possible to conduct extensive research within the timeframe. Moreover, the
population researched was relatively small making it more difficult to reach a general
conclusion.
Recommendations for the person commencing this research, Loek Winter, are derived from
the hypotheses that could be validated by literature and the results of the interviews. The
particular circumstances of the ED at the MC|Groep should be taken into account, only
incorporating those variables that add value to that ED.

Femke Lammerts and Elisa van Poelgeest, MSc 19, January 2012
Acknowledgements
This research is conducted for and supported by Professor Dr. Drs. L.H.L. Winter, co-
founder of the MC|Groep, and Professor Dr. Willem Burggraaf, connected to Nyenrode
Business University. We would like to thank both for their time, effort and support during
the writing of the thesis. Without the advice and resources of these parties, this thesis
would not have been possible. We would also like to thank all the people who were
involved in the process of this thesis and making their resources and contacts available to
us. Lastly, a special thank you to all the interviewees at the different emergency department
for their co-operation, interesting conversations and openness in the exchange of ideas and
information.
Femke Lammerts and Elisa van Poelgeest, MSc 19
January 2012

Femke Lammerts and Elisa van Poelgeest, MSc 19, January 2012
Table of contents
1. Introduction ................................................................................................................................... 8
1.1 Scientific and managerial relevance .................................................................................... 10
1.2 Structure ................................................................................................................................. 11
2. Conceptual model ....................................................................................................................... 12
3. Methodology ................................................................................................................................ 13
3.1 Introduction........................................................................................................................... 13
3.2 General overview .................................................................................................................. 13
3.3 Qualitative research .............................................................................................................. 15
3.4 Research subjects, population selection and sample size ................................................ 16
3.5 Data collection: method of collection and choice for interviews .................................. 18
3.6 Analysis................................................................................................................................... 20
3.7 Reliability and validity .......................................................................................................... 21
3.8 Operational conceptual model ............................................................................................ 23
4. Theoretical framework ............................................................................................................... 24
4.1 Introduction........................................................................................................................... 24
4.2 Emergency departments ...................................................................................................... 25
4.3 Efficiency and optimization ................................................................................................ 27
4.3.1 Efficiency ........................................................................................................................ 27
4.3.2 Optimization .................................................................................................................. 28
4.3.3 Relation between efficiency and optimization .......................................................... 28
4.4 The seven variables ............................................................................................................... 28
4.4.1 Infrastructure ................................................................................................................. 29
4.4.1.1 Emergency department layout ............................................................................. 29
4.4.1.2 The Huisartsenpost ................................................................................................ 32
4.4.2 Technology ..................................................................................................................... 34

Femke Lammerts and Elisa van Poelgeest, MSc 19, January 2012
4.4.2.1 Software and digitalization of patient data ......................................................... 35
4.4.3 Service ............................................................................................................................. 36
4.4.3.1 Quality and performance indicators .................................................................... 37
4.4.4 Employees ...................................................................................................................... 39
4.4.4.1 Emergency department doctors ........................................................................... 39
4.4.4.2 Emergency department nurses, triage nurses and nurse practitioners ........... 40
4.4.5 Logistics .......................................................................................................................... 42
4.4.5.1 Triage process and triage systems ........................................................................ 43
4.4.5.2 Waiting times and processes in the emergency department ............................ 47
4.4.6 Finances .......................................................................................................................... 48
4.4.7 Patient satisfaction......................................................................................................... 52
4.5 Hypotheses ............................................................................................................................ 55
5. Results and analysis ..................................................................................................................... 56
5.1 Infrastructure .................................................................................................................... 56
5.1.1 Emergency department layout ..................................................................................... 56
5.1.1.1 Results ...................................................................................................................... 56
5.1.1.2 Analysis .................................................................................................................... 59
5.1.2 The Huisartsenpost ....................................................................................................... 60
5.1.2.1 Results ...................................................................................................................... 60
5.1.2.2 Analysis .................................................................................................................... 63
5.2 Technology ........................................................................................................................ 63
5.2.1 Software and digitalization of patient data ................................................................ 64
5.2.1.1 Results ...................................................................................................................... 64
5.2.1.2 Analysis .................................................................................................................... 66
5.3 Service ................................................................................................................................. 67
5.3.1 Quality and performance indicators ........................................................................... 67
5.3.1.1 Results ...................................................................................................................... 67

Femke Lammerts and Elisa van Poelgeest, MSc 19, January 2012
5.3.1.2 Analysis .................................................................................................................... 68
5.4 Employees .......................................................................................................................... 69
5.4.1 Emergency department doctors .................................................................................. 69
5.4.1.1 Results ...................................................................................................................... 69
5.4.1.2 Analysis .................................................................................................................... 73
5.5 Logistics .............................................................................................................................. 74
5.5.1 Triage process and triage systems ............................................................................... 74
5.5.1.1 Results ...................................................................................................................... 74
5.1.1.2 Analysis .................................................................................................................... 75
5.5.2 Waiting time and processes in the emergency department ..................................... 75
5.5.2.1 Results ...................................................................................................................... 75
5.5.2.2 Analysis .................................................................................................................... 78
5.6 Finances .............................................................................................................................. 79
5.6.1 Financial system of the emergency department ........................................................ 79
5.6.1.1 Results ...................................................................................................................... 79
5.6.1.2 Analysis .................................................................................................................... 80
5.7 Patient satisfaction ......................................................................................................... 81
5.7.1 Patient satisfaction......................................................................................................... 81
5.7.1.1 Results ...................................................................................................................... 81
5.7.1.1Analysis ..................................................................................................................... 82
5.8 Overview of the hypotheses and their validation ............................................................ 83
6. Conclusion ................................................................................................................................... 85
6.1 Introduction........................................................................................................................... 85
6.2 Conclusion research questions............................................................................................ 85
6.3 Conclusion central research question ................................................................................ 89
6.4 Recommendations for the MC|Groep ............................................................................. 90
6.5 Limitations ............................................................................................................................. 91

Femke Lammerts and Elisa van Poelgeest, MSc 19, January 2012
6.6 Recommendations for further research ............................................................................. 92
Bibliography ..................................................................................................................................... 94
Table of figures
Figure 1: Conceptual model ............................................................................................................. 12
Figure 2: Research paths .................................................................................................................. 14
Figure 3: Selection of research subjects .......................................................................................... 16
Figure 4: Method of data collection ................................................................................................ 18
Figure 5: Analysis process ................................................................................................................ 20
Figure 6: Operational conceptual model......................................................................................... 23
Figure 7: Position of emergency department ................................................................................. 25
Figure 8: Position of efficiency and optimization .......................................................................... 27
Figure 9: Position of the seven variables ........................................................................................ 28
Figure 10: Position infrastructure variable ...................................................................................... 29
Figure 11: Position technology variable .......................................................................................... 34
Figure 12: Position service variable ................................................................................................. 36
Figuur 13: Position employee variable ............................................................................................ 39
Figure 14: Position logistics variable ............................................................................................... 42
Figure 15: Position finance variable ................................................................................................ 48
Figure 16: Financing and funding structure in Dutch health-care system .................................. 49
Figure 17: Position patient satisfaction variable ............................................................................. 52
Figuur 18: Position infrastructure variable ..................................................................................... 56
Figuur 19: Position technology variable.......................................................................................... 63
Figuur 20: Position service variable................................................................................................. 67
Figuur 21: Position employee variable ............................................................................................ 69
Figuur 22: Position logistics variable ............................................................................................... 74
Figuur 23: Position finance variable ................................................................................................ 79
Figure 24: Position patient satisfaction variable ............................................................................. 81
Table of tables
Table 1: Overview emergency department layout .......................................................................... 58
Table 2: Overview of the distribution of HAP integration ........................................................... 62
Table 3: Overview of emergency doctors and opinion on their presence ................................... 72

Femke Lammerts and Elisa van Poelgeest, MSc 19, January 2012
8
1. Introduction
The current healthcare system in the Netherlands is coming under increasing pressure due
to demographic, socio-economic and technological developments within Dutch society.
The demand for care will become increasingly complex due to the rising number of elderly
people and the increasing demand for personally tailored care. This will eventually lead to
higher healthcare costs. Consequently, the healthcare sector will have to deal with savings
and reforms (Bos, Koevoets, & Oosterwaal, 2011).
The Dutch healthcare system consists of 3 pillars: primary, secondary and tertiary care.
This was determined by the ‘structuurnota’ in 1974. The relationship between these pillars
originates from the patient perspective (Boot & Knapen, 2005). Primary care is defined as
care for which no referral is needed from a general practitioner (GP) and therefore patients
can refer themselves to specific healthcare (Bos, Koevoets, & Oosterwaal, 2011). The
emergency department (ED) forms part of the primary care pillar, but is situated within
secondary care. The general practitioner (GP) plays an important role in the process of
referring a patient to secondary care. Secondary care is only accessible by referral via
primary care. Tertiary care entails highly-specialized care (Bos, Koevoets, & Oosterwaal,
2011).
Acute care, situated in both primary and secondary care, encompasses ambulance facilities,
general practioners (GPs) and trauma care. ‘Vereniging Huisartsenposten Nederland’
(VHN) defines acute care as medical problems and conditions for which treatment is
needed within a short period of time (van Baar, Giesen, Grol, & Schrijvers, 2007). During
recent years there have been reforms leading to the creation of general practitioners’ co-
operations to organise acute care more efficiently. The following bottlenecks still exist
within the acute care sector:
There is no performance-based reimbursement: this indicates that general
practitioners do not receive the same reimbursement for e.g. a sprained ankle as a
specialist working in the emergency department (ED). Consequently, the general
practitioner has no incentive to take over low acute care patients which makes acute
care less efficient.
The differences in triage and treatment protocols induce non-efficient quality and
processes.
Femke Lammerts and Elisa van Poelgeest, MSc 19, January 2012
9
These bottlenecks will need to be adressed in the future in order to make acute care more
efficient. Within acute care, the emergency department (ED) has its own obstacles:
Shortage in the general practitioner’ (GP) care
The rise of the specialism as emergency department (ED) doctor
The increase in the number of centralized general practitioner (GP) co-operations
The decreasing number of doctor’s assistants in hospitals
Patients require more information and are less willing to accept lengthty waiting times
The multicultural society calls for another care model for consumers/patients (Nederlandse Vereniging Spoedeisende Hulp Verpleegkundigen, 2005)
A new approach towards acute care, with the focus on emergency departments (EDs) is to
be desired, as outlined in this research paper. The closure of and pressure on emergency
departments is currently a ‘hot topic’ so to speak, as is the worsening financial situation
encountered in many hospitals. Controlling costs in an emergency department is complex
as EDs have a 24/7 availability function (Baltesen, 2009). Costs, customer service and
eliminating waiting time are key factors that should be addressed in any attempt to reform
acute care. By focusing on results, a positive effect can be reached on quality, care and
patient satisfaction. Therefore, it is desirable to investigate which variables can be used to
create an optimal emergency department, which is customer focused, improves efficiency
and has a sound financial foundation (Nederlandse Zorgautoriteit, 2008).
The aim of this research is firstly to investigate which variables contribute to the efficiency
of an emergency department in the Netherlands and secondly how the latter contribute to
developing the optimal emergency department (ED). Based on these results,
recommendations on the optimal emergency department can be made. The variables
researched are infrastructure, technology, service, logistics, employees, financial system and
patient satisfaction within an emergency department (ED). To arrive at recommendations,
the following central research question is posed:
Which variables influence the efficiency of an emergency department and how can these variables be used to
create the optimal emergency department?

Femke Lammerts and Elisa van Poelgeest, MSc 19, January 2012
10
The central research question will be answered by means of the following sub-research
questions:
1. What is the definition and what characterizes of an emergency department in the
Netherlands?
2. What is the definition and characterizes efficiency in health care?
3. What is the definition and which are the optimization characteristics in health care?
4. How are efficiency and optimization interrelated?
5. Which variables contribute to the efficiency of an emergency department?
6. How does the variable infrastructure contribute to the efficiency of an emergency
department?
7. How does the variable technology contribute to the efficiency of an emergency
department?
8. How does the variable service contribute to the efficiency of an emergency
department?
9. How does the variable logistics contribute to the efficiency of an emergency
department?
10. How do the variable employees contribute to the efficiency of an emergency
department?
11. How does the variable finance contribute to the efficiency of an emergency
department?
12. How does the variable patient satisfaction contribute to the efficiency of an emergency
department?
In order to define the scope of the research, the first four sub-research questions will
clarify the terms of the central research question. Sub-research question five will explain
which variables, found in literature, contribute to the efficiency of an emergency
department. The last seven sub-research questions will answer, per variable, how each
variable influences the efficiency of an emergency department. The twelve research
questions form an extensive answer to the central research question, which will be
answered in the conclusion.
1.1 Scientific and managerial relevance
There are several reasons why this research has scientific and managerial relevance.
Scientifically, there are very few research reports that investigate both the financial

Femke Lammerts and Elisa van Poelgeest, MSc 19, January 2012
11
perspective as well as the customer focus perspective in an emergency department. There
has never been sufficient research done on customer focus in an emergency department
setting, as the main focus has been on the optimization of procedures and achieving higher
quality. The customer satisfaction and focus in this paper will be achieved as a consequence
of optimizing the emergency department’ processes. The interviews have not been
validated in English, as this research investigates the optimization of Dutch emergency
departments. This gives a better insight into the current situation of emergency
departments in the Netherlands. By looking at the different variables and their contribution
to the efficiency and optimization in an emergency department, the overall performance of
an emergency department could be improved. The new approach to the structure of an
emergency department will also influence the managerial relevance. Market forces will
become increasingly important, as well as distinguishing factors. Consequently, the
managerial approach should be adjusted in order to become more customer focused and
profitable. Finally, managers and other professionals can use the suggested variables as a
tool for change and improvement when thinking about their own acute care situation.
1.2 Structure
This report is divided into six chapters. Chapter one is the introduction as presented above.
Chapter two, shows and gives an explanation of the conceptual model used. This model is
important for the total structure of this research paper, as it will function as a guide
through all the subsequent chapters. The third chapter will discuss the methodology, in
which qualitative research, data collection, research subjects, method of analysis, reliability
and variability and the operational conceptual model will be discussed. The fourth chapter
will cover the theoretical framework. This chapter contains the literature on which the
variables are based. From this theoretical framework, hypotheses are developed. This
chapter is then followed by an overview of the results and an analysis (chapter five). The
results describe the outcomes of the interviews held and they will test the validity of the
hypotheses that emerged from the theoretical framework. The last chapter (chapter six) is
the conclusion, in which the central and twelve sub-research questions will be answered
and recommendations made. This chapter also contains the limitations of the research,
recommendations for the MC|Groep and recommendations for further research. The
bibliography can be found at the very end. The appendices can be found in the confidential
booklet, which is supplied separately to whoever it may concern.

Femke Lammerts and Elisa van Poelgeest, MSc 19, January 2012
12
2. Conceptual model
The conceptual model shown in figure 1 is important for the structure and comprehension
of this research paper. It will guide the reader in a structured manner through the chapters.
Every chapter and the subchapters will be introduced with the conceptual model, in which
the specific part under discussion is highlighted in the model.
The detailed methodology behind this conceptual model and the research paper will be
further elaborated on in chapter three (methodology). The foundation for the variables can
be read in the theoretical framework (chapter four).
The conceptual model was developed with the central research question and twelve sub-
research questions in mind, as it encompasses all the steps and terms needed to answer
these research questions and to reach a final conclusion. Figure 1 can be read and
interpreted as follows: The left box indicates the research subject. The emergency
department (ED) is the research subject, of which the head of the EDs are the
interviewees. In total twelve EDs were visited, divided into academic, teaching and
regional. The middle box shows the seven variables that, based on literature, have an effect
on the efficiency of an ED. These variables are interlinked. The right-hand box shows the
aim of this research paper, namely recommendations for the optimal ED.
Figure 1: Conceptual model
Femke Lammerts and Elisa van Poelgeest, MSc 19, January 2012
13
3. Methodology
3.1 Introduction
Chapter three discusses the methodology of this paper and is divided into eight parts. The
second section of this chapter (3.2) will give a general overview of the methodology by
means of a model. The function of the model is to give a general and clear overview of the
paths followed in this research paper. The third part (3.3) discusses the reasons for
choosing qualitative research and the fourth part (3.4) elaborates on the research subjects.
This is followed by the method of data collection (3.5), the method of analysis (3.6), the
reliability and validity of the methodology (3.7) and concluded with the operational
conceptual model (3.8).
3.2 General overview
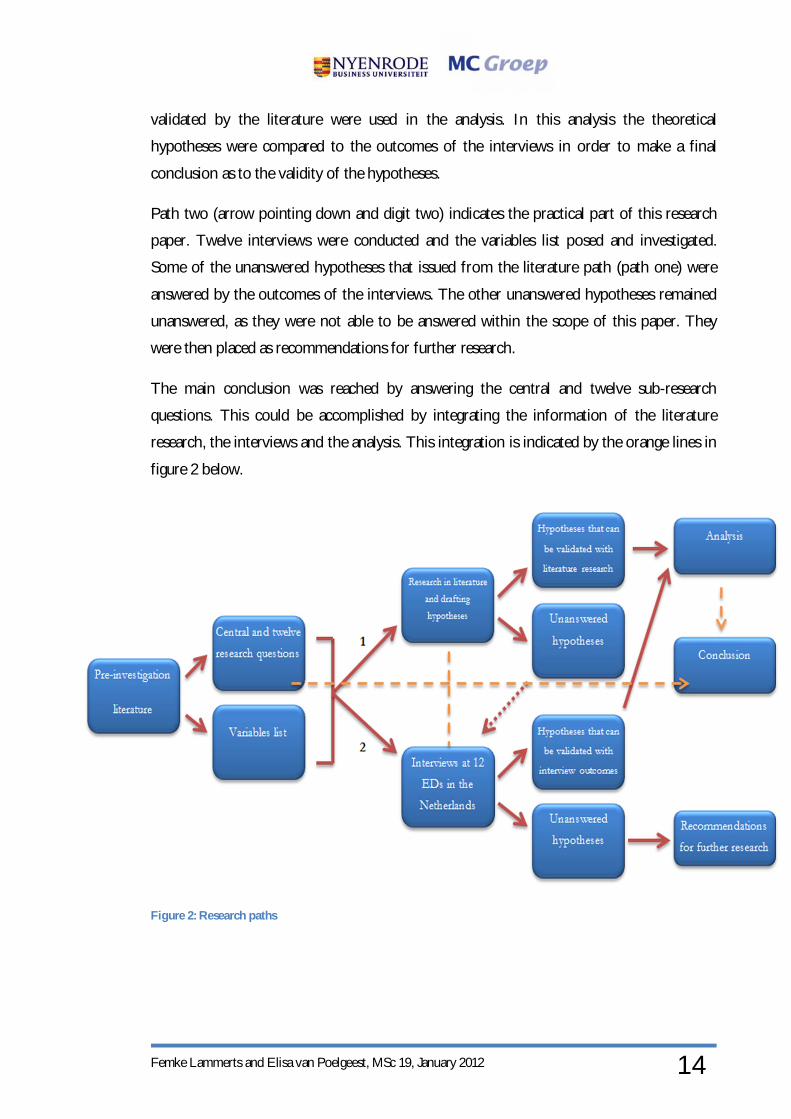
The figure on the next page, figure 2, gives an overview of the paths followed for this
research paper. The model can be interpreted as follows. The request by the person
commissioning this research, Loek Winter (co-founder of the MC|Groep), on the
optimization of emergency departments (EDs) in the Netherlands led to a pre-
investigation. The pre-investigation consisted of gaining an awareness of the literature on
EDs and optimization, in order to obtain knowledge and insight into the variables
contributing to the efficiency and optimization of EDs. From this study two products were
developed; the central research question and the twelve sub-research questions and a
variables list for the interview. The list of variables can be found in appendix I of the
confidential booklet and its foundation is described in the theoretical framework (chapter
4). The central research question and the twelve sub-research questions can be found in
chapter 1. In order to answer the central and twelve sub-research questions, two paths were
selected.
Path one (indicated by the arrow going up and digit one) shows the theoretical path.
Following the pre-investigation literature study, further research was conducted into the
literature on variables contributing to the efficiency of EDs in order to establish the
foundation for the central and twelve sub-research questions. From the literature,
hypotheses were deduced. The validation of some of these hypotheses could be tested by
the literature, other hypotheses not. This latter path will be further explained in the
research path (path two, dotted red arrow in figure 2). The hypotheses that could be
Femke Lammerts and Elisa van Poelgeest, MSc 19, January 2012
14
validated by the literature were used in the analysis. In this analysis the theoretical
hypotheses were compared to the outcomes of the interviews in order to make a final
conclusion as to the validity of the hypotheses.
Path two (arrow pointing down and digit two) indicates the practical part of this research
paper. Twelve interviews were conducted and the variables list posed and investigated.
Some of the unanswered hypotheses that issued from the literature path (path one) were
answered by the outcomes of the interviews. The other unanswered hypotheses remained
unanswered, as they were not able to be answered within the scope of this paper. They
were then placed as recommendations for further research.
The main conclusion was reached by answering the central and twelve sub-research
questions. This could be accomplished by integrating the information of the literature
research, the interviews and the analysis. This integration is indicated by the orange lines in
figure 2 below.
Figure 2: Research paths

Femke Lammerts and Elisa van Poelgeest, MSc 19, January 2012
15
3.3 Qualitative research
This section will elaborate on the reasons for choosing qualitative research.
There are three main reasons for choosing a qualitative research method: the design of the
central research questions and twelve research questions, the need for in-depth information
and the aim of the research paper. These three reasons will be further elaborated on in the
next paragraphs.
The design of the central research question and its twelve sub-research questions calls for a
qualitative answer. The nature of the central research question requires descriptive,
exploratory and explanatory information expressed in words, as well as a flexible means of
data collection. The research questions have an open design and would benefit more from
qualitative research. In-depth information is preferred in order to answer the central and
twelve sub-research questions adequately. Interviews, as part of qualitative research, can
facilitate in the need for in-depth information. Also, qualitative research enables researchers
to ask more in-depth questions during interviews when a certain topic is not clear or not
elaborated on sufficiently. Quantitative research cannot contribute to this in the same
manner as qualitative research. The central research question does not prefer a quantitative
approach, as the data would not be sufficiently extensive or in-depth to culminate in a
comprehensive and complete answer.
Qualitative research is also desirable, as the aim of this research paper is to develop
recommendations based on the current situation in the twelve individual emergency
departments (EDs). Qualitative research will be able to provide the tools to outline the
different processes within the EDs; the bottlenecks on the one hand and the successes on
the other as extensively and detailed as possible. Qualitative research can function as the
first step in this research on the efficiency and optimization of EDs in the Netherlands.
Further research could test the non-validated hypotheses in this research through
quantitative research.
In conclusion, the central research question and twelve sub-research questions were
designed according to the need for in-depth information, whereby the aim of the research
paper led to the three main reasons for choosing quantitative research as the preferred
method. The next section will elaborate on the research subjects, population selection and
sample size.

Femke Lammerts and Elisa van Poelgeest, MSc 19, January 2012
16
3.4 Research subjects, population selection and sample size
This methodology section identifies and discusses the research
subjects (population), as well as the method and reasons for selecting
this population. Figure 3 on the left gives a short overview of the
selection process of the research subjects.
The population for this research paper is the emergency department
(ED) in the Netherlands. The central research question specifies that
the research on the variables contributing to the efficiency and the
optimization are focused in the ED. Since the person commissioning
this work, Loek Winter (co-founder of the MC|Groep), is based in
the Netherlands, the research is conducted in Dutch EDs. It is
assumed that interviews with foreign EDs do not add extra valuable
information for this particular research. Such an assumption is based
on the fact that healthcare systems and working methods in an ED abroad are different. If
the focus were to shift to include other countries the results may not be applicable to a
specific ED in the Netherlands.
The interviewees functioned as representatives of the ED. These interviewees were
qualified as the head or manager of the ED. The head of the ED has the knowledge and
insight to provide the data needed to answer the questions in the interview, as well as
having access to documentation to support or add to the data in the interview. The head of
the ED has a background as ED nurse or ED doctor and can thus provide practical and
theoretical information on the different categories incorporated in the interview. A
combination of practical examples and theoretical information are necessary and important
for insight into the individual situation in a specific ED, as well as tools for the
development of the optimal ED.
The selection of the EDs was as follows. First the size of the population was defined as
105 EDs in the Netherlands (RIVM, CBS, VHN, 2011). From these 105 EDs, 67 are seen
as ‘complete’ EDs and were thus selected on the basis of the selection criteria. A complete
ED has a 24/7 availability and incorporates eight compulsory specializations (see chapter
4.2). From these 67 EDs, a further selection took place according to category (academic,
teaching, regional) and location, thus not on a random basis. The category was important as
the type of categorization can be different depending on processes and size, thus
Figure 3: Selection of research subjects

Femke Lammerts and Elisa van Poelgeest, MSc 19, January 2012
17
comparisons can be made between the EDs. Location also formed part of the selection
criteria, as the geographical location of an ED can reveal a difference in the mentality of
staff and patients and the ‘loyalty’ element towards the general practitioner (GP) (Giesen,
2006) (Olatunde, 2007). To obtain as diverse a view as possible of the EDs, these were
selected throughout the country and the ED choice within each area in the Netherlands
(North, East, West and South) was chosen randomly. After selection, the sample size was
reduced to 20 EDs. As research has it, the number of interviews required to achieve
reliable data and feasibility has not been specifically set, but most in-depth and semi-
structured interviews encompass a size of 10-20 interviews. It is also said that “An
appropriate sample size for a qualitative study is one that adequately answers the research question”
(Marshall, 1996). Considering the latter and the time frame of the research, 20 interviews
was considered a maximum number.
The head or manager of 20 EDs in the Netherlands were contacted by telephone, informed
about the research and asked to co-operate in an interview. In the end the willingness to
co-operate was the determining factor in the choice for the final selection of the EDs.
Twelve of the 20 EDs approached, were willing to cooperate (2 academic, 5 teaching and 5
regional). This list can be found in appendix II. Reasons for the twelve EDs to co-operate
were (personal) interest in the research or a general willingness to help and participate. The
other eight EDs were either too busy at that point in time, did not respond to the request
or did not see the added value of co-operating in the research.
As mentioned above, a list of the regions and co-operating EDs can be found in appendix
II. The names and exact locations of the hospitals themselves are not mentioned due to
privacy reasons. The hospitals are coded from A-L; categorization was done independently
of the sequence of the appointments.
Concluding this section on the population of the EDs in the Netherlands, a sample size of
12 was found willing to co-operate in an interview for this research. Location, category and
willingness were three of the main selection criteria. The next section will discuss the data
collection.

Femke Lammerts and Elisa van Poelgeest, MSc 19, January 2012
18
3.5 Data collect ion: method of collection and choice for interviews
In this section of the methodology, the method of data collection will
be discussed. First the method of obtaining the interviews will be
described, followed by the choice for interviews and the execution of
the interviews. The use of the variables list during the interviews will
also be elaborated on. Figure 4 on the left shows the steps in the data
collection.
As mentioned in section 3.4, the head or manager of the 12 individual
EDs agreed to co-operate in an interview. After setting a date for an
appointment by telephone, a confirmation e-mail was sent together
with the variables list (see next paragraph). The variables list was sent
to the interviewees before the appointment itself, to give the
interviewees time to prepare. It was decided to visit the individual
EDs for a face-to-face interview, as this adds to the reliability and
validity of the research. The interview lasted approximately one hour and was recorded
with a memo recorder. By recording the interview the focus could be on the collection of
data and no time was wasted on writing down answers. Recording the interviews is
important for the reliability of the research. During the interview, the structure of the
variables list acted as a basis and guide for the interview (see next paragraph). At the end of
the interview, the recordings were transferred onto the computer to serve as a backup.
Next to the interviews, some EDs offered a tour though the ED as complementary to the
interview. The tour through the ED, if possible within the time frame, was not recorded
due to potential interaction with other technology and privacy concerns. Information of
the tour in the ED was written down afterwards in the form of bullet points and was used
as background information for the research itself.
The type of interviews in this qualitative research was a combination of face-to-face semi-
structured and face-to-face in-depth interviews. As mentioned in section 3.3, the nature of
the central research question requires descriptive, exploratory and explanatory information
expressed in words, as well as a flexible method of data collection. Interviews have the
capabilities and tools to accomplish this.
Semi-structured interviews allow the interviewer to deviate from the variables list in order
to get the specific information needed in more detail or more concrete terms. In-depth
Figure 4: Method of data collection

Femke Lammerts and Elisa van Poelgeest, MSc 19, January 2012
19
interviews have an exploratory and explanatory function. The combination of the two
contributes to ensuring all aspects of the variable list are covered (Saunders, 2007) and the
central research question and twelve sub-research questions can be answered. Interviews
were conducted in Dutch, as this is the language used at most EDs. To conduct the
interviews in English would have hampered the process. Observation by the two
researchers of this paper during their visit to the ED was considered as supplementary.
Observation allows the information given by the interviewees to be verified by the
interviewers and can also be seen as an additional reason for a face-to-face interview.
Observation for a longer period of time in a specific area of the ED was not recommended
due to privacy concerns and the feasibility of receiving permission to conduct a prolonged
observation.
Questionnaires or surveys were not considered as options for data collection, as these
methods limit the quantity of information that can be collected. These methods are too
restrictive when descriptive, exploratory and explanatory information is needed to reach a
conclusion (Saunders, 2007). Also, questionnaires and surveys are the slowest way of data
collection and respondents may not fill in all the fields (Staff, 2011). The interviews had to
be completed within three weeks, so time was scarce. Telephone interviews were not a
preferred option, as they make the collection of data less reliable and valid (Saunders,
2007). This is also why face-to-face and observation criteria were considered important in
the method of data collection.
During the interview, the list of variables was used as a guide throughout the interview.
The list of variables has the same structure and sequence as the conceptual model and was
derived from the literature (see chapter 4). Using the same structure throughout the
research, facilitates the sorting of data. The interview questions are in the form of bullet
points and not written out in full, this with a view to optimizing the flexibility of the
collection of data. It is easier to deviate from bullet points than questions written out in
full, which is important for the descriptive, exploratory and explanatory information
needed to answer the central research question and the twelve sub-research questions (see
3.2 and 3.3). The list of variables can be found in appendix I in the confidential booklet.
In summary, a combination of face-to-face semi-structured and in-depth interviews was
conducted at twelve different EDs. The next section will elaborate on the analysis of the
data.

Femke Lammerts and Elisa van Poelgeest, MSc 19, January 2012
20
3.6 Analysis
This section will discuss the approach of the qualitative research
analysis. Figure 5 on the left shows a summary of the analysis
process.
After each interview the recordings were transferred to the computer
as a backup. Each interview recording was re-played and digitally
summarized in Dutch. The reason for digitally summarizing the
recordings was to obtain a quick overview of the most important
data and save time compared to writing out summaries by hand. The
summaries were written in Dutch, as the vast amount of text could
affect reliability if translated into English.
For the analysis of the results, the matrix method was used. Matrix
methods are often used in qualitative research for interviews with no
follow-ups. The matrix can distinguish two elements on the horizontal and vertical cells
and can interlink them (Groenland & Jansen, 2010). In this research the two elements were
the codes of the hospitals visited (horizontal) and vertically the variables. The information
from the digital summaries of the interviews was transferred using the matrix method. An
example of this matrix can be found in appendix III of the confidential booklet. It was
opted to use Excel, as less can go wrong when copying information from the digital
summary into Excel compared to handwritten matrices. Also, transferring data between
digital systems is quicker than transferring handwritten data. The matrix in Excel followed
the same structure as the conceptual model, as using a uniform structure is easier for the
researcher to work with, as well as for the readers to interpret. The information was copied
into the matrix in the Dutch language and then transferred to English. Translating from
Dutch to English can have an effect on the reliability of the data, however the quantity of
text was limited thus the chance of misinterpretation is minimized. The data was then
written out per variable in the results chapter. The same structure as the conceptual model
was used in the results chapter: the vast amount of information gathered would not
therefore be confusing to the readers. In the results, quotes were used from the digital
summaries as a foundation for the results and tables were developed functioning as actual
textual elements. By so doing, readers can opt to read either of the two. Quotes from the
digital summaries of the interviews were given an alphabetical reference immediately, so its
Figure 5: Analysis process

Femke Lammerts and Elisa van Poelgeest, MSc 19, January 2012
21
origin would be clear. However, these quotes, due to privacy reasons, were labeled from A-
L (as stated in 3.3) and thus referenced in the same way. The results of the interviews and
the information of the theoretical framework are integrated in the analysis, as this supports
the final conclusion and recommendations (Miles, 1994). In the analysis, the hypotheses
from the theoretical framework are validated with information from both the literature and
the interviews or either of the two, if possible. The hypotheses that cannot be clearly
validated are used as recommendations for further research. All the information and data
from the theoretical framework, results and analysis are integrated to answer the central
research question and the twelve sub-research questions in the conclusion.
In conclusion, analysis is done by transferring the recordings into digital summaries and
then transposing them into a matrix in Excel. The written results are combined with quotes
and the tables function as a quick overview and summary of the results. The conceptual
model structure is used to create a coherent and comprehensive paper. The next section
discusses the reliability and validity.
3.7 Reliability and validity
In this section the reliability and validity are discussed.
The list of variables was developed by data in literature researched in the pre-investigation.
Scientific and academic databases used for the literature research, like EBSCO and
PubMed. This makes the list of variables reliable and valid as it is based on prior research
published in scientific and academic databases.
The number of respondents is twelve. As mentioned in section 3.4, the sample size is seen
as valid by research when the number of interviews is between 10-20, or exceeding.
Conducting twelve interviews is therefore a correct number, according to literature
research, to validate this research. If the time for conducting interviews would not have
been as limited, as well as more willingness to co-operate by the different EDs, more
interviews could have been conducted for a higher validity.
The profile of the interviewees was similar in education and current function. By selecting
similar interviewees’ profiles, it can be assumed that the knowledge of the organization is
similar as well as the level education of the interviewees. This has a positive effect on the
overall reliability and completeness of the answers, as well as the understanding of the
questions posed during the interview. Data collection, in the phase of conducting the

Femke Lammerts and Elisa van Poelgeest, MSc 19, January 2012
22
interviews, was performed in Dutch. This makes the data obtained from the interviewees
more valid and reliable as Dutch is the leading language in an ED. Collecting the data in
Dutch also made it easier for the possibility to ask in-depth questions. However, as English
is the obligatory language for this research, the data was translated into English in the
matrix. This could have affected the validity of the data.
The data for this research was collected in twelve different EDs, in twelve different
hospitals throughout the Netherlands. Collecting data at different locations makes the data
better comparable with each other and more generalizable, as the variables are answered
twelve times in different situations. Moreover, the chance of bias is reduced by not
collecting data solely in one organization, making the collected data more reliable.
However, it must be taken into account that interviewees could have given social desirable
answers, due to for example not wanting to provide certain information or turning certain
information in such a way that it is presented better than the actual situation at the
moment. Also, not all interviewees were able to give the full data needed for certain
variables, as they were not entirely familiar in certain areas. Both reasons mentioned can
reduce the reliability of the data, as completeness of the data is reduced.
Data was collected in the same manner throughout the interviews, making the method of
data collection more reliable. The variables list was used as a guide through the interviews
and additional in-depth information was derived by posing specific questions. Data
collected from the interviewees was therefore quite broad and only specific parts had to be
selected to obtain the information needed to attain an answer on the different variables.
This selection process was done as cautious as possible. However, it must be taken into
account that in this process data loss could have taken place. Semi-structured interviews
allowed for answers to be compared more easily, thus increasing the reliability of the
comparison. Also, face-to-face interviews increase the validity and reliability of the answers
during the interviews. Observation of the situation at the ED contributes to this.
Data was recorded by means of a memo recorder and the two researchers of this paper
were always present at the interview. In this way the loss of data was reduced and digital
summaries could be made more accurately. Both reasons add to the reliability of the data.
The matrix method used in the analysis is a reliable and valid analyzing method when
having conducted interviews. This method provided a short and clear overview of the data
collected, in order to easily and reliably compare the data. The translation of the Dutch

Femke Lammerts and Elisa van Poelgeest, MSc 19, January 2012
23
language into English when data was transferred to the matrix, might have affected its
validity.
The following section will discuss the operational conceptual model.
3.8 Operational conceptual model
Figure 6 below shows the operational conceptual model. The operational conceptual model
is comprised of the conceptual model as illustrated in chapter 2, with the methodology
integrated in it. This model functions as a quick and brief overview of the methodology,
indicated in orange.
Figure 6: Operational conceptual model

Femke Lammerts and Elisa van Poelgeest, MSc 19, January 2012
24
4. Theoretical framework
4.1 Introduction
The theoretical framework is part of the theoretical path in this research, as illustrated in
figure 2 in the methodology (chapter 3). In this chapter, each of the seven variables in the
conceptual framework (chapter 2) will be researched via the available literature. Definitions
will be explained, as well as the foundation for the seven variables. The theoretical
framework was written with the central research question and the twelve sub-research
questions in mind.
The structure of this chapter is as follows. The theoretical framework consists of five
sections. The first section is the introduction, as presented here. The second section will
elaborate on the definitions and characterizations of an emergency department, followed by
the third section on relations between efficiency and optimization. The fourth section will
present the different variables that influence the efficiency of the emergency department.
This section consists of the seven sub-sections, in which the seven variables as mentioned
in the conceptual model (chapter 2) are discussed; infrastructure, technology, service,
employees, logistics, financial system and patient satisfaction. The last section will give an
overview of the hypotheses that are deduced from the literature.
Each section will be introduced showing a highlighted area of the conceptual model,
indicating the variable that is being discussed and thus sustaining a clear structure. All
sections will start with an introduction, explaining the relevance of the section to the
central research question and one or more of the sub-research questions. Each of the seven
variables will end with a short conclusion and a hypothesis derived from that sub-chapter.
These hypotheses will be further elaborated on in the results and analysis (chapter 5).
Several abbreviations will be used throughout the paper for the sake of brevity and
efficiency. These abbreviations will be expressed in full in the sub-chapter introductions.
An explanatory list of these abbreviations can be found in appendix IV.
Femke Lammerts and Elisa van Poelgeest, MSc 19, January 2012
25
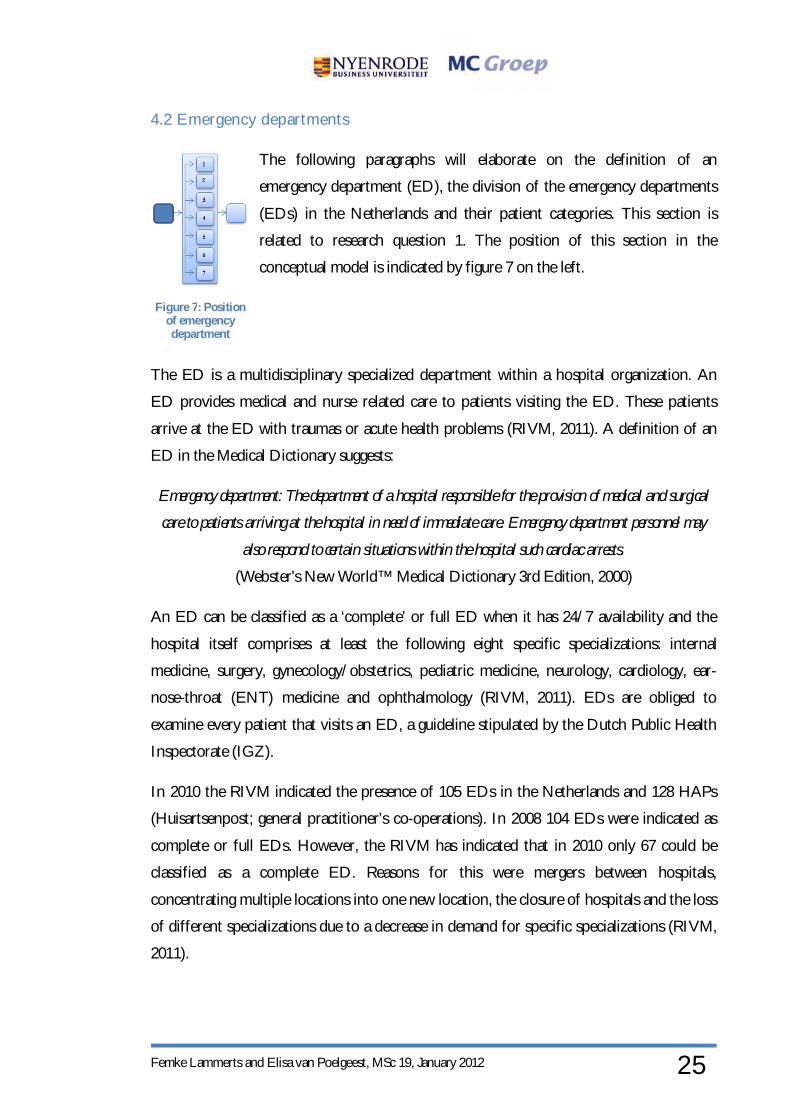
4.2 Emergency departments
The following paragraphs will elaborate on the definition of an
emergency department (ED), the division of the emergency departments
(EDs) in the Netherlands and their patient categories. This section is
related to research question 1. The position of this section in the
conceptual model is indicated by figure 7 on the left.
The ED is a multidisciplinary specialized department within a hospital organization. An
ED provides medical and nurse related care to patients visiting the ED. These patients
arrive at the ED with traumas or acute health problems (RIVM, 2011). A definition of an
ED in the Medical Dictionary suggests:
Emergency department: The department of a hospital responsible for the provision of medical and surgical
care to patients arriving at the hospital in need of immediate care. Emergency department personnel may
also respond to certain situations within the hospital such cardiac arrests.
(Webster's New World™ Medical Dictionary 3rd Edition, 2000)
An ED can be classified as a ‘complete’ or full ED when it has 24/7 availability and the
hospital itself comprises at least the following eight specific specializations: internal
medicine, surgery, gynecology/obstetrics, pediatric medicine, neurology, cardiology, ear-
nose-throat (ENT) medicine and ophthalmology (RIVM, 2011). EDs are obliged to
examine every patient that visits an ED, a guideline stipulated by the Dutch Public Health
Inspectorate (IGZ).
In 2010 the RIVM indicated the presence of 105 EDs in the Netherlands and 128 HAPs
(Huisartsenpost; general practitioner’s co-operations). In 2008 104 EDs were indicated as
complete or full EDs. However, the RIVM has indicated that in 2010 only 67 could be
classified as a complete ED. Reasons for this were mergers between hospitals,
concentrating multiple locations into one new location, the closure of hospitals and the loss
of different specializations due to a decrease in demand for specific specializations (RIVM,
2011).
Figure 7: Position of emergency department

Femke Lammerts and Elisa van Poelgeest, MSc 19, January 2012
26
Research indicates that many health problems can be treated by the HAP rather than the
ED. Therefore, EDs and HAPs are now trying to enhance their co-operation and work
together. By setting the HAPs as primary caregivers for patients, this could make acute care
more effective as non-urgent patients can be redirected to more suitable locations to
receive care (RIVM, CBS, VHN, 2011). A detailed map of the location of EDs and the
HAPs can be found in appendix V.
Patients visiting the ED can be divided into the following categories:
Self-referrals
Patients referred by their general practitioner (GP)
Patients under treatment of a specialist
Patients who arrive by ambulance
Patients referred by others
Patients that have in the past visited the ED and come back for a back-up check
(Nederlandse Vereniging Spoedeisende Hulp Verpleegkundigen, 2005)
Annually, EDs in the Netherlands receive around 1.8 million patients. Approximately 20%
of these patients are admitted to the hospital, 45% return for a follow-up, 30% return
home with an appointment for the outpatient clinic, 15% receive subsequent treatment by
their GP and 33% return home without any further follow-up. In general, 45% of the
patients visiting the ED are self-referrals, 28% are referred by the GP and 7% arrive by
ambulance. Nearly 29% of the self-referrals visit the ED with no necessity for acute care
and are therefore considered as being in the wrong location (RVZ, 2003). However, these
percentages are not applicable to every hospital as they are general numbers. It is clear that
hospitals in the north and east of the Netherlands have a different ratio in self-referrals
than hospitals in the west, central Holland and in the cities (RVZ, 2003).
In conclusion, the ED is a specialized department within a hospital providing medical care
to trauma or acute patients visiting the ED. In the Netherlands 67 ‘complete’ EDs have
been identified. Co-operation between the ED and HAP can redirect patients to more
suitable locations for non-urgent patients.

Femke Lammerts and Elisa van Poelgeest, MSc 19, January 2012
27
4.3 Efficiency and optimization
Efficiency and optimization are terms used in the central research
question and throughout this research paper. The relevance of this
section lies in the importance of defining both terms properly, in order to
use them correctly in this research paper to arrive at a conclusion. This
section will provide the definitions of both terms and their relation to
each other. Research questions 2, 3 and 4 are applicable. Figure 8 on the
left shows the position of this section in the conceptual model.
4.3.1 Efficiency
Literature identifies many definitions of efficiency. The business dictionary defines
efficiency as “The comparison of what is actually produced or performed with what can be achieved with
the same consumption of resources (money, time, labor, etc.). It is an important factor in the determination
of productivity” (Business Dictionary, 2011). Efficiency is also referred to the ‘how’ of
operations and looks at inward processes, thus questioning whether the work is relevant,
correct and delivered in the right way to achieve the strategic outcomes (Hubbell, 2007).
Efficiency is geared towards individual processes within a system, stated in the literature as
variables. Definitions of efficiency related to healthcare are mostly cost or process oriented.
In health care cost models, efficiency is defined as; the weighted sum of outputs for
hospital A divided by the weighted sum of input by hospital A (Fulton, Lasdon, McDaniel
Jr., & Nicholas, 2008). Palmer and Torgerson define efficiency in healthcare as “health care
resources that are used to get the best value for money” (Palmer & Torgerson, 1999). The United
States Government Accountability Office defines efficiency as “providing and ordering a level of
services that is sufficient to meet patients’ health care needs, but not excessive, given a patient’s health
status” (McGlynn & Shekelle, 2008).
Combining the definitions above, the following definition of efficiency in healthcare can be
developed:
“Efficiency is to provide and order a level of service that is sufficient to meet the patients’ health-care needs,
where operations and processes are questioned on their relevance to achieve the strategic outcomes and where
the health-care resources are used in such a way as to get the best value for money”
Figure 8: Position of efficiency and
optimization
Femke Lammerts and Elisa van Poelgeest, MSc 19, January 2012
28
4.3.2 Optimization
Optimization in general is defined as “Finding an alternative with the most cost effective or highest
achievable performance under the given constraints, by maximizing desired factors and minimizing
undesired ones. Practice of optimization is restricted by the lack of full information, and the lack of time to
evaluate what information is available” (Business Dictionary, 2011). Optimization aims to
improve or solve the identified problems in order to improve and maximize healthcare
services in the following areas in the best way: planning, delivery and management (Rais &
Viana, 2011). In an optimization process, the goal is to design a system or process as
functional and perfect as possible and the focus should be on the application of resources
and balancing the individual areas in healthcare. Continuous improvement is important as
healthcare is a dynamic setting and it is seen as the progress towards optimization (Wayne,
2008).
4.3.3 Relation between efficiency and optimization
Efficiency and optimization are interrelated. Efficiency can be seen as the steps to achieve
an optimum situation. Optimization refers to the best possible way in which a system or
process can be designed, in which the focus should be on the application of resources and
balancing the individual areas in healthcare (Wayne, 2008). In efficiency, the individual
processes are questioned on their relevance and improved or changed to improve their
efficiency. By continuously improving and redesigning the efficiency of the system and its
individual processes, progress is made towards an optimal situation (Wayne, 2008)
(Hubbell, 2007).
In conclusion, optimization can thus be achieved by making the system and its individual
processes as efficient as possible, depending on the timeframe and possibilities of a
particular organization.
4.4 The seven variables
Based on the literature, seven different variables have been identified as having
an effect on the efficiency of an emergency department (ED); infrastructure,
technology, service, employees, logistics, finance and patient satisfaction. The
seven variables will be discussed further individually in the following sub-
section, as will their contribution to the efficiency of an emergency department
(ED). These seven variables are related to research questions 6-12. Figure 9
indicates the position of this section in the conceptual model. Figure 9:
Position of the seven variables

Femke Lammerts and Elisa van Poelgeest, MSc 19, January 2012
29
4.4.1 Infrastructure
The first of the seven variables that contributes to an efficient emergency
department (ED) is infrastructure. Infrastructure includes the sub-variables
layout of the ED and the Huisartsenpost (HAP; general practitioner’s co-
operation). Research question six is applicable here. Figure 10 indicates the
position of this section in the conceptual model.
4.4.1.1 Emergency department layout
The layout of an emergency department(ED) has an effect on the long-term success of its
optimization. This will be further explained in the following paragraphs.
Overcrowding is a major problem worldwide. It has been stated that building a new state
of the art ED or increasing personnel will not solve all the problems as the ED must first
identify and investigate the bottlenecks in its processes. Internal reasons for overcrowding
can be ED boarding1, inefficient registration and discharge processes. External factors can
be limited access to primary care, uninsured people and a growing ageing population
(Toledo Business Journal , 2009) (Harking, 2011). However, overcrowding not only affects
the ED but also the input (community), throughput (ED) and output (hospital). Problems
in all three elements must be identified and addressed to achieve improvement in
overcrowding (Jarousse, 2011).
Generally speaking, different notions have been expressed in research as to the physical
layout of an ED (Przybylowski Jr., 2010). Below are some examples.
The ED should provide a safe and welcome setting. The first impression is important and
will determine the whole ED visit experience (Greene, 2002). Green, blue and natural
materials used for the interior seem to have a positive effect on the patient’s experience of
an ED visit (Straczynski, 2011). Also accessibility and parking at the ED play a role in
patient satisfaction (Jarousse, 2011). Safety is important, and examples are in the form of
closed-off doors and security. Registration normally takes place at the entrance to the ED,
however bedside registration through an electronic device (e.g. iPad) is on the increase in
1 Boarding: when a patient remains in the emergency department after the patient has been admitted to the facility, but has not been transferred to an inpatient unit.
Figure 10: Position infrastructure
variable

Femke Lammerts and Elisa van Poelgeest, MSc 19, January 2012
30
order to save space in the waiting-room and speed up the registration process (Greene,
2002).
Waiting-rooms benefit from having a television, internet access (throughout the ED),
refreshment facilities, games and reading material to keep the waiting patients and family
satisfied and calm (Zilm, 2003) (Romano, 2003). Questionable in research is whether to use
rows of chairs for safety reasons, or make the waiting-room more attractive by adding a
different kind of seating configuration (Greene, 2002).
The corridors and treatment rooms must be spacious (Toledo Business Journal , 2009).
Lighting must preferably consist of natural light or indirect lighting. Attention must be paid
to a quiet environment and good lighting (Wolf, 2010). The most important rooms for
urgent care must be placed near the ambulance entrance (Peck, 2011). The materials for
ceiling, wall and floor must be easy to clean. Walls must contain sound insulation to reduce
noise (Peck, 2011). It is important to prioritize what has to be an essential part of the
clinical area (center) and the outside (periphery).
To create visibility and a good overview of the ED, the ballroom layout is recommended.
The ballroom setting means that the central nursing station is placed in the middle, with the
treatment rooms around it. This is beneficial to both patients and staff; easily accessible
and close proximity (Zilm, 2003). However, research has indicated that when the number
of treatment rooms exceeds 18, the ballroom setting is no longer effective. In the latter
case, either the ballroom setting should be duplicated and two ballroom areas created, or
the EDs should investigate linear units. In the linear setting the rooms are situated in
parallel rows to make the area more ’expandable’. Also, less space is needed and the
effective walking time for staff is 25% less than that for a ballroom setting. The linear
setting is also compared to the shape of a thermometer, where patients are positioned
according to quiet and busy periods (Zilm, 2003). The central nursing desk would benefit
from partly glass covered surroundings. This creates an overview for the staff and patients
and is sound-isolating (Carolina, 2010). A digital board at the central desk in the ED is
recommended as it gives an overview of the situation within the ED itself: “With the white
board you didn't know the department was getting crowded until it was crowded” (Greene, 2002).
Uniform treatment rooms create flexibility as to their use. Treatment rooms can be geared
towards specific health issues. However, the treatment room can also be transformed into a
universal treatment room (Greene, 2002). To increase patient privacy and flexibility in

Femke Lammerts and Elisa van Poelgeest, MSc 19, January 2012
31
visualizing the patient, (sliding) doors with curtains are advised. Treatment rooms should
be separated from each other by means of walls to increase patient privacy (Peck, 2011), as
well as to reduce the risk of infection. For privacy reasons, most rooms should be single
patient rooms. This also reduces the risk of wrong medication, incorrect treatment, cross-
contamination, faulty follow-up or staff injury (Sprague, 2007). Semi-individual rooms,
especially for orthopedic and geriatric patients, can have a therapeutic function and are
therefore to be preferred over single rooms (Sprague, 2007). For efficiency purposes, the
treatment rooms should only contain essential supplies. The use of mobile carts for other
supplies is recommended (Przybylowski Jr., 2010). Other research suggests keeping stocks
of supplies and medicines in each treatment room to save treatment time (Wolf, 2010).
Important information or graphics should be placed on the left or right wall from the bed
so the patient can see it, rather than behind the bed, with the bed placed in the middle
(Carolina, 2010). Indirect lighting is recommended, also above the bed. A flexible arm with
diagnostic light should also be present (Peck, 2011). A sink and a built-in garbage box must
be included for hygienic reasons (Sprague, 2007). Questionable in research is whether or
not to place a telephone and/or television in the single patient rooms (Romano, 2003).
A distinction between high-care and low-care patients must be made. High-care patients
should be situated in the core of the ED, low-care patients must be located peripherally.
The latter do not necessarily need a bed in which to wait; a waiting-room also suffices: “We
recognized that not all ED patients are sick enough to require beds the entire time they are there”
(Przybylowski Jr., 2010). For non-urgent patients, the PDQ theory (Physician Directing
Queuing) can be used, whereby patients are divided into needing (additional) diagnostic
testing and not needing it (Przybylowski Jr., 2010). The first group can undergo diagnostic
tests and wait in a special waiting-room for the results; the latter can be treated in the
peripheral treatment rooms and then discharged. There should be a sufficient number of
fit-for purpose waiting-rooms in the ED, located adjacent to the main arrival waiting-room.
An important premise as part of the process in an ED is that treatment rooms should not
be used as waiting-rooms (Przybylowski Jr., 2010). An example of this layout can be found
in appendix VI.
For non-urgent patients a fast track or a RADIT program (Rapid Assessment and
Discharge In Triage) could improve patient satisfaction and reduce waiting times. The
RADIT program was designed to be used in peak times, generally stated as being between
2 pm and 10.30 pm. Non-urgent patients do not need to use a treatment room, but will be

Femke Lammerts and Elisa van Poelgeest, MSc 19, January 2012
32
provided with screening, examination and a diagnosis in the specifically designed RADIT
area. If simple diagnostic tests are needed, patients can wait in the RADIT treatment area
for the results. The RADIT has been stated to achieve a 98% satisfaction rate among
patients (Vega, 2007).
Depending on investment opportunities and the availability or otherwise (lack) of specific
employees, the preferred location for diagnostic imaging would be located in or adjacent to
the ED for optimal efficiency: “The best of both worlds is to have the hospital's radiology department
just eight feet across a corridor from the ED so you can share staff” (Greene, 2002). The same applies
for lab facilities (Przybylowski Jr., 2010). Due to the frequent requests for X-rays, a mobile
X-ray device could be useful (Greene, 2002). Non-urgent patients should not wait for
transport, but walk to the diagnostic test rooms themselves: ‘We move less-sick patients through
the system a lot faster’ (Harking, 2011). Digital information systems let physician’s access
patient information also outside the ED, thus making this process more efficient (Zilm,
2003).
Concluding, the ED layout affects the long-term success of its processes. To avoid
overcrowding it is desirable to have the correct layout. In order to create visibility and a
good overview of the ED, the ballroom layout is recommended. To improve the process,
diagnostics should be located within or next to the ED for optimal efficiency. Further
literature recommends making a distinction between urgent or high-care patients and non-
urgent patients. High-care patients should be located around the nursing station and non-
urgent patients can follow the RADIT program.
The following hypothesis can be formulated, based on the literature in the section above:
Hypothesis 1: the layout of the ED affects the long-term success of its processes.
4.4.1.2 The Huisartsenpost
This section elaborates on the function of the HAP (Huisartsenpost) and its co-operation
with the emergency department (ED). This has an influence on the efficiency of the
processes and procedures in an ED.
The Dutch term HAP refers to a Huisartsenpost. A HAP is a center in, next to or located
outside the premises of an ED. General practitioner’s co-operate together in a center to
provide care outside working hours. In the literature a HAP is often translated as ‘out-of-

Femke Lammerts and Elisa van Poelgeest, MSc 19, January 2012
33
hours general practitioners’, ‘general practitioner’s organization’, a ‘general practitioners co-
operation or the function of a GP in the ED as PCP (primary care provider) (Chew-
Graham, 2004) (Winters, 2009) (Philips, 2010). The following quote defines that a HAP is
available outside working hours for urgent medical care that cannot wait till the next
day:“Huisartsenposten zijn er voor acute vragen van patiënten buiten kantooruren en bieden medische zorg
die niet kan wachten tot de volgende werkdag” (Gijsen, 2010). During the day the patient can visit
his/her own GP or one nearby. After working hours and in the weekend patients can visit
a HAP for less urgent medical care. The standard procedure for a patient is to call the
regional HAP number, after which a secretary or assistant will triage the patient by
telephone. For this triage the NHG2 guidelines are used, which are almost identical to the
NTS system (see 4.4.5.1; triage systems). The urgency code determines whether a visit to
the HAP is required (NHG, 2010) (Gijsen, 2010).
Integration and co-operation between a HAP and ED is seen as an important factor for the
solution of the overcrowding in EDs and its provisions. Overcrowding is mainly caused by
non-urgent patients, accounting for 40% of the ED visits that could actually be seen by a
GP (Van Uden, 2004). Dutch research on the integration of HAPs and EDs in the
Netherlands concluded the following: “There was a shift of more than fifteen percent from secondary
care to primary care for emergency consultations and waiting/consultation times were shortened by more
than ten percent” (Kool, 2008). Research also stated that just over 25% of the patients
presenting themselves at the GP have unspecified problems and questions about
medication. Dutch health policy-makers believe that improvements in the efficiency and
quality of care at a lower cost occur when HAPs and EDs are integrated and collaborate
well with each other (Moll, 2007). Research also questions the need for the ED, ambulance
and HAP to be active during hours when few patients make use of it due to inefficiencies
and costs (Giesen, 2006). Three main advantages of a HAP are: ED diversion to alternative
care, care co-ordination to reduce the use of EDs and the accessibility of services (need to
create awareness for this) (Harking, 2011): “Reducing inappropriate and unplanned hospital
admissions enables services to work at optimum efficiency. This helps to ensure that the patients who truly
need these services are seen as quickly as possible” (Winters, 2009).
Advantages of good co-operation between the HAP and ED lie in the ‘redirection’ of
patients. The discrepancy lies in the perception by clinical staff read healthcare
professionals and patients as to what is ‘urgent’ (24% of self-referred patients think they
2 NHG: Nederlandse Huisartsen Genootschap
Femke Lammerts and Elisa van Poelgeest, MSc 19, January 2012
34
need diagnostic tests). This discrepancy in perception impacts on the use of the ED and
can be dealt with by good co-operation between the HAP and ED as well as the provision
of good information to the patient on the specific tasks of the healthcare services.
Information should include the availability of GPs, costs and explanatory texts as to the
lack of the need for diagnostic tests in the case of many injuries (Philips, 2010) (Gill, 1996)
(Lowe, 1997). Research suggests that the co-operation between HAP and ED could reduce
costs and increase effective care. However it has not been substantiated that co-operation
substantially reduces the total number of patients visiting the ED (Philips, 2010).
Redirection to a HAP, located in an ED, on or offsite of the hospital complex, is
considered effective as many patients visit the ED for non-urgent care. However, this is
only effective when the care needed by non-urgent patients can be done by a GP, without
the involvement of the facilities or staff of an ED. The location of the HAP in accordance
with the ED is not as important as the communication between the two (Harking, 2011).
Speed and convenience are also factors that determine whether to visit the ED or HAP
(Moll, 2007).
In conclusion, by integrating the HAP with the ED, efficiency improves and the quality of
care can be performed at a lower cost. There are several advantages when they both co-
operate well. The most important advantage can be found in the redirection of patients
from the ED to the HAP. It is more effective as many patients visiting the ED are non-
urgent patients, which can be treated by a GP. As such, the following hypothesis can be
formulated:
Hypothesis 2: the integration of a HAP and an ED improves the efficiency and quality of care at a lower
cost.
4.4.2 Technology
This variable consists of 2 factors: software and digitalization. Research
question seven is related to this variable and the figure on the left shows the
position in the conceptual model.
Figure 11: Position technology variable
Femke Lammerts and Elisa van Poelgeest, MSc 19, January 2012
35
4.4.2.1 Software and digitalization of patient data
Digitalization and the incorporation of a hospital-wide uniform system contribute to a
more efficient way of accessing information, improving quality and minimizing medical
errors.
The role of ICT in hospitals has increased over the years. The main reasons for this are the
increasing digitalization processes in hospitals, rising software costs, an increase in the
possibilities and complexity within the different software, increasing integration of hospital
systems, increase in the number of computers, dependence on software and personnel
costs. Software and personnel account for 70% of ICT costs. Internal auditing systems
could monitor and raise an awareness for the increasing costs, as well as lead to the
standardization of the applications and type of software used within hospitals (van
Eekeren, 2011).
Hospitals make use of different software programs. Well known software in the
Netherlands is Chipsoft, SAP, iSoft, Xcare and PACS (digital imaging). The effectiveness
of the software depends on the culture and structure of the ED and specific hospital
(Busca, 2010). The Electronic Patient Record (EPD) is an integral part of this software. In
itself the content is not complex, yet what is is to make all the processes around it
interchangeable and transparent for the different stakeholders. Although the system is
similar in every hospital, the usage method at both macro and micro levels is, as these differ
considerably per hospital. This is what makes integration at a macro and micro level more
complex (van Eekeren, 2011) (Smits, 2010).
Independently of the type of system that is used, research has shown that the usefulness
for the user is more important than the number of functions available in the software
system. Also, the planning and structure of the information must tie in with the structure
of the ED (Busca, 2010). As Busca states in his research: “In short, for a computer application to
be capable of dealing with the complexity of an ED, it must incorporate three elements: operations inside
and outside the service, apply intuitive and multiuser user interfaces, and be able to carry out an efficient
management of data at the macro, meso and micro levels” (Busca, 2010). Making use of information
and communication technology has also been stated to improve the professional
development of health professionals (Mugisha, 2009).
The effect of ICT and digitalization is thought to have a major impact. The benefits will
Femke Lammerts and Elisa van Poelgeest, MSc 19, January 2012
36
only become apparent if the different software systems are incorporated in a systematic
form, this in contrast to many hospitals worldwide. The benefits of a systematic
incorporation are: more effective and rapid healthcare, accessibility of information, shift to
evidence based medical care, improvement of the quality of patient care, a reduction in
duplication and minimizing medical errors (Anvari, 2007). Research has shown that a
paperless environment can reduce transcription by 65% and charting by 85% (Hancock,
2000). Besides, a full digital system results in greater and more efficient documentation of
the patients’ data and results (Elder, 2010).
Failure or less effective usage of a digital system lies in the lack of user focus, as the usage
by different professionals can have an adverse effect on its supportive role in clinical work
(Koch, 2003). In addition, some systems are less compatible with each other. Diagnostic
imaging is one that is frequently referred to. Research has also revealed that more
documentation can have a negative impact on the communication of new information and
results to the patient. A sound structure and a systematic approach are vital (Elder, 2010).
In summary, the role and costs of ICT within the health sector have increased due to
different factors. The effectiveness of the software that the hospital uses depends on the
structure and culture of the ED and the hospital itself. By using information and
communication technology, improvements in professional development can be measured.
To create these benefits, the system should be incorporated throughout the hospital.
Based on the literature above, the following hypothesis can be derived:
Hypothesis 3: digitalization of patient data has both a positive and negative effect on the processes in the
ED.
4.4.3 Service
The third variable is service; this comprises on the one hand patient
satisfaction and on the other quality of management and performance
indicators. The patient satisfaction aspect of service will be dealt with in
sub-chapter 7 (Patient satisfaction, variable 7). This sub-chapter on
service focuses on the quality and performance indicators needed to
maintain the standards of healthcare and compare these with each other
in order to improve the processes within the emergency department Figure 12: Position
service variable
Femke Lammerts and Elisa van Poelgeest, MSc 19, January 2012
37
(ED). Service relates to research question eight and the position of the service variable is
indicated in figure 12 above.
4.4.3.1 Quality and performance indicators
Quality and performance indicators may have an effect on efficiency when comparing
different emergency departments (EDs), but only when these indicators are standardized
among all EDs in the Netherlands.
“Quality: the degree to which health services for individuals and populations increase the likelihood of
desired health outcomes and are consistent with current professional knowledge” (El Sayed, 2011).
Measuring the quality of care and performance in an ED is complex, as it is influenced by
many different factors. The need for higher quality at lower costs and improved patient
care co-ordination makes it important to continuously monitor processes and their
effectiveness, as well as develop and improve quality programs. Quality measurement and
performance indicators must be “[…] evidence-based performance indicators that can be nationally
standardized so that statewide and national comparisons can be made” (El Sayed, 2011). Evidence-
based indicators are also important to measure the effectiveness of the ED system,
especially patient outcomes and clinical conditions. The aim of quality management is the
improvement of the ED unit and patient satisfaction. Evaluation and comparison of quality
is challenging due to the lack of integration of the system, lack of uniformity in the
collection of data, lack of consensus on performance indicators and the lack of agreement
in the assessment of its validity (Sobo, 2001) (Spaite, 1995). Specific training on quality
management implementation is therefore advisable, for management and ED staff alike
(Dellifrane, 2010). The level of quality and efficiency in the ED on weekdays or weekends
may vary. Some research suggests an increase of quality and efficiency in the weekends;
some show a decrease at the weekend. Reasons for this vary from the availability role of an
ED to staff expertise. Geographical location, patient ethnicity and patient categories play a
role in this (Miro, 2004). Quality measurement can be divided into three levels (Laffel,
1989) (Berwick, 1980):
1. Quality Assurance: inspection of services by internal and external parties
2. Continuous Quality Improvement: continuous improvement through set programs,
guidelines and communication
3. Total Quality Management: quality improvement and the use of quality indicators
Femke Lammerts and Elisa van Poelgeest, MSc 19, January 2012
38
by front line-workers, as well as effective and committed leadership
The goal of quality indicators is transparency and measurability of the quality in healthcare.
The outcomes can be used to profile an organization or institute or improve quality. The
supervision and monitoring of healthcare quality indicators in the Netherlands is the
responsibility of the IGZ, the Dutch Healthcare Inspectiorate. The IGZ publishes an
annual report, per healthcare sector, on the quality indicators for the forthcoming year.
Quality indicators in healthcare lack transparency, validity, uniformity and could not
therefore be compared with each other at national level.. The IGZ collaborates with the
parties it monitors and as from 2007 also co-operates with ‘Zichtbare Zorg’ (transparent
healthcare). The latter started a program on transparent healthcare in 2007 and will as from
2013 be known as the quality institute and all healthcare sectors will be responsible for
developing and maintaining quality indicators (IGZ, 2011) (Zichtbare Zorg, 2011).
The report on basic quality indicators 2012, states that emergency processes, as in ED, do
not have their own set of quality indicators (IGZ, 2011). An ED in the Netherlands has to
comply with the Kwaliteitswet Zorginstellingen (quality law re healthcare organizations).
Three main pointers in this are (1) delivery of responsible healthcare, (2) a clear and sound
policy as well as good communication, co-ordination and a clear division of tasks at all
levels of the organization, (3) monitoring and improving the quality of care and (4)
evaluation and adjustment of the policy (SEH, 2009). Quality management in general can
be done internally and externally. Internally through for instance training, workshops and
peer reviewing. Training among staff both individually and as a team has been proven
effective for the reduction of errors, team behavior and staff attitudes. Communication and
digitalization of data also plays a role. This consequently has effect on the quality of
performance of the ED, as well as patient satisfaction (Morey, 2002). Additionally, staff
should be qualified as ED doctor or ED nurse, according to the guidelines. External quality
management through certification, accreditation and/or visitation. There are certain bodies
that provide this to healthcare organizations. These bodies use quality norms as a basis.
Examples of these bodies are (IGZ, 2011) (Zichtbare Zorg, 2011):
NIAZ (Nederlands Instituut voor Accreditatie in de Zorg): non-mandatory
accreditation of health-care organizations by means of peer review (NIAZ, 2011).
HKZ (Harmonisatie Kwaliteitsbeoordeling in de Zorgsector): develops quality and
safety norms and issues a HKZ certificate if the organization has met the norms. It

Femke Lammerts and Elisa van Poelgeest, MSc 19, January 2012
39
is non-mandatory and is qualified under the international ISO 9001 (HKZ, 2011).
ISO (International Organization for Standardization): the largest standard
development organization in multiple sectors, bridging the public and private
sectors (ISO, 2011).
VMS (Veiligheid Management Systeem): focused on patient safety and reducing the
number of claims submitted by patients to hospitals. There are ten points that are
most effective in increasing patient safety (VMS, 2011).
As from December 31st 2012 all hospitals in the Netherlands must be either accredited or
be in a possession of a VMS certification (VMS, 2011).
In conclusion, measuring the quality of care and performance in an ED is complex. Quality
measurement and performance indicators are conducted in order to improve the ED and
patient satisfaction. However, there is no standardized quality measurement in the ED.
Several institutions are investigating the use of standardized quality indicators in order to
compare various hospitals with each other.
This hypothesis stated below can be derived from the literature above:
Hypothesis 4: standardized performance indicators enhance the quality of the processes of the ED.
4.4.4 Employees
The employees in an emergency department (ED) can contribute to the
efficiency of an ED in different ways, depending on the type of employee.
This sub-chapter will elaborate on emergency department doctors (ED
doctors) and emergency departments nurses (ED nurses), including triage
nurses and nurse practitioners (NPs). Research question nine is applicable
here and figure 13 on the left indicates the position in the conceptual
model.
4.4.4.1 Emergency department doctors
Emergency doctors (ED doctors) have an effect on the efficiency on an emergency
department (ED). The reasons for this will be explained in the following paragraphs.
In recent years, the discussion on the efficiency of ED doctors has been divided. There are
advocates and critics. Some endorse the idea, but criticize the fact that there are not
Figuur 13: Position employee
variable
Femke Lammerts and Elisa van Poelgeest, MSc 19, January 2012
40
sufficient ED doctors available to staff their services. In 2000, a small number of hospitals
in the Netherlands initiated training for ED doctors. To this day, there is still a debate
about the positioning, acceptance and responsibility of an ED doctor. Plexus Medical
Group researched the effectiveness of ED doctors in the Catharina Hospital at Eindhoven.
This was conducted by measuring the speed and number of requested diagnostic tests,
customer focus and medical practices. This research showed that ED doctors are more
effective in treatment time in three of the four urgency categories; thereby resulting in a
faster treatment time. All of this can be explained through the special training for ED
doctors, specially geared towards the situation in EDs. It also means that they can treat the
patients independently without consulting specialists outside the ED. On the other hand,
the doctor’s assistants do need to consult the specialist outside the ED before embarking
on a treatment. This element makes for significant time savings. Furthermore, it has been
shown that ED doctors have less extensive requests for additional diagnostic testing than
the doctor’s assistant, in view of the former’s experience. Therefore, the ED doctors can
save time on the speed and the number of requested diagnostic tests as well in the medical
practice itself (Maas, 2007). However, the advocates of ED doctors do have various
criticisms. The organization determines the quality of the ED and not the type of doctor
(Gans, kathan, ter Maaten, & van Offenbeek, 2008). The purpose of introducing ED
doctors to cut supervision and thus treatment times has not been affected. Moreover, it is
not confirmed that the quality of care performed by an ED doctor is superior to that of a
doctor’s assistant and an ED doctor is considered more a generalist-type doctor compared
to the specialists consulted via an ED (Gans, kathan, ter Maaten, & van Offenbeek, 2008).
Currently, not enough students are graduating to provide every ED with full-time ED
doctors. This poses difficulties in investigating the efficiency of ED doctors in an ED unit.
In conclusion, the opinions as to the effect of an ED doctor on the efficiency in an ED are
very diverse. Those in favor mention time savings in various areas as a benefit, whilst those
against question this. The shortage of ED doctors and their lack of specific training are
making it difficult to validate their effect on the efficiency in the ED.
4.4.4.2 Emergency department nurses, triage nurses and nurse practitioners
The efficiency of an emergency department nurse and triage nurse lies in the coordination
of patient care and their impact on the patient’s peace of mind.
The ED nurse is important in the process of co-ordinating patient care and the

Femke Lammerts and Elisa van Poelgeest, MSc 19, January 2012
41
cooperation with physicians. 88% of all nurses work in hospitals and specialization and
differentiation are becoming increasingly important, also as an ED nurse (Derlet, 2002).
Qualified ED nurses must meet at least the following criteria: finalized the basic education
in nursing, obtained a specialized degree in ER nursing, completed triage training and
regular training on TNCC (Trauma Nursing Core Course), BLAS (Basic and Advanced Life
Support), ENPC (Emergency Nursing Pediatric Course) and the PALS (Pediatric
Advanced Life Support). Maintaining the quality of the ED nurse is done through
registration in the BIG register, the NVSHV (nursing organization), obtaining the above
qualifications and regular training updates and peer reviewing. For the quality of the ED,
there must always be at least one ED nurse present with a qualification in pediatric care
and trauma care (NVSHV, 1996) (NVSHV, 2005) (SEH, 2009).
Literature is questioning whether the ED nurse should be assigned one particular task, as
triage nurse, during certain shifts. In the Netherlands there is not one single specific
method for this; some hospitals assign a specific triage nurse to ensure all the triages are
done in a separate room, some partly by the secretary or fully by an ED nurse in the ED
itself. By not having one single method, it is more difficult to influence waiting times and
turnaround times (SEH, 2009). Nurse triage has been widely adopted in the US and the
UK; however, opinions as to effectiveness vary as per the literature. A triage nurse ensures
that a patient receives the right urgency code and initial assessment. The effect a triage
nurse has on waiting times, especially for urgent categories, is two-fold. Triage nurses do
actually reduce the anxiety and frustration experienced by the patient (George, 1993).
Triage must be started within five minutes after arrival, as this has a positive impact on the
patient who feels he/she is being attended to. Research shows this often increases to 10
minutes, but the extra time taken has not been shown to have a negative impact on the
patient’s satisfaction. In addition, a triage nurse ensures that the patient is treated at the
right level and location, making efficient use of the resources of an ED. A triage nurse is
only effective when triage is the primary focus and is not being delayed by non-primary
responsibilities (Buckles, 1990) (Bailey, 1987) (Neades, 1997).
There are varied opinions about the role of a nurse practitioner, a NP, in an ED. An ED
nurse practitioner (NP) is seen as an efficient element within the setting of non-urgent
patients. NPs can reduce workload, reduce waiting times in the ED, improve patient care,
safety, deal with (difficult) accompanying persons and reduce pressure on junior doctors
(Rao, 1995) (Davies, 1994). The exact function of a NP is not uniform, but research
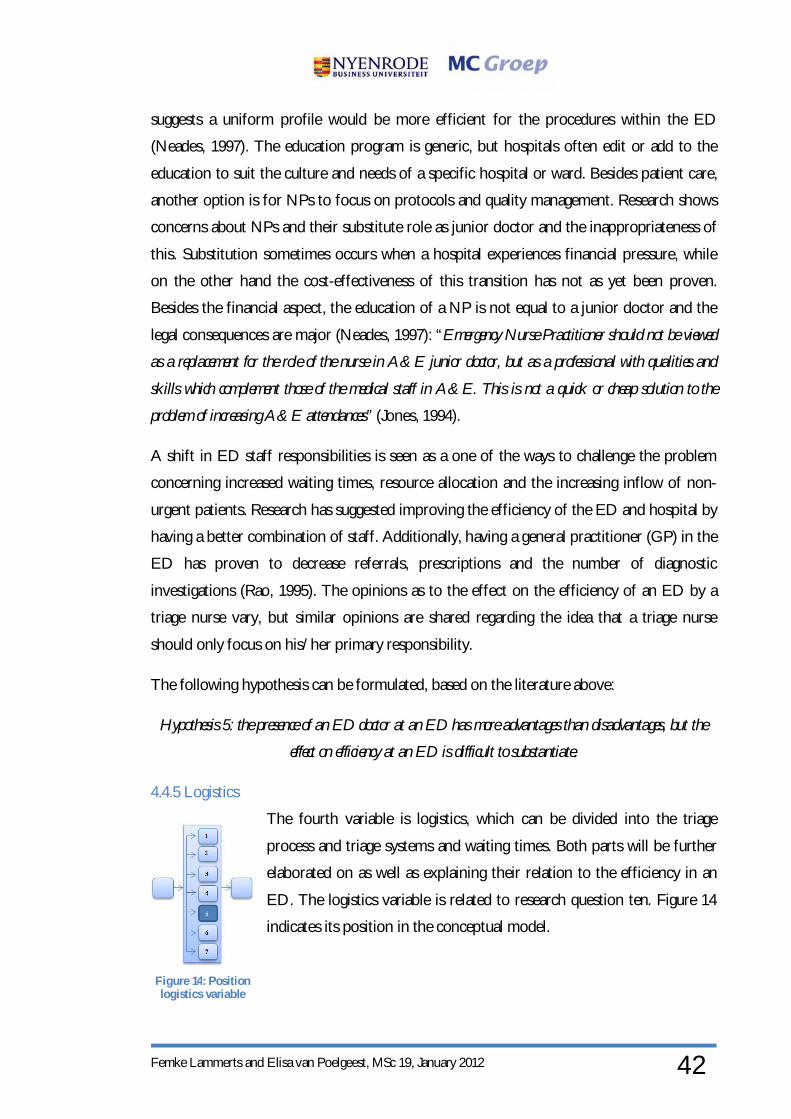
Femke Lammerts and Elisa van Poelgeest, MSc 19, January 2012
42
suggests a uniform profile would be more efficient for the procedures within the ED
(Neades, 1997). The education program is generic, but hospitals often edit or add to the
education to suit the culture and needs of a specific hospital or ward. Besides patient care,
another option is for NPs to focus on protocols and quality management. Research shows
concerns about NPs and their substitute role as junior doctor and the inappropriateness of
this. Substitution sometimes occurs when a hospital experiences financial pressure, while
on the other hand the cost-effectiveness of this transition has not as yet been proven.
Besides the financial aspect, the education of a NP is not equal to a junior doctor and the
legal consequences are major (Neades, 1997): “Emergency Nurse Practitioner should not be viewed
as a replacement for the role of the nurse in A&E junior doctor, but as a professional with qualities and
skills which complement those of the medical staff in A&E. This is not a quick or cheap solution to the
problem of increasing A&E attendances” (Jones, 1994).
A shift in ED staff responsibilities is seen as a one of the ways to challenge the problem
concerning increased waiting times, resource allocation and the increasing inflow of non-
urgent patients. Research has suggested improving the efficiency of the ED and hospital by
having a better combination of staff. Additionally, having a general practitioner (GP) in the
ED has proven to decrease referrals, prescriptions and the number of diagnostic
investigations (Rao, 1995). The opinions as to the effect on the efficiency of an ED by a
triage nurse vary, but similar opinions are shared regarding the idea that a triage nurse
should only focus on his/her primary responsibility.
The following hypothesis can be formulated, based on the literature above:
Hypothesis 5: the presence of an ED doctor at an ED has more advantages than disadvantages, but the
effect on efficiency at an ED is difficult to substantiate.
4.4.5 Logistics
The fourth variable is logistics, which can be divided into the triage
process and triage systems and waiting times. Both parts will be further
elaborated on as well as explaining their relation to the efficiency in an
ED. The logistics variable is related to research question ten. Figure 14
indicates its position in the conceptual model.
Figure 14: Position logistics variable

Femke Lammerts and Elisa van Poelgeest, MSc 19, January 2012
43
4.4.5.1 Triage process and triage systems
A triage system is on the one hand patient-oriented and on the other organization-oriented
and has an effect on patient acuity and resource allocation. Its effect on the efficiency will
be discussed further in this section. The different triage systems will be explained and
which system is most appropriate for the Dutch emergency department (ED) setting.
“Triage acuity is defined as the classification of patient acuity that characterizes the degree to which the
patient’s condition is life-threatening and whether immediate treatment is needed to alleviate symptoms”
(Gilboy, 2005).
The goal of a triage system is two-fold. On the one hand patient acuity, on the other the
adequate assignment of resources. Windle once summarized the goal for triage as “to assess
patient acuity and assign available resources appropriately, both physical and personnel” (Windle, 2002)
(Windle, 2001). The goals of triage can be divided into 2 categories, namely patient oriented
and organization oriented (Coenen, 2005). A patient is prioritized according to clinical
urgency, so patients with the highest medical need are seen first (Janssen, 2011).
Classification of a patient’s triage code is decided on by a triage nurse and will reflect the
‘safeness’ of the time allowed before treatment. Depending on the triage code, the patient
will experience no waiting time, a short waiting time or longer waiting time (Janssen, 2011).
The need for a triage system arose from a rise in overcrowded emergency departments, due
to the increase of ED visits. The latter part of this increase in ED visits resulted from self-
referrals, but also the ageing population and the changing mentality towards first visiting
the general practitioner (GP) (Janssen, 2011) (Coenen, 2005). Also, the overcrowding of
EDs has indicated an increase in the number of aggression incidents, as well as an increase
in longer waiting times for urgent patients with urgent medical problems. Added to that,
most EDs in the Netherlands do not have a clear systematic procedure for the primary care
of emergency patients (Coenen, 2005).
The main advantage of a triage system is the immediate assessment of patients, the positive
effect on waiting times in the waiting room, prioritization of care, placement of patients in
the correct treatment room or area and being able to start diagnostic tests. This all impacts
positively on the anxiety of patients, their frustrations and concerns. This in turn is
reflected in less written complaints and an increase in employee satisfaction (Blythin, 1983)
(Jones, 1988) (Nuttall, 1986) (Grose, 1988).
Femke Lammerts and Elisa van Poelgeest, MSc 19, January 2012
44
An important part of a triage system is continuous evaluation. Evaluation of the EDs triage
system can lead to improvements such as the use and layout of a triage room, the
responsibilities of and permitted interventions by a triage nurse, content and development
of pain protocols, optimization and further implementation of an ICT system and changing
the number of shifts of a triage nurses into 24/7 availability (Janssen, 2011) (Meijers, 2006)
(Cheung, 2002). When using a triage system, it is important for there to be no discrepancy
between desirability, feasibility and reality. To avoid this discrepancy, it is important that
the ED nurse has completed triage training and that triage is performed consistently
(Coenen, 2005). There is an ongoing discussion as to whether patients who are referred by
their GP or by ambulance personnel should be triaged. In general, research shows that
these patients should be triaged upon arrival at the ED, as their medical situation can
change in the time taken between the GP visit and arrival at the ED (Coenen, 2005).
EDs the world over use of different triage systems. Worldwide frequently used triage
systems are the ATS (Australian Triage Scale), CTAS (Canadian Triage and Acuity Scale),
the MTS (Manchester Triage System) and the Emergency Severity Index (ESI) or also
known as the Boston Systems (Cronin, 2003). The NTS is a Dutch triage standard. In
general it has been recommended that a triage system should meet the following
requirements to be used by EDs in the Netherlands: the triage system must be valid,
reliable, applicable in the Dutch setting, for all age categories, focuses on symptoms and
complaints, follows the nursing methodology and must be usable in all circumstances
(Coenen, 2005) (LAMP, 2003). The paragraphs that follow will explain the different triage
systems mentioned above.
MTS (Manchester Triage System) - The MTS was introduced in 1997 and focuses on the
clinical priority of the patient (Mackway J. K., 1997). It does not make use of medical
diagnosis, is flow based and dynamic. Diagnosis-based models are perceived as dangerous,
as triage must be concise and totally objective and comprehensive (Windle, 2001)
(Zimmermans, 2001) (Windle, 2002). The MTS uses the reduction method and separates
the clinical priority of the patient from the management aspects on the ward (Windle,
2002). An advantage of the MTS is its sensitivity to identify different types of critical
patients (Zimmermans, 2001). A disadvantage of the MTS is the attention and devotion to the
value attached to the pain a patient is experiencing. Recognition of pain is important for patient
satisfaction and must be treated in the triage room (Windle, 2001) (Mackway J. K., 1997).

Femke Lammerts and Elisa van Poelgeest, MSc 19, January 2012
45
ESI/Boston (Emergency Severity Index) - The ESI is also known as the Boston Triage System.
It does not, as is the case of MTS, work with target times per triage code (Gilboy, 2003).
The methodology is based on two items: urgency of a patient and resources needed.
Symptoms and complaints are questioned according to the ABCD method and the PQRST
(pain) method. An advantage is that the diagnostic tests are based on the ‘standards of care’
and not the preferences of the doctor (Zimmermans, 2001) (Wuerz, 2000) (Wuerz, 2001).
Also, the need for diagnostic tests can be better estimated (Ishove-Bolk, 2001).
ATS (Australasian Triage Scale) - The ATS focuses on the clinical urgency of patients
(Zimmermans, 2001). It describes acceptable time spent by the nurse, time by the doctor
and also keeps track of Performance Indicator Thresholds (the percentage of patients that
must be seen within the target times) (Considine, 2002). An advantage is that the ATS is
regarded as a safer system than the CTAS (next paragraph), as the same category patients
are placed in a more urgent category in the ATS compared to the CTAS. A disadvantage is
that the ATS cannot be applied uniformly, as it is adjusted to regional circumstances. The
ATS is also not yet fully developed and does not work according to a standard
methodology (Considine, 2002).
CTAS (Canadian Triage and Acuity Scale) - The CTAS was derived from the ATS and has
been adapted to Canadian needs (Zimmermans, 2001). The CTAS uses the presumptive
disease diagnosis and is focuses on the symptoms and complaints of the patient. The
system works with target times and upgrading patients when the waiting time becomes
unreasonable. The primary goal is for the patient to see the doctor within a certain time
period; the exact urgency code of a patient is not the prime factor (Beveridge, 1998). A
disadvantage is that the training and education behind the system is an unknown factor and
there is no methodological structure (Beveridge, 1998). There are also doubts about the
sensitivity of the system in the case of complex patients (Zimmermans, 2001).
NTS (Nederlandse Triage Standaard) - The NTS was introduced in 2005 and a pilot started in
2007. The NTS is seen as a system that can contribute to one triage system; it positively
affects the co-operation between the different stakeholders in emergency care. It has been
said that one triage system could positively affect the efficiency, safety, patient satisfaction,
communication and co-operation within an integrated emergency care system. The NTS is
mainly used by GPs at HAPs and triage through NTS can be done physically or over the
phone. The NTS is focuses on determining the urgency, not the diagnosis (Jochems, 2006).

Femke Lammerts and Elisa van Poelgeest, MSc 19, January 2012
46
The conclusion was that the NTS is a new concept in emergency care and still needs to be
investigated further. There are questions about the its implementation method, the
possibility of having one triage system in an integrated emergency post, the difference in
goals between the NTS and the other triage systems used by EDs, the communication, co-
operation and culture differences between GPs and ER staff and their working methods
and language aspects. These call for further investigation (Jochems, 2006) (Huibers, 2009).
Some studies also indicated concern about the quality and safety of after working hours
telephone-based consultations. A study in the Netherlands indicated that the quality was
poor in all the centers investigated and that the outcomes of the triage were only
appropriate in 58% of all calls. The underestimation of urgency was 41% (Derlx, 2008).
International studies have also questioned the effectiveness and safety issues. Consultation
by telephone did appear to reduce the number of face-to-face visits to a HAP by 50%, but
uncertainty remains about the effect on the number of future visits. Patient satisfaction was
not affected if a telephone consultation was used instead of a face-to-face visit (Bunn,
2004) (Katz, 2008).
For a system to be effective and to fit into the Dutch ED culture there must be a
separation between the medical and nursing language. It is difficult to state which triage
system is the best in its performance, as there has not been enough research in this area
(Nicholl, 2000). Research has indicated that the MTS would be most suitable to use in EDs
in the Netherlands, as the symptoms and complaints of a patients are seen as more
important than the diagnosis itself. Also, the MTS is the only European triage system and
can be used in the Netherlands as healthcare is similar to the English system. The MTS ties
in better with the ED situation in the Netherlands in terms of reliability, validity, way of
thinking and applicability by ED nurses than the other triage systems mentioned above
(Nicholl, 2000)(Zimmermans, 2001) (Windle, 2001).
A triage system has different effects on the efficiency of processes in the ED itself as well
as on patient and employee satisfaction. For instance there is a decrease in complaints
from patients, reduced waiting times in the waiting room, prioritization of care, placement
of patients in the correct treatment room or area and the ability to start diagnostic tests,
where needed, at the earliest opportunity. Extrapolating the different triage systems, MTS
is seen as being most compatible with the Dutch EDs.

Femke Lammerts and Elisa van Poelgeest, MSc 19, January 2012
47
The following hypothesis can be formulated, based on the section above:
Hypothesis 6: a triage system has an effect on the efficiency of processes in the ED.
4.4.5.2 Waiting times and processes in the emergency department
Waiting times influence logistics. If the logistics of an emergency department are well-
established, this will decrease the waiting time for patients significantly. The next section
will elaborate on the botllenecks of the processes in the ED and how to eliminate these.
Waiting time is perceived by patients as one of the most irritating aspects of a visit to the
ED. Yet, waiting time is one of the most difficult bottlenecks to eliminate. Many hospitals
use the Theory of Constraints theory (TOC) of E. Goldratt in order to reduce the
bottlenecks in their processes. It can also be used in the ED to reduce the turnaround time
of patients. The Theory of Constraints can be used as a method to increase profitability
and volume (Noreen, Smith, & Mackey, 1995): “A constraint is anything internal or external to
the manufacturing process that limits a plant’s ability to generate throughput, the rate at which the
production system generates money through the sale of products” (Kershaw, 2000, p. 2). In order to
maximize this throughput, the constraints should be identified and managed (Goldratt &
Cox, 1992). By defining throughput in a healthcare setting, it can be changed to:
“reimbursement rate less the cost of drugs and medical supplies for the number of patients seen and treated.”
(Kershaw, 2000, p. 2) The steps of TOC can be found in appendix VII of the confidential
booklet. The key factor in the TOC process is to expand the capacity of the constraint in
order to increase throughput. The ultimate target is to completely eliminate non-productive
time. The non-productive time in an ED can be decreased by reducing preparation time,
the use of appropriate supplies, available and accesible information, as well as
implementing and performing the right procedures. Constraints can be eradicated by hiring
more staff or by procuring additional equipment (Kershaw, 2000). By implementing the
Theory of Constraints, the processes within the ED become more efficient and effective.
According to the literature, (Nicholl, 2000) there was no evidence that waiting times are
shortened by implementing a simple triage system. However, time can be gained by
implementing an advanced triage system, whereby a nurse can already apply for diagnostic
tests, which in turn means that the test results are known by the first consultation. By
implementing this advanced triage system, the efficiency of the care process improves as do
turnaround times of patients by making effective use of the patient’s waiting time (Cheung,
Heeney, & Pound, 2002). A triage system only has a positive impact if the role of a triage

Femke Lammerts and Elisa van Poelgeest, MSc 19, January 2012
48
nurse is combined with extra tasks such as requests for examinations and extra
organizational adjustments (Edwards, 1999). On the other hand, the implementation of
triage does not have the desired outcome to solve all logistic problems. Therefore, various
hospitals are implementing care pathways to improve the logistic process in their
emergency departments. In 2005, Vlietland hospital developed a triage system as well as
care pathways. In these care pathways, the patient’s need for care is determined, as are the
examinations, treatment andtime span. Measurements show that the average turnaround
time decreased by 40 minutes for cardiology patients. This is also partly due to the full-time
availability of a cardiologist and the introduction of an observatory in the ED (Sterk, 2006).
Concluding, waiting time can be eliminated by using the Theory of Constraints of E.
Goldratt. In order to maximize throughput, constraints should be identified and managed.
The aim of this theory is to completely eradicate non-productive time. Further waiting time
can be reduced by introducing an advanced triage system. However, this only has a positive
effect if the triage nurse combines extra tasks such as examinations in combination with
patient triage.
As such the following hypothesis is formulated, namely:
Hypothesis 7: waiting time can be decreased by reducing the bottlenecks in the process.
4.4.6 Finances
An optimal emergency department (ED) cannot be developed without
investigating its financial system. This section will elaborate on how the
financial system works in the Netherlands and how it will function in the
future. The finance variable entails research question eleven and figure 15
shows the position in the conceptual model.
Hospitals are currently financed and funded in different ways. Financing involves
temporarily making capital available, whereas funding encompasses making a financial
contribution to cover the costs, associated with the service provided (Bos, Koevoets, &
Oosterwaal, 2010).
Figure 15: Position finance variable

Femke Lammerts and Elisa van Poelgeest, MSc 19, January 2012
49
The Dutch care authority (Nederlandse Zorgautoriteit – NZa) determines a budget for
every hospital in the Netherlands. They use a calculation method that is provided by the
ministry of health. The financing of hospitals is based on Diagnostic Therapy
Combinations (DBC). This DBC contains all (care) activities of a hospital and of medical
specialists, arising from the patients care demand (Bos, Koevoets, & Oosterwaal, 2010).
The DBC includes the total route of the diagnosis until the treatment starts. The DBC-
system gives hospitals and health insurers:
The possibility to negotiate on price and quality for certain hospital treatments.
This offers health insurers better possibilities to procure better and more affordable
care
Better insight into the costs of treatments. This leads hospitals to improve their
management and thus deliver affordable and efficient care (NZa, 2011)
The DBC codes are divided into two categories: the A-segment and B-segment. The A-
segment contains approximately 66% of the hospital treatments (NZa, 2011). For the
DBCs in this segment, there are fixed rates, determined by the Dutch care authority. For
every diagnosis, the costs of the treatment are calculated in order to determine an average
tariff. This tariff incorporates various costs components such as: costs for specialists,
nursing and X-ray photos. It also contains indirect hospital costs: costs of education,
research and the ED itself (Ministerie van VWS , 2011). All this makes it difficult to
accurately trace the revenues and costs of an ED.
In segment B, the DBC codes are subject to competition. The hospitals themselves
determine the tariffs for the treatments. Negotiations between hospitals and health insurers
about quality and price of DBC
treatments in the B-segment form the
basis of the B-segment (Bos, Koevoets,
& Oosterwaal, 2010).
In figure 16 on the right, the financing
and funding of health-care is explained.
As already stated above, there is a
difference between financing and
funding. The funding contains the
functional budget and the revenues of the Figure 16: Financing and funding structure in Dutch health-care system

Femke Lammerts and Elisa van Poelgeest, MSc 19, January 2012
50
B-segment. The turnover of the hospital comprises these two components. By declaring
the DBC codes, the hospital receives money which is the financing part. They can declare
DBC codes both in the A- as well as the B-segments. However, the revenues in the A-
segment are fixed because of the budgeting system. In the B-segment, hospitals and
insurers can negotiate on price, volume and quality of the care (Belonen naar prestatie,
2011).
In 2012, the budgets for hospitals will disappear. Healthcare will be financed on the basis
of the services delivered. In the B-segment, now changed to free market segment, the
health insurers and care providers can freely negotiate on the quality, price and volume of
the care. This includes care that is offered by many providers and can be translated into
recognizable performances. 70% of all treatments will now be based on free pricing under
this financing system. However, there will also be a regulated segment, where negotiation
is possible at maximum rates. This contains care that is not suited to free negotiation.
There will also be a fixed segment where there can be no negotiation on the care provided.
This includes, for example, care that requires an enormous investment or where the
number of patients fluctuates greatly. The ED will be financed under the first-named free
segment but can be eligible for reimbursement via the fixed segment (Belonen naar
prestatie, 2011).
This new system, DOT3, will provide higher quality and greater efficiency in healthcare
because providers are rewarded based on the services they deliver. To make the system
work, it is important that the services are well-defined. An innovative aspect of the new
system is the way in which the various items of the care offered are grouped and declared
in the system. DOT has the following advantages:
Greater transparency: every stakeholder gets more insight into quality, care process
and pricing;
Medical recognition: the extent to which the specialist can identify with the care
product itself with respect to the actual care delivered;
Care burden: the complexity of care is better encapsulated in the care products;
Transcending specialisms: Not every specialism has its own DBC codes, but
specialisms that deliver the same care, also declare the same care products;
3 DOT = DBC op weg naar Transparantie: DBC towards Transparency

Femke Lammerts and Elisa van Poelgeest, MSc 19, January 2012
51
More homogenous costs: the extent to which care costs are reimbursed to the
patient.
Care for the patient is grouped in a product based on the diagnosis. All possible care
products together are called the care product structure. This structure is based on the
International Classification of Diseases (ICD10) so that the classification is standardized in
line with the rest of the world. The ICD10 has 22 chapters. These chapters are in turn
divided into various diagnostic groups and these are again divided into several treatment
groups. Finally, the treatment group is separated into care products. There are
approximately 3500 care products. An overview of the DOT system can be found in
appendix VIII in the confidential booklet (Werken met DOT, 2011).
Because of the social care system in the Netherlands, which indicates that every person is
obligated to have health insurance, it is difficult to determine the profitability of an ED. In
concrete, patients that visit the ED get a DBC code where the average price of a certain
diagnosis is inserted. Also the visit of the ED is incorporated in the DBC code of that
certain diagnosis. The cost of the readiness and availability of an ED is a cost regardless of
the patient volume (Taheri, Butz, Lottenberg, Clawson, & Flint, 2004).
According to the literature, the low-care unit is profitable in the ED. These revenues are
used to finance the medium and high-care unit of the ED (Schrijvers, Steeg, Schaaf,
Hemrika, & Gussinklo, 2011). However, previous research does not give a clear perception
of the financial situation of EDs in general. It merely states that they are cost centers.
In conclusion, Dutch hospitals are financed and funded. These are two totally different
methods. Hospitals receive a budget, but they can also reimburse costs. Reimbursements
are currently done by DBC codes. As from next year, these codes will be extended to
DOT. This reimbursement system also makes it difficult to determine the profitability of
an ED. It is merely stated that the low-care unit of an ED is profitable.
The following hypothesis can be formulated from the literature above:
Hypothesis 8: it is difficult to determine the profitability of an ED.
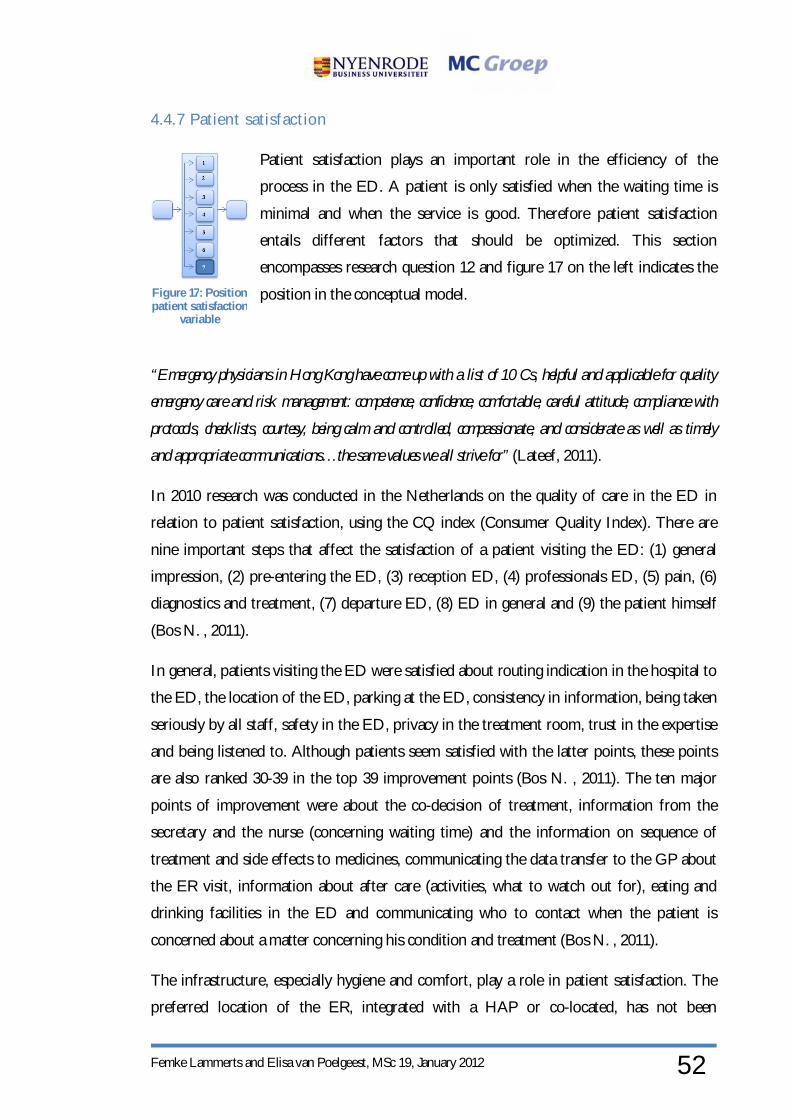
Femke Lammerts and Elisa van Poelgeest, MSc 19, January 2012
52
4.4.7 Patient satisfact ion
Patient satisfaction plays an important role in the efficiency of the
process in the ED. A patient is only satisfied when the waiting time is
minimal and when the service is good. Therefore patient satisfaction
entails different factors that should be optimized. This section
encompasses research question 12 and figure 17 on the left indicates the
position in the conceptual model.
“Emergency physicians in Hong Kong have come up with a list of 10 Cs, helpful and applicable for quality
emergency care and risk management: competence, confidence, comfortable, careful attitude, compliance with
protocols, checklists, courtesy, being calm and controlled, compassionate, and considerate as well as timely
and appropriate communications…the same values we all strive for” (Lateef, 2011).
In 2010 research was conducted in the Netherlands on the quality of care in the ED in
relation to patient satisfaction, using the CQ index (Consumer Quality Index). There are
nine important steps that affect the satisfaction of a patient visiting the ED: (1) general
impression, (2) pre-entering the ED, (3) reception ED, (4) professionals ED, (5) pain, (6)
diagnostics and treatment, (7) departure ED, (8) ED in general and (9) the patient himself
(Bos N. , 2011).
In general, patients visiting the ED were satisfied about routing indication in the hospital to
the ED, the location of the ED, parking at the ED, consistency in information, being taken
seriously by all staff, safety in the ED, privacy in the treatment room, trust in the expertise
and being listened to. Although patients seem satisfied with the latter points, these points
are also ranked 30-39 in the top 39 improvement points (Bos N. , 2011). The ten major
points of improvement were about the co-decision of treatment, information from the
secretary and the nurse (concerning waiting time) and the information on sequence of
treatment and side effects to medicines, communicating the data transfer to the GP about
the ER visit, information about after care (activities, what to watch out for), eating and
drinking facilities in the ED and communicating who to contact when the patient is
concerned about a matter concerning his condition and treatment (Bos N. , 2011).
The infrastructure, especially hygiene and comfort, play a role in patient satisfaction. The
preferred location of the ER, integrated with a HAP or co-located, has not been
Figure 17: Position patient satisfaction
variable

Femke Lammerts and Elisa van Poelgeest, MSc 19, January 2012
53
sufficiently investigated by research (Chalder, 2006). Patients are also influenced by the
patient-nurse or patient-physician relation (Hidalgo, 2011). Communication and courtesy
play a major role in this (Soleimanpour, 2011). Patients comply better with the physician if
they have been given pain relief at the ED during their stay, all of which minimized their
distress. This positively affects patient satisfaction (Downey, 2010).
Patient Centered Care (PCC), is becoming increasingly important in the 21st century. PCC
is focused on customized care. The patient becomes a partner in his/her own care and
health ‘ownership’ is aligned with 21st century thinking. There are three major areas of
importance: (1) respect for patient values, preferences, and expressed needs, (2) the co-
ordination and integration of care and (3) information, communications, and education.
The question is whether the ED will benefit from this approach. Research has shown that
it could be used, only if the approach is well planned in advance (Taylor, 2006) (Lateef,
2011).
“The two dimensions most strongly positively associated with global satisfaction were receiving the expected
medical help and being treated well by the doctor’’ (Taylor C. , 2004). A patient’s expectations play
a major role in relation to satisfaction and are not necessarily dependent on the triage code.
It is not known in this situation whether the triage code or the waiting time itself affects
satisfaction (Taylor C. , 2004). Patients arrive at the ED with certain expectations, which
are either met or not by the physician. Failure to meet the expectation can result in anger or
even aggression. Negative comments about an ED or physician can also be circulated
publicly. These patients will consequently not return for follow-up care, resulting possibly
in a loss of patients for the hospital. Managing expectations in an ED is complex, due to
the high anxiety and stress levels that are naturally present. This can only be achieved when
a balance is found between the expectations of the patient, the perception of the physician
and the prioritization by the healthcare planners. Research suggests that communication
and building a good patient-physician relationship is crucial in this (Lateef, 2011) (Hidalgo,
2011).
Waiting times do not always affect the patient’s satisfaction negatively. Communication
regarding waiting times is essential. This can be done during triage, but also through
information screens in the waiting room (Kelly, 2010). The perceived waiting time does not
necessarily show a decrease with the introduction of the information screen (Papa, 2008).
Communication plays a major role in the interaction aspects between nurse and patient, in
Femke Lammerts and Elisa van Poelgeest, MSc 19, January 2012
54
which information and psychosocial exchange play a key role in satisfaction criteria (Kim,
2010). Generally, communication in all areas between patients and staff and between staff
amongst themselves has been indicated as a frequent sphere of improvement in patient
satisfaction. “Although it may be neither feasible nor desirable to meet all patient expectations, increased
focus on wait times and staff communication may increase both ED efficiency and patient satisfaction”
(Cooke, 2006). Communication about waiting times linked to the non-urgent character of a
patient visiting the ED may have a positive impact on expectations and satisfaction
(Olsson, 2001). Research has shown that communication skills workshops improve the
communicational and therapeutic skills of physicians (Lau, 2000).
When reviewing a patient population, younger people are most often the least satisfied and
elderly people with no comorbidities most satisfied. A good education and bad health
status has a more positive impact on satisfaction than lower education and good health
status (Rahmqvist, 2010). When researching the appropriateness of seeking medical care,
patients tend to think that other patients are wasting their time, but do not see themselves
in that same light. Patients tend to search for health-seeking rationales, yet their anxiety and
symptoms appear to be more like health-seeking behavior (Adamson, 2003).
In conclusion, patient satisfaction is influenced by the efficiency in an ED. Important
factors determining patient satisfaction are the layout of the ED and the verbal
communication between patient and staff. A patient’s expectations can be turned into
realistic expectations, if the communication towards the patient is adequate. Patient
satisfaction and waiting times can also be influenced by verbal communication.
The following hypothesis can be derived from the literature:
Hypothesis 9: verbal communication towards a patient in the ED plays an important role in patient
satisfaction.
The foundations for the sub-research questions have been discussed in the sections above.
The seven variables were elaborated on as well as their effect on the efficiency on an ED.
The next section will give an overview of the hypotheses derived from the literature in this
chapter.

Femke Lammerts and Elisa van Poelgeest, MSc 19, January 2012
55
4.5 Hypotheses
Based on the theoretical framework, the following hypotheses were derived:
Hypothesis 1: the layout of the ED affects the long term success of its processes
Hypothesis 2: the integration of a HAP and an ED improves the efficiency and
quality of care at a lower cost
Hypothesis 3: digitalization of patient data has both a positive and negative effect
on the processes of an ED.
Hypothesis 4: standardized performance indicators enhance the quality of the
processes of the ED
Hypothesis 5: the presence of an ED doctor at an ED has more advantages than
disadvantages, but its effect on the efficiency at the ED is difficult to confirm
Hypothesis 6: a triage system has an effect on the efficiency of processes in the ED
Hypothesis 7: waiting time can be decreased by eliminating the bottlenecks in the
process
Hypothesis 8: it is difficult to determine the profitability of an ED
Hypothesis 9: verbal communication towards a patient in the ED plays an
important role in patient satisfaction
These hypotheses will be tested on their validation through the results of the interviews in
chapter 5.

Femke Lammerts and Elisa van Poelgeest, MSc 19, January 2012
56
5. Results and analysis
This chapter will discuss the results and analysis. The results are based on the outcomes of
the twelve interviews at different emergency departments (EDs) in the Netherlands. The
results are discussed per individual variable. The analysis incorporates the hypotheses
extrapolated from the literature (chapter 4, section 4.5) with the results of the interviews
and thus will determine the validation of those hypotheses from the literature. Hypotheses
that cannot be validated through our research will be postulated as recommendations for
further research.
The structure of the results and analysis is identical to that of the chapters above. The
structure is based on the conceptual model (chapter 2. A figure at the beginning of each
variable discussed will indicate which variable in the conceptual model is being elaborated
on. Each of the seven variables discussed will start with the results, followed by the
analysis. Quotes from the interviews will be used to substantiate the results or as evidence.
Some sections show a table at the end of the section. Its function and how to read it will be
explained in that section.
The final section of this chapter will give a short overview of the hypotheses and whether
or not they could be validated.
5.1 Infrastructure
The following chapter will discuss the results from the outcome of the
interviews on the variable infrastructure. This variable is divided into the
layout of an emergency department (ED) and the Huisartsenpost (HAP,
general practitioners’ co-operation). The results are followed by an analysis
of both, in which hypothesis 1 and 2 from the literature (chapter 4) will be
tested for validation. Figure 18 on the left shows the position of this
variable in the conceptual model.
5.1.1 Emergency department layout
5.1.1.1 Results
The results on the layout of the ED are discussed in the section below. Firstly, it is
discussed if the EDs have a Computer Tomography scanner (CT-scanner) in the
department itself after which the results of the physical layout are discussed. Secondly, the
Figuur 18: Position
infrastructure variable
Femke Lammerts and Elisa van Poelgeest, MSc 19, January 2012
57
format of the treatment rooms is detailed. This is followed by a new topic that arose during
the interviews, namely the acute admissions ward. Finally, a general conclusion on the
results of the layout of the ED is given. Table 1 gives an overview of this section.
One out of twelve EDs has a CT scanner in the department itself. One ED will get a CT in
the future and two others would like to have an own CT but stated that the investment
required was proving to be a barrier at the moment. The trauma rooms are equipped with
an X-ray device. Some have an extra X-ray room on the ED, including one ED with a
mobile X-ray device for the non- or less mobile patients.
Two out of twelve EDs currently have the ballroom setting. Two have a partly ballroom
structure and three want to set up the ballroom setting in the future. The reason for the
latter is the functionality and overview it creates for both staff and patients; “Voor de patiënt
is dit prettig, omdat hij aanspreekbaar is wanneer nodig. Het werkt voor de mensen prettig, het is dichtbij
allemaal, heel functioneel” (Hospital I, 2011).
Eight out of twelve EDs have uniform rooms, two a combination and two have a non-
uniform configuration. The reason for uniformity stated elsewhere in this paper, is the ease
of use and patient placement and allocation; “In de nieuwbouw willen we toewerken naar een
standaard kamer waar alles gedaan kan worden. Momenteel is daar nu geen plaats voor. Nu moet er
nagedacht worden wat de patient nodig heeft en welke kamers er dan ter beschikking zijn. Dat kost nu
ontzettend veel tijd omdat er vaak patiënten verplaatst moeten worden naar andere kamers” (Hospital B,
2011). All rooms contain the standard layout resources: bed, monitor, computer (in most
EDs), mobile carts, small cupboard, sink, oxygen/air pressure and stool. Some are adapted
to suit a particular specialization as for example the ENT (ear, nose and throat specialist),
urology and ophthalmology.
Three EDs have an AOA (acute admissions ward) and three said they had plans for an
AOA. Reasons mentioned in favor of an AOA are better logistics, flexibility and less
disruption for other wards; “Enige afdeling waar patiënten heen gaan, werkt logistiek veel beter.
Discussies met afdelingen zijn er uit, er is gewoon 1 centrale afdeling […] Maakt dat je flexibel bent en
rust op andere afdelingen” (Hospital K, 2011). Contrasting ideas about the effectiveness stated
are doubts as to its functionality and the number of patients; “Je moet voor jezelf duidelijk
kijken wat het voor jezelf oplevert. Het kan een oplossing zijn voor een logistiek probleem maar niet voor
het bedden tekort” (Hospital C, 2011), “Ons patiënten volume is niet groot genoeg om een AOA

Femke Lammerts and Elisa van Poelgeest, MSc 19, January 2012
58
rendabel te maken. Je moet er ook personeel neerzetten terwijl er misschien niemand wordt opgenomen”
(Hospital G, 2011).
Table 1 below provides an overview of the outcomes of the interviews. Horizontally in the
columns, the elements of the layout variable can be seen. Vertically, the rows indicate the
individual hospital codes. Specific information on the elements in the columns per
individual ED can be obtained by reading the table horizontally. If the table is read
vertically, each individual column can be linked to the different hospitals.
Hospital
code
Number of
treatment
rooms
CT/X-ray on ED? Shape Room lay-out*
A 12 (2 trauma, 2
AED)
CT near ED
X-ray on ED
Ballroom Uniform
B 20 (2 trauma, 1
AED)
CT and X-ray on ED,
ultrasound
-** Some uniform, some
specific
C 8 (1 trauma, 1
acute)
CT near ED, X-ray on ED - Uniform
D -(2 trauma) CT in 2013, X-ray next to ED Linear Uniform
E 24 (2 trauma) CT near ED, X-ray on ED Partly
ballroom
Some uniform, some
specific
F 7 (1 trauma) X-ray on ED, CT near ED,
mobile X-ray device
- Uniform
G 3 (1 trauma) Next to ED Ballroom in
future
Not uniform
H 8 (2 crash) CT near to ED, X-ray on ED No real
structure
Uniform
I 25 (2 trauma) CT near to ED, X-ray on ED Partly
ballroom
Uniform
J 11 (1 trauma) CT near to ED , X-ray on ED
(separate room in new
situation)
Ballroom in
future
Not uniform
K 6 (1 trauma) CT near to ED, X-ray on ED Ballroom in
future
Uniform
L 14 (2 trauma) CT near to ED, X-ray on ED Ballroom Uniform
Table 1: Overview emergency department layout
Note 1: * Standard layout: bed, monitor, computer, mobile carts, small cupboard, sink, oxygen/air pressure, stool
Note 2: ** A horizontal line indicates that the data in that field is unknown

Femke Lammerts and Elisa van Poelgeest, MSc 19, January 2012
59
Concluding on the results above, the interviews have indicated that the ballroom layout is
seen as functional and efficient for its processes as well as offering uniformity in the layout
of treatment rooms. The provision of diagnostic equipment for the ED is often considered
an investment issue and the location of such equipment affects the efficiency of the
processes in an ED. Opinions about an AOA vary. Some indicate flexibility as an
advantage, others question its functionality.
5.1.1.2 Analysis
From the literature the following hypothesis was derived:
Hypothesis 1: the layout of the ED affects the long-term success of its processes.
Literature has validated this hypothesis. According to the literature, layout plays a
significant part in the throughput of the emergency room (ED). This in turn makes for
improvement in overcrowding issues. The combination of these two factors makes the ED
more efficient. Efficiency in the long term can be achieved through various changes or
adaptations in the physical layout. Firstly, implementing the ballroom layout creates
visibility of the ED and easy accessibility to the central nursing station for patients and
staff. However, research has indicated that when the number of treatment rooms exceeds
18, the ballroom setting is no longer effective. The ballroom setting should then be
duplicated and two ballroom areas created or the EDs should consider linear units.
Secondly, uniformity in the layout of treatment rooms provides flexibility in patient
placement. This in turn can support the idea to centralize the primary processes and to
place other processes in the periphery. Research suggests for instance that high-care
patients should be located around the nursing station and non-urgent patients can follow
the RADIT program, for instance. Optimal efficiency can also be enhanced by the right
location for diagnostic imaging equipment, either on the ED itself or located next to the
ED. Research is questioning whether registration of a patient should be handled by the
secretary at the front desk of the ED or via bedside registration. The latter is said to save
space in the waiting room and speed up the process within the ED itself.
Hypothesis 1 can also be validated by the outcomes of the interviews in the results.
Hospitals have acknowledged the functionality and advantages of the ballroom setting
which also improves patient satisfaction. Hospital E and I have implemented a semi-
ballroom layout, as is also suggested in literature when the number of treatment rooms
exceeds 18. In addition to flexibility, the results have identified that the uniformity of

Femke Lammerts and Elisa van Poelgeest, MSc 19, January 2012
60
treatment rooms also provides ease of use and patient placement. Hospital L confirms in
the interview the efficiency and effectiveness of separating the central and peripheral
processes. Several hospitals have indicated that not having diagnostic imaging equipment
on or near the ED constitutes as bottleneck in their processes. The interviews have
confirmed that a distinction should be made between urgent and low-care patients, for
instance by placing urgent care patients near the nursing station and using a fast track for
low-care patients. In order to improve overcrowding and throughput in an ED, the
interviews have suggested the use of an ‘acute opname afdeling (AOA)’; an admissions
ward which is part of the ED with a maximum stay of 24hrs, 48hrs or 72hrs. The efficiency
of this AOA to reduce overcrowding and make for greater throughput cannot be
confirmed by the literature in this research paper, thus further research on its effect on
efficiency is to be recommended. The following hypothesis can consequently be derived
and used as a recommendation for further research (chapter 6):
Hypothesis 1: an admissions ward has a positive effect on the overcrowding and throughput of an ED.
The literature and outcomes of the interviews have shown that hypothesis 1 can be
validated.
5.1.2 The Huisartsenpost
5.1.2.1 Results
In the interviews, the Huisartsenpost (HAP) was also discussed with the head of the
emergency departments (EDs). The following section gives an overview of the results. The
results will encompass the number of hospitals that are actually integrated. Further
discussion will investigate the effects on efficiency if the processes were to be integrated,
and if these can be validated. Finally, the literature found is linked to the interviews in order
to confirm or reject the hypothesis stated.
Ten of the twelve hospitals interviewed state that the HAP is not integrated. There are
several reasons why integration or co-operation has not yet taken place. One reason is the
difficulty in co-operating with the general practitioners (GPs) because of the different
reimbursement scales that general practitioners receive in comparison with the ED versus
the responsibilities they bear; “De HAP zit aan de SEH vast maar er zijn geen samenwerkingen
mee. We zouden dat wel heel graag willen. Zeker als je kijkt naar het aantal patiënten dat wij zien en het
aantal patiënten dat de HAP ziet, want veel van hun patiënten worden toch nog doorgestuurd naar de

Femke Lammerts and Elisa van Poelgeest, MSc 19, January 2012
61
SEH […] Alleen de huisartsen hebben nog koudwatervrees om samen te werken. Ze zijn bang dat ze het
drukker gaan krijgen en dat ze niet een financiële compensatie voor krijgen” (Hospital G, 2011).
Four hospitals do not have a HAP within the he hospital complex. However, three of them
have plans for future integration. Hospital B has no plans yet, stating that they have good
collaboration agreements with the HAP. Patients can be redirected to the HAP, if they are
not urgent enough for the ED or the ED is full to capacity; “In die mate dat bij grote drukte, de
patiënt bij ons getrieerd wordt en het echt een eerstelijnszorg vraag betreft en we kunnen die patiënt niet
binnen een redelijk termijn helpen, is er overleg met de HAP en de patiënt dat hij/zij daarnaar kan
doorverwezen worden” (Hospital B, 2011).
Of the four hospitals where a HAP is located in or next to the ED, but not integrated,
three have expressed future plans for integration. Hospital D states that there is potential
for having the HAP and ED under one roof, but that one desk (integration) would be
more efficient for the patient. However, legal matters and reimbursement discussions have
not yet been resolved; “Ze zitten dichterbij en er zijn kortere lijnen. Maar er is nog steeds tegenstand
vanuit verschillende partijen. Er zitten nog heel veel mogelijkheden maar ook juridisch is het niet geregeld.
[…]. De patiënt moet nu nog terug opnieuw ingeschreven worden als hij/zij doorverwezen wordt naar de
SEH. Dat zou dus veel efficiënter kunnen geregeld worden door 1 balie neer te zetten” (Hospital D,
2011).
Seven of the EDs that are not integrated with the HAP, state as one of the reasons for
future integration the benefits to the patients as there is communication between the HAP
and ED about the placement of the patient; “Ik zie met name voordelen voor de patiënten. Als je
kijkt vanuit de patiënt dan is het makkelijk dat de huisarts deze kan doorverwijzen naar de 2e lijnszorg.
Een SEH kost meer dus je kan makkelijker afspraken maken met de huisarts welke patiënten
doorverwezen moeten worden” (Hospital H, 2011). Other reasons stated were better logistics,
increase in patient satisfaction and a reduction in waiting times; “Alle acute zorg komt bij
elkaar. Dat is efficiënt logistiek” (Hospital H, 2011), “De geïntegreerde HAP zorgt dat er mensen niet
komen op de SEH als ze er niet thuis horen. Zorgt dus dan ook voor minder wachttijden, meer tevreden
patiënten” (Hospital E, 2011). The thinking processes of the HAP and the ED are
significantly different. At the HAP a patient is considered healthy until the contrary has
been diagnosed; at the ED the patient is ill until the contrary has been diagnosed; “Ja, dat
één-loket model. Het gaat niet alleen om tijd. Het gaat ook om geld en als je in het ziekenhuis zit dan ben
je ziek tot het tegendeel bewezen is. En kom je bij de huisarts dan ben je gezond tot het tegendeel bewezen

Femke Lammerts and Elisa van Poelgeest, MSc 19, January 2012
62
is. Dus eigenlijk is dat een hele andere insteek” (Hospital L, 2011).
Obstacles and challenges for the integration of the HAP and ED can be found within the
financial system (reimbursement vs. responsibilities) and legal matters; “We willen in de
toekomst naar 1 entree met 1 functionaris die trieert. Vanuit daar kan de patiënt doorverwezen worden
ofwel naar de HAP ofwel naar de SEH. Achter die balie blijven het wel 2 identiteiten. Dit komt omdat
medico-legaal dit nog niet is afgedekt en ook financieel is het niet afgedekt. Het verschil in financiering
tussen 1e en 2e lijnszorg is nog te groot om dit te realiseren” (Hospital C, 2011). In addition, the
portfolio of tasks and responsibilities is not clear nor does an integrated situation exist; “Er
zijn ook nog vragen of we beide functionarissen beide systemen laten inkijken, wie die balie gaat bemannen.
Het is heel moeilijk om ook de takenpakketen te bepalen. Een medisch secretaresse doet velen malen meer
logistiek dan een medewerker van de HAP” (Hospital H, 2011). The complexity and non-
uniformity of the registration of patients plays a role. When patients change over from a
HAP to ED or vice versa, the patients have to be re-registered; “Als er een patiënt staat
ingeschreven bij de HAP, dan kan deze niet gelinkt worden aan het systeem van de SEH. De patiënt moet
opnieuw ingeschreven worden” (Hospital H, 2011).
Table 2 gives an overview of the distribution of HAP integration. The left column
describes the different situations of the integration of hospitals with EDs. The middle
column indicates the number of hospitals that can be apportioned according to the
different situations. Additionally, the last column connects the interviewed hospitals to the
different situations shown in the first column.
Situation Number Hospital Code
No integration 10 B, C, D, F, G, H, I, J, K,
L
No integration, HAP not on hospital complex 4 B, F, I, J
No integration, HAP on hospital complex 2 G, H
No integration, HAP in/next to ED in hospital 4 C, D, K, L
Integrated HAP and ED 2 A, E
Plans for integration in new/renovated/current
building
7 C, F, H, I, J, K, L
Table 2: Overview of the distribution of HAP integration
In conclusion, most hospitals are still not integrated with a HAP. However, they do express
an intention to co-operate since there are many benefits. Challenges need to be addressed

Femke Lammerts and Elisa van Poelgeest, MSc 19, January 2012
63
to make integration a success. These challenges are mostly related to the financial system,
especially the mismatch of the reimbursements versus responsibilities. The hypothesis from
the literature stated below is analyzed by searching for confirmation in the literature itself
as well as in the interview results.
5.1.2.2 Analysis
This subsection discusses the analysis of the premise that the integration of a HAP and an
ED improves the efficiency and quality of care and at a lower cost. The analysis is based on
hypothesis 2, formulated in chapter 4 (theoretical framework):
Hypothesis 2: the integration of a HAP and an ED improves the efficiency and quality of care at a lower
cost.
The literature states that the integration of a HAP and an ED can resolve overcrowding
problems in the ED. This constitutes one of the most important advantages of co-
operation, namely the redirection of non-urgent care patients. By redirecting those patients
to the HAP, this could reduce costs and increase effective care. Also Dutch policy makers
confirm that the efficiency and quality of care is improved when the HAP and ED are
integrated.
The results of the interviews indicate that most hospitals are not integrated with the HAP
because of the resistance of general practitioners. However, hospitals do see the advantages
of co-operation but the current lack of harmonization of reimbursements in line with
responsibilities makes it difficult to achieve this. There were insufficient interviews that
were able to corroborate the efficiency of the integration of a HAP and an ED, so the
hypothesis cannot be validated. Further research is recommended based on hypothesis 2.
5.2 Technology
This chapter will discuss the results from the outcomes of the interviews on
the variable technology. Technology encompasses the software used on an
ED and the digitalization of patient data. The results of the interviews are
followed by an analysis. In the analysis, hypothesis 3 from the literature
(chapter 4) will be tested for validation. Figure 19 shows the position of this
variable in the conceptual model. Figuur 19: Position
technology variable

Femke Lammerts and Elisa van Poelgeest, MSc 19, January 2012
64
5.2.1 Software and digitalization of patient data
5.2.1.1 Results
The following paragraphs will show the results of the technology variable. The uniformity
of software systems will be discussed, as will the effects of the digitalization of patient data
and their effects on the processes within an ED. The scope and impact of a paperless
system on an ED will also be examined.
Eleven out of twelve hospitals work with the same software hospital-wide. Hospital L does
not have a uniform software system. It was stated that iSoft has a special ED portfolio, to
which other specialists were not yet connected prior to 2004, due to the need for
optimization within the ED before opening it up to other specialists; “We hebben toen bewust
niet gekozen om de specialisten mee te laten doen, omdat we dachten dan gaan we buiten de deuren van onze
spoedeisende hulp. Dat ging alleen voor ellende zorgen, er zijn veel te veel mensen die er dan wat van vinden.
Laten we eerst maar zorgen dat we het binnen onze afdeling voor elkaar krijgen” (Hospital L, 2011).
The introduction of the system to other specialists and nursing wards has started but is
regarded a slow and cumbersome process.
Opinions regarding the notion for implementing a hospital-wide system vary considerably.
Stated as positive is the sharing of information with other wards and specialists, especially
when a patient is admitted to a nursing ward from the ED; “Wij beschouwen ons als een bron,
waarbij je start met de behandeling van de patiënt. De start van het contact met de patiënt in het
ziekenhuis. Dus alle informatie willen we graag delen met anderen die er gebruik van willen maken”
(Hospital L, 2011). Working with different systems makes for less time-saving; “Het kost
natuurlijk wel tijd door in meerdere systemen te moeten werken” (Hospital B, 2011). Others think the
benefits lie in a good transfer of information when admitting a patient to a nursing ward
and not so much in having a uniform system; “Er is niet concreet winst te maken als het zelfde
systeem gebruikt wordt in het ziekenhuis. Er is altijd winst te halen als de overdracht gewoon goed gebeurt”
(Hospital B, 2011).
Two out of twelve EDs have a paperless system. Opinions about the possibilities of having
a fully paperless and digital system are contradictory; “Alles kan papierloos” (Hospital E,
2011) or; “Nee. Dat gaat het nooit helemaal worden” (Hospital L, 2011). The effect of
digitalization of hospital G was stated as very inefficient, whereas the ED system is fully
paperless; “Heel de digitale werking hier in het ziekenhuis is inefficient” (Hospital G, 2011).
Femke Lammerts and Elisa van Poelgeest, MSc 19, January 2012
65
The benefits stated for a paperless system are the availability of information
(“systeminformatie is onmiddellijk beschikbaar, je hebt alles in 1 opslag nu” (Hospital A, 2011)), time-
saving (“Je hoeft niet alles een paar keer op papier te zetten” (Hospital A, 2011)), efficiency (“Ik
denk wel dat het efficiënter werkt. Vooral de specialisten vinden dat ze te lang bezig zijn met het invullen
van de statussen” (Hospital D, 2011)), possibilities for analyzing processes and insight into the
areas of improvement as a result of condensing all statistical information in one system
(“Je kunt er statistieken op loslaten” (Hospital L, 2011)) and less printing and printing costs
(“Wij gaan niet meer uitprinten want alles is in principe digitaal beschikbaar” (Hospital G, 2011)).
The disadvantages of a paperless system were stated as being the increase of functions vs.
time consumption (“Bespaart werk, maar kost ook tijd door het aanklikken bijvoorbeeld. Door de
meer mogelijkheden in het systeem, heeft men de neiging meer aan te klikken dan nodig is. Dat is een
leercurve.” (Hospital A, 2011)), accessibility during maintenance or breakdown periods
(“Nadeel is dat je er niet altijd bij kan bij storingen of updates, dan worden de hoofdonderdelen uitgeprint.
Maar bij SEH kan dat niet!” (Hospital E, 2011)), the loss of data during transfer to a nursing
ward (“Wij hebben nu een digitaal systeem die ophoudt bij de poort van de SEH dus er wordt wel een
uitdraai gemaakt van de SEH kaart. Maar je verliest dus wel informatie want daar staat niet alles op”
(Hospital B, 2011)) and the conversion of a paper into a digital system in the start-up
phase (“Tot voor kort waren alle dossiers nog dossiers, die zijn nu allemaal digitaal gekopieerd. Maar op
dit moment wordt alles nog afgedrukt en in het dossier bijgevoegd” (Hospital G, 2011).
The most frequently stated non-paperless documents are transfer documents from ED to
the nursing ward, radiology, diagnostic requests, documentation when patients are admitted
to the ED by ambulance or GP, medicines, consultation documents and laboratory
requests. GP letters can be sent digitally or given to the patient. The information contained
in transfer documents is often transferred verbally. The physical condition of patients is
subject to ongoing changes, whereas digitalization has not as yet been implemented;
“Overdracht naar verpleegafdelingen: EPD is een belangrijke bron van informatie, maar je ontkomt niet
aan een mondelinge overdracht (moment opname), maar bij sommige patiënten niet altijd nodig” (Hospital
J, 2011), “Kijk je naar de verpleegkundige, we hadden voorheen geschreven overdracht naar de
verpleegafdeling. Nu draai je het digitaal uit. We printen het nog voor de afdeling, omdat ze op de afdeling
nog onvoldoende elektronisch werken.[…] Nu hebben ze de overdracht en vanaf het moment dat wij de
overdracht meegeven, hebben we eigenlijk heel weinig vragen meer gehad. Alles staat er op” (Hospital L,
2011). Sometimes it is stated that the reason not all papers can be digitalized is because the
software cannot as yet implement certain codes; “Alleen bepaalde formulieren als consulten,

Femke Lammerts and Elisa van Poelgeest, MSc 19, January 2012
66
aanvragen is er wel maar nog niet op een goede manier ingebed. Dat krijgt langzaam zijn verbeteringen en
voortgang” (Hospital I, 2011). A large amount of paper administration is involved for
patients that are admitted to the ED. Some EDs are scanning all the paper administration
to have all the information available in the digital system; “Er is ook nog een grote papierstroom.
Dit is vooral het geval bij het opnemen van patiënten’ (Hospital B, 2011), “Alles wat de patiënt
meeneemt wordt gescand en toegevoegd aan het EPD” (Hospital C, 2011).
The general idea is that there are advantages to be gained by a fully digital and paperless
system; “In de toekomst wil ik dat als ik een patiënt aansluit aan een monitor dat alle gegevens worden
verwerkt in de computer. Daar is zeker nog een efficiëntie slag te halen” (Hospital C, 2011).
Digitalization has conflicting effects on the processes in an ED: there are advantages and
disadvantages. To improve the efficiency and time-savings on the ED, a uniform hospital-
wide software system is preferred by some hospitals and specialists. Some interviewees
have indicated that this is not always the case at the moment. Advantages of digitalization
are for example information transfer and sharing. Disadvantages mentioned by the
interviewees are the increase in time consumption due to the increase of functions
associated with the digital system and the incompatibility between systems. Opinions on
whether a system can be fully digital vary among the interviewees.
5.2.1.2 Analysis
From the literature, hypothesis 3 was formulated for the variable technology:
Hypothesis 3: digitalization of patient data has both a positive and negative effect on the processes in the
ED.
Literature can validate this hypothesis as digitalization has been shown to have both a
positive and to some extent a negative effect on the processes in an ED. Beneficial effects
of digitalization that have been stated in the literature are: a positive effect on the efficiency
of data management, creating more effective and rapid healthcare, the accessibility of
information, a shift to evidence-based medical care, improvement in the quality of patient
care and a reduction in the duplication of data. Digitalization also improves professional
development. A paperless environment reduces transcriptions and charting vast amounts
of patient information and results. Research has however also shown a negative side to
digitalization. It is not always possible to digitalize all documents and some systems are less
compatible with one another. An example of the latter are the compatibility and integration

Femke Lammerts and Elisa van Poelgeest, MSc 19, January 2012
67
of the diagnostic imaging codes with the rest of the software. Also, the literature often
perceives digitalization as being efficient, only if a uniform system is used hospital-wide.
The incorporation of a hospital-wide uniform system contributes to greater efficiency in
accessing information, improving quality and minimizing medical errors. Lastly, the lack of
ease of use of digital systems can adversely affect the specialists’ clinical work in terms of
its supportive function.
Hypothesis 3 can also be validated by the results of the interviews. The opinions of the
interviewees vary, as also stated in the literature analysis above. The benefits of a paperless
system are availability of information, time-saving, efficiency, possibilities for analyzing
processes and insight in areas of improvement due to statistical information in one system
and less printing and reduced printing costs. As expressed in the literature, the interviewees
have also stated that the reason not all papers can be digitalized is due to the
incompatibility of codes in certain areas, like diagnostic imaging. Negative opinions on
digitalization and its effect on the processes within an ED were reflected in the increase in
time spent on importing patient data, the increase in options for importing data and the
potential loss of data when a patient is admitted to a nursing ward where the software
systems are not uniform or hospital-wide.
The analysis above concludes that hypothesis 3 can be validated by both literature and the
results of the interviews.
5.3 Service
Service is one of the seven variables that was investigated during the
interviews. In this section the results are discussed, followed by the
analysis and based on hypothesis 4 (chapter 4). Figure 20 on the left shows
the position of the service variable in the conceptual model.
5.3.1 Quality and performance indicators
5.3.1.1 Results
This section will discuss the certification and the presence of quality and performance
indicators in the hospitals.
Ten out of twelve hospitals are NIAZ-certified. One has his own certification; another has
Figuur 20: Position service variable

Femke Lammerts and Elisa van Poelgeest, MSc 19, January 2012
68
decided to look into another accreditation organization as the NIAZ does not fit the
organization’s structure and management (Louwerse, 2011). Five out of twelve hospitals
have a collaboration agreement with Medirisk. Other items to maintain the quality of the
ED that were stated: internal and external accreditation, inspection of the IGZ, quality
handbook for the ED, digitalize protocols, reporting incidents (VIM melding), peer
reviews, coaching and training, staff qualifications, keeping portfolios of the staff updated,
courses and workshops, technical checks, patient surveys, appointing a professional to
maintain quality, instituting a safety management system and setting quality indicators and
making them transparent. No uniform decision has been taken on this latter point;
“Indicatoren wordt steeds meer op gehamerd. Jammer dat ze nog niet NL breed geaccepteerd zijn, ligt al 5
jaar een voorstel voor 50-60 indicatoren gesteld door een aantal beroepsorganisaties. Knoop wordt niet
doorgehakt. We worden pas de laatste 4-5 jaar resultaatgericht afgerekend en dan nog niet keihard. Omdat
er geen goede indicatoren zijn” (Hospital J, 2011), “Ik vind het vooral belangrijk dat er een intern goed
auditsysteem komt en dat je niet afhankelijk bent van de inspectie die eens in de zoveel tijd langskomt”
(Hospital D, 2011). Quality maintenance and improvement must involve everyone; “Iedereen
kan betrokken worden in het kwaliteitsproces om dingen te verbeteren” (Hospital G, 2011).
In conclusion, all hospitals do actually work with some sort of certification in order to
guarantee the quality of care given. However, certification is not the only measure to ensure
and maintain the quality of the ED. Other examples are inspections by the IGZ,
digitalization of protocols, peer reviews, coaching and training and making the quality
indicators transparent. The latter measure has not been standardized which makes it
difficult to compare hospitals and to work according to a more results-oriented scheme.
The next section will elaborate on the analysis of the quality and performance indicators
which is based on hypothesis 4.
5.3.1.2 Analysis
The following hypothesis was formulated based on the theoretical framework in chapter 4:
Hypothesis 4: standardized performance indicators enhance the quality of the ED.
Performance indicators need to be evidence-based and nationally standardized in order to
compare quality at a national level. They are important for measuring the effectiveness of
the ED system to create transparency and measurability of the quality of healthcare.
Performance indicators also play a role in patient outcomes and clinical conditions.
However, it is difficult for EDs to compare themselves at a national level as the
Femke Lammerts and Elisa van Poelgeest, MSc 19, January 2012
69
performance indicators are not standardized. Furthermore, communication and
digitalization of data have an effect on the quality of performance of the ED. Additionally,
the quality of the ED is maintained through external quality management: certification,
accreditation or visitation.
All hospitals have an internal and external quality management system. They use internal
and external accreditation, are subject to inspections by the IGZ, digitalization of
protocols, reporting incidents, peer reviews, qualifications of staff, courses and workshops,
patient surveys, a safety management system and setting quality indicators and making
them transparent. These measures serve to enhance quality. However, the standardized
performance indicators are still not generally established which makes it difficult to
compare hospitals. Therefore, it cannot be confirmed that standardized performance
indicators enhance the quality of the ED. Yet it can be stated that performance indicators
that are established by the hospitals themselves improve the quality and performance of the
ED.
In conclusion, performance indicators do enhance quality in general but this has not been
specifically measured for an ED as there is no general standardization to date. However,
quality is maintained through other internal and external quality management systems. So
hypothesis 4 can only be partially validated. Further research on the standardized
performance indicators is recommended for further research.
5.4 Employees
The fourth variable is the employees. In this section the focus is on the
emergency department (ED) doctor. A table is presented after the results,
giving a short overview of the presence of and opinion on emergency
(ED) doctors in the different emergency departments (EDs). The results
in this chapter will be followed by an analysis, in which hypothesis 5 of the
literature will be tested for validation. Figure 21 on the left shows the
position of the employee variable in the conceptual model.
5.4.1 Emergency department doctors
5.4.1.1 Results
Emergency department doctors are present in ten of the twelve EDs visited. The
advantages and disadvantages of the presence of an ED doctor on the processes in an ED,
Figuur 21: Position
employee variable
Femke Lammerts and Elisa van Poelgeest, MSc 19, January 2012
70
mentioned by the different interviewees, will be further elaborated on in the following
paragraphs.
Only two out of twelve hospitals do not have ED doctors. Hospital D does not use ED
doctors because it is a teaching hospital that provides training for future trainee specialists
and because the general practitioners cannot refer to ED doctors since it is not a
specialization in those hospitals. They also believe they are functioning perfectly well
without ED doctors; “Wij werken niet met SEH artsen omdat we een opleidingsziekenhuis zijn die
bestemd is voor de AIOS. Verder is een SEH arts een algemene arts en een huisarts kan alleen
doorverwijzen naar een specialist. Het is ook nog steeds een probleem om de vacatures gevuld te krijgen. (...)
Tot op heden functioneren we prima zonder SEH artsen.” (Hospital D, 2011).
The other 10 hospitals do make use of ED doctors. In 9 hospitals, the number of ED
doctors present in the ED is exactly known. It is only known that hospital B and hospital I
has a fulltime ED doctor in the emergency department. Five hospitals indicate that they do
not have fulltime ED doctors. In the case of the other hospitals, the figures are not known.
Six out of 12 hospitals indicate that there are not enough ED doctors to work on a fulltime
basis. According to hospital C, there are not enough ED doctors because of savings in the
medical curriculum. They are starting an internal training study course for acute care
doctors;“De SEH artsen zijn niet te krijgen omdat er op de opleiding bezuinigd wordt. Wij starten nu
een eigen opleiding tot arts geneeskunde.” (Hospital C, 2011). Hospital L confirms that there are
not enough ED doctors to have an ED doctor working full time in the emergency
department; “We kunnen de SEH nog niet 7 dagen in de week 24 uur per dag met SEH artsen
bemannen. (…), maar SEH artsen zijn schaars. Ze zijn er gewoon niet.” (Hospital L, 2011).
Nine of the twelve hospitals declare that they believe that ED doctors enhance efficiency in
the ED process. Three of these nine hospitals indicate that the turnaround time is reduced
by employing an ED doctor. Hospital L even pointed out that their waiting time reduced
by 4 minutes per patient; “De wachttijd gaat dan gemiddeld naar beneden. We begonnen met ongeveer
120 minuten per patient en zitten nu op 116 minuten.” (Hospital L, 2011). Hospital F confirms
that the waiting time is cut because of up-to-date protocols and because diagnostics are
more efficient and effective thanks to the presence of ER doctors on the ED; “Veel
protocollen zijn geactualiseerd en er zijn veel afspraken gemaakt met de afdelingen en medische
beeldvormende techniek en diagnostiek. Sommige diagnostiek wordt overgeslagen om een andere diagnostiek
te doen om sneller resultaat te krijgen. (...) Doorlooptijd wordt bij aanwezigheid van SEH artsen korter.”

Femke Lammerts and Elisa van Poelgeest, MSc 19, January 2012
71
(Hospital F, 2011).
Another drawback to employing ED doctors in the emergency department is that they
cannot perform the tasks they would like to make for greater efficiency. They are more
preoccupied with supervising doctor assistants or specialists in training. Hospital J states
that the ED doctors do not have enough time to prepare a vision and define and institute a
specific policy. Their policy plan for 2015 specified that the ED needs to be an
independent unit where the ED doctor is formally in charge; “SEH artsen komen niet toe aan
visie, beleid en maatschap gesprekken. (…) Hier staat in het medisch beleidsplan dat in 2015 de SEH
een volledig zelfstandige eenheid moet zijn, waarbij de SEH arts de formele baas is” (Hospital J, 2011).
Two out of 12 hospitals make use of a nurse practitioner (NP), namely hospital D and
hospital J. Hospital J indicates that their NPs are performing in the fast track and that they
are acting independently in certain protocols. They can also be used for quality assessment.
However, they believe that NPs should be given more responsibilities; “Ze doen hier de fast
track, ze doen protocollair een aantal dingen zelfstandig. (…) Je kan ze ook gebruiken voor
kwaliteitsbepaling (zorgpaden, protocollen, wachttijden). Ze moeten alleen meer doen dan fast track.”
(Hospital J, 2011) On the other hand, hospital L declares that they are against the use of
NPs. They believe that an NP does not add to the efficiency of an ED. Nurse practitioners
can only perform a small number of extra procedures and these can be done by an ED
nurse as well; “Omdat een nurse practitioner volgens mij niks toevoegt. (…) Er zitten hele lagen en de
nurse practitioner zou dan in een smalle bandbreedte zijn werk moeten doen. Ik denk niet dat we daar
genoeg aanboed voor hebben, dat is één. En twee, ik zie er veel meer in dat je dat deel bij de spoedeisende
hulp verpleegkundige neerlegt.” (Hospital L, 2011). They believe that the nurse practitioner
should play a bigger role in the care of the chronically ill; “Ik denk dat zij een grote rol hebben in
de chronische patiëntenzorg.” (Hospital L, 2011).
Eight of the twelve hospitals worked or are working with volunteers specifically dedicated to
the needs of patients and their family. The use of volunteers or hosts and hostesses is mostly
positively evaluated. This enhances the quality of service to patients. In hospital D, they work
with patient-service employees to take away some of the workload of an ED nurse and to take
extra care of patients that have to wait; “De patientenservice medewerkers nemen een stuk van het
verpleegkundige werk af. Verder regelen zij ook een stuk patiëntenservice.” (Hospital D, 2011). In
contrast, hospital G stopped using volunteers because they found it difficult to define their
tasks and in the long run there was not enough work for them; “Wij werken met vrijwilligers maar
dit is niet positief geëvolueerd. Het probleem is dat het moeilijk is om hun takenpakket goed te definiëren. (...)

Femke Lammerts and Elisa van Poelgeest, MSc 19, January 2012
72
kunnen weinig of niets doen omdat er geen patiënten zijn.” (Hospital G, 2011).
All hospitals have the required training for their nurses and doctors. However, there are
hospitals that provide extra training on specific topics like child abuse and customer
friendliness (Hospital G, 2011). Hospital D organizes symposia and case-study training;
“Symposium en scholing, waarbij er ook verwacht wordt dat er wat mee gedaan wordt. (...) Vier keer per
jaar casuïstiek bespreking met hele keten.” (Hospital E, 2011).
Table 3 below shows an overview of the presence of ED doctors in the EDs at the
different hospitals, as well as the opinions relating to their presence at an ED. When
reading the table horizontally, the presence of ED doctors is confirmed as well as the
opinion regarding their presence per individual hospital. If the table is read vertically, then
the situation of the presence of an ED doctor or the opinion on the presence of an ED
doctor can be read for all the hospital codes.
Hospital
code
ED
doctors
Opinion
A Yes Improvement quality/steady professionals
B Yes Less consultations/improvement complex care
C Yes Not enough ED doctors
D No Not enough ED doctors
E Yes Lower turnaround time
F Yes More efficient shifts, lower turnaround
G Yes More efficient process
H No -
I Yes Take control, central person in process, good support other
professionals
J Yes Should be their own boss on the ED, too much time on supervision
K Yes Too much time on supervision, function not sufficiently incorporated in
organization
L Yes More efficient because of experience, waiting time cuts Table 3: Overview of emergency doctors and opinion on their presence
The opinion on the presence of an ED doctor at an ED is two-fold. Advantages include
reducing turnaround time, cutting waiting time and making the diagnostics process more
efficient. Disadvantages include the time spent on supervision and the time taken up by
ED doctors with secondary responsibilities.
Femke Lammerts and Elisa van Poelgeest, MSc 19, January 2012
73
5.4.1.2 Analysis
Hypothesis 5 was derived from the literature:
Hypothesis 5: the presence of an ED doctor at an ED has more advantages than disadvantages, but the
effect on efficiency at an ED is difficult to substantiate.
Literature can validate this hypothesis. The opinions on the efficiency of ED doctors at an
ED differ. On the one hand, ED doctors can save time on the speed and quantity of the
diagnostics as well on the medical practice. Due to their specific training for ED situations,
ED doctors can economize on waiting and turnaround time by diagnosing and treating
without the involvement of other specialists as well as playing a role in policy- making.
However, research also shows that organization itself determines the quality of the ED and
not the type of doctor. The lack of a uniform training program and the low number of ED
doctors currently employed makes it difficult to fully investigate their effect on the
efficiency of an ED.
The results of the interviews can validate the ‘twofold’ effect of the presence of an ED
doctor at an ED. The outcomes of the interviews have, as in the literature, confirmed the
positive factor of reducing waiting and turnaround times. Also, interviewees mentioned
that diagnostics are more efficient due to the presence of an ED doctor. The results have
also indicated the disadvantages of the presence of an ED doctor, namely the time spent
on supervision and thus the time lost and taken up with tasks other than their primary tasks
and responsibilities. The shortage of ED doctors is also confirmed by several interviewees,
which makes it difficult to measure the overall efficiency of an ED. ED doctors, as
expressed by most interviewees, cannot be employed fulltime as an ED doctor. Also,
hospitals develop their own training program to educate ED doctors, which confirms the
non-uniformity in training programs for ED doctors found in the literature. This also
makes it difficult to measure the effect of ED doctors on the ED.
Hypothesis 5 can be validated by both the literature and the results of the interviews.

Femke Lammerts and Elisa van Poelgeest, MSc 19, January 2012
74
5.5 Logistics
Logistics is the fifth variable that influences the efficiency of the
processes. This section is divided into two subdivisions, namely the triage
process and the waiting time and the process within the ED itself. In each
subdivision, the results will be discussed as well as the analysis of the
literature and interviews. In the analyses, hypotheses 6 and 7 stated in the
theoretical framework (chapter 4) will be tested for validation. Figure 22
shows the position of the logistics variable in the conceptual model.
5.5.1 Triage process and triage systems
5.5.1.1 Results
These results contain the triage systems the hospitals use, as well as the time prior to triage.
Eight out of twelve hospitals use the Manchester triage system. Only hospital H does not
use a triage system. They judge people based on a clinical view; “Wij bepalen patiënten nu op
basis van een klinische blik maar niet vanuit een methodiek” (Hospital H, 2011). Hospital K uses
the Nederlandse Triage standard (NTS) system for patient triage. They used to use the
MTS but switched to NTS with the arrival of the integrated HAP. It was more efficient to
make use of one triage system; “Manchester hebben we gehad en met komst van spoedpost zijn we
overgegaan op 1 systeem omdat het handiger is als je in één systeem werkt.” (Hospital K, 2011).
However, hospital D declared that NTS does not work for their hospital since it triages
patients with a purpose other than that for a HAP; “Wij hebben gekozen voor een andere (triage
systeem) omdat wij met een ander doel triëren. Sowieso werkt het NTS niet voor een ziekenhuis.”
(Hospital D, 2011). Ten of the twelve hospitals use a triage nurse to assess patients.
However, hospital E uses a ‘co-ordination’ nurse that also does the triage instead of a triage
nurse; “We hebben niet formeel een triage verpleegkundige, maar een coördinerend verpleegkundige die ook
de triage doet.” (Hospital E, 2011).
The time taken for triage to commence is stated as between 5-10 minutes. Most of the EDs
mention it is feasible to start a triage within 5-10 minutes, unless it is very busy or the
software is not available throughout the ED. Waiting times then increase and in some cases
assistance is requested from other ED staff; “Komt ook omdat het NTS nog niet geïntegreerd is,
maar stand alone op 1 plek” (Hospital K, 2011), “De patiënten moeten binnen 10 minuten getrieerd
worden. Dat halen we redelijk goed” (Hospital G, 2011).
Figuur 22: Position logistics
variable

Femke Lammerts and Elisa van Poelgeest, MSc 19, January 2012
75
In conclusion, most hospitals make use of the Manchester triage system. However, it is not
indicated by the hospitals as being the most efficient triage system. Finally, most of the
EDs point out that triage starts within 5 minutes of a patient’s arrival.
5.1.1.2 Analysis
The following hypothesis was formulated in the theoretical framework for the sub-chapter
on triage systems:
Hypothesis 6: a triage system has an effect on the efficiency of processes in the ED.
In the literature, it can be found that the advantages of a triage system are the immediate
assessment of patients, the positive effect on waiting times in the waiting room,
prioritization of care, placement of patients in the correct treatment room or area and
being able to start diagnostic tests. What’s more, the different triage systems have their own
advantages and disadvantages and should be adjusted to the requirements of the hospitals
themselves. From the different triage systems, MTS is seen as most compatible with the
Dutch EDs.
The results do not give an indication as to whether the implementation of a triage system
makes the processes of the ED more efficient. Therefore, hypothesis 6 cannot be validated
and should be considered in the recommendations for further research in line with
hypothesis 6 below.
Hypothesis 6: a triage system has an effect on the efficiency of processes in the ED
5.5.2 Waiting time and processes in the emergency department
5.5.2.1 Results
The results state the different bottlenecks encountered in the processes within the ED.
Firstly, the lack of diagnostic equipment is discussed, followed by the dependency of
specialists that work in their own outpatients’ clinics. Further bottlenecks are the
deployment and inexperience of doctor assistants as well as the uncertainty concerning the
allocation of a patient to a particular specialism. This latter bottleneck refers to the
admission of patients to the hospital. This is followed by a discussion of the results of
turnaround and waiting times at the various hospitals. Lastly, the peak patient flow times
are elaborated on.
The interviewees at six hospitals indicate that the lack of diagnostic equipment in the ED
Femke Lammerts and Elisa van Poelgeest, MSc 19, January 2012
76
creates bottlenecks in the process. Hospital F declared that it is difficult to make clear
agreements with the radiology department to give priority to ED patients; “Het is soms
moeilijk afspraken te maken met de afdeling medisch beeldvormige techniek.Zij hebben ook hun
programma’s en er is geen aparte kamer voor de SEH.” (Hospital F, 2011).
Another bottleneck in the process is that emergency departments are dependent on
specialists who work in their own outpatients’ clinics. Six of the twelve hospitals
interviewed indicate that this factor delays their processes significantly. According to
hospital G, it takes up more time to work with specialists from outpatients’ clinics instead
of fixed specialists within the ED itself; “Wij werken met specialisten vanuit de poli’s, dat kan wel
eens extra tijd opleveren.” (Hospital G, 2011). This is confirmed by hospital L that declares
that consultation by an ‘outside’ specialist, is more time-consuming; “En natuurlijk als je op
een specialist moet wachten, gaat er over het algemeen meer tijd overheen.” (Hospital L, 2011).
According to hospitals D, F, G and J, the deployment and inexperience of doctor
assistants, constitutes one of the factors influencing inefficiency in the process within an
ED. Hospital D states that doctor assistants merely have too many patients to treat.
However, this situation is improved slightly by employing a fixed specialist in the ED itself;
“Arts-assistenten hebben gewoon te veel patiënten te verwerken. We zien wel dat het verbeterd door het
inzetten van een specialist op de SEH, maar je kan het nooit helemaal wegnemen.” (Hospital D, 2011).
Hospital F focuses on the fact that the doctor assistants are young and need extra training
to function in the emergency department. This affects turnaround time; “Die (arts-assistenten)
moeten ingewerkt worden voordat ze wat klinische ervaring hebben, en dat merk je in de doorlooptijden.”
(Hospital F, 2011).
Another bottleneck according to hospital G and I, is that sometimes it is not clear to which
specialism the patient should be referred. As a result incorrect referral entails extra
consultations. Precisely speaking, Hospital I states that if the patient cannot be clearly
referred to a particular specialism, then the ED doctor will determine the specialist
department of referral. This means that the ED doctor decides which specialism the patient
should be referred to. This leads to inefficiencies in the process; “Als een patiënt niet duidelijk
is voor één specialisme, dan bepaalt de SEH arts voor welk specialisme de patiënt naar een bepaalde
afdeling gaat. De specialisten zoeken het daar maar uit.” (Hospital I, 2011).
Two out of the 12 hospitals indicate that the bottleneck in the process is to be found at the
patient admissions procedure at the hospital. The waiting time of patients increases because

Femke Lammerts and Elisa van Poelgeest, MSc 19, January 2012
77
of the lack of availability of staff to collect patients; “Als een patiënt opgehaald moet worden door
een afdeling, dat moet dan binnen 15 minuten gebeuren. (…) Daar zitten we over het algemeen overheen.
En dat heeft ook met de afdeling te maken die dan geen beschikbaarheid heeft.” (Hospital L, 2011).
The turnaround time ranges from 5 minutes to 420 minutes, with the average time
between 116 and 180 minutes. Hospital E has the lowest turnaround time, but also the
highest range. Turnaround time is influenced by the type of specialism; “Per specialisme heb je
ook gemiddelden en je zou het eigenlijk per specialisme moeten bekijken” (Hospital E, 2011). The
multidisciplinary nature of a patient’s assessment and treatment is often stated as the major
impact factor on turnaround time; “Als patiënten lang op de SEH moeten verblijven dan komt dat
vaak omdat het multidisciplinair is. Wij werken met specialisten vanuit de poli’s dat kan wel eens extra
tijd opleveren. Als dan blijkt dat de patiënt toch niet voor het juiste specialisme is aangemeld dan moeten er
extra consulten gedaan worden. Dat kost gewoon efficiëntie” (Hospital G, 2011). Other influential
factors stated are inexperienced doctor assistants, increasing patient complexity itself
together with an increasing number of complex patients, misinformation from the GP to
the patient about waiting times at the ED, multidisciplinary consultations, admissions,
waiting for diagnostic tests or results, dependency on third parties, non-urgent patients
visiting the ED instead of the HAP and overcrowding; “30% zelfverwijzers, waarvan 15% op de
SEH thuis hoort. Ongeveer 10 mensen per dag kon gewoon naar de huisarts” (Hospital I, 2011), “De
complexiteit van wat wij aanbieden, ligt vrij hoog en daardoor is de doorlooptijd hoger” (Hospital C,
2011), “De wachttijden lopen vooral op door de complexere zorg die patiënten vragen. De kamers die je
wilt gebruiken voor laag complexe zorg worden nu bezet door patiënten die hoog complexe zorg vragen. Dus
patiënten in een lagere urgentie categorie komen niet meer aan de beurt” (Hospital B, 2011), “Verder
gebruiken specialisten de SEH om de patiënt verder in kaart te brengen omdat zij er geen tijd voor hebben.
Daardoor moeten de arts-assistenten het hele onderzoek opnieuw doen. Dat kost tijd en vooral efficiëntie”
(Hospital G, 2011). Solutions to cutting the stated waiting times were the use of an acute
admissions ward (acute opname afdeling), using care paths, more responsibilities for the
general practitioner (GP), providing better and accurate information to patients before
admissions and during the ED process itself, better communication and co-operation
between ED staff, fast track and a good overview of the patients and processes for the ED
staff (digital board) to monitor and give a clear picture of the situation and leave room for
initiative and anticipation; “De huisartsen hebben de rol om overbrugingszorg te bieden en zij denken
dat als we dichter bij het ziekenhuis zitten dan wordt de drempel alleen maar lager. De SEH denkt echter
dat veel patiënten geen echte eerste lijnszorg of tweedelijnszorg nodig hebben” (Hospital B, 2011), “Er
Femke Lammerts and Elisa van Poelgeest, MSc 19, January 2012
78
valt meer efficiëntie te behalen in een vaste kern van arts assistenten op de SEH” (Hospital F, 2011),
“Zorgpaden zijn niet de oplossing voor alles, maar met name voor een interdisciplinair proces is het handig
om een zorgpad te hebben” (Hospital A, 2011), “Het EPD geeft gelijk een routingsscherm. Iedereen
werkt vanuit zo een routingsscherm. Het is heel handig. In één blik heb je in de gaten hoe druk het is en
wat de belasting is” (Hospital I, 2011).
The peak period is similar in all the EDs. Inflow starts around noon and dies down mid-
evening. The busiest times are mentioned as Mondays and Fridays, because patients tend to
visit the GP just before the weekends or cannot get an appointment just after the weekend;
“Dat zijn patiënten die na het weekend toch nog naar de huisarts of SEH gaan. En voor de vrijdag geldt dan
hetzelfde, alleen dan andersom. Voor het weekend ga je toch maar even naar de dokter” (Hospital L, 2011).
In conclusion, different bottlenecks delay the processes within the ED and therefore also
increase the waiting time for patients. There are 5 bottlenecks indicated by the hospitals
interviewed: the lack of diagnostic equipment in the ED, consultations by specialists that
work in their own outpatients’ clinics which is most time-consuming, the inexperience of
doctor assistants has a negative effect on turnaround time, no clear referral to a certain
specialism which could entail extra consultations and admission to the hospitals. All these
bottlenecks cause extra turnaround time in the ED process. Finally, peak periods at the
EDs are generally the same, namely a normal distribution spread with a peak from around
noon until mid-evening. Busiest times are Mondays and Fridays.
5.5.2.2 Analysis
The following hypothesis was deduced from the research of the theoretical framework on
waiting times and processes within the ED:
Hypothesis 7: waiting time can be reduced by eliminating bottlenecks.
The waiting time is one of the most difficult bottlenecks to eliminate. The Theory of
Constraints (TOC) is often used to reduce bottlenecks in their processes. By implementing
this theory, the processes in the ED become more efficient and effective. Non-productive
time in an ED can be cut by reducing preparation time, the use of appropriate supplies,
available and accessible information as well as performing the right procedures. The goal of
TOC is to completely eliminate non-productive time.
Several bottlenecks were revealed during the interviews such as the lack of diagnostic
equipment in the ED the dependency on specialists from outpatients’ clinics, the

Femke Lammerts and Elisa van Poelgeest, MSc 19, January 2012
79
deployment and supervision of inexperienced doctor assistants, extra consultations because
of the ‘undifferentiation’ and non-specificity of patients and the admission of patients to
the hospital. These bottlenecks impact on waiting times. Measures designed to improve the
elements expressed above will reduce waiting times.
In conclusion, waiting times can be reduced but never completely eliminated. As such,
hypothesis 7 can be validated.
5.6 Finances
Finance is one of the variables that influence the optimization of the
processes in the emergency department (ED). The next section will first
elaborate on the results of the interviews in the twelve hospitals. This is
followed by an analysis based on hypothesis 8. Figure 23 shows the position
of the finance variable in the conceptual model.
5.6.1 Financial system of the emergency department
5.6.1.1 Results
The results in this section cover the financial systems that are used by the various hospitals.
It also gives on overview of the opinions on the new DOT system that will be established
as per 2012.
The majority of the hospitals state that revenues are very difficult to calculate as patients
that visit the ED and have repeat consultations cannot be traced as revenue for the ED;
“Het is niet te berekenen hoeveel een SEH precies opbrengt. Het is niet duidelijk als patiënten terugkomen
op de poli dat het de SEH is die geld opbrengt.” (Hospital G, 2011). This is confirmed by
hospital G that indicates that an ED can calculate what the costs and revenues are up to a
certain point. However, it is difficult to calculate what the ED generates via repeat or
follow-up consultations; “(..) SEH’s kunnen berekenen wat het kost en wat het opbrengt. Het is wel
moeilijk om te berekenen wat het oplevert aan herhaal consulten.” (Hospital H, 2011).
Hospitals C, E and K indicate that the ED is loss-making per definition because it
constitutes a cost center; “Elke SEH is per definitie verlieslatend want het is een kostencentrum.”
(Hospital C, 2011). On the other hand, seven out of the twelve hospitals point out that the
Figuur 23: Position finance
variable

Femke Lammerts and Elisa van Poelgeest, MSc 19, January 2012
80
ED generates money for the hospital elsewhere. The ED itself operates according to a
budget construction so it cannot be ascertained just how much revenue it generates.
However, the follow-up consultations at outpatients’ clinics do generate money for the
hospital at specialist level; “De SEH heeft altijd een kostenbegroting en dan komt het geld elders in
huis binnen.” (Hospital D, 2011). According to hospital F, the ED does generate income.
However, such income only appears at the specialist level via outpatient visits but not on
the ED balance sheet; “Wij genereren veel inkomsten door opname en het eerste poliklinische bezoek.
Dit wordt terug gezien bij het specialist niveau, niet bij de SEH.” (Hospital F, 2011).
Concerning the implementation of DOT, opinions vary from hospital to hospital.
However, most hospitals state that they do not see any advantage in changing DBC into
DOT. Hospital B indicates that their products are not covered in DOT for complexity
reasons; “Ik denk niet dat dit gaat helpen. Ten eerste zijn onze producten daarin niet goed gedekt. Die
complexe zorg die wij leveren wordt daar niet in gedekt.” (Hospital B, 2011). According to hospital
H, the encoding of self-referred patients will become questionable; “DOT wordt op basis van
een verwijzing gecodeerd. Als je weet dat éénderde bij ons zelfverwijzers zijn, dan is nog maar de vraag hoe
deze zullen gecodeerd worden.” (Hospital H, 2011).
In conclusion, hospitals state that it is difficult to calculate if the ED is generating money.
The interviewees indicate that in itself the ED constitutes a cost center but also generates
revenue for the hospital via follow-up consultations. Opinions about the implementation
of DOT vary significantly per hospital. Generally, most hospitals do not believe that DOT
will create greater efficiency.
5.6.1.2 Analysis
The following hypothesis was stated in the theoretical framework on the financial system:
Hypothesis 8: it is difficult to determine the profitability of an ED.
According to the literature, the social care system in the Netherlands makes it difficult to
determine the profitability of EDs. There is no DBC code for the ED. Visits to the ED are
incorporated in the DBC codes for specific diagnoses. In precise terms, this means that if
you have appendicitis, a small part of the DBC code is apportioned to a visit to the ED. It
is also stated that the outlay for the costs of ‘readiness’ for and ED and being prepared is
the same regardless of patient volume (Taheri, Butz, Lottenberg, Clawson, & Flint, 2004).
Neither does the literature give a clear perception of the financial situation of EDs in

Femke Lammerts and Elisa van Poelgeest, MSc 19, January 2012
81
general. It is only stated that the low-care unit is profitable in the ED where revenues are
used to finance the medium and high-care units. The only statement that can be found is
that EDs are cost centers that work with budgets.
The results confirm that there is no clear overview of revenues generated by the ED. The
majority of the hospitals indicate that revenues are difficult to calculate because of follow-
up consultations that cannot be traced as revenue for the ED. Follow-up consultations are
booked in under the DBC codes of specialists. The research does not confirm that EDs are
loss-making since the department is generating money for the hospital elsewhere. The
follow-up outpatient consultations do indeed generate money at the specialist level. Only
two hospitals indicate that EDs are loss-making per definition since the ED is itself a cost
center.
In short, hypothesis 8 is confirmed by the literature as well by the results of the research.
However, more research should be conducted in order to reach a general conclusion that
there is no clear overview of ED-generated revenues. A hypothesis for further research
could be:
Hypothesis 8: An emergency department is profitable.
5.7 Patient satisfaction
This section gives an overview of the results of the interviews in the twelve
hospitals. Hypothesis 9 is then tested for validation. Figure 24 on the left
indicates the position of the patient satisfaction variable in the conceptual
model.
5.7.1 Patient satisfaction
5.7.1.1 Results
The nature of the complaints from patients is a reflection of a patient’s satisfaction. This
section will elaborate on the complaints from patients and the role of volunteers in an ED.
Of the three EDs with an annual complaints score under 10, two are EDs with an
integrated HAP (hospitals A and E). For those EDs with complaints amounting to
Figure 24: Position patient satisfaction
variable

Femke Lammerts and Elisa van Poelgeest, MSc 19, January 2012
82
between 20 and 30 annually, there is a plan for an integrated HAP and ED. The most
common complaints are courtesy, communication towards the patient during the entire
process, wrong diagnosis/treatment, waiting times, receiving attention and the supply of
information; “Wat in ieder geval de bedoeling is is dat je bij de triage aangeeft wat de urgentie code is en
hoe lang de wachttijd is. En als ze in het traject zitten, dat ze goed geïnformeerd worden waar ze zitten in
het traject. Als het heel druk is, dan gaat het daar mis […]het gaat om het bakkie koffie, om de
aandacht, om de kleine dingen, om informatie, om hoe ze ontvangen zijn, hoe ze te woord gestaan zijn,
bejegening, voelt de patiënt zich gehoord” (Hospital L, 2011). The interviews have indicated that
the presence of a volunteer or ward assistant, who interacts with the patient and supports
the nurse in certain tasks, has a positive influence on patient satisfaction; “Een gastvrouw
maakt ook deel uit waarom we zo weinig klachten hebben. Zorgt voor patiënt en familie. In piektijden
aanwezig en begeleiden het hele traject” (Hospital A, 2011). Hospital E has won a prize for the
concept of ‘room service’, in which the extras in addition to the expected treatment are
seen as important impetus for satisfaction; “Service is heel belangrijk. De patiënt komt niet voor de
kwaliteit want dat verwacht hij, hij komt voor de extra dingen” (Hospital E, 2011). Hospital G
declared it had experimented with using volunteers, but that reactions were not positive as
the tasks of the volunteers were not well-defined; “Wij werken met vrijwilligers maar het is niet
positief geëvolueerd. Het probleem is dat het moeilijk is om hun takenpakket goed te definiëren. De mensen
komen met de intentie om mensen te helpen maar dan komen ze hier en dan kunnen ze niets of weinig doen
omdat er geen patiënten zijn. Ze willen wel andere dingen doen zoals kamers bijvullen maar dat moet door
een verpleegkundigen gedaan worden. Wij werken ook niet met afdelingsassistenten” (Hospital G, 2011).
To summarize, complaints in the twelve EDs mainly concerned courtesy, communication
towards the patient during the entire process, wrong diagnosis/treatment, waiting times,
receiving attention and the supply of information. The function and effect of volunteers
has been generally experienced as having a positive effect on patient satisfaction.
5.7.1.1Analysis
From the literature the following hypothesis was derived:
Hypothesis 9: verbal communication towards a patient in the ED plays an important role in patient
satisfaction.
Literature can validate hypothesis 9. The CQ index (Consumer Quality Index) has
identified nine important steps that affect the satisfaction of a patient visiting the ED. This
literature has indicated that communication is crucial at all stages and levels within the ED,

Femke Lammerts and Elisa van Poelgeest, MSc 19, January 2012
83
especially concerning waiting times and information and communication between patients
and staff. Research has indicated that patients are also influenced by the patient-nurse or
patient-physician relationship, in which communication, courtesy and building a good
patient-physician relationship are considered as crucial elements in the realization of those
relationships. Communication between patient-staff and between staff themselves has been
pointed out as a frequent area for improvement in patient satisfaction. Also,
communication about the stay at the ED, waiting times, after-care and consistency in the
treatment information were indicated as important verbal communication factors playing a
role in patient satisfaction. Research has indicated the importance of patient-centered care
(PCC), in which communication plays an important role in patient satisfaction. Also, the
presence of volunteers guiding the patients through the process in the ED is seen to
enhance patient satisfaction.
The results of the interviews can also validate hypothesis 9. The interviews revealed
complaints frequently mentioned by patients such as a lack of communication towards the
patient during the entire process, communication relating to waiting times and the supply
of information. Improvements in these domains, as also mentioned in the literature above,
will enhance patient satisfaction. Those interviewees working with a volunteer system
indicated that this has a beneficial effect on patient satisfaction.
In conclusion, hypothesis 9 can be validated by both the literature as well as the results of
the interviews.
5.8 Overview of the hypotheses and their validation
The hypotheses below were validated by both literature and the results of the interviews.
Some hypotheses could be validated, but also required more extensive research. These
hypotheses are stated below, but reformulated for further recommendations:
Hypothesis 1: Hypothesis 1: the layout of the ED affects the long-term success of
its processes.
Hypothesis 3: digitalization of patient data has both a positive and negative effect
on the processes in the ED
Hypothesis 5: the presence of an ED doctor at an ED has more advantages than
disadvantages, but the effect on efficiency at an ED is difficult to substantiate

Femke Lammerts and Elisa van Poelgeest, MSc 19, January 2012
84
Hypothesis 7: waiting time can be reduced by eliminating bottlenecks
Hypothesis 8: An emergency department is profitable
Hypothesis 9: verbal communication towards a patient in the ED plays an
important role in patient satisfaction
Some hypotheses could only be validated partially or not at all by the interviews. Some of
these hypotheses were restated or left in their original state, depending on the validation.
These hypotheses will be further elaborated on in the recommendation for further research
(chapter 6):
Hypothesis 1: an admissions ward has a positive effect on the overcrowding and
throughput of an ED (reformulated from original hypothesis 1)
Hypothesis 2: the integration of a HAP and an ED improves the efficiency and quality
of care at a lower cost
Hypothesis 4: standardized performance indicators enhance the quality of the ED
Hypothesis 6: a triage system has an effect on the efficiency of processes in the ED
Hypothesis 8: An emergency department is profitable (reformulated from the original
hypothesis 8)

Femke Lammerts and Elisa van Poelgeest, MSc 19, January 2012
85
6. Conclusion
6.1 Introduction
This chapter presents the answer to the central research question, as well as the answers to
the twelve related sub-research questions. As mentioned in chapter 1, the aim of this
research is firstly to investigate which variables contribute to the efficiency of an emergency
department in the Netherlands and secondly how the latter contribute to developing the
optimal emergency department (ED). Based on these findings, recommendations on the
optimal emergency department can be made for Loek Winter, co-founder of the
MC|Groep. The following central research question is applicable:
Which variables influence the efficiency of an emergency department, and how can these variables be used to
create the optimal emergency department?
To answer the central research question, the twelve research questions must first be
answered. These are discussed in the following paragraphs, after which the central research
question will be answered. This will be followed by recommendations for Loek Winter (co-
founder MC|Groep) who commissioned the actual research. Finally, the limitations and
recommendations for further research will be discussed.
6.2 Conclusion research questions
The first research question was based on the literature and discussed the definition and
characteristics of an ED. An ED can be classified as a fully operational ED when it has
24/7 availability and the hospital itself comprises at least the following eight specific
specializations: internal medicine, surgery, gynecology/obstetrics, pediatric medicine,
neurology, cardiology, ear-nose-throat (ENT) medicine and ophthalmology. The Dutch
health inspectorate requires EDs to examine every patient that visits an ED. An ED
provides medical and nurse-related care to patients visiting the ED. These patients enter an
ED with traumas or acute health problems.
The second, third and fourth research questions discussed the definitions relating to
efficiency and optimization and their interrelation. Efficiency refers to the method of
operations and is often referred to in the literature as the efficiency variable. From the
various definitions in the literature, efficiency was defined as ‘the capability to provide and
order a level of service that is sufficient to meet the patients’ healthcare needs, where

Femke Lammerts and Elisa van Poelgeest, MSc 19, January 2012
86
operations and processes are questioned as to their relevance with a view to achieving
strategic outcomes and where the healthcare resources are used in such a way as to get the
best value for money’. The goal of optimization is to design a system or process as
functional and perfect as possible. Continuous improvement is important as healthcare is in
itself dynamic and it is seen as the progression towards optimization. By continuously
improving and re-determining the efficiency of the system and its individual processes,
progress is made towards an optimal situation. Thus, optimization can be achieved by
making the system and its individual processes as efficient as possible.
The fifth research question identified the variables that contribute to the efficiency of an
ED. Seven variables were extrapolated and identified from the literature; infrastructure,
technology, service, employees, logistics, finance and patient satisfaction. The research
questions relating to these variables will be discussed in the following paragraphs.
The sixth research question discussed the relation between infrastructure and efficiency.
Discussed were the layout of an ED and the presence of a HAP (general practitioners’ co-
operation). The layout of an ED impacts on the efficiency of the processes in and overview
of an ED and so hypothesis 1 could be validated. These processes include the throughput
time and improvements in overcrowding. Literature and interviews have indicated that
physical layout is also shown to have an effect on the efficiency of an ED, especially the
ballroom or linear layouts for the ‘transparency’ of the ED, easy accessibility to the central
nursing station for both patients and staff and also to enhance patient satisfaction. In
addition, uniformity in treatment room layout makes for greater flexibility and ease of
patient placement. The literature stated that centralizing primary processes and placing
secondary processes in the periphery can make ED processes more efficient. Interviews
validated this added there should also be a distinction made between urgent and non-
urgent patients for example by means of a fast-track. Optimal efficiency can also be
achieved by the right location for diagnostic imaging. Hypothesis 2, relating to the
efficiency of integration between the ED and the HAP (general practitioners’ co-operation)
could be validated in the literature, but not through the interviews themselves. Literature
has proven that the efficiency of an integrated ED and HAP lies in the redirection of non-
urgent patients which can in turn also improve the quality of care. However, interviews do
not fully validate the efficiency of an integrated HAP, due to the resistance of general
practitioners and the lack of sufficient specific data from the interviews. Concluding, the
layout has an effect on the processes of throughput time and reducing overcrowding, the

Femke Lammerts and Elisa van Poelgeest, MSc 19, January 2012
87
effect of presence of a HAP and the effect on efficiency have not been validated and will
need to be further investigated.
The seventh research question related to technology and efficiency, in which its positive
and negative effects on the processes of an ED are validated by both literature and
interviews. Technology consists of the digitalization of patient data. Literature and
interviews state that efficiency in the digitalization of data can benefit the following
processes in an ED; data management efficiency, creating more effective and rapid
healthcare, the accessibility of information, a shift to evidence-based medical care,
improvement in the quality of patient care and a reduction in the duplication of data.
Digitalization can save time as it is accessible everywhere, but may also be time-consuming
due to problems in compatibility between systems and codes, the increase in the number of
functions that can be implemented by specialists and loss of data when data is digitalized.
The processes within an ED will become more efficient if digitalization, a paperless system
and a software system are applied in a uniform manner throughout the hospital. Efficiency
in the latter is seen as contributing to a more efficient and cost-effective way of accessing
information and minimizing medical errors.
Research question eight elaborated on the quality and performance indicators. The impact
of these indicators on efficiency issues could not be validated by the interviews. Literature
has however indicated that standardized performance indicators enhance the quality of the
ED, as they create transparency and make national comparisons between EDs easier. Thus
the effectiveness and quality of an ED can be measured, bottlenecks can be identified and
improved and where possible resolved to make for greater efficiency throughout the ED.
Quality and performance indicators for the EDs in the Netherlands have not yet been
standardized, thus no conclusion can be reached as to their effect on the efficiency of the
processes within the EDs. Quality in an ED is maintained through other internal and
external quality management systems, where the internal systems are developed by the
hospitals themselves.
Research question nine elaborated on the relation between the presence of an emergency
department (ED) doctor and the impact on the ED’s efficiency. Literature and interviews
alike have revealed more advantages than disadvantages when there is an ED doctor
present. The benefits of the presence of an ED doctor in relation to the efficiency of an
ED can be summed up as follows: time savings in terms of speed and number of
Femke Lammerts and Elisa van Poelgeest, MSc 19, January 2012
88
diagnostic tests, reduction in waiting and turnaround times, no need for repeated
consultations with other specialists and time for policy-making. Disadvantages mentioned
were the time lost in the supervision of doctor assistants and the generalist nature of an ED
doctor compared to the specialists consulted by an ED. Interviews have indicated that in
the Netherlands, the beneficial effect of the presence of an ED-dedicated doctor on the
efficiency in an ED is difficult to measure, in view of the scarcity of ED doctors
themselves, the shortage of ED doctors in full ED employment plus the lack of uniformity
in training programs.
The tenth research question covered the logistics of an ED, divided into triage systems and
waiting times. According to the literature, the efficiency of triage systems lies in the
following processes; reduction in waiting-room times, prioritization of care and the correct
placement and allocation of patients. The Manchester Triage System (MTS) is considered
the triage system as having being the most compatible with EDs in the Netherlands as per
the literature and as reflected in the fact that most of the interviewed EDs were using the
MTS system. However, the effect of a triage system on the efficiency of the processes in
the ED did not become apparent during the interviews themselves. Concerning waiting
times, both the literature and interviews have indicated that waiting times can be cut by
eradicating bottlenecks in those ED processes that affect waiting time. Bottlenecks
mentioned were the absence of diagnostic equipment located in the ED, dependency on
specialists outside the ED, supervision of inexperienced doctor assistants, extra
consultations due to non-specific patients and patient admissions procedure. Bottlenecks
can be identified and reduced by using the Theory of Constraints (TOC). The
implementation of this theory can enhance the processes within the ED.
Research question eleven focuses on the financial system in an ED. Both the literature and
the interviews have shown that the determination of the profitability of an ED in the
Netherlands is difficult. DBC codes for the ED are incorporated in the DBC codes for a
diagnosis, thereby resulting in the non-transparency of ED visit costs. Low-care units
finance the medium and high-care units. EDs are seen as costly, mainly due to the
consequences of their permanent availability function. On the other hand, the ED yields
revenue for the hospital through patient admissions and follow-up consultations. However,
no clear overview of revenues generated by the ED exists as yet.
The last research question explored the relation between patient satisfaction and efficiency.

Femke Lammerts and Elisa van Poelgeest, MSc 19, January 2012
89
Efficiency in the processes in an ED resulted in less complaints and a lack of efficiency led
to more complaints by patients. Here, verbal communication plays an important role,
especially with regard to waiting times, the communication of information and the relation
between patient and ED staff. These are areas where major improvements can be made.
Verbal communication during the stay at the ED, after care and consistency in the
information about treatment are also important factors contributing to patient satisfaction.
By tackling the bottlenecks and the inefficiencies, patient satisfaction can be improved and
the number of complaints reduced. The importance of verbal communication will become
more important in the 21st century owing to the new focus on Patient-Centered Care
(PCC). The use of volunteers has proven to be a useful way to improve communication
towards patients and between patient and staff.
All the research questions have now been answered. The answer to the central research
question will be presented in the following paragraph.
6.3 Conclusion central research question
Efficiency can be seen as the various steps needed to achieve an optimal situation. In this
paper, the definition of efficiency was defined as ‘providing and commissioning a level of
service that is sufficient to meet a patient’s healthcare needs, where operations and
processes are questioned and investigated as to their relevance to achieve the strategic
outcomes and where healthcare resources are used in such a way as to get the best value for
money’. Seven variables were identified as having an influence on the processes in an ED,
thereby influencing its efficiency; infrastructure, technology, service, employees, logistics,
finance and patient satisfaction. The manner in which these variables affect efficiency was
expounded in the previous paragraph in which the research questions were answered.
However, to create an optimal ED by using the seven variables, these variables must be
manipulated and used in such a way as to maximize their efficiency within the ED in
relation to the processes associated with those individual variables. Only when the
processes are implemented efficiently will it be possible to develop an optimal ED.
Continuous on-going improvement is vital. Only by first determining and then
continuously improving a system’s efficiency and its individual processes, can progress
towards an optimal situation be achieved. This is where the Theory of Constraints (TOC)
can contribute to reducing bottlenecks and make for a more efficient, effective and optimal
ED which is indeed the ultimate goal (of this paper). From a patient perspective, the

Femke Lammerts and Elisa van Poelgeest, MSc 19, January 2012
90
Patient Centered Care (PCC) should be adopted to improve patient satisfaction, as this is
becoming increasingly important in the 21st century. It must be noted however that the
optimal ED does not exist and is dependent on different factors. An ED can be designed
as optimal as possible, only when taking into account the resources, culture and location of
that individual ED.
To answer the central research question in short; literature has shown that the efficiency of
an ED is influenced by seven variables and when manipulated in a different ways can add
to an optimum situation in the ED. However, not all of these seven variables could be
validated by the results of the interviews and should therefore be investigated in further
research. The optimal ED does not exist, as resources, culture and location of the
individual ED must be taken into account when designing the optimal ED. In turn, the
seven variables must be manipulated in an ED on an individual level accordingly.
6.4 Recommendations for the MC|Groep
In the light of the answers to the central research and twelve sub-research questions, the
following recommendations can be posed for Loek Winter (co-founder of the MC|Groep).
ED layout – It is recommended to pay sufficient attention to ED layout, taking into
account both physical layout and general appearance. Not only does layout impact on
ED’s processes, but also on patient satisfaction. A ballroom setting is recommended to
create visibility, accessibility, overview and transparency for both patients and ED staff.
Also, uniformity of treatment room layout, makes for flexibility in the placement of
patients. Additionally, separating out the central and peripheral processes, as well as urgent
and non-urgent patients, will add to the efficiency of an ED.
Digitalization of data – It is recommended to use a uniform software system throughout
the hospital and digitalize all patient data to make for a more efficient and cost-effective
method of accessing information and minimizing medical errors.
ED doctor – Although it is difficult to measure the effects of efficiency to date, the
benefits extrapolated from the interviews became apparent. A pilot should be initiated to
test the effects of the ED doctor within the ED itself.
Waiting time – If not already implemented, it is recommended to use of the Theory of
Constraints (TOC) to identify bottleneck and enhance the processes within the ED,

Femke Lammerts and Elisa van Poelgeest, MSc 19, January 2012
91
including the reduction of waiting times.
Finances - EDs are seen as costly, mainly due to the consequences of their permanent
availability function. Before embarking on the process of making the ED more efficient, a
clear overview of the costs and revenues should be obtained. By so doing, those areas that
are costly can be identified and further research conducted to investigate how to make the
process more efficient whilst reducing costs. As the ED yields revenue for the hospital
through patient admissions and follow-up consultations, it is also recommended to pay
sufficient attention to patient satisfaction.
Communication – As verbal communication towards a patient in the ED plays an
important role in patient satisfaction, this area should be continuously evaluated and
improved. Patient-Centered Care (PCC) will become increasingly important in the 21st
century, especially the relation between patients and ED staff. Besides verbal
communication, it is recommended to create a physical layout in the ED that provides
enough facilities for the patient as well as offering a clean and bright appearance.
Overall, it should be born in mind that the optimal ED does not exist. Yet, an ED can be
optimized to its maximum extent by introducing the seven variables as efficiently as
possible. In this process, the particular circumstances of the MC|Groep should be taken
into consideration and only those variables that add value to the ED incorporated. Finally,
the recommendations mentioned in section 6.6 in which the hypotheses have not as yet
been validated, should be taken into account. Further research on these particular
hypotheses could be conducted by the MC|Groep itself, or an external party.
6.5 Limitations
This section discusses the limitations of this research paper. Starting with the limitations of
the methodology used, followed by the limitations relating to the theoretical framework
and lastly the limitations of data availability.
The first limitation relates to the methodology used. Not every hospital in the Netherlands
has been interviewed and not every hospital wanted to co-operate, thereby restricting the
population for the actual research. Qualitative research also limits research outcomes. It
would have been preferable to include quantitative research based on financial data had this
been possible. A further limitation is reflected in the answers given by the interviewees
during the interviews. Some of these might have been desirable from a social angle. Certain

Femke Lammerts and Elisa van Poelgeest, MSc 19, January 2012
92
questions were not answered fully, as the interviewees might not have wanted to provide all
the information requested by the researchers. Consequently, not all data was available for
analysis. Some interviewees could not answer all the questions precisely, resulting in gaps in
the data. This could be attributed to interviewees who might not have been in their
position for long or lacked the necessary background information. It was not possible to
gather the missing information after the interviews. The translation of Dutch interviews
into an English matrix in Excel could have an bearing on the content of the data. Such a
situation would not have arisen if the interviews had been conducted in English.
Theoretical research also has limitations. Time constraints made it impossible to research
each variable extensively. Certain data was not researched sufficiently or the outcomes were
indecisive as in the case of acute admission wards (AOA). Data might also have been lost
during the transfer from the memo recorder to the actual writing up of the interviews, as
well as transferring data from the interview summaries into Excel. Interviews facilitated the
gathering of extensive information, but misinterpretations is always a possibility when
processing data. It is difficult to eradicate such an effect. The optimal ED as recommended
in this paper cannot be applies to each ED, which must appraise its own situation and
adapt the optimal ED to its individual circumstances and capacities.
6.6 Recommendations for further research
This section will elaborate on the recommendations for further research, based on the
hypotheses that could only partially validated or not at all by the results of the interviews:
Hypothesis 1: an admissions ward has a positive effect on the overcrowding and
throughput of an ED (reformulated from original hypothesis 1)
Hypothesis 2: the integration of a HAP and an ED improves the efficiency and
quality of care at a lower cost
Hypothesis 4: standardized performance indicators enhance the quality of the ED
Hypothesis 6: a triage system has an effect on the efficiency of processes in the ED
Hypothesis 8: an emergency department is profitable (reformulated from the
original hypothesis 8)
Hypothesis 1 above was derived from the original hypothesis 1; ‘the layout of an
emergency department (ED) has an effect on the long-term success of its processes’.
Although the latter hypothesis was validated by both the literature and the results from the

Femke Lammerts and Elisa van Poelgeest, MSc 19, January 2012
93
interviews, the interviews indicated a preference for the presence of an acute admissions
ward (AOA). The presence of an AOA was not researched in the literature, thus no
conclusion could be reached in this respect in the paper. A recommendation would be to
conduct specific research on the impact of an AOA on the efficiency of an ED.
Hypotheses 2, 4 and 6 were stated in literature to as having a beneficial effect on ED
efficiency. However, further research should conduct further investigate as to the impact of
the presence of a HAP on ED efficiency and cost. As this could not be substantiated via
the results of the interviews. Hypothesis 4 could give rise to comparative research in the
future, where the current effects of the efficiency of an ED are compared with a future
situation. Future situation defined as the moment standardized ED performance indicators
are introduced. Recommendations for hypothesis 6 could be in-depth research on the
efficiency of a triage system.
Finally, the newly formulated hypothesis 8 was derived from hypothesis 8 as originally
posed; ‘it is difficult to determine the profitability of an ED’. Although both literature and
the results of the interviews validated original hypothesis 8, more research should be
conducted on the specific aspects of the financial system within an ED. Generally, the ED
is thought to be loss-making due to its permanent availability function. However, facts and
figures on the real costs and revenues are lacking. Further research designed to make for
greater transparency and precision would therefore contribute to optimizing efficiency and
cost-effective healthcare.

Femke Lammerts and Elisa van Poelgeest, MSc 19, January 2012
94
Bibliography
Adamson, J. (2003). Exploring the impact of patient views on 'appropriate' use of services
and help seeking: a mixed method study. British Journal of General Practice, 226-233.
Anvari, M. (2007). Impact of Information Technology on Human Resources in Healthcare.
Healthcare Quarterly, 84-88.
Bailey, A. (1987). Triage on trial. Nursing Times, 65-66.
Baltesen, F. (2009, September 17). Financiële nood groot bij vier ziekenhuizen . NRC.
Belonen naar prestatie. (2011, december 20). Bekostiging ziekenhuiszorg. Opgehaald van
Belonen naar prestatie: http://www.werkenmetdot.nl/Belonen-naar-
prestaties/Bekostiging-ziekenhuiszorg
Berwick, D. (1980). Continuous improvement as an ideal in the health care. The New
England Journal of Medicine, 53-56.
Beveridge, R. (1998). Implementation guidelines for the Canadian Emergency Department Triage &
Acuity Scale (CTAS).
Blythin, P. (1983). Would you like to wait over there please? Nursing Mirror, 36-38.
Boot, J., & Knapen, M. (2005). De Nederlandse gezondheidszorg . Houten: Bohn Stafleu van
Loghum .
Bos, N. (2011). Kwaliteit van zorg op de spoedeisende hulp vanuit patientperspectief. Utrecht: UMC
Utrecht, divisie Julius Centrum voor gezondheidswetenschappen en eerstelijns
geneeskunde.
Bos, W., Koevoets, H., & Oosterwaal, A. (2010). Ziekenhuislandschap 20/20: Niemandsland of
Droomland? Den Haag: Broese en Peereboom.
Bos, W., Koevoets, H., & Oosterwaal, A. (2011). Ziekenhuislandschap 20/20: Niemandsland of
Droomland? Den Haag: Broese en Peereboom.
Bouwels, P. (2002). Triage op de spoedeisende hulp. Utrecht: Lemma.
Buckles, E. (1990). Evaluation of patient satisfaction in A&E. Nursing standard , 33-35.

Femke Lammerts and Elisa van Poelgeest, MSc 19, January 2012
95
Bunn, F. (2004). Telephone consultation and triage: effects on health care use and patient satisfaction.
Opgehaald van Cochrane Database Systematic Review:
http://www.cochrane.org/reviews/en/ab004180.html
Busca, P. (2010). Computerization in urgency and emergency care. An Sist Sanit Navar., 69-
76.
Business Dictionary. (2011, 12 28). Optimization. Opgehaald van Business Dictionary:
http://www.businessdictionary.com/definition/optimization.html
Carolina, U. o. (2010, December). MUSC Interim Children's Emergency Department.
Health Design, pp. 8-8.
Chalder, M. (2006). Comparing care at walk-in centres and at accident and emergency
departments: an exploration of patient choice, preference and satisfaction. Emergency
Medical Journal, 260-264.
Cheung, W. (2002). An advance triage system. Accident and Emergency Nursing, 10-16.
Cheung, W., Heeney, L., & Pound, J. (2002). An advanced triage system. Accident and
Emergency Nursing, 10-16.
Chew-Graham, C. (2004). A new role for the general practicioner? Reframing inappropriate
attenders to inappropriate services. Primary Health Care Research and Development , 60-
67.
Coenen, I. (2005). Richtlijn Triage op de spoedeisende hulp. Alphen aan den Rijn: Van Zuiden
Communications B.V.
Cohen, I. (1996). Critical care medicine: opportunities and strategies for improvement.
Journal Quality Improvement, 85-103.
Considine, J. (2002). Development of physiological discriminators for the Australasian
Triage Scale. Accident and Emergency Nursing, 221-234.
Cooke, T. (2006). Patient expectations of emergency department care: phase II--a cross-
sectional survey. CJEM, 148-157.
Cronin, J. (2003). The introduction of the Manchester triage scale to an emergency

Femke Lammerts and Elisa van Poelgeest, MSc 19, January 2012
96
department in the Republic of Ireland. Accident and Emergency Nursing, 121-125.
Dale, J. (1995). Primary care in the accident and emergency department: II. Comparison of
general practitioners and hospital doctors. BMJ, 427-430.
Davies, J. (1994). X-Ray vision of shorter queues. Nursing times, 52-54.
Dellifrane, J. (2010). Quality improvement practices in academic emergency medicine:
perspectives from the chairs. Western Journal of Emergency Medicine, 479-485.
Derlet, R. (2002). Triage. European Master in Disaster Management.
Derlx, H. (2008). Quality of clinical aspects of call handling at Dutch out of hours centres.
BMJ, 668-672.
Downey, L. (2010). Pain management in the emergency department and its relationship to
patient satisfaction. Journal of Emergency Trauma Shock, 326-330.
Edwards, B. (1999). What's wrong with triage? . Emergency Nurse, 19-23.
El Sayed, M. (2011). Measuring Quality in Emergency Medical Services: A Review of
Clinical Performance Indicators. Emergency Medicine International, 1-7.
Elder, N. (2010). The management of test results in primary care: does an electronic
medical record make a difference? Family Medicine, 327-333.
Estabrooks, C. (1998). Will evidence-based nursing practice make practice perfect?
Canadian Journal of Nursing Research, 15-36.
Fernandez, C. (1999). How reliable is emergency department triage? . Annals of Emergency
Medicine, 41-47.
Fulton, L. V., Lasdon, L. S., McDaniel Jr., R. R., & Nicholas, C. (2008). Including Quality,
Access, and Efficiency in Healthcare Cost Models. Hospital Topics, 3-17.
Gans, R., kathan, C., ter Maaten, J., & van Offenbeek, M. (2008). Te weinig toegevoegde
waarde. Organisatie en niet het soort dokter bepaalt kwaliteit SEH. . Medisch Contact
, 510-513.
Gentile, e. a. (2010). Nonurgent patients in the emergency department? A French formula

Femke Lammerts and Elisa van Poelgeest, MSc 19, January 2012
97
to prevent misuse. BMC Health Services Research, 1-6.
George, S. (1993). Nurse triage in theory and in practice. Arch Emergency Medicine, 220-228.
Giesen, P. (2006). Patients either contacting a general practice cooperative or accident and
emergency department out of hours: a comparison. Emergency Medical Journal, 731-
734.
Gijsen, R. (2010, December 7). Wat is een huisartsenpost? Opgehaald van RIVM:
http://www.nationaalkompas.nl
Gilboy, N. (2003). The Emergency Severity Index, implementation handbook. A five-level
triage system. Emergency Nurses Association.
Gilboy, N. (2005). Emergency Severity Index implementation handbook. ENA.
Gill, J. (1996). Disagreement among health care professionals about the urgent care needs
of emergency department patients. Annals of Emergency Medicine, 474-497.
Goldratt, E., & Cox, J. (1992). The goal: a process of ongoing improvement. . Great Barrington:
North River Press.
Goodacre, S. (1999). Consistency of retrospective triage decisions as a standardised
instrument for audit. Journal of Accident and Emergency Medicine, 322-324.
Goransson, K. (2005). Triage in emergency departments:national survey. Journal of Clinical
Nursing, 1067-1074.
Greene, J. (2002). Building smarter EDs. Hospitals & Health Networks, 32-36.
Groenland, E., & Jansen, H. (2010, jaargang 15). Kwalitatieve analyse in marktonderzoek:
de. KWALON, pp. 43-48.
Grose, A. (1988). Triage in A & E. The Professional Nurse, 400-402.
Hancock, G. (2000). Information Technology, Health and Health Care: A View to the Future.
Ottowa: Canada Policy Research Networks.
Harking, T. (2011). Hospital Emergency Departments: Health Center Strategies That May Help
Reduce. Washington: GAO.

Femke Lammerts and Elisa van Poelgeest, MSc 19, January 2012
98
Harking, T. (2011). Hospital Emergency Departments: Health Center Strategies That May Help
Reduce. Washington: GAO.
Hidalgo, P. (2011). Factors related to patient satisfaction with hospital emergency services.
Gaceta Sanitaria, 1-7.
HKZ. (2011, December 15). HKZ-certificatie: wat is het en wat levert het op? Opgehaald van
HKZ: http://www.hkz.nl/images/stories/publicaties/wegwijzer%20certificatie.pdf
Hospital A, A. (2011, November). (F. L. Poelgeest, Interviewer)
Hospital B, B. (2011, November). (F. L. Poelgeest, Interviewer)
Hospital B, B. (2011, November). (F. L. Poelgeest, Interviewer)
Hospital C, C. (2011, November). (F. L. Poelgeest, Interviewer)
Hospital C, C. (2011, November). (F. L. Poelgeest, Interviewer)
Hospital D, D. (2011, November). (F. L. Poelgeest, Interviewer)
Hospital E, E. (2011, November). (F. L. Poelgeest, Interviewer)
Hospital F, F. (2011, November). (F. L. Poelgeest, Interviewer)
Hospital G, G. (2011, December). (F. L. Poelgeest, Interviewer)
Hospital G, G. (2011, December). (F. L. Poelgeest, Interviewer)
Hospital H, H. (2011, November). (F. L. Poelgeest, Interviewer)
Hospital I, I. (2011, November). (F. L. Poelgeest, Interviewer)
Hospital I, I. (2011, November). (F. L. Poelgeest, Interviewer)
Hospital J, J. (2011, November). (F. L. Poelgeest, Interviewer)
Hospital K, K. (2011, November). (F. L. Poelgeest, Interviewer)
Hospital K, K. (2011, November). (F. L. Poelgeest, Interviewer)
Hospital L, L. (2011, November). (F. L. Poelgeest, Interviewer)
Hubbell, L. (2007). Quality, efficiency, and accountability: Definitions and applications.

Femke Lammerts and Elisa van Poelgeest, MSc 19, January 2012
99
New Directions for Higher Education, 5-13.
Huibers, L. (2009). Wetenschappelijk onderzoek Nederlands Triage Systeem. Nijmegen: Scientific
Institute for Quality of Healthcare. Opgehaald van Scientific Institute for Quality of
Healthcare.
IGZ. (2011). Basisset ziekenhuis kwaliteitsindicatoren 2012. Utrecht: IGZ.
Ishove-Bolk. (2001). De niet verwezen patiënt op de Spoedeisende Hulp beschreven met behulp van de
Emergency Severity Index. Amsterdam.
ISO. (2011, December 13). About ISO. Opgehaald van ISO: www.iso.org
Janssen, M. A. (2011). Adherence to the guideline ‘Triage in emergency departments’: a
survey of Dutch Emergency Departments. Journal of Clinical Nursing, 2458-2468.
Jarousse, L. A. (2011). ED throughput: a key to patient safety. Hospitals & Health Networks,
33-39.
Jochems, P. (2006). Geen tijd voor spraakverwarring: doelmatige triage in de actue zorg
vereist eenduidigheid. Medisch Contact, 650-652.
Jones, G. (1988). Top priority. Nursing Standard, 656-658.
Jones, G. (1994). Expanding the role of the nurse. London: Blackwell.
Jongbloed, L. S. (2008). Evidence en population based eerstelijnszorg. UNK: LSJ Medisch
Projectbureau.
Katz, H. (2008). Patient safety and telephone medicine: some lessons from closed claim
case review. Gen Intern Med, 517-522.
Kelly, M. (2010). Delays in response and triage times reduce patient satisfaction and
enablement after using out-of-hours services. Family Practice, 652-663.
Kenndy, M. (1999). Quality management in Australian emergency medicine: translation of
theory into practice. International Journal of Quality Health Care, 329-336.
Kershaw, R. (2000). Using TOC to cure healthcare problems. Management accounting quarterly,
1-7.

Femke Lammerts and Elisa van Poelgeest, MSc 19, January 2012
100
Kim, E. (2010). Nurse-patient interaction patterns and patient satisfaction in the emergency
department. Journal of Korean Academic Nursing, 99-109.
Koch, S. (2003). Designing Clinically Useful Systems: Examples from Medicine and
Dentistry. Journal of Dental Research, 65-68.
Kool, R. B. (2008). Towards integration of general practitioner posts and accident and
emergency departments: a case study of two integrated emergency posts in the
Netherlands. BMC Health Services Resources, 1-7.
Laffel, G. (1989). The case for using industrial quality management science in health care
organizations. JAMA, 2869-2873.
LAMP, S. (2003). Landelijk protocol ambulancezorg versie 6.0.0. Zwolle: St LAMP.
Lateef, F. (2011). Patient expectations and the paradigm shift of care in emergency
medicine. Journal of Emergency Trauma Shock, 163-167.
Lau, F. (2000). Can communication skills workshops for emergency department doctors
improve patient satisfaction? Journal of Accident Emergency Medicine, 251-253.
Louwerse, P. (2011). Jaardocument 2010. Rotterdam: Maasstad Ziekenhuis.
Lowe, R. (1997). Judging who needs emergency department care: a prerequisite for policy-
making. American Journal of Emergency Medicine, 133-136.
Maas, M. (2007, february 9). SEH-arts biedt meerwaarde. Medisch Contact , 251-253.
Mackway, J. K. (1997). Manchester Triage group. Emergency Triage. BMJ.
Marshall, M. (1996). Sampling for qualitative research. Family Practice , 522-525.
McGlynn, E., & Shekelle, P. (2008). Identifying, Categorizing, and Evaluating Health Care.
Rockville: AHRQ . Opgehaald van Agency for healthcare research and quality .
Meijers, J. (2006). Assessing the relationships between contextual factors and research
utilization in nursing: systematic literature review. Journal of Advanced Nursing, 622-
635.
Miles, M. B. (1994). Qualitative data analysis: an expanded source book. Thousand Oaks,

Femke Lammerts and Elisa van Poelgeest, MSc 19, January 2012
101
California: Sage Publications.
Ministerie van VWS . (2011, december 20). Opgehaald van
http://www.kiesbeter.nl/patienteninformatie/ziekenhuizen/dbcsinformatie/defaul
t.aspx
Miro, O. (2004). Quality and effectiveness of an emergency department. Emergency Medicine,
573-574.
Moll, E. P. (2007). Out-of-hours demand for GP care and emergency services: patients'
choices and referrals by general practitioners and ambulance services. BMC Fam
Pract. 2007; 8: 46. , 1-9.
Moller, M. (2010). Patients’ conceptions of the triage encounter at the Emergency
Department. Scandinavian Journal of Caring Sciences, 746-754.
Morey, J. (2002). Error reduction and performance improvement in the emergency
department through formal teamwork training: evaluation results of the MedTeams
project. Health Services Resources, 1553-1581.
Mosby. (2009). Mosby's Medical Dictionary, 8th edition. Elsevier Health Sciences.
Mugisha, J. (2009). Using information and communication technology to revitalise
continuing professional development for rural health professionals: evidence from
a pilot project. Rural Remote Health, 1222.
Neades, B. (1997). Expanding the role of the nurse in the Emergency Department.
Postgraduate Medical Journal, 17-22.
Nederlandse Vereniging Spoedeisende Hulp Verpleegkundigen. (2005). Triage op de
spoedeisende hulp. Alphen aan den Rijn : Van Zuiden Communications B.V. .
Nederlandse Zorgautoriteit. (2008). Met spoed! Advies over verbetering van de regulering van acute
zorg . UNK.
NHG. (2010). NHG-telefoonwijzer. Een leidraad voor triage en advies. Utrecht: Nederlandse
Huisartsen Genoorschap.
NIAZ. (2011). Kwaliteitsnorm Zorginstelling 2.2. Utrecht: Nederlands Instituut voor

Femke Lammerts and Elisa van Poelgeest, MSc 19, January 2012
102
Accreditatie in de Zorg (NIAZ).
Nicholl. (2000). Triage in the A & E department, a literature review. Sheffield: University of
Sheffield.
Nicholl, J. (2000). Triage in the A & E department, a literature review. Sheffield: University of
Sheffield .
Noreen, E., Smith, D., & Mackey, T. (1995). The Theory of Constraints and its implications for
management accounting. Great Barrington: North River Press.
Nuttall, M. (1986). The chaos controller. Nursing Times, 656-658.
NVSHV. (1996). Functieprofiel Speodeisende Hulp Verpleegkundige. Den Haag: NVSHV.
NVSHV. (1996). Functieprofiel Spoedeisende Hulp Verpleegkundige. NVSHV.
NVSHV. (2005). Richtlijn Triage op de spoedeisende hulp. Alphen aan den Rijn: NVSHV.
NZa. (2011, 12 20). DBC . Opgehaald van Nza:
http://www.nza.nl/zorgonderwerpen/dossiers/dbc-
dossier/veelgesteldevragen/veelgestelde-vragen-DBC/
Olatunde, S. (2007). Different practice patterns of rural and urban general practitioners .
Canadian Journal Rural Medicine, 73-80.
Olsson, M. (2001). Repeated use of the emergency department: qualitative study of the
patient's perspective. Emergency Medicine, 430-434.
Palmer, & Torero. (1999).
Palmer, S., & Torgerson, D. (1999). Definitions of efficiency . BMJ , 318:1136.
Papa, L. (2008). Does a waiting room video about what to expect during an emergency
department visit improve patient satisfaction? CJEM, 347-354.
Peck, R. L. (2011). Building for growth in a very tight space. Healthcare Design, 36-44.
Philips, H. (2010). Out of hours care: a profile analysis of patients attending the emergency
department and the general practitioner on call. BMC Fam Practice, 88.
Philips, H. (2010). What's the effect of the implementation of general practitioner

Femke Lammerts and Elisa van Poelgeest, MSc 19, January 2012
103
cooperatives on caseload? Prospective intervention study on primary and secondary
care. BMC Health Services Resources, 222.
Philips, H. (2010). What's the effect of the implementation of general practitioner
cooperatives on caseload? Prospective intervention study on primary and secondary
care. BMC Health Services Resources, 222.
Potts, A. (2004). Computerized Physician Order Entry and Medication Errors in a Pediatric
Critical Care Unit. Pediatrics, 59-63.
Przybylowski Jr., T. (2010). No waiting Designing for attentive care in the ED. Health Care
Design, 32-38.
Rahmqvist, M. (2010). Patient characteristics and quality dimensions related to patient
satisfaction. International Journal Quality Health Care, 86-92.
Rais, A., & Viana, A. (2011). Operations Research in Healthcare: a survey. International
Transactions in Operational Research, 1-31.
Rao, G. (1995). Nurse triage may reduce workload in accident department. BMJ, 1575.
RIVM. (2011, 7 18). Bereikbaarheidsanalyse 2011. Opgeroepen op 12 15, 2011, van
Rijksoverheid: http://www.rijksoverheid.nl/documenten-en-
publicaties/rapporten/2011/07/18/onderzoeksverslag-bereikbaarheidsanalyse-
2011.html
RIVM. (2011, 12 15). Wat is een afdeling Spoedeisende hulp? Opgeroepen op 12 20, 2011, van
Nationaal Kompas:
http://www.nationaalkompas.nl/zorg/sectoroverstijgend/acute-
zorg/spoedeisende-hulp/wat-is-een-afdeling-spoedeisende-hulp/
RIVM, CBS, VHN. (2011, september 14). Locaties huisartsenposten en spoedeisende hulpen 2010.
Opgehaald van Zorgatlas :
http://www.zorgatlas.nl/zorg/eerstelijnszorg/huisartsenzorg/aanbod/locaties-
huisartsenposten-en-seh-s-2010/
RIVM, CBS, VHN. (2011, September 14). Locaties huisartsenposten en spoedeisende hulpen 2010.
Opgehaald van Zorgatlas:
http://www.zorgatlas.nl/zorg/eerstelijnszorg/huisartsenzorg/aanbod/locaties-

Femke Lammerts and Elisa van Poelgeest, MSc 19, January 2012
104
huisartsenposten-en-seh-s-2010/
Romano, M. (2003). It's a whole new ER . Modern Healthcare, 30.
Rosenau. (2001). The correlation of an Emergency Severity Index (ESI) triage tool with
labor costs in the emergency department. . Academic Emergency Medicine.
RVZ. (2003).
Saunders, M. (2007). Research Methods for Business Students. Spain: Pearson Education.
Schipper, E. (2011, Maart 11). Antwoorden kamervragen van kamerlid Mulder (VVD) over onnodig
beroep op de spoedeisende eerste hulp . Opgehaald van
http://content1b.omroep.nl/dd262fdc973b8357358ac84b24ea3e09/4ee60f46/nos
/docs/antwoorden-over-onnodig-beroep-spoedeisende-hulp%5B1%5D.pdf
Schrijvers, G., Steeg, v. d., Schaaf, H., Hemrika, M., & Gussinklo, J. (2011, 12 21). Ruimte
voor ziekenhuisinnovaties . Opgehaald van Julius Centrum :
http://www.juliuscentrum.nl/Julius/Portals/4/UploadFiles/Bekostiging%20zieke
nhuis%20innovaties%20van%20januari%202010_cb.pdf
SEH, w. k. (2009). Spoedeisende hulp: vanuit een stevige basis. werkgroep kwaliteitsindelen SEH.
SEH, w. K. (2009). Spoedeisende hulp: vanuit een stevige basis. werkgroep Kwaliteitsindeling
SEH.
Smits, T. (2010, April 4). Van papieren status naar digitaal dossier. Zorgmarkt, pp. 25-28.
Sobo, E. (2001). . Developing indicators for emergency medical services (EMS) system
evaluation and quality improvement: a statewide demonstration and planning
project. The Joint Commission Journal on Quality Improvement, 138-154.
Soleimanpour, H. (2011). Emergency department patient satisfaction survey in Imam Reza
Hospital, Tabriz, Iran. International Journael of Emerg Medicine.
Spaite, D. (1995). Emergency medical service systems research: problems of the past,
challenges of the future. . Annals of Emergency Medicine, 146-152.
Sprague, J. (2007). Zooming in. Health Facilities Management, 45-48.
Staff, A. (2011, December 29). Designing Structured Interviews for Educational Research.

Femke Lammerts and Elisa van Poelgeest, MSc 19, January 2012
105
Opgehaald van Practical Assessment, Research & Evaluation:
http://pareonline.net/getvn.asp?v=5&n=12
Sterk, P. (2006). Zorgpad laat alles kloppen. Medisch contact , 61.
Stichting Ijsselmeerziekenhuizen - MC|Groep . (2010). Jaarverantwoording zorginstellingen 2009
. Opgehaald van MC|groep :
http://www.mcgroep.com/sites/default/files/jaardocument_2009.pdf
Straczynski, S. (2011, December 18). Live Long and Prosper: 2010 Healthcare Environment
Awards Winners. Opgehaald van Contract Design:
http://www.contractdesign.com/contract/design/Live-Long-and-Prospe-
3288.shtml
Taheri, P., Butz, D., Lottenberg, L., Clawson, A., & Flint, L. (2004). The cost of trauma
center readiness. American journal of surgery, 7-13.
Taylor, C. (2004). Patient satisfaction in emergency medicine. Emergency Medicine Journal,
528-532.
Taylor, D. (2006). A multifaceted intervention improves patinet satisfaction and
perceptions of Emergency Department care. Internation Journal Quality Health Care,
238-245.
Taylor-Powell, E. (2003). Analyzing qualitative data. Wisconsin: Unversity of Wisconsin.
Toledo Business Journal . (2009, April). Fremont hospital to renovate emergency dept.
Toledo Business Journal, pp. 16-17.
van Baar, M., Giesen, P., Grol, R., & Schrijvers, A. (2007). Een inventarisatie van het
begrippenkader, wetenschappelijk onderzoek, meetinstrumenten, organisatiemodellen en
registratiesystemen op het terrein van de spoedzorg. . Utrecht & Nijmegen: Julius Centrum
voor Gezondheidswetenschappen en eerstelijnsgeneeskunde, UMC Utrecht &
Kenniscentrum huisartsenposten en spoedeisende zorg, Afdeling kwaliteit van zorg
(WOK), UMC St. Radboud Nijmegen.
van Eekeren, P. (2011). Innoveren met ICT meer dan ooit noodzaak. Amsfoort: M&I/Partners.
Van Steenwijk, P. (2010). Samenwerking huisartsenposten en spoedeisende hulp (SEH). Inventarisatie

Femke Lammerts and Elisa van Poelgeest, MSc 19, January 2012
106
van huidige situatie. Nijmegen/Utrecht: IQ Healthcare St Radbout Nijmegen en
VHN.
Van Uden, C. (2004). Does setting up out of hours primary care cooperatives outside a
hospital reduce demand for emergency care? Emergency Medicine Journal, 722-723.
Vega, V. (2007). Speeding Up the Emergency Department: The RADIT Emergency
Program at St. Joseph Hospital of Orange. Hospital Topics, 17-24.
VHN. (2010). Huisartsenposten in cijfers. Utrecht: Vereniging Huisartsenposten Nederland.
VMS. (2011, December 15). Over het VMS veiligheidsprogramma. Opgehaald van VMS:
http://www.vmszorg.nl/Over-het-programma
Wayne, D. (2008). Alive and well: Optimizing the fitness of an organization. Performance
Improvement, 21-26.
Webster's New World™ Medical Dictionary 3rd Edition. (2000). Definition of Emergency
department. Opgeroepen op December 28, 2011, van Medicine Net:
http://www.medterms.com/script/main/art.asp?articlekey=12156
Werken met DOT. (2011, december 20). DOT: de tweede generatie DBC's . Opgehaald van
Werken met DOT:
http://www.werkenmetdot.nl/GetDocument.aspx?Source=documentoverview&D
ocumentID=9752
Westert, G. (2010). Zorgbalans 2010. De prestaties van de Nederlandse zorg. Bilthoven: RIVM.
Windle, J. (2001). The extent to which the environment, triage event, documentation, components of the
assessment and training & development affect departmental accuracy when using the Manchester
Triage System. Sheffield: University of Sheffield.
Windle, J. (2002). Triage - but by any other name. Emergency Nurse.
Winters, L. (2009). Reducing Emergency Admissions to Hospital: redesign of services. Liverpool:
Liverpool Public Health Observatory.
Wolf, S. (2010). Harrisburg Hospital emergency department renovations on track. Central
Penn Business Journal, 15-16.

Femke Lammerts and Elisa van Poelgeest, MSc 19, January 2012
107
Wuerz, R. (2000). Reliability and validity of a new five-level triage instrument. Academic
Emergency Medicine, 236-242.
Wuerz, R. (2001). Implementation and refinement of the Emergency Severity Inde.
Academic Emergency Medicine, 170-176.
Zichtbare Zorg, I. (2011, december 14). Pogramma Zichtbare Zorg. Opgehaald van Zichtbare
zorg: http://www.zichtbarezorg.nl/page/Programma-Zichtbare-Zorg
Zilm, F. (2003). ED innovations. Health Facilities Management, 43-46.
Zimmermans, P. (2001). The case for a universal, valid, reliable 5-tier triage acuity scale for
US Emergency Departments. Journal of Emergency Nursing, 246-254.
Hypothesis 3: digitalization of patient data has both a positive and negative effect on the processes in the
ED.