msci esg kld stats: 1991-2014 data sets · june 2015 msci esg kld stats: 1991-2014 data sets june...
TRANSCRIPT
JUNE 2015
MSCI ESG KLD STATS: 1991-2014 Data
Sets June 2015
MSCI ESG KLD STATS: 1991-2014 DATA SETS
Methodology
MSCI ESG RESEARCH
June 2015
MSCI.COM | PAGE 2 OF 75 © 2015 MSCI Inc. All rights reserved. Please refer to the disclaimer at the end of this document.
MSCI ESG KLD STATS: 1991-2014 DATA SETS | JUNE 2015
Contents Introduction ..................................................................................... 10
MSCI ESG KLD STATS Data Sets – coverage universe ....................................... 11
ESG Performance Indicators ............................................................................. 12
Positive ESG Performance Indicators ................................................................ 12
Negative ESG Performance Indicators .............................................................. 13
Scoring of ESG Performance Indicators ............................................................ 14
ESG Performance indicators: definitions .......................................... 15
Environmental Indicators .................................................................................. 15
Positive Environment Performance Indicators ................................................. 17
Environmental Opportunities – Clean Tech (ENV-str-A) ................................................ 17
Waste Management – Toxic Emissions and Waste (ENV-str-B) .................................... 17
Waste Management - Packaging Materials & Waste (ENV-str-C) ................................. 17
Climate Change - Carbon Emissions (ENV-str-D) ........................................................... 17
Environmental Management Systems (ENV-str-G) ....................................................... 18
Natural Resource Use - Water Stress (ENV—str-H) ....................................................... 18
Natural Resource Use - Biodiversity & Land Use (ENV-str-I) ......................................... 18
Natural Resource Use - Raw Material Sourcing (ENV-str-J) ........................................... 18
Natural Resource Use - Financing Environmental Impact (ENV-str-K) .......................... 18
Environmental Opportunities - Green Buildings (ENV-str-L) ......................................... 19
Environmental Opportunities – Renewable Energy (ENV-str-M) .................................. 19
Waste Management - Electronic Waste (ENV-str-N) ..................................................... 19
Climate Change – Energy Efficiency (ENV-str-O) ........................................................... 19
Climate Change – Product Carbon Footprint (ENV-str-P) .............................................. 20
Climate Change - Insuring Climate Change Risk (ENV-str-Q) ......................................... 20
Environment - Other Strengths (ENV-str-X) ................................................................... 20
Negative Environment Performance Indicators ............................................... 20
Regulatory Compliance (ENV-con-B) ............................................................................. 20
MSCI.COM | PAGE 3 OF 75 © 2015 MSCI Inc. All rights reserved. Please refer to the disclaimer at the end of this document.
MSCI ESG KLD STATS: 1991-2014 DATA SETS | JUNE 2015
Toxic Emissions and Waste (ENV-con-D) ....................................................................... 21
Energy and Climate Change (ENV-con-F) ....................................................................... 21
Impact of Products & Services (ENV-con-G) .................................................................. 22
Biodiversity & Land Use (ENV-con-H) ............................................................................ 22
Operational Waste (ENV-con-I) ..................................................................................... 22
Supply Chain Management (ENV-con-J) ........................................................................ 22
Water Stress (ENV-con-K) .............................................................................................. 22
Environment - Other Concerns (ENV-con-X) .................................................................. 23
Social Indicators ................................................................................................ 23
Positive Social Performance Indicators: Community ........................................ 25
Community Engagement (COM-str-H) ........................................................................... 25
Negative Social Performance Indicators: Community ...................................... 25
Community Impact (COM-con-B) .................................................................................. 25
Positive Social Performance Indicators: Human Rights .................................... 26
Indigenous Peoples Relations Strength (HUM-str-D) .................................................... 26
Human Rights Policies & Initiatives (HUM-str-X) ........................................................... 26
Negative Social Performance Indicators: Human Rights .................................. 26
Support for Controversial Regimes (HUM-con-C) .......................................................... 26
Freedom of Expression & Censorship (HUM-con-J) ....................................................... 26
Human Rights Violations (HUM-con-K) .......................................................................... 26
Human Rights - Other Concerns (HUM-con-X) .............................................................. 27
Positive Social Performance Indicators: Employee Relations........................... 27
Union Relations (EMP-str-A) .......................................................................................... 27
Cash Profit Sharing (EMP-str-C) ..................................................................................... 27
Employee Involvement (EMP-str-D) .............................................................................. 27
Employee Health & Safety (EMP-str-G) ......................................................................... 27
Supply Chain Labor Standards (EMP-str-H) ................................................................... 27
Human Capital Development (EMP-str-L) ...................................................................... 28
MSCI.COM | PAGE 4 OF 75 © 2015 MSCI Inc. All rights reserved. Please refer to the disclaimer at the end of this document.
MSCI ESG KLD STATS: 1991-2014 DATA SETS | JUNE 2015
Labor Management (EMP-str-M) ................................................................................... 28
Controversial Sourcing (EMP-str-N) ............................................................................... 29
Human Capital – Other Strengths (EMP-str-X) .............................................................. 29
Negative Social Performance Indicators: Employee Relations ......................... 29
Union Relations Concerns (EMP-con-A) ........................................................................ 29
Health & Safety (EMP-con-B) ......................................................................................... 29
Supply Chain (EMP-con-F) .............................................................................................. 30
Child Labor (EMP –con-G) .............................................................................................. 30
Labor-Management Relations (EMP-con-H) .................................................................. 30
Labor Rights & Supply Chain – Other Concerns (EMP-con-X) ........................................ 30
Positive Social Performance Indicators: Diversity ............................................ 31
Board of Directors - Gender (DIV-str-C) ......................................................................... 31
Negative Social Performance Indicators: Diversity ........................................... 31
Workforce Diversity (DIV-con-A) ................................................................................... 31
Board of Directors - Gender (DIV-con-C) ....................................................................... 31
Positive Social Performance Indicators: Product .............................................. 31
Product Safety and Quality (PRO-str-A) ......................................................................... 31
Social Opportunities – Access to Healthcare (PRO-str-C) .............................................. 32
Social Opportunities - Access to Finance (PRO-str-D) .................................................... 32
Social Opportunities - Access to Communications (PRO-str-E) ..................................... 32
Social Opportunities - Opportunities in Nutrition and Health (PRO-str-F) .................... 32
Product Safety - Chemical Safety (PRO-str-G) ............................................................... 33
Product Safety -Financial Product Safety (PRO-str-H) ................................................... 33
Product Safety - Privacy and Data Security (PRO-str-I) .................................................. 33
Product Safety - Responsible Investment (PRO-str-J) .................................................... 33
Product Safety - Insuring Health and Demographic Risk (PRO-str-K) ............................ 33
Negative Social Performance Indicators: Product ............................................ 34
Product Quality & Safety (PRO-con-A) ........................................................................... 34
MSCI.COM | PAGE 5 OF 75 © 2015 MSCI Inc. All rights reserved. Please refer to the disclaimer at the end of this document.
MSCI ESG KLD STATS: 1991-2014 DATA SETS | JUNE 2015
Marketing & Advertising (PRO-con-D) ........................................................................... 34
Anticompetitive Practices (PRO-con-E).......................................................................... 34
Customer Relations (PRO-con-F) ................................................................................... 34
Other Concerns (PRO-con-X) ......................................................................................... 35
Governance Indicators ...................................................................................... 35
Positive Governance Performance Indicators .................................................. 35
Corruption & Political Instability (CGOV-str-G) .............................................................. 35
Financial System Instability (CGOV-str-H) ...................................................................... 36
Negative Governance Performance Indicators................................................. 36
Governance Structures (CGOV-con-K) ........................................................................... 36
Controversial Investments (CGOV-con-L) ...................................................................... 36
Bribery & Fraud (CGOV-con-M) ..................................................................................... 36
Governance - Other Concerns (CGOV-con-X) ................................................................ 37
Controversial Business Involvement Indicators ................................................ 38
Alcohol (ALC-con-A) ....................................................................................................... 38
Firearms (FIR-con-A) ...................................................................................................... 38
Gambling (GAM-con-A) .................................................................................................. 39
Military (MIL-con-A) ....................................................................................................... 40
Nuclear Power (NUC-con-A) .......................................................................................... 41
Tobacco (TOB-con-A) ..................................................................................................... 42
MSCI ESG KLD STATS – 2014 Data Set Key........................................ 42
Appendix .......................................................................................... 44
MSCI ESG KLD STATS DATA SETS – COVERAGE UNIVERSE History ................... 44
MSCI ESG KLD STATS DATA SETS: ESG INDICATOR HISTORY ............................ 46
Positive Environment Performance Indicators ................................................. 46
Environmental Opportunities – Clean Tech (ENV-str-A) ................................................ 46
Waste Management – Toxic Emissions and Waste (ENV-str-B) .................................... 48
Waste Management - Packaging Materials & Waste (ENV-str-C) ................................. 49
MSCI.COM | PAGE 6 OF 75 © 2015 MSCI Inc. All rights reserved. Please refer to the disclaimer at the end of this document.
MSCI ESG KLD STATS: 1991-2014 DATA SETS | JUNE 2015
Climate Change - Carbon Emissions (ENV-str-D) ........................................................... 49
Communications (ENV-str-E) ......................................................................................... 50
Property, Plant, and Equipment (ENV-str-F) .................................................................. 50
Natural Resource Use - Water Stress (ENV—str-H) ....................................................... 50
Natural Resource Use - Biodiversity & Land Use (ENV-str-I) ......................................... 51
Natural Resource Use - Raw Material Sourcing (ENV-str-J) ........................................... 51
Natural Resource Use - Financing Environmental Impact (ENV-str-K) .......................... 51
Environmental Opportunities - Green Buildings (ENV-str-L) ......................................... 51
Environmental Opportunities – Renewable Energy (ENV-str-M) .................................. 51
Waste Management - Electronic Waste (ENV-str-N) ..................................................... 51
Climate Change – Energy Efficiency (ENV-str-O) ........................................................... 51
Climate Change – Product Carbon Footprint (ENV-str-P) .............................................. 51
Climate Change – Insuring Climate Change Risk (ENV-str-Q) ........................................ 51
Environment - Other Strengths (ENV-str-X) ................................................................... 52
Negative Environment Performance Indicators ............................................... 52
Hazardous Waste (ENV-con-A) ...................................................................................... 52
Regulatory Compliance (ENV-con-B) ............................................................................. 52
Ozone Depleting Chemicals (ENV-con-C) ....................................................................... 52
Toxic Emissions and Waste (ENV-con-D) ....................................................................... 53
Agricultural Chemicals (ENV-con-E) ............................................................................... 53
Energy and Climate Change (ENV-con-F) ....................................................................... 53
Social Indicators ............................................................................... 53
Positive Social Performance Indicators: Community ........................................ 53
Generous Giving (COM-str-A) ........................................................................................ 53
Innovative Giving (COM-str-B) ....................................................................................... 54
Support for Housing (COM-str-C) .................................................................................. 54
Support for Education (COM-str-D) ............................................................................... 54
Non-US Charitable Giving (COM-str-F) .......................................................................... 55
MSCI.COM | PAGE 7 OF 75 © 2015 MSCI Inc. All rights reserved. Please refer to the disclaimer at the end of this document.
MSCI ESG KLD STATS: 1991-2014 DATA SETS | JUNE 2015
Volunteer Programs (COM-str-G) .................................................................................. 55
Other Strength (COM-str-X) ........................................................................................... 56
Negative Social Performance Indicators: Community ...................................... 56
Investment Controversies (COM-con-A) ........................................................................ 56
Tax Disputes (COM-con-D) ............................................................................................. 56
Other Concern (COM-con-X) .......................................................................................... 57
Positive Social Performance Indicators: Human Rights .................................... 57
Positive Record in South Africa (HUM-str-A) ................................................................. 57
Labor Rights Strength (HUM-str-G)................................................................................ 57
Negative Social Performance Indicators: Human Rights .................................. 58
South Africa (HUM-con-A) ............................................................................................. 58
Northern Ireland (HUM-con-B) ...................................................................................... 58
Support for Controversial Regimes (HUM-con-C) .......................................................... 58
Mexico (HUM-con-D) ..................................................................................................... 58
Labor Rights Concern (HUM-con-F) ............................................................................... 58
Indigenous Peoples Relations Concern (HUM-con-G) ................................................... 59
Operations in Sudan (HUM-con-H). ............................................................................... 59
Human Rights - Other Concerns (HUM-con-X) .............................................................. 59
Positive Social Performance Indicators: Employee Relations........................... 59
No-Layoff Policy (EMP-str-B).......................................................................................... 59
Retirement Benefits Strength (EMP-str-F). .................................................................... 60
Compensation & Benefits (EMP-str-I) ............................................................................ 60
Employee Relations (EMP-str-J) ..................................................................................... 60
Professional Development (EMP-str-K) ......................................................................... 60
Human Capital Development (EMP-str-L) ...................................................................... 61
Labor Management (EMP-str-M) ................................................................................... 61
Controversial Sourcing (EMP-str-N) ............................................................................... 61
Human Capital – Other Strengths (EMP-str-X) .............................................................. 61
MSCI.COM | PAGE 8 OF 75 © 2015 MSCI Inc. All rights reserved. Please refer to the disclaimer at the end of this document.
MSCI ESG KLD STATS: 1991-2014 DATA SETS | JUNE 2015
Negative Social Performance Indicators: Employee Relations ......................... 61
Workforce Reductions (EMP-con-C) .............................................................................. 61
Retirement Benefits Concern (EMP-con-D) ................................................................... 61
Labor-Management Relations (EMP-con-H) .................................................................. 62
Labor Rights& Supply Chain – Other Concerns (EMP-con-X) ......................................... 62
Positive Social Performance Indicators: Diversity ............................................ 62
CEO (DIV-str-A)............................................................................................................... 62
Representation (DIV-str-B) ............................................................................................ 62
Board of Directors - Gender (DIV-str-C) ......................................................................... 63
Work/Life Benefits (DIV-str-D) ....................................................................................... 63
Women & Minority Contracting (DIV-str-E)................................................................... 63
Employment of the Disabled (DIV-str-F) ........................................................................ 63
Gay & Lesbian Policies (DIV-str-G) ................................................................................. 64
Employment of Underrepresented Groups (DIV-str-H) ................................................. 64
Other Strength (DIV-str-X) ............................................................................................. 64
Negative Social Performance Indicators: Diversity ........................................... 65
Representation (DIV-con-B) ........................................................................................... 65
Board of Directors - Gender (DIV-con-C) ....................................................................... 65
Board of Directors - Minorities (DIV-con-D) .................................................................. 66
Other Concern (DIV-con-X) ............................................................................................ 66
Positive Social Performance Indicators: Product .............................................. 66
Product Safety and Quality (PRO-str-A) ......................................................................... 66
R&D/Innovation (PRO-str-B) .......................................................................................... 67
Social Opportunities – Access to Healthcare (PRO-str-C) .............................................. 67
Social Opportunities - Access to Finance (PRO-str-D) .................................................... 67
Social Opportunities - Access to Communications (PRO-str-E) ..................................... 67
Social Opportunities - Opportunities in Nutrition and Health (PRO-str-F) .................... 67
Product Safety - Chemical Safety (PRO-str-G) ............................................................... 68
MSCI.COM | PAGE 9 OF 75 © 2015 MSCI Inc. All rights reserved. Please refer to the disclaimer at the end of this document.
MSCI ESG KLD STATS: 1991-2014 DATA SETS | JUNE 2015
Product Safety -Financial Product Safety (PRO-str-H) ................................................... 68
Product Safety - Privacy and Data Security (PRO-str-I) .................................................. 68
Product Safety - Responsible Investment (PRO-str-J) .................................................... 68
Product Safety - Insuring Health and Demographic Risk (PRO-str-K) ............................ 68
Other Strength (PRO-str-X) ............................................................................................ 68
Governance Indicators ..................................................................... 68
Positive Governance Performance Indicators .................................................. 69
Limited Compensation (CGOV-str-A) ............................................................................. 69
Ownership Strength (CGOV-str-C) ................................................................................. 69
Reporting Quality (CGOV-str-D) ..................................................................................... 69
Political Accountability Strength (CGOV-str-E) .............................................................. 70
Public Policy (CGOV-str-F) .............................................................................................. 70
Other Strength (CGOV-str-X). ........................................................................................ 70
Negative Governance Performance Indicators................................................. 71
High Compensation (CGOV-con-B) ................................................................................ 71
Ownership Concern (CGOV-con-F) ................................................................................ 71
Accounting Concern (CGOV-con-G) ............................................................................... 71
Reporting Quality (CGOV-con-H) ................................................................................... 72
Political Accountability Concern (CGOV-con-I) .............................................................. 72
Public Policy (CGOV-con-J) ............................................................................................. 72
Bribery & Fraud (CGOV-con-M) ..................................................................................... 73
Governance - Other Concerns (CGOV-con-X) ................................................................ 73
MSCI.COM | PAGE 10 OF 75 © 2015 MSCI Inc. All rights reserved. Please refer to the disclaimer at the end of this document.
MSCI ESG KLD STATS: 1991-2014 DATA SETS | JUNE 2015
INTRODUCTION
MSCI ESG KLD STATS (STATS) is an annual data set of positive and negative environmental, social, and governance (ESG) performance indicators applied to a universe of publicly traded companies. The MSCI ESG KLD STATS data set was initiated in 1991, and is one of the longest continuous ESG data time series available. MSCI ESG Research is a unit of MSCI, a global independent provider of research-driven insights and tools for institutional investors. MSCI ESG Research provides ESG ratings, research and analysis to institutional investors worldwide. MSCI ESG Research employs a global team of over 140 experienced research analysts to assess how well companies manage their ESG risks and opportunities. To assess companies’ exposure to and management of ESG risks and opportunities, MSCI ESG Research collects data from the following sources:
Macro data at segment or geographic level from academic, government, NGO datasets
Company disclosure (10-K, sustainability report, proxy report, AGM results, etc.)
Government databases, 1600+ media, NGO, other stakeholder sources
Companies are invited to participate in a formal data verification process. Each annual STATS data set contains the following information:
Company information (Name, Ticker, unique security identifiers)
A set of indicators assessing positive and negative ESG performance.
MSCI.COM | PAGE 11 OF 75 © 2015 MSCI Inc. All rights reserved. Please refer to the disclaimer at the end of this document.
MSCI ESG KLD STATS: 1991-2014 DATA SETS | JUNE 2015
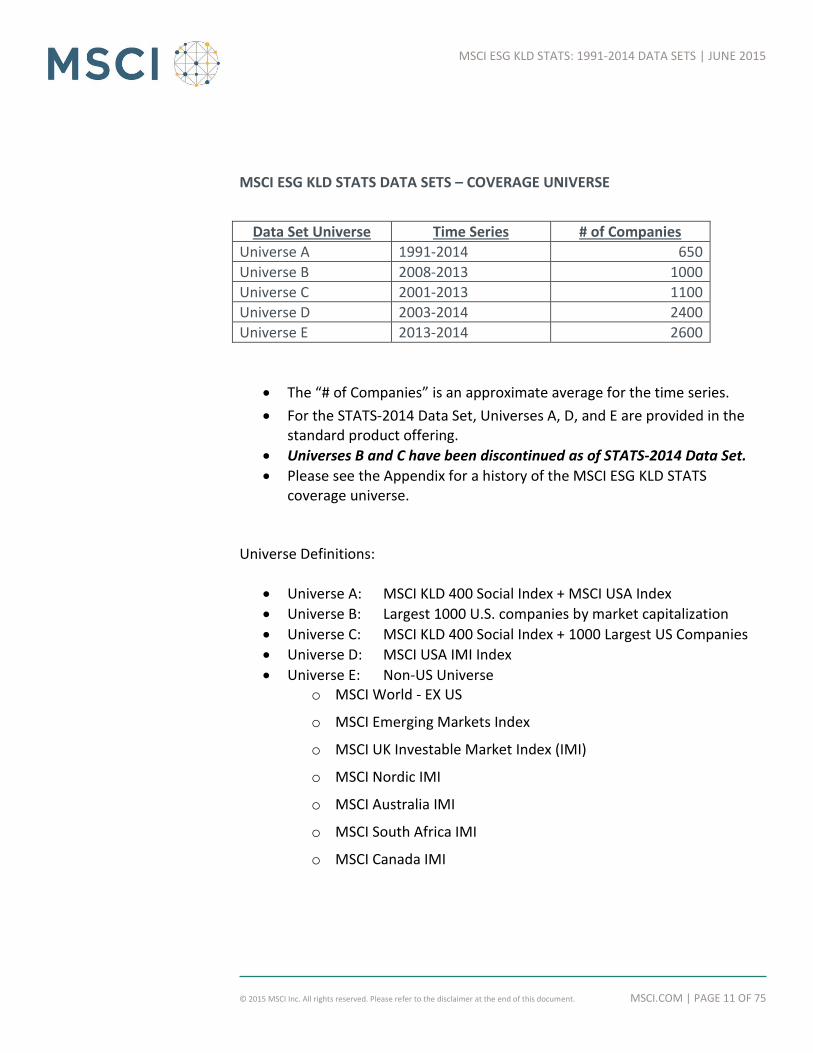
MSCI ESG KLD STATS DATA SETS – COVERAGE UNIVERSE
Data Set Universe Time Series # of Companies
Universe A 1991-2014 650
Universe B 2008-2013 1000
Universe C 2001-2013 1100
Universe D 2003-2014 2400
Universe E 2013-2014 2600
The “# of Companies” is an approximate average for the time series.
For the STATS-2014 Data Set, Universes A, D, and E are provided in the standard product offering.
Universes B and C have been discontinued as of STATS-2014 Data Set.
Please see the Appendix for a history of the MSCI ESG KLD STATS coverage universe.
Universe Definitions:
Universe A: MSCI KLD 400 Social Index + MSCI USA Index
Universe B: Largest 1000 U.S. companies by market capitalization
Universe C: MSCI KLD 400 Social Index + 1000 Largest US Companies
Universe D: MSCI USA IMI Index
Universe E: Non-US Universe o MSCI World - EX US
o MSCI Emerging Markets Index
o MSCI UK Investable Market Index (IMI)
o MSCI Nordic IMI
o MSCI Australia IMI
o MSCI South Africa IMI
o MSCI Canada IMI
MSCI.COM | PAGE 12 OF 75 © 2015 MSCI Inc. All rights reserved. Please refer to the disclaimer at the end of this document.
MSCI ESG KLD STATS: 1991-2014 DATA SETS | JUNE 2015
ESG PERFORMANCE INDICATORS
POSITIVE ESG PERFORMANCE INDICATORS
MSCI ESG KLD STATS positive performance indicators are designed to capture management best practices concerning ESG risks and opportunities. STATS positive ESG performance indicators are based on MSCI ESG Research’s proprietary ESG Ratings model which includes ESG key issues corresponding to the full range of ESG risks and opportunities. For each key issue, there are three assessed components of a company’s management capabilities: Strategy & Governance, Initiatives and Performance.
Strategy & Governance: Analysis of management strategy evaluates a company’s organizational capacity and level of commitment to address key ESG risks and opportunities, including the level and extent of organizational responsibility for the specific risks/opportunities, strength and scope of policy commitments, and strength and scope of commitment to standards.
Initiatives: This component consists of an evaluation of the strength and scope of company initiatives, programs, and targets to improve performance.
Performance: The performance component evaluates a company’s track record on managing a specific ESG risk or opportunity.
For the MSCI ESG Ratings model, every company is typically scored on only 4-7 of the most material ESG key issues for its primary industry. For some companies, it is necessary to add an additional ESG key issue if a company faces an environmental, social, or governance risk or opportunity that is atypical for the industry. In addition, there are a set of key issues that are applicable to all companies – such as Carbon Emissions, Labor Management, and Health & Safety. Each key issue is scored on a 0-10 scale. The key issue score consists of an exposure score and a management score – both also on a 0-10 scale. MSCI ESG KLD STATS utilizes the scored management component of the key issue score,
MSCI.COM | PAGE 13 OF 75 © 2015 MSCI Inc. All rights reserved. Please refer to the disclaimer at the end of this document.
MSCI ESG KLD STATS: 1991-2014 DATA SETS | JUNE 2015
without a deduction for relevant ESG controversies. This score is also on a 0-10 scale. Please note, that the industry-based key issue ratings model was introduced to MSCI ESG KLD STATS in 2010. Therefore, for the STATS-2010 Data Set and after, all companies in the coverage universe are only assessed for a limited set of positive ESG indicators. For each company indicators that are not researched will have an “NR” for “Not Researched”. Prior to STATS – 2010 Data Set, all of the positive ESG performance indicators were researched for all of the companies in the coverage universe. For a more complete description of the key issue selection process and other details of ESG Ratings methodology, please see: https://www.msci.com/www/research-paper/esg-ratings-methodology/0175943017
NEGATIVE ESG PERFORMANCE INDICATORS
Negative ESG performance indicators are based on MSCI ESG Research’s proprietary Impact Monitor controversies analysis. MSCI ESG Impact Monitor is designed to provide timely and consistent assessments of ESG controversies involving publicly traded companies. The evaluation framework used in ESG Impact Monitor is designed to be consistent with international norms represented in numerous widely accepted global conventions, including the Universal Declaration of Human Rights, the ILO Declaration on Fundamental Principles and Rights at Work, and the UN Global Compact. MSCI ESG Research analysts investigate and assess controversies involving the impact of company operations and/or products and services that allegedly violate national or international laws, regulations, and/or commonly accepted global norms.
MSCI.COM | PAGE 14 OF 75 © 2015 MSCI Inc. All rights reserved. Please refer to the disclaimer at the end of this document.
MSCI ESG KLD STATS: 1991-2014 DATA SETS | JUNE 2015
For each STATS Data Set, all of the negative ESG performance indicators have been researched for all companies in the coverage universe, with the exception of the STATS-2010 and STATS-2011 Data Sets.
SCORING OF ESG PERFORMANCE INDICATORS
ESG performance indicators in STATS are scored by a simple binary scoring model:
If a company meets the assessment criteria established for an indicator, then this is signified with a “1”.
If a company does NOT meet the assessment criteria established for an indicator, then this is signified with a “0”.
If a company has NOT been researched for a particular ESG indicator, then this is signified with a “NR” (Not Researched).
MSCI.COM | PAGE 15 OF 75 © 2015 MSCI Inc. All rights reserved. Please refer to the disclaimer at the end of this document.
MSCI ESG KLD STATS: 1991-2014 DATA SETS | JUNE 2015
ESG PERFORMANCE INDICATORS: DEFINITIONS
ENVIRONMENTAL INDICATORS
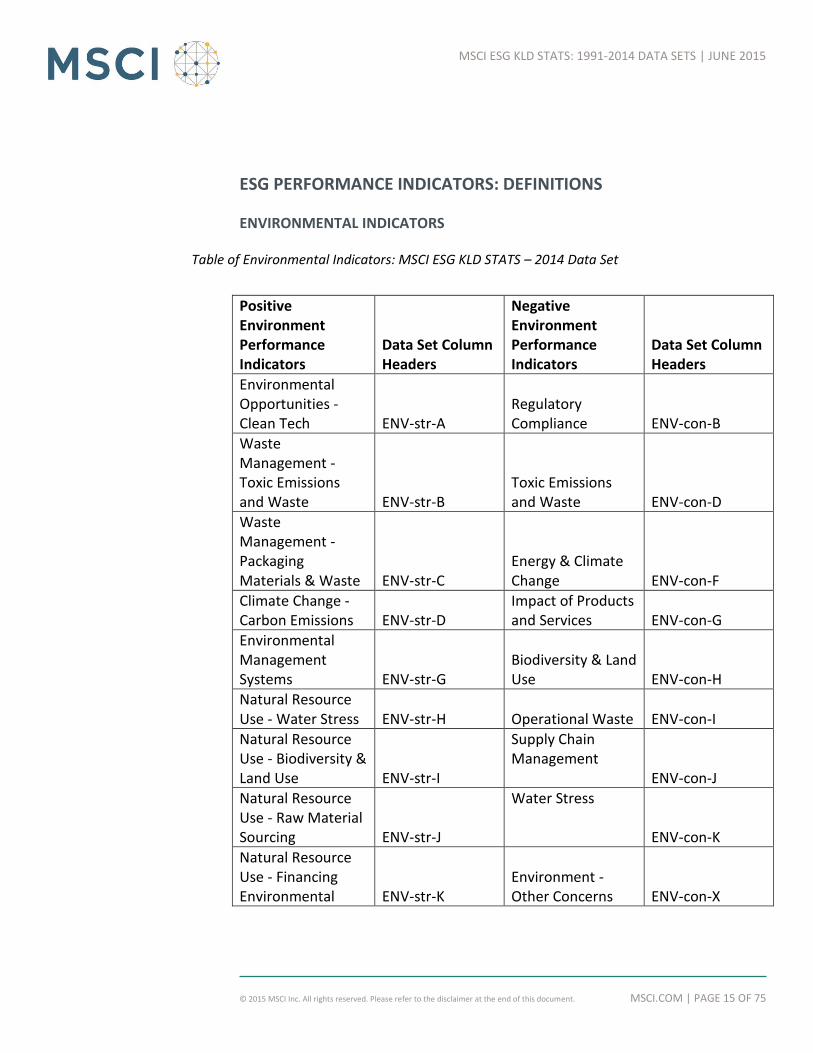
Table of Environmental Indicators: MSCI ESG KLD STATS – 2014 Data Set
Positive Environment Performance Indicators
Data Set Column Headers
Negative Environment Performance Indicators
Data Set Column Headers
Environmental Opportunities - Clean Tech ENV-str-A
Regulatory Compliance ENV-con-B
Waste Management - Toxic Emissions and Waste ENV-str-B
Toxic Emissions and Waste ENV-con-D
Waste Management - Packaging Materials & Waste ENV-str-C
Energy & Climate Change ENV-con-F
Climate Change - Carbon Emissions ENV-str-D
Impact of Products and Services ENV-con-G
Environmental Management Systems ENV-str-G
Biodiversity & Land Use ENV-con-H
Natural Resource Use - Water Stress ENV-str-H Operational Waste ENV-con-I
Natural Resource Use - Biodiversity & Land Use ENV-str-I
Supply Chain Management
ENV-con-J
Natural Resource Use - Raw Material Sourcing ENV-str-J
Water Stress
ENV-con-K
Natural Resource Use - Financing Environmental ENV-str-K
Environment - Other Concerns ENV-con-X
MSCI.COM | PAGE 16 OF 75 © 2015 MSCI Inc. All rights reserved. Please refer to the disclaimer at the end of this document.
MSCI ESG KLD STATS: 1991-2014 DATA SETS | JUNE 2015
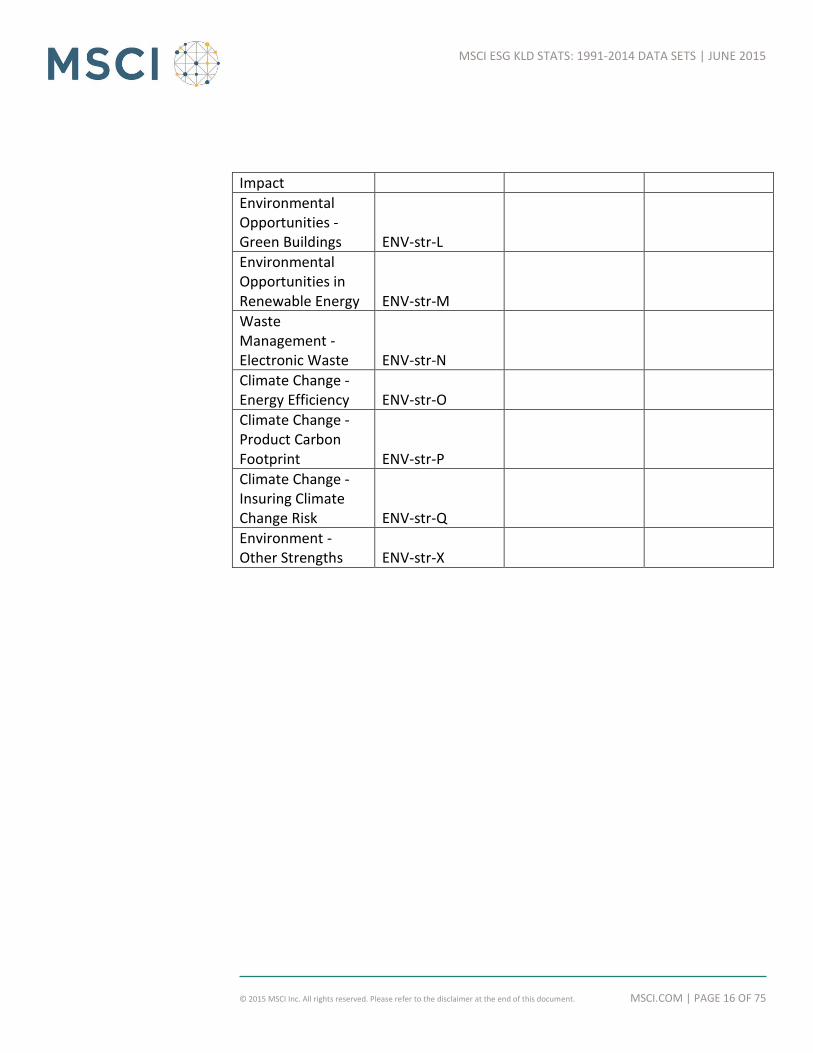
Impact
Environmental Opportunities - Green Buildings ENV-str-L
Environmental Opportunities in Renewable Energy ENV-str-M
Waste Management - Electronic Waste ENV-str-N
Climate Change - Energy Efficiency ENV-str-O
Climate Change - Product Carbon Footprint ENV-str-P
Climate Change - Insuring Climate Change Risk ENV-str-Q
Environment - Other Strengths ENV-str-X
MSCI.COM | PAGE 17 OF 75 © 2015 MSCI Inc. All rights reserved. Please refer to the disclaimer at the end of this document.
MSCI ESG KLD STATS: 1991-2014 DATA SETS | JUNE 2015
POSITIVE ENVIRONMENT PERFORMANCE INDICATORS
ENVIRONMENTAL OPPORTUNITIES – CLEAN TECH (ENV-STR-A)
This indicator is designed to assess how companies are taking advantages of opportunities in the market for environmental technologies. Companies that proactively invest in product and services that address issues of resource conservation and climate change score higher. Key management metrics include, efforts to take advantage of opportunities through strategic targeting of a market for environmental technology or through development of clean tech business segments that are related to company’s core business.
WASTE MANAGEMENT – TOXIC EMISSIONS AND WASTE (ENV-STR-B)
This indicator is designed to assess how companies manage their risk of incurring liabilities associated with pollution, contamination, and the emission of toxic and carcinogenic substances. Companies that have strong programs and performance in reducing toxic emissions score higher.
WASTE MANAGEMENT - PACKAGING MATERIALS & WASTE (ENV-STR-C)
This indicator is designed to assess how companies manage the risks of losing access to markets or of facing added costs to come into compliance with new regulations related to product packaging content and end-of-life recycling or disposal of packaging materials. Companies that proactively reduce the environmental impact of their packaging, including use of recycled content material and establishment of take-back and recycling programs, score higher.
CLIMATE CHANGE - CARBON EMISSIONS (ENV-STR-D)
This indicator is designed to assess how companies manage the risks of increased costs linked to carbon pricing or regulatory caps. Companies that proactively invest in low-carbon technologies and increase the carbon efficiency of their facilities or products score higher. Management metrics include efforts to reduce exposure through comprehensive carbon policies and implementation mechanisms, including carbon reduction
MSCI.COM | PAGE 18 OF 75 © 2015 MSCI Inc. All rights reserved. Please refer to the disclaimer at the end of this document.
MSCI ESG KLD STATS: 1991-2014 DATA SETS | JUNE 2015
targets, production process improvements, installation emissions capture equipment, and/or switching to cleaner energy sources.
ENVIRONMENTAL MANAGEMENT SYSTEMS (ENV-STR-G)
This indicator measures whether a firm has an environmental management system (EMS) in place, and whether it is certified to a third party standard, such as ISO 14001.
NATURAL RESOURCE USE - WATER STRESS (ENV—STR-H)
This indicator is designed to assess how companies manage the risks of water shortages impacting their ability to operate, losing access to markets due to stakeholder opposition over water use, or being subject to higher water costs. Companies that proactively employ water efficient processes, water recycling and alternative water sources score higher.
NATURAL RESOURCE USE - BIODIVERSITY & LAND USE (ENV-STR-I)
This indicator is designed to assess how companies manage the risks of losing access to markets, or incurring litigation, liability, or reclamation costs due to operations that damage fragile ecosystems. Companies that have policies and programs designed to protect biodiversity and address community concerns on land use score higher.
NATURAL RESOURCE USE - RAW MATERIAL SOURCING (ENV-STR-J)
This indicator is designed to assess how companies manage the risks of damaging their brand value by sourcing raw materials with high environmental impact. Companies that have policies and procedures to source materials with lower environmental impact and participate in initiatives to reduce environmental impact of raw materials production score higher. Management metrics include policies, initiatives, and targets related to sourcing the following materials of concern: seafood and/or aquaculture, timber and/or paper, palm oil, beef and/or dairy, leather, and cotton.
NATURAL RESOURCE USE - FINANCING ENVIRONMENTAL IMPACT (ENV-STR-K)
This indicator is designed to assess how companies manage the risks of credit defaults resulting from poor due diligence processes related to environmental
MSCI.COM | PAGE 19 OF 75 © 2015 MSCI Inc. All rights reserved. Please refer to the disclaimer at the end of this document.
MSCI ESG KLD STATS: 1991-2014 DATA SETS | JUNE 2015
concerns. Companies that proactively address the environmental risks embedded in their financing decisions score higher.
ENVIRONMENTAL OPPORTUNITIES - GREEN BUILDINGS (ENV-STR-L)
This indicator is designed to evaluate the extent to which companies are taking advantage of opportunities to develop or refurbish buildings with leading environmental design features, including lower embodied energy, recycled materials, lower energy and water use, waste reduction, and healthier and more productive working environments. Companies that proactively develop or refurbish buildings to achieve green building certifications score higher.
ENVIRONMENTAL OPPORTUNITIES – RENEWABLE ENERGY (ENV-STR-M)
This indicator is designed to evaluate the extent to which companies are taking advantage of opportunities linked to the development of renewable power production. Companies that proactively invest in renewable power generation and related services score higher. Key management metrics include, efforts to develop renewable power generation capacity and/or proactively complement the development of renewable power through electrical network expansion, equipment commercialization, and ‘green power’ offerings to its customers.
WASTE MANAGEMENT - ELECTRONIC WASTE (ENV-STR-N)
This indicator is designed to assess how electronic product producers and retailers manage the risks associated with recycling and/or disposal of end-of-life electronic products. Companies that proactively address electronic waste concerns by establishing comprehensive and well-managed product recovery and recycling programs score higher.
CLIMATE CHANGE – ENERGY EFFICIENCY (ENV-STR-O)
This indicator is designed to assess how companies manage the risks of increased or volatile energy costs across their operations. Companies that take proactive steps to manage and improve the energy efficiency of their operations score higher.
MSCI.COM | PAGE 20 OF 75 © 2015 MSCI Inc. All rights reserved. Please refer to the disclaimer at the end of this document.
MSCI ESG KLD STATS: 1991-2014 DATA SETS | JUNE 2015
CLIMATE CHANGE – PRODUCT CARBON FOOTPRINT (ENV-STR-P)
This indicator is designed to assess how companies manage the risks of higher input or production costs for their carbon-intense products due to increased energy costs. Companies that measure and reduce the carbon emissions associated with their products, and implement programs with their suppliers to reduce carbon footprint, score higher. Key management metrics include, efforts to reduce exposure through measurement and reduction of carbon emissions associated with raw materials production, product manufacturing, distribution, and retail.
CLIMATE CHANGE - INSURING CLIMATE CHANGE RISK (ENV-STR-Q)
This indicator is designed to assess how companies manage the risks to insured assets or individuals associated with the effects of climate change. Companies that have integrated climate change effects into their actuarial models while developing products to help customers manage climate change related risks score higher. Key management metrics include, acknowledgement of climate change as a business risk; integration of climate change into risk modeling, pricing, and reserving; product and incentive offerings to reduce or hedge climate change-related risks.
ENVIRONMENT - OTHER STRENGTHS (ENV-STR-X)
This indicator assesses a firm’s environmental management policies, programs and initiatives that are not covered by any other MSCI ESG Research environmental metrics.
NEGATIVE ENVIRONMENT PERFORMANCE INDICATORS
REGULATORY COMPLIANCE (ENV-CON-B)
This indicator identifies companies that have paid a settlement, fine or penalty due to non-compliance with U.S. environmental regulations.
MSCI.COM | PAGE 21 OF 75 © 2015 MSCI Inc. All rights reserved. Please refer to the disclaimer at the end of this document.
MSCI ESG KLD STATS: 1991-2014 DATA SETS | JUNE 2015
For each company, MSCI ESG Research calculates a three-year average of settlements, fines, and/or penalties (US$) for alleged violations of any of the following nine major U.S. federal environmental health and safety laws:
Federal Insecticide, Fungicide, and Rodenticide Act (FIFRA)
Toxic Substances Control Act (TSCA)
Endangered Species Act (ESA)
Clean Water Act (CWA)
Safe Water Drinking Act (SWDA)
Resource Conservation and Recovery Act (RCRA)
Clean Air Act (CAA)
Atomic Energy Act (AEA) Source: Nuclear Regulatory Commission
Mine Act (MA) Source: Mine Safety and Health Administration
For STATS-2014, the data covers the 2011-2013 period. Companies that averaged $40,000 or more in settlements, fines, and/or penalties during this period received a score = 1. For all STATS data sets, this indicator only covers companies in a U.S. universe.
TOXIC EMISSIONS AND WASTE (ENV-CON-D)
This indicator is designed to assess the severity of controversies related to a firm’s non-GHG emissions. Factors affecting this evaluation include, but are not limited to, a history of involvement in land or air emissions-related legal cases, widespread or egregious impacts due to hazardous emissions, resistance to improved practices, and criticism by NGOs and/or other third-party observers.
ENERGY AND CLIMATE CHANGE (ENV-CON-F)
This indicator is designed to assess the severity of controversies related to a firm’s climate change and energy-related policies and initiatives. Factors affecting this evaluation include, but are not limited to, a history of involvement in GHG-related legal cases, widespread or egregious impacts due to corporate GHG emissions, resistance to improved practices, and criticism by NGOs and/or other third-party observers.
MSCI.COM | PAGE 22 OF 75 © 2015 MSCI Inc. All rights reserved. Please refer to the disclaimer at the end of this document.
MSCI ESG KLD STATS: 1991-2014 DATA SETS | JUNE 2015
IMPACT OF PRODUCTS & SERVICES (ENV-CON-G)
This indicator is designed to assess the severity of controversies related to the environmental impact of a firm’s products and services. Factors affecting this evaluation include, but are not limited to, a history of involvement in environmental impact-related legal cases, widespread or egregious impacts due to direct or indirect use of the firm’s products or services, resistance to improved practices, and criticism by NGOs and/or other third-party observers.
BIODIVERSITY & LAND USE (ENV-CON-H)
This indicator is designed to assess the severity of controversies related to a firm’s use or management of natural resources. Factors affecting this evaluation include, but are not limited to, a history of involvement in natural resource-related legal cases, widespread or egregious impacts due to the firm’s use of natural resources, resistance to improved practices, and criticism by NGOs and/or other third-party observers.
OPERATIONAL WASTE (ENV-CON-I)
This indicator is designed to assess the severity of controversies related to the impact of a firm’s non-hazardous operational waste. Factors affecting this evaluation include, but are not limited to, a history of involvement in environmental impact-related legal cases, widespread or egregious impacts of the firm’s non-hazardous waste streams, resistance to improved practices, and criticism by NGOs and/or other third-party observers.
SUPPLY CHAIN MANAGEMENT (ENV-CON-J)
This indicator is designed to assess the severity of controversies related to the environmental impact of a company’s supply chain and the sourcing of natural resources. Factors affecting this evaluation include, but are not limited to, a history of widespread or egregious environmental impacts in a firm’s supply chain, legal cases, resistance to improved practices, and criticism by NGOs and/or other third-party observers.
WATER STRESS (ENV-CON-K)
This indicator is designed to assess the severity of controversies related to a firm’s water management practices. Factors affecting this evaluation include, but are not limited to, a history of involvement in water use-related legal cases,
MSCI.COM | PAGE 23 OF 75 © 2015 MSCI Inc. All rights reserved. Please refer to the disclaimer at the end of this document.
MSCI ESG KLD STATS: 1991-2014 DATA SETS | JUNE 2015
widespread or egregious impacts due to effluents, resistance to improved practices, and criticism by NGOs and/or other third-party observers.
ENVIRONMENT - OTHER CONCERNS (ENV-CON-X)
This indicator is designed to assess the severity of controversies related to a firm’s environmental impact not covered by other MSCI ESG Research’s environmental indicators. Factors affecting this evaluation include, but are not limited to widespread or egregious environmental impacts, resistance to improved practices, and criticism by NGOs and/or other third-party observers.
SOCIAL INDICATORS
Table of Social Indicators: MSCI ESG STATS – 2014 Data Set
Positive Social Performance Indicators
Data Set Column Headers
Negative Social Performance Indicators
Data Set Column Headers
Community Engagement COM-str-H Community Impact COM-con-B
Indigenous Peoples Relations HUM-str-D
Support for Controversial Regimes HUM-con-C
Human Rights Policies & Initiatives HUM-str-X
Freedom of Expression and Censorship HUM-con-J
Human Rights Violations HUM-con-K
Human Rights - Other Concerns HUM-con-X
Union Relations EMP-str-A Union Relations Concern EMP-con-A
Cash Profit Sharing EMP-str-C Health and Safety Concern EMP-con-B
Involvement EMP-str-D Supply Chain EMP-con-F
MSCI.COM | PAGE 24 OF 75 © 2015 MSCI Inc. All rights reserved. Please refer to the disclaimer at the end of this document.
MSCI ESG KLD STATS: 1991-2014 DATA SETS | JUNE 2015
Controversies
Health & Safety Policies & Initiatives EMP-str-G
Supply Chain -Child Labor EMP-con-G
Supply Chain Labor Standards EMP-str-H
Labor-Management Relations EMP-con-H
Labor Rights & Supply Chain - Other Concerns EMP-con-X
Human Capital Development EMP-str-L
Human Capital – Labor Management EMP-str-M
Controversial Sourcing EMP-str-N
Human Capital - Other Strengths EMP-str-X
Board of Directors - Gender DIV-str-C Workforce Diversity DIV-con-A
Board Diversity - Gender DIV-con-C
Product Safety and Quality PRO-str-A
Product Quality & Safety PRO-con-A
Social Opportunities-Access to Healthcare PRO-str-C
Marketing & Advertising PRO-con-D
Access to Finance PRO-str-D Anticompetitive Practices PRO-con-E
Social Opportunities-Access to Communications PRO-str-E Customer Relations PRO-con-F
Social Opportunities-Opportunities in Nutrition and Health PRO-str-F Other Concerns PRO-con-X
Product Safety - Chemical Safety PRO-str-G
Product Safety -Financial Product PRO-str-H
MSCI.COM | PAGE 25 OF 75 © 2015 MSCI Inc. All rights reserved. Please refer to the disclaimer at the end of this document.
MSCI ESG KLD STATS: 1991-2014 DATA SETS | JUNE 2015
Safety
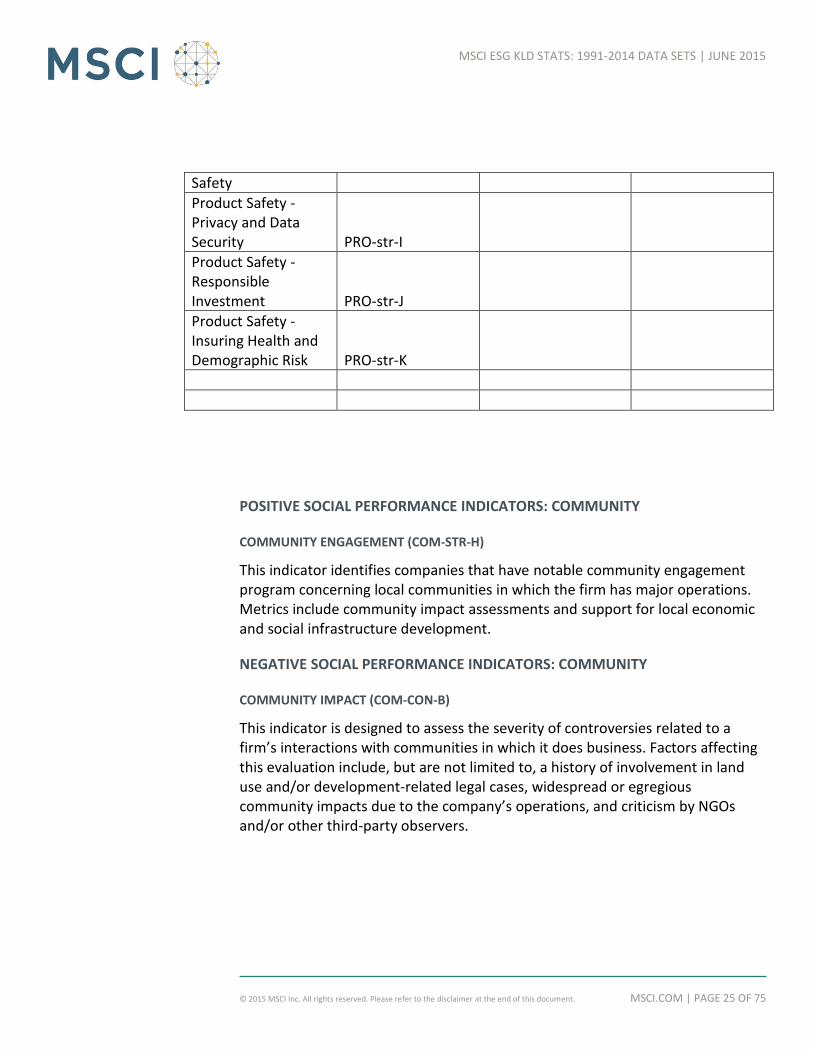
Product Safety - Privacy and Data Security PRO-str-I
Product Safety - Responsible Investment PRO-str-J
Product Safety - Insuring Health and Demographic Risk PRO-str-K
POSITIVE SOCIAL PERFORMANCE INDICATORS: COMMUNITY
COMMUNITY ENGAGEMENT (COM-STR-H)
This indicator identifies companies that have notable community engagement program concerning local communities in which the firm has major operations. Metrics include community impact assessments and support for local economic and social infrastructure development.
NEGATIVE SOCIAL PERFORMANCE INDICATORS: COMMUNITY
COMMUNITY IMPACT (COM-CON-B)
This indicator is designed to assess the severity of controversies related to a firm’s interactions with communities in which it does business. Factors affecting this evaluation include, but are not limited to, a history of involvement in land use and/or development-related legal cases, widespread or egregious community impacts due to the company’s operations, and criticism by NGOs and/or other third-party observers.
MSCI.COM | PAGE 26 OF 75 © 2015 MSCI Inc. All rights reserved. Please refer to the disclaimer at the end of this document.
MSCI ESG KLD STATS: 1991-2014 DATA SETS | JUNE 2015
POSITIVE SOCIAL PERFORMANCE INDICATORS: HUMAN RIGHTS
INDIGENOUS PEOPLES RELATIONS STRENGTH (HUM-STR-D)
This indicator identifies companies that have established relations with indigenous peoples near its proposed or current operations that respect the sovereignty, land, culture, human rights, and intellectual property.
HUMAN RIGHTS POLICIES & INITIATIVES (HUM-STR-X)
This indicator identifies companies that have undertaken exceptional human rights initiatives, including outstanding transparency or disclosure on human rights issues, or has otherwise shown industry leadership on human rights issues not covered by other MSCI human rights ratings.
NEGATIVE SOCIAL PERFORMANCE INDICATORS: HUMAN RIGHTS
SUPPORT FOR CONTROVERSIAL REGIMES (HUM-CON-C)
This indicator is designed to assess the severity of controversies related to a firm’s operations in countries with poor human rights records. Factors affecting this evaluation include, but are not limited to, links to the controversial regime, a history of controversial operations in the countries, allegations of complicity in violence towards the citizenry as a result of the company's operations, and criticism by NGOs and/or other third-party observers.
FREEDOM OF EXPRESSION & CENSORSHIP (HUM-CON-J)
This indicator measures the severity of controversies related to the impact of a firm’s operations on freedom of expression and free speech. Factors affecting this evaluation include, but are not limited to, cooperating with repressive governments seeking internet user data or requiring censorship, resistance to improved practices, and criticism by NGOs and/or other third-party observers.
HUMAN RIGHTS VIOLATIONS (HUM-CON-K)
This indicator measures the severity of controversies related to the impact of a firm’s operations on human rights. Factors affecting this evaluation include, but are not limited to, a history of involvement in human rights-related legal cases,
MSCI.COM | PAGE 27 OF 75 © 2015 MSCI Inc. All rights reserved. Please refer to the disclaimer at the end of this document.
MSCI ESG KLD STATS: 1991-2014 DATA SETS | JUNE 2015
widespread or egregious complicity in killings, physical abuse, or violation of other rights, resistance to improved practices, and criticism by NGOs and/or other third-party observers.
HUMAN RIGHTS - OTHER CONCERNS (HUM-CON-X)
This indicator measures the severity of controversies related to human rights controversies that are not covered by other MSCI ESG Research human rights ratings.
POSITIVE SOCIAL PERFORMANCE INDICATORS: EMPLOYEE RELATIONS
UNION RELATIONS (EMP-STR-A)
This indicator identifies companies with high union density.
CASH PROFIT SHARING (EMP-STR-C)
This indicator identifies companies that have a cash profit-sharing program through which they have recently made distributions to a significant proportion of their workforce.
EMPLOYEE INVOLVEMENT (EMP-STR-D)
This indicator identifies companies that encourage worker involvement via generous employee stock ownership plans (ESOPs) or employee stock purchase plans (ESPPs).
EMPLOYEE HEALTH & SAFETY (EMP-STR-G)
This indicator identifies companies that have strong employee health and safety programs. Initiatives include comprehensive H&S policies and implementation mechanisms across the supply chain, identification and elimination of sources of H&S risk, training, performance auditing of both the company’s and contractor’s operations, certification under OHSAS 18001, setting up improvement targets, and assessment of historical performance tracking and reporting.
SUPPLY CHAIN LABOR STANDARDS (EMP-STR-H)
This indicator is designed to assess how well companies manage risks of production disruptions and brand value damage due to sub-standard treatment
MSCI.COM | PAGE 28 OF 75 © 2015 MSCI Inc. All rights reserved. Please refer to the disclaimer at the end of this document.
MSCI ESG KLD STATS: 1991-2014 DATA SETS | JUNE 2015
of workers in the company’s supply chain. Companies that establish labor management policies meeting stringent international norms, implement programs to verify compliance with the policies, and introduce incentives for compliance among suppliers score higher.
HUMAN CAPITAL DEVELOPMENT (EMP-STR-L)
This indicator is designed to assess companies’ ability to attract, retain, and develop human capital based on their provision of benefits, training and development programs, and employee engagement; and avoid labor unrest or reduced productivity due to poor job satisfaction. Companies that proactively manage human capital development by offering competitive benefit packages and performance incentives, implementing formalized training programs, offering employee engagement and professional development programs, and actively measuring employee satisfaction score highest. Companies assessed for this indicator are those that rely on a highly-skilled or highly-trained workforce based on its principal lines of business. This indicator only covers companies that rely on a highly-skilled or highly-trained workforce. Please see Labor Management (EMP-str-M) for an assessment of companies with large production workforces. Name change for STATS-2014 Data Set, from "Human Capital Management" to "Human Capital Development".
LABOR MANAGEMENT (EMP-STR-M)
This indicator is designed to assess how companies manage their workforce to minimize the risk of workflow disruptions due to labor unrest, or reduced productivity due to poor job satisfaction. Companies that provide strong employment benefits and performance incentives and offer employee engagement and professional development programs score higher. Companies assessed for this indicator are those which have a large production workforce. Name change for STATS-2014 Data Set, from "Human Capital - Labor Management" to "Labor Management".
MSCI.COM | PAGE 29 OF 75 © 2015 MSCI Inc. All rights reserved. Please refer to the disclaimer at the end of this document.
MSCI ESG KLD STATS: 1991-2014 DATA SETS | JUNE 2015
CONTROVERSIAL SOURCING (EMP-STR-N)
This indicator is designed to assess how companies manage their risks of incurring regulatory compliance costs, reputational damage, or supply chain disruptions resulting from reliance on raw materials that originate in areas associated with severe human rights and labor rights abuses. The range of scoring depends on the material, with different materials relevant for different industries. In general, companies able to trace the origin of their raw materials and certify that they were obtained in a way that minimizes social harm (e.g. slave labor or funding for groups engaged in human rights violations) score higher.
HUMAN CAPITAL – OTHER STRENGTHS (EMP-STR-X)
This indicator is designed to capture best-in-class management performance in the area of human capital that is not covered by other MSCI ESG Research human capital indicators. Metrics include recognition by reputable third party sources for excellent workforce management.
NEGATIVE SOCIAL PERFORMANCE INDICATORS: EMPLOYEE RELATIONS
UNION RELATIONS CONCERNS (EMP-CON-A)
This indicator is designed to assess the severity of controversies related to a firm’s union relations practices. Factors affecting this evaluation include, but are not limited to, the firm’s response to union organizing efforts and its bargaining practices with existing unionized workers, resistance to improved practices, and criticism by NGOs and/or other third-party observers.
HEALTH & SAFETY (EMP-CON-B)
This indicator is designed to assess the severity of controversies related to the safety of a firm’s employees. Factors affecting this evaluation include, but are not limited to, a history of involvement in workplace safety-related legal cases,
MSCI.COM | PAGE 30 OF 75 © 2015 MSCI Inc. All rights reserved. Please refer to the disclaimer at the end of this document.
MSCI ESG KLD STATS: 1991-2014 DATA SETS | JUNE 2015
widespread or egregious fines for unsafe workplace practices, resistance to improved practices, and criticism by NGOs and/or other third-party observers.
SUPPLY CHAIN (EMP-CON-F)
This indicator is designed to assess the severity of controversies related to a firm’s supply chain. Factors affecting this evaluation include, but are not limited to, a history of involvement in supply chain-related legal cases, widespread or egregious instances of abuses of the labor rights or safety of employees in their supply chain, resistance to improved practices, and criticism by NGOs and/or other third-party observers.
CHILD LABOR (EMP –CON-G)
This indicator is designed to assess the severity of child labor controversies in a firm’s supply chain. Factors affecting this evaluation include, but are not limited to, a history of involvement in child labor-related legal cases, widespread or egregious instances of child labor in the firm’s supply chain, resistance to improved practices, and criticism by NGOs and/or other third-party observers.
LABOR-MANAGEMENT RELATIONS (EMP-CON-H)
This indicator is designed to assess the severity of controversies related to a firm’s labor-management relations. Factors affecting this evaluation include, but are not limited to, a history of involvement in employee-related legal cases, widespread or egregious instances of wrongful termination, reductions in benefits, or mistreatment of either employees and contractors, resistance to improved practices, and criticism by NGOs and/or other third-party observers.
LABOR RIGHTS & SUPPLY CHAIN – OTHER CONCERNS (EMP-CON-X)
This indicator identifies companies that are involved in employee relations controversies that are not covered by other MSCI ESG Research indicators.
MSCI.COM | PAGE 31 OF 75 © 2015 MSCI Inc. All rights reserved. Please refer to the disclaimer at the end of this document.
MSCI ESG KLD STATS: 1991-2014 DATA SETS | JUNE 2015
POSITIVE SOCIAL PERFORMANCE INDICATORS: DIVERSITY
BOARD OF DIRECTORS - GENDER (DIV-STR-C)
This indicator identifies companies with strong gender diversity on their board of directors. For the STATS-2014 Data Set, this indicator only covers U.S. companies.
NEGATIVE SOCIAL PERFORMANCE INDICATORS: DIVERSITY
WORKFORCE DIVERSITY (DIV-CON-A)
This indicator is designed to assess the severity of controversies related to a firm’s workforce diversity. Factors affecting this evaluation include, but are not limited to, a history of involvement in discrimination-related legal cases, widespread or egregious instances of discrimination on the basis of sex, race, or ethnicity, resistance to improved practices, and criticism by NGOs and/or other third-party observers.
BOARD OF DIRECTORS - GENDER (DIV-CON-C)
This indicator identifies companies with no women on their board of directors. For the STATS-2014 Data Set, this indicator only covers U.S. companies.
POSITIVE SOCIAL PERFORMANCE INDICATORS: PRODUCT
PRODUCT SAFETY AND QUALITY (PRO-STR-A)
This indicator is designed to assess how companies manage their risk of facing major product recalls or losing customer trust through major product quality concerns. Companies that proactively manage product quality by achieving certification to widely acceptable standards, undertaking extensive product testing and building processes to track raw materials or components score higher. For the real estate sector, this indicator is designed to evaluate how companies manage their risk of incurring loss from low occupancy rates due to poor tenant
MSCI.COM | PAGE 32 OF 75 © 2015 MSCI Inc. All rights reserved. Please refer to the disclaimer at the end of this document.
MSCI ESG KLD STATS: 1991-2014 DATA SETS | JUNE 2015
engagement programs. Companies that develop properties in urban areas with access to transportation, and offer tenant incentives to reduce maintenance and utility costs score higher.
SOCIAL OPPORTUNITIES – ACCESS TO HEALTHCARE (PRO-STR-C)
This indicator is designed to assess the extent to which companies are taking advantage of opportunities for longer term growth and protecting their license to operate through efforts to improve access to healthcare in developing countries and for under-served populations in developed markets. In developing countries, companies that adapt their business models to reflect the specific needs of individuals in these markets through areas such as R&D, pricing, and licensing strategies score higher. In developed markets, companies that take advantage of opportunities driven by regulatory changes to capture the uninsured market score higher.
SOCIAL OPPORTUNITIES - ACCESS TO FINANCE (PRO-STR-D)
This indicator is designed to assess the extent to which a company is providing lending, financing, or products to underrepresented or under-banked communities. Top performing companies will offer products and services to communities with limited or no access to financial products.
SOCIAL OPPORTUNITIES - ACCESS TO COMMUNICATIONS (PRO-STR-E)
This indicator is designed to assess the extent to which companies are taking advantage of opportunities for growth in historically underserved markets, including developing countries and underserved populations in developed countries (such as rural areas and the elderly). Companies with considerable operations in developing countries score well, as do those with substantial activities focused on expanding access through relevant initiatives and philanthropic efforts.
SOCIAL OPPORTUNITIES - OPPORTUNITIES IN NUTRITION AND HEALTH (PRO-STR-F)
This indicator is designed to assess the extent to which companies are taking advantage of the growth opportunities in the market for healthier products. Companies that offer products with improved nutritional profile, and have sought credible verification, score higher.
MSCI.COM | PAGE 33 OF 75 © 2015 MSCI Inc. All rights reserved. Please refer to the disclaimer at the end of this document.
MSCI ESG KLD STATS: 1991-2014 DATA SETS | JUNE 2015
PRODUCT SAFETY - CHEMICAL SAFETY (PRO-STR-G)
This indicator is designed to assess how companies manage the risk of losing access to markets or the costs related to reformulating their products due to the presence of chemicals of concern. Companies that proactively eliminate chemicals of concern from their products ahead of regulatory changes score higher.
PRODUCT SAFETY -FINANCIAL PRODUCT SAFETY (PRO-STR-H)
This indicator is designed to assess how companies manage the risk of incurring costs associated with unanticipated credit losses, litigation, and regulatory changes brought by offering financial products that lack transparency or are highly likely to be financially unsustainable to the end-user. Companies that offer transparent financial products based on a borrower’s ability to repay score higher.
PRODUCT SAFETY - PRIVACY AND DATA SECURITY (PRO-STR-I)
This indicator is designed to assess how companies manage the risk of incurring reputational damage, or legal liability, from a data security breach or controversial use of personal data, or having their business model undermined by evolving regulatory requirements on privacy and data protection. Companies with comprehensive privacy policies and data security management systems and companies whose business models are not reliant on trafficking in personal data score higher.
PRODUCT SAFETY - RESPONSIBLE INVESTMENT (PRO-STR-J)
This indicator is designed to assess how companies avoid ESG-related risks in their investment portfolios. Companies that mitigate ESG risks in their investments by integrating ESG risk analysis into their due diligence process across all investment portfolios and asset classes score higher.
PRODUCT SAFETY - INSURING HEALTH AND DEMOGRAPHIC RISK (PRO-STR-K)
This indicator is designed to assess how companies manage emerging insurance risks associated with public health trends and demographic change. Companies that have systems in place to identify and model emerging risks associated with health and demographic changes score higher.
MSCI.COM | PAGE 34 OF 75 © 2015 MSCI Inc. All rights reserved. Please refer to the disclaimer at the end of this document.
MSCI ESG KLD STATS: 1991-2014 DATA SETS | JUNE 2015
NEGATIVE SOCIAL PERFORMANCE INDICATORS: PRODUCT
PRODUCT QUALITY & SAFETY (PRO-CON-A)
This indicator is designed to assess the severity of controversies related to the quality and safety of a firm’s products and services. Factors affecting this evaluation include, but are not limited to, a history of involvement in product safety-related legal cases, widespread or egregious instances of recalls or fines due to defective or unsafe products and services, resistance to improved practices, and criticism by NGOs and/or other third-party observers.
MARKETING & ADVERTISING (PRO-CON-D)
This indicator is designed to assess the severity of controversies related to a firm’s marketing and advertising practices. Factors affecting this evaluation include, but are not limited to, widespread or egregious instances of false, discriminatory, or improper marketing/advertising, marketing targeted at disadvantaged groups, resistance to improved practices, and criticism by NGOs and/or other third party observers.
ANTICOMPETITIVE PRACTICES (PRO-CON-E)
This indicator is designed to assess the severity of controversies related to a firm’s anti-competitive business practices. Factors affecting this evaluation include, but are not limited to, a history of involvement in anti-trust legal cases, widespread or egregious instances of price-fixing, collusion, or bid-rigging, resistance to improved practices, and evidence-based criticism by NGOs and/or other third-party observers.
CUSTOMER RELATIONS (PRO-CON-F)
This indicator is designed to assess the severity of controversies related to a firm’s customer relations. Factors affecting this evaluation include, but are not limited to, a history of involvement in customer-related legal cases, predatory lending, widespread or egregious instances of discrimination, fraud or unfair treatment, resistance to improved practices, and criticism by NGOs and/or other third-party observers.
MSCI.COM | PAGE 35 OF 75 © 2015 MSCI Inc. All rights reserved. Please refer to the disclaimer at the end of this document.
MSCI ESG KLD STATS: 1991-2014 DATA SETS | JUNE 2015
OTHER CONCERNS (PRO-CON-X)
This indicator is designed to assess the severity of customer-related controversies not covered by any other MSCI ESG Research rating.
GOVERNANCE INDICATORS
Table of Governance Indicators: MSCI ESG STATS – 2013 Data Set
Positive Governance Performance Indicators
Data Set Column Headers
Negative Governance Performance Indicators
Data Set Column Headers
Corruption & Instability CGOV-str-G
Governance Structures Controversies CGOV-con-K
Financial System Risk CGOV-str-H
Controversial Investments CGOV-con-L
Bribery & Fraud CGOV-con-M
Governance - Other Concerns CGOV-con-X
POSITIVE GOVERNANCE PERFORMANCE INDICATORS
CORRUPTION & POLITICAL INSTABILITY (CGOV-STR-G)
This indicator is designed to assess how companies manage the risk of suffering operational disruptions or loss of market access due to violence, property destruction or sabotage, political instability, demands for bribes, and costly
MSCI.COM | PAGE 36 OF 75 © 2015 MSCI Inc. All rights reserved. Please refer to the disclaimer at the end of this document.
MSCI ESG KLD STATS: 1991-2014 DATA SETS | JUNE 2015
litigation related to corrupt practices. Companies that have programs, guidelines, and clear policies to avoid corrupt business dealings, have strong partnerships with local communities, and have a high level of disclosure and transparency score higher.
FINANCIAL SYSTEM INSTABILITY (CGOV-STR-H)
This indicator is designed to assess how a company manages its systemic risk in financial markets. Companies that institute strong governance structures and demonstrate a high level of transparency score well.
NEGATIVE GOVERNANCE PERFORMANCE INDICATORS
GOVERNANCE STRUCTURES (CGOV-CON-K)
This indicator is designed to assess the severity of controversies related to a firm’s executive compensation and governance practices. Factors affecting this evaluation include, but are not limited to, a history of involvement in compensation-related legal cases, widespread or egregious instances of shareholder or board-level objections to pay practices and governance structures, resistance to improved practices, and criticism by NGOs and/or other third-party observers.
CONTROVERSIAL INVESTMENTS (CGOV-CON-L)
This indicator is designed to assess the severity of controversies related to the social and environmental impact of a firm’s lending, underwriting, and financing activities. Topics covered include, for example, financing projects that are controversial because of their actual or anticipated environmental or social impact, as well as criticism of mining companies, REITs, and similar companies that receive royalties or own shares in a particular project that they neither own or operate.
BRIBERY & FRAUD (CGOV-CON-M)
This indicator is designed to assess the severity of controversies related to a firm’s business ethics practices. Factors affecting this evaluation include, but are not limited to, a history of involvement in widespread or egregious instances of
MSCI.COM | PAGE 37 OF 75 © 2015 MSCI Inc. All rights reserved. Please refer to the disclaimer at the end of this document.
MSCI ESG KLD STATS: 1991-2014 DATA SETS | JUNE 2015
bribery, tax evasion, insider trading, accounting irregularities, resistance to improved practices, and criticism by NGOs and/or other third-party observers.
GOVERNANCE - OTHER CONCERNS (CGOV-CON-X)
This indicator measures the severity of controversies related to a firm’s governance practices not covered by any other MSCI ESG Research rating.
MSCI.COM | PAGE 38 OF 75 © 2015 MSCI Inc. All rights reserved. Please refer to the disclaimer at the end of this document.
MSCI ESG KLD STATS: 1991-2014 DATA SETS | JUNE 2015
CONTROVERSIAL BUSINESS INVOLVEMENT INDICATORS
ALCOHOL (ALC-CON-A)
This indicator identifies companies that meet any of the following criteria: Producer Companies that derive any revenues from the manufacture of alcoholic products including brewers, distillers, and vintners, and companies that own or operate vineyards. Distributors Companies that derive any revenues from the wholesale distribution of alcoholic products. Retailers Companies that derive any revenues from the retail sale of alcoholic products including supermarkets, liquor stores, bars, pubs, or duty free stores. Licensor Companies that license their company name or brand name to alcoholic products. Suppliers Companies that derive any revenues from the supply of key raw materials and other products used specifically for the production of alcoholic products, including malt, hops, distilled spirits, alcohol flavoring, chemical additives, "pure alcohol", or "potable alcohol.” Ownership of an Alcohol Company Companies that own 20 to 49.99 percent of a company with involvement. When a company owns 50 percent or more of a subsidiary with involvement, MSCI ESG Research treats it as a consolidated subsidiary. Ownership by an Alcohol Company Companies that are 50 percent or more owned by a company with involvement.
FIREARMS (FIR-CON-A)
This indicator identifies companies that meet any of the following criteria: Producers Companies that derive any revenues from the manufacture of firearms and small arms ammunitions for civilian markets. The research does not cover companies that cater to the military, government, and law enforcement markets.
MSCI.COM | PAGE 39 OF 75 © 2015 MSCI Inc. All rights reserved. Please refer to the disclaimer at the end of this document.
MSCI ESG KLD STATS: 1991-2014 DATA SETS | JUNE 2015
Retailers and Distributors Companies that derive any revenues from the distribution (wholesale or retail) of firearms or small arms ammunition intended for civilian use. Ownership Of a Firearms Company Companies that own 20 to 49.99 percent of another company with involvement. When a company owns 50 percent or more of a subsidiary with involvement, MSCI ESG Research treats it as a consolidated subsidiary. Ownership By a Firearms Company Companies that are 50 percent or more owned by a company with involvement.
GAMBLING (GAM-CON-A)
This indicator identifies companies that meet any of the following criteria: Operations Companies that derive any revenues from the ownership and/or operation of gambling facilities, including casinos, racetracks, bingo parlors, horse, dog, or other racing events that permit wagering, lottery operations, online gambling, pari-mutuel wagering facilities, bingo; pachislot and pachinko parlors, slot machines, Jai-alai, mobile gambling, and sporting events that permit wagering. Support Companies that derive any revenues from the provision of key products or services fundamental to gambling operations, including:
Products manufactured exclusively for gambling, such as slot machines, roulette wheels, or lottery terminals;
Gambling technology and support designed for gambling applications such as IT maintenance, software design, security or surveillance systems, and lottery ticket printing; and
Gambling-related services such as credit lines, and casino management and consultation.
Licensor Companies that license their company name or brand name to gambling products. Ownership of a Gambling Company
MSCI.COM | PAGE 40 OF 75 © 2015 MSCI Inc. All rights reserved. Please refer to the disclaimer at the end of this document.
MSCI ESG KLD STATS: 1991-2014 DATA SETS | JUNE 2015
Companies that own 20 to 49.99 percent of a company with involvement. When a company owns 50 percent or more of a subsidiary with involvement, MSCI ESG Research treats it as a consolidated subsidiary. Ownership by a Gambling Company Companies that are 50 percent or more owned by a company with involvement.
MILITARY (MIL-CON-A)
This indicator identifies companies that meet any of the following criteria: Conventional Weapons Systems Companies that derive any revenues from the manufacture of conventional weapons and weapons systems. Conventional Weapons Components Companies that derive any revenues from the manufacture of critical components for conventional weapons systems. Nuclear Weapons Systems Companies that derive any revenues from the manufacture of nuclear weapons. Nuclear Weapons Components Companies that derive any revenues from the manufacture of critical components for nuclear weapons or nuclear weapons delivery systems. Chemical and Biological Weapons Systems Companies that derive any revenues from the manufacture of biological or chemical weapons, which are defined as weapons that use pathogens such as viruses, bacteria, and disease-causing biological agents, toxins, or chemical substances that have toxic properties that kill, injure, or incapacitate. Chemical and Biological Weapons Components Companies that manufacture critical components for chemical or biological weapons systems. Support Systems and Services Companies that derive any revenues from the provision of weapons systems support and services. This category is comprised of companies that provide equipment, systems, and services in direct support of weapons systems, or that provide systems with direct weapons-related applications. Companies are only included if there is evidence that the product or service has a weapons application. Ownership of a Military Weapons Company
MSCI.COM | PAGE 41 OF 75 © 2015 MSCI Inc. All rights reserved. Please refer to the disclaimer at the end of this document.
MSCI ESG KLD STATS: 1991-2014 DATA SETS | JUNE 2015
Companies that own 20 to 49.99 percent of a company with involvement. When a company owns 50 percent or more of a subsidiary with involvement, MSCI ESG Research treats it as a consolidated subsidiary. Ownership by a Military Weapons Company Companies that are 50 percent or more owned by a company with involvement.
NUCLEAR POWER (NUC-CON-A)
This indicator identifies companies that meet any of the following criteria: Nuclear Power Generation Companies that own or operate nuclear power plants. Essential Suppliers Companies that supply key nuclear-specific products or services to the nuclear power industry, including:
Builders or designers of nuclear power plants or nuclear power technology, which also includes producers of nuclear fuel products, nuclear reactors, nuclear rods, and equipment for nuclear power generation;
Suppliers of nuclear-specific key components or essential services for the design, construction, or operation of nuclear power plants;
Companies that specialize in providing consulting and license renewal services for the nuclear industry;
Companies involved in uranium mining, spent fuel processing, and fuel storage;
Distributors and handlers of nuclear fuel;
Companies involved in the repair and maintenance of core nuclear power generation equipment.
Ownership of a Nuclear Power Company Companies that own 20 to 49.99 percent of a company with involvement. When a company owns 50 percent or more of a subsidiary with involvement, MSCI ESG Research treats it as a consolidated subsidiary. Ownership by a Nuclear Power Company Companies that are 50 percent or more owned by a company with involvement.
MSCI.COM | PAGE 42 OF 75 © 2015 MSCI Inc. All rights reserved. Please refer to the disclaimer at the end of this document.
MSCI ESG KLD STATS: 1991-2014 DATA SETS | JUNE 2015
TOBACCO (TOB-CON-A)
This indicator identifies companies that meet any of the following criteria: Producers Companies that derive any revenues from growing or processing raw tobacco leaves, or the manufacture of tobacco products, including cigars, blunts, cigarettes, beedis, kreteks, smokeless tobacco, snuff, snus, chewing tobacco. Distributors Companies that derive any revenues from distribute tobacco products to retailers and other distributors. This data point does not include a manufacturer that distributes its own tobacco products, unless it also provides logistics or distribution services to other tobacco companies. Retailers Companies that derive any revenues from the retail of tobacco products. Licensor Companies that license their company or brand name to tobacco products. Supplier Companies that derive any revenues from the manufacture and supply of key products necessary for the production of tobacco products, such as tobacco flavoring, cigarette filters (acetate tow), tobacco roll paper, cigarette manufacturing machines, and tobacco packaging; specifically cigarette cartons, films, and aluminum foil. Ownership of a Tobacco Company Companies that own 20 to 49.99 percent of a company with involvement. When a company owns 50 percent or more of a subsidiary with involvement, MSCI ESG Research treats it as a consolidated subsidiary. Ownership by a Tobacco Company Companies that are 50 percent or more owned by a company with involvement.
MSCI ESG KLD STATS – 2014 DATA SET KEY
Please note the following worksheets within the MSCI ESG STATS_KEY spreadsheet:
2014 ESG Indicators: o All active ESG indicators for the 2014 research year.
2014 CBIs:
MSCI.COM | PAGE 43 OF 75 © 2015 MSCI Inc. All rights reserved. Please refer to the disclaimer at the end of this document.
MSCI ESG KLD STATS: 1991-2014 DATA SETS | JUNE 2015
o All active controversial business involvement (CBI) indicators for the 2014 research year.
2014 Additional Information o Company name, ticker, unique security identifier, ESG Indicators –
summation data
Data Set Universes - 2014 STATS ESG Indicators_ History
o All active and discontinued ESG indicators for each STATS Data Set, 1991-2014.
STATS CBI_History
o All active and discontinued CBI indicators for each STATS Data Set, 1991-2014
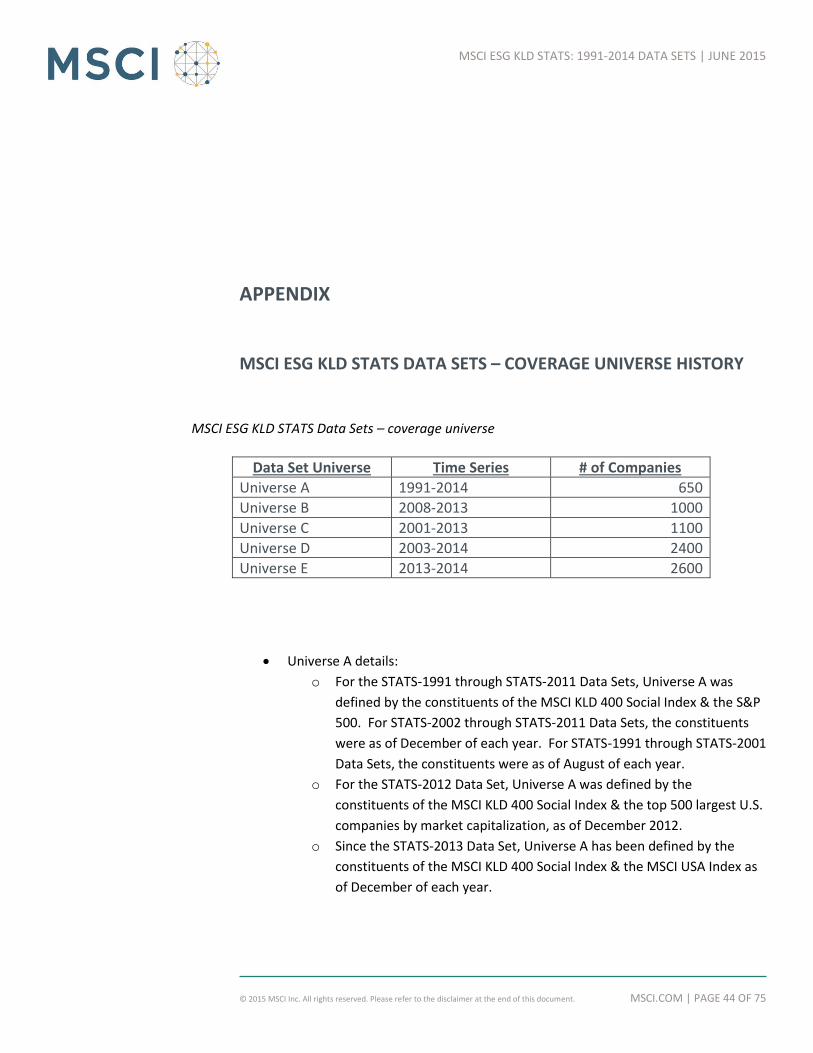
MSCI.COM | PAGE 44 OF 75 © 2015 MSCI Inc. All rights reserved. Please refer to the disclaimer at the end of this document.
MSCI ESG KLD STATS: 1991-2014 DATA SETS | JUNE 2015
APPENDIX
MSCI ESG KLD STATS DATA SETS – COVERAGE UNIVERSE HISTORY
MSCI ESG KLD STATS Data Sets – coverage universe
Data Set Universe Time Series # of Companies
Universe A 1991-2014 650
Universe B 2008-2013 1000
Universe C 2001-2013 1100
Universe D 2003-2014 2400
Universe E 2013-2014 2600
Universe A details:
o For the STATS-1991 through STATS-2011 Data Sets, Universe A was
defined by the constituents of the MSCI KLD 400 Social Index & the S&P
500. For STATS-2002 through STATS-2011 Data Sets, the constituents
were as of December of each year. For STATS-1991 through STATS-2001
Data Sets, the constituents were as of August of each year.
o For the STATS-2012 Data Set, Universe A was defined by the
constituents of the MSCI KLD 400 Social Index & the top 500 largest U.S.
companies by market capitalization, as of December 2012.
o Since the STATS-2013 Data Set, Universe A has been defined by the
constituents of the MSCI KLD 400 Social Index & the MSCI USA Index as
of December of each year.
MSCI.COM | PAGE 45 OF 75 © 2015 MSCI Inc. All rights reserved. Please refer to the disclaimer at the end of this document.
MSCI ESG KLD STATS: 1991-2014 DATA SETS | JUNE 2015
The MSCI USA Index is the U.S. component of the MSCI World
Index, and consists of large and mid-size market capitalization
companies. For a description of the MSCI World Index, please
visit MSCI’s website: https://www.msci.com/index-
methodology
The MSCI KLD 400 Social Index comprises companies with high
Environmental, Social and Governance (ESG) ratings and
excludes companies involved in Alcohol, Gambling, Tobacco,
Military Weapons, Civilian Firearms, Nuclear Power, Adult
Entertainment, and Genetically Modified Organisms (GMO). The
Index aims to serve as a benchmark for investors whose
objectives include owning companies with very high ESG ratings
and avoiding companies that screens excluding companies
involved in the production of products and services with high
negative social and/or environmental impact. Launched in May
1990 as the Domini 400 Social Index, it is one of the first ESG
indexes. Constituent selection is based on data from MSCI ESG
Research. For more information on the MSCI KLD 400 Social
Index, please visit MSCI’s website:
https://www.msci.com/index-methodology
Universe B Details:
o The MSCI ESG KLD STATS time series expanded its coverage in 2001 to include the top 1000 U.S. companies by market capitalization, as of December 31st. Universe B consists only of the top 1000 and has been offered since 2008. MSCI discontinued this universe after the STATS-2013 Data Set.
Universe C Details:
o The MSCI ESG KLD STATS time series expanded its coverage in 2001 to include the top 1000 U.S. companies by market capitalization, as of December. Universe B consists of the constituents of the MSCI KLD 400 Social Index and the top 1000 U.S. companies by market capitalization, as of December. MSCI discontinued this universe after the STATS-2013 Data Set.
Universe D:
MSCI.COM | PAGE 46 OF 75 © 2015 MSCI Inc. All rights reserved. Please refer to the disclaimer at the end of this document.
MSCI ESG KLD STATS: 1991-2014 DATA SETS | JUNE 2015
o The MSCI ESG KLD STATS time series expanded its coverage in 2003 to include the top 3000 U.S. companies by market capitalization, as of December of each year.
o Since the STATS-2013 Data Set, Universe D includes only the constituents of the MSCI USA IMI Index, as of December of each year. For more information on the MSCI USA IMI Index please visit MSCI’s website: https://www.msci.com/index-methodology
Universe E:
o The MSCI ESG KLD STATS time series expanded its coverage in 2013 to include non-U.S. companies.
o Universe E includes all companies that are constituents of the following MSCI Indexes, as of December of each year:
MSCI World - EX US
MSCI Emerging Markets Index
MSCI UK IMI
MSCI Nordic IMI
MSCI Australia IMI
MSCI South Africa IMI
MSCI Canada IMI
MSCI ESG KLD STATS DATA SETS: ESG INDICATOR HISTORY
POSITIVE ENVIRONMENT PERFORMANCE INDICATORS
ENVIRONMENTAL OPPORTUNITIES – CLEAN TECH (ENV-STR-A)
Name change for STATS-2013 Data Set to Environmental Opportunities - Clean Tech from Environmental Opportunities. For STATS-2013 Data Set, Environmental Opportunities - Green Buildings was spun off from Env-str-A as a separate indicator - see ENV-str-L.
MSCI.COM | PAGE 47 OF 75 © 2015 MSCI Inc. All rights reserved. Please refer to the disclaimer at the end of this document.
MSCI ESG KLD STATS: 1991-2014 DATA SETS | JUNE 2015
Name change for STATS-2012 Data Set to Environmental Opportunities from Beneficial Products and Services. STATS-2012 Definition
Environmental Opportunities (ENV-str-A)
This indicator evaluates how companies are taking advantages of opportunities in the market for environmental technologies, and/or to develop or refurbish buildings with green building characteristics including lower embodied energy, recycled materials, lower energy and water use, waste reduction, and healthier and more productive working environments. Companies that proactively invest in product and services addressing issues of resource conservation and climate change, and/or develop or refurbish buildings to achieve green building certifications score higher. Companies lacking strategies and investments targeting these areas, or that ignore opportunities in green buildings, score lower.
For the STATS-1991 through STATS-2011 Data Sets, this indicator was labelled Beneficial Products and Services. STATS-2011 Definition
Beneficial Products and Services (ENV-str-A). This indicator measures the positive environmental impact of a firm’s products and/or services. Factors affecting this evaluation include, but are not limited to, products/services that reduce other firms’ and individuals’ consumption of energy, production/consumption of hazardous chemicals, and overall patterns of resource consumption.
STATS-1991 through 2005 Definition: Beneficial Products and Services (ENV-str-A). The company derives substantial revenues from innovative remediation products, environmental services, or products that promote the efficient use of energy, or it has developed innovative products with environmental benefits. (The term “environmental service”
MSCI.COM | PAGE 48 OF 75 © 2015 MSCI Inc. All rights reserved. Please refer to the disclaimer at the end of this document.
MSCI ESG KLD STATS: 1991-2014 DATA SETS | JUNE 2015
does not include services with questionable environmental effects, such as landfills, incinerators, waste-to-energy plants, and deep injection wells.) Through 1994, “substantial revenues” was specified as more than 4% of total revenues.
WASTE MANAGEMENT – TOXIC EMISSIONS AND WASTE (ENV-STR-B)
For the STATS-2013 Data Set, this indicator covered best practices in managing toxic emissions. For the STATS-2012 Data Set, this indicator covered best practices in managing toxic emissions and electronic waste. For STATS-2013, please see Waste Management - Electronic Waste (ENV-str-N) for the identification of companies with best practices in managing electronic waste. For the STATS-2013 Data Set, this indicator was renamed “Waste Management – Toxic Emissions and Waste” from “Waste Management” in the STATS-2012 Data Set.
STATS-2012 Definition:
Waste Management (ENV-str-B)
This indicator evaluates companies that are at risk of incurring liabilities associated with pollution, contamination, and the emission of toxic and carcinogenic substances, and/or companies that produce or sell electronic products face risks associated with recycling and/or disposal of end-of-life electronic products. Companies with strong programs and track records of reducing emissions and waste, and/or that proactively address electronic waste concerns by establishing comprehensive and well-managed product recovery and recycling programs, score higher. Companies that create large volumes of toxic and carcinogenic emissions or waste, yet lack programs or policies to reduce or control these substances and have experienced recent incidents of contamination, or electronic product companies with a strictly compliance-driven approach, score lower.
MSCI.COM | PAGE 49 OF 75 © 2015 MSCI Inc. All rights reserved. Please refer to the disclaimer at the end of this document.
MSCI ESG KLD STATS: 1991-2014 DATA SETS | JUNE 2015
For the STATS-2012 Data Set, this indicator was renamed “Waste Management” from “Pollution Prevention” in the STATS-2011 Data Set.
STATS-2011 Definition:
Pollution Prevention (ENV-str-B)
This indicator measures a firm’s method of mitigating non-carbon air emissions, water discharges, and solid waste from its operations. Factors affecting this evaluation include, but are not limited to, initiatives to reduce a firm’s non-carbon air emissions from its operations; to reduce the release of raw sewage, industrial chemicals, and other regulated substances; to reduce hazardous and non-hazardous waste; and programs to reduce the use of packaging materials, to support recycling; and to recycle old products such as televisions and other consumer electronics.
STATS-1991 through 2009 Definition:
Pollution Prevention (ENV-str-B). The company has notably strong pollution prevention programs including emissions reductions and toxic-use reduction programs.
WASTE MANAGEMENT - PACKAGING MATERIALS & WASTE (ENV-STR-C)
For the STATS-2013 Data Set, this indicator was renamed “Waste Management - Packaging Materials & Waste” from “Packaging Materials & Waste” in the STATS-2012 Data Set.
CLIMATE CHANGE - CARBON EMISSIONS (ENV-STR-D)
As of STATS-2013, this indicator covered best practices in managing carbon emissions. For the STATS-2012 Data Set, this indicator covered carbon emissions, energy efficiency, product carbon footprint, insuring climate risk, and renewable energy. Please see Environmental Opportunities – Renewable Energy
MSCI.COM | PAGE 50 OF 75 © 2015 MSCI Inc. All rights reserved. Please refer to the disclaimer at the end of this document.
MSCI ESG KLD STATS: 1991-2014 DATA SETS | JUNE 2015
(ENV-str-M), Climate Change - Energy Efficiency (ENV-str-O), Climate Change - Product Carbon Footprint (ENV-str-P), Climate Change - Insuring Climate Change Risk (ENV-str-Q) for the indicators that cover these other climate change issues. For the STATS-2013 Data Set, this indicator has been renamed from “Climate Change” in the STATS-2012 Data Set.
COMMUNICATIONS (ENV-STR-E)
This indicator was originally in STATS-1996 Data Set through STATS-2004 Data Set; in 2005 mapped to CGOV-str-D. STATS-1996 Data Set through STATS-2004 Data Set were adjusted to replace ENV-str-E with CGOV-str-D.
STATS-1996 through STATS-2004 Definition: Communications (ENV-str-E). The company is a signatory to the CERES Principles, publishes a notably substantive environmental report, or has notably effective internal communications systems in place for environmental best practices.
PROPERTY, PLANT, AND EQUIPMENT (ENV-STR-F)
Discontinued after STATS-1995 Data Set. This indicator was discontinued after the STATS-1995 Data Set.
STATS-1991 through STATS-1995 Definition: Property, Plant, and Equipment (ENV-str-F). The company maintains its property, plant, and equipment with above average environmental performance for its industry. KLD has not assigned strengths for this issue since 1995.
NATURAL RESOURCE USE - WATER STRESS (ENV—STR-H)
For the STATS-2013 Data Set, this indicator has been renamed from “Water Stress” in STATS-2012.
MSCI.COM | PAGE 51 OF 75 © 2015 MSCI Inc. All rights reserved. Please refer to the disclaimer at the end of this document.
MSCI ESG KLD STATS: 1991-2014 DATA SETS | JUNE 2015
NATURAL RESOURCE USE - BIODIVERSITY & LAND USE (ENV-STR-I)
For the STATS-2013 Data Set, this indicator has been renamed from “Biodiversity & Land Use” in STATS-2012.
NATURAL RESOURCE USE - RAW MATERIAL SOURCING (ENV-STR-J)
For the STATS-2013 Data Set, this indicator has been renamed from “Raw Material Sourcing” in STATS-2012.
NATURAL RESOURCE USE - FINANCING ENVIRONMENTAL IMPACT (ENV-STR-K)
For the STATS-2013 Data Set, this is a new, separate indicator. This issue was covered in Other Strength (ENV-str-X) in STATS-2012.
ENVIRONMENTAL OPPORTUNITIES - GREEN BUILDINGS (ENV-STR-L)
For the STATS-2013 Data Set, this is a new separate indicator. This issue was covered in Environmental Opportunities (ENV-str-A) in STATS-2012.
ENVIRONMENTAL OPPORTUNITIES – RENEWABLE ENERGY (ENV-STR-M)
For the STATS-2013 Data Set, this is a new separate indicator. This issue was covered in Climate Change (ENV-str-D) in STATS-2012.
WASTE MANAGEMENT - ELECTRONIC WASTE (ENV-STR-N)
For the STATS-2013 Data Set, this is a new separate indicator. This issue was covered in Waste Management (ENV-str-B) in STATS-2012.
CLIMATE CHANGE – ENERGY EFFICIENCY (ENV-STR-O)
For the STATS-2013 Data Set, this is a new separate indicator. This issue was covered in Climate Change (ENV-str-D) in STATS-2012.
CLIMATE CHANGE – PRODUCT CARBON FOOTPRINT (ENV-STR-P)
For the STATS-2013 Data Set, this is a new separate indicator. This issue was covered in Climate Change (ENV-str-D) in STATS-2012.
CLIMATE CHANGE – INSURING CLIMATE CHANGE RISK (ENV-STR-Q)
For the STATS-2013 Data Set, this is a new separate indicator. This issue was covered in Climate Change (ENV-str-D) in STATS-2012.
MSCI.COM | PAGE 52 OF 75 © 2015 MSCI Inc. All rights reserved. Please refer to the disclaimer at the end of this document.
MSCI ESG KLD STATS: 1991-2014 DATA SETS | JUNE 2015
ENVIRONMENT - OTHER STRENGTHS (ENV-STR-X)
This indicator assesses a firm’s environmental management policies, programs and initiatives that are not covered by any other MSCI ESG Research environmental metrics.
NEGATIVE ENVIRONMENT PERFORMANCE INDICATORS
HAZARDOUS WASTE (ENV-CON-A)
Discontinued after STATS-2009 Data Set. Since STATS-2010 Data Set, this indicator covered by ENV-con_D. STATS-1991 through STATS-2009 Definition: Hazardous Waste (ENV-con-A). The company's liabilities for hazardous waste sites exceed $50 million, or the company has recently paid substantial fines or civil penalties for waste management violations. Before 1996 the threshold for liabilities was $30 million.
REGULATORY COMPLIANCE (ENV-CON-B)
For STATS-2013, the data covers the 2010-2012 period. Companies that averaged $40,000 or more in settlements, fines, and/or penalties during this period received a score = 1. For STATS, this indicator only covers companies in a U.S. universe.
OZONE DEPLETING CHEMICALS (ENV-CON-C)
Discontinued after STATS-2009 Data Set. Since STATS-2010 Data Set, indicator covered by ENV-con-G. STATS-1991 through STATS-2009 Definition:
MSCI.COM | PAGE 53 OF 75 © 2015 MSCI Inc. All rights reserved. Please refer to the disclaimer at the end of this document.
MSCI ESG KLD STATS: 1991-2014 DATA SETS | JUNE 2015
Ozone Depleting Chemicals (ENV-con-C). The company is among the top manufacturers of ozone depleting chemicals such as HCFCs, methyl chloroform, methylene chloride, or bromines.
TOXIC EMISSIONS AND WASTE (ENV-CON-D)
For the STATS-2013 Data Set, this indicator has been renamed from “Toxic Spills & Releases” in STATS-2012.
AGRICULTURAL CHEMICALS (ENV-CON-E)
Discontinued after STATS-2009 Data Set. Since STATS-2010 Data Set, indicator covered by ENV-con-G. STATS-1991 through STATS-2009 Definition: Agricultural Chemicals (ENV-con-E). The company is a substantial producer of agricultural chemicals, i.e., pesticides or chemical fertilizers.
ENERGY AND CLIMATE CHANGE (ENV-CON-F)
For the STATS-2013 Data Set, this indicator has been renamed from “Climate Change” in STATS-2012.
SOCIAL INDICATORS
POSITIVE SOCIAL PERFORMANCE INDICATORS: COMMUNITY
GENEROUS GIVING (COM-STR-A)
Discontinued after STATS-2011 Data Set.
STATS-1991 through STATS-2011 Definition:
MSCI.COM | PAGE 54 OF 75 © 2015 MSCI Inc. All rights reserved. Please refer to the disclaimer at the end of this document.
MSCI ESG KLD STATS: 1991-2014 DATA SETS | JUNE 2015
Generous Giving (COM-str-A). The company has consistently given over 1.5% of trailing three-year net earnings before taxes (NEBT) to charity, or has otherwise been notably generous in its giving.
INNOVATIVE GIVING (COM-STR-B)
Discontinued after STATS-2013 Data Set. For STATS-2010 through STATS-2013 Data Set, indicator included COM-str-D. STATS-2010 through STATS-2013 Definition: This indicator evaluates companies’ charitable giving programs. Companies whose programs support affordable housing, access to healthcare, K-12 public education, initiatives to relieve hunger, or in-kind giving and other programs targeted at disadvantaged communities, score higher. STATS-1991 through STATS-2009 Definition: Innovative Giving (COM-str-B). The company has a notably innovative giving program that supports nonprofit organizations, particularly those promoting self-sufficiency among the economically disadvantaged. Companies that permit nontraditional federated charitable giving drives in the workplace are often noted in this section as well.
SUPPORT FOR HOUSING (COM-STR-C)
Discontinued after STATS-2009 Data Set. Since STATS-2010 Data Set, indicator covered by PROD-str-D. STATS-1991 through STATS-2009 Definition: Support for Housing (COM-str-C). The company is a prominent participant in public/private partnerships that support housing initiatives for the economically disadvantaged, e.g., the National Equity Fund or the Enterprise Foundation.
SUPPORT FOR EDUCATION (COM-STR-D)
Discontinued after STATS-2009 Data Set. Since STATS-2010 Data Set, indicator covered by COM-str-B.
MSCI.COM | PAGE 55 OF 75 © 2015 MSCI Inc. All rights reserved. Please refer to the disclaimer at the end of this document.
MSCI ESG KLD STATS: 1991-2014 DATA SETS | JUNE 2015
Support for Education (COM-str-D) introduced as a new indicator in STATS-1994 Data Set. STATS-1994 through STATS-2009 Definition: Support for Education (COM-str-D). The company has either been notably innovative in its support for primary or secondary school education, particularly for those programs that benefit the economically disadvantaged, or the company has prominently supported job-training programs for youth.
NON-US CHARITABLE GIVING (COM-STR-F)
Discontinued after STATS-2009 Data Set. Since STATS-2010 Data Set, indicator covered by COM-str-A.
Non-US Charitable Giving (COM-str-F) introduced as a new indicator in STATS-1994 Data Set.
STATS-1994 through STATS-2009 Definition: Non-US Charitable Giving (COM-str-F). The company has made a substantial effort to make charitable contributions abroad, as well as in the U.S. To qualify, a company must make at least 20% of its giving, or have taken notably innovative initiatives in its giving program, outside the U.S.
VOLUNTEER PROGRAMS (COM-STR-G)
Discontinued after STATS-2009 Data Set.
Volunteer Programs (COM-str-G) introduced as a new indicator in STATS-2005 Data Set.
STATS-2005 through STATS-2009 Definition: Volunteer Programs (COM-str-G). The company has an exceptionally strong volunteer program.
MSCI.COM | PAGE 56 OF 75 © 2015 MSCI Inc. All rights reserved. Please refer to the disclaimer at the end of this document.
MSCI ESG KLD STATS: 1991-2014 DATA SETS | JUNE 2015
OTHER STRENGTH (COM-STR-X)
Discontinued after STATS-2011 Data Set. STATS-1991 through STATS-2011 Definition: Other Strength (COM-str-X). The company has either an exceptionally strong in-kind giving program or engages in other notably positive community activities.
NEGATIVE SOCIAL PERFORMANCE INDICATORS: COMMUNITY
INVESTMENT CONTROVERSIES (COM-CON-A)
Discontinued after STATS-2009 Data Set. Since STATS-2010 Data Set, indicator covered by PROD-con-X. STATS-1991 through STATS-2009 Definition: Investment Controversies (COM-con-A). The company is a financial institution whose lending or investment practices have led to controversies, particularly ones related to the Community Reinvestment Act.
TAX DISPUTES (COM-CON-D)
Discontinued after STATS-2009 Data Set. Since STATS-2010 Data Set, indicator covered by CGOV-con-X. Indicator covered by CGOV-con-E for STATS-1991 through STATS-2004 Data Sets; these data sets were adjusted to have COM-con-D replace CGOV-con-E. Since STATS - 2010 Data Set, indicator covered by CGOV-con-X. STATS-1991 through STATS-2009 Definition:
MSCI.COM | PAGE 57 OF 75 © 2015 MSCI Inc. All rights reserved. Please refer to the disclaimer at the end of this document.
MSCI ESG KLD STATS: 1991-2014 DATA SETS | JUNE 2015
Tax Disputes (COM-con-D). The company has recently been involved in major tax disputes involving Federal, state, local or non-U.S. government authorities, or is involved in controversies over its tax obligations to the community.
OTHER CONCERN (COM-CON-X)
Discontinued after STATS-2009 Data Set. Since STATS-2010 Data Set, indicator covered by COM-con-B. STATS-1991 through STATS-2009 Definition: Other Concern (COM-con-X). The company is involved with a controversy that has mobilized community opposition, or is engaged in other noteworthy community controversies.
POSITIVE SOCIAL PERFORMANCE INDICATORS: HUMAN RIGHTS
POSITIVE RECORD IN SOUTH AFRICA (HUM-STR-A)
Discontinued after STATS-1995 Data Set. STATS-1994 through STATS-1995 Definition: Positive Record in South Africa (HUM-str-A). The company’s social record in South Africa is noteworthy.
LABOR RIGHTS STRENGTH (HUM-STR-G)
Discontinued after STATS-2009 Data Set. Since STATS-2010 Data Set, indicator covered by EMP-str-H. STATS-2002 through STATS-2009 Definition: Labor Rights Strength (HUM-str-G). The company has outstanding transparency on overseas sourcing disclosure and monitoring, or has particularly good union relations outside the U.S., or has undertaken labor rights-related initiatives that KLD considers outstanding or innovative.
MSCI.COM | PAGE 58 OF 75 © 2015 MSCI Inc. All rights reserved. Please refer to the disclaimer at the end of this document.
MSCI ESG KLD STATS: 1991-2014 DATA SETS | JUNE 2015
NEGATIVE SOCIAL PERFORMANCE INDICATORS: HUMAN RIGHTS
SOUTH AFRICA (HUM-CON-A)
Discontinued after STATS-1994 Data Set. STATS-1991 through STATS-1994 Definition: South Africa (HUM-con-A). The company faced controversies over its operations in South Africa.
NORTHERN IRELAND (HUM-CON-B)
Discontinued after STATS-1994 Data Set. STATS-1991 through STATS-1994 Definition: Northern Ireland (HUM-con-B). The company has operations in Northern Ireland.
SUPPORT FOR CONTROVERSIAL REGIMES (HUM-CON-C)
Name change for STATS-2012 Data Set to “Support for Controversial Regimes” from “Operations in Burma”. STATS-1994 through STATS-2011 Definition: Burma (HUM-con-C). The company has operations in Burma.
MEXICO (HUM-CON-D)
Discontinued after STATS-2002 Data Set. STATS-1994 through STATS-2002 Definition: Mexico (HUM-con-D). The company's operations in Mexico have had major recent controversies, especially those related to the treatment of employees or degradation of the environment.
LABOR RIGHTS CONCERN (HUM-CON-F)
Discontinued after STATS-2009 Data Set. Since STATS-2010 Data Set, indicator covered by EMP-con-F STATS-2002 through STATS-2009 Definition:
MSCI.COM | PAGE 59 OF 75 © 2015 MSCI Inc. All rights reserved. Please refer to the disclaimer at the end of this document.
MSCI ESG KLD STATS: 1991-2014 DATA SETS | JUNE 2015
Labor Rights Concern (HUM-con-F). The company's operations have had major recent controversies primarily related to labor standards in its supply chain.
INDIGENOUS PEOPLES RELATIONS CONCERN (HUM-CON-G)
Discontinued after STATS-2009 Data Set. For STATS-2010 and STATS-2011 Data Sets, indicator covered by HUM-con-X. Since STATS-2012 Data Set, indicator covered by HUM-con-K. STATS-2000 through STATS-2009 Definition: Indigenous Peoples Relations Concern (HUM-con-G). The company has been involved in serious controversies with indigenous peoples (either in or outside the U.S.) that indicate the company has not respected the sovereignty, land, culture, human rights, and intellectual property of indigenous peoples.
OPERATIONS IN SUDAN (HUM-CON-H).
Discontinued after STATS-2011 Data Set. Since STATS-2012 Data Set, indicator covered by Hum-con-C STATS-2010 through STATS-2011 Definition:
Operations in Sudan (HUM-con-H). The company has operations or direct investment in, or sourcing from, Sudan.
HUMAN RIGHTS - OTHER CONCERNS (HUM-CON-X)
Name change for 2013-Data Set from Other Concern.
POSITIVE SOCIAL PERFORMANCE INDICATORS: EMPLOYEE RELATIONS
NO-LAYOFF POLICY (EMP-STR-B)
Discontinued after STATS-1994 Data Set. Since STATS-1995 Data Set, indicator covered by EMP-str-X. STATS-1991 through STATS-1994 Definition:
MSCI.COM | PAGE 60 OF 75 © 2015 MSCI Inc. All rights reserved. Please refer to the disclaimer at the end of this document.
MSCI ESG KLD STATS: 1991-2014 DATA SETS | JUNE 2015
No-Layoff Policy (EMP-str-B). The company has maintained a consistent no-layoff policy.
RETIREMENT BENEFITS STRENGTH (EMP-STR-F).
Discontinued after STATS-2009 Data Set. STATS-1991 through STATS-2009 Definition: Retirement Benefits Strength (EMP-str-F). The company has a notably strong retirement benefits program.
COMPENSATION & BENEFITS (EMP-STR-I)
Discontinued after STATS-2013 Data Set. STATS-2012 through STATS-2013 Definition:
This indicator identifies companies that provide noteworthy employee compensation and benefit programs. Management metrics include cash profit sharing, ESOPs, pension plans and other benefit programs.
EMPLOYEE RELATIONS (EMP-STR-J)
Discontinued after STATS-2013 Data Set. STATS-2012 through STATS-2013 Definition:
This indicator is designed to identify companies that have practices in place to develop strong employee relations. Metrics include strong collective bargaining agreements and robust employee satisfaction programs.
PROFESSIONAL DEVELOPMENT (EMP-STR-K)
Discontinued after STATS-2013 Data Set. STATS-2012 through STATS-2013 Definition:
This indicator identifies companies that provide excellent employee training and development programs.

MSCI.COM | PAGE 61 OF 75 © 2015 MSCI Inc. All rights reserved. Please refer to the disclaimer at the end of this document.
MSCI ESG KLD STATS: 1991-2014 DATA SETS | JUNE 2015
HUMAN CAPITAL DEVELOPMENT (EMP-STR-L)
Name change for STATS-2014 Data Set, from "Human Capital Management" to "Human
Capital Development".
LABOR MANAGEMENT (EMP-STR-M)
Name change for STATS-2014 Data Set, from "Human Capital - Labor Management" to "Labor Management". For the STATS-2013 Data Set, this is a new separate indicator. This issue was covered in Human Capital Management (EMP-str-L) in STATS-2012.
CONTROVERSIAL SOURCING (EMP-STR-N)
For the STATS-2013 Data Set, this is a new separate indicator. This issue was covered in Human Rights Policies & Initiatives (HUM-str-X) in STATS-2012.
HUMAN CAPITAL – OTHER STRENGTHS (EMP-STR-X)
For the STATS-2013 Data Set, this indicator has been reactivated. It was previously active for STATS – 1991 through 2011 Data Sets.
NEGATIVE SOCIAL PERFORMANCE INDICATORS: EMPLOYEE RELATIONS
WORKFORCE REDUCTIONS (EMP-CON-C)
Discontinued after STATS-2009 Data Set. Since STATS-2010 Data Set, indicator covered by EMP-con-X STATS-1991 through STATS-2009 Definition: Workforce Reductions (EMP-con-C). The company has made significant
reductions in its workforce in recent years.
RETIREMENT BENEFITS CONCERN (EMP-CON-D)
Discontinued after STATS-2009 Data Set. Since STATS-2010 Data Set, indicator covered by EMP-con-X
MSCI.COM | PAGE 62 OF 75 © 2015 MSCI Inc. All rights reserved. Please refer to the disclaimer at the end of this document.
MSCI ESG KLD STATS: 1991-2014 DATA SETS | JUNE 2015
STATS-1991 through STATS-2009 Definition: Retirement Benefits Concern (EMP-con-D). The company has either a
substantially under funded defined benefit pension plan, or an inadequate retirement benefits program. In 2004, KLD renamed this concern from Pension/Benefits Concern.
LABOR-MANAGEMENT RELATIONS (EMP-CON-H)
For the STATS-2013 Data Set, this is a new indicator that was part of Labor-Management Relations (EMP-con-X) in STATS-2012.
LABOR RIGHTS& SUPPLY CHAIN – OTHER CONCERNS (EMP-CON-X)
For the STATS-2014 Data Set, this indicator has been renamed from Labor Rights – Other Concerns (EMP-con-X) in STATS-2012. For the STATS-2013 Data Set, this indicator has been renamed from Labor-Management Relations (EMP-con-X) in STATS-2012.
POSITIVE SOCIAL PERFORMANCE INDICATORS: DIVERSITY
CEO (DIV-STR-A).
Discontinued after STATS-2009 Data Set. Since STATS-2010 Data Set, indicator covered by Div-str-B. STATS-1991 through STATS-2009 Definition: CEO (DIV-str-A). The company's chief executive officer is a woman or a member of a minority group.
REPRESENTATION (DIV-STR-B)
Discontinued after STATS-2011 Data Set. STATS-1991 through STATS-2011 Definition:
MSCI.COM | PAGE 63 OF 75 © 2015 MSCI Inc. All rights reserved. Please refer to the disclaimer at the end of this document.
MSCI ESG KLD STATS: 1991-2014 DATA SETS | JUNE 2015
Representation (DIV-str-B). The company has made notable progress in the promotion of women and minorities, particularly to line positions with profit-and-loss responsibilities in the corporation.
BOARD OF DIRECTORS - GENDER (DIV-STR-C)
Since the STATS-2013 Data Set, this indicator only covers U.S. companies.
WORK/LIFE BENEFITS (DIV-STR-D)
Discontinued after STATS-2011 Data Set. Since STATS-2012 Data Set, indicator covered by DIV-str-H STATS-1991 through STATS-2011 Definition: Work/Life Benefits (DIV-str-D). The company has outstanding employee benefits or other programs addressing work/life concerns, e.g., childcare, elder care, or flextime.
WOMEN & MINORITY CONTRACTING (DIV-STR-E)
Discontinued after STATS-2013 Data Set. STATS-2012 through STATS-2013 Definition: This indicator identifies companies with a demonstrably strong record on purchasing from or contracting with women- and/or minority-owned businesses. For the STATS-2013 Data Set, this indicator only covers U.S. companies. STATS-1991 through STATS-2011 Definition: Women/Minority Contracting (DIV-str-E). The company does at least 5% of its subcontracting, or otherwise has a demonstrably strong record on purchasing or contracting, with women- and/or minority-owned businesses.
EMPLOYMENT OF THE DISABLED (DIV-STR-F)
Discontinued after STATS-2009 Data Set. Since STATS-2010 Data Set, indicator covered by DIV-str-H STATS-1991 through STATS-2009 Definition:

MSCI.COM | PAGE 64 OF 75 © 2015 MSCI Inc. All rights reserved. Please refer to the disclaimer at the end of this document.
MSCI ESG KLD STATS: 1991-2014 DATA SETS | JUNE 2015
Employment of the Disabled (DIV-str-F). The company has implemented innovative hiring programs; other innovative human resource programs for the disabled, or otherwise has a superior reputation as an employer of the disabled.
GAY & LESBIAN POLICIES (DIV-STR-G)
Discontinued after STATS-2011 Data Set. Since STATS-2012 Data Set, indicator covered by DIV-str-H STATS-1995 through STATS-2011 Definition:
Gay & Lesbian Policies (DIV-str-G).The company has implemented notably progressive policies toward its gay and lesbian employees. In particular, it provides benefits to the domestic partners of its employees.
EMPLOYMENT OF UNDERREPRESENTED GROUPS (DIV-STR-H)
Discontinued after STATS-2013 Data Set. STATS-2010 through STATS-2013 Definition: This indicator is designed to assess a firm’s efforts to promote diversity in its workforce. Factors affecting this evaluation include, but are not limited to, its effort to recruit women and minorities, and its participation in multi-stakeholder diversity initiatives. For the STATS-2013 Data Set, this indicator only covers U.S. companies.
OTHER STRENGTH (DIV-STR-X)
Discontinued after STATS-2011 Data Set. STATS-1991 through STATS-2011 Definition:
MSCI.COM | PAGE 65 OF 75 © 2015 MSCI Inc. All rights reserved. Please refer to the disclaimer at the end of this document.
MSCI ESG KLD STATS: 1991-2014 DATA SETS | JUNE 2015
Other Strength (DIV-str-X). The company has made a notable commitment to diversity that is not covered by other MSCI ratings.
NEGATIVE SOCIAL PERFORMANCE INDICATORS: DIVERSITY
REPRESENTATION (DIV-CON-B)
Discontinued after STATS-2011 Data Set. From STATS-1993 Data Set to STATS-2009 Data Set, indicator tracked line executives and board members For STATS-2010 and 2011 Data Sets, line executives only. Since STATS-2010 Data Set, board diversity covered by Div-con-C. STATS-2010 through STATS-2011 Definition: Representation (DIV-con-B). This indicator measures the diversity of a firm’s workforce. Factors affecting this evaluation include, but are not limited to, the percentage of women and minorities in senior management. STATS-1993 through STATS-2009 Definition: Non-Representation (DIV-con-B). The company has no women on its board of directors or among its senior line managers.
BOARD OF DIRECTORS - GENDER (DIV-CON-C)
New indicator for STATS-2010 Data Set when Board Diversity - Gender split off from Div-Con-B. For the STATS-2013 Data Set, this indicator only covers U.S. companies. For MSCI ESG STATS – 2013 Data Set, the data for DIV-con-C, Board Diversity – Women; and
DIV-con-D, Board Diversity – Minorities was provided by Institutional Shareholder Services
Inc.
MSCI.COM | PAGE 66 OF 75 © 2015 MSCI Inc. All rights reserved. Please refer to the disclaimer at the end of this document.
MSCI ESG KLD STATS: 1991-2014 DATA SETS | JUNE 2015
BOARD OF DIRECTORS - MINORITIES (DIV-CON-D)
Discontinued after STATS-2013 Data Set. STATS-2012 and STATS-2013 Definition: This indicator identifies companies with no minorities on their board of directors. For the STATS-2013 Data Set, this indicator only covers U.S. companies. For MSCI ESG STATS – 2013 Data Set, the data for DIV-con-C, Board Diversity – Women; and
DIV-con-D, Board Diversity – Minorities was provided by Institutional Shareholder Services
Inc.
OTHER CONCERN (DIV-CON-X)
Discontinued after STATS-2009 Data Set. Since STATS-2010 Data Set, indicator covered by DIV-con-A STATS-1991 through STATS-2009 Definition: Other Concern (DIV-con-X). The company is involved in diversity controversies not covered by other KLD ratings.
POSITIVE SOCIAL PERFORMANCE INDICATORS: PRODUCT
PRODUCT SAFETY AND QUALITY (PRO-STR-A)
For the STATS-2013 Data Set, this is indicator was renamed from “Quality” in STATS-2012. In STATS-2012, this indicator also covered the following product safety issues:
Chemical Safety,
Financial Product Safety,
Privacy and Data Security,
Responsible Investment,
Insuring Health and Demographic Risk.
MSCI.COM | PAGE 67 OF 75 © 2015 MSCI Inc. All rights reserved. Please refer to the disclaimer at the end of this document.
MSCI ESG KLD STATS: 1991-2014 DATA SETS | JUNE 2015
For STATS-2013, please see the following for the assessment of these issues: Product Safety - Chemical Safety(PRO-str-G), Product Safety -Financial Product Safety(PRO-str-H), Product Safety - Privacy and Data Security(PRO-str-I), Product Safety - Responsible Investment(PRO-str-J), Product Safety - Insuring Health and Demographic Risk(PRO-str-K).
R&D/INNOVATION (PRO-STR-B)
Discontinued after STATS-2009 Data Set. STATS-1991 through STATS-2009 Definition: R&D/Innovation (PRO-str-B). The company is a leader in its industry for research and development (R&D), particularly by bringing notably innovative products to market.
SOCIAL OPPORTUNITIES – ACCESS TO HEALTHCARE (PRO-STR-C)
For the STATS-2013 Data Set, this is indicator has been renamed from “Social Opportunities” in STATS-2012. In STATS-2012, this indicator also covered access to communications, and nutrition and health. For the STATS-2013 Data Set, please see Social Opportunities-Access to Communications (PRO-str-E) and Social Opportunities-Opportunities in Nutrition and Health (PRO-str-F)
SOCIAL OPPORTUNITIES - ACCESS TO FINANCE (PRO-STR-D)
For the STATS-2013 Data Set, this is indicator has been renamed from “Access to Finance” in STATS-2012.
SOCIAL OPPORTUNITIES - ACCESS TO COMMUNICATIONS (PRO-STR-E)
For the STATS-2013 Data Set, this is a new, separate indicator. This issue was covered in Social Opportunities (PRO-str-C) in STATS-2012.
SOCIAL OPPORTUNITIES - OPPORTUNITIES IN NUTRITION AND HEALTH (PRO-STR-F)
For the STATS-2013 Data Set, this is a new, separate indicator. This issue was covered in Social Opportunities (PRO-str-C) in STATS-2012.
MSCI.COM | PAGE 68 OF 75 © 2015 MSCI Inc. All rights reserved. Please refer to the disclaimer at the end of this document.
MSCI ESG KLD STATS: 1991-2014 DATA SETS | JUNE 2015
PRODUCT SAFETY - CHEMICAL SAFETY (PRO-STR-G)
For the STATS-2013 Data Set, this is a new, separate indicator. This issue was covered in Quality (PRO-str-A) in STATS-2012.
PRODUCT SAFETY -FINANCIAL PRODUCT SAFETY (PRO-STR-H)
For the STATS-2013 Data Set, this is a new, separate indicator. This issue was covered in Quality (PRO-str-A) in STATS-2012.
PRODUCT SAFETY - PRIVACY AND DATA SECURITY (PRO-STR-I)
For the STATS-2013 Data Set, this is a new, separate indicator. This issue was covered in Quality (PRO-str-A) in STATS-2012.
PRODUCT SAFETY - RESPONSIBLE INVESTMENT (PRO-STR-J)
For the STATS-2013 Data Set, this is a new, separate indicator. This issue was covered in Quality (PRO-str-A) in STATS-2012.
PRODUCT SAFETY - INSURING HEALTH AND DEMOGRAPHIC RISK (PRO-STR-K)
For the STATS-2013 Data Set, this is a new, separate indicator. This issue was covered in Quality (PRO-str-A) in STATS-2012.
OTHER STRENGTH (PRO-STR-X)
Discontinued after STATS-2009 Data Set. Since STATS-2010 Data Sets, indicator covered by PRO-str-C. STATS-1991 through STATS-2009 Definition: Other Strength (PRO-str-X). The company's products have notable social benefits that are highly unusual or unique for its industry.
GOVERNANCE INDICATORS
MSCI.COM | PAGE 69 OF 75 © 2015 MSCI Inc. All rights reserved. Please refer to the disclaimer at the end of this document.
MSCI ESG KLD STATS: 1991-2014 DATA SETS | JUNE 2015
POSITIVE GOVERNANCE PERFORMANCE INDICATORS
LIMITED COMPENSATION (CGOV-STR-A)
Discontinued after STATS-2009 Data Set. STATS-1991 through STATS-2009 Definition: Limited Compensation (CGOV-str-A). The company has recently awarded notably low levels of compensation to its top management or its board members. The limit for a rating is total compensation of less than $500,000 per year for a CEO or $30,000 per year for outside directors.
OWNERSHIP STRENGTH (CGOV-STR-C)
Discontinued after STATS-2009 Data Set. STATS-1991 through STATS-2009 Definition: Ownership Strength (CGOV-str-C). The company owns between 20% and 50% of another company KLD has cited as having an area of social strength, or is more than 20% owned by a firm that KLD has rated as having social strengths. When a company owns more than 50% of another firm, it has a controlling interest, and KLD treats the second firm as if it is a division of the first.
REPORTING QUALITY (CGOV-STR-D)
Discontinued after STATS-2009 Data Set. Originally in STATS-1996 Data Sets through STATS-2004 Data Sets as ENV-str-E; in 2005 ENV-str-E mapped to CGOV-str-D. STATS-1996 Data Set through STATS-2004 Data-Set were adjusted to replace ENV-str-E with CGOV-str-D. STATS-1996 through STATS-2009 Definition: Reporting Quality (CGOV-str-D). This indicator measures the quality of a firm’s reporting on its corporate social responsibility (CSR)/sustainability efforts. Factors affecting this evaluation include, but are not limited to, the
MSCI.COM | PAGE 70 OF 75 © 2015 MSCI Inc. All rights reserved. Please refer to the disclaimer at the end of this document.
MSCI ESG KLD STATS: 1991-2014 DATA SETS | JUNE 2015
completeness and specificity of a firm’s reporting, its setting of specific goals for its CSR efforts, and quantitative measurement of progress towards these goals.
POLITICAL ACCOUNTABILITY STRENGTH (CGOV-STR-E)
Discontinued after STATS-2009 Data Set. STATS-2005 through STATS-2009 Definition:
Political Accountability Strength (CGOV-str-E). The company has shown markedly responsible leadership on public policy issues and/or has an exceptional record of transparency and accountability concerning its political involvement in state or federal-level U.S. politics, or in non-U.S. politics.
PUBLIC POLICY (CGOV-STR-F)
Discontinued after STATS-2011 Data Set. STATS-2007 through STATS-2011 Definition: Public Policy (CGOV-str-F). This indicator measures a firm’s support for public policies that have noteworthy benefit s for the environment, communities, employees, or consumers. Factors affecting this evaluation include, but are not limited to, support/lack of support for regulations addressing climate change, improved labor rights, enhancement of shareholder rights, and protections for consumers.
OTHER STRENGTH (CGOV-STR-X).
Discontinued after STATS-2009 Data Set. STATS-1991 through STATS-2009 Definition: Other Strength (CGOV-str-X). The company has a unique and positive corporate culture, or has undertaken a noteworthy initiative not covered by KLD’s other corporate governance ratings.
MSCI.COM | PAGE 71 OF 75 © 2015 MSCI Inc. All rights reserved. Please refer to the disclaimer at the end of this document.
MSCI ESG KLD STATS: 1991-2014 DATA SETS | JUNE 2015
NEGATIVE GOVERNANCE PERFORMANCE INDICATORS
HIGH COMPENSATION (CGOV-CON-B)
Discontinued after STATS-2009 Data Set. Since STATS-2010 Data Set, indicator covered by CGOV-con-K STATS-1991 through STATS-2009 Definition: High Compensation (CGOV-con-B). The company has recently awarded notably high levels of compensation to its top management or its board members. The limit for a rating is total compensation of more than $10 million per year for a CEO or $100,000 per year for outside directors.
OWNERSHIP CONCERN (CGOV-CON-F)
Discontinued after STATS-2009 Data Set. STATS-1991 through STATS-2009 Definition: Ownership Concern (CGOV-con-F). The company owns between 20% and 50% of a company KLD has cited as having an area of social concern, or is more than 20% owned by a firm KLD has rated as having areas of concern. When a company owns more than 50% of another firm, it has a controlling interest, and KLD treats the second firm as if it is a division of the first.
ACCOUNTING CONCERN (CGOV-CON-G)
Discontinued after STATS-2009 Data Set. Since STATS - 2010 Data Set, indicator covered by CGOV-con-X STATS-1991 through STATS-2009 Definition: Accounting Concern (CGOV-con-G). The company is involved in significant accounting-related controversies. In 2006, KLD added the Accounting Concern.
MSCI.COM | PAGE 72 OF 75 © 2015 MSCI Inc. All rights reserved. Please refer to the disclaimer at the end of this document.
MSCI ESG KLD STATS: 1991-2014 DATA SETS | JUNE 2015
REPORTING QUALITY (CGOV-CON-H)
Discontinued after STATS-2012 Data Set. STATS-2010 through STATS-2012 Definition: Reporting Quality (CGOV-con-H). This indicator measures the quality of a firm’s reporting on its CSR/sustainability efforts. Factors affecting this evaluation include, but are not limited to, the completeness and specificity of a firm’s reporting, its setting of specific goals for its CSR efforts, and quantitative measurement of progress towards these goals. STATS-2005 through STATS-2009 Definition: Transparency Concern (CGOV-con-H). The company is distinctly weak in reporting on a wide range of social and environmental performance measures.
POLITICAL ACCOUNTABILITY CONCERN (CGOV-CON-I)
Discontinued after STATS-2007 Data Set. STATS-2005 through STATS-2007 Definition: Political Accountability Concern (CGOV-con-I). The company has been involved in
noteworthy controversies on public policy issues and/or has a very poor record of
transparency and accountability concerning its political involvement in state or federal-level
U.S. politics, or in non-U.S. politics.
PUBLIC POLICY (CGOV-CON-J)
Discontinued after STATS-2011 Data Set. STATS-2007 through STATS-2011 Definition: Public Policy (CGOV-con-J). This indicator measures a firm’s lack of support for public policies that have noteworthy benefits for the environment, communities, employees, or consumers. Factors affecting this evaluation include, but are not limited to, support/lack of support for regulations addressing climate change, improved labor rights, enhancement of shareholder rights, and protections for consumers.
MSCI.COM | PAGE 73 OF 75 © 2015 MSCI Inc. All rights reserved. Please refer to the disclaimer at the end of this document.
MSCI ESG KLD STATS: 1991-2014 DATA SETS | JUNE 2015
BRIBERY & FRAUD (CGOV-CON-M)
Name change for 2013-Data Set from Business Ethics.
GOVERNANCE - OTHER CONCERNS (CGOV-CON-X)
Name change for 2013-Data Set from Other Concern.
MSCI.COM | PAGE 74 OF 75 © 2015 MSCI Inc. All rights reserved. Please refer to the disclaimer at the end of this document.
MSCI ESG KLD STATS: 1991-2014 DATA SETS | JUNE 2015
AMERICAS
+ 1 212 804 5299
EUROPE, MIDDLE EAST & AFRICA
+ 44 20 7618 2510
ASIA PACIFIC
+ 612 9033 9339
ABOUT MSCI ESG RESEARCH PRODUCTS
AND SERVICES
MSCI ESG Research products and services
are provided by MSCI ESG Research Inc.,
and are designed to provide in-depth
research, ratings and analysis of
environmental, social and governance-
related business practices to companies
worldwide. ESG ratings, data and analysis
from MSCI ESG Research Inc. are also used
in the construction of the MSCI ESG
Indexes. MSCI ESG Research Inc. is a
Registered Investment Adviser under the
Investment Advisers Act of 1940 and a
subsidiary of MSCI Inc.
ABOUT MSCI
For more than 40 years, MSCI’s research-
based indexes and analytics have helped
the world’s leading investors build and
manage better portfolios. Clients rely on
our offerings for deeper insights into the
drivers of performance and risk in their
portfolios, broad asset class coverage and
innovative research.
Our line of products and services includes
indexes, analytical models, data, real estate
benchmarks and ESG research.
MSCI serves 98 of the top 100 largest
money managers, according to the most
recent P&I ranking.
For more information, visit us at
www.msci.com.
CONTACT US
MSCI ESG KLD STATS: 1991-2014 DATA SETS | JUNE 2015
MSCI.COM | PAGE 75 OF 75 © 2015 MSCI Inc. All rights reserved.
This document and all of the information contained in it, including without limitation all text, data, graphs, charts (collectively, the “Information”) is the property of MSCI Inc. or its subsidiaries (collectively, “MSCI”), or MSCI’s licensors, direct or indirect suppliers or any third party involved in making or compiling any Information (collectively, with MSCI, the “Information Providers”) and is provided for informational purposes only. The Information may not be modified, reverse-engineered, reproduced or redisseminated in whole or in part without prior written permission from MSCI.
The Information may not be used to create derivative works or to verify or correct other data or information. For example (but without limitation), the Information may not be used to create indexes, databases, risk models, analytics, software, or in connection with the issuing, offering, sponsoring, managing or marketing of any securities, portfolios, financial products or other investment vehicles utilizing or based on, linked to, tracking or otherwise derived from the Information or any other MSCI data, information, products or services.
The user of the Information assumes the entire risk of any use it may make or permit to be made of the Information. NONE OF THE INFORMATION PROVIDERS MAKES ANY EXPRESS OR IMPLIED WARRANTIES OR REPRESENTATIONS WITH RESPECT TO THE INFORMATION (OR THE RESULTS TO BE OBTAINED BY THE USE THEREOF), AND TO THE MAXIMUM EXTENT PERMITTED BY APPLICABLE LAW, EACH INFORMATION PROVIDER EXPRESSLY DISCLAIMS ALL IMPLIED WARRANTIES (INCLUDING, WITHOUT LIMITATION, ANY IMPLIED WARRANTIES OF ORIGINALITY, ACCURACY, TIMELINESS, NON-INFRINGEMENT, COMPLETENESS, MERCHANTABILITY AND FITNESS FOR A PARTICULAR PURPOSE) WITH RESPECT TO ANY OF THE INFORMATION.
Without limiting any of the foregoing and to the maximum extent permitted by applicable law, in no event shall any Information Provider have any liability regarding any of the Information for any direct, indirect, special, punitive, consequential (including lost profits) or any other damages even if notified of the possibility of such damages. The foregoing shall not exclude or limit any liability that may not by applicable law be excluded or limited, including without limitation (as applicable), any liability for death or personal injury to the extent that such injury results from the negligence or willful default of itself, its servants, agents or sub-contractors.
Information containing any historical information, data or analysis should not be taken as an indication or guarantee of any future performance, analysis, forecast or prediction. Past performance does not guarantee future results.
The Information should not be relied on and is not a substitute for the skill, judgment and experience of the user, its management, employees, advisors and/or clients when making investment and other business decisions. All Information is impersonal and not tailored to the needs of any person, entity or group of persons.
None of the Information constitutes an offer to sell (or a solicitation of an offer to buy), any security, financial product or other investment vehicle or any trading strategy.
It is not possible to invest directly in an index. Exposure to an asset class or trading strategy or other category represented by an index is only available through third party investable instruments (if any) based on that index. MSCI does not issue, sponsor, endorse, market, offer, review or otherwise express any opinion regarding any fund, ETF, derivative or other security, investment, financial product or trading strategy that is based on, linked to or seeks to provide an investment return related to the performance of any MSCI index (collectively, “Index Linked Investments”). MSCI makes no assurance that any Index Linked Investments will accurately track index performance or provide positive investment returns. MSCI Inc. is not an investment adviser or fiduciary and MSCI makes no representation regarding the advisability of investing in any Index Linked Investments.
Index returns do not represent the results of actual trading of investible assets/securities. MSCI maintains and calculates indexes, but does not manage actual assets. Index returns do not reflect payment of any sales charges or fees an investor may pay to purchase the securities underlying the index or Index Linked Investments. The imposition of these fees and charges would cause the performance of an Index Linked Investment to be different than the MSCI index performance.
The Information may contain back tested data. Back-tested performance is not actual performance, but is hypothetical. There are frequently material differences between back tested performance results and actual results subsequently achieved by any investment strategy.
Constituents of MSCI equity indexes are listed companies, which are included in or excluded from the indexes according to the application of the relevant index methodologies. Accordingly, constituents in MSCI equity indexes may include MSCI Inc., clients of MSCI or suppliers to MSCI. Inclusion of a security within an MSCI index is not a recommendation by MSCI to buy, sell, or hold such security, nor is it considered to be investment advice.
Data and information produced by various affiliates of MSCI Inc., including MSCI ESG Research Inc. and Barra LLC, may be used in calculating certain MSCI indexes. More information can be found in the relevant index methodologies on www.msci.com.
MSCI receives compensation in connection with licensing its indexes to third parties. MSCI Inc.’s revenue includes fees based on assets in Index Linked Investments. Information can be found in MSCI Inc.’s company filings on the Investor Relations section of www.msci.com.
MSCI ESG Research Inc. is a Registered Investment Adviser under the Investment Advisers Act of 1940 and a subsidiary of MSCI Inc. Except with respect to any applicable products or services from MSCI ESG Research, neither MSCI nor any of its products or services recommends, endorses, approves or otherwise expresses any opinion regarding any issuer, securities, financial products or instruments or trading strategies and MSCI’s products or services are not intended to constitute investment advice or a recommendation to make (or refrain from making) any kind of investment decision and may not be relied on as such. Issuers mentioned or included in any MSCI ESG Research materials may include MSCI Inc., clients of MSCI or suppliers to MSCI, and may also purchase research or other products or services from MSCI ESG Research. MSCI ESG Research materials, including materials utilized in any MSCI ESG Indexes or other products, have not been submitted to, nor received approval from, the United States Securities and Exchange Commission or any other regulatory body.
Any use of or access to products, services or information of MSCI requires a license from MSCI. MSCI, Barra, RiskMetrics, IPD, FEA, InvestorForce, and other MSCI brands and product names are the trademarks, service marks, or registered trademarks of MSCI or its subsidiaries in the United States and other jurisdictions. The Global Industry Classification Standard (GICS) was developed by and is the exclusive property of MSCI and Standard & Poor’s. “Global Industry Classification Standard (GICS)” is a service mark of MSCI and Standard & Poor’s.
NOTICE AND DISCLAIMER