msci fundamental data methodology share data and security ratios (price to sales, price to earnings,...
TRANSCRIPT
msci.com
Index Methodology
MSCI Fundamental Data Methodology November 2013

MSCI msci.com © 2013 MSCI Inc. All rights reserved. Please refer to the disclaimer at the end of this document
MSCI Fundamental Data Methodology
November 2013
2 of 36
Contents
Introduction .............................................................................................................................. 4
1. Fundamental Per Share Data .............................................................................................. 6
1.1 General Rules .................................................................................................................................................. 6
1.1.1. Number of shares ................................................................................................................. 6
1.1.2. Consolidation ....................................................................................................................... 6
1.1.3. Currency and Frequency ...................................................................................................... 6
1.1.4. Accounting Standards Used ................................................................................................. 7
1.1.5. Sources and Updates ............................................................................................................ 7
1.2. Historical Per Share Data Calculations .......................................................................................................... 7
1.2.1. Sales Per Share (SPS) ............................................................................................................ 8
1.2.2. Earnings Per Share (EPS) ...................................................................................................... 8
1.2.3. Cash Earnings Per Share (CEPS) ............................................................................................ 9
1.2.4. Dividends Per Share (DPS) .................................................................................................... 9
1.2.5. Book Value Per Share (BVPS) ............................................................................................. 10
1.3. Forecasted Per Share Data .......................................................................................................................... 10
2. Security Ratios .................................................................................................................... 13
2.1. Valuation Ratios .......................................................................................................................................... 13
2.2. Other Financial Ratios .................................................................................................................................. 13
2.2.2. Return on Equity (ROE) ...................................................................................................... 15
2.2.3. Payout Ratio ....................................................................................................................... 15
2.2.4. Current Internal Growth Rate (g) ....................................................................................... 15
2.2.5. Short-term Forward Earnings Per Share Growth Rate (EGRSF) ......................................... 15
2.2.6. Long-term Forward Earnings Per Share Growth Rate (EGRLF) .......................................... 16
3. Index Ratio .......................................................................................................................... 17
3.1. Index Valuation Ratios ................................................................................................................................. 17
3.2. Other Index Financial Ratios ........................................................................................................................ 18
3.2.1. Return on Equity (ROE) ...................................................................................................... 18
3.2.2. Payout Ratio ....................................................................................................................... 18
3.2.3. Current Internal Growth Rate (g) ....................................................................................... 18
3.2.4. Short-term Forward EPS Growth Rate (EGRSF) .................................................................. 18
3.2.5. Long-term Growth Rates/Trends ....................................................................................... 19
MSCI msci.com © 2013 MSCI Inc. All rights reserved. Please refer to the disclaimer at the end of this document
MSCI Fundamental Data Methodology
November 2013
3 of 36
3.2.6. 12-Month Index EPS ........................................................................................................... 19
3.2.7. Year on Year Growth EPS ................................................................................................... 19
3.2.8. Estimated Daily Dividend Yield ........................................................................................... 20
4. Fundamental Data Treatments for Corporate Events ..................................................... 22
4.1. Nominal Changes in Capital Structure ......................................................................................................... 22
4.2. Real Changes in Capital Structure ................................................................................................................ 23
4.3. Both Nominal and Real Changes in Capital Structure ................................................................................. 23
4.4. Changes in Business Structure ..................................................................................................................... 24
5. Balance Sheet Information ................................................................................................ 25
6. Hyperinflationary economies – Adjustment of Fundamental Data ................................ 27
Appendix I: MSCI’s treatment of some specific aspects of IFRS .......................................... 28
Appendix II: Index Ratio Calculation Examples ..................................................................... 29
Appendix III: Correction Policy ............................................................................................... 34
Methodology Book Tracked Changes ................................................................................... 35

MSCI msci.com © 2013 MSCI Inc. All rights reserved. Please refer to the disclaimer at the end of this document
MSCI Fundamental Data Methodology
November 2013
4 of 36
Introduction
MSCI began publishing annual fundamental data for developed market companies in 1969 and for
emerging market companies in 1988. MSCI has accumulated a large volume of historical fundamental
data during this period.
Fundamental data Security Level Ratios Historical Coverage
Earnings per share Price to Earnings Return on Equity
Since December 1969 for DM Since January 1992 for EM Since March 1997 for DM Since December 1993 for EM
Cash Earnings per share Price to Cash Earnings Since January 1970 for DM Since January 1992 for EM
Sales per share Price to Sales Since January 1992 for EM countries Since January 2001 for DM countries
Book Value per share Price to Book Value Since December 1974 for DM Since January 1992 for EM
Dividends per share Dividend Yield Since December 1969 for DM Since January 1992 for EM
5-years Sales, earnings, cash-earnings, earnings per share
Since December 1969
5 year SPS growth trend , 5 year EPS growth trends
Since June 2003
Balance sheet items Since March 1971 for DM
MSCI uses these fundamental data items to define:
Fundamental per share data
Security ratios
Index ratios
Balance Sheet information
In addition, MSCI uses fundamental data to calculate the variables used to assign style to securities
under its Value and Growth methodology. The following table summarizes the key variables calculated
by MSCI using fundamental data:

MSCI msci.com © 2013 MSCI Inc. All rights reserved. Please refer to the disclaimer at the end of this document
MSCI Fundamental Data Methodology
November 2013
5 of 36
Table #1 Fundamental Data Calculation Summary
Fundamental Per Share Data Security Level Ratios Index Level Ratios
Sales Per Share Price to Sales
Long-term Historical Sales Per Share Growth Trend
Long-term Historical Sales Per Share Growth Trend
Earnings Per Share Price to Earnings Price to Earnings
Long-term Historical Earnings Per Share Growth Trend
Long-term Historical Earnings Per Share Growth Trend
Return on Equity Return on Equity
Current Internal Growth Rate Current Internal Growth Rate
12 Months Trailing Index EPS
Year on Year Growth Trailing EPS
Cash Earnings Per Share Price to Cash Earnings Price to Cash Earnings
Dividends Per Share Dividend Yield Dividend Yield
Payout Ratio Payout Ratio
Book Value Per Share Price to Book Value Price to Book Value
Forecasted Earnings Per Share Price to Earnings Forward
Price to Earnings Backward
Long-term Forward Earnings Per Share Growth Rate
Short-term Forward Earnings Per Share Growth Rate
12 Months Forward Index EPS
Year on Year Growth Forward EPS
For certain corporate events MSCI may also adjust and/or restate fundamental data and related ratios in
order to maintain comparability between historical and future data. These adjustments are made based
on the timing of the event and availability of information at the time of the event.
Depending on the MSCI Equity Index Series or the Global Equity Model, MSCI will provide different
fundamental data for each product on a monthly basis. Per share data and security ratios (price to sales,
price to earnings, return on equity, price to cash earnings, price to book value, dividend yield) are
provided for all MSCI Equity Index Series and Global Equity Models. Fundamental data used for style
attribution is distributed for the MSCI Value and Growth Indexes and the Global Equity Models. This
data includes long-term historical growth trends, current internal growth rate, and forecasted earnings
figures.
MSCI strives to maintain clear and transparent rules that best reflect the accounting standards of each
country in a consistent manner. The information provided in this methodology book relates to all equity
index products distributed by MSCI that use fundamental data. The book demonstrates MSCI’s use of
fundamental data to calculate financial ratios and indicators at both the security and index level.
Additionally, this book demonstrates how MSCI uses fundamental data in connection with corporate
events.

MSCI msci.com © 2013 MSCI Inc. All rights reserved. Please refer to the disclaimer at the end of this document
MSCI Fundamental Data Methodology
November 2013
6 of 36
1. Fundamental Per Share Data MSCI provides per share data on an annualized basis and calculates the data on a company level in which all classes (listed and unlisted) of equity are aggregated. The total shares outstanding for the latest period is used for per share data calculations.
MSCI provides two types of fundamental per share data:
Historical
Forecasted
Using historical and forecasted data, MSCI calculates security and index ratios. The following section details how MSCI gathers and calculates all fundamental per share data.
1.1 General Rules
1.1.1. Number of shares
To calculate per share figures, MSCI uses the total number of shares at the company level at the date of the results.
All of the company’s share classes, listed and unlisted, are aggregated in the total number of shares regardless of whether they are included in an index, as long as they exhibit characteristics of equity securities and are eligible for the MSCI universe. If preferred shares exhibit equity-like characteristics, they are included in the number of shares for per share calculation
MSCI always excludes stock options, warrants and convertible securities from the number of shares outstanding. In other words, diluted number of shares is not used. In general, treasury shares are systematically excluded from index level calculations and from number of shares used for per share calculations.
Total number of shares at the company level at the date of the results is used to calculate per share figures, except United States of America, Canada, the United Kingdom and Ireland where average number of shares is used for per share calculations of earnings, cash earnings, and sales as is the standard practice in these countries.
For companies where MSCI tracks their Depository Receipts (ADR, GDR) or Certificates of Participation (CPO), MSCI reports the fundamental per-share variables on a ‘per-ADR / GDR’ or ‘per-CPO’ basis.
1.1.2. Consolidation
MSCI always calculates fundamental data using consolidated information unless consolidated results are unavailable or are not reported on a regular basis. However, in countries like India, owing to the disclosure procedures, there could be use of unconsolidated data for interim financial results whereas the fiscal period financial results could be consolidated.
1.1.3. Currency and Frequency
MSCI reports fundamental data in the currency that the company reports. In general, MSCI follows the frequency of the company reporting. For example, if companies report quarterly results, MSCI also follows quarterly results.

MSCI msci.com © 2013 MSCI Inc. All rights reserved. Please refer to the disclaimer at the end of this document
MSCI Fundamental Data Methodology
November 2013
7 of 36
1.1.4. Accounting Standards Used
The primary accounting standard followed by MSCI is the local GAAP. If the company does not report in local GAAP but reports in other GAAPs, such as IAS or US GAAP, then MSCI will follow the latter. For a large number of European countries and some other countries in the Asia-Pacific, MSCI started following IFRS accounting in the year 2006 (please refer to Appendix I for details on MSCI’s treatment of some specific issues related to IFRS).
1.1.5. Sources and Updates
MSCI sources company information from third party vendors as well as from publicly available information made available by the companies. In addition, MSCI reflects publicly available information once it is available in the market, provided that the information is complete. We commonly obtain information in the form of vendor files, press releases, interim and annual reports. MSCI uses both audited and unaudited reports.
MSCI endeavors to ensure correctness, quality and timeliness of data loaded into its database, by employing quality control procedures like updating company information only upon availability of complete information, such as official filings with stock exchanges or regulators or upon dual vendor validation. Emphasis is placed on updating the results of bigger companies first, but without undue delay for updating the results for all companies.
1.2. Historical Per Share Data Calculations
The following are the historical per share figures that are reported and/or used by MSCI:
Sales per share (SPS)
Earnings per share (EPS)
Cash earnings per share (CEPS)
Dividends per share (DPS)
Book value per share (BVPS)
In general, historical per share figures are calculated using the following formula:
levelcompanyaatgoutstandinsharesofNumber
figuremonth12TrailingfiguresharePer
)(12 figureinterimeComparativfigureinterimCurrentfigureperiodfiscalreportedLastemonthfigurTrailing
For instance, if the last period for which results are reported is for an interim period of 3 months ended Mar 31, 2011, the trailing 12-month Earnings will be calculated as:
Trailing 12-month earnings = Fiscal period earnings for the year ended Dec 31, 2010 + (3 month earnings for the current interim period ended Mar 31, 2011 – 3 month earnings for the comparative interim period ended Mar 31, 2010)
MSCI msci.com © 2013 MSCI Inc. All rights reserved. Please refer to the disclaimer at the end of this document
MSCI Fundamental Data Methodology
November 2013
8 of 36
The following are exceptions:
Dividends per share are always used on a per share basis as provided by the company for all calculations.
Book value per share is calculated using the latest reported book value; a trailing 12-month figure is not calculated.
The following section defines the general rules for historical per share figures and their use.
1.2.1. Sales Per Share (SPS)
MSCI defines sales for all issuers as net operating revenues from all on-going lines of business of the company.
Due to the different definitions of sales in different industries, MSCI does not report sales for certain companies in the financial sector (GICS® Sector 40):
For Banks (GICS® Industry Group 4010) and some Diversified Financial companies (GICS® Industry Group 4020), other than securities in Multi-Sector Holdings (GICS® Sub-industry Group 40201030), MSCI does not publish sales.
For Insurance companies (GICS® Industry Group 4030), MSCI uses the net premiums earned (or net premiums written, if the former is not available) as a proxy for sales.
In the case of Trading companies in Japan (Sogoshosha), gross sales (Total Trading Transactions) is considered as per the Japanese GAAP.
MSCI follows cumulative sales reported by the companies, instead of quarterly sales figures. In addition, excise tax is always deducted from sales whenever this information is available.
MSCI uses sales for two purposes:
Price/Sales, which is calculated using the trailing 12-month sales per share figure; and
Long-term Historical SPS growth trend, which is calculated using the last five years fiscal year-end sales per share.
1.2.2. Earnings Per Share (EPS)
MSCI defines earnings as the net income from the continuing operations available to all equity shareholders (i.e., all shareholders holding securities that exhibit equity-like characteristics), excluding extraordinary items or non-recurring items, minority interest and preferred dividends (in cases where preferred shares do not exhibit equity like characteristics).
In cases where MSCI determines that a company has unusual gains or losses that do not reflect the earnings potential of the company going forward, the item will be treated as non-recurring and will be excluded from earnings on an after-tax basis. Profit / loss on sale of discontinued operations, restructuring charges, bankruptcy charges, changes in accounting policy etc. could be some instances where the profits / losses are adjusted by MSCI to reflect normalized earnings.
For all countries, the EPS is calculated using net earnings and number of shares, except in the US, Canada, the UK, and Ireland where MSCI follows basic (undiluted) EPS from continuing operations available to common shareholders as reported by companies.
MSCI msci.com © 2013 MSCI Inc. All rights reserved. Please refer to the disclaimer at the end of this document
MSCI Fundamental Data Methodology
November 2013
9 of 36
MSCI uses earnings per share for four purposes:
Price/Earnings, which is calculated using the trailing 12-month earnings per share figure;
Long-term Historical EPS growth trend, which is calculated using the last five years fiscal year-end earnings per share;
Return on Equity (ROE), which is calculated using the trailing 12-month earnings per share figure and latest book value per share; and
Current Internal Growth Rate (g), which is calculated using return on equity and the dividend payout ratio.
1.2.3. Cash Earnings Per Share (CEPS)
MSCI defines cash earnings as earnings per share, as stated above, including depreciation and amortization as reported by the company. In cases where amortization is not reported, then only depreciation is added back to earnings in order to calculate cash earnings. In addition, where a company does not report depreciation and / or amortization values in its interim financial statements, the latest fiscal values will be used to compute CEPS.
MSCI uses cash earnings per share to calculate:
Price/Cash Earnings, which is calculated using the trailing 12-month cash earnings per share figure.
1.2.4. Dividends Per Share (DPS)
MSCI defines regular cash dividends as those paid from annual operating profits and/or accumulated earnings, while capital repayments or returns of capital are defined as cash distributions from the company’s share capital or additional paid-in capital (capital contribution reserve). Regular capital repayments are considered as regular cash dividends.
To estimate the current annualized dividend, MSCI takes the sum of all the declared regular cash distributions (dividends or capital repayments), including the ones not yet ex or paid, over the latest 12-month period.
However, if the regular cash distribution frequency is changed, the latest 12 months of distribution may not be available. An example may be when the distribution frequency is changed from annual to semi-annual which yields either latest 6 months of distributions or latest 18 months of distributions. In this case, MSCI estimates the current annualized dividend by using the latest 6 months of distribution if resulting in a higher amount than the previous annualized dividend. If the latest 6 months of distribution is lower than the previous annualized dividend, MSCI keeps the previous annualized dividend without taking the latest 6 months of distribution into consideration.
In the US and Canada, however, regular cash distributions are annualized by multiplying the latest cash distributions by the frequency of the regular cash distributions’ payments. This is done to capitalize on the regularity of the regular cash distributions’ information in providing a forward-looking approach for the US and Canada.
MSCI uses dividends per share for two purposes:
Dividend yield, which is calculated using the annualized dividend per share figure; and
Current Internal Growth Rate (“g”), which is calculated using the dividend payout ratio and return on equity.
MSCI msci.com © 2013 MSCI Inc. All rights reserved. Please refer to the disclaimer at the end of this document
MSCI Fundamental Data Methodology
November 2013
10 of 36
Dividend per share is calculated using the gross dividend of a security (i.e., before any applicable withholding tax). Capital repayments are usually not subject to withholding tax. Special cash dividends, unless they are paid for three consecutive years, and extraordinary capital repayments are excluded from the dividend yield calculation.
Yields are gross, before withholding tax, and take into account special tax credits when applicable.
1.2.5. Book Value Per Share (BVPS)
MSCI defines book value as shareholders’ equity available to shareholders at the latest period end date excluding minority interest, treasury shares and preferred shares that do not exhibit equity like characteristics.
MSCI uses the book value per share for three purposes:
Price/Book Value, which is calculated using the latest book value per share;
Return on Equity (ROE), which is calculated using the latest book value and the trailing 12-month earnings per share figure; and
Current Internal Growth Rate (“g”), which is calculated using return on equity and the dividend payout ratio.
1.3. Forecasted Per Share Data
Forecasted variables are based on consensus earnings estimates taken from financial analysts as provided by Thomson I/B/E/S for all countries except Japan and China A. For Japan, data from Toyo Keizai is used for securities that are not covered by Thomson I/B/E/S. For China A, data from Wind is used. MSCI uses forecasted data along with historical data to provide a comprehensive assessment of a company’s performance.
MSCI defines two types of earnings per share based on forecasts:
EPS12F = 12-month forward EPS estimate derived on a rolling basis from the consensus of analysts’ earnings estimates for the current fiscal year and the next fiscal year.
12
)12( 2112
EPSMEPSMEPS F
Where
o EPS1 is the consensus of analysts’ earnings estimates for current fiscal year.
o EPS2 is the consensus of analysts’ earnings estimates for the next fiscal year.
o M is the number of months remaining before the current fiscal year end
o The current fiscal year corresponds to the fiscal year following the last fiscal year for which the company has made its results publicly available

MSCI msci.com © 2013 MSCI Inc. All rights reserved. Please refer to the disclaimer at the end of this document
MSCI Fundamental Data Methodology
November 2013
11 of 36
For cases where EPS2 is not available and M is greater than or equal to 8, EPS1 is used as an
approximation of EPS12F.
Example:
Calculating the 12-month forward earnings as of January 10, 2010:
Security A Security B Security C
Latest reported Fiscal Year Dec 31, 2009 Mar 31, 2009 Dec 31, 2008
M 11 2 11
EPS1 0.64 1.04 1.04
EPS1 date Dec 31, 2010 Mar 31, 2010 Dec 31, 2009
EPS2 0.74 1.52 1.52
EPS2 date Dec 31, 2011 Mar 31, 2011 Dec 31, 2010
EPS3
1.72
EPS3 date
Dec 31, 2011
EPS12F 0.65 1.44 1.54
For Security C, the results for the fiscal year ending December 31, 2009 are not yet available. As a result, the EPS1 estimates still pertain to the fiscal year ending December 31, 2009. Therefore, in order to have meaningful 12-month forward earnings, the EPS2 and the EPS3 are used instead of the EPS1 and EPS2.
EPS12B = backward 12-month EPS derived in a similar fashion as the EPS12F but using the EPS from the last reported fiscal year and the consensus of analysts’ earnings estimates for the current fiscal year.
Where
o EPS0 is last fiscal year end reported earnings per share
o EPS1 is the consensus of analysts’ earnings estimates for current fiscal year.
EPS12F and/or EPS12B are used to calculate:
Price to 12-month forward earnings; and
Short-term forward EPS growth rate
MSCI msci.com © 2013 MSCI Inc. All rights reserved. Please refer to the disclaimer at the end of this document
MSCI Fundamental Data Methodology
November 2013
12 of 36
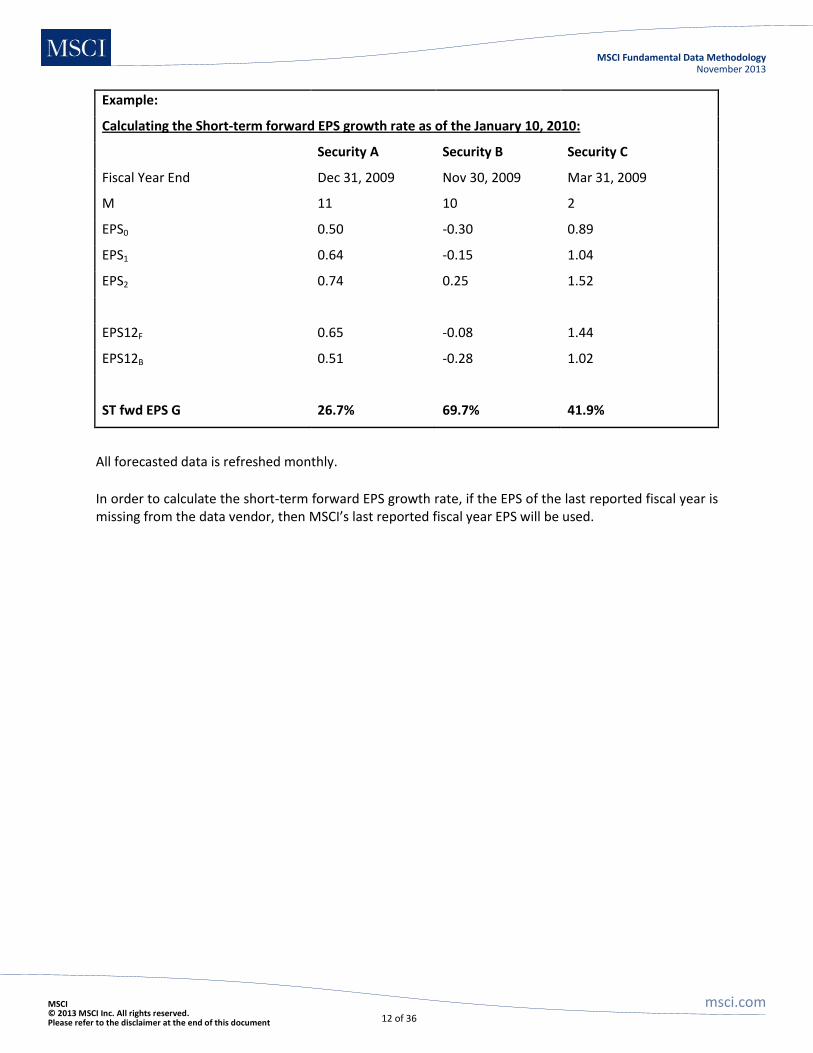
Example:
Calculating the Short-term forward EPS growth rate as of the January 10, 2010:
Security A Security B Security C
Fiscal Year End Dec 31, 2009 Nov 30, 2009 Mar 31, 2009
M 11 10 2
EPS0 0.50 -0.30 0.89
EPS1 0.64 -0.15 1.04
EPS2 0.74 0.25 1.52
EPS12F 0.65 -0.08 1.44
EPS12B 0.51 -0.28 1.02
ST fwd EPS G 26.7% 69.7% 41.9%
All forecasted data is refreshed monthly.
In order to calculate the short-term forward EPS growth rate, if the EPS of the last reported fiscal year is missing from the data vendor, then MSCI’s last reported fiscal year EPS will be used.
MSCI msci.com © 2013 MSCI Inc. All rights reserved. Please refer to the disclaimer at the end of this document
MSCI Fundamental Data Methodology
November 2013
13 of 36
2. Security Ratios Security ratios are derived using fundamental per share data as defined in the preceding section and are used by MSCI to define the investment style of a security.
MSCI calculates two types of security ratios:
Valuation Ratios
Other Financial Ratios
This section provides details on the definitions and computations of the variables used to calculate security ratios.
2.1. Valuation Ratios
In general, all valuation ratios are calculated using the following formula:
figuresharepermonth12gTrailin
pricesecurityCurrentRatiosaluationV
This formula applies to:
Price to Sales (P/S)
Price to Earnings (P/E)
Price to Cash Earnings (P/CE)
Price to Book Value (P/BV)
Price to Earnings Forward (P/E fwd)
While for
Dividend Yield (YIELD) we use the inverse of the above formula.
2.2. Other Financial Ratios
Other financial ratios calculated by MSCI include the following:
Long-term Historical Growth Trends
Return on Equity (ROE)
Payout Ratio
Current Internal Growth Rate (g)
Short-term Forward Earnings Per Share Growth Rate (EGRSF)
Long-term Forward Earnings Per Share Growth Rate (EGRLF)
MSCI msci.com © 2013 MSCI Inc. All rights reserved. Please refer to the disclaimer at the end of this document
MSCI Fundamental Data Methodology
November 2013
14 of 36
2.2.1. Long-term Historical Growth Trends
MSCI calculates two historical growth trends, showing the evolution of fundamental data over the last five years.
Long-term historical EPS growth trend (EGRO)
Long-term historical SPS growth trend (SGRO)
To calculate the EGRO and SGRO, first MSCI applies a regression using the ordinary least square method to the last five-years’ EPS and SPS, respectively.
btaEPSt btaSPSt
Where:
a, the slope coefficient,
b, the intercept,
t, the year expressed in number of cumulative months.
Then, we calculate an average absolute EPS or SPS:
n
i
i
n
EPSSPE
1
~~~
n
i
i
n
SPSSPS
1
~~~
Finally, we calculate the growth trend as follows:
SPE
aEGRO EPS
~~~ SPS
aSGRO SPS
~~~
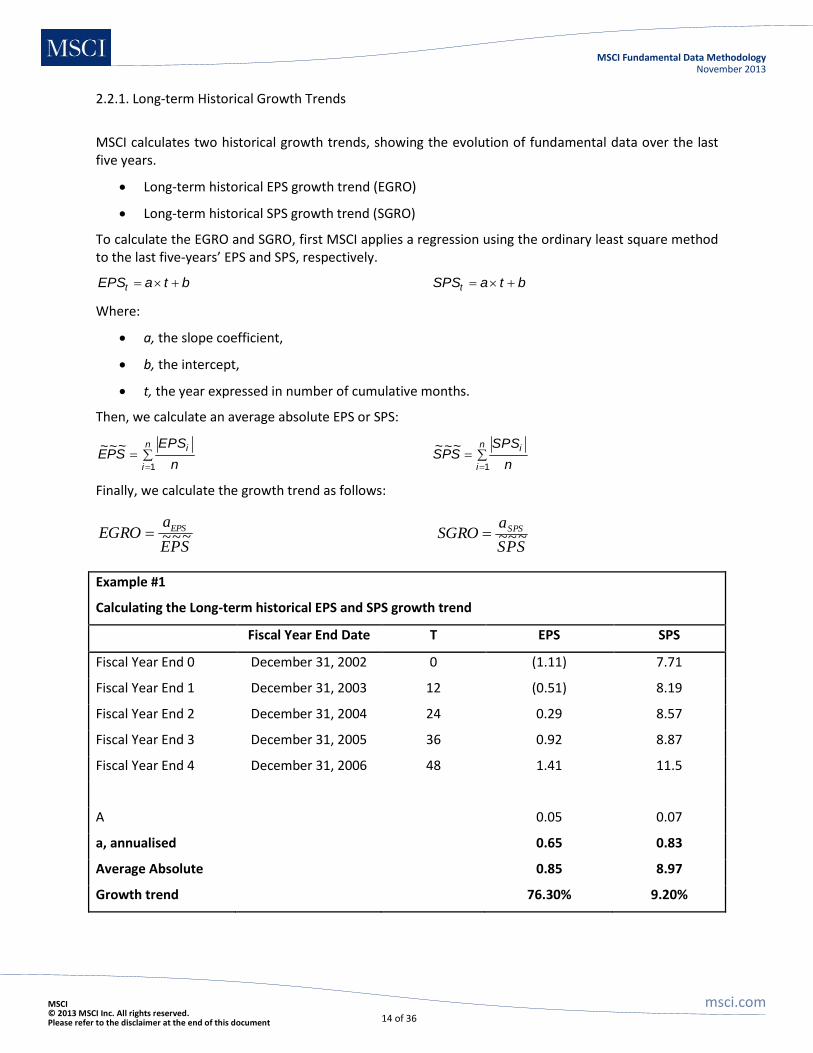
Example #1
Calculating the Long-term historical EPS and SPS growth trend
Fiscal Year End Date T EPS SPS
Fiscal Year End 0 December 31, 2002 0 (1.11) 7.71
Fiscal Year End 1 December 31, 2003 12 (0.51) 8.19
Fiscal Year End 2 December 31, 2004 24 0.29 8.57
Fiscal Year End 3 December 31, 2005 36 0.92 8.87
Fiscal Year End 4 December 31, 2006 48 1.41 11.5
A 0.05 0.07
a, annualised 0.65 0.83
Average Absolute 0.85 8.97
Growth trend 76.30% 9.20%
MSCI msci.com © 2013 MSCI Inc. All rights reserved. Please refer to the disclaimer at the end of this document
MSCI Fundamental Data Methodology
November 2013
15 of 36
A minimum of the last four comparable EPS or SPS values is needed to compute the historical growth trends. Growth trends for securities without at least four years of comparable EPS or SPS data are not calculated and/or used to attribute the style of a security. In order to provide meaningful historical growth trends, MSCI restates EPS and SPS to reflect the impact of corporate events that may affect historical financial data.
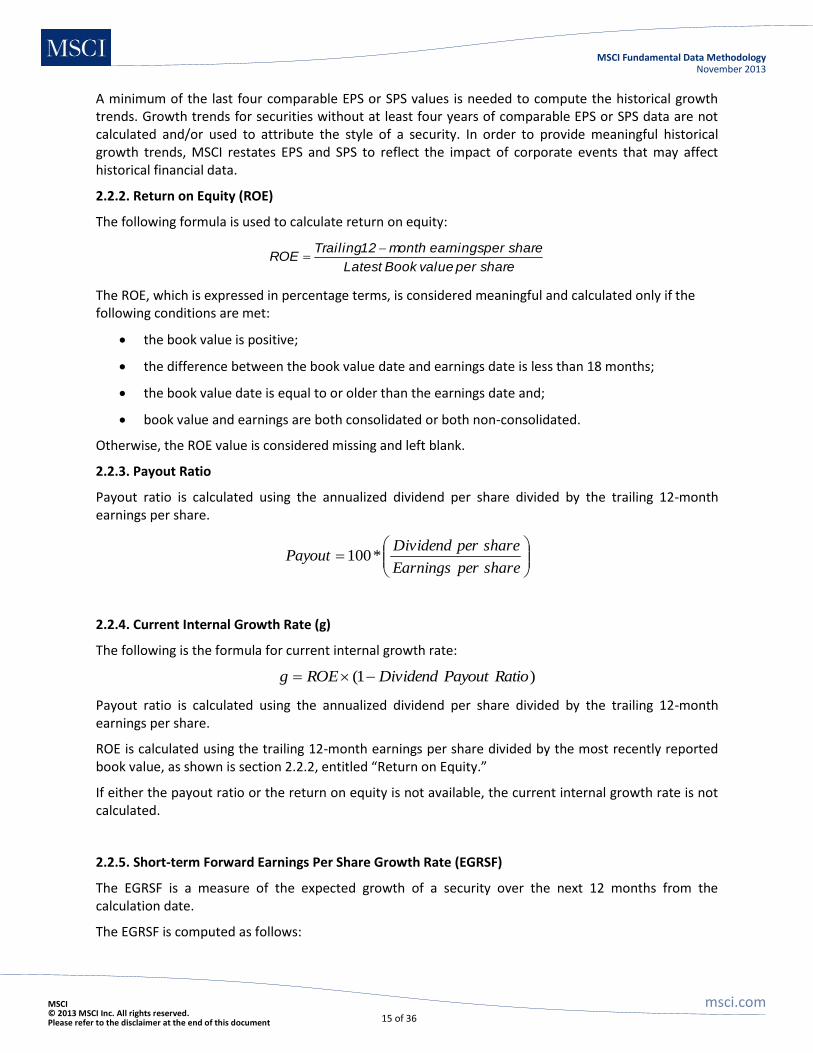
2.2.2. Return on Equity (ROE)
The following formula is used to calculate return on equity:
sharepervalueBookLatest
shareperearningsmonth12TrailingROE
The ROE, which is expressed in percentage terms, is considered meaningful and calculated only if the following conditions are met:
the book value is positive;
the difference between the book value date and earnings date is less than 18 months;
the book value date is equal to or older than the earnings date and;
book value and earnings are both consolidated or both non-consolidated.
Otherwise, the ROE value is considered missing and left blank.
2.2.3. Payout Ratio
Payout ratio is calculated using the annualized dividend per share divided by the trailing 12-month earnings per share.
shareperEarnings
shareperDividendPayout *100
2.2.4. Current Internal Growth Rate (g)
The following is the formula for current internal growth rate:
)1( RatioPayoutDividendROEg
Payout ratio is calculated using the annualized dividend per share divided by the trailing 12-month earnings per share.
ROE is calculated using the trailing 12-month earnings per share divided by the most recently reported book value, as shown is section 2.2.2, entitled “Return on Equity.”
If either the payout ratio or the return on equity is not available, the current internal growth rate is not calculated.
2.2.5. Short-term Forward Earnings Per Share Growth Rate (EGRSF)
The EGRSF is a measure of the expected growth of a security over the next 12 months from the calculation date.
The EGRSF is computed as follows:

MSCI msci.com © 2013 MSCI Inc. All rights reserved. Please refer to the disclaimer at the end of this document
MSCI Fundamental Data Methodology
November 2013
16 of 36
B
BF
EPS
EPSEPSEGRSF
12
1212
2.2.6. Long-term Forward Earnings Per Share Growth Rate (EGRLF)
The LT fwd EPS G is the consensus of analysts’ earnings growth rate estimates typically provided for the next 3 to 5 years. In cases where the LT fwd EPS G is considered an outlier (greater than 50% or less than -33%) and the corresponding estimate is based on only one contributor, the variable will not be used by MSCI.
MSCI msci.com © 2013 MSCI Inc. All rights reserved. Please refer to the disclaimer at the end of this document
MSCI Fundamental Data Methodology
November 2013
17 of 36
3. Index Ratio In general, index ratios computed by MSCI result from the aggregation of the constituent using the methodology that best reflects the underlying index.
To reflect the underlying index methodology, index ratios are calculated taking into account each security’s inclusion factor, which consists of the free float-adjustment and the style inclusion factor. For MSCI’s international index series, the inclusion factor is the foreign inclusion factor (FIF) and for the MSCI’s domestic indexes, the inclusion factor is the domestic inclusion factor (DIF). For the former, the appropriate FIF is multiplied by the value inclusion factor (VIF) for the value indexes and by the growth inclusion factor (GIF) for the growth indexes. For the latter series (i.e. domestic indexes), FIF is replaced by DIF.
MSCI calculates two types of index ratios:
Valuation ratios
Other Financial Ratios
The following section details the calculations of these ratios.
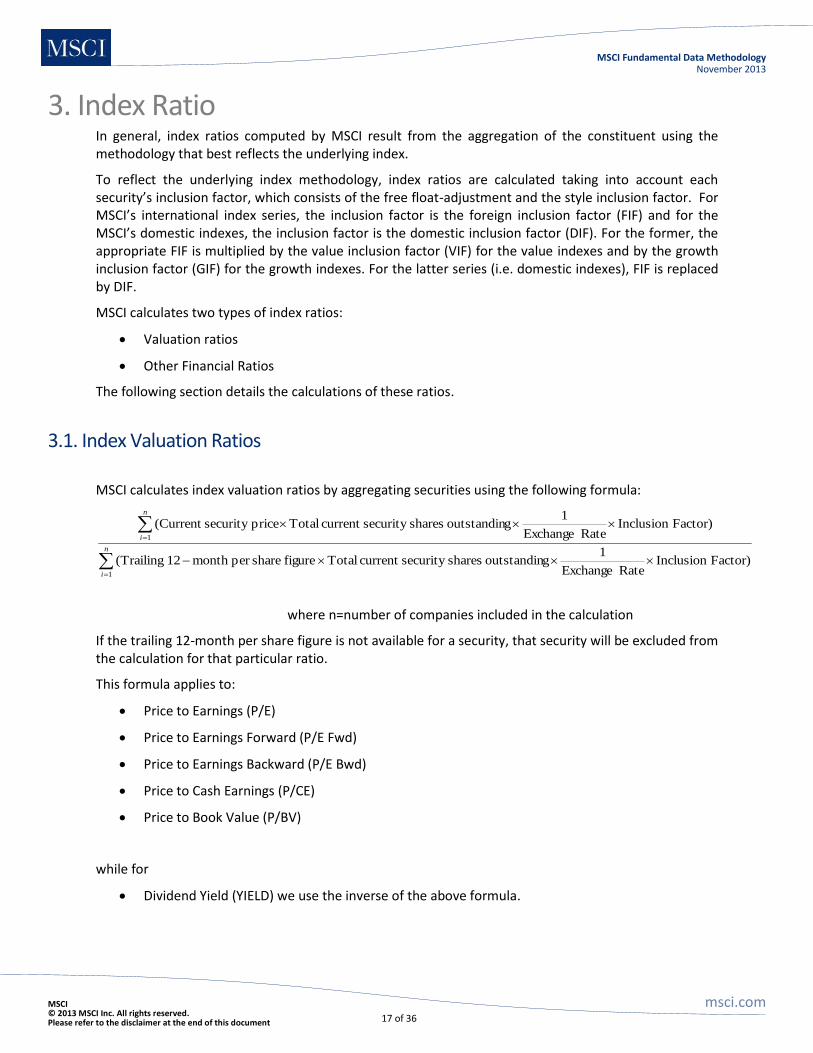
3.1. Index Valuation Ratios
MSCI calculates index valuation ratios by aggregating securities using the following formula:
n
i
n
i
1
1
)FactorInclusionRateExchange
1goutstandinsharessecuritycurrentTotalfiguresharepermonth12Trailing(
Factor)InclusionRateExchange
1goutstandinsharessecuritycurrentTotalpricesecurity(Current
where n=number of companies included in the calculation
If the trailing 12-month per share figure is not available for a security, that security will be excluded from the calculation for that particular ratio.
This formula applies to:
Price to Earnings (P/E)
Price to Earnings Forward (P/E Fwd)
Price to Earnings Backward (P/E Bwd)
Price to Cash Earnings (P/CE)
Price to Book Value (P/BV)
while for
Dividend Yield (YIELD) we use the inverse of the above formula.

MSCI msci.com © 2013 MSCI Inc. All rights reserved. Please refer to the disclaimer at the end of this document
MSCI Fundamental Data Methodology
November 2013
18 of 36
3.2. Other Index Financial Ratios Other financial ratios calculated by MSCI include the following:
Return on Equity (ROE)
Payout Ratio
Current Internal Growth Rate (g)
Short-term Forward EPS Growth Rate (EGRSF)
Long-term Growth Rates/Trends
12-month Index EPS
Year on Year Growth EPS
Estimated Daily Dividend Yield
3.2.1. Return on Equity (ROE)
Return on equity at an index level, which attempts to show the average return on equity for an index, is calculated using the recalculated earnings divided by the recalculated book value, as defined by the following formula:
EPIndex
BVPIndexROEIndex
/
/
3.2.2. Payout Ratio
Payout ratio at an index level is calculated using price to earnings and the dividend yield at an index level, as defined in the following formula:
3.2.3. Current Internal Growth Rate (g)
The current internal growth rate at an index level is calculated using the return on equity and the payout ratio at an index level, as defined in the following formula:
EPIndexinYieldDividendIndexROEIndexgIndex /%)(1
3.2.4. Short-term Forward EPS Growth Rate (EGRSF)
The short-term forward EPS growth rate is the percentage change between the recalculated earnings backward and the recalculated earnings forward. It is calculated using the following formula:
1/
/
12
12
F
B
EPIndex
EPIndexEGRSFIndex
Index P/E12B=Index level Price to Earnings Backward based on EPS12B for all securities included in the index.
yielddividendIndexearningstopricelevelIndexPayout

MSCI msci.com © 2013 MSCI Inc. All rights reserved. Please refer to the disclaimer at the end of this document
MSCI Fundamental Data Methodology
November 2013
19 of 36
Index P/E12F=Index level Price to Earnings Forward based on EPS12F for all securities included in the index.
EPS12F (12-month forward EPS) and EPS12B (12-month backward EPS) are as defined in section 1.3.
Price to Earnings Backwards is calculated using the index level valuation ratio formula as defined in Section 3.1.
3.2.5. Long-term Growth Rates/Trends
Long-term growth rates and trends at an index level are computed by MSCI from the aggregation of the constituents’ security level data using the following formula:
n
in
i
RateGrowth
factorInclusionsharescurrentTotalpriceshareCurrent
factorInclusionsharescurrentTotalpriceshareCurrent
1
1
)goutstandinsecurity(
goutstandinsecurity
where n=number of companies included in the calculation
This formula applies to:
Long-term Forward EPS Growth Rate (EGRLF)
Long -term Historical EPS Growth Trend (EGRO)
Long-term Historical SPS Growth Trend (SGRO)
3.2.6. 12-Month Index EPS
MSCI calculates the 12-month index EPS by combining an index level with its underlying price to earnings ratios, thereby creating a new theoretical per share figure at an index level that reflects the evolution of the EPS for an index. MSCI calculates:
12 months trailing Index EPS
12 months forward Index EPS
The following formula is used to calculate these 12-month index ratios:
LevelIndexatP/E
LevelIndexEPSMonths 12
3.2.7. Year on Year Growth EPS
Using the 12-month index EPS, as shown above, MSCI calculates an EPS growth rate for an index. Year on year growth EPS relates earnings growth to the index level. Currently, MSCI calculates these figures using:
12-Month Index Historical EPS
12-Month Index Forward EPS
The year on year growth rate is calculated using the following formula:
MSCI msci.com © 2013 MSCI Inc. All rights reserved. Please refer to the disclaimer at the end of this document
MSCI Fundamental Data Methodology
November 2013
20 of 36
beforemonthsEPSIndexmonths
beforemonthsEPSIndexmonthsMonthCurrenttheofEPSIndexMonthsEPSGrowthYearonYear
1212
121212100
For details on index ratio calculation examples, see Appendix II, entitled “Index Ratio Calculation Examples.”
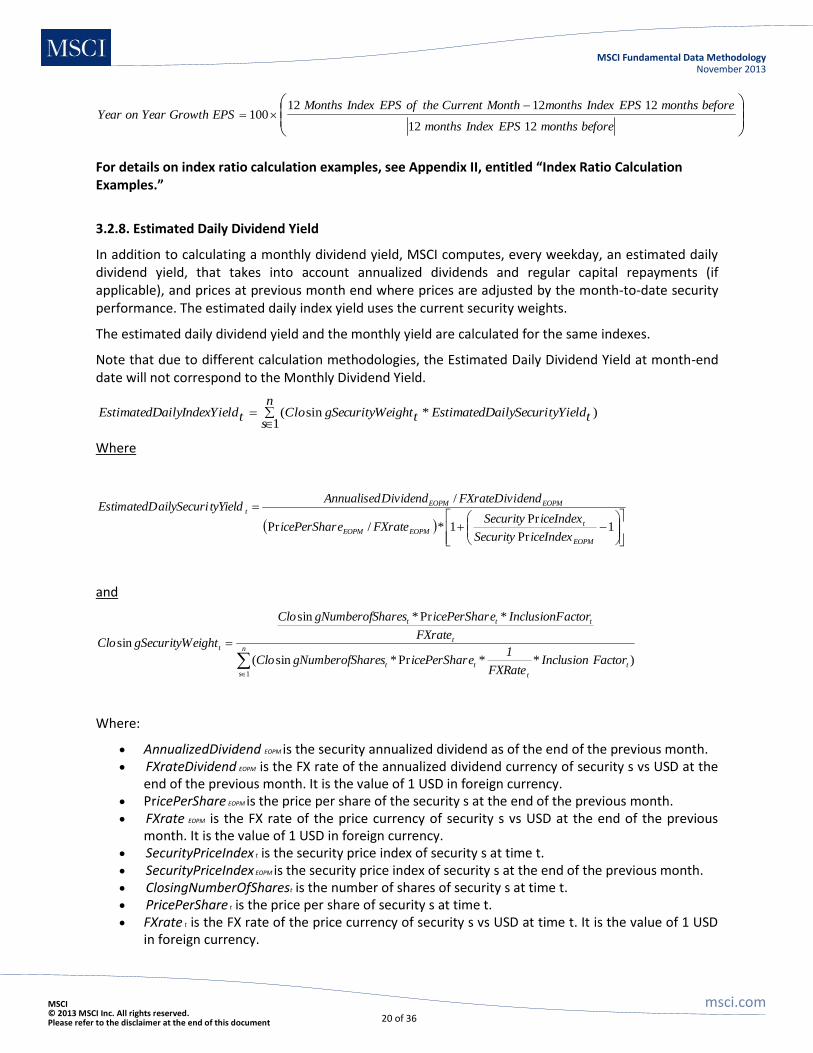
3.2.8. Estimated Daily Dividend Yield
In addition to calculating a monthly dividend yield, MSCI computes, every weekday, an estimated daily dividend yield, that takes into account annualized dividends and regular capital repayments (if applicable), and prices at previous month end where prices are adjusted by the month-to-date security performance. The estimated daily index yield uses the current security weights.
The estimated daily dividend yield and the monthly yield are calculated for the same indexes.
Note that due to different calculation methodologies, the Estimated Daily Dividend Yield at month-end date will not correspond to the Monthly Dividend Yield.
n
sttyYieldailySecuriEstimatedDteightgSecurityWClotieldailyIndexYEstimatedD
1)*sin(
Where
1Pr
Pr1*/Pr
/
EOPM
tEOPMEOPM
EOPMEOPMt
iceIndexSecurity
iceIndexSecurityFXrateeicePerShar
dendFXrateDiviDividendAnnualisedtyYieldailySecuriEstimatedD
and
n
s
t
t
tt
t
ttt
t
FactorInclusionFXRate
1eicePerSharharesgNumberofSClo
FXrate
actorInclusionFeicePerSharharesgNumberofSClo
eightgSecurityWClo
1
)**Pr*sin(
*Pr*sin
sin
Where:
AnnualizedDividend EOPM is the security annualized dividend as of the end of the previous month. FXrateDividend EOPM is the FX rate of the annualized dividend currency of security s vs USD at the
end of the previous month. It is the value of 1 USD in foreign currency. PricePerShare EOPM is the price per share of the security s at the end of the previous month. FXrate EOPM is the FX rate of the price currency of security s vs USD at the end of the previous
month. It is the value of 1 USD in foreign currency. SecurityPriceIndex t is the security price index of security s at time t. SecurityPriceIndex EOPM is the security price index of security s at the end of the previous month. ClosingNumberOfSharest is the number of shares of security s at time t. PricePerShare t is the price per share of security s at time t. FXrate t is the FX rate of the price currency of security s vs USD at time t. It is the value of 1 USD
in foreign currency.

MSCI msci.com © 2013 MSCI Inc. All rights reserved. Please refer to the disclaimer at the end of this document
MSCI Fundamental Data Methodology
November 2013
21 of 36
InclusionFactort is the inclusion factor (e.g. Foreign Inclusion Factor, Domestic Inclusion Factor, Growth Inclusion Factor, Value Inclusion Factor) of the security s at time t+1.

MSCI msci.com © 2013 MSCI Inc. All rights reserved. Please refer to the disclaimer at the end of this document
MSCI Fundamental Data Methodology
November 2013
22 of 36
4. Fundamental Data Treatments for Corporate Events The following section details the treatment of fundamental data to account for a corporate event. When a corporate event occurs, MSCI may adjust and/or restate fundamental data in order to ensure comparability between the pre and post event data.
For the treatment of fundamental data, MSCI categorizes corporate events as the following:
Nominal Changes in Capital Structure
Real Changes in Capital Structure
Both Nominal and Real Changes in Capital Structure
Changes in Business Structure
For events such as share buybacks, special cash dividends, and debt-to-equity swaps, no adjustment is made generally.
The policies and guidelines set forth apply in most corporate events. For corporate events not described in this section or combinations of different types of corporate events and other exceptional cases, MSCI will determine the most appropriate implementation method and will announce it prior to the changes becoming effective in the MSCI Equity Index Series.
4.1. Nominal Changes in Capital Structure
Nominal changes in capital structure, events that have no effect on the capitalization of a security, require fundamental data to be adjusted in the same way that the price of the security is adjusted using the price adjustment factor (PAF).
For fundamental per share data, if the corporate event leads to an increase in the number of shares, the adjustment factor will decrease the value of the per share data using the same terms of the corporate event. If the corporate event leads to a decrease in the number of shares, the adjustment factor will increase the value of the per share data using the same terms of the corporate event.
Illustration:
Split 2:1, with a nominal value change from 50 to 25 The shareholder exchanges 1 share of nominal 50 against 2 shares of nominal 25. The price before split is 100 and the shareholder had 1 share at a price of 100 Then he has 2 shares which price is : 1*100/ 2 = 50 The adjustment factor is (ex/cum) 50/100 = 0.50 Fundamental data per share figures are adjusted by this adjustment factor.
In the case of the current dividend rate, if the adjustment factor is between 0.8 and 1.25, no adjustment is made. MSCI assumes that any event that leads to an adjustment factor within this range will typically not lead to a change in a company’s dividend policy.
Security and index ratios will remain neutral to corporate events that result in nominal changes in capital structure because fundamental per share data is adjusted in the same proportion as price. Any changes that may be observed are due to price performance or company fundamental data.

MSCI msci.com © 2013 MSCI Inc. All rights reserved. Please refer to the disclaimer at the end of this document
MSCI Fundamental Data Methodology
November 2013
23 of 36
4.2. Real Changes in Capital Structure
For all corporate events that involve a real change in capital structure, events that cause a change in security market capitalization, a pro forma book value will be calculated in order to reflect the incoming or outgoing market capitalization. All other fundamental data will not be adjusted for such events including the current dividend rate, except if earnings and/or cash earnings are negative.
Illustration:
Pro forma book value per share is calculated using the following formula:
offeringpublicorplacementprivateaftersharesofNumber
priceIssueissuedsharesofNumbergoutstandins sharecompanyofnumberLatestBVPSLatest )()(
The number of shares at BVPS date = 1000. The book value per share before the public offering is EUR 25. Event: Public placement of 100 shares @ EUR 50 per share. New BVPS = (1000*25)+(100*50)
(1000 + 100)
New BVPS = 27.27
Adjustment Factor for BVPS = New BVPS/ Old BVPS = 1.09
If a company has multiple share classes, book value is adjusted by using the total amount of capital raised in the issue.
Security and index ratios will change by the increase or decrease in the number of shares and change in price. Price to book value, return on equity, and current internal growth rate, at a security and index level, will change based on the new book value per share.
If earnings/cash earnings are negative, an adjustment factor is applied according to the change in number of shares (Pre-event number of shares/ Post-event number of shares) in order to avoid increasing losses artificially in P/E and P/CE calculations at index level.1
4.3. Both Nominal and Real Changes in Capital Structure
All corporate events that involve a nominal and real change in capital structure require fundamental data to be adjusted in the same way that the price of the security is adjusted using the price adjustment factor (PAF) due to the discount the shares are offered at in relation to the market price, except:
In the case of the current dividend rate, if the adjustment factor is between 0.8 and 1.25, no adjustment is made. MSCI assumes that any event that leads to an adjustment factor within this range will typically not lead to a change in a company’s dividend policy.
1 When a corporate event results in incoming market capitalization and the company reports losses, MSCI adjusts the trailing 12-month EPS.
The loss per share will be recalculated using the number of shares after the corporate event to avoid a decrease in earnings due to an increase in market capitalization.
MSCI msci.com © 2013 MSCI Inc. All rights reserved. Please refer to the disclaimer at the end of this document
MSCI Fundamental Data Methodology
November 2013
24 of 36
If earnings or cash earnings are negative, an adjustment factor is applied according to the change in number of shares (Pre-event number of shares/ Post-event number of shares) in order to avoid increasing losses artificially in P/E and P/CE calculations at index level.1
In the case of book value, a pro forma book value will be calculated in order to reflect the incoming or outgoing market capitalization.
4.4. Changes in Business Structure
MSCI defines changes in business structure as events that cause a company’s on-going business model to substantially change. Events that cause a change in business structure include significant events such as significant mergers and acquisitions and early index inclusions resulting from spin-offs and IPOs. MSCI uses a threshold of an increase of 50% or greater or a decrease of 33% or more, relative to the company’s full market capitalization before the event to identify such significant events.
For these significant events, if the post-event entity moves from being a non-constituent to a constituent of the Global Investable Market Index or moves from the Small Cap Index to the Standard Index, the style characteristics of the affected securities are reviewed. If the post-event entity moves from the Standard Index to the Small Cap Index or remains in the same Size-Segment Index (with the Large and Mid Cap Indexes being considered as one size index), the style characteristics of the affected securities are not reviewed.
In cases where such a style review is performed, pro forma post-event fundamental data provided by the post-event entity is used. If no pro forma post-event fundamental data is provided, estimations of proforma fundamental data are performed using actual figures provided by the post-event entity.
MSCI will also use estimated proforma fundamental data for the acquiring company in acquisitions of loss-making companies, provided the acquired loss-making companies meet the following conditions:
The acquired loss-making company was a constituent of the MSCI Standard Size Segment before the acquisition; and
The 12-month trailing losses of the acquired loss-making company exceeded USD 1bn at the end of the month previous to the ex-date of the acquisition event.
For the acquiring company, MSCI will use estimated proforma fundamental data arrived at by use of pre-event fundamental data of both the acquiring company and the acquired company. Such estimated fundamental data would be used until the time the acquiring company starts reporting post-event fundamental data.

MSCI msci.com © 2013 MSCI Inc. All rights reserved. Please refer to the disclaimer at the end of this document
MSCI Fundamental Data Methodology
November 2013
25 of 36
5. Balance Sheet Information MSCI covers the following Balance Sheet items in its product files.
Assets
Fixed Assets (FA) Net fixed assets after accumulated depreciation; may be blanked.
Investments (INV) Equity participation in loans to subsidiaries, affiliates and associated companies. Investments of pure portfolio nature are excluded from this item whenever possible; may be blanked
Other Assets (OA) Assets that by their nature are not readily classifiable as Fixed Assets, Investments or Current Assets (such as intangible assets or non-current debtors). May aggregate other balance sheet items if detailed breakdown is not reported by the company; may be blanked
Current Assets (CA) Include inventories, receivables, securities, bank balances, cash and equivalent. May aggregate other balance sheet items if detailed breakdown is not reported by the company; may be blanked
Total Assets (TA) = FA + INV + OA + CA
Liabilities
Shareholders equity / Book Value (BV) Capital and all reserves of an equity nature; may be blanked
Other Liabilities (OL) Liabilities that by their nature are not readily classifiable as Book Value, Long-term Debt or Current Liabilities, for example minority interests, special provisions, pension funds, deferred taxation, etc. May aggregate other balance sheet items if detailed breakdown is not reported by the company; may be blanked
Long Term Debt (LD) Debt maturing in over one year; may be blanked
Current Liabilities (CL) Includes all liabilities of short-term nature, i.e. payable within one year. May aggregate other balance sheet items if detailed breakdown is not reported by the company; may be blanked
Total Liabilities (TL) = BV + OL + LD + CL
MSCI also covers the following Balance Sheet ratio for its Global Equity Model
Market leverage (MLEV)
It is calculated as MCAP
LDPREFMCAPMLEV
,
where MCAP is the market value of common equity at previous month-end, PREF is the most recent
book value of preferred equity, and LD is the most recent book value of long-term debt.
Book leverage (BLEV)
It is calculated as BV
LDPREFBVBLEV
MSCI msci.com © 2013 MSCI Inc. All rights reserved. Please refer to the disclaimer at the end of this document
MSCI Fundamental Data Methodology
November 2013
26 of 36
where BV is the most recent book value of common equity, PREF is the most recent book value of preferred equity, and LD is the most recent book value of long-term debt.
Debt-to-assets (DTOA)
It is calculated as TA
CLLDDTOA
where LD is the long-term debt and CL are the current liabilities, and TA is most recent book value of total assets.
MSCI msci.com © 2013 MSCI Inc. All rights reserved. Please refer to the disclaimer at the end of this document
MSCI Fundamental Data Methodology
November 2013
27 of 36
6. Hyperinflationary economies – Adjustment of Fundamental Data
MSCI follows the guidelines provided under FRS (Financial Reporting Standard) 29 to adjust fundamental data of companies belonging to hyperinflationary economies. The standard states that:
Hyperinflation is indicated by characteristics of the economic environment of a country, which include, but are not limited to, the following:
The general population prefers to keep its wealth in non-monetary assets or in a relatively stable foreign currency. Amounts of local currency held are immediately invested to maintain purchasing power;
The general population regards monetary amounts not in terms of the local currency but in terms of a relatively stable foreign currency. Prices may be quoted in that currency;
Sales and purchases on credit take place at prices that compensate for the expected loss of purchasing power during the credit period, even if the period is short;
Interest rates, wages and prices are linked to a price index; and
The cumulative inflation rate over three years is approaching, or exceeds, 100%.
Accordingly, MSCI will review the inflation rates of countries on a periodic basis to identify cases that meet the above threshold.
Earlier, MSCI used to adjust fundamental data of companies belonging to hyperinflationary currency economies (viz Argentina, Brazil, Venezuela etc.). The data was adjusted to reflect the fundamental variables excluding the impact of inflation.

MSCI msci.com © 2013 MSCI Inc. All rights reserved. Please refer to the disclaimer at the end of this document
MSCI Fundamental Data Methodology
November 2013
28 of 36
Appendix I: MSCI’s treatment of some specific aspects of IFRS
Under the regulation adopted by the Council of the European Union, all EU listed companies are required to prepare their consolidated financial statements for financial years beginning on or after January 1, 2005, in accordance with IFRS. In addition, several companies in other regions including Norway, Switzerland, Australia, Singapore, Hong Kong and China also adopted IFRS starting 2005. EU listed companies that report using United States Generally Accepted Accounting Principles ('US GAAP') were permitted to continue doing so until 2007.
A transition from local GAAP to IFRS impacts the computation of historical long-term earnings and sales trends because IFRS earnings and sales numbers may not be comparable with the numbers reported using local GAAP. Historical earnings and historical sales trends over a five-year period are important components of MSCI's index construction methodology. 1) MSCI's approach to the treatment of amortization of goodwill: In order to make five-year earnings comparable, MSCI will adjust historical [non-IFRS] earnings by adding back "amortization of goodwill" for companies where the difference between IFRS earnings and non-IFRS earnings is more than or equal to 10%. For companies with the largest percentage and absolute change in earnings due to the adoption of IFRS, the discontinuation of goodwill amortization explains the bulk of the earnings change in a majority of cases. 'Amortization of goodwill' is also the only item for which historical pre-IFRS earnings data can be consistently adjusted to make it comparable to IFRS data. For further details, please refer to MSCI's consultation document -- 'MSCI Consultation on the Treatment of Financial Results under IFRS'-- released in February 2006. 2) In order to make sales comparable, MSCI will make case-by-case adjustments.
3) MSCI's approach to the treatment of Gain / Loss due to Revaluation of property:
'Revaluation of property' can have a large impact on earnings of Real Estate companies. Therefore, MSCI adjusts the earnings of real estate companies (i.e., companies falling under the GICS Industry Group 'Real Estate' for 'Gain / Loss due to Revaluation of Investment Property').
To compute the trailing EPS of a real estate company that has opted to revalue its investment property, MSCI adjusts the trailing EPS for the 'Gain / Loss due to Revaluation of Investment Property' for the latest trailing period updated by MSCI.
To compute the Long-term Historical EPS growth trend and to make the five year earnings comparable, MSCI adjusts the EPS of fiscals reported by the company under IFRS (December 2004 onwards) for the 'Gain / Loss due to Revaluation of Investment Property'.
As a reminder, MSCI calculates:
1) Long-term Historical EPS growth trend, by performing a regression analysis of the last five years' fiscal year-end earnings per share;
2) Long-term Historical SPS growth trend, by performing a regression analysis of the last five years' fiscal year-end sales per share.

MSCI msci.com © 2013 MSCI Inc. All rights reserved. Please refer to the disclaimer at the end of this document
MSCI Fundamental Data Methodology
November 2013
29 of 36
Appendix II: Index Ratio Calculation Examples
This appendix provides examples on how index ratios are calculated.
The ratios are calculated by dividing the market capitalization of the relevant index by the aggregated relevant fundamental data for all securities included in the relevant index.
MSCI calculates index valuation ratios by aggregating securities using the following formula:
n
i
n
i
FactorInclusionRateExchange
1goutstandinsharessecuritycurrentTotalfiguresharepermonth12Trailing
FactorInclusionRateExchange
1goutstandinsharessecuritycurrentTotalpricesecurityCurrent
1
1
)(
)(
where n=number of companies included in the calculation
If the trailing 12-month per share figure is not available for a security, that security will be excluded from the calculation for that particular ratio.
This formula applies to:
Price to Earnings (P/E)
Price to Earnings Forward (P/E Fwd)
Price to Earnings Backward (P/E Bwd)
Price to Cash Earnings (P/CE)
Price to Book Value (P/BV)
while for
Dividend Yield (D/P) we use the inverse of the above formula
For Price to Earnings (P/E) and Price to Cash Earnings (P/CE) ratios, the security level per share figure is the Trailing 12-month earnings per share and the Trailing 12-month cash earnings per share respectively.

MSCI msci.com © 2013 MSCI Inc. All rights reserved. Please refer to the disclaimer at the end of this document
MSCI Fundamental Data Methodology
November 2013
30 of 36
Each example runs a simulation with three securities in an index.
Example # 1 Calculating price to book value for MSCI Index Security A Security B Security C Price USD 45.21 USD 15.40 USD 25.49 Book Value Per Share USD 10.90 USD 7.80 USD 13.20 P/BV 4.15 1.97 1.93 Total Current Security Shares Outstanding (in millions) 50.24 40.87 12.41 Exchange Rate 1.0 1.0 1.0 Foreign Inclusion Factor (FIF) 0.9 0.8 0.95 Inclusion Factor 0.9 0.8 0.95 Adjusted Market Capitalization (in millions of USD) 2044.22 503.52 300.51 Book Value (in millions of USD) 492.85 255.03 155.62 Total Adjusted Market Capitalization (in millions of USD) 2848.25 Recalculated Total Book Value (in millions of USD) 903.5
Index Level Price to Book Value 3.15
Example # 2 Calculating price to book value for MSCI Index Security A Security B Security C Price USD 45.21 USD 15.40 USD 25.49 Book Value Per Share USD 10.90 USD 7.80 USD 13.20 P/BV 4.15 1.97 1.93 Total Current Security Shares Outstanding (in millions) 50.24 40.87 12.41 Exchange Rate 1.0 1.0 1.0 Foreign Inclusion Factor (FIF) 0.9 0.8 0.95 Value Inclusion Factor (VIF) 1.0 0.5 0.65 Inclusion Factor 0.9 0.4 0.62 Adjusted Market Capitalization (in millions of USD) 2044.22 251.76 195.33 Book Value (in millions of USD) 492.85 127.51 101.15 Total Adjusted Market Capitalization (in millions of USD) 2491.31 Recalculated Total Book Value (in millions of USD) 721.52
Index Level Price to Book Value 3.45
MSCI msci.com © 2013 MSCI Inc. All rights reserved. Please refer to the disclaimer at the end of this document
MSCI Fundamental Data Methodology
November 2013
31 of 36
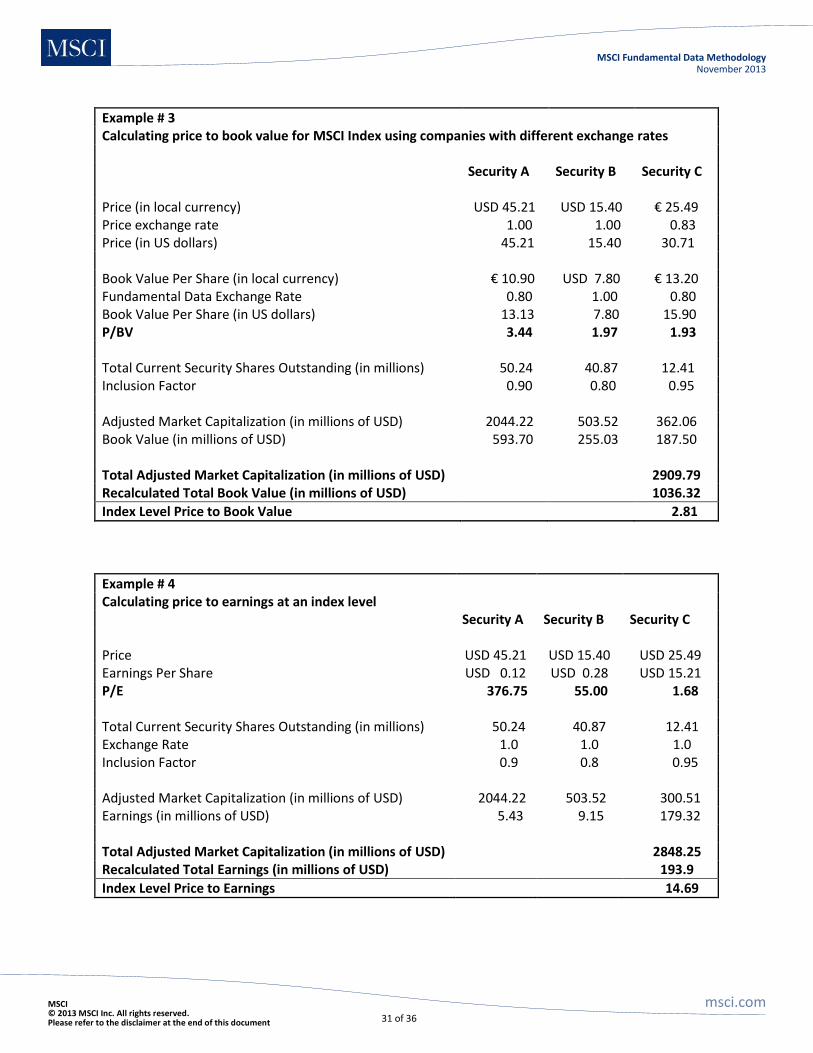
Example # 3 Calculating price to book value for MSCI Index using companies with different exchange rates Security A Security B Security C Price (in local currency) USD 45.21 USD 15.40 € 25.49 Price exchange rate 1.00 1.00 0.83 Price (in US dollars) 45.21 15.40 30.71 Book Value Per Share (in local currency) € 10.90 USD 7.80 € 13.20 Fundamental Data Exchange Rate 0.80 1.00 0.80 Book Value Per Share (in US dollars) 13.13 7.80 15.90 P/BV 3.44 1.97 1.93 Total Current Security Shares Outstanding (in millions) 50.24 40.87 12.41 Inclusion Factor 0.90 0.80 0.95 Adjusted Market Capitalization (in millions of USD) 2044.22 503.52 362.06 Book Value (in millions of USD) 593.70 255.03 187.50 Total Adjusted Market Capitalization (in millions of USD) 2909.79 Recalculated Total Book Value (in millions of USD) 1036.32
Index Level Price to Book Value 2.81
Example # 4 Calculating price to earnings at an index level Security A Security B Security C Price USD 45.21 USD 15.40 USD 25.49 Earnings Per Share USD 0.12 USD 0.28 USD 15.21 P/E 376.75 55.00 1.68 Total Current Security Shares Outstanding (in millions) 50.24 40.87 12.41 Exchange Rate 1.0 1.0 1.0 Inclusion Factor 0.9 0.8 0.95 Adjusted Market Capitalization (in millions of USD) 2044.22 503.52 300.51 Earnings (in millions of USD) 5.43 9.15 179.32 Total Adjusted Market Capitalization (in millions of USD) 2848.25 Recalculated Total Earnings (in millions of USD) 193.9
Index Level Price to Earnings 14.69
MSCI msci.com © 2013 MSCI Inc. All rights reserved. Please refer to the disclaimer at the end of this document
MSCI Fundamental Data Methodology
November 2013
32 of 36
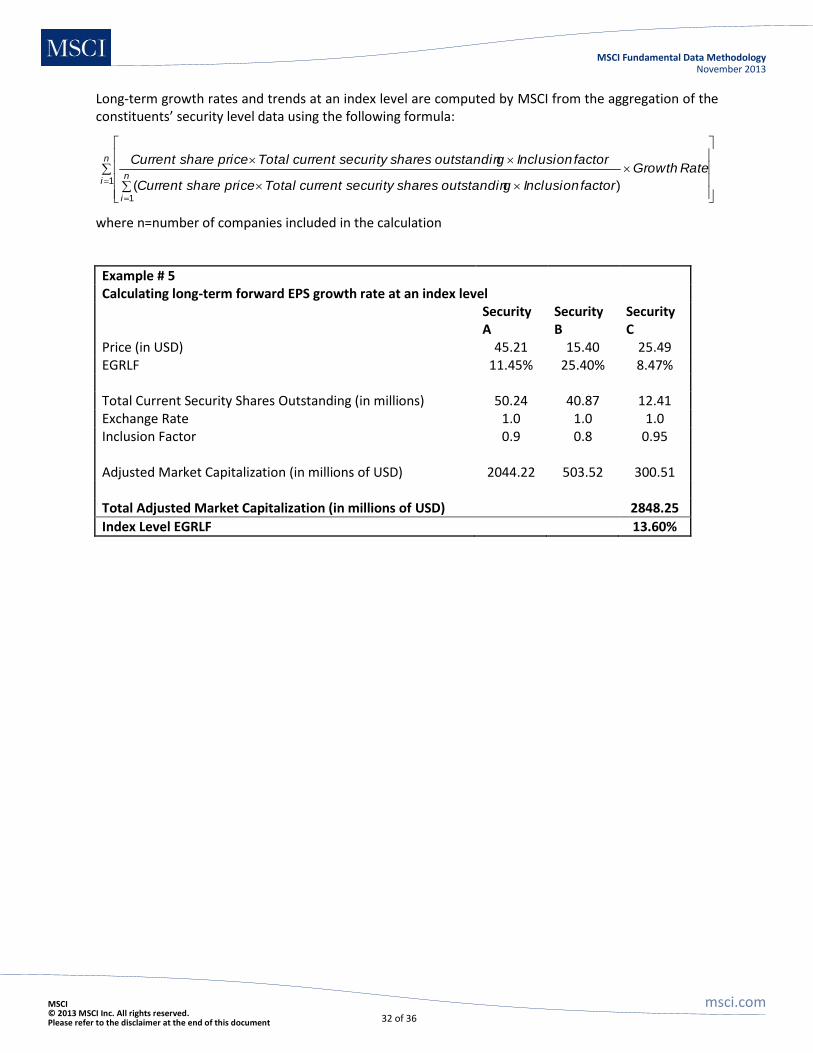
Long-term growth rates and trends at an index level are computed by MSCI from the aggregation of the constituents’ security level data using the following formula:
n
in
i
RateGrowth
factorInclusiongoutstandinsharessecuritycurrentTotalpriceshareCurrent
factorInclusiongoutstandinsharessecuritycurrentTotalpriceshareCurrent
1
1
)(
where n=number of companies included in the calculation
Example # 5 Calculating long-term forward EPS growth rate at an index level
Security A
Security B
Security C
Price (in USD) 45.21 15.40 25.49 EGRLF 11.45% 25.40% 8.47% Total Current Security Shares Outstanding (in millions) 50.24 40.87 12.41 Exchange Rate 1.0 1.0 1.0 Inclusion Factor 0.9 0.8 0.95 Adjusted Market Capitalization (in millions of USD) 2044.22 503.52 300.51 Total Adjusted Market Capitalization (in millions of USD) 2848.25
Index Level EGRLF 13.60%

MSCI msci.com © 2013 MSCI Inc. All rights reserved. Please refer to the disclaimer at the end of this document
MSCI Fundamental Data Methodology
November 2013
33 of 36
MSCI calculates the 12-month index EPS by combining an index level with its underlying price to earnings ratios, thereby creating a new theoretical per share figure at an index level that reflects the evolution of the EPS for an index. MSCI calculates:
12 months trailing Index EPS
12 months forward Index EPS
The following formula is used to calculate these 12-month index ratios:
LevelIndexatP/E
LevelIndexEPSMonths 12
Example # 6 Calculating 12-month index EPS
Security A
Security B
Security C
Price (in USD) 45.21 15.40 25.49 Earnings Per Share (in USD) 0.12 0.28 15.21 P/E 376.75 55.00 1.68 Total Current Security Shares Outstanding (in millions) 50.24 40.87 12.41 Exchange Rate 1.0 1.0 1.0 Inclusion Factor 0.9 0.8 0.95 Adjusted Market Capitalization (in millions of USD) 2044.22 503.52 300.51 Earnings (in millions of USD) 5.43 9.15 179.32
Index Level Price to Earnings 14.69 Index Level 954.15 12-month Index EPS 64.96

MSCI msci.com © 2013 MSCI Inc. All rights reserved. Please refer to the disclaimer at the end of this document
MSCI Fundamental Data Methodology
November 2013
34 of 36
Appendix III: Correction Policy
The rule for Valuation Ratios correction is as follows:
The correct valuation ratios (P/E, P/CE, P/Sales, P/BV, and Dividend Yield) are calculated at security level and their yields are used to evaluate the impact of the incorrect data on the security.
If the incorrect security yields are within ±0.25% of the correct yields (±0.5% for book value yield), no revision is done on the country and industry index. No announcement is made by MSCI. Per share figures and valuation ratios at security level are revised in the MSCI historical database.
If the incorrect security yields are not within ±0.25% of the correct yields (±0.5% for book value yield), an announcement is made by MSCI with the revised valuation ratios at the security level. The impact of the incorrect security level data on the country index and industry group is evaluated.
If the incorrect index yields at country/industry level are within ±0.1% of the correct yields (±0.5% for book value yield), no index revision is done. No announcement is made by MSCI.
If the incorrect index yields are not within ±0.1 of the correct yield (±0.5% for book value yield), new valuation ratios are calculated, for all the indexes in which the security is included. For all indexes where the incorrect yields lie outside the stated threshold, an announcement is made by MSCI with the revised valuation ratios.

MSCI msci.com © 2013 MSCI Inc. All rights reserved. Please refer to the disclaimer at the end of this document
MSCI Fundamental Data Methodology
November 2013
35 of 36
Methodology Book Tracked Changes
The following sections have been updated since February 2013
2.2.3 Payout Ratio
3.2.2. Payout Ratio at Index level
3.2.6. Year on Year Growth EPS
MSCI msci.com © 2013 MSCI Inc. All rights reserved. Please refer to the disclaimer at the end of this document
MSCI Fundamental Data Methodology
November 2013
36 of 36
Client Service Information is Available 24 Hours a Day
Notice and Disclaimer This document and all of the information contained in it, including without limitation all text, data, graphs, charts (collectively, the “Information”) is the property of MSCI Inc. or its
subsidiaries (collectively, “MSCI”), or MSCI’s licensors, direct or indirect suppliers or any third party involved in making or compiling any Information (collectively, with MSCI, the “Information Providers”) and is provided for informational purposes only. The Information may not be reproduced or redisseminated in whole or in part without prior written permission from MSCI.
The Information may not be used to create derivative works or to verify or correct other data or information. For example (but without limitation), the Information may not be used to create indexes, databases, risk models, analytics, software, or in connection with the issuing, offering, sponsoring, managing or marketing of any securities, portfolios, financial products or other investment vehicles utilizing or based on, linked to, tracking or otherwise derived from the Information or any other MSCI data, information, products or services.
The user of the Information assumes the entire risk of any use it may make or permit to be made of the Information. NONE OF THE INFORMATION PROVIDERS MAKES ANY EXPRESS OR IMPLIED WARRANTIES OR REPRESENTATIONS WITH RESPECT TO THE INFORMATION (OR THE RESULTS TO BE OBTAINED BY THE USE THEREOF), AND TO THE MAXIMUM EXTENT PERMITTED BY APPLICABLE LAW, EACH INFORMATION PROVIDER EXPRESSLY DISCLAIMS ALL IMPLIED WARRANTIES (INCLUDING, WITHOUT LIMITATION, ANY IMPLIED WARRANTIES OF ORIGINALITY, ACCURACY, TIMELINESS, NON-INFRINGEMENT, COMPLETENESS, MERCHANTABILITY AND FITNESS FOR A PARTICULAR PURPOSE) WITH RESPECT TO ANY OF THE INFORMATION.
Without limiting any of the foregoing and to the maximum extent permitted by applicable law, in no event shall any Information Provider have any liability regarding any of the Information for any direct, indirect, special, punitive, consequential (including lost profits) or any other damages even if notified of the possibility of such damages. The foregoing shall not exclude or limit any liability that may not by applicable law be excluded or limited, including without limitation (as applicable), any liability for death or personal injury to the extent that such injury results from the negligence or wilful default of itself, its servants, agents or sub-contractors.
Information containing any historical information, data or analysis should not be taken as an indication or guarantee of any future performance, analysis, forecast or prediction. Past performance does not guarantee future results.
None of the Information constitutes an offer to sell (or a solicitation of an offer to buy), any security, financial product or other investment vehicle or any trading strategy. You cannot invest in an index.
MSCI’s indirect wholly-owned subsidiary Institutional Shareholder Services, Inc. (“ISS”) is a Registered Investment Adviser under the Investment Advisers Act of 1940. Except with respect to any applicable products or services from ISS (including applicable products or services from MSCI ESG Research Information, which are provided by ISS), neither MSCI nor any of its products or services recommends, endorses, approves or otherwise expresses any opinion regarding any issuer, securities, financial products or instruments or trading strategies and neither MSCI nor any of its products or services is intended to constitute investment advice or a recommendation to make (or refrain from making) any kind of investment decision and may not be relied on as such.
The MSCI ESG Indexes use ratings and other data, analysis and information from MSCI ESG Research. MSCI ESG Research is produced by ISS or its subsidiaries. Issuers mentioned or included in any MSCI ESG Research materials may be a client of MSCI, ISS, or another MSCI subsidiary, or the parent of, or affiliated with, a client of MSCI, ISS, or another MSCI subsidiary, including ISS Corporate Services, Inc., which provides tools and services to issuers. MSCI ESG Research materials, including materials utilized in any MSCI ESG Indexes or other products, have not been submitted to, nor received approval from, the United States Securities and Exchange Commission or any other regulatory body.
Any use of or access to products, services or information of MSCI requires a license from MSCI. MSCI, Barra, RiskMetrics, ISS, CFRA, FEA, and other MSCI brands and product names are the trademarks, service marks, or registered trademarks or service marks of MSCI or its subsidiaries in the United States and other jurisdictions. The Global Industry Classification Standard (GICS) was developed by and is the exclusive property of MSCI and Standard & Poor’s. “Global Industry Classification Standard (GICS)” is a service mark of MSCI and Standard & Poor’s.
About MSCI MSCI Inc. is a leading provider of investment decision support tools to investors globally, including asset managers, banks, hedge funds and pension funds. MSCI products and services include indexes, portfolio risk and performance analytics, and governance tools.
The company’s flagship product offerings are: the MSCI Indexes with close to USD 7 trillion estimated to be benchmarked to them on a worldwide basis1; Barra multi-asset class factor models, portfolio risk and performance analytics; RiskMetrics multi-asset class market and credit risk analytics; IPD real estate information, indexes and analytics; MSCI ESG (environmental, social and governance) Research screening, analysis and ratings; ISS governance research and outsourced proxy voting and reporting services; FEA valuation models and risk management software for the energy and commodities markets; and CFRA forensic accounting risk research, legal/regulatory risk assessment, and due‐diligence. MSCI is headquartered in New York, with research and commercial offices around the world.
1As of March 31, 2012, as published by eVestment, Lipper and Bloomberg in September 2012 Jan 2013
Americas Europe, Middle East & Africa Asia Pacific
Americas Atlanta Boston Chicago Montreal Monterrey New York San Francisco Sao Paulo Stamford Toronto
1.888.588.4567 (toll free) + 1.404.551.3212 + 1.617.532.0920 + 1.312.675.0545 + 1.514.847.7506 + 52.81.1253.4020 + 1.212.804.3901 + 1.415.836.8800 + 55.11.3706.1360 +1.203.325.5630 + 1.416.628.1007
Cape Town Frankfurt Geneva London Milan Paris
+ 27.21.673.0100 + 49.69.133.859.00 + 41.22.817.9777 + 44.20.7618.2222 + 39.02.5849.0415 0800.91.59.17 (toll free)
China North China South Hong Kong Seoul Singapore Sydney Tokyo
10800.852.1032 (toll free) 10800.152.1032 (toll free) + 852.2844.9333 798.8521.3392 (toll free) 800.852.3749 (toll free) + 61.2.9033.9333 + 81.3.5226.8222