msl solutions ltd for personal use only - asx · 2018-08-30 · investor presentation august 2018...
TRANSCRIPT

MSL Solutions Ltd
Investor Presentation
August 2018
For
per
sona
l use
onl
y
This document is issued by MSL Solutions Limited, (“MSL Solutions”) to provide summary information about MSL Solutions and its associated entities and their activities current as at the date of this document. Theinformation contained in this document is of general background and does not purport to be complete. It is intended only for those persons to whom it is delivered personally by or on behalf of MSL Solutions. Byattending this presentation, you represent and warrant that (i) if you are in Australia, you are a person to whom an offer of securities may be made without a disclosure document (as defined in the Corporations Act2001 (Cth) (“Corporations Act”)) on the basis that you are exempt from the disclosure requirements of Part 6D.2 in accordance with Section 708(8) or 708(11) of the Corporations Act; (ii) if you are in the UnitedStates, you are a qualified institutional buyer (as defined under Rule 144A under the U.S. Securities Act; (iii) if you are outside Australia and the United States, you are a person to whom an offer and issue of securitiescan be made outside Australia without registration, lodgement or approval of a formal disclosure document or other filing in accordance with the laws of that foreign jurisdiction. If you are not such a person, you arenot entitled to attend this presentation. Please return this document and any copies and do not provide this document to any other person.
This document is not, and should not be considered as, an offer or an invitation to acquire securities in MSL Solutions or any other financial products and neither this document nor any of its contents will form thebasis of any contract or commitment. This document is not a prospectus and does not contain all of the information which would be required to be disclosed in a prospectus.
In particular, this document does not constitute an offer to sell, or a solicitation of an offer to buy, securities in the United States. Securities may not be offered or sold in the United States unless the securities havebeen registered under the US Securities Act of 1933 or an exemption from registration is available.
Neither MSL Solutions nor any of its officers, employees, related bodies corporate, affiliates, agents or advisers guarantees or makes any representations or warranties, express or implied, as to, or takesresponsibility for, the accuracy or reliability of the information contained in this document. MSL Solutions does not represent or warrant that this document is complete or that it contains all material informationabout MSL Solutions or which a prospective investor or purchaser may require in evaluating a possible investment in MSL Solutions or acquisition of MSL Solutions shares. Nothing contained in this document nor anyinformation made available to you is, or shall be relied upon as, a promise, representation, warranty or guarantee, whether as to the past, present or the future. MSL Solutions has not carried out due diligenceinvestigations in connection with the preparation of this document. You must conduct your own independent investigations and enquiries as you deem fit. The information set out in this document does notconstitute or purport to be a recommendation by MSL Solutions, its officers, employees, agents or advisers and has been prepared without taking into account the objectives, financial situation or needs ofindividuals. The information in this document does not constitute financial product advice (nor investment, taxation or legal advice).
To the maximum extent permitted by law, MSL Solutions and its related bodies corporate and each of their respective directors, employees, officers, affiliates, agents and advisers expressly disclaim any and allliability (including without limitation for negligence) for representations or warranties or in relation to the accuracy or completeness of the information, statements, opinions or matters, express or implied, containedin, arising out of or derived from, or for omissions from, this document including, without limitation, any historical financial information, any estimates or projections and any other financial information derivedtherefrom. In particular, this document does not constitute, and shall not be relied upon as, a promise, representation, warranty or guarantee as to the past, present or the future performance of MSL Solutions.
This document contains certain forward-looking statements and opinion which are provided as a general guide only and should not be relied on as an indication or guarantee of future performance and involveknown and unknown risks, uncertainties and other factors, many of which are outside the control of MSL Solutions. Past performance is not necessarily a guide to future performance and no representation orwarranty is made as to the likelihood of achievement or reasonableness of any forward looking statements or other forecast.
Information in this document (“Confidential Information”) is confidential and by accepting the invitation and attending this presentation you agree to keep this information confidential and not to disclose it toanyone within your organisation except on a need-to-know basis and subject to these restrictions, or to anyone outside your organisation. You must not copy, use, publish, record or reproduce the ConfidentialInformation or directly or indirectly disclose t to any person without the prior written consent of MSL Solutions, which may be withheld in its absolute discretion.
All figures in this document are in Australian dollars (AUD) unless stated otherwise.
2
IMPORTANT NOTICE & DISCLAIMERF
or p
erso
nal u
se o
nly

Executing on Growth Strategy
MPower Connect Collaboration PlatformRedefining the Sport, Leisure & Hospitality Industry Globally
For
per
sona
l use
onl
y

FY18 FINANCIAL RESULTS HIGHLIGHTSF
or p
erso
nal u
se o
nly

CLUBS (MBO’s)• Membership-based organisations.
• 12,000+ venues in Australia (Frost & Sullivan)
• 50,000+ venues in UK
• 500+ venues as customers in Australia including:
o Sport / Leagues clubs
o Private City clubs
o Marinas
o RSL’s
• MSL has less than 5% of the total addressable market (TAM)
ASSOCIATED MBO’S• Growth into venues that have
operations similar to a Club MBO and need to drive long-term engagement & loyalty:
o Restaurant Franchise Groups
o Boutique Hotels
o Retirement Living
o Theme Parks
o Sport Associations
• MSL has less than 1% of the total addressable market (TAM)
LARGE, GROWING & FRAGMENTED GLOBAL MARKET
STADIA & ARENAS• Global smart stadium market to
reach revenues of $20Bn by 2024 growing at CAGR 22% due to enhanced fan engagement(Infoholic Research)
• 10,000+ venues globally(Frost & Sullivan)
• Iconic venue clients in UK, Australia & Europe including over 60% of English Premier League (EPL) venues
• MSL has less than 1% of total addressable market (TAM)
GOLF FACILITIES • R&A/USGA new World
Handicap System announced for 2020
• Global market of 33,000+ facilities
• MSL presence in Australia & Europe
• Paid per member to run handicaps in Australia
• MSL has less than 3% of the total addressable market (TAM)
For
per
sona
l use
onl
y

MSL exists to drive Engagement for Sports, Leisure and Hospitality businesses.
We know consumers demand a premium, personalised experience when engaging with venues.
With our industry first collaboration technology platform, our venuesincrease customer engagement which drives income growth and sustainability.
MPOWER MSL – OUR VISION F
or p
erso
nal u
se o
nly

7
DIGITAL IS TRANSFORMING WHAT WE DO WITH OUR LEISURE TIMEF
or p
erso
nal u
se o
nly

8
CHANGING TIMES – HOW FREE TIME BECAME SCREEN TIMEF
or p
erso
nal u
se o
nly

*REPORT: State of the Connected Customer – Second Edition 2018: Salesforce
Customer expectations are at an all-time high.Experience impacts the bottom line, for better or worse.
With 80% of a retailer’s business typically coming from 20% of its customers, identifying your most valuable customers and understanding their shopping habits is critical to cultivating loyal, brand enthusiasts.
47% of retailers do not currently have any process in place to communicate the most valuable customer status to their associates before the point of checkout.
CUSTOMER LOYALTY IS THE NEW BATTLEGROUNDF
or p
erso
nal u
se o
nly

THE STRATEGY – UNIQUE PLATFORM THAT DRIVES ENGAGEMENT
ATTRACT more guests
REPEAT visitation with personalised customer
experience
DELIVER long term engagement & loyalty
INCREASED Revenue
THRIVE
SURVIVEFor
per
sona
l use
onl
y

• Create competitive advantage through increased business agility with MSL’s Connect industry platform.
• Customers have flexibility to select one or many modules, and increase modules over time as they mature on their customer experience programs.
• MPower Connect open API network allows easy partnering with other technology solutions to amplifies the value of their investment with MSL Connect.
• Acquisitions provide a key entry point to new customers and synergies by adding the MPower Connect modules over time for their venue.
INDUSTRY FIRST – MPOWER CONNECT INDUSTRY PLATFORMF
or p
erso
nal u
se o
nly

AUD $m’s FY16 FY17 FY18 Description
Revenue Growth- Organic Growth- Acquisition Growth
30%14%16%
110%17%93%
44%20%24%
Total Revenue including Recurring Annuities (customer support & SaaS Subscriptions) and Non-Recurring Revenue (upfront licence fees, services, hardware & advertising)
Recurring Revenue- Support Annuity- SaaS / Subscriptions
5.74.80.9
12.17.44.7
15.8 (31%)9.2 (25%)6.6 (40%)
Recurring annuity contracts – note customer churn rates annually are less than 5%
Annual Recurring Revenue (ARR)- Support ARR- SaaS / Subscriptions ARR
16.89.27.6
ARR is the forward looking annuity value contracted at a point in time.
Customer Venues- Organic Growth- Acquisition Growth
2,066 2,406 (16%)4%
12%
Customer venues using MSL software modules from the MPower Connect technology stack at period end.
R&D Expense (see Note 1)- % of Revenue
1.312%
4.318%
5.717%
Amount of spend on innovation including investment in future commercialisable research & development.
S&M Expense- % of Revenue
3.228%
4.620%
4.814%
Amount of sales & marketing headcount, commission and non-headcount programs spend in the year.
Note 1: A number of comparable technology companies capitalise R&D expense and then amortise this over a 5 to 10 year period. MSL policy to expense R&D in the year it is incurred above the EBITDA line.
KEY METRICS FOR INTERNATIONAL GROWTHF
or p
erso
nal u
se o
nly

• Represents recurring annual customer support contracts and SaaS subscription annual fees
• Growth in FY18 44%• 20% organic• 24% acquisitions
• Annualised Recurring Revenue (ARR) as at 30 June 2018 is $16.8m. This will be a key measure at each period end.
• Expect growth trend to continue over the next 5 years
STRATEGIC ACQUISITIONS
SALES EXPANSION
Today
MANAGEMENT TARGET
CONSOLIDATION
$0
$2
$4
$6
$8
$10
$12
$14
$16
$18
$20
$22
2005 2015 2016 2017 2018 2019 2020
MSL is incorporated
Acquires iseekgolf Pty
Ltd
Acquires Palient (Marina Management
System)
Acquires Micropower Pty Ltd (Full Venue Enterprise System)
Acquires Arta I.P, as basis for Zuuse Pty Ltd
Acquires GolfLink
Partners Pty Ltd
PGA Australia appoints MSL
Strategic
Deconsolidation of Zuuse
Acquires Marketown
Media Pty Ltd (Mpower Media
Network)
Acquires InfoGenesis
Pty Ltd
Acquires RockitPty Ltd (T/A
Golf Computer Systems
Acquires DotGolf cloud-
based gold management
systems
MSL appointed
Gold Australia Strategic
Technology Partner
Acquires VertedaHoldings
Limited (UK)
Acquires GolfBox A/S (Denmark)
First US clients sales
Acquires Pricap
Services Pty Ltd
Enters binding agreement to
acquire Pallister Assets
Official listing on the
Australian Stock
Exchange
Zuuse Pty Ltd merges with
Progressclaim; MSL owns a
11.5% stake in the merged
entity
RECURRING REVENUE GROWTHF
or p
erso
nal u
se o
nly

14
REVENUE
-
5,000
10,000
15,000
20,000
25,000
H1 FY17 H2 FY17 H1 FY18 H2 FY18
Revenue Seasonality
14%
17%
20%
16%
93%
24%
-
5,000
10,000
15,000
20,000
25,000
30,000
35,000
40,000
FY16 FY17 FY18
Growth Profile
Prior Year Organic Growth Acquistion Growth
For
per
sona
l use
onl
y

GROWTH STRATEGIES – ORGANIC & BY ACQUISITION
Growth in customers organically & via strategic
acquisitions
Trend toward
75%+ revenue international
Trend toward 75%+ revenue annualized
recurring
Increaserevenue per
customer
25+ Countries | 2400+ Clients | 7 Offices | 150 Employees
For
per
sona
l use
onl
y

Financial Results
For
per
sona
l use
onl
y

Key Notes:• Research & Development – an additional $1.4m was
invested in solution innovations commercialisable in the future. $5.7m total R&D spend offset by $0.3m tax credit.
➢ Note that a number of comparative technology companies on the ASX capitalise R&D expenditure and take through the amortisation line over a 5-10 year period. Adjusted EBITDA excluding R&D in FY18 would be $10.6m.
• Transaction Costs – costs relate to XciteMedia &Pricap completed in H2, and other acquisitions not completed or in progress.
• Tax – includes benefit from R&D incentives and lower offshore corporate tax rates
• Amortisation - relates to the identified acquisition intangibles such as customer contracts only, no capitalised R&D.
A$m FY17Statutory
Actual
FY18Half-Year Guidance
FY18Statutory
Actual
FY18Variance Forecast
Revenue 23.4 34.0 33.6 (0.4)
Other Income 0.7 1.5 1.5 -
Total Revenue & Income 24.1 35.5 35.1 (0.4)
Cost of Sales (5.4) (9.5) (9.0) 0.5
Gross Margin 18.7 26.0 26.1 0.1
Customer Services & Technical Costs (3.8) (5.4) (5.4) -
Sales & Marketing Costs (4.6) (4.8) (4.8) -
Research & Development Costs (4.3) (4.0) (5.4) (1.4)
General & Administration Expenses (4.0) (5.4) (5.3) 0.1
Adjusted1 EBITDA 2.1 6.4 5.2 (1.2)
Significant One-Off Costs (8.8) (0.3) (0.3) -
Transaction Costs (1.0) (0.2) (0.6) (0.4)
EBITDA (7.7) 5.9 4.3 (1.6)
Depreciation, Interest & Tax 0.8 - 0.3 0.3
NPATA (6.9) 5.9 4.6 (1.3)
Amortisation (4.1) (4.5)
NPAT (11.0) 0.1
Adjusted1 NPATA 2.9 5.9 5.6 (0.3)17
INCOME STATEMENT
(1) Adjusted EBITDA and Adjusted NPATA excludes significant expense items of $0.9m predominately relating to transaction relatedexpenses, and includes other income from the release of an earn out provision (FY18: $0.5m, FY17: $0.7m) and gain on the sale ofZuuse shares (FY18: $0.6m, FY17: Nil).
For
per
sona
l use
onl
y

A$m June 2017 June 2018
Cash & cash equivalents 11.9 6.6
Trade & other receivables 7.2 8.5
Assets held for sale 2.2 1.9
Property, Plant & Equipment 0.3 0.2
Intangible assets 41.9 43.3
Other assets 0.8 1.0
Total Assets 64.3 61.6
Trade and other payables (7.3) (6.1)
Provisions (6.7) (4.4)
Borrowings (0.2) -
Deferred tax liability (3.5) (2.3)
Deferred revenue (5.9) (6.0)
Total Liabilities (23.6) (18.8)
Net Assets 40.6 42.8
Key Notes:
• Strong balance sheet - Cash of $6.6m, No Loan Debt;
• Assets held for sale relate to Zuuse Pty Ltd. Other receivables include a non-current loan owing from Zuuse of $0.8m.
• Intangible assets relate to acquired businesses
• Deferred consideration on business combinations included in other payables and provisions
• Net deferred tax liability of $2.3m includes $1.5m asset related to tax losses, $4.2m liability related to intangible assets and a net asset of $0.4m for timingdifferences
18
BALANCE SHEETF
or p
erso
nal u
se o
nly
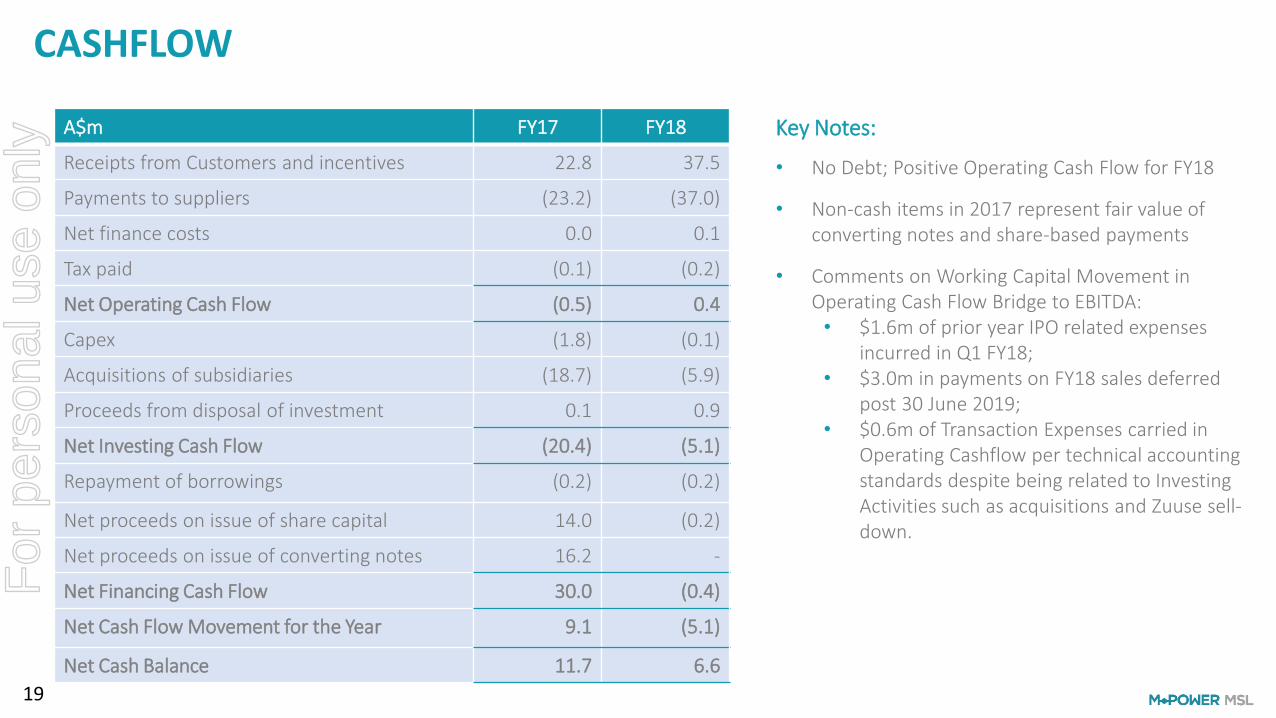
A$m FY17 FY18
Receipts from Customers and incentives 22.8 37.5
Payments to suppliers (23.2) (37.0)
Net finance costs 0.0 0.1
Tax paid (0.1) (0.2)
Net Operating Cash Flow (0.5) 0.4
Capex (1.8) (0.1)
Acquisitions of subsidiaries (18.7) (5.9)
Proceeds from disposal of investment 0.1 0.9
Net Investing Cash Flow (20.4) (5.1)
Repayment of borrowings (0.2) (0.2)
Net proceeds on issue of share capital 14.0 (0.2)
Net proceeds on issue of converting notes 16.2 -
Net Financing Cash Flow 30.0 (0.4)
Net Cash Flow Movement for the Year 9.1 (5.1)
Net Cash Balance 11.7 6.6
Key Notes:
• No Debt; Positive Operating Cash Flow for FY18
• Non-cash items in 2017 represent fair value of converting notes and share-based payments
• Comments on Working Capital Movement in Operating Cash Flow Bridge to EBITDA:• $1.6m of prior year IPO related expenses
incurred in Q1 FY18;• $3.0m in payments on FY18 sales deferred
post 30 June 2019;• $0.6m of Transaction Expenses carried in
Operating Cashflow per technical accounting standards despite being related to Investing Activities such as acquisitions and Zuuse sell-down.
19
CASHFLOWF
or p
erso
nal u
se o
nly

Appendix
For
per
sona
l use
onl
y

21
Segment results
MSL GROUP SUMMARY MPower Venue MPower Golf MPower Media MPower BI Corporate MSL TOTAL
STATUTORY RESULTS (A$’000s) FY18 FY17 Variance FY18 FY17 Variance FY18 FY17 Variance FY18 FY17 Variance FY18 FY17 Variance FY18 FY17 Variance
Annuity Revenue 7,589 6,830 759 6,978 4,784 2,194 784 164 620 474 300 174 0 0 0 15,825 12,078 3,747
Other Revenue 13,068 7,478 5,590 2,728 2,805 (77) 544 689 (145) 1,435 359 1,076 1,461 707 754 19,236 12,038 7,198
Total Revenue 20,657 14,308 6,349 9,706 7,589 2,117 1,328 853 475 1,909 659 1,250 1,461 707 754 35,061 24,116 10,945
3rd Party COGS (8,151) (5,039) (3,112) (766) (321) (445) (35) 0 (35) (62) (49) (13) 0 0 0 (9,014) (5,409) (3,605)
Overheads (9,749) (7,054) (2,695) (5,848) (6,010) 162 (593) (591) (2) (748) (723) (25) (3,976) (2,258) (1,718) (20,914) (16,636) (4,278)
Total Expenses (17,900) (12,093) (5,807) (6,614) (6,331) (283) (628) (591) (37) (810) (772) (38) (3,976) (2,258) (1,718) (29,928) (22,045) (7,883)
Adjusted EBITDA 2,757 2,215 542 3,092 1,258 1,834 700 262 438 1,099 (113) 1,212 (2,515) (1,551) (964) 5,133 2,071 3,062
Significant items (918) (9,844) 8,926 (918) (9,844) 8,926
Depreciation (154) (167) 13 (154) (167) 13
Amortisation (4,557) (4,122) (435) (4,557) (4,122) (435)
Interest (214) (21) (193) (214) (21) (193)
Tax 798 1,063 (265) 798 1,063 (265)
NPAT 2,757 2,215 542 3,092 1,258 1,834 700 262 438 1,099 (113) 1,212 (7,560) (14,642) 7,082 88 (11,020) 11,108
Adjusted NPATA 2,757 2,215 542 3,092 1,258 1,834 700 262 438 1,099 (113) 1,212 (2,085) (676) (1,409) 5,563 2,946 2,617
For
per
sona
l use
onl
y