mt. carrington gold silver project pre-feasibility study ... · asx and media release: 27 december...
TRANSCRIPT

ASX and Media Release: 27 December 2017 ASX Code: WRM
MT. CARRINGTON GOLD – SILVER PROJECT PRE-FEASIBILITY STUDY CONFIRMS A FINANCIALLY ROBUST GOLD FIRST STAGE PROJECT
ASX Code: WRM Issued Securities Shares: 907.7 million Options: 206.9 million Cash on hand (30 Sept 2017) $2.2M Market Cap (22 Dec 2017) $11M at $0.012 per share Directors & Management Brian Phillips Non-Executive Chairman Matthew Gill Managing Director & Chief Executive Officer Peter Lester Non-Executive Director Ian Smith Non-Executive Director Jeremy Gray Non-Executive Director Shane Turner Company Secretary Rohan Worland Exploration Manager For further information, contact: Matthew Gill or Shane Turner Phone: 03 5331 4644 or email [email protected] or visit our website www.whiterockminerals.com.au
The Board of White Rock Minerals (ASX:WRM) is pleased to report the key outcomes of the Company’s Pre-Feasibility Study (PFS) into the development of the first stage of its 100% owned Mt Carrington gold and silver project, located in New South Wales.
The outcomes confirm the technical and financial viability of the initial project development and provide a very strong rationale to advance the project through a Definitive Feasibility Study (DFS) towards development.
Highlights:- Gold first, Silver later Maiden Ore Reserve declared: 3.47 million tonnes at 1.4g/t gold for
159,000 ounces gold, When compared to the 2016 Scoping Study1:-
o Gold First Stage mine life has been extended from an initial 3 years to 4 ½ years,
o The production rate increases 25% to 1,000,000 tpa, o Gold production increases 30% to 35,000 ounces per annum,
and o Total gold produced increases 59% to 148,000 oz gold over this
initial 4 ½ year Gold First Stage.
The Stage One Pre-feasibility study (PFS) confirms Mt. Carrington as a viable gold first project (Gold First) with significant potential upside in subsequent silver production and future gold and silver exploration.
The PFS findings indicate a technically sound and financially viable project generating in excess of A$36 million undiscounted cashflow over the initial 4 ½ year Gold First mine plan, with a strong Internal Rate of Return (IRR) of 34%.
Development to be based on the first three gold-only production open pits and a conventional whole-of-ore leach process plant with an annual throughput of 1 million tonnes.
Maiden Ore Reserve of 3.47 million tonnes of material containing 159,000 oz gold, supporting a project producing at least 35,000 oz per year recovered gold for the proposed initial 4 ½ year operation.
Total forecast capital expenditure of A$35.7 million including a A$4 million contingency.
Estimated average all-in sustaining cost (AISC) of A$1,236 per ounce over the initial 4 ½ year life of mine (LOM) with a payback of 22 months.
Highly prospective near-mine exploration potential for both gold and silver, and additional “silver-only” Indicated Mineral Resources are available for the second stage of the Project’s development (Stage Two).
Stage Two presents an attractive opportunity to potentially increase the scale and overall life of the mine with minimal capital outlay. Stage Two is currently the subject of continuing studies.
Directors have approved the Stage One PFS, with commencement of the Mt. Carrington Definitive Feasibility Study (DFS) to follow.
1 Refer ASX Announcement “WRM Upside Mining Potential at Mt Carrington” dated 20 October 2016.

White Rock Minerals (WRM or the Company) is pleased to announce the completion of the Stage One Pre-Feasibility Study (PFS) for the development of its 100% owned Mt. Carrington Gold First stage of the project in northern New South Wales.
The compilation of the PFS included detailed economic analysis and further technical work building on previous studies which determined that the best “go-forward” case was a gold first initial stage capitalising on the existing pre-stripped gold pits, tailings dam and process water facilities with a minimal capital expenditure to commence full rate production, based on a 1 mtpa process plant and 35,000 ounces of gold p.a. for the initial 4 ½ year mine plan.
The silver dominant Mineral Resource, containing some 8.3M ounces in the Indicated category (refer ASX announcements 13 February 2012 & 20 November 2013) is the subject of further mineralogy studies, metallurgical test work and concentrate sales discussions. Mining of these silver resources constitutes Stage Two of the Mt Carrington project.
The PFS confirms Mt Carrington as a viable and relatively fast start, modest capex and opex project that is technically sound and economically viable, generating over A$36 million in undiscounted cash-flow over its initial stage 4 ½ year life. The forecast capital cost of A$35.7 million including a A$4 million contingency makes a modest capex start-up gold project. With this in place, the Stage Two silver phase will benefit from the already installed processing plant and associated infrastructure paid for by the Gold First stage of the project. This will further extend the life of the mine and further enhance the Project’s financial metrics. All technical analysis was done using a US$1,275/ounce gold price and a foreign exchange rate of AUD:USD 0.75.
As a key outcome from the PFS, WRM has declared a maiden Ore Reserve in accordance with the JORC Code (2012) for the Mt Carrington Gold First project of 3.47 million tonnes of ore at a grade of 1.4 g/t gold containing 159,000 ounces of gold. Whilst this Stage One mine plan is small as a stand-alone project, its economic returns and payback period are viable, with free cashflow in excess of A$36 million generated and a payback period of 22 months. Stage Two of the project will potentially increase the overall scale of the mine and project economics, with minimal capital requirements.
Based on the results of the PFS, the WRM Board has approved the commencement of the Definitive Feasibility Study (DFS), subject to funding.
The PFS was compiled using a number of well-credentialed, independent and reputable consultants and engineering companies across Australia along with White Rock Minerals’ personnel.
Peer Group Positioning
The Gold First PFS production profile results are significantly better than the gold stage of the 2016 Scoping Study, with annual gold production increased 30% and overall gold produced increased 59%. However, operating costs and capital expenditure have increased from the earlier study, up 68% and 67% respectively. The Gold First mine life has increased from 3 to 4 ½ years, but is less than the Scoping Study’s 7 years as that study also included mining the silver resources. There is a second stage to follow for silver and gold/silver production from these existing resources, but these are not included in the Gold First stage.
Peer group comparisons position the Mt Carrington project within the midrange of All In Sustaining Costs (AISC) relative to currently producing gold mines in Australia based on 2017 reported production (Figure 1), and has a capital intensity (Capex$/Gold ozpa) that is likewise midrange when compared to its peers’ projects (Figure 2).
Overall, the Board believes that the Mt Carrington Gold First Stage One represents a solid project firmly within the “deliverable” range for a project of this size.

Figure 1 Selected Australian gold producers AISC.
Source: DJ Carmichael, S&P Market Intelligence, Company announcements
Figure 2 Selected Australian gold development projects capital intensity.
Source: DJ Carmichael, S&P Market Intelligence, Company announcements
Commentary
Managing Director and CEO Matt Gill said “The Board is delighted to approve the Mt Carrington PFS and also the commencement of the Definitive Feasibility Study. Now that the PFS results are in we can see a modest capex and opex way to deliver real value from the project for our shareholders. This is likely to be the first of several stages to fully explore and exploit the valuable resources that we have at Mt Carrington.
The initial 4 ½ year gold first stage will deliver over A$36 million in free cashflow and provides our shareholders with a 22-month payback and solid return on investment. Subsequent stages of the project will require additional study and investment and are expected to yield similar positive results. The Mt Carrington resource base also includes over 8 million ounces of silver in the Indicated category and this resource is expected to be the basis of Stage Two of the project. WRM will ensure that every opportunity to improve project scale and return on investment will continue to be examined and pursued.
We thank all our stakeholders especially all of our local communities and major shareholders for working so closely with us to see the strong possibilities in this project for all.”
PRE‐FEASIBILITY STUDY PARAMETERS – CAUTIONARY STATEMENT
The PFS referred to in this announcement is based on an Ore Reserve derived from Indicated Resources. No Inferred Resource material has been included in the estimation of Ore Reserves. The Company advises that the Ore Reserve provides more than 90% of the total tonnage and more than 90% of the total gold metal underpinning the forecast production target and financial projections. The additional life‐of‐mine plan material derived from non‐Ore Reserve material comprises less than 10% of the total tonnage and less than 10% of the total gold metal and is material mostly classified as Inferred Mineral Resource. There is no dependence of the outcomes of the PFS and the guidance provided in this announcement on the non-Ore Reserve material. The Company has concluded that it has reasonable grounds for disclosing a production target which includes a modest proportion of Inferred Mineral Resource material of less than 10% of the total processed material. However, there is a low level of geological confidence associated with Inferred Mineral Resources and there is no certainty that further work will result in the determination of Indicated Mineral Resources or that the production target itself will be realised.
Unless otherwise stated, all cashflows are in Australian dollars, are undiscounted and are not subject to inflation/escalation factors, and all years are calendar years. The PFS has been prepared to an overall level of accuracy of approximately ‐15% to +25%.
The Company has concluded that it has a reasonable basis for providing forward looking statements included in this announcement. The detailed reasons for this conclusion are outlined throughout this announcement and in particular in Appendix 1: Forward Looking and Cautionary Statements. All material assumptions on which the forward-looking statements are based are set out in this document.
CAUTIONARY STATEMENT
This report (“Report”) has been prepared by White Rock Minerals Limited and is provided on the basis that none of the Company nor its respective officers, shareholders, related bodies corporate, partners, affiliates, employees, representatives and advisers make any representation or warranty (express or implied) as to the accuracy, reliability, relevance or completeness of the material contained in this report and nothing contained in this report is, or may be relied upon as a promise, representation or warranty, whether as to the past or the future. The Company hereby exclude all warranties that can be excluded by law.
The Report contains prospective financial material which is predictive in nature and may be affected by inaccurate assumptions or by known or unknown risks and uncertainties and may differ materially from results ultimately achieved.

The Report contains “forward-looking statements”. All statements other than those of historical facts included in the report are forward-looking statements. Where the Company expresses or implies an expectation or belief as to future events or results, such expectation or belief is expressed in good faith and believed to have a reasonable basis. However, forward-looking statements are subject to risks, uncertainties and other factors, which could cause actual results to differ materially from future results expressed, projected or implied by such forward-looking statements. Such risks include, but are not limited to, gold and other metals price volatility, currency fluctuations, increased production costs and variances in ore grade or recovery rates from those assumed in mining plans, as well as political and operational risks and governmental regulation and judicial outcomes. The Company does not undertake any obligation to release publicly any revisions to any “forward-looking statement” other than as required by law relating to any material changes in assumptions.
The information in this report is in summary form only and does not contain all the information necessary to fully evaluate any transaction or investment. It should be read in conjunction with the Company’s other periodic and continuous disclosure announcements lodged with the ASX, which are available at www.asx.com.au and other publicly available information on the Company’s website at www.whiterockminerals.com.au.

Table of Contents 1. Introduction ........................................................................................................................................ 2
2. Study Parameters ................................................................................................................................ 5
3. Study Team ......................................................................................................................................... 5
4. Key Outcomes of the Pre-Feasibility Study ......................................................................................... 6
5. Mineral Resource ................................................................................................................................ 7
6. Mining ................................................................................................................................................. 8
7. Ore Reserves ..................................................................................................................................... 11
8. Metallurgy and Ore Processing ......................................................................................................... 12
9. Infrastructure, transport and services .............................................................................................. 16
10. Tailings Storage Facility and Water Management ......................................................................... 18
11. Capital Expenditure ....................................................................................................................... 23
12. Operating Expenditure .................................................................................................................. 24
13. Community Relations .................................................................................................................... 26
14. Environment and Permitting ......................................................................................................... 27
15. Economic Evaluation ..................................................................................................................... 28
16. Conclusions and recommendations .............................................................................................. 29
17. Next Steps and Further Work ........................................................................................................ 30
18. Exploration .................................................................................................................................... 31
Appendix 1 – Forward-Looking and Cautionary statements ..................................................................... 35
Appendix 2 – Competent Persons ............................................................................................................. 38
APPENDIX 3: JORC Code 2012 Table 1 ...................................................................................................... 46

Page 2 of 57
1. Introduction
The Mt Carrington Project is located in northern NSW, near the township of Drake on the
Bruxner Highway, 4 hours drive south-west of Brisbane (Figure 3). The tenement package is
100% owned by White Rock and comprises 22 mining leases and one exploration licence over
a total area of 183km² (Figure 5).
Figure 3 – Location Map
The Mt Carrington Project contains gold-silver epithermal mineralisation associated with a
large 250km² collapsed volcanic caldera structure located in the southern New England Fold
Belt. Gold was first discovered in the district in 1853. In 1988 a mining operation at Mt
Carrington focussed on extracting open pit oxide gold and silver ore from the Strauss, Kylo,
Carrington, Guy Bell and Lady Hampden deposits (Figure 4). The oxide ore was largely
depleted by 1990, and with metal prices at US$370/oz gold and US$5/oz silver, coupled with
start-up operational issues, the small-scale mine was closed.

Page 3 of 57
Lismore 100km > < Tenterfield 50km
Figure 4 - Mt Carrington Project site layout plan showing past mining
activity and existing infrastructure

Page 4 of 57
Figure 5 - Mt Carrington Tenements

Page 5 of 57
2. Study Parameters
The Mt. Carrington Pre-Feasibility Study (PFS) has been conducted based on the following parameters;
The Strauss and Kylo Mineral Resource Estimate of 4.5 Mt at 1.5 g/t Gold (210,000 ounces) and
1.6 g/t Silver (238,000 ounces) – ASX Announcement 9 October 2017.
Open-pit earth-moving mining operation conducted by contractors,
Processing plant and infrastructure built under engineering, procurement and construction
(EPC) contracts with owner-operator management,
Power supply lines to be built as part of the site infrastructure plan from grid-power already to
the site via energy retailer and distributor contracts,
Management of the project implementation by the White Rock Minerals Management Team
(Owner’s Team).
3. Study Team
The PFS commenced in February 2017, and was managed by the Owner’s Team. Contributing
consultants are:
Alan Riles – Riles Integrated Resource Management Pty Ltd – Study Manager, metallurgy, processing
operations, coordination of technical inputs,
Richard Buerger – Mining Plus – Mineral Resource estimation (Gold only) in accordance with the JORC
Code (2012),
Mark Eggers & Greg Kennedy – Pells Sullivan Meynink – Mining Geotechnical,
Colin Mc Vie & John Battista – Mining Plus – mine planning & scheduling, mine design & optimisation,
cost modelling (mining capital and operating cost estimates), Ore Reserves,
Richard Holder – Pitt & Sherry – metallurgy test work design & management of the ALS Laboratory,
Cameron Bain – Mincore – processing capital, engineering and operating costs,
Heather Wardlaw & Arun Muhunthan – ATC Williams – water and tailings management,
Mike Mcrae-Williams – Hatlar Group Pty Ltd – Environmental, Community relations, water and tailings
management,
Rohan Worland & Matt Gill – White Rock Minerals – owner’s team, project management, study review
and oversight, and
Neil Grimes – Mannerim Partners – Financial and Economic evaluation.

Page 6 of 57
4. Key Outcomes of the Pre-Feasibility Study
Key PFS outcomes for the Mt. Carrington Project are included in Table 1. The estimated Ore Reserve,
which constitutes more than 90% of the milled production tonnes, has been prepared by competent
persons in accordance with the JORC Code (2012).
Gold First PFS
Project Life (years) – Gold First Stage 4.3
Strip Ratio (waste:ore) including pre-strip 2.67
Strip Ratio (waste:ore) excluding pre-strip 2.42
Gold recovered (koz) 147,300
Annual Gold production (average koz) 36,800
Grind size p80 (um) 75
Metallurgical recovery (%) 82.8
Ore Reserve (Mt ore) 3.47
Ore Reserve Gold Grade (g/t) 1.43
Ore Reserve (koz Gold) 159,000
Mineral Resource (Mt)* 4.5
Mineral Resource Gold Grade (g/t)* 1.5
Mineral Resource (koz Gold)* 210,000
Mineral Resource (koz Silver)* 238,000
Table 1 – Key PFS Physicals Outcomes
Notes:
* Refer Section 5 below and ASX Announcement 9 October 2017
Initial Capital Cost (A$M)** 35.7
Mining Cost (A$/t ore)*** 18.33
Processing Cost (A$/t ore milled) 21.84
Total Site Operating Cost (A$/t ore milled)**** 46.23
C1 Cash Cost (A$/oz produced) 1,078
All In Sustaining Cost (AISC) (A$/oz produced) 1,236
Free Cash Flow generated (A$M) 36.7
IRR (%) 34.0
Table 2 – Key PFS Financial Outcomes
** This includes contingency.
*** Mining cost is an average of $5.19/t of material mined over the life of mine.
**** Includes G&A and Royalty payments.
The PFS ore treatment rate is a nominal 1 Mtpa (up from 800 ktpa in previous studies) and was
determined from some early stage trade-off studies to be the optimal rate for the resource base. Oxide,
transitional and primary sulphide material will be treated in a conventional CIL circuit. A key difference
between the PFS and prior studies is a focus on the Gold First resource base and a simple cyanide leach
circuit to maximise gold recovery.
The silver dominant resources, containing approximately 8.3M ounces Ag in the Indicated category
(refer ASX announcements 13 February 2012 & 20 November 2013) are the subject of further

Page 7 of 57
mineralogy, metallurgical test work and concentrate sales discussions. Mining of this silver resource
constitutes Stage Two of the Mt Carrington project.
The gold price used to constrain the Mineral Resource estimate is A$2,000/oz, while A$1,600/oz was
used to estimate the Ore Reserve. The financial model assumes a long-term consensus gold price of
A$1,700/oz.
Although it is expected that some silver will be recovered into doré along with the gold during Stage
One, the expected revenue from silver is relatively small and the metallurgical recovery of silver via the
proposed process is relatively uncertain at this stage. As such, no revenue from silver has been included
for the purposes of this Gold First PFS.
The pit optimisations and pit designs were developed without considering the value of Inferred material
to determine the ultimate pit limits. However, there is a relatively small amount of Inferred material
that is within the final pit limits (approximately 9% of the total mill feed inventory). Value has been
attributed to the recoverable gold from this Inferred material in the base-case financial modelling for
the project. A comprehensive pre-mining RC grade control drilling program is planned, which will
provide increased certainty around both tonnage and grade of this Inferred material. It is to be noted
that 60% of this Inferred material is not mined until the last year of the Gold First stage.
Sensitivity studies have demonstrated that the project is still viable if no value is attributed to the gold
contained in the Inferred material.
There is a low level of geological confidence associated with Inferred Mineral Resources and there is no
certainty that further work will result in the determination of Indicated Mineral Resources or that the
production target itself will be realised.
However only a small percentage of mill feed material (<9%) included in the mine schedule is currently
classified as Inferred Mineral Resource. No material classified as Inferred Mineral Resource is included
in the Ore Reserves Estimate.
5. Mineral Resource
As part of the PFS technical studies, the Company announced a revised Mineral Resource estimate for
the two main gold deposits Strauss and Kylo (ASX Announcement 9 October 2017). The updated Mineral
Resource estimate for Strauss and Kylo was completed by independent resource and mining
consultants, Mining Plus Pty Ltd (“Mining Plus”) and is summarised in Table 3.
Strauss-Kylo Gold Deposit Mineral Resource Estimate - September 2017
Category Deposit Tonnes Au (g/t) Au (oz) Ag (g/t) Ag (oz)
Indicated Strauss 2,070,000 1.5 103,000 1.7 115,000
Kylo 2,010,000 1.3 85,000 1.4 92,000
Indicated Sub-Total 4,080,000 1.4 188,000 1.6 207,000
Inferred Strauss 380,000 1.7 21,000 2.4 30,000
Kylo 30,000 1.1 1,000 1.5 2,000
Inferred Sub-Total 410,000 1.7 22,000 2.3 31,000
Indicated & Inferred
Strauss 2,450,000 1.6 124,000 1.8 145,000
Kylo 2,050,000 1.3 86,000 1.4 93,000
Indicated & Inferred
Total 4,500,000 1.5 210,000 1.6 238,000
Table 3: Mt Carrington – Strauss and Kylo September 2017 Mineral Resource Estimate at 0.5 g/t cut-off grade.

Page 8 of 57
6. Mining
It is envisaged that a mining contractor will carry out the mining activities with technical and
management direction from White Rock. The mine is planned to be operated over three discrete open
pits each incorporating drill and blast, load and haul, and ore and waste management tasks.
The three pits are to be mined in an optimised sequence commencing with Kylo West and an initial
starter pit in Kylo North. This sequence allows the early exposure of high grade ores and targets the
completion of Kylo West for backfilling with waste rock from the mining operation. The sequence
beyond these two starter pits is:-
Strauss Stage 1 commences when Kylo North Stage 1 is completed;
Kylo North Stage 2 commences when Kylo West is completed; and
Strauss Stage 2 commences when Strauss Stage 1 is completed.
The mining quantities are initially governed by the bench turn-over and vertical advance rates. To
efficiently utilise the mining equipment it is planned to be mining in two areas in parallel, as this will
allow drilling and blasting to be separated from load and haul, thus optimising overall productivity.
Mine scheduling used the following key parameters and assumptions:-
The total material movement per quarter is scheduled with a peak quarterly movement of 1.0
Mt (Figure 6),
The mining schedule is constrained by setting a maximum vertical advance rate of 12 metres per
quarter per pit to allow sufficient time for drill and blast, load and haul, dewatering and grade
control, and
The production schedule assumes a process throughput rate of 1.0 Mtpa of ore which is not
dependent on the weathering characteristics of the ore.
Initial mine development and pre‐stripping activities are scheduled to provide sufficient material
required to construct the Tailings Storage Facility (TSF), site roads and the Run‐of‐Mine (ROM) pad.
Waste dump capacity is sufficient to store all waste materials.
The initial six-month pre-strip is also required before a continuous ex-pit ore supply can be assured.
There is an historic low-grade stockpile from the previous mining operations (1987-1990) which requires
removal as soon as practicable in order to help improve acid rock drainage management at the site. This
historic low-grade stockpile material will be reclaimed and processed during the commissioning phase
of the process plant. It is envisaged that reclaiming of this stockpile will commence about 3-4 months
after the start of the pre-strip mining. The annual planned ore production rate of 1.0 Mtpa can be
sustained for the full mine life, however this includes the Inferred mineralisation (excluding the pre-
exiting low grade stockpile). The Inferred mineralisation totals 9% of the mined plant feed of which the
majority is in the last year of the mine life (Figure 7).
Financial modelling results indicate that the project shows a positive NPV with the Inferred material
included in the mill feed inventory, and a reduced but still positive NPV if the Inferred material is treated
as waste. Thus, the viability of the project does not depend on the inclusion of Inferred material in the
mill feed inventory.

Page 9 of 57
Figure 6: Quarterly Mining Production by Pit
Figure 7: Quarterly Mining Production by Material
Geotechnical Considerations
Pells Sullivan Meynink (PSM – specialist geotechnical consultants) undertook a number of geotechnical
reviews of the project area including two site visits, pit wall mapping and drill core logging, and a final
review for the pit shells, which was undertaken by comparing the new shells versus the previous pit
designs. The following points summarised their findings.
Most of the walls presented in the final shells are located near the previous pit designs assessed
in the PFS design study.
Extensions to the Strauss pit towards the south, and Kylo North towards the north increase the
portions of weathered material within the final wall, and
The rock mass quality of the weathered portions was assessed from the current geotechnical
models to be sufficiently high to preclude the likelihood of rock mass failure.
As such, the slope design parameters provided have been assessed to be applicable to the pit shell
designs (Table 4) and are appropriate for this level of study.

Page 10 of 57
Pit
Slope Design Sector (bearing, clockwise from
North)
Bench Height = 16 m Berm Width = 7 m
From (degrees)
To (degrees)
Bench Face Angle (o)
Inter Ramp Angle (o)
Kylo North
020 100 70 51
100 270 75 55
270 330 65 48
330 020 75 55
Strauss
040 100 60 45
100 210 70 51
210 270 60 45
270 040 70 51
Kylo West
030 100 70 51
100 300 75 54
300 350 65 48
350 030 75 55
Table 4 – Recommended Pit Slope Design Parameters
Figure 8 – Open pits, Process plant and waste-rock storage looking towards the southwest
Note the close proximity of the processing plant and waste dump to the deposits to be mined, thus minimising land disturbance,
haulage distances and costs.

Page 11 of 57
7. Ore Reserves
White Rock engaged Mining Plus to undertake the PFS mining engineering study work including the
estimation of a maiden Ore Reserve. The Ore Reserve estimate consisted of an initial conversion of the
Mineral Resource block model to a mining block model in order to incorporate appropriate allowance
for mining dilution and ore loss factors, followed by the completion of open pit optimisation, the
development of an open pit mine design, and then mine scheduling and cost estimation.
The Ore Reserves for the Project are reported according to the Australasian Code for Reporting of
Exploration Results, Mineral Resources and Ore Reserves (JORC Code 2012 Edition). The Mineral
Resource was converted to Ore Reserves in consideration of the level of confidence in the Mineral
Resource estimate and reflecting the appropriate modifying factors. Mineral Resource estimates are
reported inclusive of those Mineral Resources converted to Ore Reserves. The Probable Ore Reserves
estimate is based on Mineral Resource classified as Indicated.
Table 5 presents a summary of the Ore Reserves on a 100% Project basis at a A$1,600/oz gold price. Ore
dilution of 6% and ore loss of 5% was assumed. The result saw a conversion of 85% of the Mineral
Resource to Ore Reserve.
Mt Carrington Project Ore Reserve Classification
Tonnes (Mt) Grade (g/t Au) Contained Gold (koz Au)
Proved - - -
Probable 3.47 1.43 159
Total Ore Reserve (0.58 g/t cut-off grade)
3.47 1.43 159
Table 5– Ore Reserve Estimate for the Mt Carrington Project – October 2017
Notes: 1. The Ore Reserve conforms with and uses JORC Code 2012 definitions 2. All figures are rounded to reflect appropriate levels of confidence. Apparent differences may occur due to rounding

Page 12 of 57
8. Metallurgy and Ore Processing
8.1 Metallurgical Test Work
The Mt Carrington resources consist of several discrete gold and silver polymetallic deposits in which the gold and silver mineralisation is generally associated with sulphides, mainly pyrite and also some base metal sulphides, notably sphalerite and chalcopyrite.
The gold-only deposits considered in this PFS report consist of a primary zone of quartz - jasperoid and quartz – based metal veins overlain by an oxide cap and a thin transition zone which has some extension to depth in fracture zones. The presence of cyanide consuming base metal species presents the main metallurgical challenge.
The metallurgical test work was carried out by ALS Metallurgy on four main composites intended to represent the main ore types likely to be mined and treated by the processing plant: Strauss, Kylo North, Kylo West Oxide and Kylo / Strauss supergene. Test work initially considered three processing routes:- flotation to a concentrate for sale, a flotation – concentrate cyanide leach route and a conventional cyanide leach by CIL flowsheet. Preliminary assessments concluded that the conventional CIL route offered the best overall economics based on up to 85% recovery at an acceptable cyanide consumption (below 2 kg/t).
The final metallurgical recoveries used in the Whittle pit optimisations and financial model are summarised below.
Ore Source Oxide (%) Transition (%) Primary (%)
Kylo West 95.5 80.0 82.5
Kylo North 95.5 80.0 83.0
Strauss 95.5 80.0 82.5
Table 6: Mineral Processing Recoveries by Ore Source and weathering type
Cyanide consumption under closely controlled conditions was found to range from 1.35 kg/t for oxide ore to 1.8 kg/t for primary and supergene ores. Recovery – cyanide consumption optimisation work will continue through the next phase of feasibility study work.
8.2 Ore Processing and Production
The processing plant will be designed at a nominal throughput of 1 Mtpa of fresh ore. The plant will be
designed to operate seven days per week at a nominal treatment rate of 124 dry tonnes per hour of
fresh ore.
Over the initial Gold First 4 ½ year mine life, approximately 4 Mt of ore will be processed at an average
grade of 1.4 g/t Au and 83% recovery to produce approximately 147,300oz recovered gold as dore.

Page 13 of 57
Figure 9: Quarterly Milling Production by Material
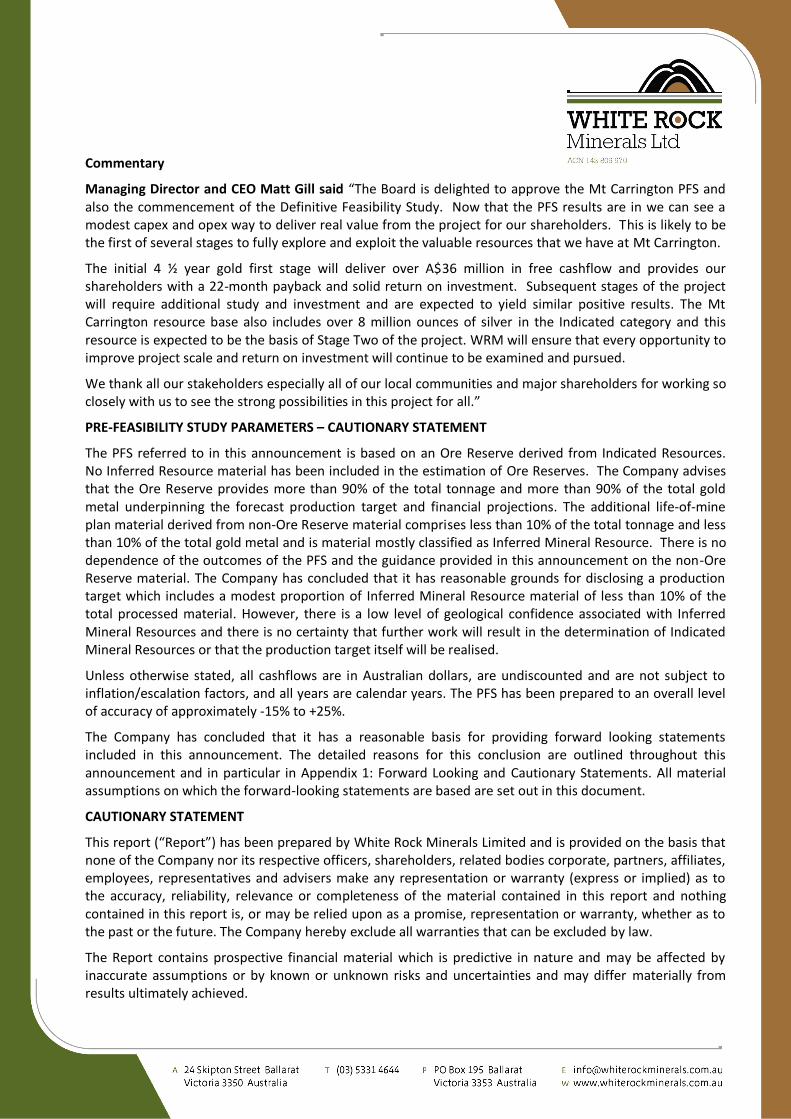
8.3 Process Plant Description
The processing plant design is based on conventional, well-proven processing technology following a processing route of:-
Primary crushing by a jaw crusher to a product size of P80 of 100mm direct feeding a sizing screen.
Sizing screen oversize and middlings feeding Secondary and Tertiary cone crushers respectively to a product size of P80 of 10mm.
Crushed fine ore storage bin with a live capacity of 200 tonnes.
Grinding using a single stage 3.5MW Ball mill and classification circuit to a product size of P80 of 75µm.
Leaching with cyanide and adsorption onto activated carbon using one pre-aeration tank followed by a six-stage carbon in leach (CIL) circuit, acid wash and pressure Zadra elution in separate columns.
Thermal regeneration of the barren carbon prior to its return to the CIL circuit.
Electrowinning the gold onto steel wool cathodes.
Smelting of the calcined steel wool cathodes to produce a final product of gold dore.
CIL tailings are treated using a cyanide detoxification circuit, prior to discharge into the tailings storage facility (TSF).
Reagents preparation and storage.
Water and air services.
A schematic outline of the process is shown below.
Page 14 of 57
Figure 10: Process Flowsheet

Page 15 of 57
The proposed processing plant layout reflects the sequential nature of the processing operations, with
ROM ore received at one end of the facility and gold doré bars produced in the gold room and tailings
disposal at the TSF. Figure 11 illustrates the proposed plant layout.
Figure 11: Process plant layout
To minimise capital expenditure and environmental impact, the process plant has been arranged to fit the natural ground contours, sit within the existing cleared footprint of the previous plant site, and maximise modularisation and off-site assembly.
Raw and process water will be sourced from either the existing Humphries Creek dam on the property or decant return water from the TSF via a system of overland pipelines and transfer pumps. Process water will also be received from containment ponds used to collect pit water and surface run-off.
Water services will also include potable water and fire-water services.

Page 16 of 57
9. Infrastructure, transport and services
9.1 Water Supply
There are several water sources on the mining lease as follows:-
Raw Water Supply 1ML tank - The existing Humphries Creek dam has a storage volume of approximately 750ML and is licensed to supply 50ML per annum of fresh water from Humphries Creek. There is an additional water license for 50ML/annum from Lake Talamini to cover process water requirements until decant water is available from the TSF.
Process Water Supply 1ML tank - Additional process water supply can be sourced from Lady Hampden pit which has a storage volume of approximately 150ML. Lady Hampden Pit will also be used to collect runoff water. A diesel-powered pump will be located at Lady Hampden pit to transfer water to the TSF or Process Water Tank.
TSF Decant return - It is expected that after the first 3 months of start-up, decant water will be available from the TSF.
In pit mining or dewatering - Mine water will be pumped to a sediment dam or the TSF so that sediment will be settled out prior to reuse in the process plant.
9.2 Power Supply
Power will be sourced from the local grid supply at 11kV and distributed via an HV switchyard located on the process plant boundary to the various plant areas including the process plant, warehouse, workshops and Mine Services area.
Total installed power for the processing plant is 6MW with a demand of 4.9MW.
9.3 Roads
The existing site entrance off the Cheviot Hills Road will be the main access point into the project
site. All main roads and bridges used for entering the site shall be checked in accordance with NSW
RMS requirements for construction road freight.
Road access will require regular maintenance to retain a trafficable surface during the construction
period. Borrow sites and other suitable materials for the road works have been identified.
9.5. Laydown Yard
A pre-existing contractor’s laydown yard for the storage of the process plant equipment is located
adjacent to the processing plant facility.
9.6 Accommodation
Adequate accommodation is available in the local township of Drake and surrounding towns (Casino
and Tenterfield) for both the temporary construction and permanent operations workforce.
Therefore, a village or camp is not required to be constructed to support project development.

Page 17 of 57
9.7 Light Infrastructure
In addition to the major items of power and water supply, there are some light infrastructure items
required which include the following:-
Single diesel fuel storage tank.
Single LPG bullet.
Buildings:
o Existing main site office complex for administration and training,
o Security turnstile entrance, public car park and offices,
o Security gatehouse, first aid hut and emergency response offices and equipment,
o Warehouse and reagents Storage,
o Fixed Plant Maintenance Workshop for equipment repair,
o Assay laboratory,
o Processing Plant Control Room,
o Crib Room and Ablutions.
Security fencing around active areas.
Light vehicle workshop.
Heavy Vehicle workshop.
Explosives workshop and magazine.
Survey observation and/or monitoring locations.

Page 18 of 57
10. Tailings Storage Facility and Water Management
10.1 Site Visit
ATC Williams (ATCW - a specialist consultancy providing engineering services and technical
advice on tailings management, waste management, geotechnical engineering and water
management) visited the Mt Carrington Tailings Storage Facility (TSF) for a walk-over inspection
to gain an understanding of the topography and existing features around the existing tailings
storages and to identify possible sources of material for future embankment construction.
The site visit highlighted the complex issues of near surface seepage, runoff from old workings,
waste rock dumps (WRDs) and the existing TSF. Historical acid mine drainage was evident from
the WRD to the east of the plant site in the adjacent Humphries Creek Catchment as well as to
the west in the TSF catchment. Historical acid mine drainage was also observed flowing from an
old adit near the Strauss Pit into Saw Pit Creek.
Much of the contaminated water potentially flowing into Saw Pit Gully from the WRD has been
diverted into the TSF and as a consequence, it is observed that wildlife has returned to the gully.
Seepage from the TSF embankment and water flowing from the standpipe piezometer
downstream of the TSF and the Toe Dam was observed.
10.2 Options Study
A Tailings Storage Facility (TSF) Options Study was completed by ATC Williams in July 2017. A raise of
the existing TSF wall with an extension to the east was selected as the preferred option at that time.
Construction was to be staged with downstream raises.
10.3 Prefeasibility Design
10.3.1 Overview
Since completion of the Options study, the criteria and assumptions for the Prefeasibility Study of the
TSF have evolved. The TSF layout for the selected option has now been further developed into a pre-
feasibility study level based on the revised Life of Mine Plan for the Gold First stage.
10.3.2 Site Water Management
The TSF will provide storage for the site’s contaminated water and supply the required water for
processing. The site water management design adopted the following parameters:-
Runoff and inflows collected and pumped or directed to the TSF from:
a. Waste rock dumps and low-grade ore stockpiles
b. Plant site
c. ROM pad
d. Historic acid mine seepage collection from the Humphries Creek catchment
e. Pits: Kylo, Kylo North, Strauss, Lady Hampden
Return water capacity of 4,110 m3/day (TSF to plant),

Page 19 of 57
Water treatment capacity of 1,200 m3/day (prior to discharge),
Diversion drains with a capacity for 1 in 100 rainfall events, and
A sedimentation pond to be located downstream of the TSF embankment.
A high-level water balance indicated that for median and higher rainfall years there will be sufficient
return water for processing. During high rainfall events the existing reverse osmosis water treatment
plant will be operated to discharge excess water.
10.3.3 Tailings Storage Facility Design
The TSF design has adopted the following design parameters and assumptions:
Average throughput of 1 Mtpa
An initial Life of Mine of 4 ½ years
Tailings settled density of 1.1 t/m3
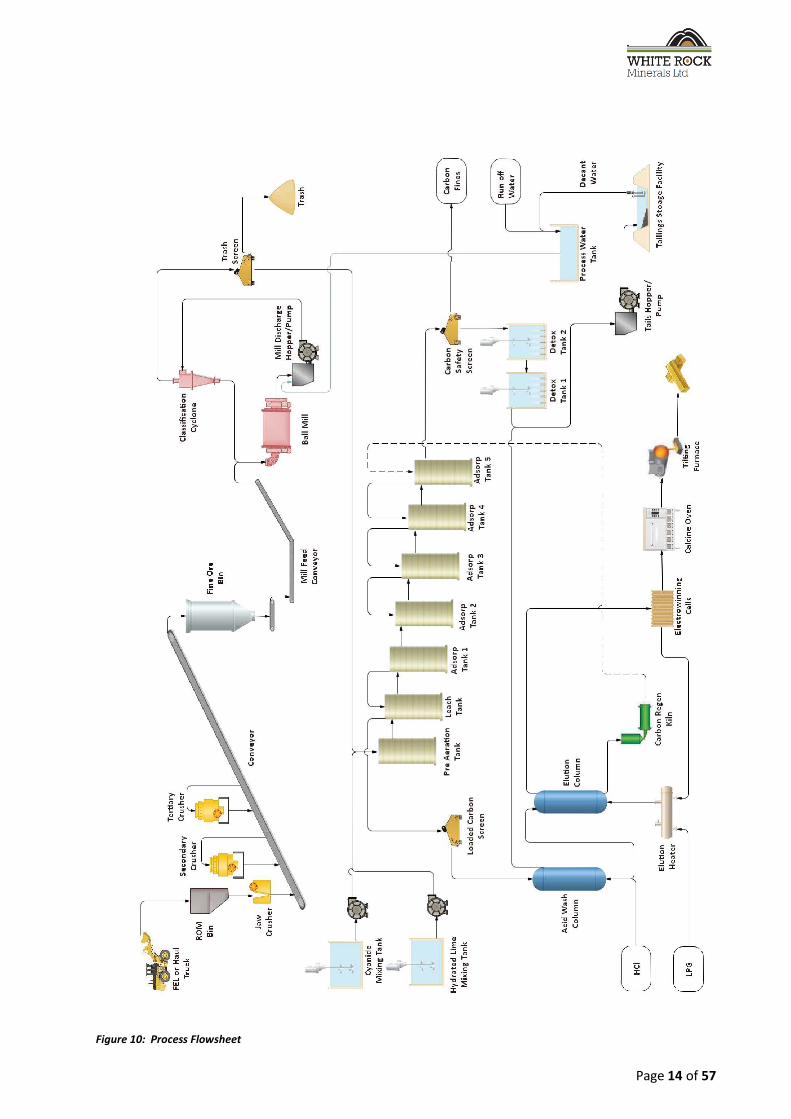
The new TSF will be constructed encompassing the existing TSF as shown in Figure 12 below. The
facility has been designed as a 2-stage structure, with the Stage 1 embankment to a crest level of RL
509.5 m providing storage for 2.4 Mt and Stage 2 to a crest level of RL 514.5 m providing for a further
1.6 Mt.
The pre-feasibility design provides for:
A new separate embankment constructed downstream of the existing embankment; and
An emergency spillway to the north of the embankment.
The design adopts a zoned embankment with a bituminous geomembrane sealing system on the
upstream face. The embankment crest width is 10 m. Side slopes are 2:1 (Horizontal: Vertical) on the
upstream and downstream side.
It is anticipated that construction materials will be sourced from existing waste rock stockpiles or from
waste rock produced during ongoing mining operations. The bituminous geomembrane will be sourced
from off-site.
The design criteria for the TSF is based on the NSW Dam Safety Committee Guidelines supplemented by
accepted industry guidelines.
Tailings deposition will be undertaken from the northern and western sides of the TSF and the decant
pond will form at the eastern end adjacent to the embankment, where a decant water return system
will be located. Tailings delivery and water return pipelines will be installed between the plant and the
TSF.
It is proposed that the closure concept for the TSF be a modified wet cover, subject to NSW Dam Safety
Committee, the Departments of Planning and Environment (DPE) and Primary Industries (DPI) and EPA
approvals. This means the tailings surface will be covered with 2m of thick rockfill below the spillway
invert level. The rockfill will remain saturated to minimise oxidation of the tailings.

Page 20 of 57
10.4 Cost Estimate
Cost estimates have been based on assumed rates derived from similar projects carried out by ATCW as
well as liaison with suppliers.
Total Capital Cost for each of the embankment stages is presented in Table 7.
Table 7 – TSF Summary Capital Cost Estimate (+/- 30%)
Stages Cost (M$)
Stage 1 Embankment 3.7
Stage 2 Embankment 2.4
Rehabilitation Cover 2.5
Page 21 of 57
Figure 12 – Mt Carrington Site Layout and drainage design
Page 22 of 57
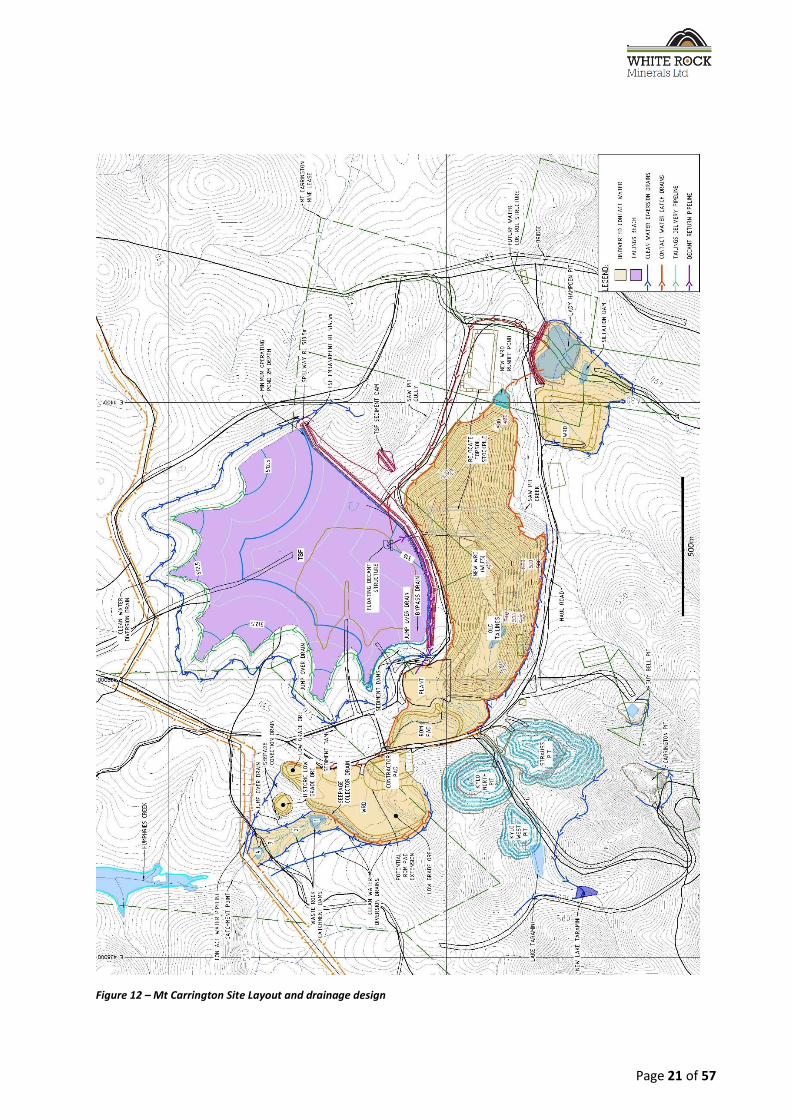
Figure 13 – Open pits, Process plant, TSF and waste-rock storage looking towards the north west

Page 23 of 57
11. Capital Expenditure
The capital cost estimate of A$ 35.7M represents costs for the overall Project development as at Q4 2017. The estimate includes direct costs for the establishment of open pit mine development, construction of the ore processing plant and the non‐process infrastructure, and indirect costs associated with the EPC contractors, Owner’s Team, consultants, operational readiness and pre‐production operations. An amount of A$4M has been included as Project contingency.
The capital cost estimate has been developed with inputs from Mining Plus, Mincore, ATC Williams and the Owner’s Team. The Project Schedule indicates a 13‐month construction and commissioning timeframe.
The accuracy of the estimate is ‐15% to +25% and is in line with a Class 4 estimate under the AACE International Cost Estimate Classification guidelines.
Escalation to project completion is excluded from the capital estimate. No allowances have been made for interest during construction.
The capital cost estimate includes:
Direct costs of the Project development.
Indirect costs associated with the design, construction and commissioning of the new facilities.
Owner’s cost associated with the management of the Project from design, engineering and construction up to the handover to operations and Project close‐out.
Insurance and operating spares, and first fills.
Costs associated with operational readiness and pre‐production operations.
Growth allowance on quantity, pricing and unit rates variance.
Contingency on project scope definition and risks.
The costs are summarised by major area in Table 8. The material quantities and unit cost estimates
were developed from engineering drawings and detailed equipment lists, estimates and calculations at
the level required for a PFS, and validated against estimates from similar sized projects.
Area A$M
Direct
Process Plant 20.2
TSF 3.7
Site Preparation and Infrastructure 3.0
Mining Facilities 1.1
Subtotal Direct 28.0
Engineering and Contractors (Indirect) 3.7
Contingency (Process Plant) 4.0
Total Capital Costs 35.7
Table 8: Summary of Total Capital Costs by Major Area as at Q4, 2017 (excluding escalation and interest)

Page 24 of 57
12. Operating Expenditure The total estimated Life of Mine (LoM) operating cost for mining, processing, transport and refining, is approximately A$158.9 million; and inclusive of General & Administrative costs, royalties and rehabilitation fund levy is A$182.9 million. Refer to Table 9 and Figures 14 & 15 for a summary of the operating costs.
Area LoM Cost (A$M)
LoM Cost (A$/t Processed)
LoM Cost (A$/Oz)
Mining 72.5 18.33 492
Processing 86.1 21.77 584
Transport and Refining 0.3 0.08 2
Operating cash costs 158.9 40.18 1,078
General and Administration 14.7 3.71 99
Royalties 5.8 1.46 39
Rehabilitation expense 3.5 0.88 23
Total Cost 182.9 46.23 1,239
Table 9: Operating Expenditure Summary Note: * General and Administration costs in the table are site only. All numbers are rounded to reflect appropriate levels of confidence. Apparent differences may occur due to rounding.
12.1 Mining Operating Cost
The mining operating cost estimate has been developed by Mining Plus and the Owner’s Team. Mining costs assume a mining contractor operation with site-based Owner management. The largest component of costs is for on-site personnel. Equipment ownership, fuel, tyres, maintenance and explosives will be included in the proposed mining contract. Owner’s mining equipment and vehicles are planned to be obtained under a finance lease which is included in operating costs over five years. Costs for mining in the pre-operating phase have been assumed as an expense in the first period including during process plant commissioning. All waste mining is expensed in the period it is incurred.

Page 25 of 57
Figure 14 – Mining costs A$/t

Page 26 of 57
12.2 Processing Operating Cost
The processing operating cost estimate has been developed with inputs from vendors, chemical suppliers, Mincore and the Owner’s Team.
Figure 15 – Processing costs $/t
13. Community Relations Throughout the ownership of the Mt Carrington Project, White Rock has maintained a strong platform
of engagement with the community. The level of community engagement has been dictated by the level
of activity on site and has included community sponsorship and support of community initiatives.
Engagement to inform and consult with the community has included local coffee and chat sessions in
Drake, Community Open Days and site tours, educational school and university site visits, articles in
local newsletters and regional newspapers, circulation and posting of project fact sheets and hosting of
Tenterfield Council, State MPs and the Native Tile claimants on site tours.
At the beginning of the PFS process, White Rock engaged leading community consultants, Umwelt, to
assist in developing a Social Impact Assessment (“SIA”) and Community Engagement Strategy that will
form an integral part of the Development Consent process. Ultimately the strategy aims to work with
stakeholders and the community to identify ways to enhance the positive and minimise the negative
impacts of the Project.
The Mt Carrington Project is located close to the township of Drake (pop.395) within the Tenterfield
Local Government Area (“LGA”) (pop. 3,966). The township of Tabulam (pop.644) in the Kyogle LGA
(pop. 9,228) is only 13km east of Drake, and where there is an Aboriginal community that is part of a
Native Tile Claim over the entire area (NNTT #NC11/5). Drake is approximately equidistant from the
larger regional townships of Tenterfield and Casino (pop. 10,558), which falls in the Richmond Valley
LGA (pop. 22,037).

Page 27 of 57
14. Environment and Permitting Mining Lease
The Mt Carrington Project is wholly contained within the historic Mining Leases and a surrounding
Exploration Licence that are 100% owned by White Rock. The main areas of disturbance (the pits,
processing plant and TSF) sit within the Mining Lease where past mining and forestry practices have
already created a disturbed landscape. The Mining Lease will require an extension to include some
additional areas such as the expanded tailings storage facility. In addition, a new Mine Operation Plan
will require approval on granting of Development Consent before mining operations can commence.
Native Title
One Native Title claim is registered over the area (NNTT #NC11/5). No Native Title negotiations have
commenced.
Land Ownership
The majority of the central Mining Leases and the area of the Exploration Licence subject of this PFS are
located in Girard State Forest SF303. Access and compensation agreements for this land are in place
with Forests NSW. The periphery of the central Mining Leases to the east includes private freehold and
Crown Land. Compensation agreements for these areas are yet to be put in place.
Environmental
White Rock has engaged environmental consultants RW Corkery to assist in managing the
environmental permitting process. Since 2010 White Rock and a range of specialist environmental
consultants have been collecting a variety of environmental baseline data that will assist in the
preparation of the Preliminary Environmental Assessment (“PEA”) and ultimately the Environmental
Impact Statement (“EIS”) required for Development Consent. The majority of long lead time baseline
studies are near complete and include air quality, surface water, groundwater, terrestrial & aquatic
ecology, meteorology and rock materials characterisation. White Rock is continuing to progress studies
and approval processes to manage or mitigate the risks that have been identified for the Project to date
and expects to commence the formal approvals process in the near future.
Of the studies completed to date, waste rock characterisation and terrestrial ecology have the greatest
impact on mine planning and management of the operation. Waste rock characterisation has identified
components of the waste rock which are potentially acid forming (PAF) and these will require
appropriate mine scheduling and waste rock dump design to negate potential environmental impacts.
The data obtained to date indicates that the PAF can be effectively managed within the current waste
dump footprints. The mine plan also incorporates the removal of acid generating rock from the historic
waste rock dumps by prioritising the rehandling and processing of this material at the commencement
of operations. Further detailed rock characterisation test work is planned and this will inform mine
scheduling and design work in further project stages.
Terrestrial ecology (flora and fauna) studies have been conducted across the project, and at this stage,
no Endangered Ecological Communities currently listed under either the NSW Biodiversity Conservation
(BC) Act or the Federal Environment Protection and Biodiversity Conservation (EPBC) Act have been
identified within the Project Site. Similarly, no flora species currently listed as threatened under either
act have been recorded within areas likely to be impacted by the project. A number of threatened fauna
species have been recorded within the expanded project zone and one threatened species has been
noted within the potential impact zone associated with the Gold First stage of the project. This species
is the Giant Barred Frog and, while relatively widespread in the project area, it has been recorded in the
gully downstream of the existing and proposed TSF. Investigations into this species are ongoing with a
view to developing a management strategy and plan which will minimise any impacts on the frog
habitat and on the project.

Page 28 of 57
15. Economic Evaluation
Mannerim Partners was commissioned to undertake the project financial modelling for the PFS. All
Owner’s Team expenditures relating to the studies prior to January 2019 are treated as sunk costs and
that includes the costs of all prior studies. Table 10 below highlights the key financial inputs and
assumptions applied in the project economic analysis. All assumptions will be reviewed in the course of
subsequent stages of study.
Parameter Units Assumption
Gold Price US$/oz 1,275
Exchange rate AUD:USD 0.75
Accumulated Tax losses A$M 21*
Royalties % 4.0**
Corporate Income Tax Rate % 30
Diesel Price (after rebate) A$/litre 0.70
Table 10 – Key Financial Assumptions
Notes:
* Estimated tax losses at the end of December 2017
** Royalty percentage as per NSW taxation rules on Ad Valorem basis less allowable deductions.
The financial analysis was undertaken using a US$1,275/oz Gold Price, approximately the mid-point of
the US$ Gold price over the last five years, and a A$:US$ exchange rate of 0.75. The Gold price is
assumed to be constant over the LoM plan. Table 11 below summarises the key financial outcomes.
Result Unit PFS
Gold produced Koz 147,311
Gross revenue A$M 250.43
Cash operating costs (C1) A$/oz 1,078
All-in Sustaining Costs (AISC) A$/oz 1,236
Development capital cost A$M 35.7
Sustaining capital cost A$M 2.75
Development capital cost per ounce (Dev. Capex/Gold produced) A$/oz 242
Payback period Months 22
Project LOM Operating costs A$M 182.9
Free cash flow (before tax) A$M 36.7
IRR % 34
Table 11 – Summary of PFS Financial Outcomes
Notes:
1. All figures are rounded to reflect appropriate levels of confidence. Apparent differences may occur due to rounding.
2. C1 = mining and processing operating expenditure + transport and refining costs.
3. AISC = C1 + G&A + Royalties + sustaining capital.
4. Development costs are expressed in 2017 Q4 real terms. The forecast capital costs including potential escalation to
project completion (Q4 2019) is estimated at A$35.7M.
5. The capital cost estimate is within accuracy of -15%/ +25%.
6. Total estimated costs to sustain the assets over the life of the project.
7. Gold price assumption US$1,275/oz.
8. AUD:USD 0.75.

Page 29 of 57
16. Conclusions and recommendations
The Board has approved the Stage One PFS outcomes which indicate a technically sound and
financially viable Project for progression to a Definitive Feasibility Study (DFS) followed by a
Final Investment Decision (FID), and the continuation of Environment Studies.
The Stage One PFS case for the project consists of the development of the gold mine open pits
(Kylo North, Kylo West and Strauss), with a conventional CIL process plant and associated
infrastructure using a grid power supply, for a 1 Mtpa throughput rate, over an initial 4 ½ year
“Gold First” project life.
Potential to further optimise and enhance the financial outcomes of the Project will be assessed
during the Definitive Feasibility Study stage.
The silver dominant resources, containing some 8.3M ounces in the Indicated category (refer
ASX announcements 13 February 2012 & 20 November 2013) is the subject of further
mineralogy, metallurgical test work and concentrate sales discussions. Mining of this silver
resource constitutes Stage Two of the Mt Carrington project.
Expenditure to further unlock the considerable exploration potential of the Mt Carrington
tenements is not included in the PFS.

Page 30 of 57
17. Next Steps and Further Work
The Board has determined that the Definitive Feasibility Study should be commenced, and that the
Project’s Environmental Studies continue towards final permitting, both subject to available funding.
Major components of the Definitive Feasibility Study (DFS) stage will be to confirm the mine and process
designs, mine schedule, infrastructure designs and final details necessary to confirm capital and
operating costs. The DFS will be led by White Rock’s management team.
Included in the DFS will also be further detailed ore and waste rock characterisation work including
further test work and geological interpretation. Following this work, the waste rock dump design and
mine schedule will be reviewed and updated as appropriate.
The team will also engage with potential contractors in the local area and region to confirm
construction and mining costs, and to assist with the project execution planning.
A further detailed review of the potential to produce Silver at Mt Carrington will also be undertaken.
This work will be done with the aim of delivering a low capex and low opex plan to mine and produce
Silver either alongside planned gold production or as a subsequent stage of operations. Maximising the
use of the already built and paid for Gold First facilities, plant, equipment and infrastructure is expected
to deliver a robust and valuable Stage Two Silver operation.
Recommended next steps
Key next steps and expected timing are as follows;
1. Q1 2018 – Commence “Gold First” Definitive Feasibility Study (DFS)
2. Q2 2018 – Continue/accelerate the necessary environmental baseline studies towards
conclusion
3. Q3 2018 - Complete “Gold First DFS”
4. Q3 2018 – Commence the Social Impact Assessment and Community Engagement process
5. Q3 2018 – Lodge the project’s Preliminary Environmental Assessment (PEA)
6. Q2 2019 – Complete the necessary baseline studies and Lodge the project’s Environmental
Impact Statement (EIS)
7. Q3 2019 – Conclude financing arrangements & achieve Financial Investment Decision (FID)
8. Q3 2019 – Assess and design all long-lead items and consider placement of critical long-lead
items
9. Q4 2019 – Achieve environmental and project permitting – NSW Development Consent
10. Q4 2019 – Commence detailed contract negotiations for supplies and service for construction
and operations
11. Q4 2019 – Commence detailed engineering, procurement and site establishment
12. Q1 2020 – Commence construction
13. Q4 2020 – First Gold production

Page 31 of 57
Schedule Summary
Assuming a start date for detailed engineering of Q4 2019, and early EPC contractor engagement, a construction completion date of Q3 2020 with first gold pour Q4 2020 is achievable. This equates to a permitting and financing schedule of 24 months and an implementation time of 13 months.
Project Milestone Duration Start Date Q4, 2019 Q1, 2020 Q2, 2020 Q3, 2020 Q4, 2020
Permits and Approvals 24 months PEA Q3 2018 EIS Q2 2019
D/ment Consent
Engineering & Procurement 7 months Month 1
Additional Technical Info (Geotechnical, Met Testwork)
3 months Month 3
Detailed Engineering 4 months Month 3
Bid Review & Award 6 months Month 3
Equipment Manufacture and Delivery
7 months Month 6
Freight and Clearance
Construction 9 months Month 7
Commissioning & 1st Gold Production
1 month Month 13
Figure 16: EPC Summary Schedule
Further Work
A number of activities will be necessary in the DFS stage:-
1. Completion of the metallurgical test work to support the detailed design,
2. Progress mineralogy and metallurgical test work on the silver deposits,
3. Further analysis of the low-grade ore stockpile,
4. Additional detailed ore and waste rock characterisation,
5. Additional work on the final TSF design and site water management requirements,
6. Environmental work necessary to meet NSW regulatory requirements.
18. Exploration
Gold – Silver
The majority of exploration completed by the Company at Mt Carrington has focused on the Mineral
Resources with near term development potential. These Mineral Resources have undergone extensive
drilling to expand and upgrade the Mineral Resources available for development studies, with those at
Kylo and Strauss the subject of this report. Additional exploration of new targets has been delayed
subject to a successful feasibility study outcome.
Mt Carrington is a historic mining centre with a number of intermediate sulphidation epithermal gold-
silver deposits characterised by relatively high levels of base metals (copper-lead-zinc) mineralisation.
Mineralisation is hosted within the Drake Volcanics, a NW-trending 60km x 10km Permian bimodal

Page 32 of 57
volcano-sedimentary sequence. The mineralisation occurs in a range of styles including fissure, sheeted
and stockwork veins and breccias, as well as stratabound replacement and sulphide disseminations. The
host rocks include coherent andesite and rhyodacite flows, as well as andesitic volcaniclastic lithologies.
The majority of mineralisation is located within the Drake Quiet Zone, a 20km diameter circular feature
of low magnetic signature. Detailed mapping by White Rock has confirmed that the Drake Quiet Zone is
a large scale caldera structure. Calderas are a common setting for a range of epithermal mineralisation
styles from low-grade disseminated bulk tonnage deposits through to high grade vein hosted deposits.
The Mt Carrington Mining Leases are enveloped by a large Exploration Licence with demonstrated
potential for epithermal and intrusion-related gold, silver and copper mineralisation (Figure 5).
Target generation work by White Rock has
identified 26 prospects within and proximal to
the central Mining Leases (Figure 17) and a
further 22 regional prospects on EL 6273. Each
of these prospects has been ranked according
to prospectivity criteria as Tier A, B or C.
White Rock plans to initially target the Tier A
prospects on the central Mining Leases that
offer the best potential for high grade gold
mineralisation. At All Nations, Pioneer,
Carrington and Guy Bell there are seven
structural targets with shallow historic drill
intersections that can be immediately
followed-up with drilling. Each of them has the
potential to add significantly to the Resource
base with some of the intersections tantalising
if they are the outer edge of better formed
veins e.g. 0.85m @ 18.2g/t Au from 76.5m and
0.4m @ 17.2g/t Au form 96.6m (ANDD003)
(refer ASX Announcement 28 September 2009
by Rex Minerals Ltd).
Figure 17: Mt Carrington central Mining lease exploration targets.
Copper
The Mt Carrington Resource base on the central Mining Leases comprises a number of epithermal gold-
silver deposits as shown in Figure 18. Lateral and vertical metal zonation of these deposits is evident
whereby distal silver-rich deposits (e.g. Lady Hampden) occur in the north-east of the leases, progressing
westward to Au-Zn dominant deposits (Kylo & Strauss) to Au-Cu deposits (Mt Carrington). Further south
and west of Mt Carrington are several more discrete zones of quartz-chalcopyrite (copper) veins at the
All Nations, Pioneer and Gladstone Hill prospects. The veins mark the potential progression from deeper
porphyry copper-gold mineralisation to shallow epithermal gold-silver mineralisation, and may provide a
vector to hidden porphyry copper deposits.
The widespread occurrences of near surface copper mineralisation in the Drake Volcanic Caldera at Mt
Carrington have been prospected and explored in the region for over a century. The concept of a deep
seated porphyry copper system as the source of the near surface secondary copper was developed by
White Rock in conjunction with external consultants. The shallow copper mineralisation at Mt Carrington
displays a clear metal zonation and distinction from the adjacent gold and silver deposits. Importantly
there are also strong indications that a primary intrusive mineralising source may exist at depth below

Page 33 of 57
the secondary copper ‘leakage’ observed at surface and in shallow drilling. Historic drilling that targeted
copper has been restricted to less than 400 metres depth from surface, with the majority of historic
holes less than 100 metres depth. In February 2015 White Rock completed a deep penetrating, electrical
geophysics ‘MIMDAS’ survey to better define the electrical response of alteration from 300m to 1,000m
depth prior to finalising drill hole locations for testing the porphyry copper gold concept.
The MIMDAS survey revealed a number of new large and robust IP anomalies (Figure 19). The data
indicated a strong plausible link between the known near surface secondary copper mineralisation at the
All Nations and Gladstone Prospects on the central Mining Leases, and the main chargeability anomaly
to the west on the adjacent Exploration Licence. Several smaller discrete anomalous responses were also
observed at shallow depths beneath Gladstone and All Nations and to the immediate west (ASX
Announcement 13 March 2015). These anomalous responses were interpreted to represent possible
sulphide alteration outwards from a copper porphyry source.
First pass drilling was completed on three of the geophysical IP anomalies. Drilling confirmed that an
extensive zone of sulphide alteration encompasses the western copper-gold zone, paving the way for
further exploration of these targets (ASX Announcements 9 June 2015 & 30 June 2015). The alteration is
interpreted to be part of a large halo of pyrite-illite-silica alteration that encompasses a number of high
level intrusive volcanic bodies, including porphyries, within an extensive and significant hydrothermal
system. This style of alteration is typically observed elsewhere within the outer and upper portions of a
mineralised copper gold porphyry and/or intrusive related gold system. Importantly, the first clear
porphyry ‘host rock’ unit was intersected. Zones of gypsum pyrite veining and epithermal quartz veining
were also intersected at depths that show the epithermal mineralisation range is likely to extend well
beyond the shallow limits previously known. Prior to this drill program there had been no drilling into
any of these targets, or of this depth on the project. These drill holes provide first hand evidence that
what was already a large system is now shown to extend beyond 800m depth and over 1,000m further
west than previously mapped.
The potential for significant copper mineralisation remains an exciting target at Mt Carrington. White
Rock is now working towards a more efficient approach in isolating the vectors towards copper
mineralisation, through a PhD project that commenced in September 2016 with the University of New
South Wales.
Based on the original observations from historic drilling, the surface geochemical zonation and the
observations from the MIMDAS geophysics and subsequent drilling, the immediate vectors point
towards a source of copper mineralisation directly below the All Nations and Gladstone prospects. In
addition the MIMDAS data suggests that the IP anomalies are open at depth to the west, and both north
and south.

Page 34 of 57
Figure 18: Location of deep porphyry copper target on the Mt Carrington central Mining Leases. There is a broad zonation
from distal silver mineralisation at Lady Hampden and Silver King in the east, to the proximal gold mineralisation at Kylo,
Strauss and Guy Bell, and the historic copper occurrences at Gladstone, All Nations, Carrington and Pioneer interpreted to
represent the surface expression of structural controls to a copper porphyry mineralised source at depth.
Figure 19: Vertical projection of completed drill holes on MIMDAS IP chargeability cross sections - Line 1 (1400N) and Line 2
(1100N). High chargeable response in pink, low response in blue.

Page 35 of 57
Appendix 1 – Forward-Looking and Cautionary statements
Some statements in this report regarding estimates or future events are forward‐looking statements.
They include indications of, and guidance on, future earnings, cash flow, costs and financial
performance. Forward‐looking statements include, but are not limited to, statements preceded by
words such as “planned”, “expected”, “projected”, “estimated”, “may”, “scheduled”, “intends”,
“anticipates”, “believes”, “potential”, “could”, “nominal”, “conceptual” and similar expressions.
Forward‐looking statements, opinions and estimates included in this report are based on assumptions
and contingencies which are subject to change without notice, as are statements about market and
industry trends, which are based on interpretations of current market conditions. Forward‐looking
statements are provided as a general guide only and should not be relied on as a guarantee of future
performance. Forward‐looking statements may be affected by a range of variables that could cause
actual results to differ from estimated results, and may cause the Company’s actual performance and
financial results in future periods to materially differ from any projections of future performance or
results expressed or implied by such forward‐looking statements. These risks and uncertainties include
but are not limited to liabilities inherent in mine development and production, geological, mining and
processing technical problems, the inability to obtain mine licenses, permits and other regulatory
approvals required in connection with mining and processing operations, competition for among other
things, capital, acquisitions of reserves, undeveloped lands and skilled personnel, incorrect assessments
of the value of acquisitions, changes in commodity prices and exchange rate, currency and interest rate
fluctuations, various events which could disrupt operations and/or the transportation of mineral
products, including labour stoppages and severe weather conditions, the demand for and availability of
transportation services, the ability to secure adequate financing and management's ability to anticipate
and manage the foregoing factors and risks. There can be no assurance that forward‐looking
statements will prove to be correct. Statements regarding plans with respect to the Company’s mineral
properties may contain forward‐looking statements in relation to future matters that can only be made
where the Company has a reasonable basis for making those statements. This report has been
prepared in compliance with the JORC Code (2012) and the current ASX Listing Rules.
The Company believes that it has a reasonable basis for making the forward‐looking statements in this
report, including with respect to any production targets and financial estimates, based on the
information contained in this report and in particular:
(a) The PFS which was completed by independent engineering firms, Mining Plus, Mincore and ATC
Williams and additional consultants, together with White Rock’s Project Development Team under the
direction of the Study Manager Alan Riles and White Rock CEO, Matt Gill B.Eng (Hons, Mining),
M.Eng.Sc., FAusIMM, GAICD. As is normal for this type of study, the PFS has been prepared to an overall
level of accuracy of approximately ‐15% to +25%.
(b) The Company has a gold Mineral Resource Estimate for the Mt. Carrington Resource of 4.5 Mt at 1.5
g/t Au for 210,000 oz (at a 0.58 g/t Au cut‐off grade) of which 90.6%, being 4.08 M at 1.4 g/t Au for
188,000 oz, is classified in the Indicated Mineral Resource category under the JORC Code (2012).
(c) The Mt. Carrington Mineral Resource was estimated by Mr Richard Buerger of Mining Plus, Victoria
Australia in September 2017.
(d) Metallurgical test work, consistent with that required for this level of study, was carried out by ALS
Metallurgical Laboratories in Burnie Tasmania, and this formed the basis for estimates of metallurgical
recoveries carried out by independent consultant Mr Alan Riles. The test work resulted in gold
recoveries ranging from 80-85% as a function of cyanide addition rates, with the study average of 83%

Page 36 of 57
subject to further optimisation in the next phase. This range of data was used in the analysis for the
study. Mr Riles holds a Bachelor of Metallurgy from the University of Sheffield, UK and a Masters in
Economic Geology from the University of Tasmania. He is Member of the Australian Institute of
Geoscientists (MAIG). Mr Riles was a consultant to the Company during this Study, which included a
review of the previous scoping study. Mr Riles consents to the inclusion in this report of the matters
based on his information in the form and context in which it appears.
(e) The mine planning and scheduling for the 1.0 Mtpa production estimate was supervised by Mr Colin
Mc Vie and Mr John Battista (Mining engineers with considerable mine planning and operations
experience and Members of the Australasian Institute of Mining and Metallurgy) utilising the Whittle
Optimisation software (for open pit mine optimisation) and various mine planning and scheduling
software (for open pit mine planning). More than 90% of the mining inventory is in the Probable Ore
Reserve category, accounting for more than 3.5 years of the 4.3 years of mine life.
(f) Mincore prepared the detailed process flowsheet based on metallurgical test work.
(g) Geotechnical Engineering has been completed by PSM using modern geotechnical techniques and
methods, and based on test work consistent with this level of study. PSM are industry recognised
experts in the field of mining geotechnical engineering.
(h) The Company believes that the investigations and studies carried out on the process flowsheet and
the mine planning for this Study meet or exceed what would normally be expected for a PFS.
(i) The Company is confident that there is a reasonable probability that it will continue to increase the
mineral resources at the Mt Carrington Project through exploration to extend the mine life past what is
currently assumed in the PFS. Silver only resources at White Rock and Lady Hampden have not been
contemplated in this Gold First PFS. Additional prospects exist within the White Rock Mt. Carrington
mineral licences held by the Company that offer good potential for additional resources.
(j) The Mt Carrington project’s positive technical and economic fundamentals provide a platform for the
Company to advance discussions with potential strategic partners and traditional financiers. Continued
support from key institutional shareholders and strategic partners, current market conditions and an
encouraging outlook for the global gold market enhance the Company’s view of the fundability of the
Mt Carrington Project. The Board is confident the Company will be able to finance the Mt Carrington
Project through a combination of debt and equity or strategic partnerships.
In this regard, it should be noted that one of the Company’s largest shareholders – Cartesian Royalty
Holdings (“CRH”) - has provided a binding conditional term sheet in connection with a proposed two-
phase financing package for the Company to develop its Mt Carrington project to full commercial
production (refer ASX Release “WRM Signs Transformational Financing Package” dated 27 June 2016).
The second phase contemplates a future streaming financing of US$19 million in return for a share of
gold and silver production to fund working capital and the construction and commissioning of White
Rock's Mt Carrington Project to reach commercial production. The transactions contemplated by the
term sheet are subject to various conditions as set out in more detail in the ASX Release.
(k) White Rock’s Board and Management team includes:-
Chairman, Mr Brian Philips, AWASM (Mining), FAusIMM, C Eng, a qualified Mine Surveyor and
mining industry professional with more than 45 years international corporate and mining
experience,
Non-Executive Director Mr Ian Smith, B.E (Hons, Mining), BF in Admin, FIEAust, FAusIMM,
MAICD, a Mining Engineer with more than 40 years mining, development and corporate
leadership experience,
Non‐Executive Director Mr Peter Lester, B.E (Mining), MAusIMM, MAICD, a Mining Engineer
who has over 40 years extensive mining operational, project development and business
development experience primarily with dynamic international mining companies,

Page 37 of 57
CEO and Managing Director Mr Matt Gill, B.Eng (Hons, Mining), M.Eng.Sc., FAusIMM, GAICD, a
Mining Engineer, who has more than 35 years of experience in the mining industry, the last 15
years at senior and executive management level in several Gold mining companies,
Non-Executive Director Mr Jeremy Gray, B.C (Hons, Finance), who has more than 23 years of
experience in the Global Finance industry, Project Financing, Development and Execution, and
Exploration Manager Mr Rohan Worland, is a geologist with 25 years exploration experience
including 14 years with the Normandy and Newmont groups. He has extensive experience in a
variety of gold deposit styles in Australia, North and South America and New Zealand.
The Board and Management are well qualified and experienced to deal with any funding and project
development challenges as they occur. In addition, the current state of the mining professional labour
market is such that expert specialist input, when required, is available in Australia and can be sourced
on a part‐time or full‐time basis.
(l) The Study is based on the assumption that all gold produced will be refined at and sold to the Perth
Mint, a statutory authority of the Government of Western Australia. The gold market is a highly liquid
international market with no need for offtake agreements.
PREVIOUSLY REPORTED INFORMATION
This announcement contains references to exploration results and Mineral Resource estimates, all of
which have been cross-referenced to previous market announcements by the Company. The Company
confirms that it is not aware of any new information or data that materially affects the information
included in the relevant market announcements and in the case of estimates of Mineral Resources, that
all material assumptions and technical parameters underpinning the estimates in the relevant market
announcement continue to apply and have not materially changed.
Background relating to earlier studies at the Mt Carrington Project can be found in ASX announcements
as follows:
2012 – ASX Release 31 July 2012 – Mt Carrington Gold-Silver Scoping Study
2014 – ASX Release 16 September 2014 – Updated Gold Focussed Scoping Study
2016 – ASX Release 29 March 2016 – Update September 2014 Scoping Study
2016 – ASX Release 20 October 2016 – Update 2014 Scoping Study
2017 – ASX Release 9 October 2017 – JORC 2012 Mineral Resource
These announcements are available at the Company’s website www.whiterockminerals.com.au.

Page 38 of 57
Appendix 2 – Competent Persons
The information in this report that relates to process engineering design work and costing was compiled
under the guidance of professional engineers with membership status of the Australasian Institute of
Mining and Metallurgy (AusIMM) and the Institute of Engineers Australia who qualify as Competent
Persons as defined in the 2012 Edition of the ‘Australasian Code for Reporting of Exploration Results,
Mineral Resources and Ore Reserves’. This was supervised by Alan Riles and carried out by Mincore
(process engineering), Pitt & Sherry (metallurgical test work) and ATC Williams (TSF design and costing).
The information in this report that relates to Ore Reserves is based on information compiled by Colin
McVie and John Battista of Mining Plus. Mr McVie is a Competent Person who is a Member of the
AusIMM and Mr Battista is a Competent Person who is a Member and Chartered Professional of the
AusIMM. Both Mr McVie and Mr Battista have sufficient experience that is relevant to the style of
mineralisation and type of deposits under consideration and to the activity currently being undertaken
to qualify as Competent Persons as defined in the 2012 Edition of the ‘Australasian Code for Reporting
of Exploration Results, Mineral Resources and Ore Reserves’. Mr McVie and Mr Battista both consent to
the inclusion in this report of the matters based on his information in the form and context in which it
appears.


APPENDIX 3: JORC Code 2012 Table 1 Estimation and Reporting of Ore Reserves The Company has relied upon the previously reported information in the ASX Announcement of 9 October 2017 in respect of the matters related to sections 1, 2 and 3. (Criteria listed in section 1, and where relevant in sections 2 and 3, also apply to this section.)
Criteria JORC Code (2012) Explanation Commentary
Mineral Resource Estimate for conversion to Ore Reserves
Description of the Mineral Resource estimate used as a basis for the conversion to an Ore Reserve
The Ore Reserve Estimate is based on the results of a revised Mineral Resource Estimate for Strauss and Kylo deposits completed by Mining Plus Pty Ltd (“Mining Plus”) as per the ASX announcement from White Rock Minerals on 9th October 2017, with the competent person being Mining Plus’s Richard Buerger. The Mineral Resource block model used for this project is the file Strauss-Kylo_1709_eng for the Strauss and Kylo deposits, also referred to as the updated Mineral Resource model of September 2017. This model has been deemed to be the most up to date representation of the geology at the Mt Carrington project by WRM, and data transfer of the resource block model to Mining Plus, was validated between the WRM and Mining Plus geology and mining teams during the commencement of this study. All geological information including the resource model completed by Mining Plus is available and was used as the basis of this mining study.
Clear statements as to whether the Mineral Resources are reported additional to, or inclusive of, the Ore Reserves
The Minerals Resources are reported inclusive of the Ore Reserves.

Page 47 of 57
Criteria JORC Code (2012) Explanation Commentary
Site Visits Comment on any site visits undertaken by the Competent Person and the outcome of those visits
Overall there have been a number of site visits over a significant period of time by both project personnel and also a WRM site maintenance team, so the site conditions are well understood. WRM have some personnel based on site as part of on-going care and maintenance activities for the project site, also supported by the WRM Corporate team and a team of specialised consultants. Site visits undertaken by the current project team as outlined below: Colin McVie & Mining Plus; • Mining Plus Manager Project Development conducted a site visit on the 21st & 22nd March 2017 as the Ore Reserve Competent Person in order to ensure the data used for the mining study matches the field observations. • Site visit involved detailed site tour of all areas, including proposed waste dump locations, and site layout considerations, and inspections of previous mining areas, waste dumps and other site activities including plant location, water management, and TSF. • While on-site discussions occurred with the geotechnical team and environmental lead to understand site specific items for consideration. • Other members of the Mining Plus team including a Project Administrator - Andrew Bales and Principal Resource Geologist - Richard Buerger (CP for Resources on this project) have also attended site visits.
Alan Riles - Riles Integrated Resource Management Pty Ltd Study Manager, metallurgy, processing operations, coordination of technical inputs visited site on March 20
th – 22
nd 2017 to conduct the following:-
General project setting and access considerations,
Detailed site tour of all facilities including existing pits and plant site, TSF and surface water management, general site topography and potential plant and infrastructure locations
Discussions with the geology team on deposit geology, mineralisation, geometallurgy and potential future ore-types
Inspection of core and discussions on observed mineralogy for selection of metallurgical test work composites.
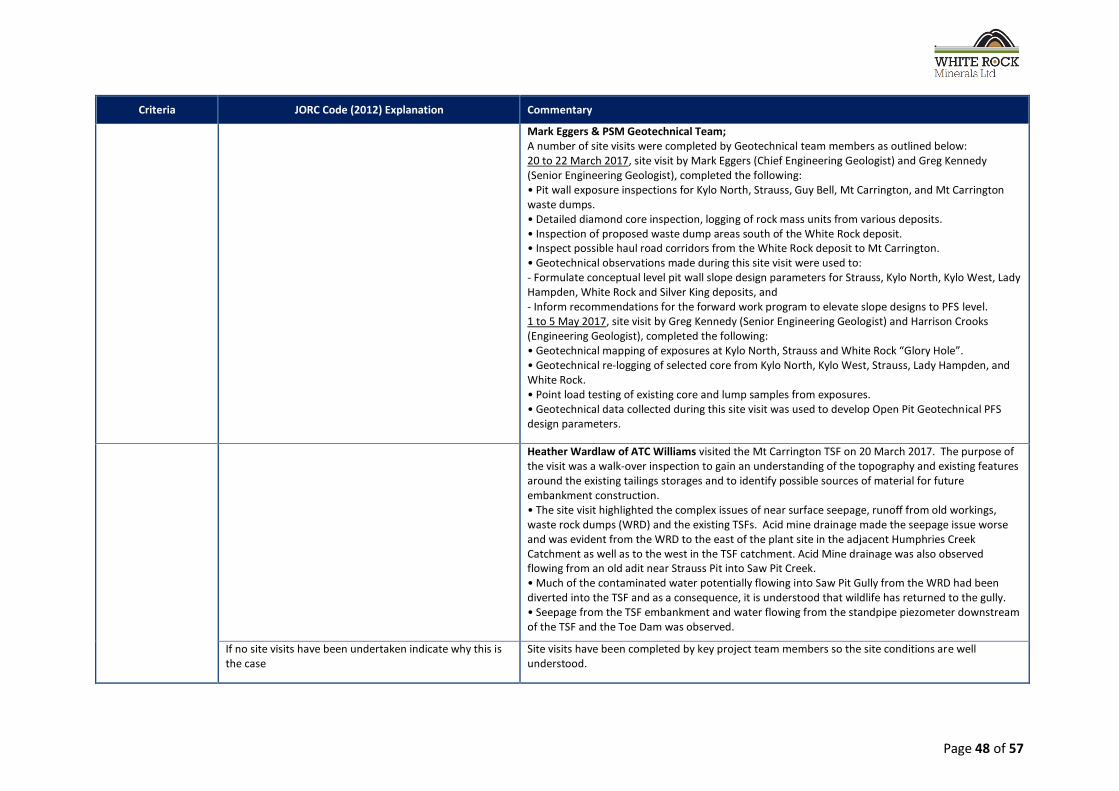
Page 48 of 57
Criteria JORC Code (2012) Explanation Commentary
Mark Eggers & PSM Geotechnical Team; A number of site visits were completed by Geotechnical team members as outlined below: 20 to 22 March 2017, site visit by Mark Eggers (Chief Engineering Geologist) and Greg Kennedy (Senior Engineering Geologist), completed the following: • Pit wall exposure inspections for Kylo North, Strauss, Guy Bell, Mt Carrington, and Mt Carrington waste dumps. • Detailed diamond core inspection, logging of rock mass units from various deposits. • Inspection of proposed waste dump areas south of the White Rock deposit. • Inspect possible haul road corridors from the White Rock deposit to Mt Carrington. • Geotechnical observations made during this site visit were used to: - Formulate conceptual level pit wall slope design parameters for Strauss, Kylo North, Kylo West, Lady Hampden, White Rock and Silver King deposits, and - Inform recommendations for the forward work program to elevate slope designs to PFS level. 1 to 5 May 2017, site visit by Greg Kennedy (Senior Engineering Geologist) and Harrison Crooks (Engineering Geologist), completed the following: • Geotechnical mapping of exposures at Kylo North, Strauss and White Rock “Glory Hole”. • Geotechnical re-logging of selected core from Kylo North, Kylo West, Strauss, Lady Hampden, and White Rock. • Point load testing of existing core and lump samples from exposures. • Geotechnical data collected during this site visit was used to develop Open Pit Geotechnical PFS design parameters.
Heather Wardlaw of ATC Williams visited the Mt Carrington TSF on 20 March 2017. The purpose of the visit was a walk-over inspection to gain an understanding of the topography and existing features around the existing tailings storages and to identify possible sources of material for future embankment construction. • The site visit highlighted the complex issues of near surface seepage, runoff from old workings, waste rock dumps (WRD) and the existing TSFs. Acid mine drainage made the seepage issue worse and was evident from the WRD to the east of the plant site in the adjacent Humphries Creek Catchment as well as to the west in the TSF catchment. Acid Mine drainage was also observed flowing from an old adit near Strauss Pit into Saw Pit Creek. • Much of the contaminated water potentially flowing into Saw Pit Gully from the WRD had been diverted into the TSF and as a consequence, it is understood that wildlife has returned to the gully. • Seepage from the TSF embankment and water flowing from the standpipe piezometer downstream of the TSF and the Toe Dam was observed.
If no site visits have been undertaken indicate why this is the case
Site visits have been completed by key project team members so the site conditions are well understood.

Page 49 of 57
Criteria JORC Code (2012) Explanation Commentary
Study Status The type and level of study undertaken to enable Mineral Resources to be converted to Ore Reserves
Mining Plus conducted a Pre-Feasibility mining study on the Mt Carrington project's Strauss and Kylo Gold deposits based on the September 2017 Indicated Mineral Resource
The code requires that a study to at least Pre-Feasibility Study level has been undertaken to convert Mineral Resource to Ore Reserves. Such studies will have been carried out and will have determined a mine plan that is technically achievable and economically viable, and that material modifying factors have been considered
As part of the Mt Carrington Gold First Pre-Feasibility study, a mine plan was developed that is technically achievable and economically viable. This mine plan considered material Modifying Factors such as mining, processing, metallurgy, infrastructure, economic, marketing, legal, environmental, social and regulatory, involving a multi discipline team with team members from various groups, with the leads being WRM and Mining Plus.
Cut-off parameters The basis of the cut-off grade(s) or quality parameters applied
The Mineral Resource provided was a geologically domained resource; this geological model was evaluated to determine which blocks produced cash surplus when treated as ore. The economic analysis for the cut-off was completed initially to determine pit extents and pit development sequence through the use of Geovia's Whittle software. Cut-off grade is based on a Net Block Value basis in Whittle, taking into account the net revenue from recovered gold and the cost of ore mining, processing and G&A for each block. These parameters are used to determine an Au cut-off grade and blocks above this grade are considered as ore. The Au cut-off grade varies slightly according to rock type; the overall weighted average cut-off for the purposes of Ore Reserves is 0.58g/t Au
Mining factors or assumptions
The method and assumptions used as reported in the Pre-Feasibility or Feasibility Study to convert the Mineral Resource to an Ore Reserve (i.e. either by application of appropriate factors by optimisation or by preliminary or detailed design)
The general methodology used to convert Mineral Resources to Ore Reserves was as follows: 1. Prepare a mining block model, incorporating appropriate dilution and ore loss factors, from the block model that underpins the Mineral Resource estimate. 2. Prepare mining and processing cost inputs, geotechnical slope information, expected processing recoveries and other inputs (gold price, royalties) for input to Whittle optimisation software, 3. Run Whittle pit optimisations at a range of revenue factors to produce a series of nested pit shells. All Inferred material was treated as waste for the purposes of this pit optimisation, such that the pit design is not driven by inclusion of Inferred material. 4. Select a pit shell to use as a basis for pit design and design final pit and pit stages. 5. Run mine scheduling to produce a set of mining physicals over the life of mine. Inferred material that occurs within the pit designs (less than 10% of total mining inventory and mostly forecast to be mined late in the mine life) was attributed value during this process. 6. Develop a mining cost model (capex and opex) for input into the overall project financial modelling

Page 50 of 57
Criteria JORC Code (2012) Explanation Commentary
The choice, nature and appropriateness of the selected mining method (s) and other mining parameters including associated design issues such as pre-strip, access, etc.
The mining method planned to be utilised is conventional open pit mining using truck and excavator operating on 4m benches. Drilling and blasting has been considered to be required for all the material to be mined.
The assumptions made regarding geotechnical parameters (e.g. pit slopes, stope sizes, etc.), grade control and pre-production drilling The major assumptions made and the Mineral Resource model used for pit and stope optimisation (if appropriate)
Pells Sullivan Meynink (PSM) undertook a number of reviews of the project area including a final review for the pit shells, which resulted in the slope design parameters remaining applicable to the Ore Reserve, that PSM have stated are to a minimum of a Pre-feasibility geotechnical Study level. Batter angle for the pits range from 60
o to 75
o depending on localised geological boundaries and
weathering zones. Final pit benches are planned to be 16m high with 7.5m catch berms.
The mining dilution factors used The mining recovery factors used Any mining widths used
The sub-blocked geological block model that forms the basis of the Mineral Resource Estimate (MRE) was modified to incorporate appropriate dilution by regularising the model to a Selective Mining Unit (SMU) size of 4m x 4m x 2m (X x Y x Z). Comparison of the Grade-tonnage curves from the regularised mining model (or "SMU model") and the original MRE model shows that the SMU model incorporates a global dilution factor of approximately 6%, which is considered appropriate for the proposed mining method and the type of mining equipment envisaged for the project. Dilution is therefore considered to be inherently incorporated into the Ore Reserves via the SMU regularisation process. However, the regularised SMU model was not considered to incorporate sufficient Ore Loss (or mining recovery); and as such an additional 4% Ore Loss (or 96% Mining Recovery) factor was applied for Ore Reserves estimation purposes. A Minimum Mining Width of 15m was used during the pit and pushback design process.
The manner in which Inferred Mineral Resources are utilised in mining studies and the sensitivity of the outcome to their inclusion
No value was attributed to Inferred Mineral Resources during the pit shell generation process. There is some Inferred material above the nominated cut-off grade (0.58g/t Au) that is included in the mining inventory within the final pit designs, and economic value is attributed to this Inferred material in the project schedule and economic analysis. The Inferred material represents approximately 9% of the total mining inventory for the project. Financial modelling demonstrates a positive project NPV if the revenue from Inferred material is removed (i.e. Inferred treated as waste), so the project's economic viability does not depend on the inclusion of the Inferred material. The proportion of Inferred material in the early part of the mine plan is not significant; most of the Inferred material is in the Strauss pit Stage 2 cutback which is the last cutback scheduled in the LoM plan. A comprehensive RC grade control program will be implemented, specifically designed to improve confidence in the geological modelling that underpins the Mineral Resources and Ore Reserves.

Page 51 of 57
Criteria JORC Code (2012) Explanation Commentary
The infrastructure requirements of the selected mining methods
The Ore Reserve estimation process has taken into account the pre-existing infrastructure such as historical waste dumps and haul roads and utilised these where practicable. The ROM Pad, workshop and processing plant area, while being placed on pre-existing infrastructure areas, do not impact on the Ore Reserve.
Metallurgical factors or assumptions
The metallurgical process proposed and the appropriateness of that process to the style of the mineralisation
A three-stage crushing and ball-milling comminution circuit followed by a conventional carbon in leach (CIL) process is proposed. This process is considered appropriate for the Mt Carrington ore, which is classified as free‐milling. Alternatives evaluated included flotation concentrate sales and concentrate leaching in light of the presence of cyanide-consuming base metal sulphides; however CIL was selected on the basis of maximising recovery at acceptable CN usage levels.
Whether the metallurgical process is well-tested technology or novel in nature
The proposed metallurgical process and flowsheet is commonly used in the Australian and international gold mining industry and is considered to be well‐tested technology.
The nature, amount and representativeness of metallurgical test work undertaken, the nature of the metallurgical domaining applied and the corresponding metallurgical recovery factors applied
Composites tested by ore source for the Kylo North, Kylo West and Strauss pits and by oxidation state i.e. oxide, transition, primary. Diagnostic leach, CN leach tests and size by size recovery tests performed to determine amenability to CN leaching, and optimal grind size. Bond Work Index tests carried out to determine ore hardness and power consumption. The metallurgical recoveries utilised for the study were:- Oxide 95.5% Transitional 80.0% Fresh 82.5% (Strauss and Kylo West), 83.0% Kylo North
Any assumptions or allowances made for deleterious elements
Allowance has been made for pre-aeration to improve gold recovery and reduce CN usage due to the potential impact of sulphides in the ore feed.
The existence of any bulk sample or pilot scale test work and the degree to which such samples are considered representative of the orebody as a whole
There has been no bulk sampling or pilot-plant testing to date.
For minerals that are defined by the specification, has the ore reserve estimation been based on the appropriate mineralogy to meet the specifications?
Not applicable
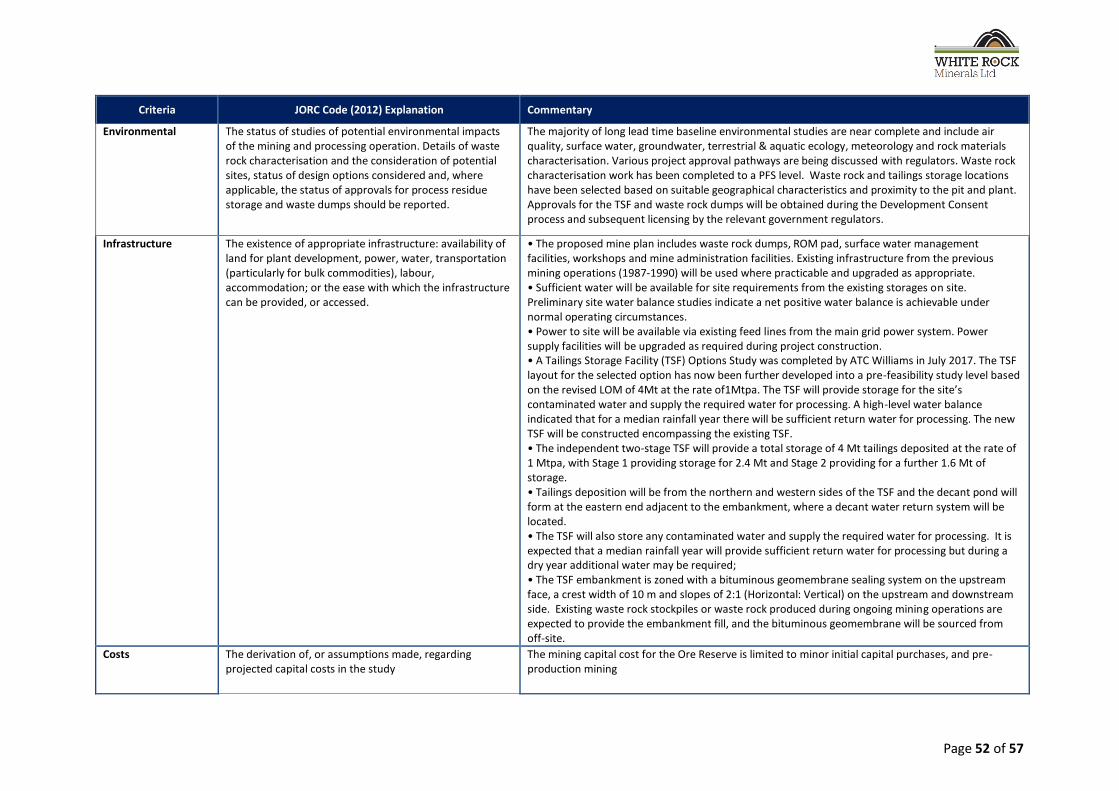
Page 52 of 57
Criteria JORC Code (2012) Explanation Commentary
Environmental The status of studies of potential environmental impacts of the mining and processing operation. Details of waste rock characterisation and the consideration of potential sites, status of design options considered and, where applicable, the status of approvals for process residue storage and waste dumps should be reported.
The majority of long lead time baseline environmental studies are near complete and include air quality, surface water, groundwater, terrestrial & aquatic ecology, meteorology and rock materials characterisation. Various project approval pathways are being discussed with regulators. Waste rock characterisation work has been completed to a PFS level. Waste rock and tailings storage locations have been selected based on suitable geographical characteristics and proximity to the pit and plant. Approvals for the TSF and waste rock dumps will be obtained during the Development Consent process and subsequent licensing by the relevant government regulators.
Infrastructure The existence of appropriate infrastructure: availability of land for plant development, power, water, transportation (particularly for bulk commodities), labour, accommodation; or the ease with which the infrastructure can be provided, or accessed.
• The proposed mine plan includes waste rock dumps, ROM pad, surface water management facilities, workshops and mine administration facilities. Existing infrastructure from the previous mining operations (1987-1990) will be used where practicable and upgraded as appropriate. • Sufficient water will be available for site requirements from the existing storages on site. Preliminary site water balance studies indicate a net positive water balance is achievable under normal operating circumstances. • Power to site will be available via existing feed lines from the main grid power system. Power supply facilities will be upgraded as required during project construction. • A Tailings Storage Facility (TSF) Options Study was completed by ATC Williams in July 2017. The TSF layout for the selected option has now been further developed into a pre-feasibility study level based on the revised LOM of 4Mt at the rate of1Mtpa. The TSF will provide storage for the site’s contaminated water and supply the required water for processing. A high-level water balance indicated that for a median rainfall year there will be sufficient return water for processing. The new TSF will be constructed encompassing the existing TSF. • The independent two-stage TSF will provide a total storage of 4 Mt tailings deposited at the rate of 1 Mtpa, with Stage 1 providing storage for 2.4 Mt and Stage 2 providing for a further 1.6 Mt of storage. • Tailings deposition will be from the northern and western sides of the TSF and the decant pond will form at the eastern end adjacent to the embankment, where a decant water return system will be located. • The TSF will also store any contaminated water and supply the required water for processing. It is expected that a median rainfall year will provide sufficient return water for processing but during a dry year additional water may be required; • The TSF embankment is zoned with a bituminous geomembrane sealing system on the upstream face, a crest width of 10 m and slopes of 2:1 (Horizontal: Vertical) on the upstream and downstream side. Existing waste rock stockpiles or waste rock produced during ongoing mining operations are expected to provide the embankment fill, and the bituminous geomembrane will be sourced from off-site.
Costs The derivation of, or assumptions made, regarding projected capital costs in the study
The mining capital cost for the Ore Reserve is limited to minor initial capital purchases, and pre-production mining

Page 53 of 57
Criteria JORC Code (2012) Explanation Commentary
The methodology used to estimate operating costs Mining operating costs were built up from first-principles where the operating hours of all equipment were established and then costs applied for maintenance, tyres, labour and consumables. The costs further take into account the fixed dry hire costs and associated insurances, plus the cost of labour including operators, maintainers and management and also an expected contractor's profit margin. Processing operating costs were built up from first-principles calculations where the main costs drivers are the required power (Bond WI and grind size), CN (test work results) and labour. All operating costs are considered to be at PFS level of accuracy i.e. -15%/+25%.
Allowances made for the content of deleterious elements Not applicable
The source of exchange rates used in the study The primary exchange rate of relevance to the valuation of the White Rock project is the AUD: USD rate. WRM has referred to a range of 12 international broker forecasts as a reference for future exchange rate used. Based on a detailed review of these forecasts, WRM has selected AUD: USD 0.75 for capital cost, operating cost and valuation purposes.
Derivation of transport charges Not applicable
The basis for forecasting or source of treatment and refining charges, penalties for failure to meet specification, etc.
Not applicable
The allowances made for royalties payable, both Government and private
The royalty rate applicable for the Mt Carrington project is 4% ex-mine value. Ex-mine value refers to the value of the mineral once it is mined and brought to surface allowing for deductions related to processing, treatment, depreciation and some administration costs. This rate has been applied to all revenues of the project over its life of mine.
Revenue Factors The derivation of, or assumptions made regarding revenue factors including head grade, metal or commodity price(s) exchange rates, transportation and treatment charges, penalties, net smelter returns etc.
The pit optimisations were based on a Revenue Factor 1 gold price of A$1600 per ounce, less applicable royalties. It is envisaged that gold will be produced as dore bars so product treatment and transportation charges will be minimal and there is no requirement for net smelter return calculations.
The derivation of assumptions made of metal or commodity price(s), for the principal metals, minerals and co-products.
A life-of-mine (LOM) forecast Gold price of A$1,700 (real 2017) is applied in the financial model for the project evaluation. This price was selected by White Rock on the basis of historical A$ Gold prices over the last 5 years. Over the past 5 years Gold prices have occurred in a range from A$1303 to A$1821. The price is near the median of the historical range and consistent with long term broker consensus forecasts.

Page 54 of 57
Criteria JORC Code (2012) Explanation Commentary
Market Assessment The demand, supply and stock situation for the particular commodity, consumption trends and factors likely to affect supply and demand into the future.
There is a transparent market for the sale and purchase of gold.
A customer and competitor analysis along with the identification of likely market windows for the product
There is a transparent market for the sale and purchase of gold.
Price and volume forecasts and the basis for these forecasts
There is a transparent market for the sale and purchase of gold.
For industrial minerals the customer specification, testing and acceptance requirements prior to a supply contract
Not applicable
Economic The inputs to the economic analysis to produce the net present value (NPV), the source and confidence of these economic inputs estimated inflation, discount rate, etc.
Discounted cashflow modelling and sensitivity analysis has been completed to evaluate the economic performance of the project. Key value driver inputs into the financial model include; Gold price of A$1,700/oz based on historical performance and long-term forecasts, as determined by the Board of Directors of White Rock, and excluding project financing. The project returns a positive NPV under the assumptions used.
NPV ranges and sensitivity to variations in the significant assumptions and inputs
White Rock has not disclosed the Project NPV to support the Ore Reserve estimates as this is considered to be commercially sensitive. The Project NPV is most sensitive to variations in realised gold price and operating costs - 10% reduction in gold price or total gold produced reduces NPV by approx. 95%, a 10% increase in operating costs reduces NPV by approx. 68%, and a 10% increase in development capital reduces NPV by 18%. A 10% increase in realised gold price or total gold produced increases NPV by 95% and a 10% decrease in operating costs increases NPV by 68%. A 10% decrease in capital costs increases NPV by 18%.

Page 55 of 57
Criteria JORC Code (2012) Explanation Commentary
Social The status of agreements with key stakeholders and matters leading to social licence to operate.
Throughout the ownership of the Mt Carrington Project White Rock has maintained a strong platform of engagement with the community. The level of community engagement has been dictated by the level of activity and has included community sponsorship and support of community initiatives. At the beginning of the PFS, White Rock engaged leading community consultants Umwelt to assist in developing a Social Impact Assessment (“SIA”) and Community Engagement Strategy that is an integral part of the Development Consent process. Ultimately the strategy aims to work with stakeholders and the community to identify ways to enhance the positive and minimise the negative impacts of the Project. One Native Title claim is registered over the area (NNTT #NC11/5). Introductory meetings and a site visit has been completed with Native Title claimants. No Native Title negotiations have commenced. The majority of the central Mining Leases and the area of the Exploration Licence subject of this PFS are located in Girard State Forest SF303. Access and compensation agreements for this land are in place with Forests NSW. The periphery of the central Mining Leases to the east includes private freehold and Crown Land. Current compensation agreements are not in place for this land.
Other To the extent relevant, the impacts of the following on the project and/or on the estimation and classification of the Ore reserves:
Any identified material naturally occurring risks. Terrestrial ecology studies that commenced in 2013 and are still ongoing have shown that no impacts are expected on threatened vegetation communities as no Endangered Ecological Communities currently listed under either the BC Act or the EPBC Act have been identified within the Project Site. Similarly, to date no flora species currently listed as Threatened under either Act has been recorded within areas likely to be impacted and therefore no adverse impacts are anticipated at this stage. One Threatened fauna species has been detected in the area which may be impacted by the project. This species, the Giant Barred Frog, has been found in 4 locations in the general area of the Project and one of these locations may be impacted by the development. Further work is required to develop strategies to ensure that the impact of the Project is minimised.
The status of material legal agreements and marketing arrangements
No material contracts or marketing arrangements are in place.

Page 56 of 57
Criteria JORC Code (2012) Explanation Commentary
The status of governmental agreements and approvals critical to the viability of the project, such as mineral tenement status, and government and statutory approvals. There must be reasonable grounds to expect that all necessary government regulations will be received within the timeframes anticipated in the Pre-feasibility or Feasibility study. Highlight and discuss the materiality of any unresolved matter that is dependent on a third party on which extraction of the reserve is contingent.
The project is contained within 22 mining leases and one exploration licence, which are all in good standing. An approved Mining Operation Plan for Care & Maintenance activities on the mining tenements is current. Approvals for mining will be sought through the Development Consent process.
Classification The basis for the classification of the Ore Reserves into varying confidence categories.
It is the opinion of the Competent Persons for Ore Reserves that the results are an appropriate reflection of the deposits. There are no Measured Mineral Resources for the deposits under consideration, so there are no Proven Ore Reserves. Indicated Mineral Resources within the final pit design (which has been derived by applying appropriate Modifying Factors as described above) have been classified as Probable Ore Reserves.
Whether the result appropriately reflects the Competent Person's view of the deposit
The proportion of Probable Ore Reserves that have been derived from Measured Mineral Resources (if any)
Audits or reviews The results of any audits or reviews of Ore Reserve estimates
No audits or reviews of the Ore Reserves estimate have been conducted to date.
Discussion of relative accuracy/confidence
Where appropriate a statement of the relative accuracy and confidence level in the Ore Reserve estimate using and approach or procedure deemed appropriate by the Competent Person. For example, the application of statistical or geostatistical procedures to quantify the relative accuracy of the reserve within stated confidence limits, or, if such an approach is not deemed appropriate, a qualitative discussion of the factors which could affect the relative accuracy and confidence of the estimate
The Ore Reserve is based on the following key elements: ● A current Mineral Resource estimate with the large proportion of Mineral Resource classification being Indicated; this is considered sufficient to support a PFS. ● There are no unforeseen modifying factors at the time of this statement that will have any material impact on the Ore Reserve estimate. ● Geotechnical assessment is considered sufficient for a PFS, and allows progression to feasibility level study, with more detailed geotechnical assessment to be completed in the next stage of study. ● The mine planning and scheduling assumptions are based on current industry practice, which are seen as globally correct at this level of study; with further work in the next level of study to understand any periodic cost fluctuations. ● As part of ongoing works planned as part of the DFS, it is recommended that further work is completed on ore and waste rock characterisation, including further test work and geological interpretation. Following this work, the waste rock dump design and mine schedule will be reviewed and updated as appropriate. This work would also include further analysis of the historic low-grade ore stockpile. ● The cost estimates and financial evaluation have been estimated by the project team with specialist consultants and team members, which are considered sufficient to support this level of
The statement should specify whether it relates to global or local estimates, and if local, state the relevant tonnages, which should be relevant to technical and economic evaluation. Documentation should include assumptions made and the procedures used

Page 57 of 57
Criteria JORC Code (2012) Explanation Commentary
Accuracy and confidence discussions should extend to specific discussions of any applied Modifying factors that may have a material impact on Ore Reserve viability, or for which there are remaining areas of uncertainty at the current study stage
study. The accuracy of the cost estimate is ‐15% to +25% and is in line with a Class 4 estimate under the AACE International Cost Estimate Classification guidelines. ● As part of the DFS works, the project team will also engage with potential contractors in the local area and region to confirm construction and mining costs, and to assist with the project execution planning. ● Mine economics are based on long term commodity forecasts which carry inherent risks. It is recognised that this may not be possible or
appropriate in all circumstances. These statements of relative accuracy and confidence of the estimate should be compared with production data, where available.