mt measurements in the cape fold belt, south africabib.gfz-potsdam.de/emtf/2007/pdf/tietze.pdf ·...
TRANSCRIPT

MT measurements in the Cape Fold Belt, South Africa Kristina Tietze1,2, Ute Weckmann1,2, Jana Beerbaum1,2, Juliane Hübert1,3, Oliver Ritter1 1 GeoForschungsZentrum Potsdam, Telegrafenberg, 14473 Potsdam, Germany, email: [email protected] 2 University of Potsdam, Germany 3 now at University of Uppsala, Sweden
1. OVERVIEW
Figure 1: Simplified terrane map of Southern Africa with different on- and offshore geophysical profiles within
the Inkaba yeAfrica project. The map also shows the Archean Kaapvaal Craton, the Mesoproterozoic Namaqua Natal Mobile Belt and the upper Paleozoic Cape Fold Belt. A large region is covered by the Paleozoic-Mesozoic sediments and igneous rocks of the Karoo Basin.
The southern part of the African continent consists of an assemblage of different continental masses. The Archean nucleus is the Kaapvaal craton. In the Proterozoic the Namaqua Natal Mobile Belt (NNMB) accreted in the south, followed by the collision of the Permo-Triassic Cape
22. Kolloquium Elektromagnetische Tiefenforschung, Hotel Maxičky, Děčín, Czech Republic, October 1-5, 2007 250
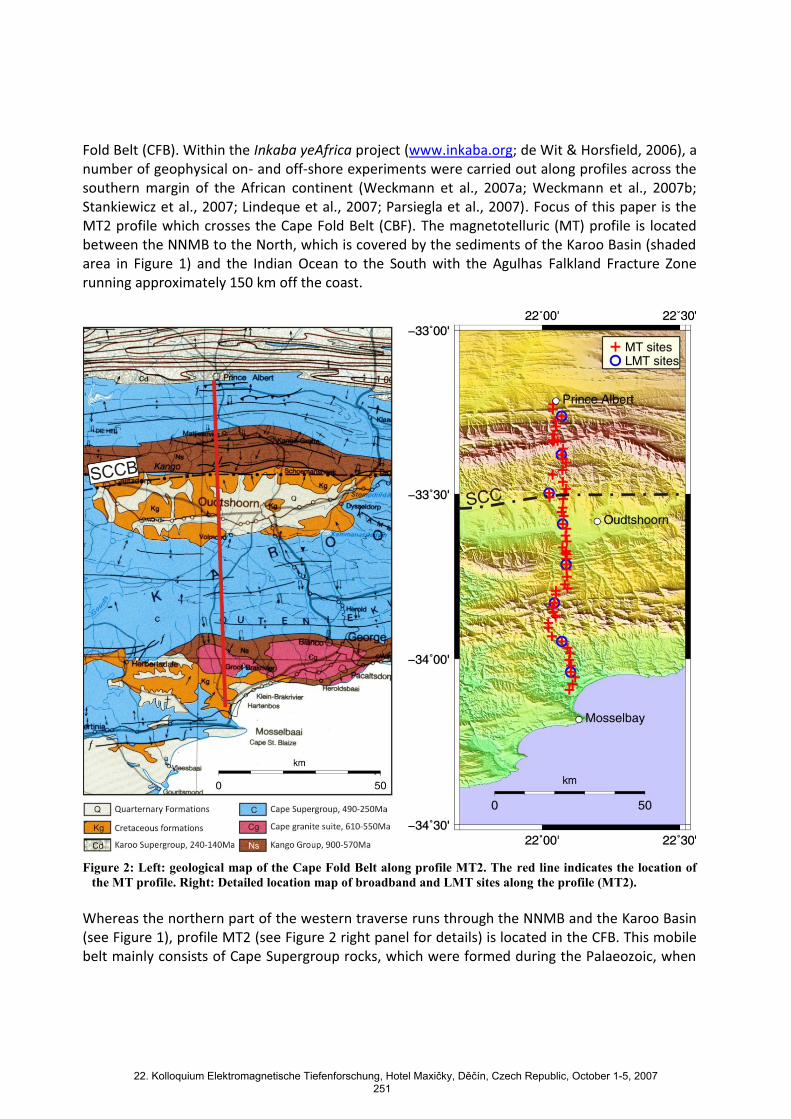
Fold Belt (CFB). Within the Inkaba yeAfrica project (www.inkaba.org; de Wit & Horsfield, 2006), a number of geophysical on- and off-shore experiments were carried out along profiles across the southern margin of the African continent (Weckmann et al., 2007a; Weckmann et al., 2007b; Stankiewicz et al., 2007; Lindeque et al., 2007; Parsiegla et al., 2007). Focus of this paper is the MT2 profile which crosses the Cape Fold Belt (CBF). The magnetotelluric (MT) profile is located between the NNMB to the North, which is covered by the sediments of the Karoo Basin (shaded area in Figure 1) and the Indian Ocean to the South with the Agulhas Falkland Fracture Zone running approximately 150 km off the coast.
Figure 2: Left: geological map of the Cape Fold Belt along profile MT2. The red line indicates the location of
the MT profile. Right: Detailed location map of broadband and LMT sites along the profile (MT2). Whereas the northern part of the western traverse runs through the NNMB and the Karoo Basin (see Figure 1), profile MT2 (see Figure 2 right panel for details) is located in the CFB. This mobile belt mainly consists of Cape Supergroup rocks, which were formed during the Palaeozoic, when
22. Kolloquium Elektromagnetische Tiefenforschung, Hotel Maxičky, Děčín, Czech Republic, October 1-5, 2007 251
deposition occurred in a basin created by inversion of a Pan African mobile belt flanking the southern margin of Africa (de Wit, 1992). Since then, the Cape Fold Belt has experienced several periods of re-activation. During Late Proterozoic / Early Cambrian eroded material from uplifts in the NNMB filled basins to the south, forming the Kango and Outshoorn inliers (Hälbich, 1993) (see Figure 2 left panel). Open questions concern the kinematic history of the CFB inliers as well as the subsurface geometry of major tectonic and stratigraphic boundaries. A crucial point is if and to which extent the CFB may continue under the NNMB or vice versa.
2. MT DATA SET ACROSS THE CFB 54 MT sites recording electric and magnetic field variations in a period range from 0.001 s to 1000 s were deployed along a 105 km long profile from Prince Albert to Mosselbay in November 2005 (red crosses in Figure 2 right panel) crossing the Cape Fold Belt and its inliers. We acquired 5-component MT data using GPS synchronized S.P.A.M. MkIII (Ritter et al., 1998) and CASTLE broadband instruments together with non-polarizable Ag/AgCl telluric electrodes and Metronix MFS05/06 induction coil magnetometers. The average site spacing was approximately 2 km. Blue circles mark LMT stations, which extend the period range to 20000 s. The MT data were processed with the EMERALD software package (Ritter et al., 1998) using both robust single site and remote reference techniques (Krings et al., this issue). Measurements were widely affected by extensive farming. To improve data quality, the frequency domain selection scheme after Weckmann et al. (2005) was applied. Figure 3 shows MT and GDS data and the results from a distortion analysis after Becken & Burkhardt (2004) at selected sites. The MT data are shown in a NS/EW coordinate system for four exemplary sites. Site locations are marked with pink arrows in Figure 5. Apparent resistivities in the Outeniekwaberge (site 137), the Rooiberge, and the Swartberg Mountains (site 108) are high, reaching values of up to 106 Ωm whereas in the Kango Basin (sites 121 and 117) resistivities are very low and the curves are characterized by a steep descent to extremely low resistivity values (< 1 Ωm) for periods longer than 1s (note the different scaling of the axes). In the northern profile section (north of site 130), nearly all sites show phases exceeding 90° for one (sites 121 and 108) or even both (site 117) polarizations at long periods (> 1s). Real parts of the induction vectors (in the Wiese convention) in Figure 3 show a common behavior for longer periods (> 5s) by pointing towards south. Only stations in close vicinity to the Indian Ocean show the “ocean effect” with northward oriented induction vectors. Shorter periods (< 1s) are mainly influenced by the resistive mountain chains and the conductive basins. Figure 4b shows induction vectors for four different frequencies along the entire profile MT2. Shaded areas (grey, pink and blue) indicate zones of enhanced conductivity which could be the cause for larger induction vectors and their reversals. Induction vectors for periods shorter than 1s mainly show the influence of the Kango Basin. The influence of the Indian Ocean in the South and the extremely conductive crust of the NNMB in the North can clearly be seen in the induction vectors for periods longer than 1s.
22. Kolloquium Elektromagnetische Tiefenforschung, Hotel Maxičky, Děčín, Czech Republic, October 1-5, 2007 252

Figure 3: Off-diagonal and diagonal components of apparent resistivity, phase and induction vectors (Wiese
convention) of four exemplary sites (in a geographic coordinate system: x = geographic north, y = geographic east). For site locations refer to Figure 5. Additionally, ellipticity parameters after Becken and Burkhard (2004) provide information on the directionality and dimensionality of the MT data.
22. Kolloquium Elektromagnetische Tiefenforschung, Hotel Maxičky, Děčín, Czech Republic, October 1-5, 2007 253

The lower panels in Figure 3 show the impedance decomposition parameters for the four exemplary sites obtained from the analysis using Becken and Burkhardt (2004). The graph shows the ellipticities of the two independent current systems and the galvanic distortion angles. Shaded areas in light blue and red indicate the weighted means of respective quantities over period and their weighted r.m.s. deviations; the patches are centered at the mean values and have a width of two standard.
Figure 4: a) Regional strike angles shown in a rose diagram. The average amounts to -76°. b) Real Induction
vectors in the Wiese convention for four different frequencies along our profile. Shaded areas (grey, pink and blue) indicate zones of enhanced conductivity which could be the cause for larger induction vectors and their reversals.
22. Kolloquium Elektromagnetische Tiefenforschung, Hotel Maxičky, Děčín, Czech Republic, October 1-5, 2007 254
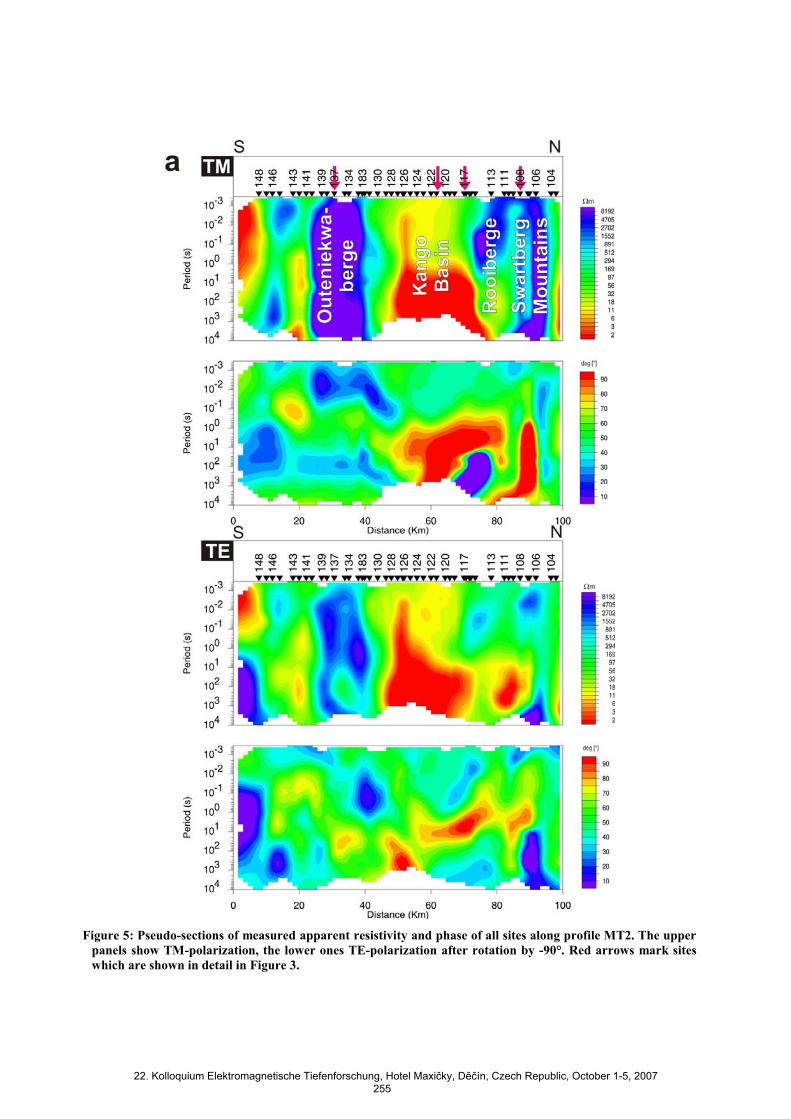
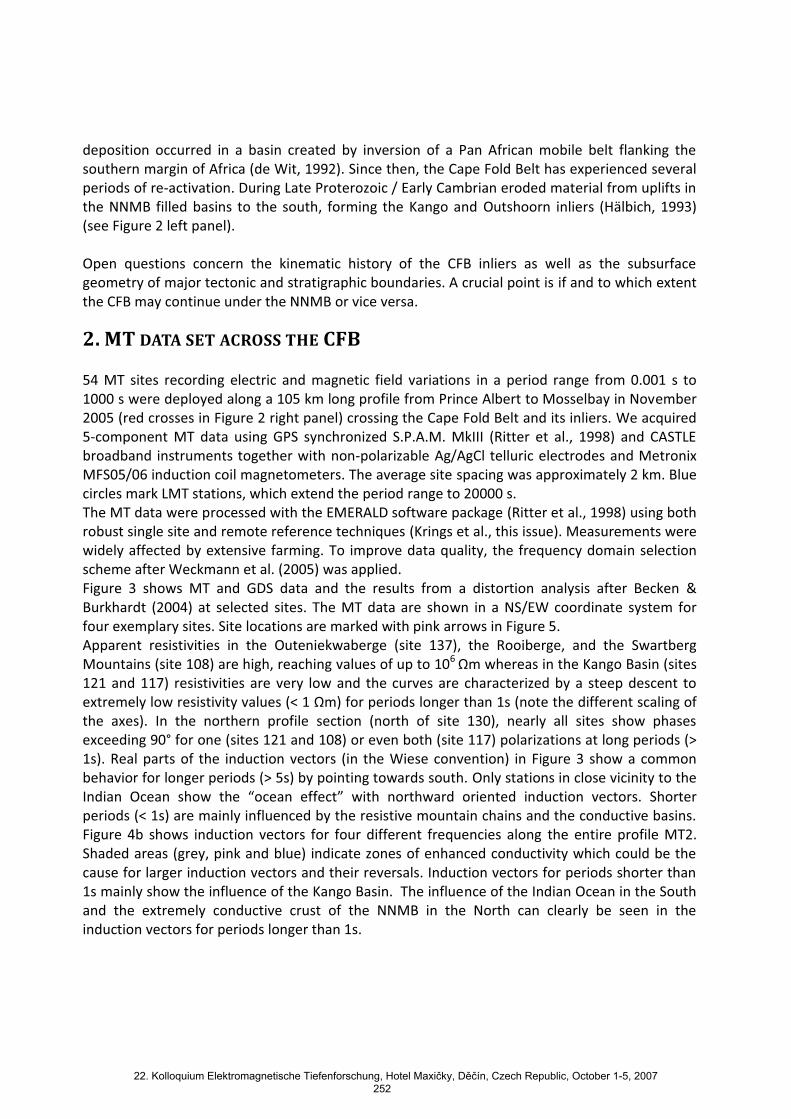
Figure 5: Pseudo-sections of measured apparent resistivity and phase of all sites along profile MT2. The upper
panels show TM-polarization, the lower ones TE-polarization after rotation by -90°. Red arrows mark sites which are shown in detail in Figure 3.
22. Kolloquium Elektromagnetische Tiefenforschung, Hotel Maxičky, Děčín, Czech Republic, October 1-5, 2007 255
A significantly large sub-set of sites (sites 137, 121, 117) shows ellipticities deviating from 0 for long periods (>1s), indicating 3D structures at depth / off-profile. In addition, several sites (e.g. site 108) show larger ellipticities for shorter periods (< 1s), which likely indicate local and shallow 3D structures. Distortion angles are stable for each site over the entire period range (sites 137, 121, 108), indicating frequency-independent distortion of the regional impedance tensor.. However, at some stations e.g. site 117 they vary strongly with period. This could be caused by the strong conductivity contrast between the mountain ranges and the sedimentary basins and different strike directions for these tectonic units. Regional geo-electric strike angles are shown in a rose diagram plot in Figure 4a. The average strike direction, including data from all sites and over the entire period range, amounts to -76°. This direction corrensponds roughly with the regionally east-west trending geologic structures of the CFB. In a pseudo-section presentation different geological and tectonic features can already be attributed to zones of high and low conductivity. Figure 5 shows pseudo-sections for TM and TE polarizations after rotation by -90°. This direction was chosen as a compromise of geo-electric strike and the known strike direction of geologic and tectonic units. TE-mode data are now perpendicular, TM-mode parallel to the profile MT2. Along the profile, apparent resistivities range from 106 Ωm in the Swartberg Mountains and the Outeniekwaberge to as low as 0.01 Ωm at sites in the Kango Basin. For periods above 1s phases often exceed 90° at sites in the northern half of the profile. In a preliminary interpretation approach we intend to assess which structures are consistent with 2D inversions. For the 2D inversion we only use MT data with phases staying in their assigned quadrant, with small ellipticities, and with consistent apparent resistivity-phase relationship (no significant deviation when applying the Sutarno phase criterion). Obviously, none of the observed 3D effects can be explained by a 2D model.
3. FIRST 2D INVERSION RESULTS Figure 6 shows a first 2D inversion model along profile cut-off at 30 km depth. The 2D inversion model is the result of a minimum structure, non-linear conjugate gradient inversion algorithm after Rodi and Mackie (2001), which is implemented in WinGLink (www.geosystem.net). Prior to modelling the data were rotated by -90°. Inversion was started from a homogeneous half-space of 100 Ωm with τ=10 using TE and TM mode data. Preset error bounds of 5% for TM-polarization apparent resistivity and 200% for TE-polarization apparent resistivity and 0.6° for the phases of both polarizations were applied. Larger error floors were assigned to the apparent resistivity data, in particular to the TE-polarization to avoid problems with static shift effects and off-profile features.
22. Kolloquium Elektromagnetische Tiefenforschung, Hotel Maxičky, Děčín, Czech Republic, October 1-5, 2007 256
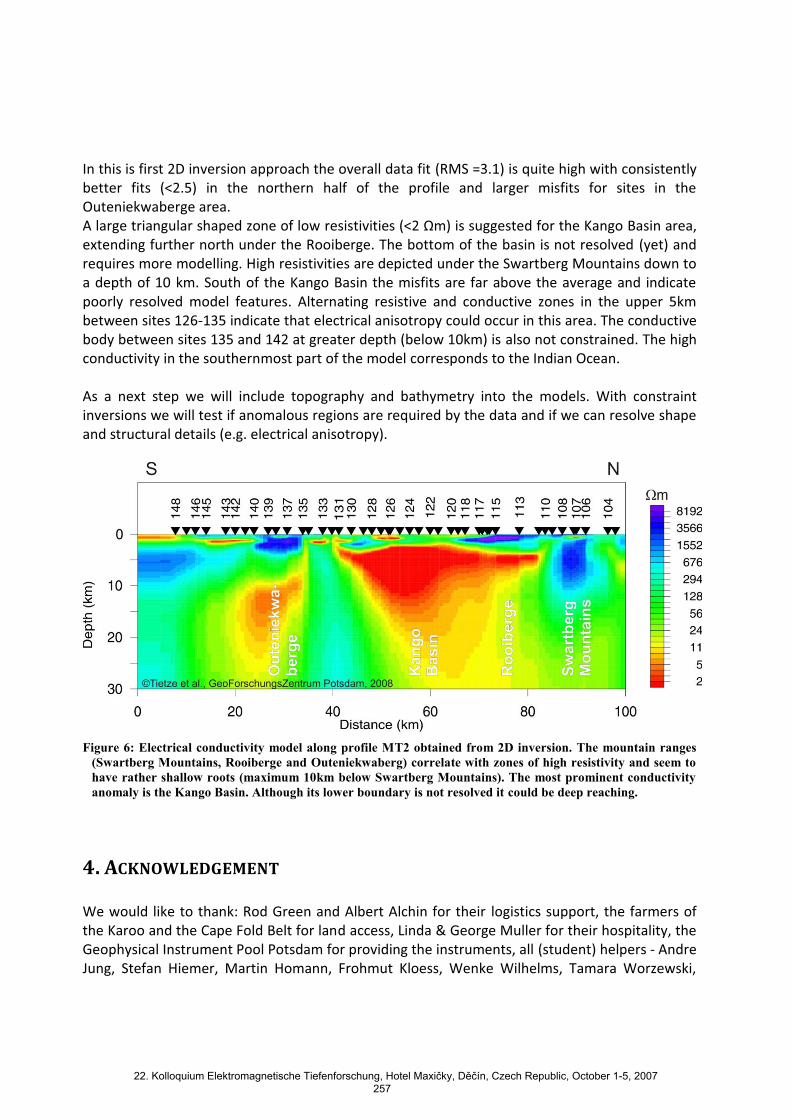
In this is first 2D inversion approach the overall data fit (RMS =3.1) is quite high with consistently better fits (<2.5) in the northern half of the profile and larger misfits for sites in the Outeniekwaberge area. A large triangular shaped zone of low resistivities (<2 Ωm) is suggested for the Kango Basin area, extending further north under the Rooiberge. The bottom of the basin is not resolved (yet) and requires more modelling. High resistivities are depicted under the Swartberg Mountains down to a depth of 10 km. South of the Kango Basin the misfits are far above the average and indicate poorly resolved model features. Alternating resistive and conductive zones in the upper 5km between sites 126-135 indicate that electrical anisotropy could occur in this area. The conductive body between sites 135 and 142 at greater depth (below 10km) is also not constrained. The high conductivity in the southernmost part of the model corresponds to the Indian Ocean. As a next step we will include topography and bathymetry into the models. With constraint inversions we will test if anomalous regions are required by the data and if we can resolve shape and structural details (e.g. electrical anisotropy).
Figure 6: Electrical conductivity model along profile MT2 obtained from 2D inversion. The mountain ranges
(Swartberg Mountains, Rooiberge and Outeniekwaberg) correlate with zones of high resistivity and seem to have rather shallow roots (maximum 10km below Swartberg Mountains). The most prominent conductivity anomaly is the Kango Basin. Although its lower boundary is not resolved it could be deep reaching.
4. ACKNOWLEDGEMENT We would like to thank: Rod Green and Albert Alchin for their logistics support, the farmers of the Karoo and the Cape Fold Belt for land access, Linda & George Muller for their hospitality, the Geophysical Instrument Pool Potsdam for providing the instruments, all (student) helpers - Andre Jung, Stefan Hiemer, Martin Homann, Frohmut Kloess, Wenke Wilhelms, Tamara Worzewski,
22. Kolloquium Elektromagnetische Tiefenforschung, Hotel Maxičky, Děčín, Czech Republic, October 1-5, 2007 257

Stefan Rettig, Manfred Schueler, Marc Green, Helena van der Merwe and Shaun Moore- during the field work, and the GFZ Potsdam for funding the experiment. This is an Inkaba yeAfrica publication.
5. REFERENCES Becken, M. and Burkhardt, H., (2004). An ellipticity criterion in magnetotelluric tensor analysis,
Geophys. J. Int., 159:69-82
de Wit, M.J. & Horsfield, B. (2006). Inkaba yeAfrica Project surveys sector of Earth from core to space. EOS, 87, 11
de Wit, M.J. (1992). The Cape Fold Belt: A Challenge for an integrated approach to inversion tectonics. In: Inversion Tectonics of the Cape Fold Belt, Karoo and Cretaceous Basins of Southern Africa, 3-12 (ed: de Wit, M.J. & Ransome, I.G.D.), Balkema, Rotterdam
Hälbich, I.W. (1993). The Cape Fold Belt – Agulhas Bank Transect across the Gondwana Suture in Southern Africa. American Geophysical Union Special Publication, 202, 18pp.
Lindeque, A. S., Ryberg, T., Stankiewicz, J., Weber, M. & de Wit, M. J. (2007). Deep Crustal Seismic Reflection Experiment Across the Southern Karoo Basin, South Africa. South African Journal of Geology, 110 (2/3), 419-438
Parsiegla, N., Gohl, K. & Uenzelmann-Neben, G. (2007). Deep crustal structure of the sheared South African continental margin: first results of the Agulhas-Karoo Geoscience Transect. South African Journal of Geology, 110 (2/3), 393-406.
Ritter, O., Junge, A. and Dawes, G.J.K., (1998). New equipment and processing for magnetotelluric remote reference observations, Geophys. J. Int., 32:535-548
Rodi, W. and Mackie, R.L., (2001). Nonlinear conjugate gradients algorithm for 2D magnetotelluric inversion, Geophysics, 66:174-187
Stankiewicz, J., Ryberg, T., Schulze, A., Lindeque, A. S., Weber, M. & de Wit, M.J. (2007). Initial Results from Wide-Angle Seismic Refraction Lines in the Southern Cape. South African Journal of Geology, 110 (2/3), 407-418.
Weckmann, U., Ritter, O., Jung, A., Branch, T. & de Wit, M.J. (2007a). Magnetotelluric measurements across the Beattie magnetic anomaly and the Southern Cape Conductive Belt, South Africa. Journal of Geophysical Research, 112, B05416, doi:10.1029/2005JB003975.
Weckmann, U., Jung, A., Branch, T. & Ritter, O. (2007b). Comparison of electrical conductivity structures and 2D magnetic modelling along two profiles crossing the Beattie Magnetic Anomaly, South Africa. South African Journal of Geology, 110 (2/3), 449-464.
Weckmann, U., A. Magunia, and O. Ritter, (2005). Effective noise separation for magnetotelluric single site data processing using a frequency domain selection scheme, Geophys. J. Int., 161, 3:456-468
22. Kolloquium Elektromagnetische Tiefenforschung, Hotel Maxičky, Děčín, Czech Republic, October 1-5, 2007 258