mtn group limited€¦ · 2 financial review 3 2016 guidance ... nigerian regulatory fine and tower...
TRANSCRIPT

MTN Group Limited
Results presentation for the six month period ended 30 June 2016

AGENDA
1 Strategic and
operational update
2 Financial review
3 2016 Guidance
4 Key matters and
immediate priorities

Strategic and operational update

4
Performance reflects a confluence of material issues which created a ‘perfect storm’
Group financial results for the six months ended 30 June 16
On 10 June MTN settled Nigerian regulatory fine with Federal Government of Nigeria
MTN to pay 330 billion naira (USD 1.67 billion) over three years in full and final settlement, in addition
to complying with certain other regulatory conditions
50 billion naira (USD 250 million) paid on 24 February 2016 forms part of the monetary component of
the settlement
June 2016, first schedule of 30 billion naira paid (USD 124 million)
Accrued present value of remaining, 280 billion naira (USD 1.42 billion)
Impact
- EBITDA: negative re-measurement impact of R10 499 million (provision R9 287m made in H2 15)
- Headline earnings: R8 632 million
- HEPS: 474 cents
- Cash flow: R 5 870 million
Nigeria fine
settlement;
significant
negative
impact on
results
STRATEGIC AND
OPERATIONAL UPDATE

5
A challenging operating environment
Source of GDP growth: IMF
Slowing reliant economies, regulatory pressure and tough competition
1.3 2.70.0
3.55.9
8.6
5.0
0.1
-1.8
4.0 4.5 4.9
8.5
5.3
6.5
10.48.9
15.7
2.2 2.1
6.7
-4
0
4
8
12
16
20
South Africa Nigeria Iran Ghana Cameroon Ivory Coast Uganda
The economic landscape in key MTN markets (%)
2015 GDP 2016 GDP f/c Inflation 2016 f/c
Key
challenges
impacted
growth
Depreciation in local currencies resulted in higher US dollar expenses
Forex losses of R3 606 million
Liquidity constraints impacting repatriation of funds from Nigeria
Weak macro economic conditions in most markets resulted in lower consumer spending
Negative GDP growth in South Africa and Nigeria expected in 2016, our two largest markets
Regulatory pressure, notably withdrawal of regulatory services in Nigeria until May 2016
7.5 million disconnected of subscribers – registration requirements in Nigeria, Uganda and Cameroon
(approximately 18 million since October 15)
STRATEGIC AND
OPERATIONAL UPDATE
6Note: Results are presented based on operational performance (excluding hyperinflation, Nigerian regulatory fine and tower profits)
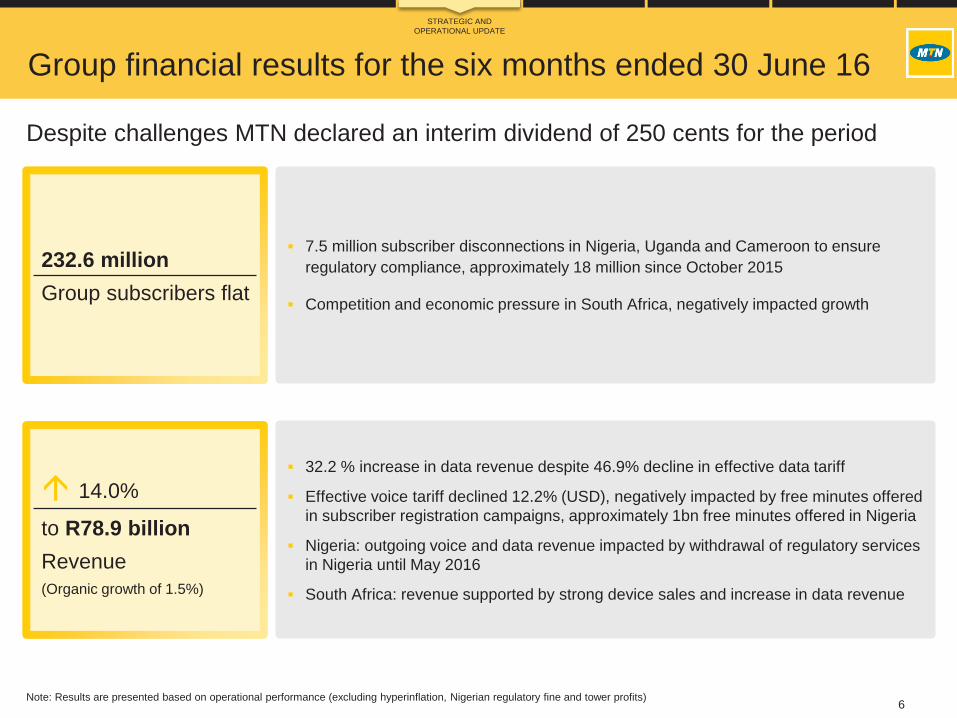
Despite challenges MTN declared an interim dividend of 250 cents for the period
Group financial results for the six months ended 30 June 16
STRATEGIC AND
OPERATIONAL UPDATE
7.5 million subscriber disconnections in Nigeria, Uganda and Cameroon to ensure
regulatory compliance, approximately 18 million since October 2015
Competition and economic pressure in South Africa, negatively impacted growth
232.6 million
Group subscribers flat
14.0%
to R78.9 billion
Revenue
(Organic growth of 1.5%)
32.2 % increase in data revenue despite 46.9% decline in effective data tariff
Effective voice tariff declined 12.2% (USD), negatively impacted by free minutes offered
in subscriber registration campaigns, approximately 1bn free minutes offered in Nigeria
Nigeria: outgoing voice and data revenue impacted by withdrawal of regulatory services
in Nigeria until May 2016
South Africa: revenue supported by strong device sales and increase in data revenue
7
Group financial results for the six months ended 30 June 16
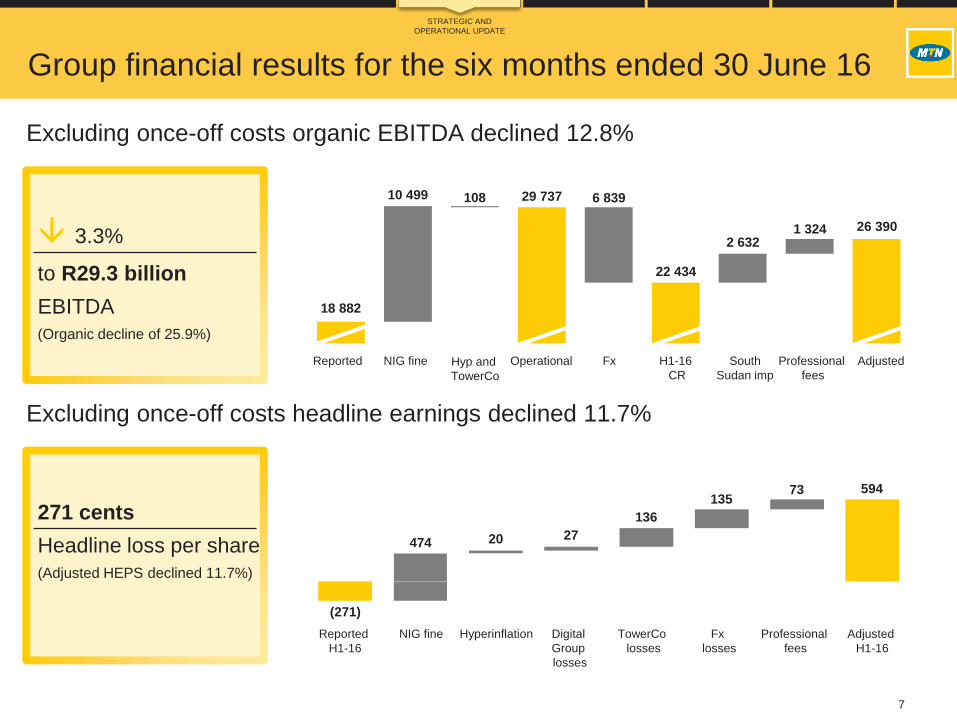
Excluding once-off costs organic EBITDA declined 12.8%
Excluding once-off costs headline earnings declined 11.7%
STRATEGIC AND
OPERATIONAL UPDATE
3.3%
to R29.3 billion
EBITDA
(Organic decline of 25.9%)
271 cents
Headline loss per share
(Adjusted HEPS declined 11.7%)
NIG fine Professional
fees
Operational AdjustedReported Fx H1-16
CR
South
Sudan imp
18 882
10 499 108 29 737 6 839
22 434
2 6321 324 26 390
NIG fine Digital
Group
losses
Adjusted
H1-16
Reported
H1-16
TowerCo
losses
Fx
losses
Professional
fees
Hyperinflation
(271)
474 20 27
136
13573 594
Hyp and
TowerCo
8
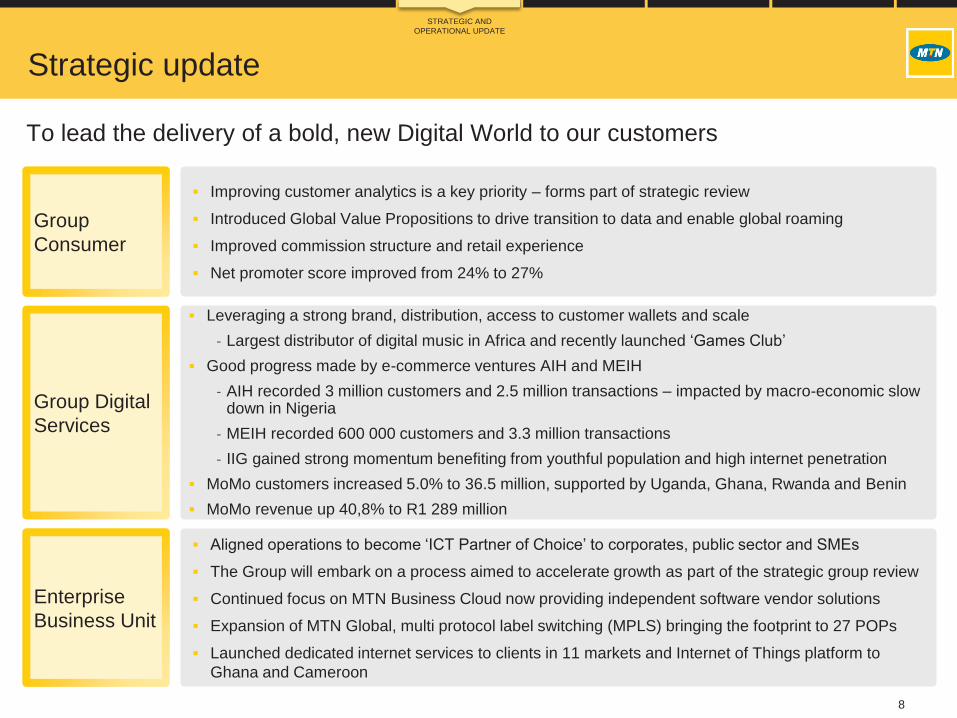
To lead the delivery of a bold, new Digital World to our customers
Strategic update
Group
Consumer
Improving customer analytics is a key priority – forms part of strategic review
Introduced Global Value Propositions to drive transition to data and enable global roaming
Improved commission structure and retail experience
Net promoter score improved from 24% to 27%
Group Digital
Services
Leveraging a strong brand, distribution, access to customer wallets and scale
- Largest distributor of digital music in Africa and recently launched ‘Games Club’
Good progress made by e-commerce ventures AIH and MEIH
- AIH recorded 3 million customers and 2.5 million transactions – impacted by macro-economic slow down in Nigeria
- MEIH recorded 600 000 customers and 3.3 million transactions
- IIG gained strong momentum benefiting from youthful population and high internet penetration
MoMo customers increased 5.0% to 36.5 million, supported by Uganda, Ghana, Rwanda and Benin
MoMo revenue up 40,8% to R1 289 million
Enterprise
Business Unit
Aligned operations to become ‘ICT Partner of Choice’ to corporates, public sector and SMEs
The Group will embark on a process aimed to accelerate growth as part of the strategic group review
Continued focus on MTN Business Cloud now providing independent software vendor solutions
Expansion of MTN Global, multi protocol label switching (MPLS) bringing the footprint to 27 POPs
Launched dedicated internet services to clients in 11 markets and Internet of Things platform to
Ghana and Cameroon
STRATEGIC AND
OPERATIONAL UPDATE
9
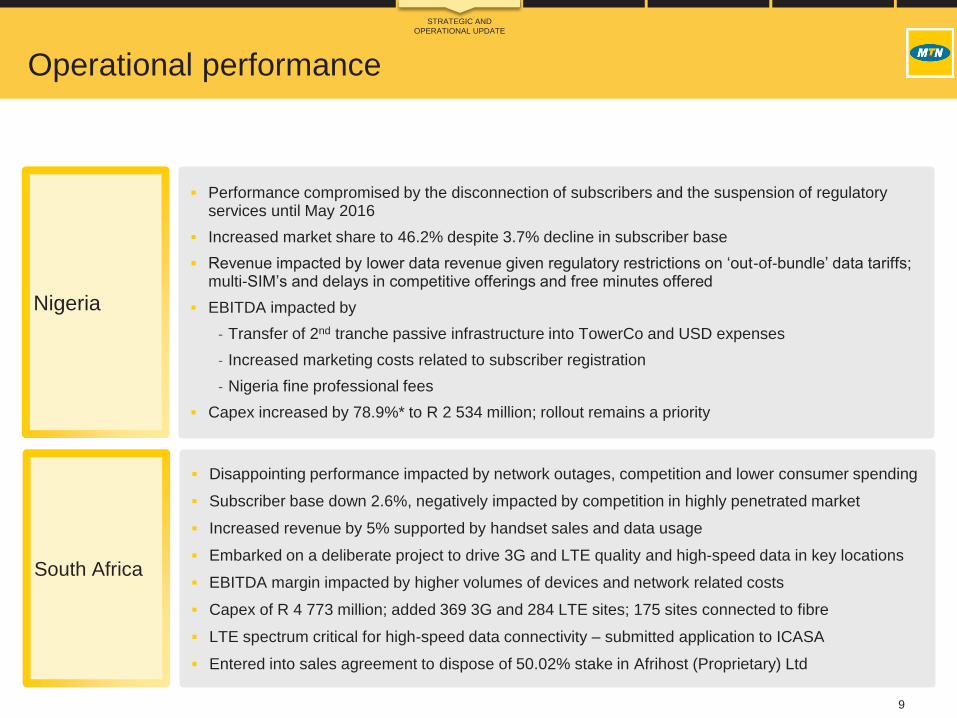
Operational performance
Performance compromised by the disconnection of subscribers and the suspension of regulatory services until May 2016
Increased market share to 46.2% despite 3.7% decline in subscriber base
Revenue impacted by lower data revenue given regulatory restrictions on ‘out-of-bundle’ data tariffs; multi-SIM’s and delays in competitive offerings and free minutes offered
EBITDA impacted by
- Transfer of 2nd tranche passive infrastructure into TowerCo and USD expenses
- Increased marketing costs related to subscriber registration
- Nigeria fine professional fees
Capex increased by 78.9%* to R 2 534 million; rollout remains a priority
Disappointing performance impacted by network outages, competition and lower consumer spending
Subscriber base down 2.6%, negatively impacted by competition in highly penetrated market
Increased revenue by 5% supported by handset sales and data usage
Embarked on a deliberate project to drive 3G and LTE quality and high-speed data in key locations
EBITDA margin impacted by higher volumes of devices and network related costs
Capex of R 4 773 million; added 369 3G and 284 LTE sites; 175 sites connected to fibre
LTE spectrum critical for high-speed data connectivity – submitted application to ICASA
Entered into sales agreement to dispose of 50.02% stake in Afrihost (Proprietary) Ltd
Nigeria
South Africa
STRATEGIC AND
OPERATIONAL UPDATE
10
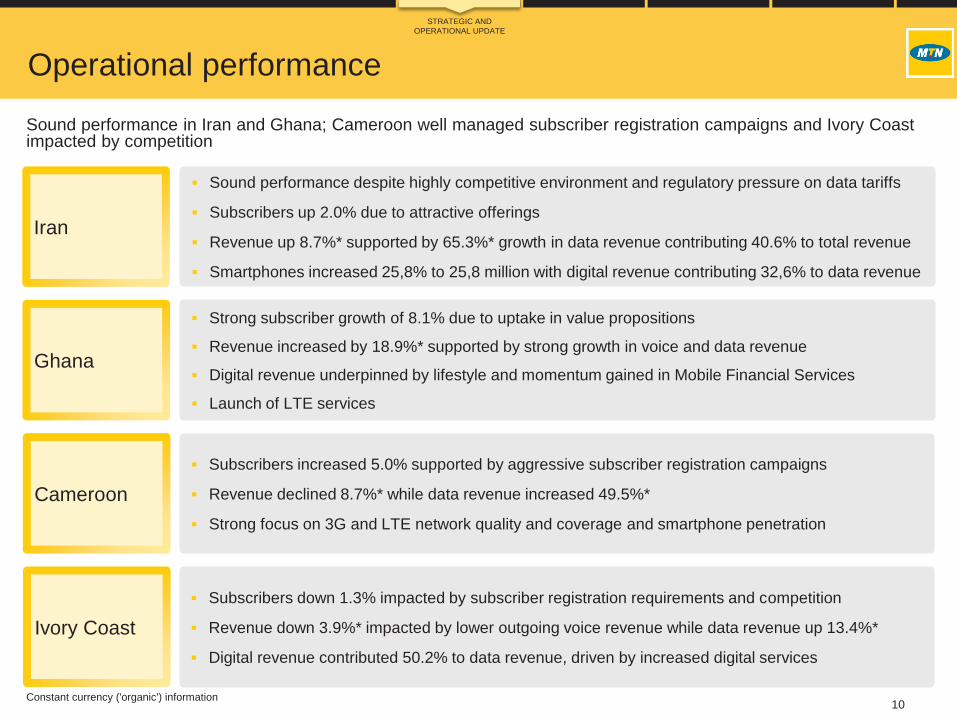
Sound performance in Iran and Ghana; Cameroon well managed subscriber registration campaigns and Ivory Coast impacted by competition
Operational performance
Sound performance despite highly competitive environment and regulatory pressure on data tariffs
Subscribers up 2.0% due to attractive offerings
Revenue up 8.7%* supported by 65.3%* growth in data revenue contributing 40.6% to total revenue
Smartphones increased 25,8% to 25,8 million with digital revenue contributing 32,6% to data revenue
Iran
Ghana
Cameroon
Ivory Coast
Strong subscriber growth of 8.1% due to uptake in value propositions
Revenue increased by 18.9%* supported by strong growth in voice and data revenue
Digital revenue underpinned by lifestyle and momentum gained in Mobile Financial Services
Launch of LTE services
Subscribers increased 5.0% supported by aggressive subscriber registration campaigns
Revenue declined 8.7%* while data revenue increased 49.5%*
Strong focus on 3G and LTE network quality and coverage and smartphone penetration
Subscribers down 1.3% impacted by subscriber registration requirements and competition
Revenue down 3.9%* impacted by lower outgoing voice revenue while data revenue up 13.4%*
Digital revenue contributed 50.2% to data revenue, driven by increased digital services
STRATEGIC AND
OPERATIONAL UPDATE
Constant currency ('organic') information

Financial review
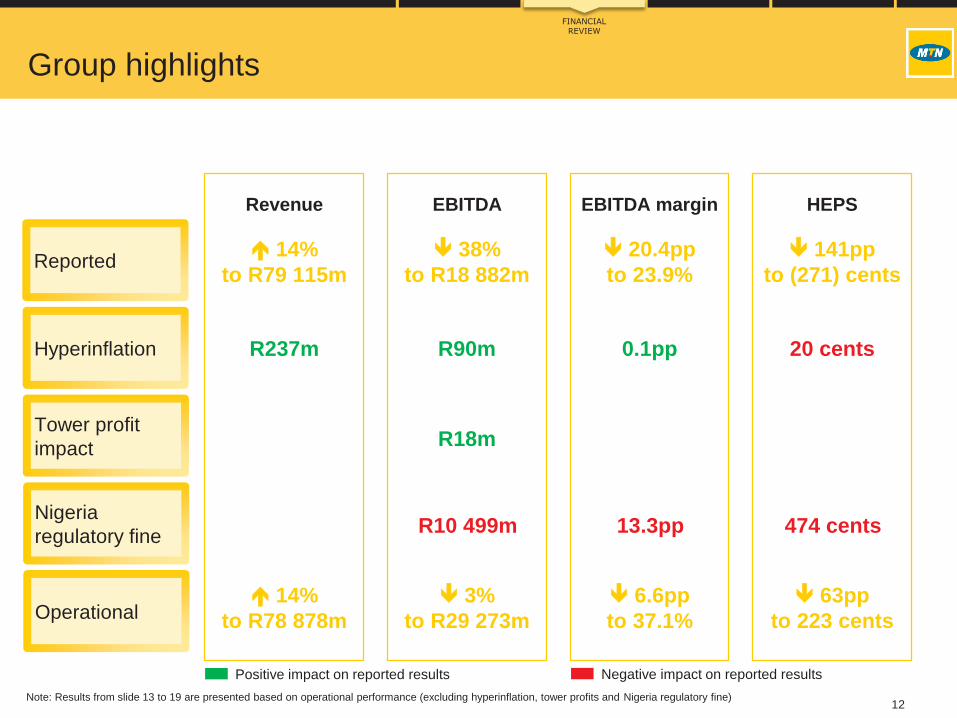
12Note: Results from slide 13 to 19 are presented based on operational performance (excluding hyperinflation, tower profits and Nigeria regulatory fine)
Group highlights
14%
to R79 115m
38%
to R18 882m
20.4pp
to 23.9%
141pp
to (271) cents
R237m R90m 0.1pp 20 cents
R18m
14%
to R78 878m
3%
to R29 273m
6.6pp
to 37.1%
63pp
to 223 cents
Revenue EBITDA EBITDA margin HEPS
Reported
Hyperinflation
Tower profit
impact
Nigeria
regulatory fine
Operational
R10 499m 13.3pp 474 cents
Positive impact on reported results Negative impact on reported results
FINANCIAL REVIEW
13
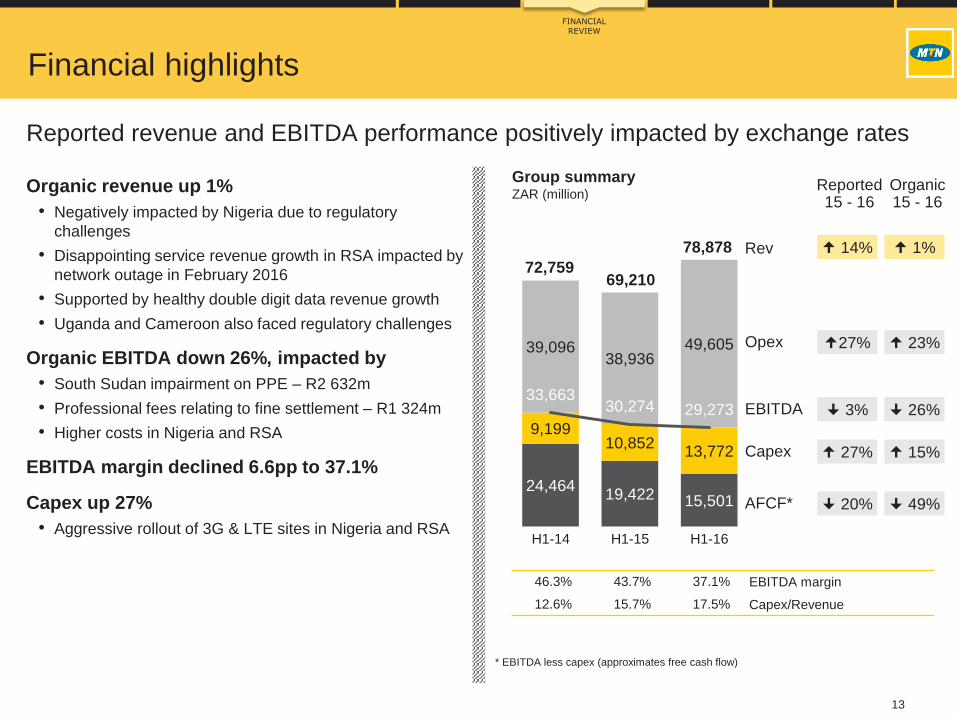
* EBITDA less capex (approximates free cash flow)
Financial highlights
Organic revenue up 1%
• Negatively impacted by Nigeria due to regulatory
challenges
• Disappointing service revenue growth in RSA impacted by
network outage in February 2016
• Supported by healthy double digit data revenue growth
• Uganda and Cameroon also faced regulatory challenges
Organic EBITDA down 26%, impacted by
• South Sudan impairment on PPE – R2 632m
• Professional fees relating to fine settlement – R1 324m
• Higher costs in Nigeria and RSA
EBITDA margin declined 6.6pp to 37.1%
Capex up 27%
• Aggressive rollout of 3G & LTE sites in Nigeria and RSA
Reported revenue and EBITDA performance positively impacted by exchange rates
24,464 19,422 15,501
9,199 10,852
13,772
39,096 38,936
49,605
72,75969,210
78,878
33,66330,274 29,273
H1-14 H1-15 H1-16
46.3% 43.7% 37.1% EBITDA margin
12.6% 15.7% 17.5% Capex/Revenue
Rev
Opex
EBITDA
Capex
AFCF*
14%
27%
3%
27%
20%
1%
23%
26%
15%
49%
Reported15 - 16
Organic15 - 16
Group summary ZAR (million)
FINANCIAL REVIEW
14
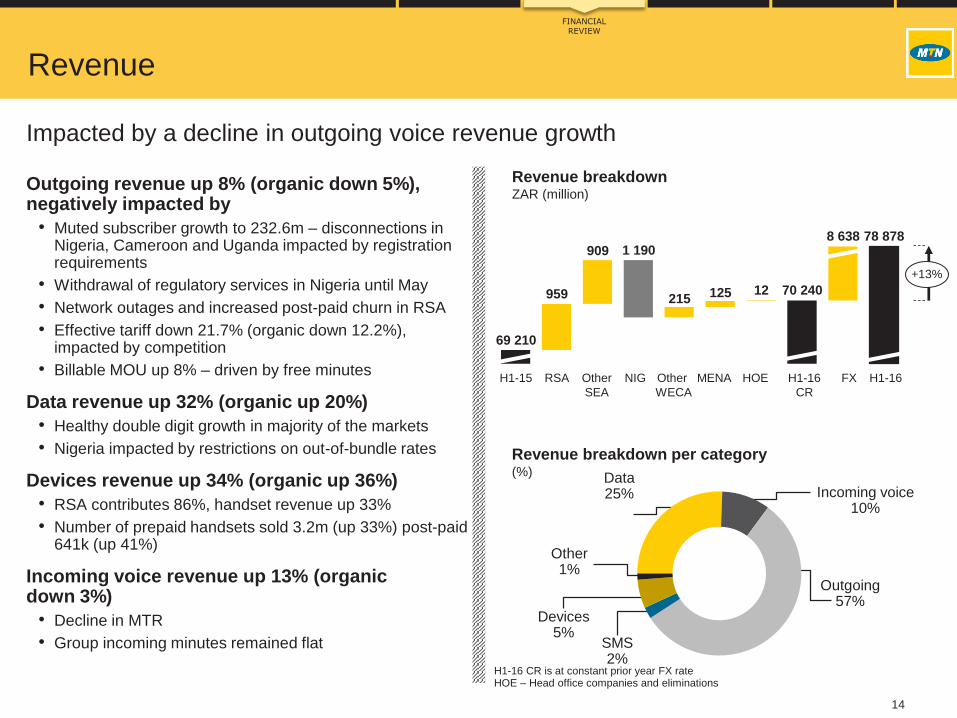
H1-16 CR is at constant prior year FX rate HOE – Head office companies and eliminations
Revenue
Impacted by a decline in outgoing voice revenue growth
Outgoing revenue up 8% (organic down 5%), negatively impacted by
• Muted subscriber growth to 232.6m – disconnections in Nigeria, Cameroon and Uganda impacted by registration requirements
• Withdrawal of regulatory services in Nigeria until May
• Network outages and increased post-paid churn in RSA
• Effective tariff down 21.7% (organic down 12.2%), impacted by competition
• Billable MOU up 8% – driven by free minutes
Data revenue up 32% (organic up 20%)
• Healthy double digit growth in majority of the markets
• Nigeria impacted by restrictions on out-of-bundle rates
Devices revenue up 34% (organic up 36%)
• RSA contributes 86%, handset revenue up 33%
• Number of prepaid handsets sold 3.2m (up 33%) post-paid 641k (up 41%)
Incoming voice revenue up 13% (organic down 3%)
• Decline in MTR
• Group incoming minutes remained flat
Revenue breakdownZAR (million)
69 210
FINANCIAL REVIEW
RSA H1-16
CR
NIG FX H1-16H1-15 Other
WECA
MENA HOEOther
SEA
959
909 1 190
215 125 12 70 240
8 638 78 878
+13%
Revenue breakdown per category(%) Data
25% Incoming voice10%
Outgoing57%
SMS2%
Devices5%
Other1%

15
H1-16 CR is at constant prior year FX rate HOE – Head office companies and eliminations
Revenue – data
Increased data revenue contribution at 25%
Data revenue up 32% (organic up 20%)
• Strong data revenue growth despite 59% decline in data
tariff (organic decline 47%)
• Continued improvements of 3G and LTE networks across
operations (data traffic up 135%)
• Increased device penetration (no. of smartphones on
network up 26%)
• Increased contribution from digital service revenue
Nigeria data revenue
• Impacted by regulatory restrictions on “out of bundle” data
tariffs
Digital and MFS services revenue contributed
32% to data revenue
• Increased up-take in lifestyle content
• Continued growth in MFS
Data revenueZAR (million)
FINANCIAL REVIEW
15 013
1 089469 125
1 071465 12 17 970
1 879 19 849
RSA H1-16
CR
NIG FX H1-16H1-15 Other
WECA
MENA HOEOther
SEA
+12.5%
Access data58%
VAS4%
ICT6%
Digital26%
MFS6%
Data breakdown per category(%)
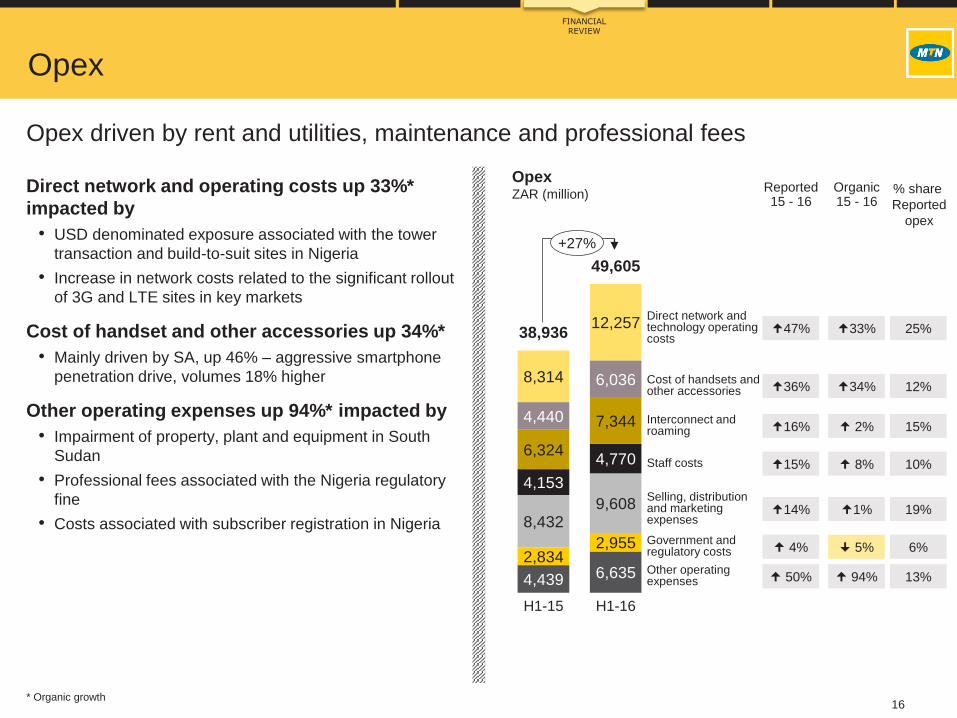
16* Organic growth
Opex
Direct network and operating costs up 33%*
impacted by
• USD denominated exposure associated with the tower
transaction and build-to-suit sites in Nigeria
• Increase in network costs related to the significant rollout
of 3G and LTE sites in key markets
Cost of handset and other accessories up 34%*
• Mainly driven by SA, up 46% – aggressive smartphone
penetration drive, volumes 18% higher
Other operating expenses up 94%* impacted by
• Impairment of property, plant and equipment in South
Sudan
• Professional fees associated with the Nigeria regulatory
fine
• Costs associated with subscriber registration in Nigeria
Opex driven by rent and utilities, maintenance and professional fees
4,439 6,635 2,834
2,955
8,432 9,608
4,153
4,770 6,324
7,344 4,440
6,036 8,314
12,257 38,936
49,605
H1-15 H1-16
Direct network and technology operating costs
Cost of handsets and other accessories
Interconnect and roaming
Staff costs
Selling, distribution and marketing expenses
Other operating expenses
+27%
OpexZAR (million)
Government and regulatory costs
FINANCIAL REVIEW
33%
34%
2%
8%
1%
5%
94%
Organic15 - 16
25%
12%
15%
10%
19%
6%
13%
% share
Reported
opex
47%
36%
16%
15%
14%
4%
50%
Reported15 - 16
17
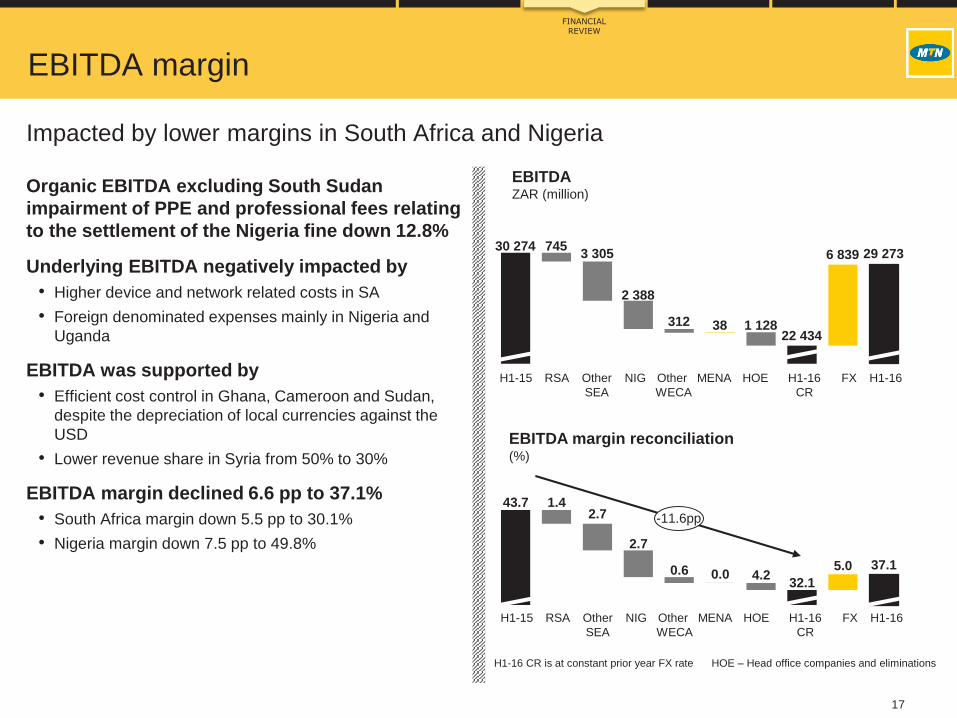
EBITDA margin
H1-16 CR is at constant prior year FX rate HOE – Head office companies and eliminations
Impacted by lower margins in South Africa and Nigeria
Organic EBITDA excluding South Sudan
impairment of PPE and professional fees relating
to the settlement of the Nigeria fine down 12.8%
Underlying EBITDA negatively impacted by
• Higher device and network related costs in SA
• Foreign denominated expenses mainly in Nigeria and
Uganda
EBITDA was supported by
• Efficient cost control in Ghana, Cameroon and Sudan,
despite the depreciation of local currencies against the
USD
• Lower revenue share in Syria from 50% to 30%
EBITDA margin declined 6.6 pp to 37.1%
• South Africa margin down 5.5 pp to 30.1%
• Nigeria margin down 7.5 pp to 49.8%
EBITDAZAR (million)
FINANCIAL REVIEW
RSA H1-16
CR
NIG FX H1-16H1-15 Other
WECA
MENA HOEOther
SEA
30 274 7453 305
2 388
312 38 1 12822 434
6 839 29 273
EBITDA margin reconciliation(%)
43.7 1.42.7
2.7
0.6 0.0 4.232.1
5.0 37.1
RSA H1-16
CR
NIG FX H1-16H1-15 Other
WECA
MENA HOEOther
SEA
-11.6pp

18
Finance cost
Net interest paid more than doubled to
ZAR 1 855m
• Increase in net debt by 187%: ZAR 49.3bn (H1-15: ZAR
17.2bn)
Forex loss ZAR 3 606m impacted by fx
movements
• Nigeria losses mainly due to USD denominated
intercompany loans and third party payables
• Mauritius forex losses mainly on Iran receivables
• South Sudan forex losses mainly on USD third party trade
payables
• Sudan forex losses on settlement of USD denominated
third party trade payables
• RSA forex losses on derivatives hedging foreign payables
Impacted by higher net interest paid and fx losses
H1-16 H1-15 H1-14
Net interest paid 1 855 839 932
Net forex losses 3 606 1 481 736
Total 5 461 2 320 1 668
H1-16 H1-15 H1-14
Nigeria 1 124 769 129
Mauritius 1 078 253 104
South Sudan 408 - 19
Sudan 395 (83) (4)
RSA 178 77 54
Manco 141 (4) (3)
Other 282 469 437
Total 3 606 1 481 736
Net finance costZAR (million)
Net forex losses/(gains)ZAR (million)
FINANCIAL REVIEW

19
Taxation
(461) (472)(1 573)
6 6725 672 5 661
1,042
1,023 606
7 253
6 2234 694
H1-14 H1-15 H1-16
Normalised Group effective tax rate of 49.2%
(H1-15: 32.9%)
• Reported group effective tax rate impacted by the Nigeria
regulatory fine and hyperinflation
• Normalised group effective tax rate impacted by lower
PBT due to
- Decrease in equity income from joint ventures and
associates
- Nigeria professional fees
- South Sudan unrealised forex losses and PPE
impairment and
- Conakry goodwill impairment
Normalised withholding tax
• 6.3% (prior year 5.4%) – WHT is lower than prior year in
absolute terms due to lower dividends up-streamed
Current tax
• Current tax largely unchanged
Deferred tax – income statement
• Nigeria unrealised forex losses on USD denominated
intercompany loans and third party payables
-14%-25%
TaxZAR (million)
Normal taxDef taxWHT
31.5% 32.9% 49.2% Eff tax rate %
FINANCIAL REVIEW
Share of
results JVs
and assoc
Forex
losses
S Sdn
Adj eff
tax rate
Eff
Tax rate
Goodwill
impairment
PPE
impairment
S Sdn
Professional
fees
NIG
49.2 9.6
3.41.3 1.2 0.7 33.0
-16.2pp
Group effective taxZAR (million)

20
ZAR (million) H1-16 H1-15 Change %
Revenue 79 115 69 304 14
Other income 367 411 (11)
COS and operating expenses 50 101 39 040 28
EBITDA before Nigeria regulatory fine 29 381 30 675 (4)
Nigeria regulatory fine 10 499 - 100
EBITDA 18 882 30 675 (38)
Depreciation, amortisation and impairment of goodwill 13 691 10 750 27
Profit from operations 5 191 19 925 (74)
Net finance cost 5 945 2 319 156
Share of results from joint ventures and associates after tax (1 692) 2 027 (184)
Net monetary gain 919 496 85
(Loss)/profit before tax (1 527) 20 129 (108)
Income tax expense 4 726 6 249 (24)
(Loss)/profit after tax (6 253) 13 880 (145)
Non-controlling interests (764) 1 980 (139)
Attributable (loss)/profit (5 489) 11 900 (146)
Income statement (IFRS)
Impacted by losses from JV’s and fx
FINANCIAL REVIEW
21
669 729 654
(271)
742807
92
402
474
1,4111,536
1,148
203
2013 2014 2015 H1-16
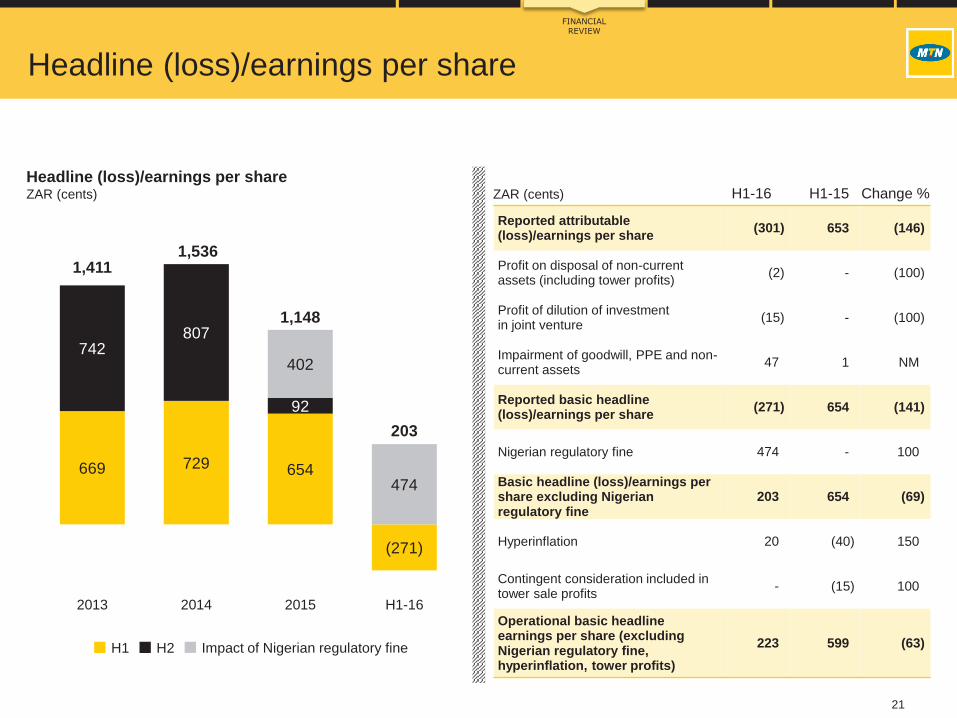
Headline (loss)/earnings per share
H1-16 H1-15 Change %
Reported attributable (loss)/earnings per share
(301) 653 (146)
Profit on disposal of non-current assets (including tower profits)
(2) - (100)
Profit of dilution of investment in joint venture
(15) - (100)
Impairment of goodwill, PPE and non-current assets
47 1 NM
Reported basic headline (loss)/earnings per share
(271) 654 (141)
Nigerian regulatory fine 474 - 100
Basic headline (loss)/earnings per share excluding Nigerian regulatory fine
203 654 (69)
Hyperinflation 20 (40) 150
Contingent consideration included in tower sale profits
- (15) 100
Operational basic headline earnings per share (excluding Nigerian regulatory fine, hyperinflation, tower profits)
223 599 (63)
Headline (loss)/earnings per shareZAR (cents) ZAR (cents)
FINANCIAL REVIEW
Impact of Nigerian regulatory fineH1 H2

22
5,979 6,8808,225 8,808
4,585
9,362
12,302
14,69415,2192,088
2,422
17,429
19,182
25,34124,027
4,585
2012 2013 2014 2015 H1-16
H1 H2 Share buy back
Shareholder returns
Dividends
• Interim dividend 250cps, 48% decline
Share buy-backs
• H2-11 repurchased 6.8m shares (ZAR 930m)
• H1-12 repurchased 15.6m shares (ZAR 2.1bn)
• H2-14 repurchased 10.7m shares (ZAR 2.4bn)
• Total repurchase of 1.8% of issued shares since 2011
Dividends and share buy-backsZAR (million)
FINANCIAL REVIEW

23
ZAR (million) 2016 Dec 2015
Property, plant and equipment 93 462 106 702
Goodwill and other intangible assets 52 172 55 887
Other non-current assets 54 813 55 846
Cash 26 955 34 177
Current assets* 55 513 61 255
Total assets 282 915 313 867
Total equity 119 796 151 838
Interest-bearing liabilities 81 947 75 171
Other liabilities 81 172 86 858
Total liabilities 163 119 162 029
Total equity and liabilities 282 915 313 867
Net debt 49 257 31 635
Annualised net debt/EBITDA excluding Nigerian regulatory fine 0.83 0.46
ZAR strengthened against most other African currencies (Naira 50%, Cedi 4%, Uganda Shilling 7% and Syrian Pound 52%) since Dec 2015
*Includes foreign currency deposits of ZAR 1 123m (Dec 2015 ZAR 428m), treasury bills and commercial papers of ZAR 3 926m (Dec 2015 ZAR 7 196m) and bonds of ZAR 49m (Dec 2015 ZARnil)
Statement of financial position (IFRS)
Total assets impacted by FCTR
FINANCIAL REVIEW

24
ZAR (million) H1-16 H1-15 Change %
Cash generated from operations^ 23 870 26 289 (9)
Dividends paid to equity holders of the Company (15 212) (14 697) (4)
Dividends paid to non-controlling interests (790) (3 042) 74
Dividends received from associates and joint ventures 426 285 49
Net interest paid (2 143) (934) (129)
Tax paid (6 587) (6 469) (2)
Cash (used in)/generated from operating activities (436) 1 432 (130)
Acquisition of property, plant and equipment and intangible assets (14 024) (11 830) (19)
Movement in investments and other investing activities (185) (2 641) 93
Cash used in investing activities (14 209) (14 471) 2
Cash generated by financing activities 13 608 1 558 NM
Cash and cash equivalents at the beginning of the year 34 139 43 072 (21)
Effect of exchange rates on cash and equivalents (6 272) (787) NM
Net monetary gain on cash and cash equivalents 107 134 (20)
Cash and cash equivalents at the end of the year* 26 937 30 938 (13)
^Cash generated from operations decreased by R2.4bn mainly as a result of Nigerian payments on regulatory fine (R5.9bn)* Includes bank overdraft of R18m (H1-15: R76m)
Statement of cash flows (IFRS)
Impacted by R5.9bn payment made on Nigerian regulatory fine
FINANCIAL REVIEW

2016 Guidance

26
(‘000)
Guidanceprovided
March 2016
Updated guidance
June 2016
SEA 3 515 1 850
South Africa 1 100 1 100
Uganda 1 800 950
Other 615 (200)
WECA 6 825 4 725
Nigeria 3 500 800
Ghana 1 100 1 800
Cameroon 1 000 1 000
Ivory Coast 400 475
Other 825 650
MENA 1 610 1 500
Iran 1 100 1 500
Syria - (100)
Sudan 350 400
Other 160 (300)
Total 11 950 8 075
Net additions guidance
Guidance 2016
2016
GUIDANCE

27
ZAR (million)
Authorised
2016
Capitalised
June 2016
Capitalised
June 2015
SEA 13 548 5 626 5 896
South Africa 11 280 4 773 4 678
Uganda 807 364 556
Other 1 461 489 662
WECA 16 162 6 975 3 652
Nigeria 11 130 2 534 1 172
Ghana 1 258 1 646 355
Cameroon 1 157 1 121 943
Ivory Coast 815 842 422
Other 1 802 832 760
MENA 3 539 1 064 732
Syria# 1 543 191 56
Sudan# 1 280 549 337
Other 716 324 339
Head office companies and eliminations 1 865 107 572
Total 35 114 13 772 10 852
Hyperinflation - 78 17
Total reported 35 114 13 850 10 869
Iran (49%)# 3 518 2 313 1 854
#Excluding hyperinflation
Capex guidance
2016
GUIDANCE

Key matters and immediate priorities

29
Appointment of the right CEO to take MTN forward into new growth phase
Key matters and immediate priorities
VP’s to strengthen management team, further changes to be completed by year-end
More in-depth commercial, risk and governance skills and experience
KEY MATTERS AND
IMMEDIATE PRIORITIES
New Group
CEO
Appointment of Rob Shuter, new Group president and CEO, as soon as practically possible in 2017 (no later than July 2017)
Brings extensive experience in Africa and Europe – previously CEO Vodafone Europe cluster
In the interim, Phuthuma to hand over more operational responsibility to key executives
High calibre
Management
team
Stephen van Coller, VP for M&A and strategy
Godfrey Motsa, VP for SEA region (excluding South Africa)
Gunter Engling to act as CFO, following the resignation of Brett Goschen
Babak Fouladi, Group CTIO and CTO of South Africa for 12 months
Phuthuma Nhleko to revert to non-executive Chairman role as soon as Rob Shuter joins the Group
Refreshed
composition
of the board
Stan Miller, Paul Hanratty and Nkululeko “Nkunku” Sowazi appointed to Group board
Mike Harper, Mike Bosman, Lerato Phalatse and Trudi Makhaya appointed to MTN South Africa board

30
Deep and fundamental strategic review of operations and processes to
ensure the Group is operating far more optimally
Prospects
Advanced analytics will support network quality, high speed data connectivity, improved customer
service and segmented offerings
Increased operating efficiencies and improving customer services focusing on improved service
channels productivity and MoMo as a distribution channel
Creating value through leveraging its extensive infrastructure
Embark on a process of housing new revenue streams, particularly digital services, outside the core
business enabling more agility and greater flexibility to accelerate growth
New revenue streams expected to increase contribution in next 12-18 months
Areas to be
addressed
KEY MATTERS AND
IMMEDIATE PRIORITIES
Tower
investments
Investments in towers with IHS evidenced by substantial ownership interest in INT and direct
investments in IHS
IHS is well positioned for future growth and build-out from 3G upgrades and move to LTE across its
key markets
IHS is now the largest independent tower operator in EMEA by tower count and tenth largest
independent tower company in the world with 24 000 towers
Recently led in-country consolidation through its acquisition of Helios Towers Nigeria

31
Prospects
KEY MATTERS AND
IMMEDIATE PRIORITIES
Expect improved operating conditions supported by permanent and refreshed management team
Strong operational oversight ensuring regulatory compliance across operations
Operating
conditions
Nigeria
South Africa
Iran
Aims to list MTN Nigeria on Nigeria Stock Exchange during 2017, subject to prevailing market
conditions and appropriate regulatory approval
Expect improved competitiveness and performance following reinstatement of regulatory services
Data performance to benefit from increased investment in 3G and LTE and recently acquired
spectrum
Expect improved performance supported by strong focus on customer service and improving the
network quality, capacity and speed
Data growth will benefit from significant investment and deliberate focus in 3G and LTE
Significant opportunities to expand digital services supported by easing of sanctions
Expect improvements in operating environment supported by a reduction in inflation and normalised
exchange rate
Working towards remittance of approximately R15.4 billion

Questions

thank you

Appendices

35
South Africa
Revenue growth of 5.1%
Subscribers down 2.6% to 29.8 million
• Negatively impacted by network outages in some areas,
competition and economic pressure affecting consumer
spending
• Pre-paid and post-paid segments declined by 2.7% to
24.7 million and 2.1% to 5.1 million respectively
Strong data revenue growth, supported by
smartphones
• Strong data revenue growth, up 19.2%, contributing
34.1% to total revenue attributable to
- Smartphones up 18.4% to 9.3 million
- Improved 3G and LTE network quality
- Additional services being offered in digital, including
international content
• Device sales in the previous comparable period were
impacted by the industrial strike action and supply chain
challenges
22,574 25,346 24 673
5,4195,242 5,132
27,99330,588 29 805
Dec 14 Dec 15 Jun 16
Total subscribers ‘000
Postpaid
Prepaid
19,157 18,882 19,841
19,765 21,156
38,922 40,038
19,841
Dec 14 Dec 15 Jun 16
Revenue ZAR (million)
H2
H1
Launched Jun 1994 Market share 32.3% Population 55.7m Market size 2016 96m Penetration 162% Shareholding 100%

36
South Africa
Strong focus on network experience
EBITDA margin down 5.5 pp
• Mainly due to
- Increased device costs relating to higher volumes sold
- Impact of network related costs as a result of the rollout
of 3G and LTE sites
Focus on improving network quality and capacity
• Capex of R4 773 million
• Rollout of 369 co-located 3G sites and 284 LTE sites
• 175 sites were connect to fibre
• 10 000 homes passed with fibre to the home, 40% rolled
out over the six month period
• Invitation to apply for high demand spectrum – 700MHz,
800MHz and 2.6GHz bands
12,775 12,158 13,862
13,638 14,510
26,413 26,668
13 862
Dec 14 Dec 15 Jun 16
Expenses ZAR (million)
H2
H1
2,0004,678 4,773
3,676
6,2705,676
10,948
4,773
Dec 14 Dec 15 Jun 16
Capex ZAR (million)
H2
H1
32.1% 33.4% 30.1% EBITDA margin

37
Nigeria
* Constant currency ('organic') information
Challenging operating environment
Subscriber decline of 3.7%
• Market share increased by 46.2% despite the decline in
subscriber base to 58.9 million (including 568 000
Visafone subscribers)
• Inability to offer competitive prices as a result of the
suspension of regulatory services until May 2016, when
approval was received
Revenue declined 4.8%*
• Lower outgoing voice and data revenue impacted by
regulatory requirements, multi-SIMs and tough economic
conditions
• Data revenue declined 2.7%*, contributing
19.3% to total revenue
- 11.2% increase in smartphones to 16 million
- Digital revenue continued to gain momentum – music
and lifestyle
- Diamond Yellow increased to 6.5 million registered
accounts
59,893
61,252
58 978
Dec 14 Dec 15 Jun 16
Total subscribers ‘000
413,611 408,999 389,345
411,195 398,450
824,806 807,449
389,345
Dec 14 Dec 15 Jun 16
Revenue NGN (million)
H2
H1
Launched Aug 2001 Market share 46.2% Population 174.3 m Market size 2016 133m Penetration 72% Shareholding 78.8%
38
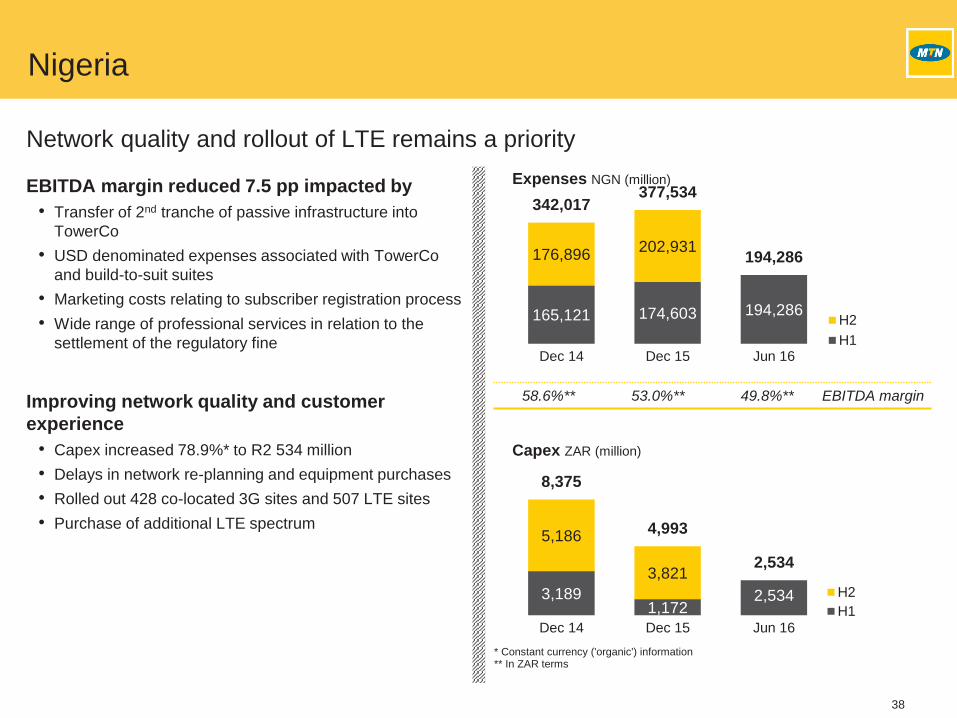
Nigeria
* Constant currency ('organic') information** In ZAR terms
Network quality and rollout of LTE remains a priority
EBITDA margin reduced 7.5 pp impacted by
• Transfer of 2nd tranche of passive infrastructure into
TowerCo
• USD denominated expenses associated with TowerCo
and build-to-suit suites
• Marketing costs relating to subscriber registration process
• Wide range of professional services in relation to the
settlement of the regulatory fine
Improving network quality and customer
experience
• Capex increased 78.9%* to R2 534 million
• Delays in network re-planning and equipment purchases
• Rolled out 428 co-located 3G sites and 507 LTE sites
• Purchase of additional LTE spectrum
165,121 174,603 194,286
176,896202,931
342,017377,534
194,286
Dec 14 Dec 15 Jun 16
Expenses NGN (million)
H2
H1
3,1891,172
2,534
5,186
3,821
8,375
4,993
2,534
Dec 14 Dec 15 Jun 16
Capex ZAR (million)
H2
H1
58.6%** 53.0%** 49.8%** EBITDA margin

39
Iran
*Constant currency ('organic') information **In ZAR terms***Excluding hyperinflation
Revenue growth of 8.7%* supported by increased data revenue growth
Subscriber growth of 2.0% to 47.3 million
• Attractive segmented offerings, data bundles and
improved network experience
Strong data revenue
• Data revenue increased 65.3%*, contributing 40.6% to
total revenue despite regulatory pressure on data tariffs
• Smartphones increased 25.8% to 25.8 million
• Digital revenue contributed 32.6% to data revenue due to
strong growth in local lifestyle content based usage
• Outgoing voice revenue negatively impacted by the
continuous substitution of data services
EBITDA down 2.4 pp
• Mainly due to increased transmission costs associated
with the data network expansion, as well as marketing
costs related to 3G and LTE campaigns
3G and LTE networks expansion
• Added 1 783 co-located 3G sites and 851 LTE sites
27,260 31,038 33,739
29,46632,281
56,72663,319
33,739
Dec 14*** Dec 15*** Jun 16***
Revenue IRR (billion)
(100%)
H2
H1
8911,854 2,313
2,221
2,326
3,112
4,180
2 313
Dec 14*** Dec 15*** Jun 16***
Capex ZAR (million)
(49%)
H2
H1
42.8%** 41.5%** 37.7%** EBITDA margin
Launched Oct 2006 Market share 46.4% Population 80.6m Market size 2016 101m Penetration 126% Shareholding 49%
40
Ghana
*Constant currency ('organic') information**In ZAR terms
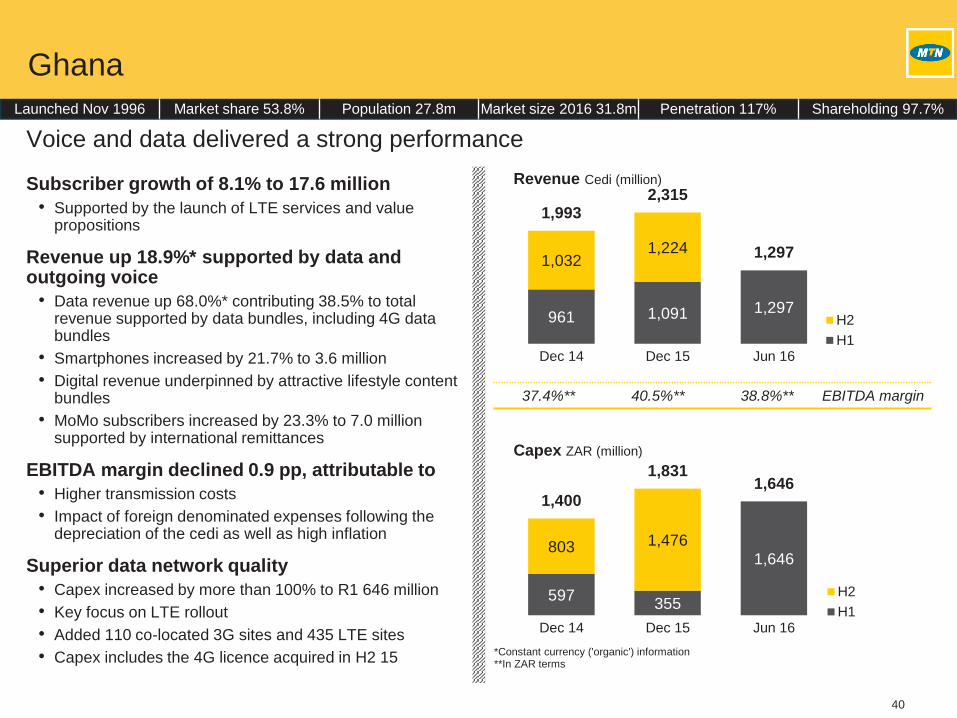
Voice and data delivered a strong performance
Subscriber growth of 8.1% to 17.6 million
• Supported by the launch of LTE services and value propositions
Revenue up 18.9%* supported by data and outgoing voice
• Data revenue up 68.0%* contributing 38.5% to total revenue supported by data bundles, including 4G data bundles
• Smartphones increased by 21.7% to 3.6 million
• Digital revenue underpinned by attractive lifestyle content bundles
• MoMo subscribers increased by 23.3% to 7.0 million supported by international remittances
EBITDA margin declined 0.9 pp, attributable to
• Higher transmission costs
• Impact of foreign denominated expenses following the depreciation of the cedi as well as high inflation
Superior data network quality
• Capex increased by more than 100% to R1 646 million
• Key focus on LTE rollout
• Added 110 co-located 3G sites and 435 LTE sites
• Capex includes the 4G licence acquired in H2 15
961 1,091 1,297
1,0321,224
1,9932,315
1,297
Dec 14 Dec 15 Jun 16
Revenue Cedi (million)
H2
H1
597355
1,646803 1,476
1,400
1,8311,646
Dec 14 Dec 15 Jun 16
Capex ZAR (million)
H2
H1
37.4%** 40.5%** 38.8%** EBITDA margin
Launched Nov 1996 Market share 53.8% Population 27.8m Market size 2016 31.8m Penetration 117% Shareholding 97.7%

41
Cameroon
*Constant currency ('organic') information**In ZAR terms
Aggressive subscriber registration campaigns
Subscribers up 5.0% to 9.6 million
• Market share growth attributable to improved network
quality, expansion of LTE footprint and increased
smartphone penetration
Revenue declined 8.7%*
• Decline in outgoing voice revenue impacted by price
competition and free minutes used as part of subscriber
registration process
• Data revenue increased 49.5%* and contributes 18.8% to
total revenue, supported by increased 3G device
penetration and network rollout
• Smartphones increased by 34.1% to 2.6 million
• Mobile Money brand campaign increased activity
EBITDA margin up 0.2 pp
• Supported by strong cost optimisation
• Reduction in transmission costs due to WACS cable
Focus on 3G and LTE network rollout and quality
• 6.9%* increase in capex to R1 121 million
• 189 co-located 3G sites and 64 LTE sites rolled out
136,593 135,986 124,152
146,776 134,244
283,369 270,230
124,152
Dec 14 Dec 15 Jun 16
Revenue CFA (million)
H2
H1
373943 1 121489
968862
1,911
1,121
Dec 14 Dec 15 Jun 16
Capex ZAR (million)
H2
H1
42.8%** 36.2%** 38.0%** EBITDA margin
Launched Feb 2000 Market share 57.4% Population 23.6m Market size 2016 18.5m Penetration 71% Shareholding 70%
42
Ivory Coast
*Constant currency ('organic') information**In ZAR terms
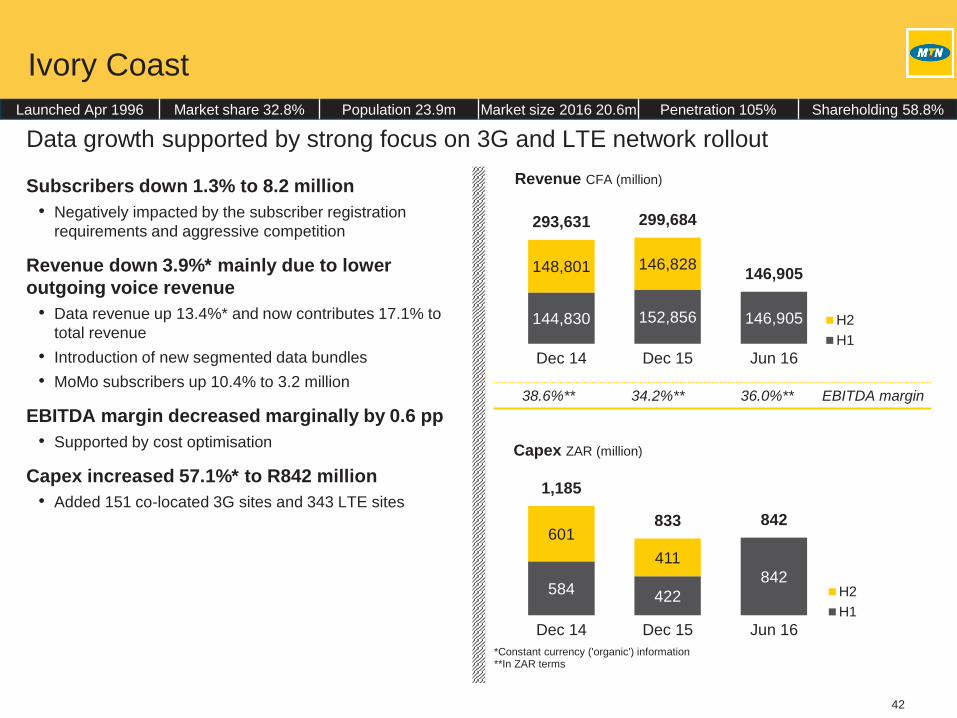
Data growth supported by strong focus on 3G and LTE network rollout
Subscribers down 1.3% to 8.2 million
• Negatively impacted by the subscriber registration
requirements and aggressive competition
Revenue down 3.9%* mainly due to lower
outgoing voice revenue
• Data revenue up 13.4%* and now contributes 17.1% to
total revenue
• Introduction of new segmented data bundles
• MoMo subscribers up 10.4% to 3.2 million
EBITDA margin decreased marginally by 0.6 pp
• Supported by cost optimisation
Capex increased 57.1%* to R842 million
• Added 151 co-located 3G sites and 343 LTE sites
144,830 152,856 146,905
148,801 146,828
293,631 299,684
146,905
Dec 14 Dec 15 Jun 16
Revenue CFA (million)
H2
H1
584 422
842
601
411
1,185
833 842
Dec 14 Dec 15 Jun 16
Capex ZAR (million)
H2
H1
38.6%** 34.2%** 36.0%** EBITDA margin
Launched Apr 1996 Market share 32.8% Population 23.9m Market size 2016 20.6m Penetration 105% Shareholding 58.8%

43
Uganda
*Constant currency ('organic') information**In ZAR terms
Gaining momentum post subscriber registration process
Subscribers increased 10.8% to 9.9 million
• Supported by voice bundle propositions and continued
success of MTN Zone
• MoMo decreased registered subscribers by 24.4% to 7.2
million mainly due to H2 2015 disconnections during the
subscriber registration process
Revenue decreased 2.3%*
• Voice revenue impacted by One Network Area, decline in
mobile termination rates and disconnections
• Data revenue up 22.7%*, contributing 32.8% to total
revenue – supported by data bundles
• Digital revenue contributed 70.5% to data revenue
supported by local content services including MTN Play.
EBITDA margin down 6.0 pp
• Higher network operating costs and associated USD
denominated expenses
• Higher transmission costs, marketing and distribution
costs following the launch of 3G and 4G services.
Capex spend down 42.1%* to R364 million
• Delay in supply chain process
• Added 195 co-located 3G sites and 100 LTE sites
618,467 633,861 619,434
649,118 668,830
1,267,585 1,302,691
619,434
Dec 14 Dec 15 Jun 16
Revenue UGX (million)
H2
H1
407556
364
260
395667
951
364
Dec 14 Dec 15 Jun 16
Capex ZAR (million)
H2
H1
39.2%** 34.5%** 30.0%** EBITDA margin
Launched Oct 1998 Market share 52.7% Population 40.5m Market size 2016 20.3m Penetration 46% Shareholding 96%

44
Syria
*Constant currency ('organic') information**In ZAR terms***Excluding hyperinflation
Operational growth despite a challenging environment
Subscribers decreased by 2.4%
Revenue increased 10.5%*
• Supported by 16.9%* increase in data revenue,
contributing 28.8% to total revenue
EBITDA margin increased 12.3 pp
• Supported by the conversion of the BOT licence and cost
optimisation
Capex increased by 241.1% to R191 million
• Added 92 co-located 3G sites and 3 LTE sites
26,436 26,468 29,295
26,844 29,392
53,280 55,860
29,295
Dec 14*** Dec 15*** Jun 16***
Revenue SYP (million)
H2
H1
38 56 191319
918357
974
191
Dec 14*** Dec 15*** Jun 16***
Capex ZAR (million)
H2
H1
18.9%** 17.7%** 28.6%** EBITDA margin
Launched Jun 2002 Market share 40.9% Population 17.0m Market size 2016 14.8m Penetration 84% Shareholding 75%

45
Sudan
*Constant currency ('organic') information**In ZAR terms***Excluding hyperinflation
Progress in tough conditions
Subscribers increased 4.2% to 8.8 million
• Driven by targeted marketing campaigns
Revenue increased by 15.7%*
• Data revenue increased 78.3%* and contributes 27.7% to
total revenue as a result of increased data users
EBITDA margin down 1.9 pp
Capex up 62.9% to R549 million
• Added 44 co-located 3G sites
692 811 938
738830
1,4301,641
938
Dec 14*** Dec 15*** Jun 16***
Revenue SDG (million)
H2
H1
481 337549
911
482
1,392
819
549
Dec 14*** Dec 15*** Jun 16***
Capex ZAR (million)
H2
H1
33.8%** 35.0%** 35.4%** EBITDA margin
Launched Sep 2005 Market share 33.8% Population 37.6m Market size 2016 30.3m Penetration 69% Shareholding 85%

46
ZAR (million)Actual H1-16
Hyper-inflation
Tower profit*
Nigeria regulatory
fine
Actual 2016
adjustedActual H1-15
Hyper-inflation
Tower profit*
Actual 2015
adjustedAdjusted
change %
Revenue 79 115 237 - - 78 878 69 304 94 - 69 210 14
Other income 367 - 18 - 349 411 - 352 59 492
EBITDA 18 882 90 18 (10 499) 29 273 30 675 49 352 30 274 (3)
Depreciation, amortisation and impairment of goodwill 13 691 77 - - 13 614 10 750 35 - 10 715 27
Profit from operations 5 191 13 18 (10 499) 15 659 19 925 14 352 19 559 (20)
Net finance cost 5 945 32 - 452 5 461 2 319 (1) - 2 320 135
Share of results of joint ventures & associates after tax
(1 692) (1 039) - - (653) 2 027 362 - 1 665 (139)
Net monetary gain 919 919 - - - 496 496 - - NM
(Loss)/profit before tax (1 527) (139) 18 (10 951) 9 545 20 129 873 352 18 904 (50)
Income tax expense 4 726 32 - - 4 694 6 249 26 - 6 223 (25)
(Loss)/profit after tax (6 253) (171) 18 (10 951) 4 851 13 880 847 352 12 681 (62)
Non-controlling interests (764) 204 - (2 319) 1 351 1 980 105 75 1 800 (25)
Attributable (loss)/profit (5 489) (375) 18 (8 632) 3 500 11 900 742 277 10 881 (68)
EBITDA margin 23.9% 37.1% 44.3% 43.7% (6.6)pp
Effective tax rate (309.6%) 49.2% 31.0% 32.9% 16.3pp
*Tower sale profits for the period relates to Ghana release of deferred profit of R18m (H1-15: The measurement of the contingent consideration receivable relating to Nigeria tower transaction tranche 1 of R339m and the Ghana release of deferred profit of R13m)
Income statement
Hyperinflation, Nigeria regulatory fine and tower sales impact

47
ZAR (million)Cash and cash
equivalents*
Net interest-bearing
liabilities
Net debt/(cash)
H1-16
Net debt/(cash)
Dec 2015
South and East Africa 4 161 2 107 (2 054) (1 652)
South Africa 3 457 - (3 457) (1 507)
Uganda 81 1 279 1 198 (86)
Other 623 828 205 (59)
West and Central Africa 18 548 24 587 6 039 3 956
Nigeria 14 785 16 922 2 137 1 695
Ghana 223 1 141 918 15
Cameroon 745 1 483 738 118
Ivory Coast 810 2 842 2 032 2 399
Other 1 985 2 199 214 (271)
Middle East and North Africa 2 981 3 188 207 (585)
Syria 736 - (736) (1 525)
Sudan 323 2 131 1 808 1 889
Other 1 922 1 057 (865) (949)
Head office companies & eliminations 7 000 52 065 45 065 29 916
Total 32 690 81 947 49 257 31 635
* Includes restricted cash and current investments
Net debt

48
Net debt composition
Nigeria and Head office
Naira denominated
USDdenominated
ZARdenominated
Eurodenominated
Nigeria borrowings 11 331 5 591 - -
Nigeria cash 12 832 1 941 - 12
Head office borrowings - 25 700 26 365 -
Head office cash - 3 996 2 284 720
Nigeria borrowings(%)
USD33%(26%)
Naira67%(74%)
Head office borrowings(%)
Nigeria cash(%)
Head office cash(%)
USD49%(57%)
ZAR51%(43%)
USD13%(6%)
ZAR33%(44%)
USD57%(45%)
Euro10%(11%)
Naira87%(94%)
Net debt compositionZAR (million)
49
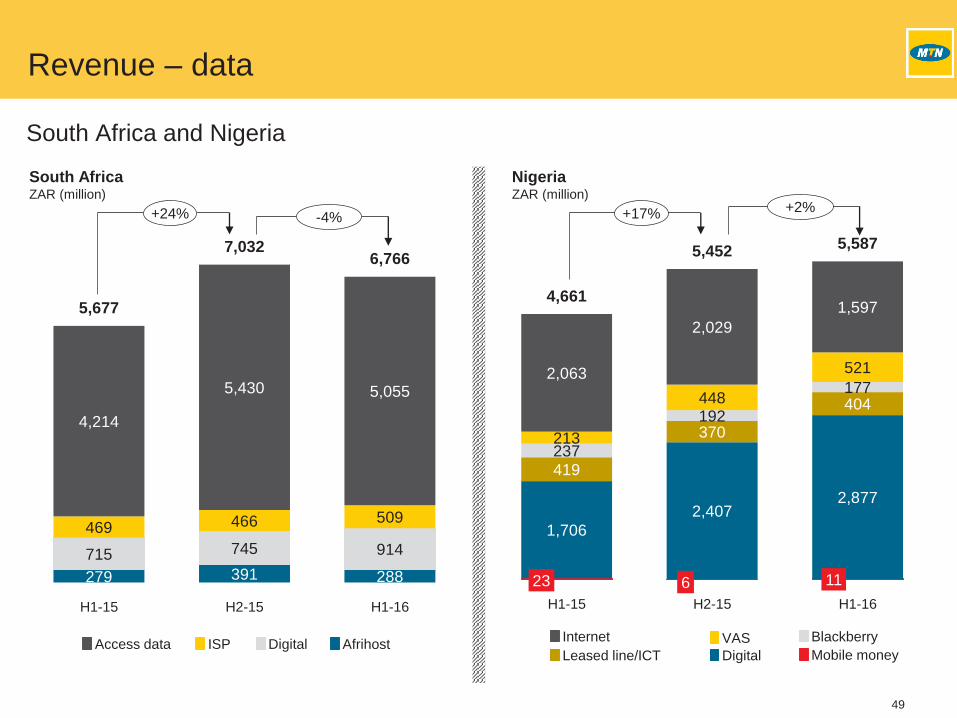
Revenue – data
South Africa and Nigeria
23 6 11
1,706
2,4072,877
419
370
404
237
192
177
213
448
5212,063
2,029
1,5974,661
5,4525,587
H1-15 H2-15 H1-16
279 391 288
715 745 914
469 466 509
4,214
5,430 5,055
5,677
7,0326,766
H1-15 H2-15 H1-16
South AfricaZAR (million)
NigeriaZAR (million)
ISP DigitalAccess data AfrihostInternet VAS Blackberry
Leased line/ICT Mobile moneyDigital
+24% -4% +17% +2%

50
ZAR (million) H1-16 H1-15 Change %
Telco joint ventures 2 198 1 935 14
Iran 1 975 1 737 14
Swaziland 50 48 4
Botswana 173 150 15
Tower companies (2 480) (64) NM
Ghana (17) 22 (177)
Uganda - (149) (100)
Nigeria * (2 463) 63 NM
BICS 123 118 4
Share of results of telco joint ventures and associates after tax excluding hyperinflation (159) 1 989 (108)
Iran – Hyperinflation (H1-16: Mainly depreciation and amortisation of assets written up) (1 039) 362 NM
Share of results of telco joint ventures & associates after tax including hyperinflation (1 198) 2 351 (151)
Digital Group (494) (324) (52)
AIH (370) (249) (49)
MEIH (69) (42) (64)
IME (55) (33) (67)
Share of results of joint ventures and associates after tax (1 692) 2 027 (183)
* Includes forex losses of R2 282m resulting from the devaluation of the Naira
Share of results of joint ventures and associates after tax (IFRS)
51
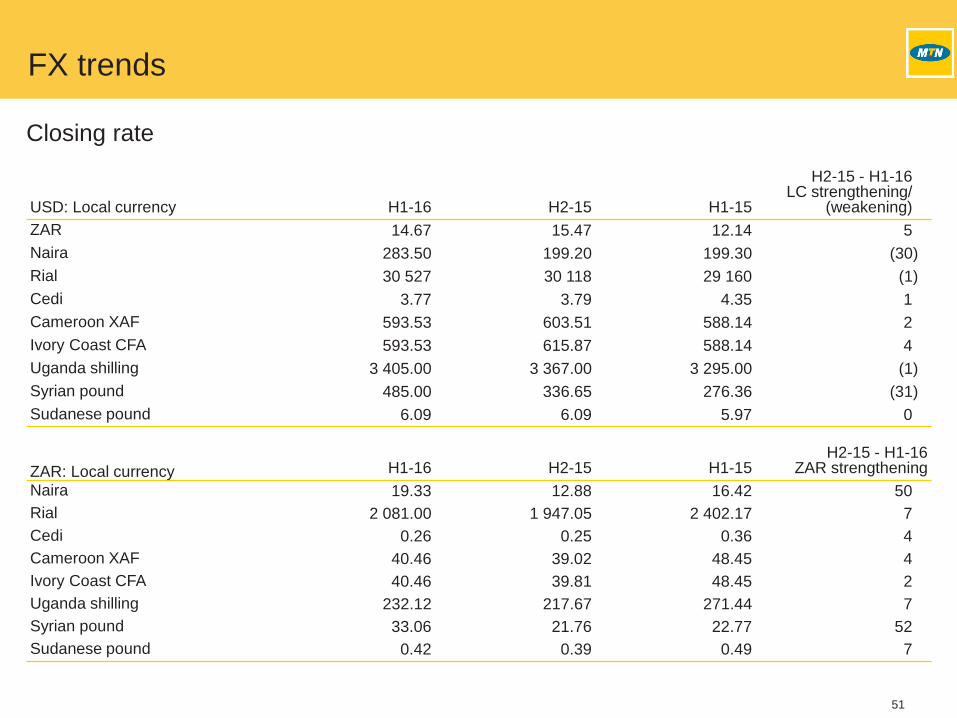
USD: Local currency H1-16 H2-15 H1-15
H2-15 - H1-16LC strengthening/
(weakening)
ZAR 14.67 15.47 12.14 5
Naira 283.50 199.20 199.30 (30)
Rial 30 527 30 118 29 160 (1)
Cedi 3.77 3.79 4.35 1
Cameroon XAF 593.53 603.51 588.14 2
Ivory Coast CFA 593.53 615.87 588.14 4
Uganda shilling 3 405.00 3 367.00 3 295.00 (1)
Syrian pound 485.00 336.65 276.36 (31)
Sudanese pound 6.09 6.09 5.97 0
ZAR: Local currency H1-16 H2-15 H1-15H2-15 - H1-16
ZAR strengthening
Naira 19.33 12.88 16.42 50
Rial 2 081.00 1 947.05 2 402.17 7
Cedi 0.26 0.25 0.36 4
Cameroon XAF 40.46 39.02 48.45 4
Ivory Coast CFA 40.46 39.81 48.45 2
Uganda shilling 232.12 217.67 271.44 7
Syrian pound 33.06 21.76 22.77 52
Sudanese pound 0.42 0.39 0.49 7
FX trends
Closing rate

52
USD: Local currency H1-16 H2-15 H1-15H1-15 - H1-16LC weakening
ZAR 15.26 12.77 11.85 (22)
Naira 205.83 199.34 196.49 (5)
Rial 30 271 29 831 28 024 (7)
Cedi 3.83 3.80 3.76 (2)
Cameroon XAF 590.97 596.62 587.24 (1)
Ivory Coast CFA 597.32 598.87 587.07 (2)
Uganda shilling 3 371.57 3 508.93 2 956.18 (12)
Syrian pound 418.97 312.76 237.91 (43)
Sudanese pound 6.09 6.08 5.97 (2)
ZAR: Local currency H1-16 H2-15 H1-15
H1-15 - H1-16ZAR strengthening/
(weakening)
Naira 13.52 14.62 16.59 (19)
Rial 1 984.95 2 184.00 2 364.16 (16)
Cedi 0.25 0.28 0.32 (22)
Cameroon XAF 38.79 43.83 49.58 (22)
Ivory Coast CFA 39.18 44.08 49.58 (21)
Uganda shilling 220.40 257.64 249.48 (12)
Syrian pound 27.41 23.02 20.07 37
Sudanese pound 0.40 0.45 0.50 (20)
FX trends
Average rate