mtn nigeria communications limited. - dunn loren … nigeria... · equity research | mtn nigeria...
TRANSCRIPT

August 04, 2016 www.dunnlorenmerrifield.com Bloomberg: < DLMN> GO
MTN Nigeria Communications Limited. Nigeria | Equities | Telecommunication | January 12, 2017 DLM RESEARCH
…Still dauntingly tall among peers
Equity Research | MTN Nigeria Communications Limited DLM RESEARCH
January 12, 2017 2 www.dunnlorenmerrifield.com
Bloomberg: < DLMN> GO
In comparison to peers, MTN Nigeria Communications Limited outplays other
communication companies in Nigeria, as it presently controls about 40% of the
industry.
MTN Nigeria Communications Limited (MTNN) is well placed in the Nigeria
telecommunications space with total assets of N964.38billion (Book value- FY’14).
The company won a bid for a mobile phone licence to operate in Nigeria in 2001 at
a cost of $285 million. The decision to operate in Nigeria was a calculated one which we
believe was due to the limited wireless capacity in Nigeria at the time coupled with the fact
that the market was untested. This initially raised concern amongst various investors with
regards to the company’s strategy and return on investment. However, in its first year of
operation through December 2004, MTNN surprisingly accumulated 1.96 million
subscribers before rising to 41.6 million in 2014 and subsequently to 57 million subscribers
as at 2016.
In 2015, the group reported R147.06 billion in revenue out of which Z51.91 billion
(35.32%) emanated from the Nigeria operation. Between 2011 and 2014, the company
grossed a total of N3.13 trillion in revenues, and paid out N883.99billion representing
28.24% of revenue as cash dividend during the same period. Overall, the strong revenue
(the highest among the group’s subsidiaries) reflects the success story that supports the
strong business strategy of the company. Today, Nigeria accounts for the largest
proportion of the group’s profits. Despite regulatory headwinds, we do not expect the
company to cut down its operation in Nigeria in the medium to long term given that
MTNN is the group’s ‘’cash cow’’.
One of MTNN’s major strength is its wide network coverage. We recognise the fact
that the company has come under pressure in recent time due to lower mobile termination
rates, declining voice revenue, current internet data price crash and regulatory pressure.
This has weighed significantly on profits and margins even as competition has puts
pressure on its ability to grow subscriber base in maturing markets. Furthermore, voice
revenue continued to come under pressure as a result of the use of multiple SIM cards as
well as promotional price offer by other operators. The number of porting activities
showed MTNN’s loss of subscribers to other operators and we do not expect the
company to win back all subscribers consequent to the recent disconnection. Ih the last
two years, the company has lost market share at an average of 2%. However, MTNN is
responding explicitly, with reduction in the price of data bundle plans, and new
promotional offers in the form of recharge bonuses. MTNN is a key beneficiary of growth
in the Nigeria‘s telecom industry given its subscription ratess rate. MTNN’s footprint and
investment in growth areas such as mobile money transfer service is making the company
a preferred partner to many multinational businesses.
.
…Still dauntingly tall among peers
Alex Ibhade
Please read the Important Disclosures at the end of this report.
Fig. 2: Stock data
FYE December
Price Mov’t: YtD / 52wk N/A
Average daily vol./val. N/A
Shares Outstanding (mn) 407
Capitalization (N’mn) 632,612 ($2,067mn)
EPS, N- FY2014 513.51
DPS, N- FY2014 586.80
FCFPS, N- FY2014 741.08
Source: Bloomberg, NSE, DLM Research
Fig. 3: Key ratios
FY 2014 FY2013
EBIT margin 39.88% 42.77%
Net profit margin 25.34% 27.32%
Equity multiplier 5.60x 4.76x
Asset turnover 0.86x 0.83x
Source: Company report, NSE, DLM Research
Fig. 4: Valuations
FY2015E FY2016E FY2017F
Revenue/share 2,026x 1,984x 1,968x
EBITDA/share 1,178x 1,170x 1,171
EBIT/share 808.1x 813.5x 806.8x
Net debt/asset 19.24% 22.98% 20.61%
NAVPS 422.70x 433.74x 441.62x
ROE 111.79% 113.06% 108.14%
ROA 22.11% 20.38% 18.31%
Div. Yield 0.00% 0.00% 0.00%
Source: Company annual report, DLM Research
Price:
- Expected listing price range N800 – N1,600
- Recommendation: Neutral
* As at January Thursday 12, 2017
We initiate coverage on MTN Nigeria Communications
Limited (MTNN) given the company’s strong brand, earnings
stream, solid balance sheet and cash flow generation. Our
near term outlook on the company is premised on a number
of factors such as: investment in growth area, growth in
mobile money and machine-to-machine. Mobile money and
machine-to-machine are industry forces that are recording
strong growth.
The MTNN Mobile Money service which allows MTNN
customers to send and receive cash via their mobile device
has recorded 6.2 million accounts and presents the company
with enormous potential to grow income from transaction
fees
MTN Nigeria Communications Limited.

Equity Research | MTN Nigeria Communications Limited DLM RESEARCH
January 12, 2017 3 www.dunnlorenmerrifield.com
Bloomberg: < DLMN> GO
Outlook.......... what does the future hold. In this section we present,
three likely scenarios which the revenue and earnings profile for MTN Nigeria
may chart, given the outlook for the Nigerian telecom industry and, in relation
to the domestic economy.
Scenario 1: Base case assumptions project a conservative growth rate.
Our base case is derived from a number of factors such as decreasing voice
revenues, hostile competition, migration to other networks and decrease in
number of subscribers.
Scenario 2: Assumes that data income grows at historical CAGR of
19.14% over the next five years with possible increase in the price of data.
Based on this assumption, revenue would increase to about N811.71billion by
2016, N833.33billion by 2017, N873.10billion by 2018 and N888.76billion by
2019. As at November 1, 2016, the industry average for data tariff floor for
major operators such as MTN, Etisalat and Airtel was N0.53k/MB. A review
of the old rate showed that Etisalat offered (N0.94k/MB), Airtel (N0.52k/MB),
MTN (N0.45k/MB) and Globacom (N0.21k/MB). As a result of the price
variation, NCC came up with an average data tariff of N0.53k/MB for
dominant operators. However, an interim price floor of 0.90k/MB was
introduced by NCC. This was later suspended with an expectation to continue
with effect from December 1, 2016. The proposed tariff seeks to increase the
industry average data tariff from N0.53k/MB to N0.90k/MB.
The implementation of the new rate is pending on the finalisation of the
study on the determination of cost based pricing for retail broadband and
data services in Nigeria. With increasing use of internet, we expect an
additional data usage on the network going forward. On the back of this growth
assumption, there’s a robust revenue upside potential for MTN Nigeria from
the medium to long term. However, despite the growth potential, MTN Nigeria
would still need to focus on cost management, albeit in the short to medium
term until a meaningful top line growth is achieved for a healthy bottom line.
By 2017 and beyond however, our forecasts imply that operating cash flow will
be healthy to accommodate dividend growth, but cost reduction would still be
necessary. However, if voice revenue continues to decrease at this rate beyond
2018 and data floor price decreases further or even remain at the current level
as opposed to the proposed data price increase, then revenue would no longer
be sufficient to boost operating and net profits. We would therefore see a
reduction in dividend pay-out albeit at a significantly reduced level, and likely
temporarily, until a sustainable growth is attained.
Scenario 3: Assumes that the company focuses on pursuing revenues in
other growth areas in line with management drive.
“ As at November 1,
2016, the industry average for data tariff
floor for major operators such as MTN, Etisalat
and Airtel was N0.53k/MB.
’’

Equity Research | MTN Nigeria Communications Limited DLM RESEARCH
January 12, 2017 4 www.dunnlorenmerrifield.com
Bloomberg: < DLMN> GO
Likely scenarios MTN Nigeria valuation or share price may chart.
Fig. 5: MTN Nigeria valuation range
We considered the main valuation criteria used in the
telecommunications industry. However, DCF is our principal method to
assess the value of MTNN as we believe the DCF model is the most
appropriate model to value companies in the telecom sector. The two key
factors which we considered will affect valuation are revenue growth and cash
flow. Typically, the telecommunications industry is considered to be slightly less
risky, hence, we used beta coefficient of 0.84, though higher than that of the
group. We used a WACC of 16.97% and cost of equity of 18.96%–and believe
a dividend yield above 10% would be appropriate to provide an adequate return
to investors. Our valuation model suggests that N800 - N1,600/share looks a
likely listing range for MTNN Nigeria, suggesting a dividend yield above 30%.
This would make dividend yield base investment on the stock attractive. The
dividend model assumes 56% average dividend pay-out of operating profit. For
EV/EBITDA model, past performance of EBITDA is positive but volatile,
and we do not expect it to grow significantly in the near term. Hence, we
forecast a maintainable normalized EBITDA of N471.40billion with
EV/EBITDA multiple of 1.93x. Our adopted EV/EBITDA multiple is lower
than those of our selected African market peers, as we applied a discount to
reflect market risks. The EV/EBITDA method suggests the shares could trade
at N1,272/share. The DCF valuation model and sensitivity analysis suggests a
price range of N804 – N1,653/share. Overall, our valuation prices places
MTNN shares on a forecast P/E of 2.72x range bound which does looks
attractive in our view and could be a very profitable long-term buy. MTN
has invested heavily in its set up and is dependent on the investments in
assets for future returns. Therefore, with higher asset base, its
depreciation and amortization is relatively higher.
Value per share: EV/EBITDA Method: N1,272/share
Value per share: DCF Sensitivity analysis: N804 – N1,653/share
Value per share: Price/Book Model: N850.10/share
Adopted EV/EBITDA multiple: 1.93x
Maintainable normalized EBITDA N471.40billion billion
Enterprise value - N1.02trillion
“ Overall, our
valuation prices place MTNN shares on a
forecast P/E of 2.72x range bound which does looks attractive in our
view and could be a very profitable long-term buy.
’’
Adopted price to book value: 1.9x
Value per share: DCF model: N1,474/share
Equity Research | MTN Nigeria Communications Limited DLM RESEARCH
January 12, 2017 5 www.dunnlorenmerrifield.com
Bloomberg: < DLMN> GO
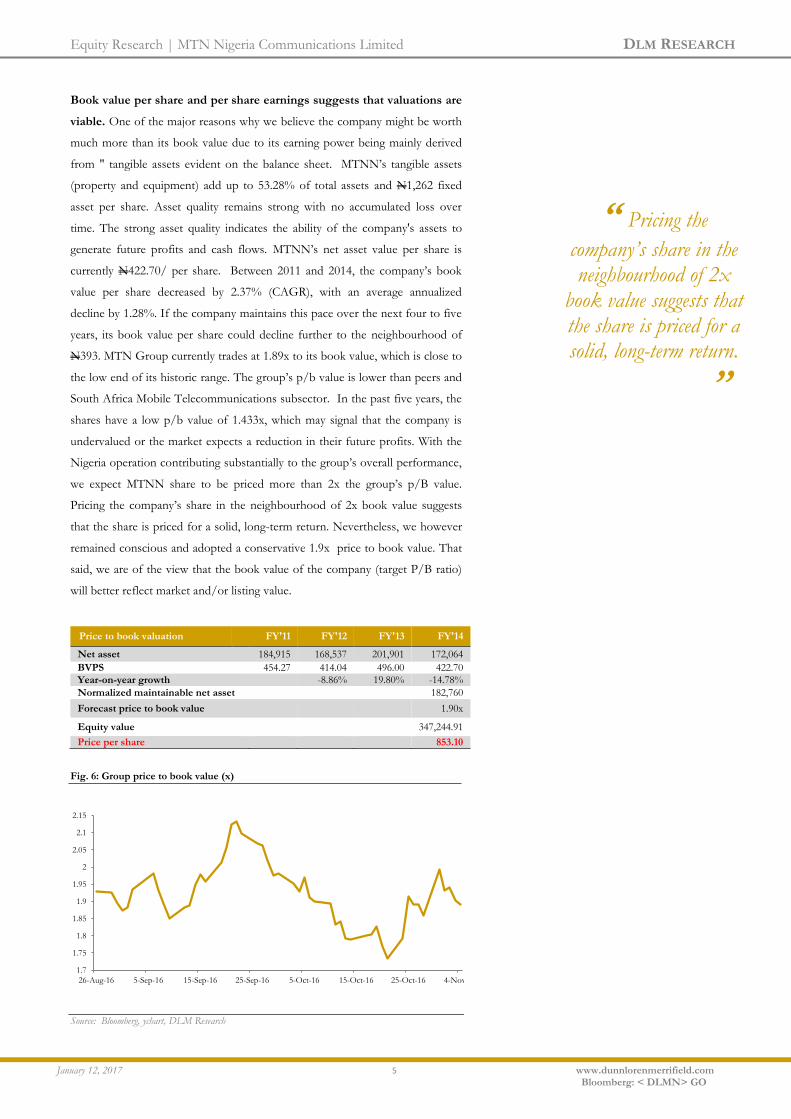
Book value per share and per share earnings suggests that valuations are
viable. One of the major reasons why we believe the company might be worth
much more than its book value due to its earning power being mainly derived
from " tangible assets evident on the balance sheet. MTNN’s tangible assets
(property and equipment) add up to 53.28% of total assets and N1,262 fixed
asset per share. Asset quality remains strong with no accumulated loss over
time. The strong asset quality indicates the ability of the company's assets to
generate future profits and cash flows. MTNN’s net asset value per share is
currently N422.70/ per share. Between 2011 and 2014, the company’s book
value per share decreased by 2.37% (CAGR), with an average annualized
decline by 1.28%. If the company maintains this pace over the next four to five
years, its book value per share could decline further to the neighbourhood of
N393. MTN Group currently trades at 1.89x to its book value, which is close to
the low end of its historic range. The group’s p/b value is lower than peers and
South Africa Mobile Telecommunications subsector. In the past five years, the
shares have a low p/b value of 1.433x, which may signal that the company is
undervalued or the market expects a reduction in their future profits. With the
Nigeria operation contributing substantially to the group’s overall performance,
we expect MTNN share to be priced more than 2x the group’s p/B value.
Pricing the company’s share in the neighbourhood of 2x book value suggests
that the share is priced for a solid, long-term return. Nevertheless, we however
remained conscious and adopted a conservative 1.9x price to book value. That
said, we are of the view that the book value of the company (target P/B ratio)
will better reflect market and/or listing value.
Price to book valuation FY'11 FY'12 FY'13 FY'14
Net asset 184,915 168,537 201,901 172,064
BVPS 454.27 414.04 496.00 422.70
Year-on-year growth
-8.86% 19.80% -14.78%
Normalized maintainable net asset
182,760
Forecast price to book value 1.90x
Equity value 347,244.91
Price per share 853.10
Fig. 6: Group price to book value (x)
Source: Bloomberg, ychart, DLM Research
1.7
1.75
1.8
1.85
1.9
1.95
2
2.05
2.1
2.15
26-Aug-16 5-Sep-16 15-Sep-16 25-Sep-16 5-Oct-16 15-Oct-16 25-Oct-16 4-Nov-16
“ Pricing the
company’s share in the neighbourhood of 2x
book value suggests that the share is priced for a solid, long-term return.
’’

Equity Research | MTN Nigeria Communications Limited DLM RESEARCH
January 12, 2017 6 www.dunnlorenmerrifield.com
Bloomberg: < DLMN> GO
Dividend yield and dividend growth will be the main focus for investors.
The company has historically paid dividend greater than net income as
depreciation and amortization are very substantial. While the main determinant
of dividend growth in the medium to long term is earnings / free cash flow,
investors will be attracted to MTNN’s track record of paying dividend. While
our dividend forecast is based on the assumption that the current dividend
trend will be maintained, we see dividend yield ticking above inflation.
Dividend paid has increased from N220.79billion in 2011 to N238.86billion in
2014, representing a CAGR of 2.66%. The dividend paid in 2014 represents
45.48% and 72.62% of cash flow from operations and operating profit
respectively. Though, there are rooms for growth, but for FY’16, dividend
payout is forecast to moderate as a result of capex programme and regulatory
fine of N330billion unless management are able to cut some costs or capex.
Companies typically keep their pay-out ratios fairly low, such that when they
experience slowdown in cash flow and profit, they will be able to keep and
grow dividend. While a significant proportion of the company’s annual dividend
is accrued to the group due to its shareholdings status, in our view, the huge
dividend pay out to the group signals profit repatriation. Overall, we think that
balance sheet is strong enough to support future growth.
Fig. 7: Dividend operating profit (%)
Source: Company annual report, DLM Research
Costs and dividends eat up bigger slice of MTNN’s earnings. MTNN has
historically spent more of its earnings on costs of operation and dividend to
shareholders. Despite slow growth, operating costs has historically outpaced
EBITDA, while annual dividend exceeded net income except for FY’11 and
FY’13 financial year. Cash outflow for the two line items averaged 85.37% of
revenues over the past four years. While we reckon the fact that dividend-
paying stocks is among the best-performing asset classes, the high costs
underscores the intense pressure on corporate earnings. With the addition of
interest charges and income tax, MTNN seem to be paying out more than it
earns except for FY’11 and FY’13 where it posted positive net balance.
62.18%
75.36%
54.46%
72.62%
FY'11 FY'12 FY'13 FY'14

Equity Research | MTN Nigeria Communications Limited DLM RESEARCH
January 12, 2017 7 www.dunnlorenmerrifield.com
Bloomberg: < DLMN> GO
Fig. 8: Revenues and cash out flow – 2011-2014 (N’bn)
Source: Company annual report, DLM Research
With the negative net cash balance in FY12 and FY14, three scenarios
maybe playing out in our view. Annual headline revenues may be higher than
reported, while costs may be lower than reported. The third scenario is that
MTN Nigeria may be drawing from accumulated retained earnings and or profit
from sales of assets. However, with the exclusion of non-cash items such as
depreciation and amortization, net cash balance remained at a comfortable
position, which although, does not reflects on retained earnings. Erecting
network of cellular masts and towers is a costly undertaking; this has resulted in
a steady capital expenditure as a percentage of operating cash flow. However,
with the sales of 9,151 towers in 2014, we expect to see a substantial reduction
in the company’s overall cost structure going forward as the cost of tower
maintenance continues to eat into profits. Overall, reduction in overall cost
structure will provide the company an opportunity to mitigate some business
risks.
Fig. 9: Net cash balance (N’bn)
Source: Company annual report, DLM Research
750.51
772.07 761.66
854.64
757.98 753.58
793.61
824.81
FY'11 FY'12 FY'13 FY'14
Total cash out flow Revenues
7.47
-18.49
31.96
-29.83
FY'11 FY'12 FY'13 FY'14
“ However, with the
exclusion of non-cash items such as
depreciation and amortization, net cash balance remained at a comfortable position,
which although, does not reflects on retained
earnings.
’’

Equity Research | MTN Nigeria Communications Limited DLM RESEARCH
January 12, 2017 8 www.dunnlorenmerrifield.com
Bloomberg: < DLMN> GO
Retained Earnings FY'11 FY'12 FY'13 FY'14
Share capital 646.51 646.51 646.51 646.51
Share premium 64,498.50 64,498.50 64,498.50 64,498.50
Retained Earnings 119,770 103,392 135,851 106,017
Increase/Decrease in retained earnings (16,378) 32,459 (29,834)
Annual revenues utilization FY'11 FY'12 FY'13 FY'14
Total costs 402,879 435,804 454,160 495,876
Net interest expenses 17,841 14,033 28,608 38,324 Income tax 108,998 82,749 94,024 81,579
Dividends 220,789 239,480 184,863 238,861
Total cash out flow 750,507 772,066 761,656 854,640 Headline revenues 757,978 753,578 793,614 824,807 Net cash balance 7,471 (18,488) 31,958 (29,833)
Annual inflow and out flow FY'11 FY'12 FY'13 FY'14
Total costs 402,879 435,804 454,160 495,876
Less Dep & Amortization 111,836 119,790 141,187 150,418
Total costs 291,043 316,014 312,973 345,458
Interest received 13,314 34,039 13,673 22,575
Interest Paid 32,879 46,526 42,336 48,391
Net interest Paid 19,565 12,486 28,662 25,815 Tax paid 60,833 103,487 87,412 66,744 dividends 220,789 239,480 184,863 238,861
Total cash out flow 592,230 671,467 613,911 676,878
Headline revenues 757,978 753,578 793,614 824,807 Net cash balance 165,748 82,111 179,703 147,929
Total costs (Excl Dep & Amort) to headline revenues 38.40% 41.94% 39.44% 41.88% Total cash out flow to headline revenues 78.13% 89.10% 77.36% 82.07%
MTN has a positive free cash flow but not strong enough to support
substantial increase in dividend payout when adjusted for interest
payment. Cash Flow from Operation was mostly strong except for a decline
in FY’12 and FY’14 due largely to higher operating costs. While EBITDA level
is strong, EBITDA is only a proxy, particularly when dealing with capital
intensive companies like MTN. Hence, we relied more on free cash flow to the
firm. The reason we need FCF instead of EBITDA and operating cash flow is
the capex adjustment. Nevertheless, we think that balance sheet strength is
sufficient to support current dividend trend out to 2019E and even beyond.
Though, the company is expected to have a greater amount of free cash flow in
the near term as its expenditure on the major initiative winds down.
Fig. 10: Free Cash Flow
(FCF) FY'11 FY'12 FY'13 FY'14
Tax rate 30.7% 26.0% 27.7% 24.8%
EBITDA 466,935 437,564 490,640 479,349
EBIT 355,099 317,774 339,453 328,931
Tax on EBIT (108,998) (82,749) (94,024) (81,579)
Capital expenditures (126,556) (228,134) (229,814) (139,362)
Depreciation & Amort. 111,836 119,790 151,187 150,418
Unlevered free cash flow 231,380 126,681 166,802 258,408
\
“ Cash Flow from
Operation was mostly strong except for a
decline in FY’12 and FY’14 due largely to higher operating costs..
’’
Equity Research | MTN Nigeria Communications Limited DLM RESEARCH
January 12, 2017 9 www.dunnlorenmerrifield.com
Bloomberg: < DLMN> GO
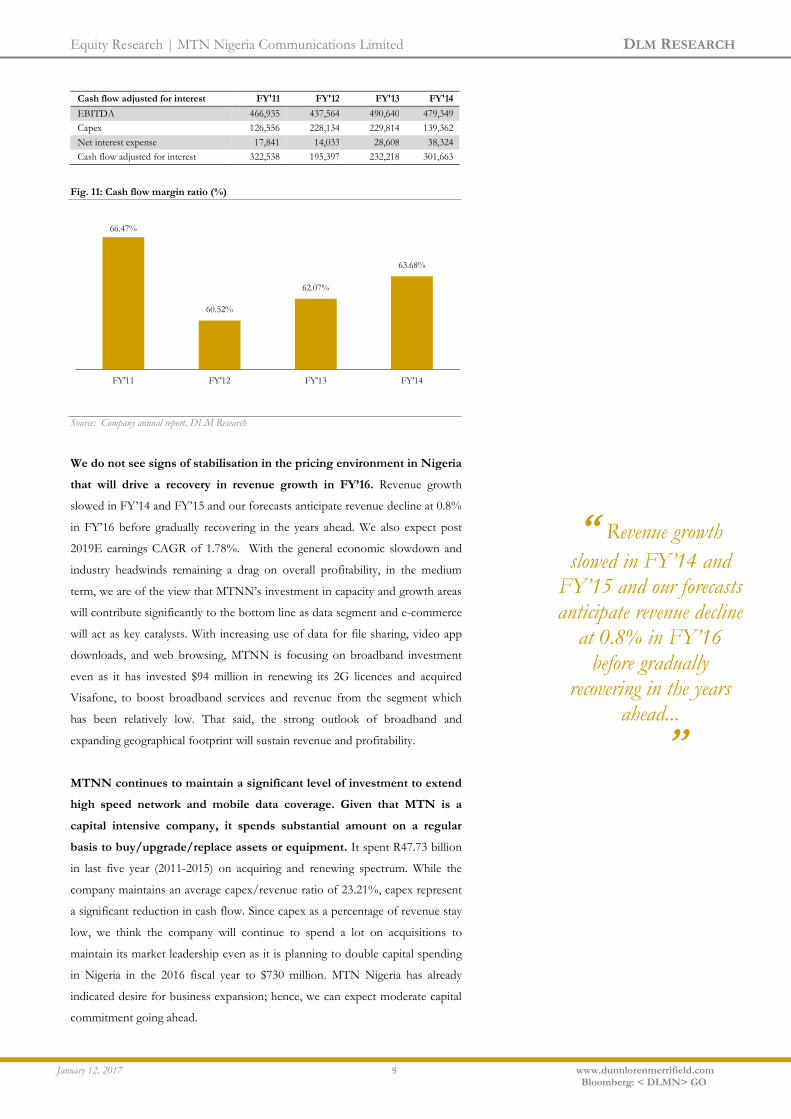
Cash flow adjusted for interest FY'11 FY'12 FY'13 FY'14
EBITDA 466,935 437,564 490,640 479,349
Capex 126,556 228,134 229,814 139,362
Net interest expense 17,841 14,033 28,608 38,324
Cash flow adjusted for interest 322,538 195,397 232,218 301,663
Fig. 11: Cash flow margin ratio (%)
Source: Company annual report, DLM Research
We do not see signs of stabilisation in the pricing environment in Nigeria
that will drive a recovery in revenue growth in FY’16. Revenue growth
slowed in FY’14 and FY’15 and our forecasts anticipate revenue decline at 0.8%
in FY’16 before gradually recovering in the years ahead. We also expect post
2019E earnings CAGR of 1.78%. With the general economic slowdown and
industry headwinds remaining a drag on overall profitability, in the medium
term, we are of the view that MTNN’s investment in capacity and growth areas
will contribute significantly to the bottom line as data segment and e-commerce
will act as key catalysts. With increasing use of data for file sharing, video app
downloads, and web browsing, MTNN is focusing on broadband investment
even as it has invested $94 million in renewing its 2G licences and acquired
Visafone, to boost broadband services and revenue from the segment which
has been relatively low. That said, the strong outlook of broadband and
expanding geographical footprint will sustain revenue and profitability.
MTNN continues to maintain a significant level of investment to extend
high speed network and mobile data coverage. Given that MTN is a
capital intensive company, it spends substantial amount on a regular
basis to buy/upgrade/replace assets or equipment. It spent R47.73 billion
in last five year (2011-2015) on acquiring and renewing spectrum. While the
company maintains an average capex/revenue ratio of 23.21%, capex represent
a significant reduction in cash flow. Since capex as a percentage of revenue stay
low, we think the company will continue to spend a lot on acquisitions to
maintain its market leadership even as it is planning to double capital spending
in Nigeria in the 2016 fiscal year to $730 million. MTN Nigeria has already
indicated desire for business expansion; hence, we can expect moderate capital
commitment going ahead.
66.47%
60.52%
62.07%
63.68%
FY'11 FY'12 FY'13 FY'14
“ Revenue growth
slowed in FY’14 and FY’15 and our forecasts anticipate revenue decline
at 0.8% in FY’16 before gradually
recovering in the years ahead...
’’
Equity Research | MTN Nigeria Communications Limited DLM RESEARCH
January 12, 2017 10 www.dunnlorenmerrifield.com
Bloomberg: < DLMN> GO
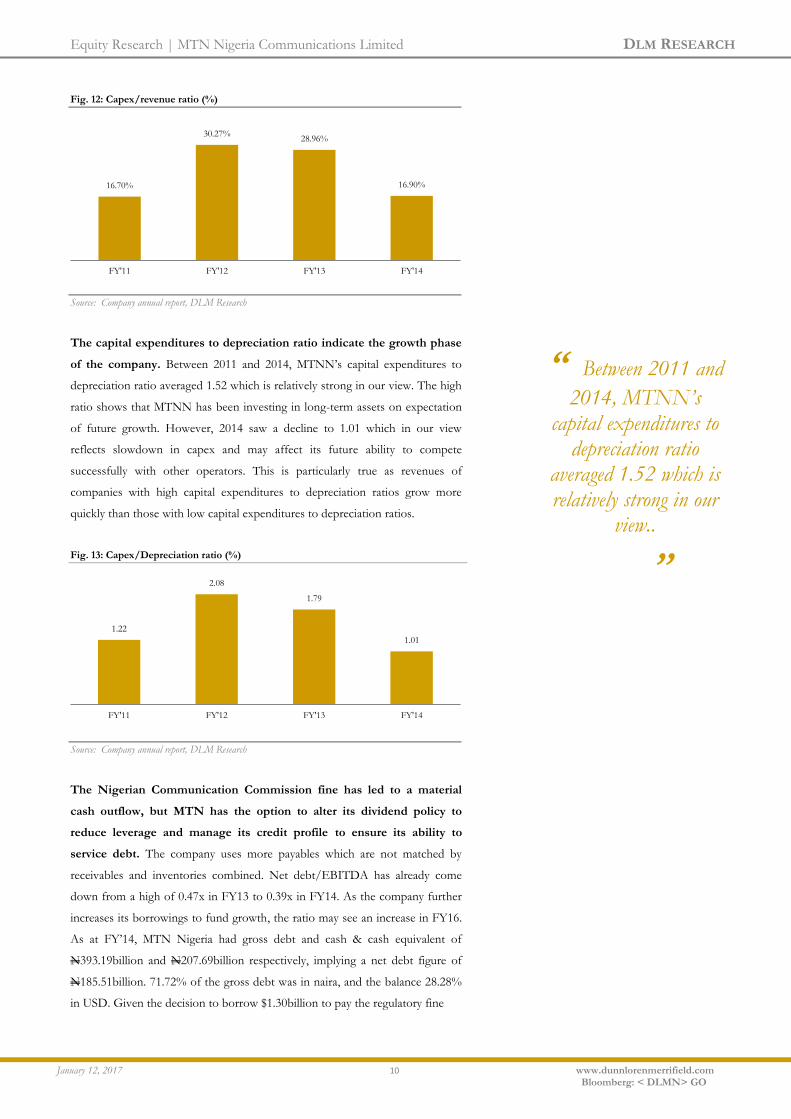
Fig. 12: Capex/revenue ratio (%)
Source: Company annual report, DLM Research
The capital expenditures to depreciation ratio indicate the growth phase
of the company. Between 2011 and 2014, MTNN’s capital expenditures to
depreciation ratio averaged 1.52 which is relatively strong in our view. The high
ratio shows that MTNN has been investing in long-term assets on expectation
of future growth. However, 2014 saw a decline to 1.01 which in our view
reflects slowdown in capex and may affect its future ability to compete
successfully with other operators. This is particularly true as revenues of
companies with high capital expenditures to depreciation ratios grow more
quickly than those with low capital expenditures to depreciation ratios.
Fig. 13: Capex/Depreciation ratio (%)
Source: Company annual report, DLM Research
The Nigerian Communication Commission fine has led to a material
cash outflow, but MTN has the option to alter its dividend policy to
reduce leverage and manage its credit profile to ensure its ability to
service debt. The company uses more payables which are not matched by
receivables and inventories combined. Net debt/EBITDA has already come
down from a high of 0.47x in FY13 to 0.39x in FY14. As the company further
increases its borrowings to fund growth, the ratio may see an increase in FY16.
As at FY’14, MTN Nigeria had gross debt and cash & cash equivalent of
N393.19billion and N207.69billion respectively, implying a net debt figure of
N185.51billion. 71.72% of the gross debt was in naira, and the balance 28.28%
in USD. Given the decision to borrow $1.30billion to pay the regulatory fine
16.70%
30.27% 28.96%
16.90%
FY'11 FY'12 FY'13 FY'14
1.22
2.08
1.79
1.01
FY'11 FY'12 FY'13 FY'14
“ Between 2011 and
2014, MTNN’s capital expenditures to
depreciation ratio averaged 1.52 which is relatively strong in our
view..
’’
Equity Research | MTN Nigeria Communications Limited DLM RESEARCH
January 12, 2017 11 www.dunnlorenmerrifield.com
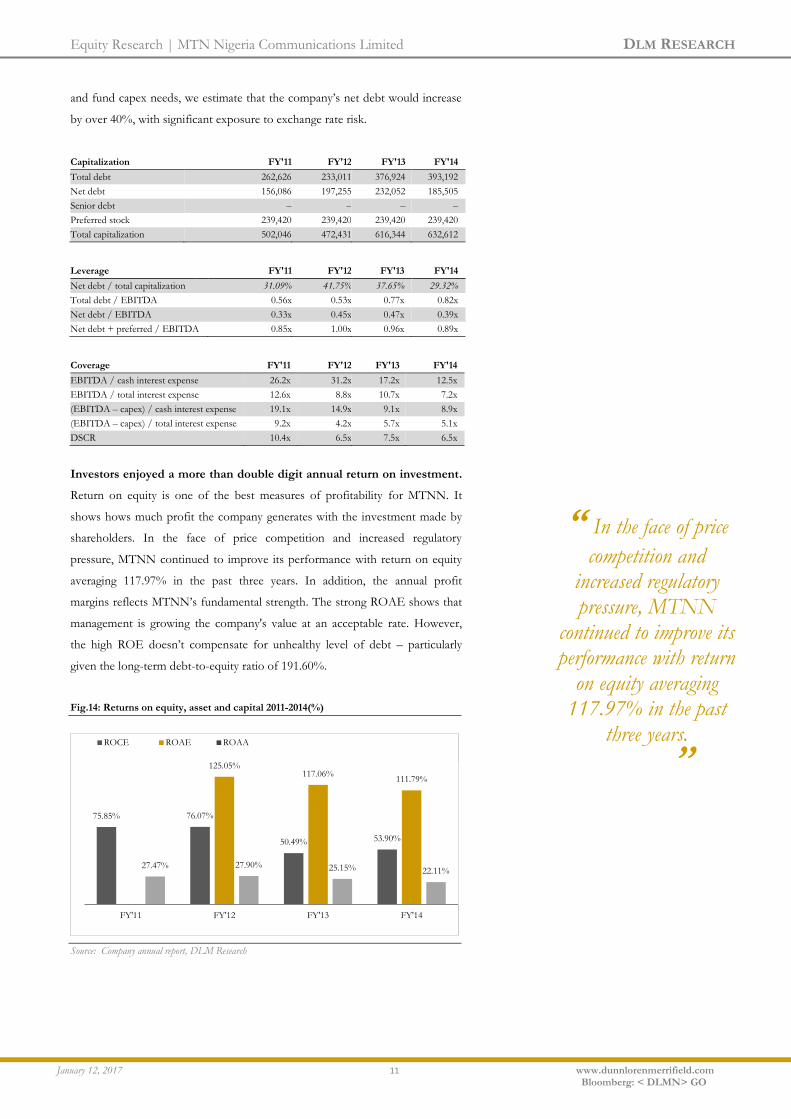
Bloomberg: < DLMN> GO
and fund capex needs, we estimate that the company’s net debt would increase
by over 40%, with significant exposure to exchange rate risk.
Capitalization FY'11 FY'12 FY'13 FY'14
Total debt 262,626 233,011 376,924 393,192
Net debt 156,086 197,255 232,052 185,505
Senior debt – – – –
Preferred stock 239,420 239,420 239,420 239,420
Total capitalization 502,046 472,431 616,344 632,612
Leverage FY'11 FY'12 FY'13 FY'14
Net debt / total capitalization 31.09% 41.75% 37.65% 29.32%
Total debt / EBITDA 0.56x 0.53x 0.77x 0.82x
Net debt / EBITDA 0.33x 0.45x 0.47x 0.39x
Net debt + preferred / EBITDA 0.85x 1.00x 0.96x 0.89x
Coverage FY'11 FY'12 FY'13 FY'14
EBITDA / cash interest expense 26.2x 31.2x 17.2x 12.5x
EBITDA / total interest expense 12.6x 8.8x 10.7x 7.2x
(EBITDA – capex) / cash interest expense 19.1x 14.9x 9.1x 8.9x
(EBITDA – capex) / total interest expense 9.2x 4.2x 5.7x 5.1x
DSCR 10.4x 6.5x 7.5x 6.5x
Investors enjoyed a more than double digit annual return on investment.
Return on equity is one of the best measures of profitability for MTNN. It
shows hows much profit the company generates with the investment made by
shareholders. In the face of price competition and increased regulatory
pressure, MTNN continued to improve its performance with return on equity
averaging 117.97% in the past three years. In addition, the annual profit
margins reflects MTNN’s fundamental strength. The strong ROAE shows that
management is growing the company's value at an acceptable rate. However,
the high ROE doesn’t compensate for unhealthy level of debt – particularly
given the long-term debt-to-equity ratio of 191.60%.
Fig.14: Returns on equity, asset and capital 2011-2014(%)
Source: Company annual report, DLM Research
75.85% 76.07%
50.49% 53.90%
125.05% 117.06%
111.79%
27.47% 27.90% 25.15% 22.11%
FY'11 FY'12 FY'13 FY'14
ROCE ROAE ROAA
“ In the face of price
competition and increased regulatory pressure, MTNN
continued to improve its performance with return
on equity averaging 117.97% in the past
three years. ’’

Equity Research | MTN Nigeria Communications Limited DLM RESEARCH
January 12, 2017 12 www.dunnlorenmerrifield.com
Bloomberg: < DLMN> GO
Fig. 15: Profitability margins 2011-2014(%)
Source: Company annual report, DLM Research
Current ratio increased steadily to 1.13 in 2014 as there was a growth in
borrowing which caused an increase on total current liabilities and a
rapid increase on the current ratio in 2014. The ratios have consistently
remained under 1.00 before 2014 which generally highlighted the company ‘s
negative working capital and probably suggests some liquidity crisis. However,
given the low inventory in the telecommunication industry, the low current
ratio of the company can be accepted. This in our view reflects that the majority
of the company’s assets can be categorized as non-current assets like property,
plant and equipment (PP&E) and intangible.
Fig. 16: Liquidity ratios 2011-2014 (x)
Source: Company annual report, DLM Research
Fig. 17: Working capital 2011-2014 (N’bn)
Source: Company annual report, DLM Research
61.60% 58.06%
61.82% 58.12%
46.85% 42.17% 42.77%
39.88%
30.11% 29.33% 27.32% 25.34%
FY'11 FY'12 FY'13 FY'14
EBITDA margin EBIT margin Net Profit Margin
0.91
0.43
0.85
1.13
0.92
0.44
0.85
1.13
FY'11 FY'12 FY'13 FY'14
Quick ratio Current ratio
-28.36
-203.98
-42.06
47.66
FY'11 FY'12 FY'13 FY'14

Equity Research | MTN Nigeria Communications Limited DLM RESEARCH
January 12, 2017 13 www.dunnlorenmerrifield.com
Bloomberg: < DLMN> GO
The Company
Equity Research | MTN Nigeria Communications Limited DLM RESEARCH
January 12, 2017 14 www.dunnlorenmerrifield.com
Bloomberg: < DLMN> GO
The company
MTN Nigeria Communications Limited MTNN, is a leading provider of
telecoms services to both the consumer- and the business sector in
Nigeria. The company was founded in 2001 after it secured one of the four
available licenses to operate digital Global System for Mobile
Telecommunications (GSM) with a licence fee of US$285 million for an initial
15 year period, allowing MTNN to provide and operate a 900 and 1800 MHz
second-generation digital mobile service. MTNN commenced commercial
operations in Nigeria with three cities, Lagos, Abuja and PortHarcourt.
In the absence of sufficient transmission capacity in Nigeria, MTN
embarked on the construction of a microwave transmission backbone at
a cost of US$120 million. The company offers an extensive range of services
including: cellular network access and ICT solutions. It also provides internet
services, such as video calling through its 3G network, data services mobile
internet, and mobile WiFi services. In addition, it offers international roaming
services, including data roaming, in-flight roaming, and WiFi roaming services.
It provides voice SMS, fashion and lifestyle tips, mobile TV, bulk SMS service,
mobile newspaper, conference call. Beside being the first GSM network to
make a call in Nigeria, MTNN was also the first to launch its service across
major Nigerian cities, and currently has the most expansive network coverag
across overall 3,340 cities, towns and villages in all the 36 states including the
Federal Capital Territory. In 2013, MTNN became the first telecom operator to
build a 10,000 base transceiver stations (BTS) in Nigeria. Since inception
MTNN has led the growth in the Nigeria telecom market to become the biggest
mobile operator in Nigeria with millions of subscribers joining its network. AS
at FY’15, MTNN’s subscribers’ base totalled 61.25 million subscribers before
decline to 58.4 million in the first half of 2016. The company’s subsidiary is XS
Broadband Limited, which provide broadband fixed wirless access.
MTNN’s main focus is to keep its current subscribers while also looking
to tap the growth opportunities in broaband and ICT space – both in the
consumer and business segment with the view to maximising avverge
revenue per user. Hence, this strategy has aided the achievement of its set
objectives of developing a telecommunication in emerging markets and
realizing a good return on investment (ROI).
“ MTNN commenced
commercial operations in Nigeria with three cities,
Lagos, Abuja and PortHarcourt.
’’
Equity Research | MTN Nigeria Communications Limited DLM RESEARCH
January 12, 2017 15 www.dunnlorenmerrifield.com
Bloomberg: < DLMN> GO
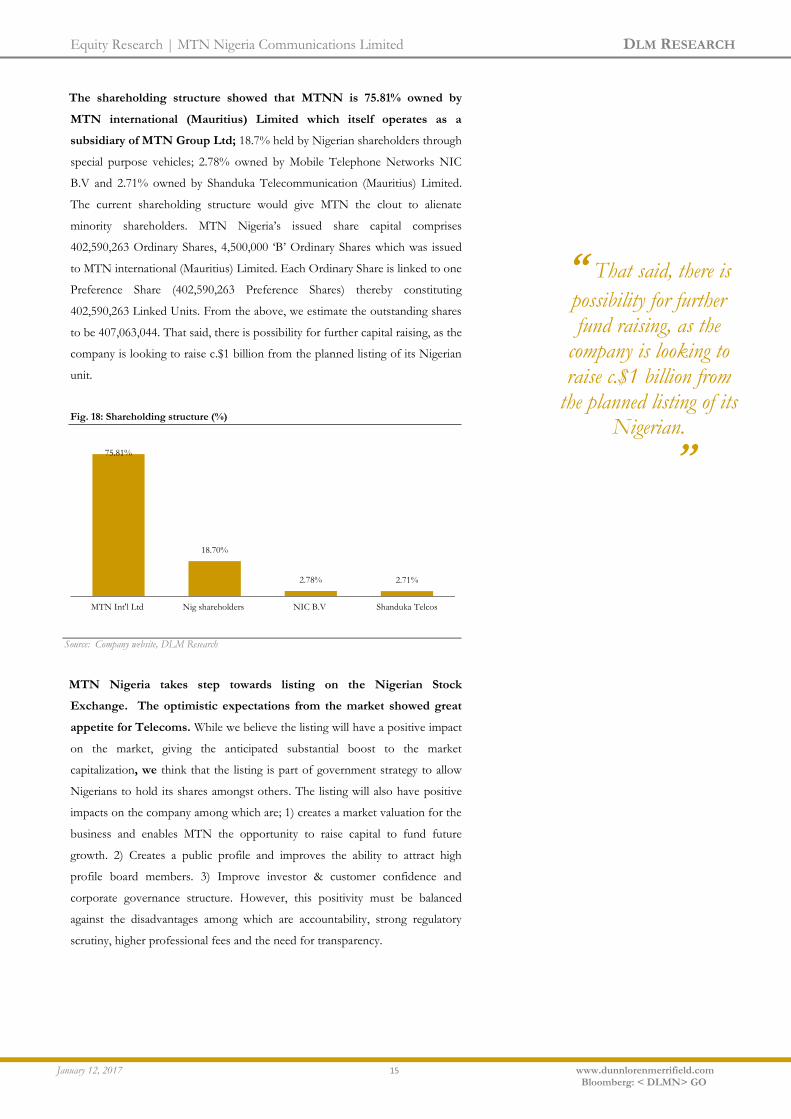
The shareholding structure showed that MTNN is 75.81% owned by
MTN international (Mauritius) Limited which itself operates as a
subsidiary of MTN Group Ltd; 18.7% held by Nigerian shareholders through
special purpose vehicles; 2.78% owned by Mobile Telephone Networks NIC
B.V and 2.71% owned by Shanduka Telecommunication (Mauritius) Limited.
The current shareholding structure would give MTN the clout to alienate
minority shareholders. MTN Nigeria’s issued share capital comprises
402,590,263 Ordinary Shares, 4,500,000 ‘B’ Ordinary Shares which was issued
to MTN international (Mauritius) Limited. Each Ordinary Share is linked to one
Preference Share (402,590,263 Preference Shares) thereby constituting
402,590,263 Linked Units. From the above, we estimate the outstanding shares
to be 407,063,044. That said, there is possibility for further capital raising, as the
company is looking to raise c.$1 billion from the planned listing of its Nigerian
unit.
Fig. 18: Shareholding structure (%)
Source: Company website, DLM Research
MTN Nigeria takes step towards listing on the Nigerian Stock
Exchange. The optimistic expectations from the market showed great
appetite for Telecoms. While we believe the listing will have a positive impact
on the market, giving the anticipated substantial boost to the market
capitalization, we think that the listing is part of government strategy to allow
Nigerians to hold its shares amongst others. The listing will also have positive
impacts on the company among which are; 1) creates a market valuation for the
business and enables MTN the opportunity to raise capital to fund future
growth. 2) Creates a public profile and improves the ability to attract high
profile board members. 3) Improve investor & customer confidence and
corporate governance structure. However, this positivity must be balanced
against the disadvantages among which are accountability, strong regulatory
scrutiny, higher professional fees and the need for transparency.
75.81%
18.70%
2.78% 2.71%
MTN Int'l Ltd Nig shareholders NIC B.V Shanduka Telcos
“ That said, there is
possibility for further fund raising, as the
company is looking to raise c.$1 billion from
the planned listing of its Nigerian.
’’
Equity Research | MTN Nigeria Communications Limited DLM RESEARCH
January 12, 2017 16 www.dunnlorenmerrifield.com
Bloomberg: < DLMN> GO
The listing is part of MTNN’s negotiation strategy with Nigerian
Communication Commission (NCC). While MTNN has begun initiating
procedures for the listing, it is uncertain at this time the numbers of shares to
be put on the stock exchange from the outstanding shares for public investors.
Post listing, we believe there will be more financial disclosures giving more
clarity on its business operations. That said, there are chances the listing will be
delayed for a number of reasons with market timing a major factor to be
considered. in addition, though the bulk of the share is held by its subsidiary,
we anticipate a scenario of limited float and the shares being tightly held by a
few investors.
Post listing we are of the view that the company may carefully consider
issue of capital management and would most likely buy back shares in
line with the group’s capital management strategy. Though, buying back
shares could push the company’s EPS and RoE higher than the company-wide
earnings. This will effectively reduce the company’s shares in existence. One of
the major reasons for this will be to fuel dividend growth. If the company
maintain the current dividend pay-out each year, and the number of total shares
is decreased, shareholder will be receiving a larger dividend each year– with the
group maintaining significant advantage over other investors due to its
shareholding status. The success of this if considered, will depend largely on
The Nigerian Stock Exchange regulation on listing
MTNN to raise funds through Initial Public Offer for multiple payments.
The company is targeting about $1billion to settle the regulatory fine of N330
billion which has not been fully settled. The second which is very vital is the
company’s quest to invest in capex. Though the company has not announced
any guidance on the planned IPO, we believe MTN may offer a small portion
of its stake in the business as minority shareholders will be unwilling to sell
down their holdings or exit. With the current shareholding’s structure, we do
not envisage a scenario for hostile takeover by any single investors or
divestment by majority owners aimed at dispersing its stock among high net-
worth Nigerians. On the other hand, with ownership dilution protection in
mind, we anticipate a scenario where treasury stock will be created to keep a
controlling interest within the treasury with the view to ward off hostile
takeovers by any single investors.
“ The company is
targeting about $1billion to settle the
regulatory fine of N330 billion which has not been fully
settled ’’

Equity Research | MTN Nigeria Communications Limited DLM RESEARCH
January 12, 2017 17 www.dunnlorenmerrifield.com
Bloomberg: < DLMN> GO
SWOT Analysis
Strength and Opportunities
1. Good access to funding
2. Strong market position
3. The MTN brand enjoys a high level of consumer awareness and
attraction as a result of strong advertising and sponsorship activities
4. Information on competitor's activities
5. Growing mobile and internet market
6. Low mobile penetration rates in some markets
Weakness &Threat Weakness &Threat 1. Increasing cost of operation
2. Intense price competition in the market
3. Corporate governance, regulatory and political uncertainties
4. General slowdown in economic activities which may affect earnings
growth.
5. The uprising insecurity on network facility.
6. Too many expansions can lead to loss of focus
7. Mobile number portability may impact growth
Equity Research | MTN Nigeria Communications Limited DLM RESEARCH
January 12, 2017 18 www.dunnlorenmerrifield.com
Bloomberg: < DLMN> GO
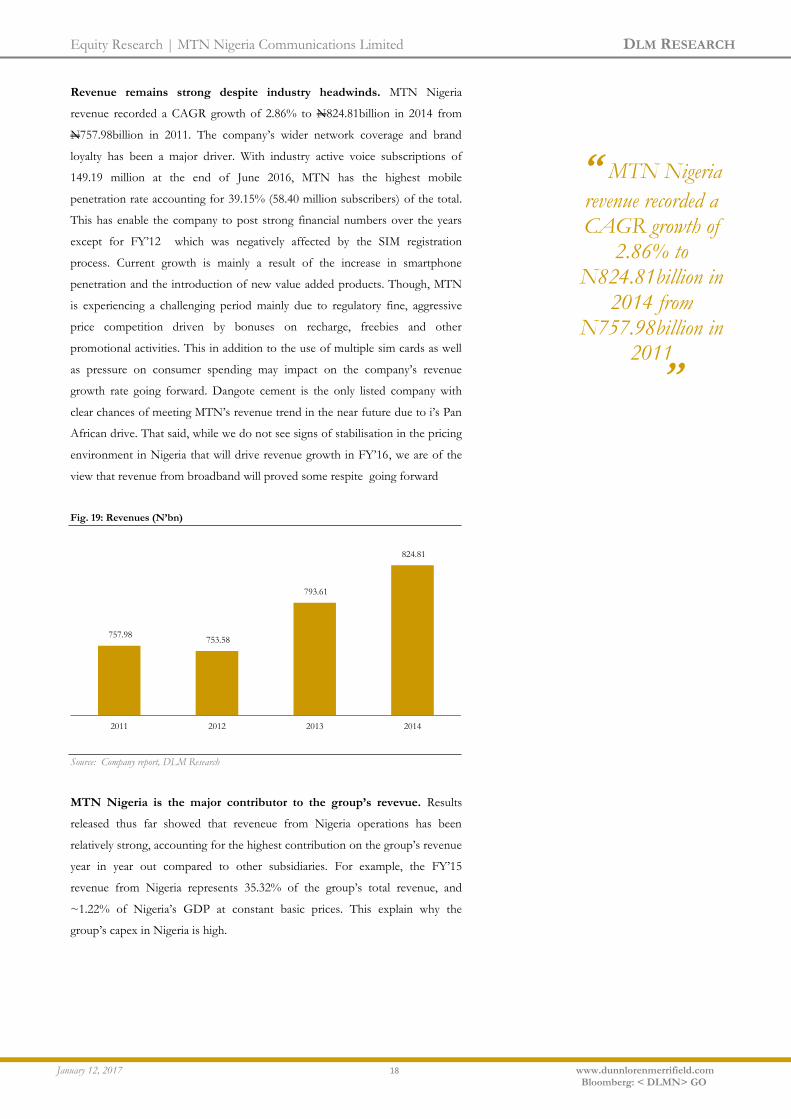
Revenue remains strong despite industry headwinds. MTN Nigeria
revenue recorded a CAGR growth of 2.86% to N824.81billion in 2014 from
N757.98billion in 2011. The company’s wider network coverage and brand
loyalty has been a major driver. With industry active voice subscriptions of
149.19 million at the end of June 2016, MTN has the highest mobile
penetration rate accounting for 39.15% (58.40 million subscribers) of the total.
This has enable the company to post strong financial numbers over the years
except for FY’12 which was negatively affected by the SIM registration
process. Current growth is mainly a result of the increase in smartphone
penetration and the introduction of new value added products. Though, MTN
is experiencing a challenging period mainly due to regulatory fine, aggressive
price competition driven by bonuses on recharge, freebies and other
promotional activities. This in addition to the use of multiple sim cards as well
as pressure on consumer spending may impact on the company’s revenue
growth rate going forward. Dangote cement is the only listed company with
clear chances of meeting MTN’s revenue trend in the near future due to i’s Pan
African drive. That said, while we do not see signs of stabilisation in the pricing
environment in Nigeria that will drive revenue growth in FY’16, we are of the
view that revenue from broadband will proved some respite going forward
Fig. 19: Revenues (N’bn)
Source: Company report, DLM Research
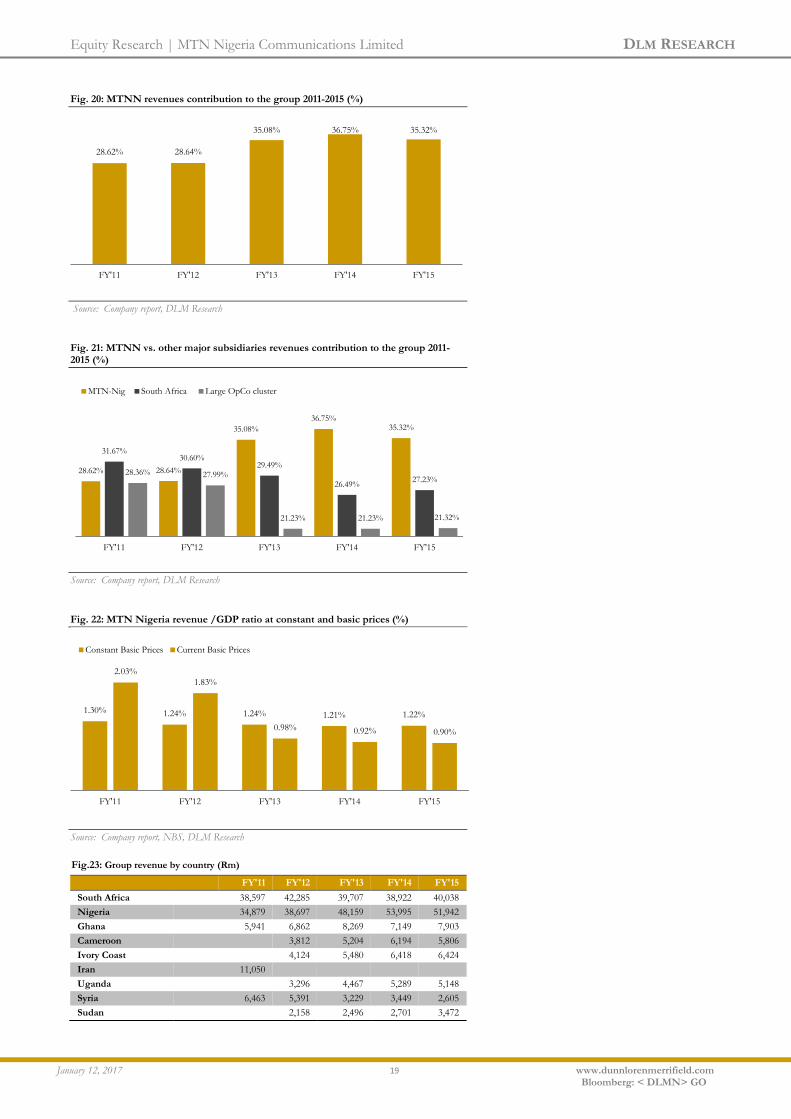
MTN Nigeria is the major contributor to the group’s revevue. Results
released thus far showed that reveneue from Nigeria operations has been
relatively strong, accounting for the highest contribution on the group’s revenue
year in year out compared to other subsidiaries. For example, the FY’15
revenue from Nigeria represents 35.32% of the group’s total revenue, and
~1.22% of Nigeria’s GDP at constant basic prices. This explain why the
group’s capex in Nigeria is high.
757.98 753.58
793.61
824.81
2011 2012 2013 2014
“ MTN Nigeria
revenue recorded a CAGR growth of
2.86% to N824.81billion in
2014 from N757.98billion in
2011 ’’
Equity Research | MTN Nigeria Communications Limited DLM RESEARCH
January 12, 2017 19 www.dunnlorenmerrifield.com
Bloomberg: < DLMN> GO
Fig. 20: MTNN revenues contribution to the group 2011-2015 (%)
Source: Company report, DLM Research
Fig. 21: MTNN vs. other major subsidiaries revenues contribution to the group 2011-2015 (%)
Source: Company report, DLM Research
Fig. 22: MTN Nigeria revenue /GDP ratio at constant and basic prices (%)
Source: Company report, NBS, DLM Research
28.62% 28.64%
35.08% 36.75% 35.32%
FY'11 FY'12 FY'13 FY'14 FY'15
28.62% 28.64%
35.08%
36.75% 35.32%
31.67% 30.60%
29.49%
26.49% 27.23%
28.36% 27.99%
21.23% 21.23% 21.32%
FY'11 FY'12 FY'13 FY'14 FY'15
MTN-Nig South Africa Large OpCo cluster
1.30% 1.24% 1.24% 1.21% 1.22%
2.03%
1.83%
0.98% 0.92% 0.90%
FY'11 FY'12 FY'13 FY'14 FY'15
Constant Basic Prices Current Basic Prices
Fig.23: Group revenue by country (Rm)
FY'11 FY'12 FY'13 FY'14 FY'15
South Africa 38,597 42,285 39,707 38,922 40,038
Nigeria 34,879 38,697 48,159 53,995 51,942
Ghana 5,941 6,862 8,269 7,149 7,903
Cameroon
3,812 5,204 6,194 5,806
Ivory Coast
4,124 5,480 6,418 6,424
Iran 11,050
Uganda
3,296 4,467 5,289 5,148
Syria 6,463 5,391 3,229 3,449 2,605
Sudan
2,158 2,496 2,701 3,472
Equity Research | MTN Nigeria Communications Limited DLM RESEARCH
January 12, 2017 20 www.dunnlorenmerrifield.com
Bloomberg: < DLMN> GO
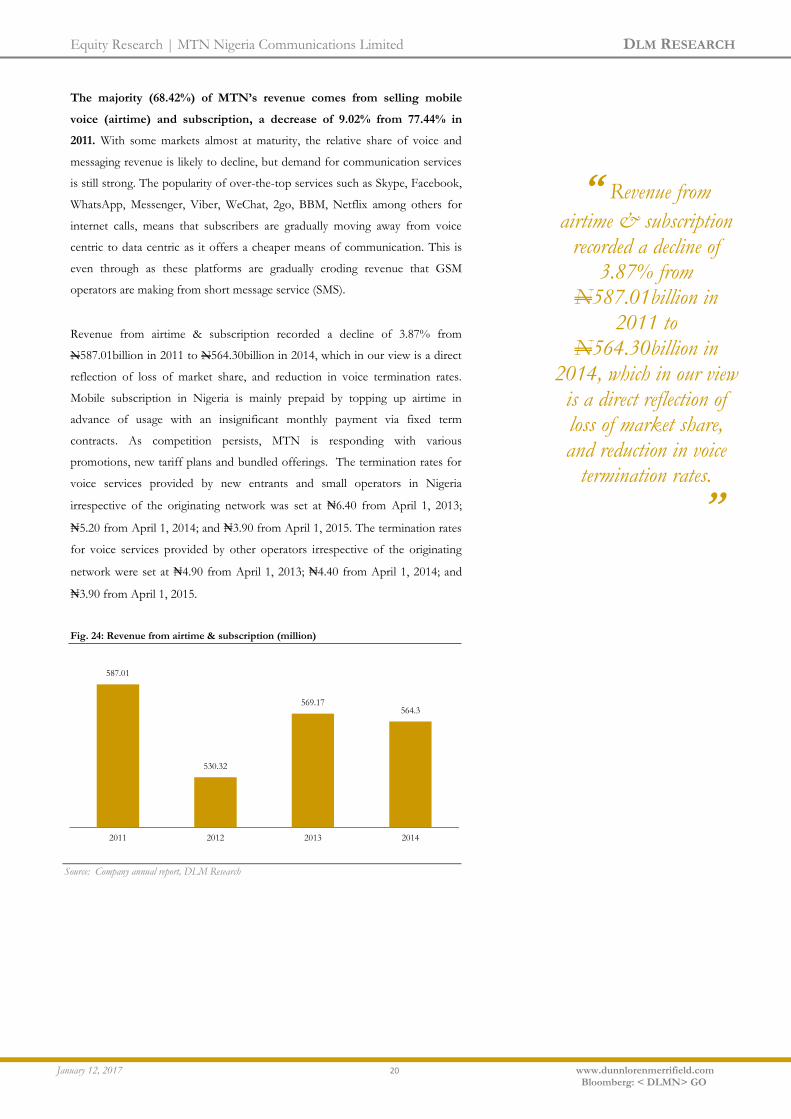
The majority (68.42%) of MTN’s revenue comes from selling mobile
voice (airtime) and subscription, a decrease of 9.02% from 77.44% in
2011. With some markets almost at maturity, the relative share of voice and
messaging revenue is likely to decline, but demand for communication services
is still strong. The popularity of over-the-top services such as Skype, Facebook,
WhatsApp, Messenger, Viber, WeChat, 2go, BBM, Netflix among others for
internet calls, means that subscribers are gradually moving away from voice
centric to data centric as it offers a cheaper means of communication. This is
even through as these platforms are gradually eroding revenue that GSM
operators are making from short message service (SMS).
Revenue from airtime & subscription recorded a decline of 3.87% from
N587.01billion in 2011 to N564.30billion in 2014, which in our view is a direct
reflection of loss of market share, and reduction in voice termination rates.
Mobile subscription in Nigeria is mainly prepaid by topping up airtime in
advance of usage with an insignificant monthly payment via fixed term
contracts. As competition persists, MTN is responding with various
promotions, new tariff plans and bundled offerings. The termination rates for
voice services provided by new entrants and small operators in Nigeria
irrespective of the originating network was set at ₦6.40 from April 1, 2013;
₦5.20 from April 1, 2014; and ₦3.90 from April 1, 2015. The termination rates
for voice services provided by other operators irrespective of the originating
network were set at ₦4.90 from April 1, 2013; ₦4.40 from April 1, 2014; and
₦3.90 from April 1, 2015.
Fig. 24: Revenue from airtime & subscription (million)
Source: Company annual report, DLM Research
587.01
530.32
569.17 564.3
2011 2012 2013 2014
“ Revenue from
airtime & subscription recorded a decline of
3.87% from N587.01billion in
2011 to N564.30billion in
2014, which in our view is a direct reflection of loss of market share, and reduction in voice
termination rates.
’’

Equity Research | MTN Nigeria Communications Limited DLM RESEARCH
January 12, 2017 21 www.dunnlorenmerrifield.com
Bloomberg: < DLMN> GO
Fig. 25: Airtime & subscription contribution to revenue (%)
Source: Company annual report, DLM Research
Data revenue is growing and is expected to hit the N150 billion mark by
the end of 2016 as data usage increases. This is part of the company’s
strategy to boost the declining average revenues per user (ARPU).following the
acquisition of Visafone with focus on enhancing data and internet services.
MTN strategy is to tap into the growth opportunities in the e-commerce field,
expand its product offering outside of traditional voice, increase presence in the
digital space by leveraging technologies and taking advantage of low levels of
internet penetration in a bid to generate a substantial amount of income from
the sector. With increasing use of data for over-the-top services, video and app
download; we see e-commerce and data income as a good long-term bet for
MTN’s endeavours to diversify revenue to cushion the effect of low ARPU in
Nigeria.
Fig. 26: Income contribution
Airtime & Subscription 587,011 530,316 569,168 564,301
Data 37,889 80,788 93,566 105,572
SMS 22,474 31,313 19,338 15,823
Interconnect & Roaming 91,705 92,334 77,173 86,846
Handset & Accessories 1,701 2,439 1,705 223
Others 17,199 26,388 32,664 52,041
Total 757,979 763,578 793,614 824,806
Fig. 27: Data contribution to revenue (%)
Source: Company annual report, DLM Research
77.44%
70.37%
71.72%
68.42%
FY'11 FY'12 FY'13 FY'14
5.00%
10.72%
11.79% 12.80%
FY'11 FY'12 FY'13 FY'14
“ With increasing use
of data for over-the-top services, video and app
download; we see e-commerce and data
income as a good long-term bet for MTN’s
endeavours to diversify revenue to cushion the effect of low ARPU in
Nigeria
’’
Equity Research | MTN Nigeria Communications Limited DLM RESEARCH
January 12, 2017 22 www.dunnlorenmerrifield.com
Bloomberg: < DLMN> GO
Fig. 28: Data revenue projection (N’bn)
Source: Company annual report, DLM Research
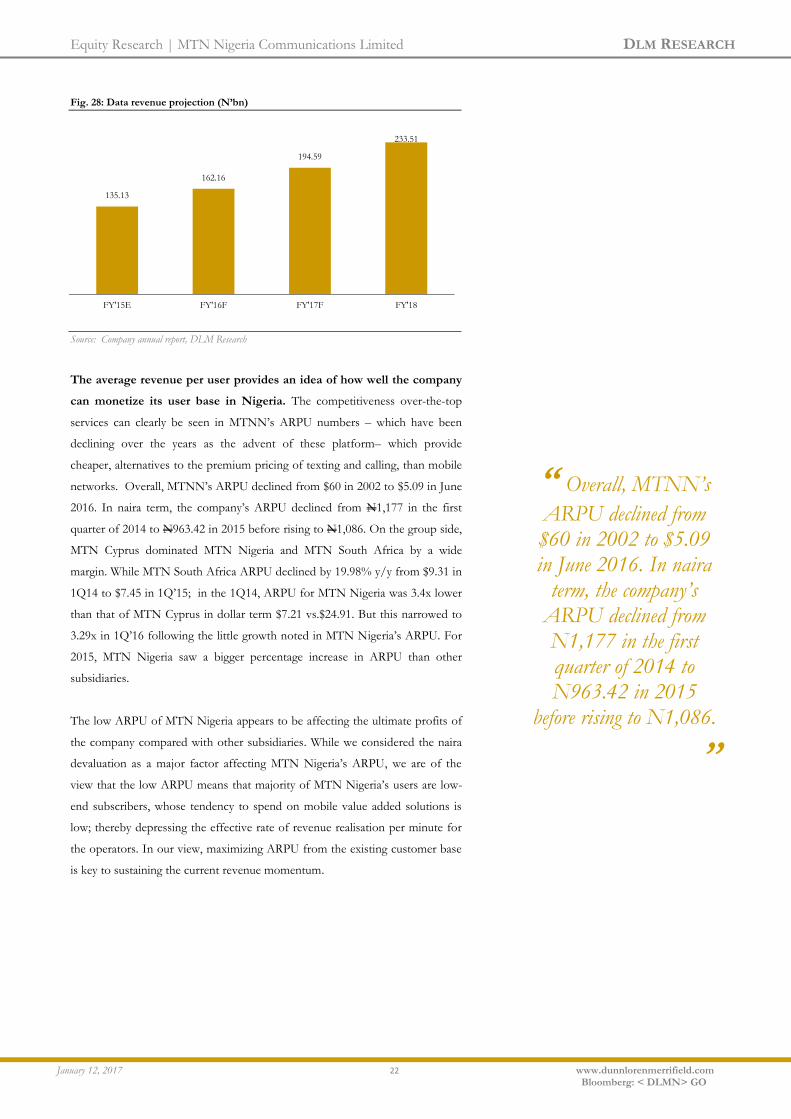
The average revenue per user provides an idea of how well the company
can monetize its user base in Nigeria. The competitiveness over-the-top
services can clearly be seen in MTNN’s ARPU numbers – which have been
declining over the years as the advent of these platform– which provide
cheaper, alternatives to the premium pricing of texting and calling, than mobile
networks. Overall, MTNN’s ARPU declined from $60 in 2002 to $5.09 in June
2016. In naira term, the company’s ARPU declined from N1,177 in the first
quarter of 2014 to N963.42 in 2015 before rising to N1,086. On the group side,
MTN Cyprus dominated MTN Nigeria and MTN South Africa by a wide
margin. While MTN South Africa ARPU declined by 19.98% y/y from $9.31 in
1Q14 to $7.45 in 1Q’15; in the 1Q14, ARPU for MTN Nigeria was 3.4x lower
than that of MTN Cyprus in dollar term $7.21 vs.$24.91. But this narrowed to
3.29x in 1Q’16 following the little growth noted in MTN Nigeria’s ARPU. For
2015, MTN Nigeria saw a bigger percentage increase in ARPU than other
subsidiaries.
The low ARPU of MTN Nigeria appears to be affecting the ultimate profits of
the company compared with other subsidiaries. While we considered the naira
devaluation as a major factor affecting MTN Nigeria’s ARPU, we are of the
view that the low ARPU means that majority of MTN Nigeria’s users are low-
end subscribers, whose tendency to spend on mobile value added solutions is
low; thereby depressing the effective rate of revenue realisation per minute for
the operators. In our view, maximizing ARPU from the existing customer base
is key to sustaining the current revenue momentum.
135.13
162.16
194.59
233.51
FY'15E FY'16F FY'17F FY'18
“ Overall, MTNN’s
ARPU declined from $60 in 2002 to $5.09 in June 2016. In naira
term, the company’s ARPU declined from N1,177 in the first quarter of 2014 to N963.42 in 2015
before rising to N1,086.
’’

Equity Research | MTN Nigeria Communications Limited DLM RESEARCH
January 12, 2017 23 www.dunnlorenmerrifield.com
Bloomberg: < DLMN> GO
Fig. 29: MTN Nigeria ARPU ($)
Source: Company annual report, DLM Research
Fig. 30: MTN Nigeria ARPU (Naira)
Source: Company annual report, DLM Research
Fig. 31: MTN Nigeria ARPU Trend ($)
Source: Company annual report, DLM Research
Fig. 32: MTNN ARPU vs. other subsidiaries ($)
Source: Company annual report, DLM Research
7.21
6.92 6.91
6.47
5.68
5.25
4.99 4.87
5.4
5.09
1Q14 1Q15 1Q16 2Q16
1,177.82
1,124.34 1,123.29 1,118.11 1,102.59
1,046.45
994.44
963.42
1,078.00 1,086
1Q14 1Q15 1Q16 2Q16
60
57
51
2002 2003 2004
7.21 6.92 6.91 6.47 5.68 5.25 4.99 4.87 5.4
9.31 8.86
8.34 8.21 7.45 7.46 7.22 6.4 3.32
24.91
27.35 25.39
21.99
19.35 19.37 19.8 18.38 17.78
11.46 11.21 12.06 10.54
9.14 9.02 9.48 9.0 8.0
1Q14 2Q14 3Q14 4Q14 1Q15 2Q15 3Q15 4Q15 1Q16
Nigeria SA Cyprus Congo.B
Equity Research | MTN Nigeria Communications Limited DLM RESEARCH
January 12, 2017 24 www.dunnlorenmerrifield.com
Bloomberg: < DLMN> GO
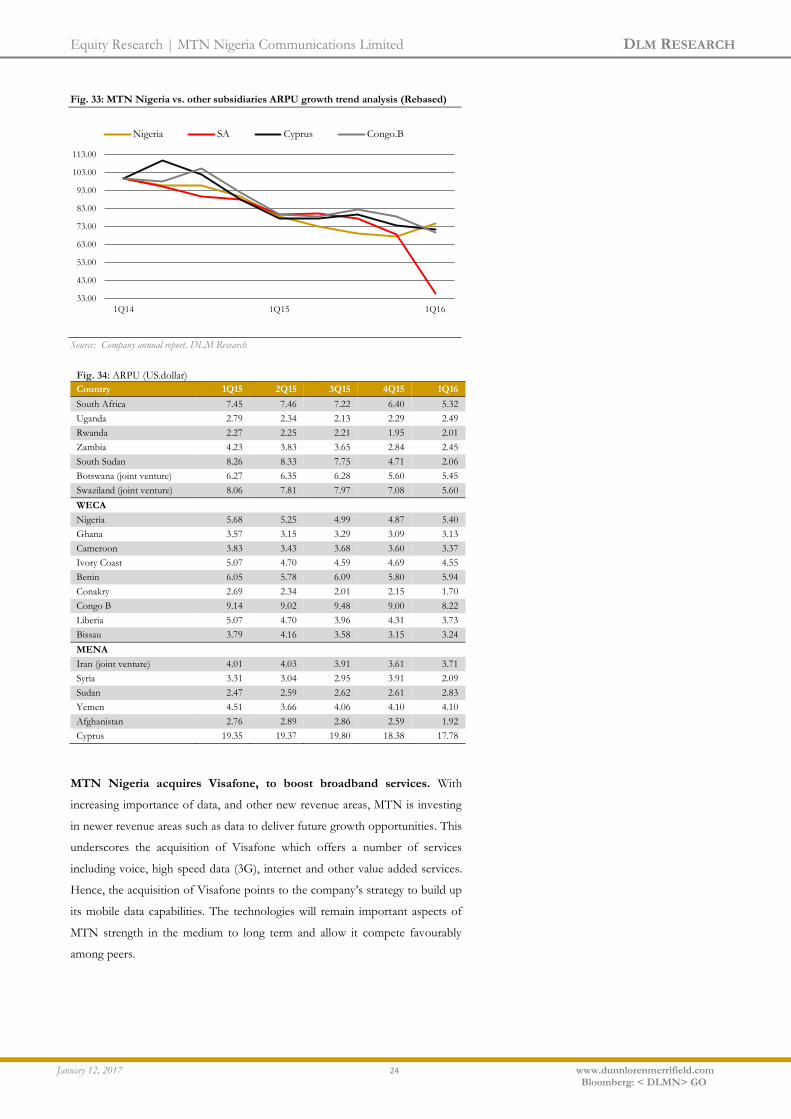
Fig. 33: MTN Nigeria vs. other subsidiaries ARPU growth trend analysis (Rebased)
Source: Company annual report, DLM Research
Fig. 34: ARPU (US.dollar) Country 1Q15 2Q15 3Q15 4Q15 1Q16
South Africa 7.45 7.46 7.22 6.40 5.32
Uganda 2.79 2.34 2.13 2.29 2.49
Rwanda 2.27 2.25 2.21 1.95 2.01
Zambia 4.23 3.83 3.65 2.84 2.45
South Sudan 8.26 8.33 7.75 4.71 2.06
Botswana (joint venture) 6.27 6.35 6.28 5.60 5.45
Swaziland (joint venture) 8.06 7.81 7.97 7.08 5.60
WECA
Nigeria 5.68 5.25 4.99 4.87 5.40
Ghana 3.57 3.15 3.29 3.09 3.13
Cameroon 3.83 3.43 3.68 3.60 3.37
Ivory Coast 5.07 4.70 4.59 4.69 4.55
Benin 6.05 5.78 6.09 5.80 5.94
Conakry 2.69 2.34 2.01 2.15 1.70
Congo B 9.14 9.02 9.48 9.00 8.22
Liberia 5.07 4.70 3.96 4.31 3.73
Bissau 3.79 4.16 3.58 3.15 3.24
MENA
Iran (joint venture) 4.01 4.03 3.91 3.61 3.71
Syria 3.31 3.04 2.95 3.91 2.09
Sudan 2.47 2.59 2.62 2.61 2.83
Yemen 4.51 3.66 4.06 4.10 4.10
Afghanistan 2.76 2.89 2.86 2.59 1.92
Cyprus 19.35 19.37 19.80 18.38 17.78
MTN Nigeria acquires Visafone, to boost broadband services. With
increasing importance of data, and other new revenue areas, MTN is investing
in newer revenue areas such as data to deliver future growth opportunities. This
underscores the acquisition of Visafone which offers a number of services
including voice, high speed data (3G), internet and other value added services.
Hence, the acquisition of Visafone points to the company’s strategy to build up
its mobile data capabilities. The technologies will remain important aspects of
MTN strength in the medium to long term and allow it compete favourably
among peers.
33.00
43.00
53.00
63.00
73.00
83.00
93.00
103.00
113.00
1Q14 1Q15 1Q16
Nigeria SA Cyprus Congo.B

Equity Research | MTN Nigeria Communications Limited DLM RESEARCH
January 12, 2017 25 www.dunnlorenmerrifield.com
Bloomberg: < DLMN> GO
The acquisition gives MTN edge over other mobile operators as the first major
operator to introduce 4G voice telephony which would improve e-commerce
sector, banking; insurance and financial services, software and IT enabled
services and widens the revenue base of the company. We think that MTN will
integrate the operation of Visafone into its GSM operation, and run it as voice
over its 4G Long Term Evolution (LTE) technology network as against the
initial plans to run Visafone as a Code Division Multiple Access. The new
800MHz frequency band will enable MTN to compete effectively with
Globacom which has 700 MHz spectrum.
MTN Nigeria account for the highest subscribers in the group’s total
subscribers. Despite the growing competition in the industry, MTNN
recorded 22.6 million net additional subscribers in the last 5years (2010-2015)
following regulatory approval of select promotional offerings from October
2014. As at December 2015, MTNN recorded 61.3 million subscribers,
representing 58.40% growth between 2010 and 2015, and accounted for
26.37% of the group’s total subscribers. In 2015 alone, MTN Nigeria recorded
a 2.34% growth by ramping up 1.4 million customers in a year that saw its
parent company also increasing customer base by 9.1million to 232.5 million
subscribers, representing 4.07% growth y-o-y.
Fig. 35: MTNN subscribers’ vs. Group subscribers 2010-2015 (million)
Source: Company annual report, DLM Research
Fig. 36: MTNN subscribers’ contribution to group’s total subscribers’ (%)
Source: Company annual report, DLM Research
38.7 41.6 47.4 56.8 59.9 61.3
141.6
164.5
189.3 207.8
223.4 232.5
FY'10 FY'11 FY'12 FY'13 FY'14 FY'15
MTN Nig MTN Group
27.33%
25.29% 25.04%
27.33%
26.81%
26.37%
FY'10 FY'11 FY'12 FY'13 FY'14 FY'15
“ Despite the growing
competition in the industry, MTNN
recorded 22.6 million net additional
subscribers in the last 5years (2010-2015) following regulatory approval of select
promotional offerings from October 2014
’’
Equity Research | MTN Nigeria Communications Limited DLM RESEARCH
January 12, 2017 26 www.dunnlorenmerrifield.com
Bloomberg: < DLMN> GO
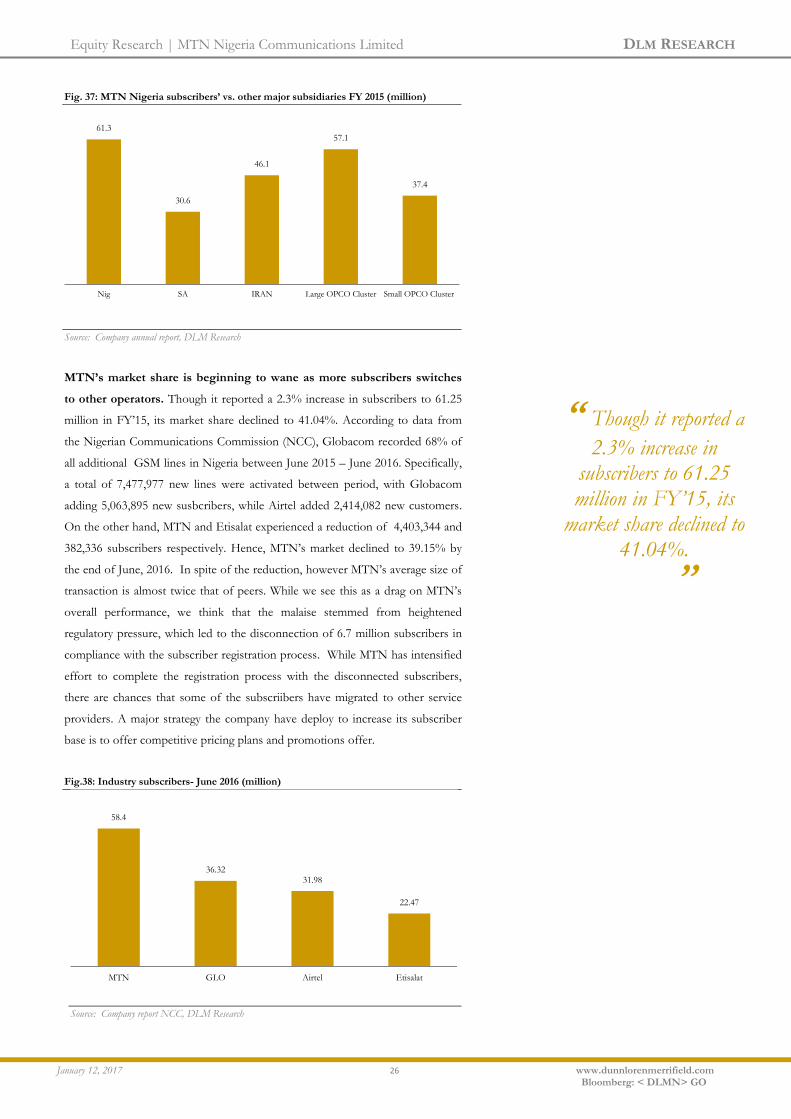
Fig. 37: MTN Nigeria subscribers’ vs. other major subsidiaries FY 2015 (million)
Source: Company annual report, DLM Research
MTN’s market share is beginning to wane as more subscribers switches
to other operators. Though it reported a 2.3% increase in subscribers to 61.25
million in FY’15, its market share declined to 41.04%. According to data from
the Nigerian Communications Commission (NCC), Globacom recorded 68% of
all additional GSM lines in Nigeria between June 2015 – June 2016. Specifically,
a total of 7,477,977 new lines were activated between period, with Globacom
adding 5,063,895 new susbcribers, while Airtel added 2,414,082 new customers.
On the other hand, MTN and Etisalat experienced a reduction of 4,403,344 and
382,336 subscribers respectively. Hence, MTN’s market declined to 39.15% by
the end of June, 2016. In spite of the reduction, however MTN’s average size of
transaction is almost twice that of peers. While we see this as a drag on MTN’s
overall performance, we think that the malaise stemmed from heightened
regulatory pressure, which led to the disconnection of 6.7 million subscribers in
compliance with the subscriber registration process. While MTN has intensified
effort to complete the registration process with the disconnected subscribers,
there are chances that some of the subscriibers have migrated to other service
providers. A major strategy the company have deploy to increase its subscriber
base is to offer competitive pricing plans and promotions offer.
Fig.38: Industry subscribers- June 2016 (million)
Source: Company report NCC, DLM Research
61.3
30.6
46.1
57.1
37.4
Nig SA IRAN Large OPCO Cluster Small OPCO Cluster
58.4
36.32 31.98
22.47
MTN GLO Airtel Etisalat
“ Though it reported a
2.3% increase in subscribers to 61.25 million in FY’15, its
market share declined to 41.04%.
’’
Equity Research | MTN Nigeria Communications Limited DLM RESEARCH
January 12, 2017 27 www.dunnlorenmerrifield.com
Bloomberg: < DLMN> GO
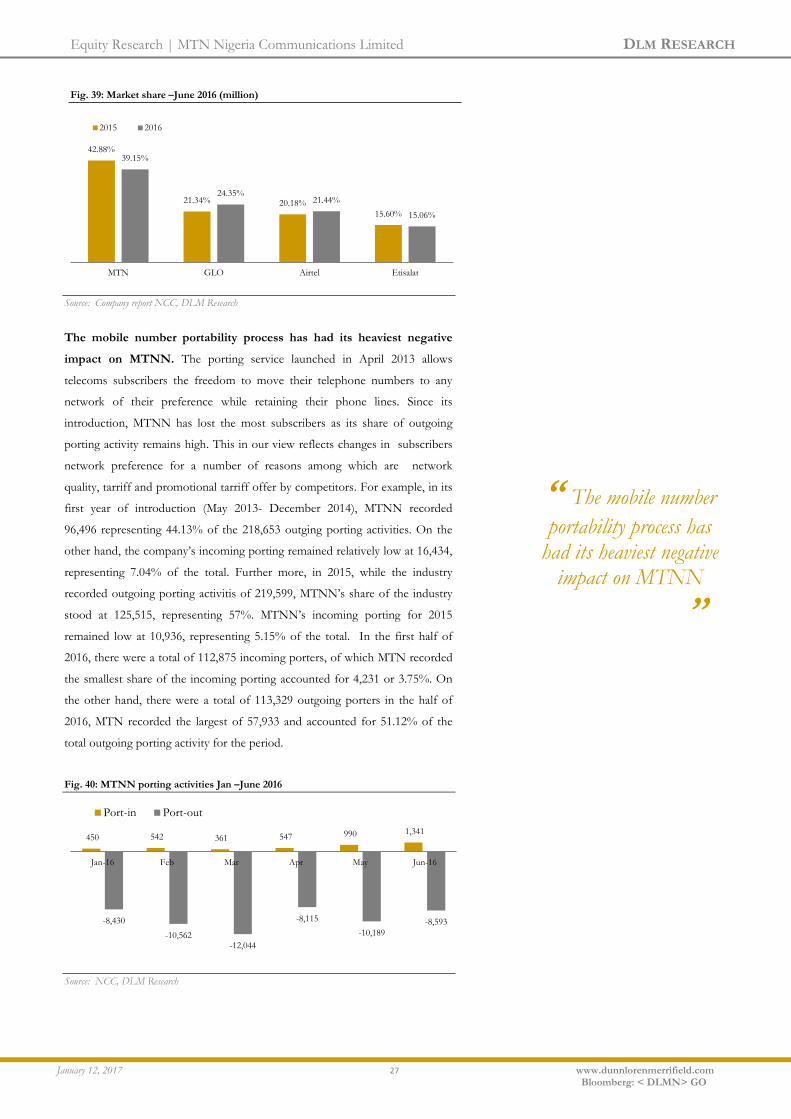
Fig. 39: Market share –June 2016 (million)
Source: Company report NCC, DLM Research
The mobile number portability process has had its heaviest negative
impact on MTNN. The porting service launched in April 2013 allows
telecoms subscribers the freedom to move their telephone numbers to any
network of their preference while retaining their phone lines. Since its
introduction, MTNN has lost the most subscribers as its share of outgoing
porting activity remains high. This in our view reflects changes in subscribers
network preference for a number of reasons among which are network
quality, tarriff and promotional tarriff offer by competitors. For example, in its
first year of introduction (May 2013- December 2014), MTNN recorded
96,496 representing 44.13% of the 218,653 outging porting activities. On the
other hand, the company’s incoming porting remained relatively low at 16,434,
representing 7.04% of the total. Further more, in 2015, while the industry
recorded outgoing porting activitis of 219,599, MTNN’s share of the industry
stood at 125,515, representing 57%. MTNN’s incoming porting for 2015
remained low at 10,936, representing 5.15% of the total. In the first half of
2016, there were a total of 112,875 incoming porters, of which MTN recorded
the smallest share of the incoming porting accounted for 4,231 or 3.75%. On
the other hand, there were a total of 113,329 outgoing porters in the half of
2016, MTN recorded the largest of 57,933 and accounted for 51.12% of the
total outgoing porting activity for the period.
Fig. 40: MTNN porting activities Jan –June 2016
Source: NCC, DLM Research
42.88%
21.34% 20.18%
15.60%
39.15%
24.35% 21.44%
15.06%
MTN GLO Airtel Etisalat
2015 2016
450 542 361 547 990 1,341
-8,430
-10,562 -12,044
-8,115
-10,189
-8,593
Jan-16 Feb Mar Apr May Jun-16
Port-in Port-out
“ The mobile number
portability process has had its heaviest negative
impact on MTNN
’’

Equity Research | MTN Nigeria Communications Limited DLM RESEARCH
January 12, 2017 28 www.dunnlorenmerrifield.com
Bloomberg: < DLMN> GO
Fig. 41: MTNN porting activities 2015
Source: NCC, DLM Research
Higher operating cost holding back operating profits. MTN has been
unable to increase operating profits by as much as 2% CAGR since 2011
as operating costs continues to exert pressure on operating profits and
margins. Operating overhead in Nigeria appears high with very wide cost
structure which comprises of NCC levies, site maintenance cost, leased capacity
cost, diesel cost, high valued equipment maintenance contracts, and community
relation costs. The upsurge in these costs has given way to decline in operating
profit. MTN’s operating expenses rose from N402.88 billion in 2011 to
N495.88billion. On the other hand, operating profit declined from N355.01
billion in 2011 to N328.93 billion in 2014. Despite the increase in general cost
level, we believe MTN needs to be cost efficient to address this negative trend
going forward. The major drivers of costs are depreciation, and direct network
operation costs. While tower maintenance is one of the biggest costs, MTN sold
9,151 of its Nigerian cell towers to infrastructure company IHS in order to drive
down its operating costs as the towers were expensive to maintain. Some of the
underlined challenges were; inaccessible roads to some of the tower, high
security costs and weak power supply. The lack of stable power supply in
Nigeria has meant MTNN run up high operating costs that affect its profit level.
For instance, in 2014, MTN Nigeria spent c.N30.5billion on the purchase of
diesel. The company’s high power bill accounts for over 50% of its operating
costs.
Fig. 42: Operating cost and cost to revenue ratio 2011-2014 (Billion, %)
Source: Company annual report, DLM Research
1,186 1,478 1,559 994 657 536 951 737 599 1,068 735 436
(6,571) (6,951) (7,439) (8,161) (9,558)
(11,918)
(19,214)
(11,218) (12,259)
(10,073) (11,414) (10,739)
Jan-15 Feb Mar Apr May Jun Jul Aug Sep Oct Nov Dec-15
Port-in Port-out
50.00%
52.00%
54.00%
56.00%
58.00%
60.00%
62.00%
350.00
400.00
450.00
500.00
550.00
600.00
2011 2012 2013 2014
Operating costs Cost to revenue
“ MTN’s operating
expenses rose from N402.88 billion in
2011 to N495.88billion. On
the other hand, operating profit declined from N355.01 billion in 2011 to N328.93 billion in 2014.
’’
Equity Research | MTN Nigeria Communications Limited DLM RESEARCH
January 12, 2017 29 www.dunnlorenmerrifield.com
Bloomberg: < DLMN> GO
Fig.43: Operating profit , OP. cost/profit ratios and OP. margins (Billion, %)
Source: Company annual report, DLM Research
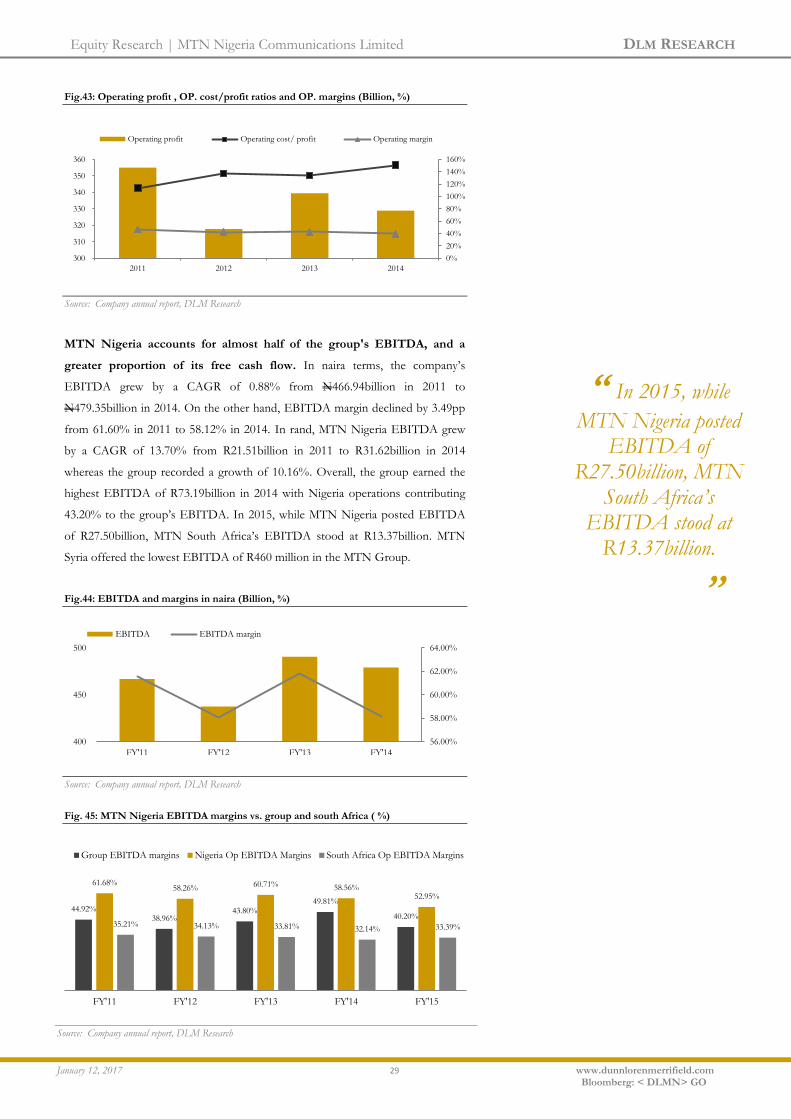
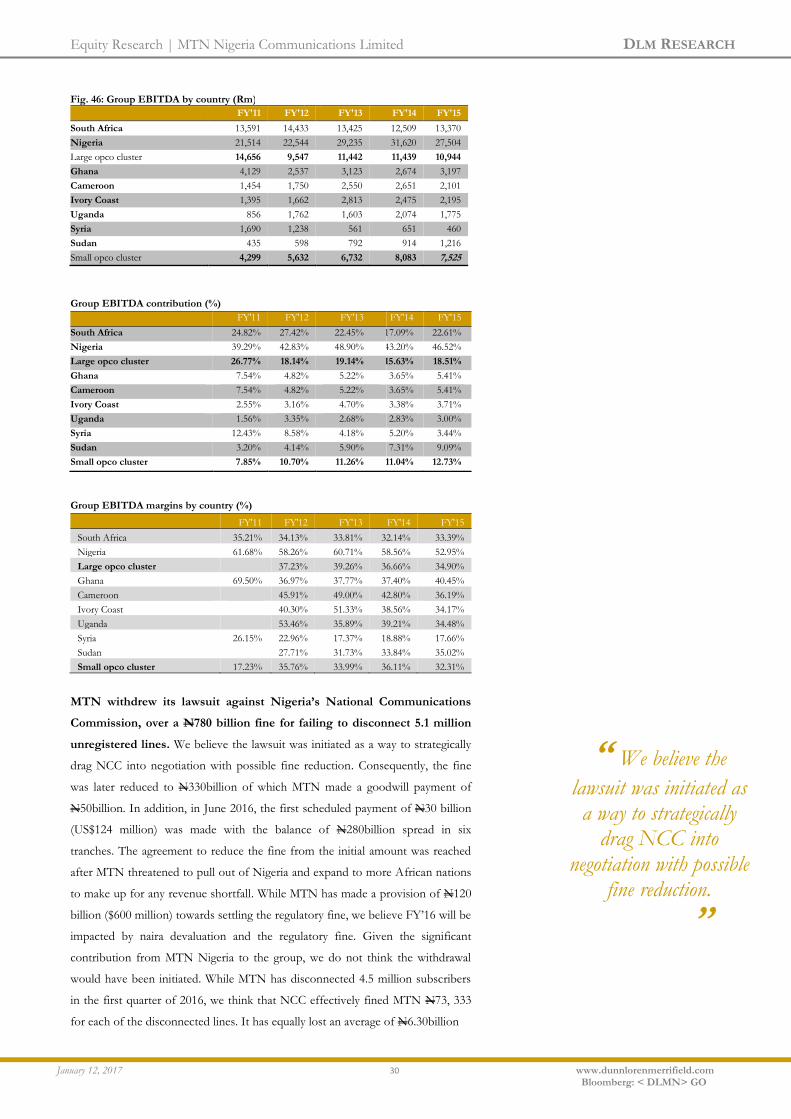
MTN Nigeria accounts for almost half of the group's EBITDA, and a
greater proportion of its free cash flow. In naira terms, the company’s
EBITDA grew by a CAGR of 0.88% from N466.94billion in 2011 to
N479.35billion in 2014. On the other hand, EBITDA margin declined by 3.49pp
from 61.60% in 2011 to 58.12% in 2014. In rand, MTN Nigeria EBITDA grew
by a CAGR of 13.70% from R21.51billion in 2011 to R31.62billion in 2014
whereas the group recorded a growth of 10.16%. Overall, the group earned the
highest EBITDA of R73.19billion in 2014 with Nigeria operations contributing
43.20% to the group’s EBITDA. In 2015, while MTN Nigeria posted EBITDA
of R27.50billion, MTN South Africa’s EBITDA stood at R13.37billion. MTN
Syria offered the lowest EBITDA of R460 million in the MTN Group.
Fig.44: EBITDA and margins in naira (Billion, %)
Source: Company annual report, DLM Research
Fig. 45: MTN Nigeria EBITDA margins vs. group and south Africa ( %)
0%
20%
40%
60%
80%
100%
120%
140%
160%
300
310
320
330
340
350
360
2011 2012 2013 2014
Operating profit Operating cost/ profit Operating margin
56.00%
58.00%
60.00%
62.00%
64.00%
400
450
500
FY'11 FY'12 FY'13 FY'14
EBITDA EBITDA margin
44.92% 38.96%
43.80% 49.81%
40.20%
61.68% 58.26% 60.71% 58.56%
52.95%
35.21% 34.13% 33.81% 32.14% 33.39%
FY'11 FY'12 FY'13 FY'14 FY'15
Group EBITDA margins Nigeria Op EBITDA Margins South Africa Op EBITDA Margins
Source: Company annual report, DLM Research
“ In 2015, while
MTN Nigeria posted EBITDA of
R27.50billion, MTN South Africa’s
EBITDA stood at R13.37billion.
’’
Equity Research | MTN Nigeria Communications Limited DLM RESEARCH
January 12, 2017 30 www.dunnlorenmerrifield.com
Bloomberg: < DLMN> GO
Fig. 46: Group EBITDA by country (Rm)
FY'11 FY'12 FY'13 FY'14 FY'15
South Africa 13,591 14,433 13,425 12,509 13,370
Nigeria 21,514 22,544 29,235 31,620 27,504
Large opco cluster 14,656 9,547 11,442 11,439 10,944
Ghana 4,129 2,537 3,123 2,674 3,197
Cameroon 1,454 1,750 2,550 2,651 2,101
Ivory Coast 1,395 1,662 2,813 2,475 2,195
Uganda 856 1,762 1,603 2,074 1,775
Syria 1,690 1,238 561 651 460
Sudan 435 598 792 914 1,216
Small opco cluster 4,299 5,632 6,732 8,083 7,525
Group EBITDA contribution (%)
FY'11 FY'12 FY'13 FY'14 FY'15
South Africa 24.82% 27.42% 22.45% 17.09% 22.61%
Nigeria 39.29% 42.83% 48.90% 43.20% 46.52%
Large opco cluster 26.77% 18.14% 19.14% 15.63% 18.51%
Ghana 7.54% 4.82% 5.22% 3.65% 5.41%
Cameroon 7.54% 4.82% 5.22% 3.65% 5.41%
Ivory Coast 2.55% 3.16% 4.70% 3.38% 3.71%
Uganda 1.56% 3.35% 2.68% 2.83% 3.00%
Syria 12.43% 8.58% 4.18% 5.20% 3.44%
Sudan 3.20% 4.14% 5.90% 7.31% 9.09%
Small opco cluster 7.85% 10.70% 11.26% 11.04% 12.73%
Group EBITDA margins by country (%)
FY'11 FY'12 FY'13 FY'14 FY'15
South Africa 35.21% 34.13% 33.81% 32.14% 33.39%
Nigeria 61.68% 58.26% 60.71% 58.56% 52.95%
Large opco cluster
37.23% 39.26% 36.66% 34.90%
Ghana 69.50% 36.97% 37.77% 37.40% 40.45%
Cameroon 45.91% 49.00% 42.80% 36.19%
Ivory Coast 40.30% 51.33% 38.56% 34.17%
Uganda 53.46% 35.89% 39.21% 34.48%
Syria 26.15% 22.96% 17.37% 18.88% 17.66%
Sudan 27.71% 31.73% 33.84% 35.02%
Small opco cluster 17.23% 35.76% 33.99% 36.11% 32.31%
MTN withdrew its lawsuit against Nigeria’s National Communications
Commission, over a N780 billion fine for failing to disconnect 5.1 million
unregistered lines. We believe the lawsuit was initiated as a way to strategically
drag NCC into negotiation with possible fine reduction. Consequently, the fine
was later reduced to N330billion of which MTN made a goodwill payment of
N50billion. In addition, in June 2016, the first scheduled payment of N30 billion
(US$124 million) was made with the balance of N280billion spread in six
tranches. The agreement to reduce the fine from the initial amount was reached
after MTN threatened to pull out of Nigeria and expand to more African nations
to make up for any revenue shortfall. While MTN has made a provision of N120
billion ($600 million) towards settling the regulatory fine, we believe FY’16 will be
impacted by naira devaluation and the regulatory fine. Given the significant
contribution from MTN Nigeria to the group, we do not think the withdrawal
would have been initiated. While MTN has disconnected 4.5 million subscribers
in the first quarter of 2016, we think that NCC effectively fined MTN N73, 333
for each of the disconnected lines. It has equally lost an average of N6.30billion
“ We believe the
lawsuit was initiated as a way to strategically
drag NCC into negotiation with possible
fine reduction.
’’

Equity Research | MTN Nigeria Communications Limited DLM RESEARCH
January 12, 2017 31 www.dunnlorenmerrifield.com
Bloomberg: < DLMN> GO
in month (N18.83bn in the first quarter) using $4.5 average revenue per
subscriber in a month. MTN Nigeria has always been fine for a number of
offences. For example, in 2014, NCC imposed quality of service fine of
N185million on the company which was duly paid. The fine underlines some of
the wider risks associated with emerging markets.
Fig. 47: MTN Nigeria regulatory fines 2012 - 2015 ( N’bn)
Source: Company annual report, DLM Research
H1’16 performance negatively impacted by regulatory pressure. For H1
2016, MTN Nigeria’s revenue declined by 4.80% to N389.35billion from
N408.99billion in the prior year. Revenue growth for the period was impacted
by a number of factors such as; 1) disconnection of the final batch of
subscribers in compliance with the subscriber registration process. 2) The
suspension of regulatory services until May 2016 when the operation attained
the necessary approvals to introduce market-related pricing plans and
promotions. 3) The introduction of regulatory restrictions on “out-of-bundle”
data tariffs which impacted MTN Nigeria’s data revenue growth. 4) Multiple
SIM usage. Digital revenue gained contributed 51.7% to data revenue
supported by growth in music and other lifestyle content services. EBITDA
margin declined by 7.5 pp to 49.8%, impacted by the transfer of the second
tranche of passive infrastructure into the TowerCo as well as US dollar-
denominated expenses associated with the TowerCo and build-to-suit sites.
This was supported by 13.8% increase in marketing costs relating to the
subscriber registration process.
Fig. 48: MTN Nigeria interim revenues 2013 - 2016 ( N’bn)
Source: Company report, DLM Research
0.360 0.131 0.185
330
2012 2013 2014 2015
383.06 413.61 408.99 389.35
410.56 411.20 398.45
2013 2014 2015 2016
H1 H2
“ For the half year
2016, MTN Nigeria’s revenue declined by
4.80% to N389.35billion from N408.99billion in the
prior year.
’’
Equity Research | MTN Nigeria Communications Limited DLM RESEARCH
January 12, 2017 32 www.dunnlorenmerrifield.com
Bloomberg: < DLMN> GO
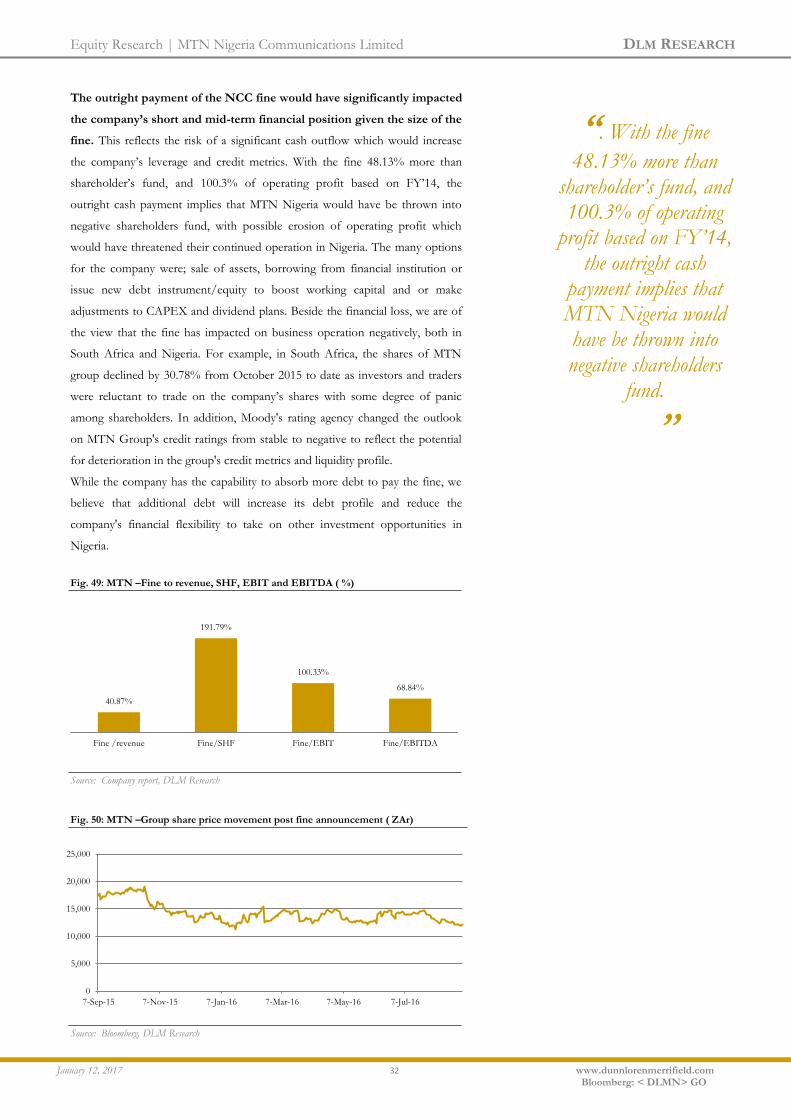
The outright payment of the NCC fine would have significantly impacted
the company’s short and mid-term financial position given the size of the
fine. This reflects the risk of a significant cash outflow which would increase
the company’s leverage and credit metrics. With the fine 48.13% more than
shareholder’s fund, and 100.3% of operating profit based on FY’14, the
outright cash payment implies that MTN Nigeria would have be thrown into
negative shareholders fund, with possible erosion of operating profit which
would have threatened their continued operation in Nigeria. The many options
for the company were; sale of assets, borrowing from financial institution or
issue new debt instrument/equity to boost working capital and or make
adjustments to CAPEX and dividend plans. Beside the financial loss, we are of
the view that the fine has impacted on business operation negatively, both in
South Africa and Nigeria. For example, in South Africa, the shares of MTN
group declined by 30.78% from October 2015 to date as investors and traders
were reluctant to trade on the company’s shares with some degree of panic
among shareholders. In addition, Moody's rating agency changed the outlook
on MTN Group's credit ratings from stable to negative to reflect the potential
for deterioration in the group's credit metrics and liquidity profile.
While the company has the capability to absorb more debt to pay the fine, we
believe that additional debt will increase its debt profile and reduce the
company's financial flexibility to take on other investment opportunities in
Nigeria.
Fig. 49: MTN –Fine to revenue, SHF, EBIT and EBITDA ( %)
Source: Company report, DLM Research
Fig. 50: MTN –Group share price movement post fine announcement ( ZAr)
Source: Bloomberg, DLM Research
40.87%
191.79%
100.33%
68.84%
Fine /revenue Fine/SHF Fine/EBIT Fine/EBITDA
0
5,000
10,000
15,000
20,000
25,000
7-Sep-15 7-Nov-15 7-Jan-16 7-Mar-16 7-May-16 7-Jul-16
“. With the fine
48.13% more than shareholder’s fund, and 100.3% of operating
profit based on FY’14, the outright cash
payment implies that MTN Nigeria would have be thrown into negative shareholders
fund.
’’

Equity Research | MTN Nigeria Communications Limited DLM RESEARCH
January 12, 2017 33 www.dunnlorenmerrifield.com
Bloomberg: < DLMN> GO
MTN group to issue dollar denominated bond to pay regulatory fine. The
decision to raise fund came after the company reported H1’16 loss pressured by
Nigeria operation regulatory fine. Since 2010, the group have issued a number
of bonds to fund business expansion. For example, in 2010, the group issued a
R1.25billion which matures in 2017. In 2014, the group also issued another
$750million note which matures in 2024. While the new bond when issued will
increase the group’s leverage profile and ratios, we think that it’s a right decision
for the company given that MTN Nigeria credit limit with Nigerian banks is
already high therefore limiting its borrowing capacity from Nigerian banks due
largely to CBN’s regulation that Nigerian banks cannot lend more than 20% of
their capital to one single company (single obligor limits). For example, in
2013, the company secured a 7-year loan worth $3 billion -N470 billion (which
consists of $1.8 billion in additional facilities and $ 1.2 billion in restructuring of
existing local facility loan) from a consortium of local and international financial
institutions to upgrade its network, which include; Zenith Bank Plc N55 billion;
FCMB N15 billion; Guaranty Trust Bank Plc N40 billion; United Bank for
Africa, N25 billion and Fidelity Bank N26.2 billion. Others local financiers are
Access Bank Plc with N35 billion; Diamond Bank Plc N5 billion; Citibank N5
billion; Ecobank, N15 billion; First Bank of Nigeria Limited N40 billion, FSDH
N3billion; Keystone Bank N5 billion; Mainstreet Bank N5 billion, Rand
Merchant Bank N3 billion; Stanbic IBTC, N15 billion; Standard Chartered N7
billion; and Union Bank of Nigeria N20 billion, totalling N329.25 billion.
Hence, MTN will have to look outside Nigeria possibly South Africa for
borrowings for business expansion.
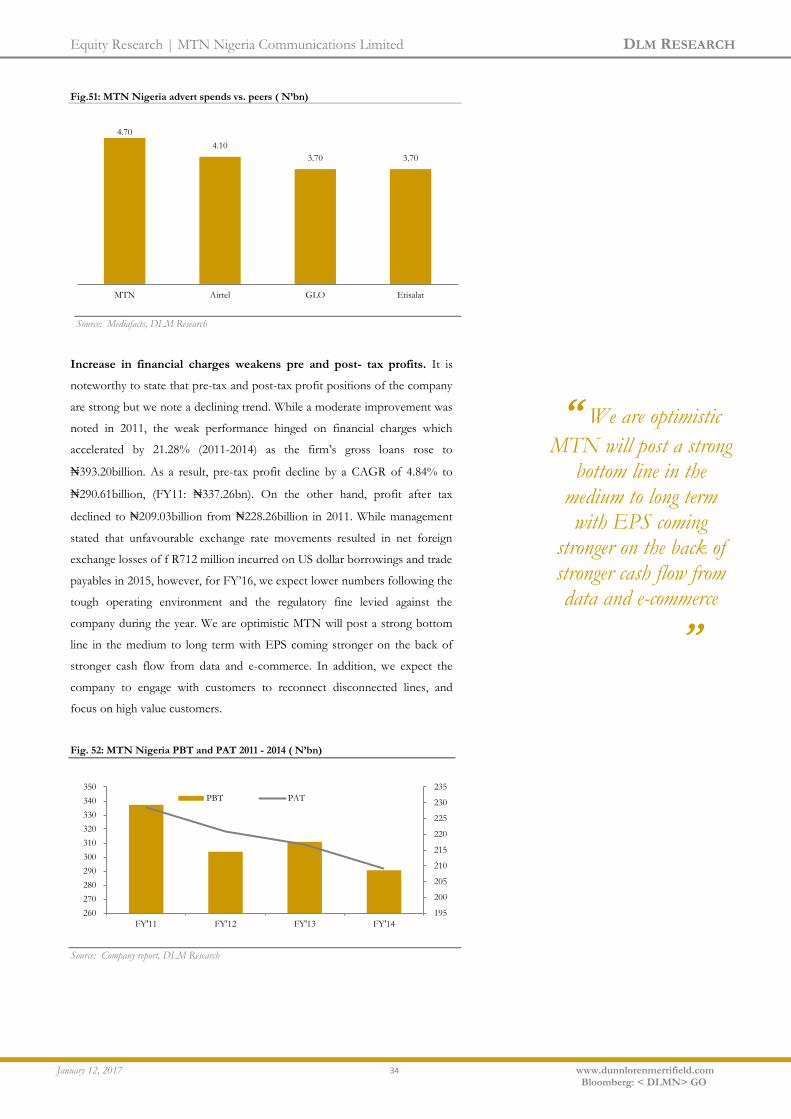
MTN is the biggest advertisement spender in the sector. Advertisement
is a major force to reckon with in the telecom industry. In the sector, a
successful marketing campaign can lead to increase sales, better name
recognition and a wider customer base. Hence, MTN Nigeria continuously
engage in aggressive marketing strategy ranging from traditional print media to
social network marketing, large scale TV and print advertising. In the past five
years, MTN has spent a substantial budget of its adspend on publicising its
products. For example, with the quest for a bigger share of the market and
outdo other competitors, MTN spent c.N4.7billion on advertising in 2015 and
was closely followed by Airtel which spent N4.10billion. Though, 2015 MTN’s
advert spends represents a decline when compared with the period 2011 when
advertising spend was N6.38billion. The company also frequently uses
celebrities who endorse the services as brand ambassadors.
“ The decision to raise
fund came after the company reported
H1’16 loss pressured by Nigeria operation
regulatory fine. The bond issuing is to enable the company raise fund
to offset the N330billion Nigerian fine, and address capex
needs ’’
Equity Research | MTN Nigeria Communications Limited DLM RESEARCH
January 12, 2017 34 www.dunnlorenmerrifield.com
Bloomberg: < DLMN> GO
Fig.51: MTN Nigeria advert spends vs. peers ( N’bn)
Source: Mediafacts, DLM Research
Increase in financial charges weakens pre and post- tax profits. It is
noteworthy to state that pre-tax and post-tax profit positions of the company
are strong but we note a declining trend. While a moderate improvement was
noted in 2011, the weak performance hinged on financial charges which
accelerated by 21.28% (2011-2014) as the firm’s gross loans rose to
₦393.20billion. As a result, pre-tax profit decline by a CAGR of 4.84% to
₦290.61billion, (FY11: ₦337.26bn). On the other hand, profit after tax
declined to ₦209.03billion from ₦228.26billion in 2011. While management
stated that unfavourable exchange rate movements resulted in net foreign
exchange losses of f R712 million incurred on US dollar borrowings and trade
payables in 2015, however, for FY’16, we expect lower numbers following the
tough operating environment and the regulatory fine levied against the
company during the year. We are optimistic MTN will post a strong bottom
line in the medium to long term with EPS coming stronger on the back of
stronger cash flow from data and e-commerce. In addition, we expect the
company to engage with customers to reconnect disconnected lines, and
focus on high value customers.
Fig. 52: MTN Nigeria PBT and PAT 2011 - 2014 ( N’bn)
Source: Company report, DLM Research
4.70
4.10
3.70 3.70
MTN Airtel GLO Etisalat
195
200
205
210
215
220
225
230
235
260
270
280
290
300
310
320
330
340
350
FY'11 FY'12 FY'13 FY'14
PBT PAT
“ We are optimistic
MTN will post a strong bottom line in the
medium to long term with EPS coming
stronger on the back of stronger cash flow from data and e-commerce
’’

Equity Research | MTN Nigeria Communications Limited DLM RESEARCH
January 12, 2017 35 www.dunnlorenmerrifield.com
Bloomberg: < DLMN> GO
Maintaining focus on profitable growth has led to strong profit
margins. The strong profit margins indicate how successful management has
been in generating income from operating the business. Over the last five
years, MTN Nigeria has consistently had operating margins that is above 40%
except for 2014 where it posted operating profit margin of 39.88%. In our
view, trends in operating margins for the most part are directly tied to
management decisions. This highlights the management’s ability to manage
expenses without hindering sales growth. The highest operating margin
(46.85%) was recorded in FY’11 on the back of growth in revenue and
managements’ focus on cost efficiency. In addition, profit after tax margin
remains fairly stable between 2011 –2012 but saw a notable decline in FY’11
and FY’14.
Fig.53: MTN Nigeria profitability margins 2011 - 2014 (%)
Source: Company report, DLM Research
The difference between EBIT and EBITDA margin is a reflection of the
capital intensive nature of the company. We note the huge difference
between EBIT margin and EBITDA margin is at an average of 17%. This is
expected from a capital intensive firm as they operate an Asset heavy model –
because of the heavy investments in property plant and equipment that leads to
high depreciation and amortization. The difference between EBIT margin and
EBITDA margin tells a whole lot about the amount of depreciation and
amortization in the Income Statement.
61.60% 58.06%
61.82%
58.12%
46.85%
42.17% 42.77% 39.88%
44.49%
40.31% 39.17%
35.23%
30.11% 29.33% 27.32%
25.34%
20.00%
25.00%
30.00%
35.00%
40.00%
45.00%
50.00%
55.00%
60.00%
65.00%
FY'11 FY'12 FY'13 FY'14
EBITDA margin EBIT margin PBT margin PAT margin
“ Over the last five
years, MTN Nigeria has consistently had
operating margins that is above 40% except for 2014 where it posted
operating profit of 39.88%.
’’

Equity Research | MTN Nigeria Communications Limited DLM RESEARCH
January 12, 2017 36 www.dunnlorenmerrifield.com
Bloomberg: < DLMN> GO
Fig.54: EBIT vs EBITDA margins ( %)
Source: Company annual report, DLM Research
Fig.55: EBIT vs EBITDA margins difference ( %)
Source: Company annual report, DLM Research
Healthy balance sheet position, despite increasing borrowings. A
review of the firm’s balance sheet showed that total assets rose by a CAGR of
5.09% to ₦964.38billion, (2011: ₦830.97bn). It is worthy to state that the
increase in assets was predominantly driven by investment in fixed asset
deployed to network sites. We see this increasing further in the medium to
long term as the company continue to explore investments opportunities in
Nigeria. The book value of fixed asset is N513.85bllion based on FY’14
results, which is 23.48% more than FY’14 debt level. Monetizing some of
MTN’s asset particularly fixed assets will help to unlock huge cash which can
be put forward to reduce the debt level. While the industry was widely
considered as an infrastructure business where owning asset is crucial for
services delivery; however, this is gradually changing as the operators in the
industry are realizing the important of asset optimization. This follows
MTN’s towers divestment in September 2014.
34.00%
39.00%
44.00%
49.00%
54.00%
59.00%
64.00%
FY'11 FY'12 FY'13 FY'14
EBITDA margin EBIT margin
14.00%
15.00%
16.00%
17.00%
18.00%
19.00%
20.00%
FY'11 FY'12 FY'13 FY'14
“ Monetizing some of
MTN’s asset particularly fixed assets will help to unlock huge cash which can be put forward to reduce the debt level
’’
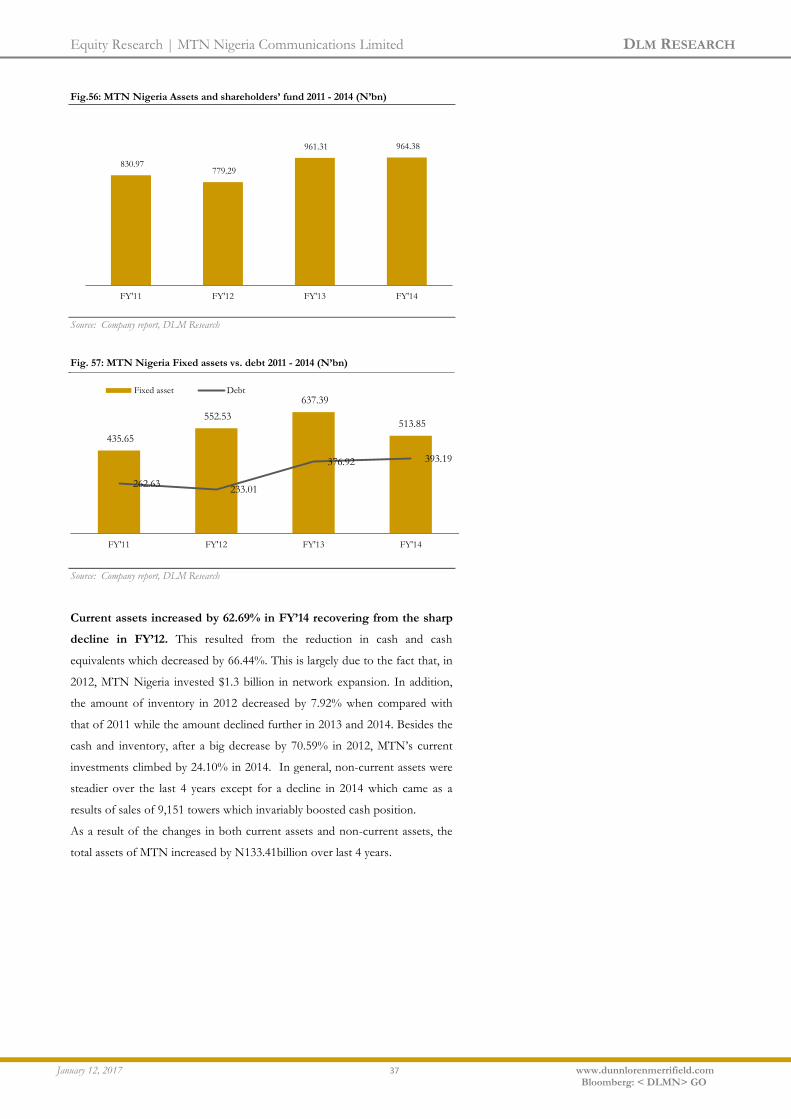
Equity Research | MTN Nigeria Communications Limited DLM RESEARCH
January 12, 2017 37 www.dunnlorenmerrifield.com
Bloomberg: < DLMN> GO
Fig.56: MTN Nigeria Assets and shareholders’ fund 2011 - 2014 (N’bn)
Source: Company report, DLM Research
Fig. 57: MTN Nigeria Fixed assets vs. debt 2011 - 2014 (N’bn)
Source: Company report, DLM Research
Current assets increased by 62.69% in FY’14 recovering from the sharp
decline in FY’12. This resulted from the reduction in cash and cash
equivalents which decreased by 66.44%. This is largely due to the fact that, in
2012, MTN Nigeria invested $1.3 billion in network expansion. In addition,
the amount of inventory in 2012 decreased by 7.92% when compared with
that of 2011 while the amount declined further in 2013 and 2014. Besides the
cash and inventory, after a big decrease by 70.59% in 2012, MTN’s current
investments climbed by 24.10% in 2014. In general, non-current assets were
steadier over the last 4 years except for a decline in 2014 which came as a
results of sales of 9,151 towers which invariably boosted cash position.
As a result of the changes in both current assets and non-current assets, the
total assets of MTN increased by N133.41billion over last 4 years.
830.97 779.29
961.31 964.38
FY'11 FY'12 FY'13 FY'14
435.65
552.53
637.39
513.85
262.63 233.01
376.92 393.19
FY'11 FY'12 FY'13 FY'14
Fixed asset Debt

Equity Research | MTN Nigeria Communications Limited DLM RESEARCH
January 12, 2017 38 www.dunnlorenmerrifield.com
Bloomberg: < DLMN> GO
Fig.58: Current vs Non-current assets 2011 - 2014 (N’bn)
Source: Company report, DLM Research
Total Liabilities increased in line with assets. The current liabilities of
MTN Nigeria dropped by 20.07% in 2013 compared to 2012 level, and
declined by 0.81% in the past four years. This trend reflected a recovery of
company’s bad financial condition in last four years. The drops in current
liabilities resulted largely from reduction on current borrowings and other
current assets. In contrast, the non-current liabilities decreased by 12.02% and
6.84% in 212 and 2014, yet it increased by 15.66% between 2011 and 2014,
reaching N438.24 billion in 2014. The overall increase is in accordance with
the growth in non-current interest-bearing loans –as non-current borrowing
over weighted the decrease of current borrowings. Hence, the financial
liabilities increased significantly the total liability, thus influenced company’s
financial position. In general, total liability increased by N146.26 billion
because of the influence of non-current liability. The total liabilities were
highest in 2014 following the 4.33% growth in noncurrent liabilities.
Fig.59: Current vs Non-current liabilities 2011 - 2014 (N’bn)
Source: Company report, DLM Research
496.5
621.69
714.38
562.64
334.47
157.59
246.93
401.74
FY'11 FY'12 FY'13 FY'14
Current assets Non current assets
362.83 361.57
289
354.08
283.23 249.18
470.42 438.24
FY'11 FY'12 FY'13 FY'14
Current Liabilities Non current liabilities
“ The drops in current
liabilities resulted largely from reduction on current
borrowings and other current assets
’’

Equity Research | MTN Nigeria Communications Limited DLM RESEARCH
January 12, 2017 39 www.dunnlorenmerrifield.com
Bloomberg: < DLMN> GO
After years of strong growth, shareholders’ fund figures have been
lower than expected particularly given the current level of gross debt.
The obvious truth is that MTN have used spare capital to fund expansion. In
generally, the total equity of MTN Nigeria decreased almost each year except
for 2013 where it recorded a growth of 19.18%, but on average, MTN
Nigeria’s shareholder’s fund decreased by 1.28% between 2011-2014 as the
company has negative net cash balance (retained earnings in 2012 and 2014).
The growth in 2013 resulted from increase in retained earnings attributable to
ordinary shareholders and minority interest. To connect with the movement
in income statement, improvement in net profit directly explained the positive
fluctuation in retained earnings. The retained earnings determined the trend
of total equity.
Fig.60: Shareholders equity 2011 - 2014 (N’bn)
Source: Company report, DLM Research
Investment in infrastructure to enhance the quality and capacity of the
company’s network. MTN is clearly investing a huge amount into future
growth, and we think the payoff will be massive going forward. However,
given the industry headwinds, it is uncertain whether the company will
continue to spend a lot on acquisitions and other activities with its free cash
flow. The company stated that its investment profile in Nigeria has risen by
~23% to $16 billion, representing almost half of the total assets in the
nation’s telecoms industry, which currently stands over c.$35 billion. Between
2001 and 2010, MTNN invested N887.577 billion in fixed assets. Theses
investment in infrastructure has enabled the company to build the largest
network facility in Nigeria. For FY’15, capex declined by 40.4% to R4.99
billion, impacted by the tower transaction as well as increased use of build-to-
suit towers with the rollout of capex below budget. More so, in 2015, MTNN
renewed its operating spectrum in the 900MHz and 1,800MHz frequency
bands. It also paid N18.96billion for the 2.6 GHz to boost its mobile
broadband and LTE 4G services in Nigeria.
184.92
168.54
201.9
172.06
FY'11 FY'12 FY'13 FY'14
“ To connect with the
movement in income statement, improvement in
net profit directly explained the positive fluctuation in retained
earnings
’’
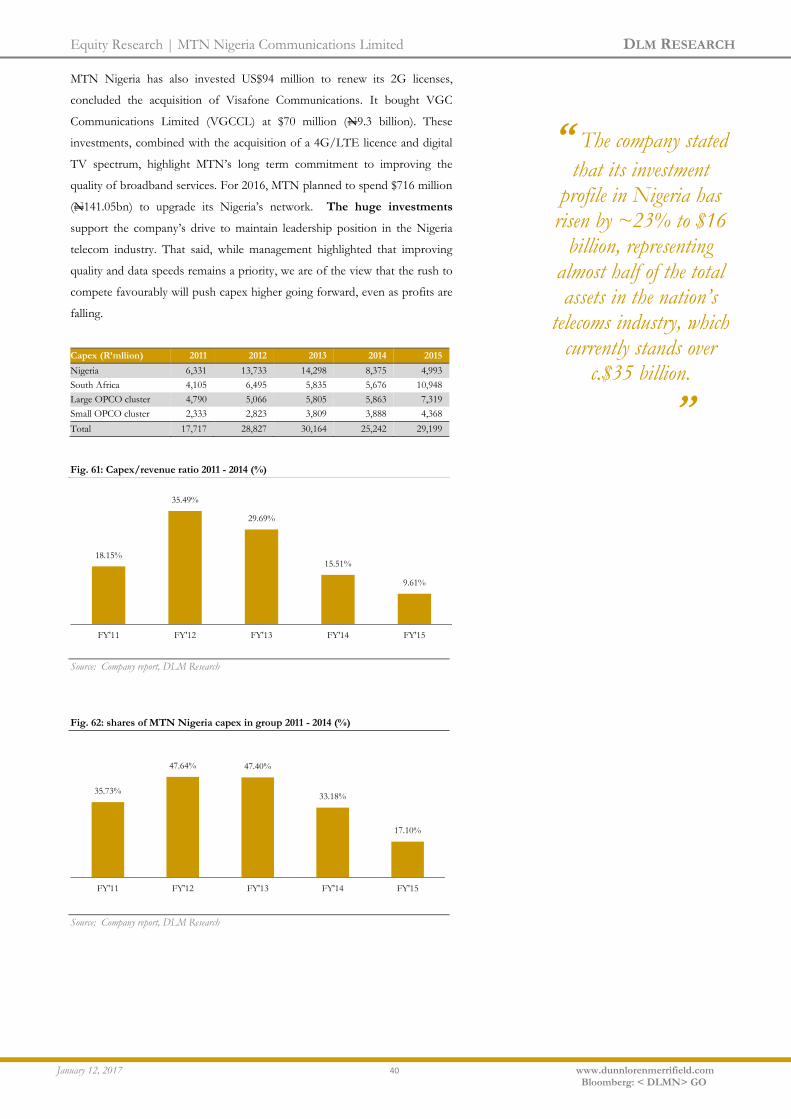
Equity Research | MTN Nigeria Communications Limited DLM RESEARCH
January 12, 2017 40 www.dunnlorenmerrifield.com
Bloomberg: < DLMN> GO
MTN Nigeria has also invested US$94 million to renew its 2G licenses,
concluded the acquisition of Visafone Communications. It bought VGC
Communications Limited (VGCCL) at $70 million (N9.3 billion). These
investments, combined with the acquisition of a 4G/LTE licence and digital
TV spectrum, highlight MTN’s long term commitment to improving the
quality of broadband services. For 2016, MTN planned to spend $716 million
(N141.05bn) to upgrade its Nigeria’s network. The huge investments
support the company’s drive to maintain leadership position in the Nigeria
telecom industry. That said, while management highlighted that improving
quality and data speeds remains a priority, we are of the view that the rush to
compete favourably will push capex higher going forward, even as profits are
falling.
Capex (R’mllion) 2011 2012 2013 2014 2015
Nigeria 6,331 13,733 14,298 8,375 4,993
South Africa 4,105 6,495 5,835 5,676 10,948
Large OPCO cluster 4,790 5,066 5,805 5,863 7,319
Small OPCO cluster 2,333 2,823 3,809 3,888 4,368
Total 17,717 28,827 30,164 25,242 29,199
Fig. 61: Capex/revenue ratio 2011 - 2014 (%)
Source: Company report, DLM Research
Fig. 62: shares of MTN Nigeria capex in group 2011 - 2014 (%)
Source: Company report, DLM Research
18.15%
35.49%
29.69%
15.51%
9.61%
FY'11 FY'12 FY'13 FY'14 FY'15
35.73%
47.64% 47.40%
33.18%
17.10%
FY'11 FY'12 FY'13 FY'14 FY'15
“ The company stated
that its investment profile in Nigeria has
risen by ~23% to $16 billion, representing
almost half of the total assets in the nation’s
telecoms industry, which currently stands over
c.$35 billion.
’’

Equity Research | MTN Nigeria Communications Limited DLM RESEARCH
January 12, 2017 41 www.dunnlorenmerrifield.com
Bloomberg: < DLMN> GO
In our view, the company’s rising debt-equity ratio is also a key
concern. The growing financial leveraging is largely on account of the high
costs of infrastructure. Since telecommunication is a capital intensive sector,
the need for financing is bound to rise, given the massive outlay required to
acquire network infrastructure. In FY11, the company’s total debt stood at
N262.63billion but rose to ₦393.19billion in 2014 – comprising short and
long term unsecured borrowings with the carrying amount (28.28%)
denominated in US dollar and (71.72%) denominated in naira. While the
foreign loan portfolio is LIBOR linked variable interest plus some margins,
this exposes the company to interest and exchange rate risks. With debt
already at N393.19 billion, further borrowing could take the company’s debts
above N500billion and total liabilities to more than N1trillion, which will be
more than the book value of asset, therefore putting the company’s future
cash flow and profitability under pressure and possibly impairing its ability to
compete effectively in Nigeria. For FY’16, we are of the view that MTN
Nigeria’s debt profile will accelerate further after the acquisition of Visafone,
though, there was no information on the cost and financing of the deal.
Fig. 63: Borrowings 2011 - 2014 (N’bn)
Source: Company report, DLM Research
Debt-to-assets ratio grew from 31.60% in 2011 to 40.77% in 2014. The four
year trend line is less encouraging but MTNN appears to be only moderately
leveraged. (The company had a larger debt-to-asset ratio in 2014, with an average
ratio of 35.37%. This means that for every N1 of assets there is N0.40 of debt,
which is not excessive by any means and, highlights that MTNN can increase its
financial gearing by a considerable amount before the balance sheet takes on too
much debt. This also means the company is making acquisitions and increasing
debt in an attempt to improve returns to shareholders.
262.63 233.01
376.92 393.19
FY'11 FY'12 FY'13 FY'14
Debt Summary (N’m) 2011 2012 2013 2014
Senior debt – – – –
Subordinated debt 262,626.3 233,010.8 376,924.0 393,192.0
Total debt 262,626.3 233,010.8 376,924.0 393,192.0
Cash 106,540.5 35,755.8 144,872.0 207,687.0
Net debt 156,086 197,255 232,052 185,505
“ In FY11, the
company’s total debt stood at
N262.63billion but
rose to ₦393.19billion in 2014 – comprising short and long term
unsecured borrowings with the carrying
amount (28.28%) denominated in US
dollar and (71.72%) denominated in naira.
’’
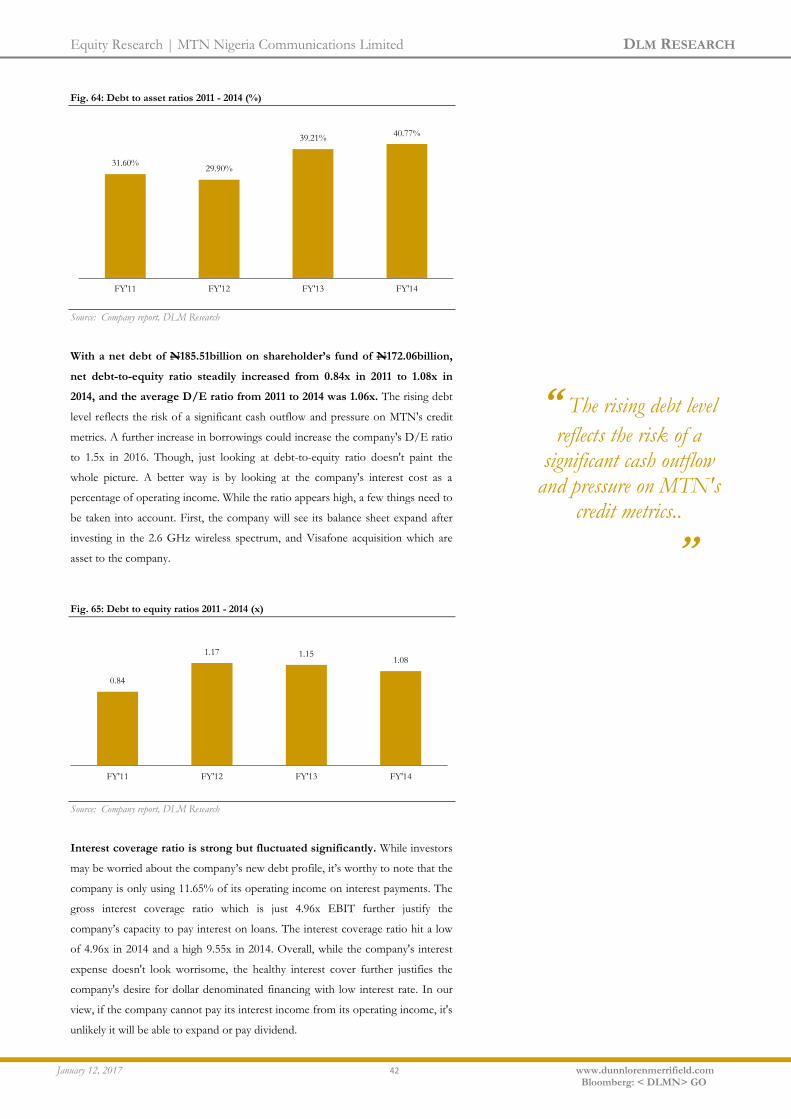
Equity Research | MTN Nigeria Communications Limited DLM RESEARCH
January 12, 2017 42 www.dunnlorenmerrifield.com
Bloomberg: < DLMN> GO
Fig. 64: Debt to asset ratios 2011 - 2014 (%)
Source: Company report, DLM Research
With a net debt of N185.51billion on shareholder’s fund of N172.06billion,
net debt-to-equity ratio steadily increased from 0.84x in 2011 to 1.08x in
2014, and the average D/E ratio from 2011 to 2014 was 1.06x. The rising debt
level reflects the risk of a significant cash outflow and pressure on MTN's credit
metrics. A further increase in borrowings could increase the company's D/E ratio
to 1.5x in 2016. Though, just looking at debt-to-equity ratio doesn't paint the
whole picture. A better way is by looking at the company's interest cost as a
percentage of operating income. While the ratio appears high, a few things need to
be taken into account. First, the company will see its balance sheet expand after
investing in the 2.6 GHz wireless spectrum, and Visafone acquisition which are
asset to the company.
Fig. 65: Debt to equity ratios 2011 - 2014 (x)
Source: Company report, DLM Research
Interest coverage ratio is strong but fluctuated significantly. While investors
may be worried about the company’s new debt profile, it’s worthy to note that the
company is only using 11.65% of its operating income on interest payments. The
gross interest coverage ratio which is just 4.96x EBIT further justify the
company’s capacity to pay interest on loans. The interest coverage ratio hit a low
of 4.96x in 2014 and a high 9.55x in 2014. Overall, while the company's interest
expense doesn't look worrisome, the healthy interest cover further justifies the
company's desire for dollar denominated financing with low interest rate. In our
view, if the company cannot pay its interest income from its operating income, it's
unlikely it will be able to expand or pay dividend.
31.60% 29.90%
39.21% 40.77%
FY'11 FY'12 FY'13 FY'14
0.84
1.17 1.15 1.08
FY'11 FY'12 FY'13 FY'14
“ The rising debt level
reflects the risk of a significant cash outflow
and pressure on MTN's credit metrics..
’’

Equity Research | MTN Nigeria Communications Limited DLM RESEARCH
January 12, 2017 43 www.dunnlorenmerrifield.com
Bloomberg: < DLMN> GO
Fig. 66: Interest coverage ratios 2011 - 2014 (x)
Source: Company report, DLM Research
Interest expense FY'11 FY'12 FY'13 FY'14
Senior interest expense
– – –
Subordinated interest expense 32,001.60 46,480.4 42,234.6 47,860.4
Others 2,150.60 2,496.4 2,995.6 2,649.5
Total charges 34,152.2 48,977 45,230 50,510
Net Cash interest expense 17,841 14,033 28,608 38,324
Coverage FY'11 FY'12 FY'13 FY'14
EBITDA / cash interest expense 26.2x 31.2x 17.2x 12.5x
EBITDA / total interest expense 12.6x 8.8x 10.7x 7.2x
(EBITDA – capex) / cash interest expense 19.1x 14.9x 9.1x 8.9x
(EBITDA – capex) / total interest expense 9.2x 4.2x 5.7x 5.1x
DSCR 10.4x 6.5x 7.5x 6.5x
The low debt-to- EBITDA level suggests MTN Nigeria has a higher
repayment debt capacity. A key metric to gauge companies’ repaying capacity is
net debt-to-EBITDA. The main target of this ratio is to examine the cash
available with the company to pay back its debts, and not how much income that
is being earned. The metric tells us how many years it will take the company to
repay the debt if using the cash it generates from its core operations. The
company’s debt repayment capacity is under 1x the EBITDA. The debt-to-
EBITDA ratio hit a low of 0.53x in 2012 and a high 0.82x in 2014, with average
ratio of 0.67x for the four years period. The lower ratios indicate the company
have a low amount of financial debt relative to EBITDA.
Fig.67: Debt to EBIT and EBITDA ratios 2011 - 2014 (x)
Source: Company report, DLM Research
9.55
6.38
7.39
4.96
FY'11 FY'12 FY'13 FY'14
0.52 0.53
0.59
0.52
0.40 0.39 0.41
0.36
FY'11 FY'12 FY'13 FY'14
Net debt/EBIT Net debt/EBITDA
“ The debt-to-
EBITDA ratio hit a low of 0.53x in 2012 and a high 0.82x in
2014, with average ratio of 0.67x for the four
years period.
’’

Equity Research | MTN Nigeria Communications Limited DLM RESEARCH
January 12, 2017 44 www.dunnlorenmerrifield.com
Bloomberg: < DLMN> GO
Debt to cash flow from operating activity is strong. This implies that the
company has greater financial flexibility to invest in future growth
opportunities. Cash flow-to-debt ratio rose from 2.72x in 2011 to 3.005x in
2014. This figure is likely to see a decrease in 2016 following the anticipated
growth in the company’s debt. While this seems like a negative development, it is
worth noting that the company took some debt in 2015 to finance investment in
its networks, which should increase the quality of services. Most of these debts
will not come due until 2019 and beyond, which provides room for the company
to accumulate enough cash to pay off its debt.
Fig. 68: Cash flow from operation 2011 - 2014 (N’bn)
Source: Company report, DLM Research
Fig. 69: Cash flow to debt ratios 2011 - 2014 (x)
Source: Company report, DLM Research
503.79
456.10
492.61
525.23
FY'11 FY'12 FY'13 FY'14
2.72 2.71 2.44
3.05
FY'11 FY'12 FY'13 FY'14
Leverage statistics FY'11 FY'12 FY'13 FY'14
Net debt / total capitalization 31.09% 41.75% 37.65% 29.32%
Total debt / EBITDA 0.56x 0.53x 0.77x 0.82x
Net debt / EBITDA 0.33x 0.45x 0.47x 0.39x
Net debt + preferred / EBITDA 0.85x 1.00x 0.96x 0.89x
Capitalization FY'11 FY'12 FY'13 FY'14
Total debt 262,626 233,011 376,924 393,192
Net debt 156,086 197,255 232,052 185,505
Preferred stock 239,420 239,420 239,420 239,420
Total capitalization 502,046 472,431 616,344 632,612
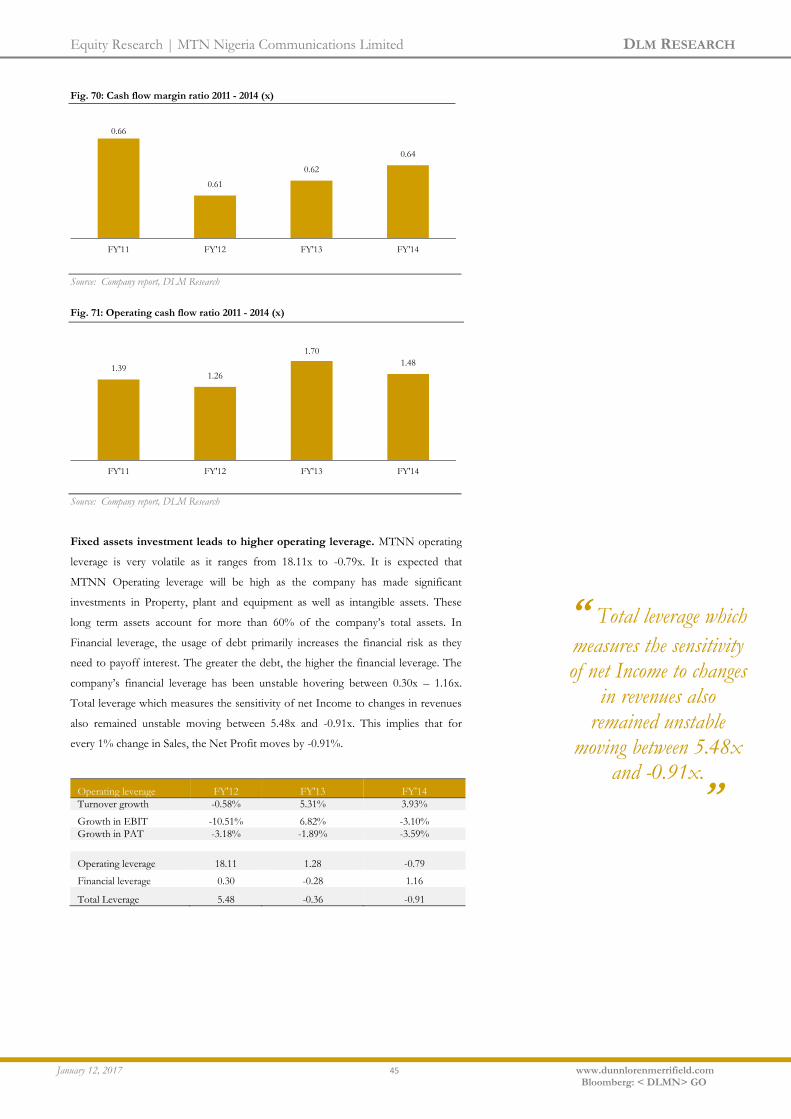
Equity Research | MTN Nigeria Communications Limited DLM RESEARCH
January 12, 2017 45 www.dunnlorenmerrifield.com
Bloomberg: < DLMN> GO
Fig. 70: Cash flow margin ratio 2011 - 2014 (x)
Source: Company report, DLM Research
Fig. 71: Operating cash flow ratio 2011 - 2014 (x)
Source: Company report, DLM Research
Fixed assets investment leads to higher operating leverage. MTNN operating
leverage is very volatile as it ranges from 18.11x to -0.79x. It is expected that
MTNN Operating leverage will be high as the company has made significant
investments in Property, plant and equipment as well as intangible assets. These
long term assets account for more than 60% of the company’s total assets. In
Financial leverage, the usage of debt primarily increases the financial risk as they
need to payoff interest. The greater the debt, the higher the financial leverage. The
company’s financial leverage has been unstable hovering between 0.30x – 1.16x.
Total leverage which measures the sensitivity of net Income to changes in revenues
also remained unstable moving between 5.48x and -0.91x. This implies that for
every 1% change in Sales, the Net Profit moves by -0.91%.
Operating leverage FY'12 FY'13 FY'14
Turnover growth -0.58% 5.31% 3.93%
Growth in EBIT -10.51% 6.82% -3.10%
Growth in PAT -3.18% -1.89% -3.59%
Operating leverage 18.11 1.28 -0.79
Financial leverage 0.30 -0.28 1.16
Total Leverage 5.48 -0.36 -0.91
0.66
0.61
0.62
0.64
FY'11 FY'12 FY'13 FY'14
1.39 1.26
1.70
1.48
FY'11 FY'12 FY'13 FY'14
“ Total leverage which
measures the sensitivity of net Income to changes
in revenues also remained unstable
moving between 5.48x and -0.91x.
’’

Equity Research | MTN Nigeria Communications Limited DLM RESEARCH
January 12, 2017 46 www.dunnlorenmerrifield.com
Bloomberg: < DLMN> GO
Fig. 72: Operating, financial and total leverage 2011 - 2014 (x)
Source: Company report, DLM Research
MTN’s track record of paying dividends will be of immense benefit to
prospective investors with preference for dividend paying companies.
MTN has paid dividends every year since 2004. The consistent dividend
payments indicate that the company is profit-making. Long term investors
prefer dividend paying companies because it is a measure of how they are
making profits while growing the business. In 2014, MTN paid a total dividend
of N238.86billion representing 45.48% and 72.62% of cash flow from
operations and operating profit respectively. Though, there are rooms for
growth, but for FY’16, the ability to maintain the dividend payout trend is slim
as a result of capex programme and regulatory fine of N330billion unless
management are able to cut some costs or capex which is unlikely in our view.
The main determinant of dividend growth in future will be earnings / free cash
flow growth which we think will be low given the impact of regulatory fine,
reduction in airtime & subscription revenue and price war in Nigeria.
Fig. 73: Dividend2011 - 2014 (N’bn)
Source: Company report, DLM Research
-5.00
0.00
5.00
10.00
15.00
20.00
FY'12 FY'13 FY'14
Operating leverage Financial leverage
Total Leverage
220,789 239,480
184,863
238,861
FY'11 FY'12 FY'13 FY'14
“ In 2014, MTN
paid a total dividend of N238.86billion
representing 45.48% and 72.62% of cash
flow from operations and operating profit
respectively.
’’
Equity Research | MTN Nigeria Communications Limited DLM RESEARCH
January 12, 2017 47 www.dunnlorenmerrifield.com
Bloomberg: < DLMN> GO
Fig. 74: Cash dividend/cash flow from operation and operating profit 2011 - 2014 (%)
Source: Company report, DLM Research
Free cash flows to equity to grow 0.17%. Revenue is clearly contributing to
FCFE despite sporadic growth but MTN is clearly also investing a huge amount
into future growth, and we think the payoff of will be massive going forward.
CapEx seems to be all over the place right now, which in our view will bode
well for the company in the medium to long term. Though, it uncertain whether
the company will continue to spend a lot on acquisitions and other activities
with its free cash flow.
Fig. 75:Capex/revenues 2011 - 2014 (%)
Source: Company report, DLM Research
Fig. 76: Capex/revenues projection 2015 - 2019 (%)
Source: Company report, DLM Research
43.83%
52.51%
37.53% 45.48%
62.18%
75.36%
54.46%
72.62%
FY'11 FY'12 FY'13 FY'14
Div/Cash from operation Div/Operating profit
15.43%
28.75% 27.18%
15.44%
FY'11 FY'12 FY'13 FY'14
26.72%
20.54% 21.99%
18.91%
16.19%
FY'15E FY'16F FY'17F FY'18F FY'19F

Equity Research | MTN Nigeria Communications Limited DLM RESEARCH
January 12, 2017 48 www.dunnlorenmerrifield.com
Bloomberg: < DLMN> GO
Financial Projections

Equity Research | MTN Nigeria Communications Limited DLM RESEARCH
January 12, 2017 49 www.dunnlorenmerrifield.com
Bloomberg: < DLMN> GO
Financial projections. The current pricing pressure in Nigeria implies
that MTN Nigeria is exhausting its capacity to grow earning but
focusing on other growth areas. Going forward, we expect the company to
try to turn around the negative trend in subscribers’ numbers. Nevertheless,
there are significant upside potential in broadband, e-ecommerce and other
growth areas which the company is looking to explore. Hence, we expect
revenue to grow at a CAGR of 1.78% to N900.96billion by FY19. The H1’16
results showed that ARPU is increasing. This shows that the company has
successfully focused on deriving higher revenue from other business unit
particularly e-commerce and broadband which continue show prospect for
growth. Going forward we expect that customer acquisitions will continue, but
the company possesses a significant opportunity to maximise ARPUs by
offering promotional deals in growth areas. Airtime and subscription continues
to decline in both revenue and active users and it is clear that this trend will
continue in the near term particularly in maturing markets as competition
intensified and we believe that the company will try to differentiate itself by
launching new services and increasing marketing expenditure if necessary.
Hence, sequel to securing a digital broadcast licence for N34billionn in 2015,
the company has commenced the pilot of its digital television broadcasting
service in Jos, Plateau State. Plans to accelerate EBITDA have gained
momentum, as it uses discounted tariffs and promo to grow market share.
Hence, we project EBITDA growth of 1.98% CAGR to N515.35 billion.
Fig. 77: Revenue projection 2015 - 2019 (N’bn)
Source: Company report, DLM Research
Fig. 78: EBITDA and margin projection 2015 - 2019 (N’bn, %)
Source: Company report, DLM Research
807.49 801.03
825.06
858.06
900.96
FY'15E FY'16E FY'17F FY'18F FY'19F
58.40%
58.60%
58.80%
59.00%
59.20%
59.40%
59.60%
59.80%
60.00%
60.20%
450
460
470
480
490
500
510
520
FY'15E FY'16E FY'17F FY'18F FY'19F
EBITDA EBITDA Margin
“ Going forward we
expect that customer acquisitions will continue, but the
company possesses a significant opportunity to maximise ARPUs by offering promotional deals in growth areas
’’

Equity Research | MTN Nigeria Communications Limited DLM RESEARCH
January 12, 2017 50 www.dunnlorenmerrifield.com
Bloomberg: < DLMN> GO
MTN’s Valuation Range

Equity Research | MTN Nigeria Communications Limited DLM RESEARCH
January 12, 2017 51 www.dunnlorenmerrifield.com
Bloomberg: < DLMN> GO
MTN’s Valuation Range. MTN Group is valued at c.$15billion, but with
MTN Nigeria contributing ~35.32% of the group’s revenue, one would expect
the company’s worth to be 40% of the group – but this is necessarily not the
case given the impact of annual capex. The annual capital expenditures tell a lot
about the operating and growth philosophy of the company. Given its
expansion drive, we expect MTN to have capital expenditures that is greater
than the average depreciation expense. While the current investment shows
that the company is building capacity and although capital expenditures would
be considered in forecasting future cash flows, as the cash flows will reflect a
growth profile. Being the first major mobile telecom that will be listing on the
domestic bourse, there are chances the stock will attract some premium for a
number of reasons among which are strong demand and limited float.
Valuation. Whilst we considered the main valuation criteria used in the
telecommunications industry, we employed DCF as our principal method in
assessing the value of MTNN. In our view, the DCF model is the most
appropriate model to value companies in the telecom sector. The two key
factors which we considered will affect valuation are revenue growth and cash
flow. We used a WACC of 16.97% and cost of equity of 18.96%–and think a
dividend yield above 10% would be appropriate to provide an adequate return
to investors. Our valuation model suggests that N800 - N1,600/share looks a
likely listing range for MTNN Nigeria, suggesting a dividend yield above 30%.
This would make dividend yield base investment on the stock attractive. The
dividend model assumes average dividend pay-out of 56% of operating profit.
For EV/EBITDA model, past performance of EBITDA is positive but
volatile, and we do not expect it to grow significantly in the near term. Hence,
we forecast a maintainable normalized EBITDA of N471.40billion with
EV/EBITDA multiple of 1.93x. Our adopted EV/EBITDA multiple is lower
than those of our selected African markets peers, as we applied a discount to
reflect market risks. The EV/EBITDA method suggests the shares could trade
at N1,272/share. The DCF valuation model and sensitivity analysis suggests a
price range of N804 – N1,653/share. With N422.70 BVPS and N513.51 EPS,
valuations seem viable.
Fig.96: Valuation metrics
Capital structure (Equity) 30.44%
Capital structure (Debt) 69.56%
Forecast period 5year
Beta 0.84
Long term growth rate 3.00%
Risk free rate 13.50%
Risk premium 6.50%
Tax rate 30%
Cost of equity 18.96%
WACC 16.97%
Outstanding shares (Million) 407.06
“ MTN Group is
valued at c.$15billion, but with MTN Nigeria contributing ~35.32% of the group’s revenue, one would expect the
company’s worth to be 40% of the group, but
this is necessarily not the case given the impact of
annual capex
’’

Equity Research | MTN Nigeria Communications Limited DLM RESEARCH
January 12, 2017 52 www.dunnlorenmerrifield.com
Bloomberg: < DLMN> GO
Fig.80: Betas and Leverage
Unlevered beta
Adopted beta 0.84
Tax rate 30%
Debt/equity ratio 1.08x
Unlevered Beta 0.48
Levered beta
Unlevered beta 0.48
Tax rate 30%
Debt/equity ratio 1.08x
Levered Beta 0.84
Fig.81: DCF Valuation
FY’15E FY’16F FY’17F FY’18F FY’19F
EBIT(₦’mn) 331,150 328,421 338,356 339,019 347,771
Operating FCF (₦’mn) 75,758 97,631 171,199 105,521 124,435
Present Value of Op FCF 64,767 71,356 106,972 60,964 61,461
EV(₦’mn) 917,413
Equity Value (₦’mn) 600,321
Price/Share ₦1,474.80
Fig.82: Sensitivity analysis of enterprise value to changes in EV/EBITDA multiple and
WACC (₦’billion)
Fig.83: Sensitivity analysis of enterprise value to changes in growth rate and WACC
(₦’billion)
Terminal perpetual growth rates
3.0% 3.5% 4.0% 4.50% 5.0%
Discount 15.00% 905,482 931,259 959,380 990,179 1,024,058
Discount 15.50% 868,558 891,865 917,199 944,837 975,106
Discount 16.00% 834,471 855,617 878,525 903,425 930,589
Discount 18.00% 720,823 735,578 751,386 768,366 786,651
WACC 16.97% 775,260 792,921 811,943 832,490 854,754
Fig.84: Sensitivity analysis of equity value to changes in EV/EBITDA multiple and WACC
(₦’billion)
EV/EBITDA multiples
3x 4x 5x 6x 7x
Discount 15% 499,984 672,887 845,791 1,018,695 1,191,599
Discount 15.50% 484,109 653,302 822,496 991,690 1,160,883
Discount 16.00% 468,611 634,190 799,768 965,347 1,130,925
Discount 18.00% 410,184 562,199 714,213 866,227 1,018,241
WACC 16.97% 439,565 598,387 757,209 916,031 1,074,853
Fig.85: Sensitivity analysis of equity value to changes in growth rate and WACC (₦’billion)
EV/EBITDA multiples
3x 4x 5x 6x 7x
Discount 15.00% 893,176 1,066,079 1,238,983 1,411,887 1,584,791
Discount 15.50% 877,301 1,046,494 1,215,688 1,384,882 1,554,075
Discount 16.00% 861,803 1,027,382 1,192,960 1,358,539 1,524,117
Discount 18.00% 803,376 955,391 1,107,405 1,259,419 1,411,433
WACC 16.97% 832,757 991,579 1,150,401 1,309,223 1,468,045
Terminal perpetual growth rates
3.0% 3.5% 4.0% 4.50% 5.0%
Discount 15% 512,290 538,067 566,188 596,987 630,866
Discount 15.50% 475,366 498,673 524,007 551,645 581,914
Discount 16.00% 441,279 462,425 485,333 510,233 537,397
Discount 18.00% 327,631 342,386 358,194 375,174 393,459
WACC 16.97% 382,068 399,729 418,751 439,298 461,562
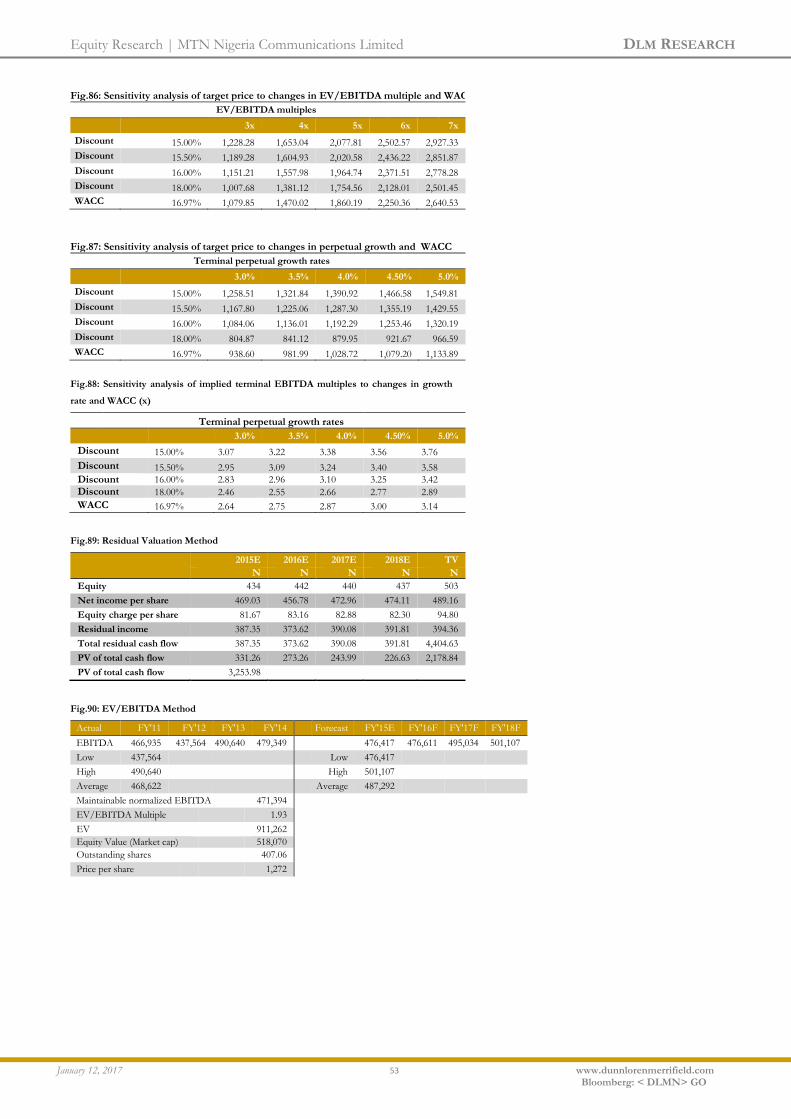
Equity Research | MTN Nigeria Communications Limited DLM RESEARCH
January 12, 2017 53 www.dunnlorenmerrifield.com
Bloomberg: < DLMN> GO
Fig.86: Sensitivity analysis of target price to changes in EV/EBITDA multiple and WACC
EV/EBITDA multiples
3x 4x 5x 6x 7x
Discount 15.00% 1,228.28 1,653.04 2,077.81 2,502.57 2,927.33
Discount 15.50% 1,189.28 1,604.93 2,020.58 2,436.22 2,851.87
Discount 16.00% 1,151.21 1,557.98 1,964.74 2,371.51 2,778.28
Discount 18.00% 1,007.68 1,381.12 1,754.56 2,128.01 2,501.45
WACC 16.97% 1,079.85 1,470.02 1,860.19 2,250.36 2,640.53
Fig.87: Sensitivity analysis of target price to changes in perpetual growth and WACC
Terminal perpetual growth rates
3.0% 3.5% 4.0% 4.50% 5.0%
Discount 15.00% 1,258.51 1,321.84 1,390.92 1,466.58 1,549.81
Discount 15.50% 1,167.80 1,225.06 1,287.30 1,355.19 1,429.55
Discount 16.00% 1,084.06 1,136.01 1,192.29 1,253.46 1,320.19
Discount 18.00% 804.87 841.12 879.95 921.67 966.59
WACC 16.97% 938.60 981.99 1,028.72 1,079.20 1,133.89
Fig.88: Sensitivity analysis of implied terminal EBITDA multiples to changes in growth
rate and WACC (x)
Terminal perpetual growth rates
3.0% 3.5% 4.0% 4.50% 5.0%
Discount 15.00% 3.07 3.22 3.38 3.56 3.76
Discount 15.50% 2.95 3.09 3.24 3.40 3.58
Discount 16.00% 2.83 2.96 3.10 3.25 3.42
Discount 18.00% 2.46 2.55 2.66 2.77 2.89
WACC 16.97% 2.64 2.75 2.87 3.00 3.14
Fig.89: Residual Valuation Method
2015E 2016E 2017E 2018E TV
N N N N N
Equity 434 442 440 437 503
Net income per share 469.03 456.78 472.96 474.11 489.16
Equity charge per share 81.67 83.16 82.88 82.30 94.80
Residual income 387.35 373.62 390.08 391.81 394.36
Total residual cash flow 387.35 373.62 390.08 391.81 4,404.63
PV of total cash flow 331.26 273.26 243.99 226.63 2,178.84
PV of total cash flow 3,253.98
Fig.90: EV/EBITDA Method
Actual FY'11 FY'12 FY'13 FY'14
Forecast FY'15E FY'16F FY'17F FY'18F
EBITDA 466,935 437,564 490,640 479,349
476,417 476,611 495,034 501,107
Low 437,564
Low 476,417
High 490,640
High 501,107
Average 468,622
Average 487,292
Maintainable normalized EBITDA 471,394
EV/EBITDA Multiple
1.93
EV
911,262
Equity Value (Market cap)
518,070
Outstanding shares
407.06
Price per share 1,272

Equity Research | MTN Nigeria Communications Limited DLM RESEARCH
January 12, 2017 54 www.dunnlorenmerrifield.com
Bloomberg: < DLMN> GO
Overview: Of the Nigerian Telecommunication Industry

Equity Research | MTN Nigeria Communications Limited DLM RESEARCH
January 12, 2017 55 www.dunnlorenmerrifield.com
Bloomberg: < DLMN> GO
Overview of the Nigerian telecommunication industry. The Nigerian
telecom industry has seen a remarkable growth story and has significantly
contributed to the growth of the domestic economy in the past 10 years.
With customers demand growing year in and year out, competition has
shifted in such a way that few could have predicted. The FDI in Nigeria
between 2001 and 2011 was c.$45bn, and Telecoms accounted for ~35% of
the total. The sector’s cumulative investment is valued at $34 billion (N6.7
trillion), an increase from $32 billion (N63.6 trillion) since 2013. Investment
for the industry is projected to reach $42 billion (N8.5 trillion) by 2017. In
2015 the growth rate in the telecommunications sector was higher than for
the economy as whole. As a result, the proportion of total annual GDP
accounted for by telecommunications increased. .In real terms, the sector
contributed N1,645,82 billion to GDP in the final quarter of 2015, or 8.88%.
The year on year growth rate recorded in the fourth quarter of 2015 was
3.49%, though lower than the growth rate of 18.76% recorded quarter-on-
quarter. Despite the growth noted thus far, expanding coverage to rural areas
is a complex issue. Geographic terrain and vast distances, lack of electricity
and road access, and continued security threats are all challenges to
investment in rural coverage.
Fig. 91: –Telecom sector contribution to GDP y-o-y 2010 and 2015 ( %)
Source: NBS, NCC, DLM Research
Fig. 92: –Telecom sector contribution to GDP y-o-y 2010 and 2015 ( %)
Source: NBS, NCC, DLM Research
9.03%
8.68% 8.64%
8.57%
8.46% 8.50%
2010 2011 2012 2013 2014 2015
8.27%
9.25%
7.57%
8.76% 8.38%
9.46%
7.71%
8.88% 8.83%
9.80%
Q1'14 Q2'14 Q3'14 Q4'14 Q1'15 Q2'15 Q3'15 Q4'15 Q1'16 Q2'16
“ In real terms, the
sector contributed N1,645,82 billion to
GDP in the final quarter of 2015, or 8.88%. The year on
year growth rate recorded in the fourth quarter of
2015 was 3.49%, though lower than the
growth rate of 18.76% recorded quarter-on-
quarter. ’’
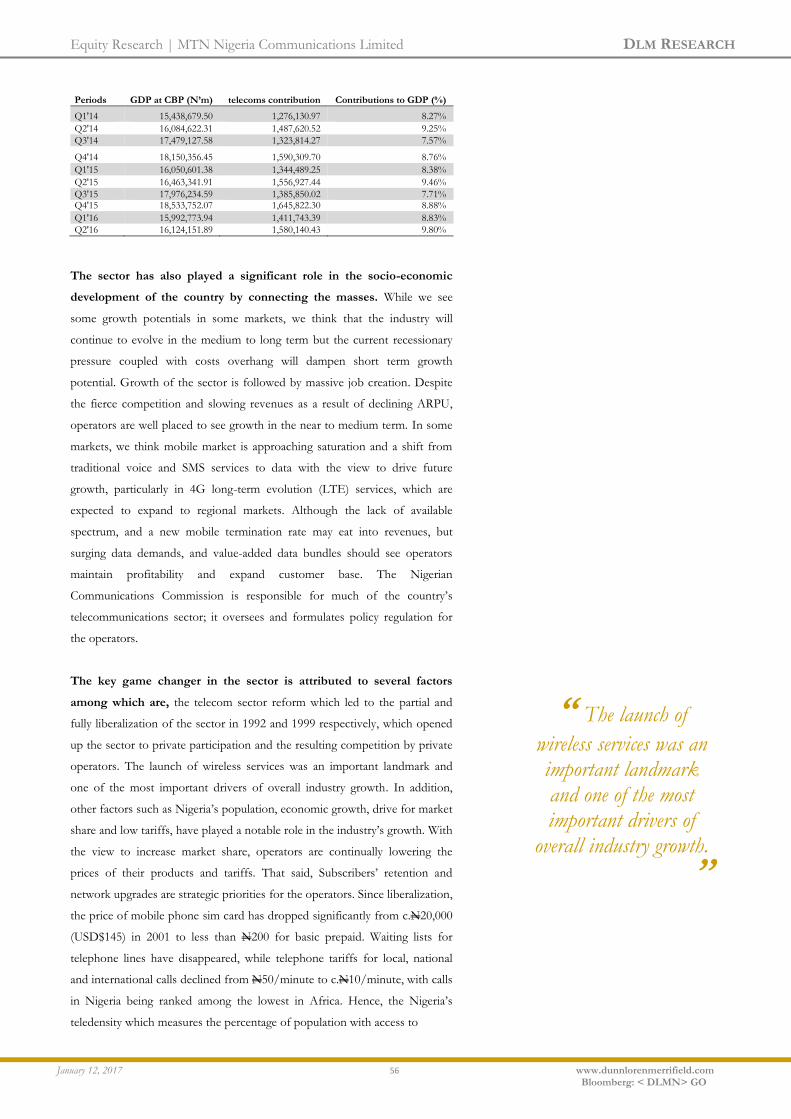
Equity Research | MTN Nigeria Communications Limited DLM RESEARCH
January 12, 2017 56 www.dunnlorenmerrifield.com
Bloomberg: < DLMN> GO
Periods GDP at CBP (N’m) telecoms contribution Contributions to GDP (%)
Q1'14 15,438,679.50 1,276,130.97 8.27%
Q2'14 16,084,622.31 1,487,620.52 9.25%
Q3'14 17,479,127.58 1,323,814.27 7.57%
Q4'14 18,150,356.45 1,590,309.70 8.76%
Q1'15 16,050,601.38 1,344,489.25 8.38%
Q2'15 16,463,341.91 1,556,927.44 9.46%
Q3'15 17,976,234.59 1,385,850.02 7.71% Q4'15 18,533,752.07 1,645,822.30 8.88%
Q1'16 15,992,773.94 1,411,743.39 8.83%
Q2'16 16,124,151.89 1,580,140.43 9.80%
The sector has also played a significant role in the socio-economic
development of the country by connecting the masses. While we see
some growth potentials in some markets, we think that the industry will
continue to evolve in the medium to long term but the current recessionary
pressure coupled with costs overhang will dampen short term growth
potential. Growth of the sector is followed by massive job creation. Despite
the fierce competition and slowing revenues as a result of declining ARPU,
operators are well placed to see growth in the near to medium term. In some
markets, we think mobile market is approaching saturation and a shift from
traditional voice and SMS services to data with the view to drive future
growth, particularly in 4G long-term evolution (LTE) services, which are
expected to expand to regional markets. Although the lack of available
spectrum, and a new mobile termination rate may eat into revenues, but
surging data demands, and value-added data bundles should see operators
maintain profitability and expand customer base. The Nigerian
Communications Commission is responsible for much of the country’s
telecommunications sector; it oversees and formulates policy regulation for
the operators.
The key game changer in the sector is attributed to several factors
among which are, the telecom sector reform which led to the partial and
fully liberalization of the sector in 1992 and 1999 respectively, which opened
up the sector to private participation and the resulting competition by private
operators. The launch of wireless services was an important landmark and
one of the most important drivers of overall industry growth. In addition,
other factors such as Nigeria’s population, economic growth, drive for market
share and low tariffs, have played a notable role in the industry’s growth. With
the view to increase market share, operators are continually lowering the
prices of their products and tariffs. That said, Subscribers’ retention and
network upgrades are strategic priorities for the operators. Since liberalization,
the price of mobile phone sim card has dropped significantly from c.N20,000
(USD$145) in 2001 to less than N200 for basic prepaid. Waiting lists for
telephone lines have disappeared, while telephone tariffs for local, national
and international calls declined from N50/minute to c.N10/minute, with calls
in Nigeria being ranked among the lowest in Africa. Hence, the Nigeria’s
teledensity which measures the percentage of population with access to
“ The launch of
wireless services was an important landmark and one of the most important drivers of
overall industry growth.
’’
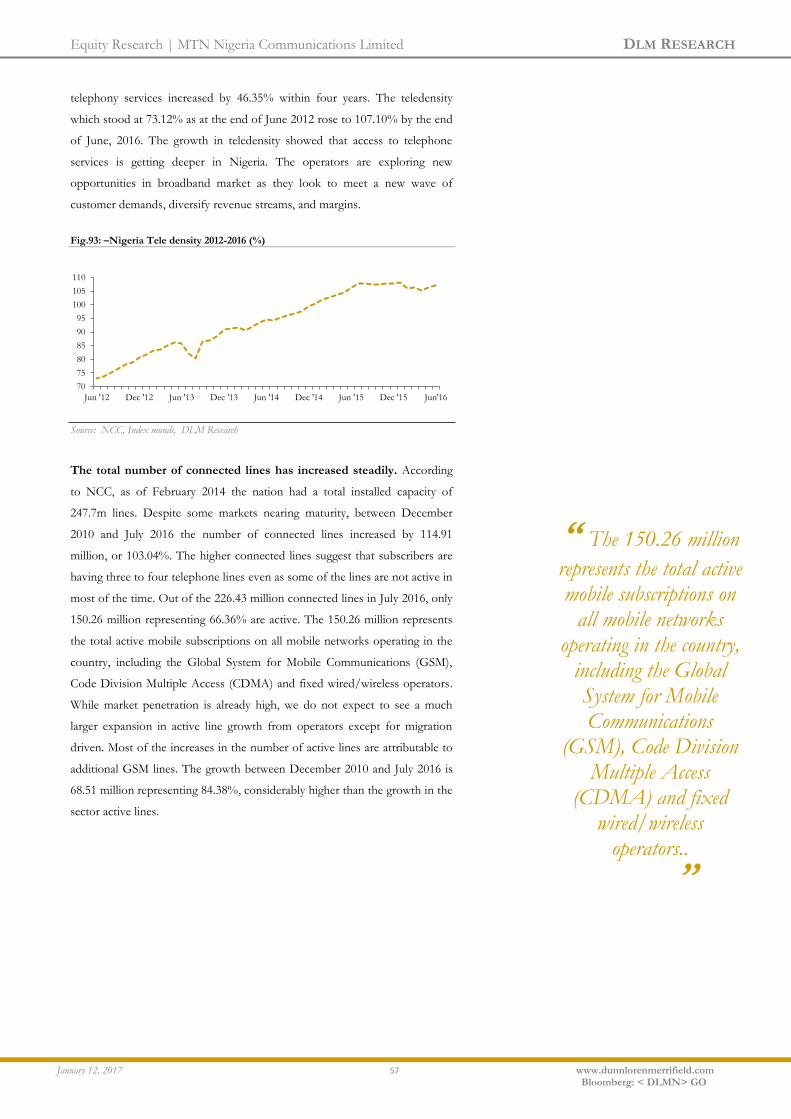
Equity Research | MTN Nigeria Communications Limited DLM RESEARCH
January 12, 2017 57 www.dunnlorenmerrifield.com
Bloomberg: < DLMN> GO
telephony services increased by 46.35% within four years. The teledensity
which stood at 73.12% as at the end of June 2012 rose to 107.10% by the end
of June, 2016. The growth in teledensity showed that access to telephone
services is getting deeper in Nigeria. The operators are exploring new
opportunities in broadband market as they look to meet a new wave of
customer demands, diversify revenue streams, and margins.
Fig.93: –Nigeria Tele density 2012-2016 (%)
Source: NCC, Index mundi, DLM Research
The total number of connected lines has increased steadily. According
to NCC, as of February 2014 the nation had a total installed capacity of
247.7m lines. Despite some markets nearing maturity, between December
2010 and July 2016 the number of connected lines increased by 114.91
million, or 103.04%. The higher connected lines suggest that subscribers are
having three to four telephone lines even as some of the lines are not active in
most of the time. Out of the 226.43 million connected lines in July 2016, only
150.26 million representing 66.36% are active. The 150.26 million represents
the total active mobile subscriptions on all mobile networks operating in the
country, including the Global System for Mobile Communications (GSM),
Code Division Multiple Access (CDMA) and fixed wired/wireless operators.
While market penetration is already high, we do not expect to see a much
larger expansion in active line growth from operators except for migration
driven. Most of the increases in the number of active lines are attributable to
additional GSM lines. The growth between December 2010 and July 2016 is
68.51 million representing 84.38%, considerably higher than the growth in the
sector active lines.
70
75
80
85
90
95
100
105
110
Jun'16Dec '15Jun '15Dec '14Jun '14Dec '13Jun '13Dec '12Jun '12
“ The 150.26 million
represents the total active mobile subscriptions on
all mobile networks operating in the country,
including the Global System for Mobile Communications
(GSM), Code Division Multiple Access
(CDMA) and fixed wired/wireless
operators..
’’
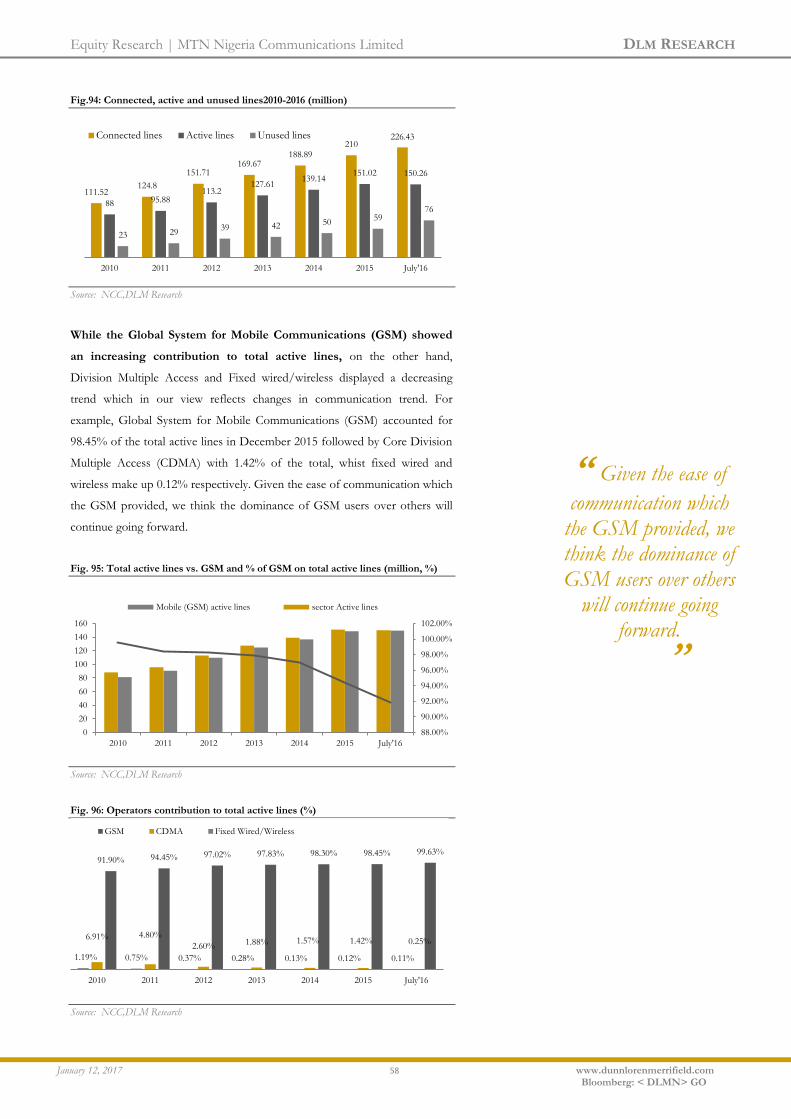
Equity Research | MTN Nigeria Communications Limited DLM RESEARCH
January 12, 2017 58 www.dunnlorenmerrifield.com
Bloomberg: < DLMN> GO
Fig.94: Connected, active and unused lines2010-2016 (million)
Source: NCC,DLM Research
While the Global System for Mobile Communications (GSM) showed
an increasing contribution to total active lines, on the other hand,
Division Multiple Access and Fixed wired/wireless displayed a decreasing
trend which in our view reflects changes in communication trend. For
example, Global System for Mobile Communications (GSM) accounted for
98.45% of the total active lines in December 2015 followed by Core Division
Multiple Access (CDMA) with 1.42% of the total, whist fixed wired and
wireless make up 0.12% respectively. Given the ease of communication which
the GSM provided, we think the dominance of GSM users over others will
continue going forward.
Fig. 95: Total active lines vs. GSM and % of GSM on total active lines (million, %)
Source: NCC,DLM Research
Fig. 96: Operators contribution to total active lines (%)
Source: NCC,DLM Research
111.52 124.8
151.71 169.67
188.89 210
226.43
88 95.88 113.2
127.61 139.14
151.02 150.26
23 29 39 42 50
59 76
2010 2011 2012 2013 2014 2015 July'16
Connected lines Active lines Unused lines
88.00%
90.00%
92.00%
94.00%
96.00%
98.00%
100.00%
102.00%
0
20
40
60
80
100
120
140
160
July'16201520142013201220112010
Mobile (GSM) active lines sector Active lines
99.63% 98.45% 98.30% 97.83% 97.02% 94.45% 91.90%
0.25% 1.42% 1.57% 1.88% 2.60%
4.80% 6.91%
0.11% 0.12% 0.13% 0.28% 0.37% 0.75% 1.19%
July'16201520142013201220112010
GSM CDMA Fixed Wired/Wireless
“ Given the ease of
communication which the GSM provided, we think the dominance of GSM users over others
will continue going forward.
’’

Equity Research | MTN Nigeria Communications Limited DLM RESEARCH
January 12, 2017 59 www.dunnlorenmerrifield.com
Bloomberg: < DLMN> GO
Mobile Subscribers (GSM) has seen a steady growth. While the Nigeria
mobile market has high rates of penetration; with over 130m sim cards in
circulation, the fixed-line market is lagging. We are of the view that uptake of
smart devices and the low-cost smart phones are a key driver of this
development. The smartphone penetration rate is still growing strongly and
adoption is higher in the developed markets. In 2015, the GSM subscribers
recorded a y-on-y growth of 8.71% or 11.91 million to 148.68 million
subscribers. Between 2010 and 2015, SGM operators in Nigeria recorded an
additional 67.48 million subscribers, representing a growth of 83.11%
(CAGR: 12.86%). This is due largely to the fact that GSM is the most popular
subscription type in Nigeria, and only a small fraction of subscriptions are for
fixed lines. July, 2016 marked a clear turning point as total GSM subscribers
rose to 149.71 million. With the growth nearing no end, Nigeria is expected to
lead the global growth in mobile GSM subscribers follow by South Africa.
The growth in mobile GSM subscribers is driven by users’ preference for
using their device for a variety of activities that are normally performed on
laptops or desktops.
Fig. 97: GSM subscribers in Nigeria (million)
Source: NCC,DLM Research
Fig. 98: CDMA and Fixed wired/wireless subscribers in Nigeria (million)
Source: NCC,DLM Research
149.7 148.68 136.77
124.84
109.83
90.56 81.19
July'16201520142013201220112010
0.37
2.15 2.19 2.41 2.95
4.60
6.10
0.16 0.19 0.18 0.36 0.42 0.72
1.05
July'16201520142013201220112010
CDMA Fixed Wired/Wireless
“ Between 2010 and
2015, SGM operators in Nigeria recorded an
additional 67.48 million subscribers,
representing a growth of 83.11% (CAGR:
12.86%)..
’’
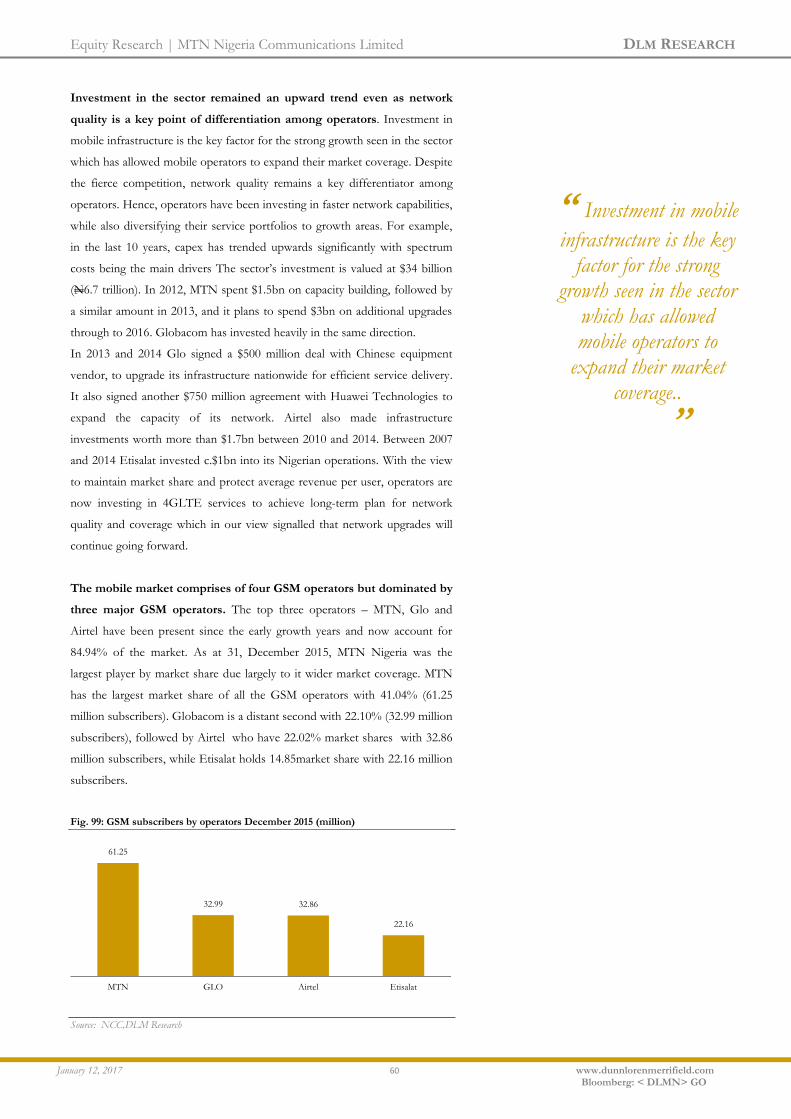
Equity Research | MTN Nigeria Communications Limited DLM RESEARCH
January 12, 2017 60 www.dunnlorenmerrifield.com
Bloomberg: < DLMN> GO
Investment in the sector remained an upward trend even as network
quality is a key point of differentiation among operators. Investment in
mobile infrastructure is the key factor for the strong growth seen in the sector
which has allowed mobile operators to expand their market coverage. Despite
the fierce competition, network quality remains a key differentiator among
operators. Hence, operators have been investing in faster network capabilities,
while also diversifying their service portfolios to growth areas. For example,
in the last 10 years, capex has trended upwards significantly with spectrum
costs being the main drivers The sector’s investment is valued at $34 billion
(N6.7 trillion). In 2012, MTN spent $1.5bn on capacity building, followed by
a similar amount in 2013, and it plans to spend $3bn on additional upgrades
through to 2016. Globacom has invested heavily in the same direction.
In 2013 and 2014 Glo signed a $500 million deal with Chinese equipment
vendor, to upgrade its infrastructure nationwide for efficient service delivery.
It also signed another $750 million agreement with Huawei Technologies to
expand the capacity of its network. Airtel also made infrastructure
investments worth more than $1.7bn between 2010 and 2014. Between 2007
and 2014 Etisalat invested c.$1bn into its Nigerian operations. With the view
to maintain market share and protect average revenue per user, operators are
now investing in 4GLTE services to achieve long-term plan for network
quality and coverage which in our view signalled that network upgrades will
continue going forward.
The mobile market comprises of four GSM operators but dominated by
three major GSM operators. The top three operators – MTN, Glo and
Airtel have been present since the early growth years and now account for
84.94% of the market. As at 31, December 2015, MTN Nigeria was the
largest player by market share due largely to it wider market coverage. MTN
has the largest market share of all the GSM operators with 41.04% (61.25
million subscribers). Globacom is a distant second with 22.10% (32.99 million
subscribers), followed by Airtel who have 22.02% market shares with 32.86
million subscribers, while Etisalat holds 14.85market share with 22.16 million
subscribers.
Fig. 99: GSM subscribers by operators December 2015 (million)
Source: NCC,DLM Research
61.25
32.99 32.86
22.16
MTN GLO Airtel Etisalat
“ Investment in mobile
infrastructure is the key factor for the strong
growth seen in the sector which has allowed mobile operators to
expand their market coverage..
’’
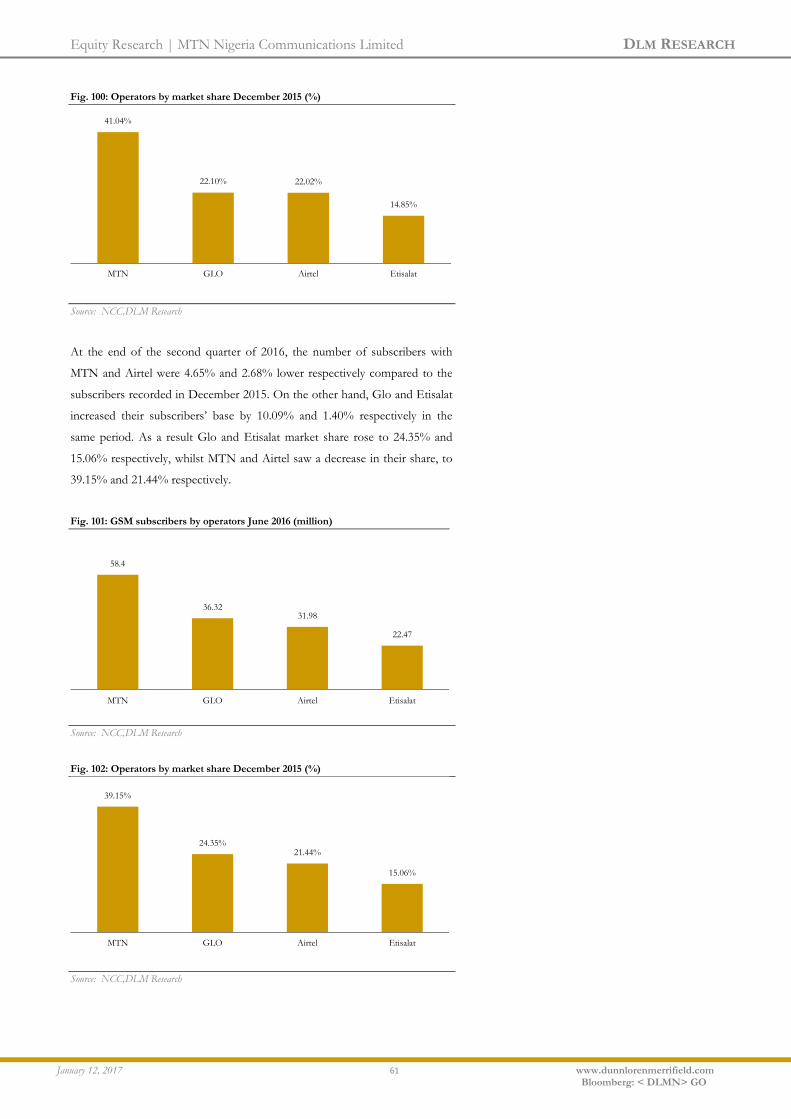
Equity Research | MTN Nigeria Communications Limited DLM RESEARCH
January 12, 2017 61 www.dunnlorenmerrifield.com
Bloomberg: < DLMN> GO
Fig. 100: Operators by market share December 2015 (%)
Source: NCC,DLM Research
At the end of the second quarter of 2016, the number of subscribers with
MTN and Airtel were 4.65% and 2.68% lower respectively compared to the
subscribers recorded in December 2015. On the other hand, Glo and Etisalat
increased their subscribers’ base by 10.09% and 1.40% respectively in the
same period. As a result Glo and Etisalat market share rose to 24.35% and
15.06% respectively, whilst MTN and Airtel saw a decrease in their share, to
39.15% and 21.44% respectively.
Fig. 101: GSM subscribers by operators June 2016 (million)
Source: NCC,DLM Research
Fig. 102: Operators by market share December 2015 (%)
Source: NCC,DLM Research
41.04%
22.10% 22.02%
14.85%
MTN GLO Airtel Etisalat
58.4
36.32 31.98
22.47
MTN GLO Airtel Etisalat
39.15%
24.35% 21.44%
15.06%
MTN GLO Airtel Etisalat

Equity Research | MTN Nigeria Communications Limited DLM RESEARCH
January 12, 2017 62 www.dunnlorenmerrifield.com
Bloomberg: < DLMN> GO
In the medium to long term, we expect to see a fundamental shift in
the industry from a voice dominated environment to a data dominated
environment and this may impact on the viability of most operators.
While growth in mobile usage has been remarkably strong in recent years,
fixed broadband penetration remains very low - presenting opportunity for
investment. Broadband/internet connections is expected to grow significantly
in the near to medium term as Nigerian grows more reliant on mobile devices
with the increasing youthful population embracing mobility. The growth in
internet usage is expected to be driven by traffic on social media, content-rich
apps download, music and video accessed from a new range of cheaper
smartphones. With c.150 million mobile subscribers, the majority of the
internet users in Nigeria are limited to narrow band internet at 2G/3G speed.
Despite the growth in internet usage noted thus far, Nigeria still lags behind
most of the world in terms of high-speed broadband connectivity. With the
view to boost broadband quality, coverage and internet penetration, operators
are investing on 4G LTE mobile broadband services. For example, MTN
Nigeria acquired Visafone to utilise Visafone NCC band allocation for 4G
LTE services. At the end of June 2016, internet users on Nigeria’s
telecommunications networks declined to 92.28million from 92.36 million
subscribers in May 2016, of which 92.18 million were on GSM networks. This
means that of all the active GSM lines, ~62% had an internet subscription.
On the other hand, the ratio of internet to mobile subscriptions amongst
CDMA providers is low relative to GSM subscribers.
Fig. 103: Internet subscribers in Nigeria (million)
Source: NCC,DLM Research
92.28 97.2
75.75
65.67
55.18 46.56
38.26 31.04
23.96
9.96 7.95 4.96 1.75
June'16*Sep'15*20142013201220112010200920082007200620052004
“ While growth in
mobile usage has been remarkab
ly strong in recent years, fixed broadband
penetration remains very low - presenting opportunity for investment...
’’

Equity Research | MTN Nigeria Communications Limited DLM RESEARCH
January 12, 2017 63 www.dunnlorenmerrifield.com
Bloomberg: < DLMN> GO
Fig. 104: Internet subscribers in Nigeria percentage on population (%)
Source: NCC,DLM Research
Fig. 105: Internet users by operators (million)
Source: NCC,DLM Research
MTN remains the market leader in internet subscription despite losing
subscribers month-on-month. At the end of June 2016 MTN Nigeria had
32.97million internet subscribers – which was almost 100% more than Airtel’s
17.33 million subscribers. Glo was second with 26.23 million and Etisalat
fourth with 15.28 million subscribers. The current level showed that MTN
has ~36% market share, followed by Glo with 28.57% market share. The
entry of ntel and Smile underscores the potential for growth in the mobile
broadband space. The entrance by ntel comes at a time when operators are
struggling with slowing revenues and looking to revenue from data to
improve income. This in our view suggests there could be significant return
on investment if operators develop the necessary infrastructure to support
growing data use. The three operators that currently offers 4G network are
Ntel, Smile and Mtn-Visafone.
0.00%
10.00%
20.00%
30.00%
40.00%
50.00%
60.00%
June'16*Sep'15*20142013201220112010200920082007200620052004
92.18
0.10
GSM CDMA
“ At the end of June
2016 MTN Nigeria had 32.97million
internet subscribers – which was almost 100%
more than Airtel’s 17.33 million subscribers..
’’
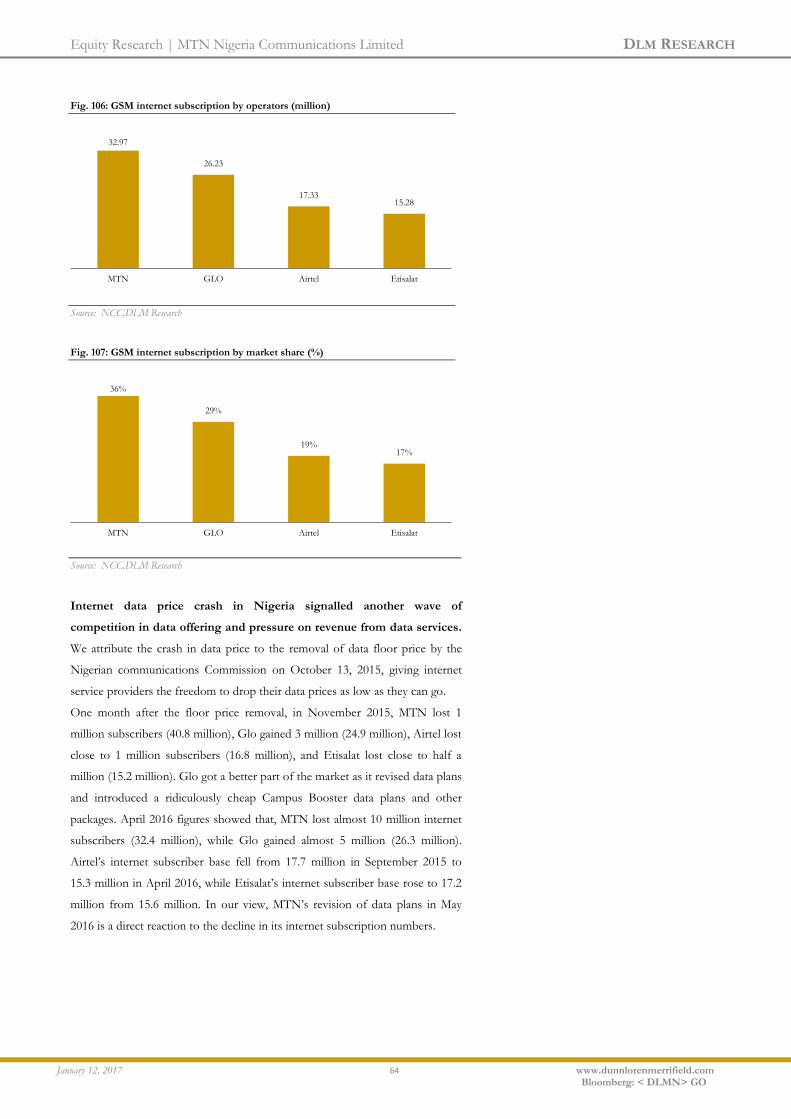
Equity Research | MTN Nigeria Communications Limited DLM RESEARCH
January 12, 2017 64 www.dunnlorenmerrifield.com
Bloomberg: < DLMN> GO
Fig. 106: GSM internet subscription by operators (million)
Source: NCC,DLM Research
Fig. 107: GSM internet subscription by market share (%)
Source: NCC,DLM Research
Internet data price crash in Nigeria signalled another wave of
competition in data offering and pressure on revenue from data services.
We attribute the crash in data price to the removal of data floor price by the
Nigerian communications Commission on October 13, 2015, giving internet
service providers the freedom to drop their data prices as low as they can go.
One month after the floor price removal, in November 2015, MTN lost 1
million subscribers (40.8 million), Glo gained 3 million (24.9 million), Airtel lost
close to 1 million subscribers (16.8 million), and Etisalat lost close to half a
million (15.2 million). Glo got a better part of the market as it revised data plans
and introduced a ridiculously cheap Campus Booster data plans and other
packages. April 2016 figures showed that, MTN lost almost 10 million internet
subscribers (32.4 million), while Glo gained almost 5 million (26.3 million).
Airtel’s internet subscriber base fell from 17.7 million in September 2015 to
15.3 million in April 2016, while Etisalat’s internet subscriber base rose to 17.2
million from 15.6 million. In our view, MTN’s revision of data plans in May
2016 is a direct reaction to the decline in its internet subscription numbers.
32.97
26.23
17.33 15.28
MTN GLO Airtel Etisalat
36%
29%
19% 17%
MTN GLO Airtel Etisalat

Equity Research | MTN Nigeria Communications Limited DLM RESEARCH
January 12, 2017 65 www.dunnlorenmerrifield.com
Bloomberg: < DLMN> GO
Domestic calls recorded by the industry between 2010 and 2014 showed
no consistent trends pattern. In 2010, local outgoing calls stood at 26.48
billion minutes while the local incoming calls stood at 29.10 billion minutes,
yielding a total of 55.58billion minutes calls made across the four major
networks in Nigeria in 2010. Year 2012 recorded the highest time spent on
domestic calls with local outgoing calls of 59.12billion minutes and incoming
calls of 60.56billion minutes yielding a total of 119.67billion minutes. As at
December 2014, the total outgoing traffic for mobile GSM operators came to
32.22billlion minutes while total incoming climbed to 32.63 billion minutes.
MTN reported the highest outgoing and incoming traffic of 10.07 billion
minutes and 15.69 billion minutes respectively. On the other hand, the total
outgoing and incoming traffic for the Mobile CDMA operators & Fixed
telephone operators for the same period came in at 2.18 billion minutes and
1.82 billion minutes respectively. MTN Fixed reported the highest outgoing
traffic of 1.39 billion minutes and the highest incoming traffic of 1.48 billion
minutes. As at December, 2014, the total outgoing mobile to international
traffic was 1.64 billion minutes while total incoming mobile to international
traffic was 2.77billion minutes. International calls recorded classified by
outgoing and incoming calls were lower largely because tariffs was higher and
therefore costly in call charges. The ratio of outgoing to incoming calls
averaged at 1:6. MTN reported the highest outgoing traffic of 891million
minutes and the highest incoming traffic of 1.94 billion minutes. The total
number of mobile roaming minutes outgoing and incoming for the Mobile
GSM operators was 66.08 million, while the total number of SMS sent as at
December 2014 was 2.28 billion and total number of received SMS reported
was 2.58 billion.
Fig. 108: Local and national telephone traffic for mobile operators 2010-2014 (Minutes-billion)
Source: NCC, DLM Research
55.58
40.51
119.68
28.76
64.85
2010 2011 2012 2013 2014
“ As at December
2014, the total outgoing traffic for mobile GSM
operators came to 32.22billlion minutes while total incoming
climbed to 32.63 billion minutes. MTN reported the highest outgoing and
incoming traffic of 10.07 billion minutes
and 15.69 billion minutes respectively.
’’

Equity Research | MTN Nigeria Communications Limited DLM RESEARCH
January 12, 2017 66 www.dunnlorenmerrifield.com
Bloomberg: < DLMN> GO
Fig. 109: Local incoming and outgoing traffic for mobile operators 2010-2014 (Minutes-billion)
Source: NCC, DLM Research
Fig. 110: International telephone traffic for mobile operators 2010-2014 (Minutes-billion)
Source: NCC, DLM Research
Local & National Telephone Traffic Cdma (2014)
MULTILINKS 3,094,233.64 9,844,549.00
GLOBACOM 11,853,221 1,022,315
MTN 1,392,000,000 1,476,000,000
VISAFONE 694,480,160 292,063,696
21st CENTURY 80,428,775 40,924,155
ipNX 146,406
TOTAL 2,182,002,795.64 1,819,854,715.00
Total Number Of Roaming Minutes Gsm (2014)
MTN 33,865,155.00 14,426,965.00 48,292,120.00
GLO 3,274,557.00 2,775,263.00 6,049,820.00
AIRTEL 377,992.00 4,399,274.00 4,777,266.00
EMTS 4,420,271.32 2,537,516.39 6,957,787.71
TOTAL 41,937,975.32 24,139,018.39 66,076,993.71
29.1
21.18
60.56
13.2
32.63 26.48
19.33
59.12
15.56
32.22
2010 2011 2012 2013 2014
Local Incoming calls traffic local outgoing calls traffic
2.89
2.25 2.46 2.46
2.77
1.76
1.25 1.49
1.8 1.64
2010 2011 2012 2013 2014
Int'l Incoming calls traffic Int'l outgoing calls traffic
Local & National Telephone Traffic Gsm (2014)
MTN 10,074,000,000.00 15,699,000,000.00
GLO 7,608,256,463.01 5,065,958,826.28
AIRTEL 7,042,598,992.00 6,932,463,561.00
EMTS 7,491,416,855.82 4,934,434,445.78
TOTAL 32,216,272,310.83 32,631,856,833.06
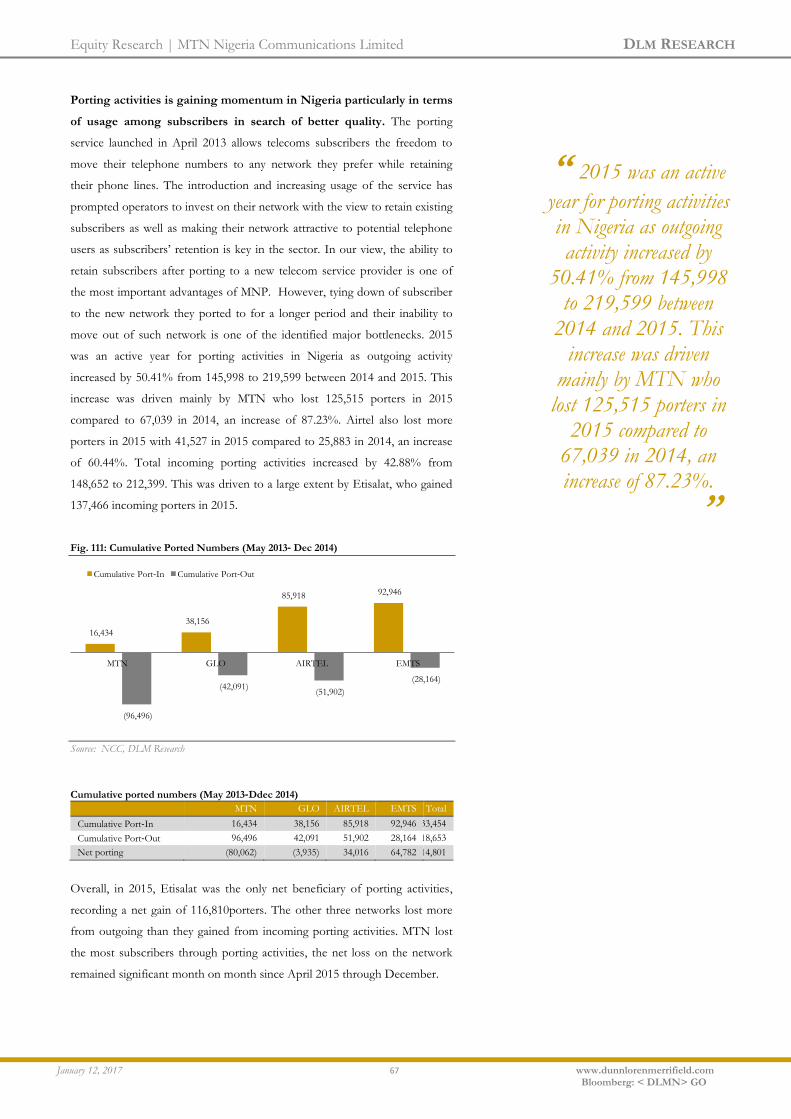
Equity Research | MTN Nigeria Communications Limited DLM RESEARCH
January 12, 2017 67 www.dunnlorenmerrifield.com
Bloomberg: < DLMN> GO
Porting activities is gaining momentum in Nigeria particularly in terms
of usage among subscribers in search of better quality. The porting
service launched in April 2013 allows telecoms subscribers the freedom to
move their telephone numbers to any network they prefer while retaining
their phone lines. The introduction and increasing usage of the service has
prompted operators to invest on their network with the view to retain existing
subscribers as well as making their network attractive to potential telephone
users as subscribers’ retention is key in the sector. In our view, the ability to
retain subscribers after porting to a new telecom service provider is one of
the most important advantages of MNP. However, tying down of subscriber
to the new network they ported to for a longer period and their inability to
move out of such network is one of the identified major bottlenecks. 2015
was an active year for porting activities in Nigeria as outgoing activity
increased by 50.41% from 145,998 to 219,599 between 2014 and 2015. This
increase was driven mainly by MTN who lost 125,515 porters in 2015
compared to 67,039 in 2014, an increase of 87.23%. Airtel also lost more
porters in 2015 with 41,527 in 2015 compared to 25,883 in 2014, an increase
of 60.44%. Total incoming porting activities increased by 42.88% from
148,652 to 212,399. This was driven to a large extent by Etisalat, who gained
137,466 incoming porters in 2015.
Fig. 111: Cumulative Ported Numbers (May 2013‐ Dec 2014)
Source: NCC, DLM Research
Cumulative ported numbers (May 2013‐Ddec 2014) MTN GLO AIRTEL EMTS Total
Cumulative Port‐In 16,434 38,156 85,918 92,946 233,454
Cumulative Port‐Out 96,496 42,091 51,902 28,164 218,653
Net porting (80,062) (3,935) 34,016 64,782 14,801
Overall, in 2015, Etisalat was the only net beneficiary of porting activities,
recording a net gain of 116,810porters. The other three networks lost more
from outgoing than they gained from incoming porting activities. MTN lost
the most subscribers through porting activities, the net loss on the network
remained significant month on month since April 2015 through December.
16,434
38,156
85,918 92,946
(96,496)
(42,091) (51,902)
(28,164)
MTN GLO AIRTEL EMTS
Cumulative Port‐In Cumulative Port‐Out
“ 2015 was an active
year for porting activities in Nigeria as outgoing activity increased by
50.41% from 145,998 to 219,599 between
2014 and 2015. This increase was driven
mainly by MTN who lost 125,515 porters in
2015 compared to 67,039 in 2014, an increase of 87.23%.
’’

Equity Research | MTN Nigeria Communications Limited DLM RESEARCH
January 12, 2017 68 www.dunnlorenmerrifield.com
Bloomberg: < DLMN> GO
Hence, Glo lost the least at 15,637, while Airtel recorded a net gain of 6,206
as a result of a net gain in third quarter of the year. In the first half of 2016,
there were a total of 112,875 incoming porters, which is a decrease compared
to 114,844 recorded in the prior year. Etisalat recorded the most incoming
activity of 60,485, and accounted for 53.59% of activity while MTN recorded
the smallest share of incoming porting accounted for 4,231 or 3.75%. On the
other hand, there were a total of 113,329 outgoing porters in the first half of
2016, a decrease of 6.44% relative to the 121,129 outgoing porters recorded
in the prior year. MTN recorded the largest outgoing activity of 57,933 and
accounted for 51.12% of total outgoing porting activity for the period.
Fig. 112: Porting activities Jan-16 Feb Mar Apr May Jun-16 `Total % share
Incoming
Airtel 5,280 5,752 8,177 6,859 6,829 5,527 38,424 34.04%
Etisalat 6,329 7,411 11,136 11,466 11,765 12,378 60,485 53.59%
Globacom 2589 1,828 1,446 1,468 846 1,558 9,735 8.62%
MTN 450 542 361 547 990 1341 4,231 3.75%
Total 14,648 15,533 21,120 20,340 20,430 20,804 112,875
Outgoing
Airtel 4,396 2,095 3,494 4,235 3,846 5,111 23,177 20.45%
Etisalat 976 1,671 2,153 2622 2,662 2,369 12,453 10.99%
Globacom 1,065 2,517 3,570 3,644 4,269 4,701 19,766 17.44%
MTN 8,430 10,562 12,044 8,115 10,189 8,593 57,933 51.12%
Total 14,867 16,845 21,261 18,616 20,966 20,774 113,329
Net porting activities
Airtel 884 3,657 4,683 2,624 2,983 416
Etisalat 5,353 5,740 8,983 8,844 9,103 10,009
Globacom 1,524 (689) (2,124) (2,176) (3,423) (3,143)
MTN (7,980) (10,020) (11,683) (7,568) (9,199) (7,252)
Total (219) (1,312) (141) 1,724 (536) 30
Porting activities
Dec-14 Jan-15 Feb Mar Apr May Jun Jul Aug Sep Oct Nov Dec-15 Total
Incoming
Airtel 1,799 2,342 2,758 2,289 2,933 4,161 6,290 6,613 5,596 5,347 3,074 3,445 2,885 47,733
Etisalat 7,638 7,820 9,187 10,111 9,875 12,252 13,382 14,125 11,875 12,898 11,211 12,346 12,384 137,466
Globacom 621 1,146 1,532 1,435 1,717 1,065 850 850 1,413 1,505 979 1,735 2,037 16,264
MTN 1,110 1,186 1,478 1,559 994 657 536 951 737 599 1,068 735 436 10,936
Total 11,168 12,494 14,955 15,394 15,519 18,135 21,058 22,539 19,621 20,349 16,332 18,261 17,742 212,399
Outgoing
Airtel 2,686 3,330 3,655 3,197 3,381 3,316 3,768 4,047 3,362 3,635 3,562 3,086 3,188 41,527
Etisalat 920 1,749 1,625 1,431 1,777 1,984 2,177 2,161 2,077 1,264 1,241 1,431 1,739 20,656
Globacom 2,260 2,680 2,570 2,651 2,038 3,253 3,290 3,290 2,795 3,212 1,703 2,327 2,092 31,901
MTN 4,673 6,571 6,951 7,439 8,161 9,558 11,918 19,214 11,218 12,259 10,073 11,414 10,739 125,515
Total 10,539 14,330 14,801 14,718 15,357 18,111 21,153 28,712 19,452 20,370 16,579 18,258 17,758 219,599
Net porting activities
Airtel (887) (988) (897) (908) (448) 845 2,522 2,566 2,234 1,712 (488) 359 (303)
Etisalat 6,718 6,071 7,562 8,680 8,098 10,268 11,205 11,964 9,798 11,634 9,970 10,915 10,645
Globacom (1,639) (1,534) (1,038) (1,216) (321) (2,188) (2,440) (2,440) (1,382) (1,707) (724) (592) (55)
MTN (3,563) (5,385) (5,473) (5,880) (7,167) (8,901) (11,382) (18,263) (10,481) (11,660) (9,005) (10,679) (10,303)
Total 629 (1,836) 154 676 162 24 (95) (6,173) 169 (21) (247) 3 (16)

Equity Research | MTN Nigeria Communications Limited DLM RESEARCH
January 12, 2017 69 www.dunnlorenmerrifield.com
Bloomberg: < DLMN> GO
Average revenue per user has seen a significant decline as competition
heightened price pressure, resulting in faster declines. The monthly
average revenue per user in the telecom sector declined from its 2003 level of
~$48 to $6. The monthly Average Revenue Per User (ARPU) in Nigeria’s
telecoms market is estimated at N1,830, given the current foreign exchange
rate at N305. Using the ARPU of $6.00 and a subscriber base of 149.7million,
Nigeria’s mobile telephone users now pay c.N273.96billion monthly in
accessing telecom service, especially calls making. The growth is largely due to
the increase in the number of registered phone users as well as the
devaluation of the naira. While significant of new devices sold in Nigeria are
multi-SIMs, low-value customers have the highest share of the SIMs and seek
highly discounted call rates. As competition intensified, a further decline in
Mobile termination rates implies decline in interconnect revenue if usage
remains flat. As mobile and smart device utilization and connectivity
continues to expand, this will ultimately shape and define the Nigerian
telecoms space going forward.
Fig. 113: Average revenue per user 2010-2015($)
Source: NCC, DLM Research
7 7 6 6 6 6
17 16
15 15 15 14.5
2010 2011 2012 2013 2014 2015
ARPU, by connection ARPU, by subscriber (US$)
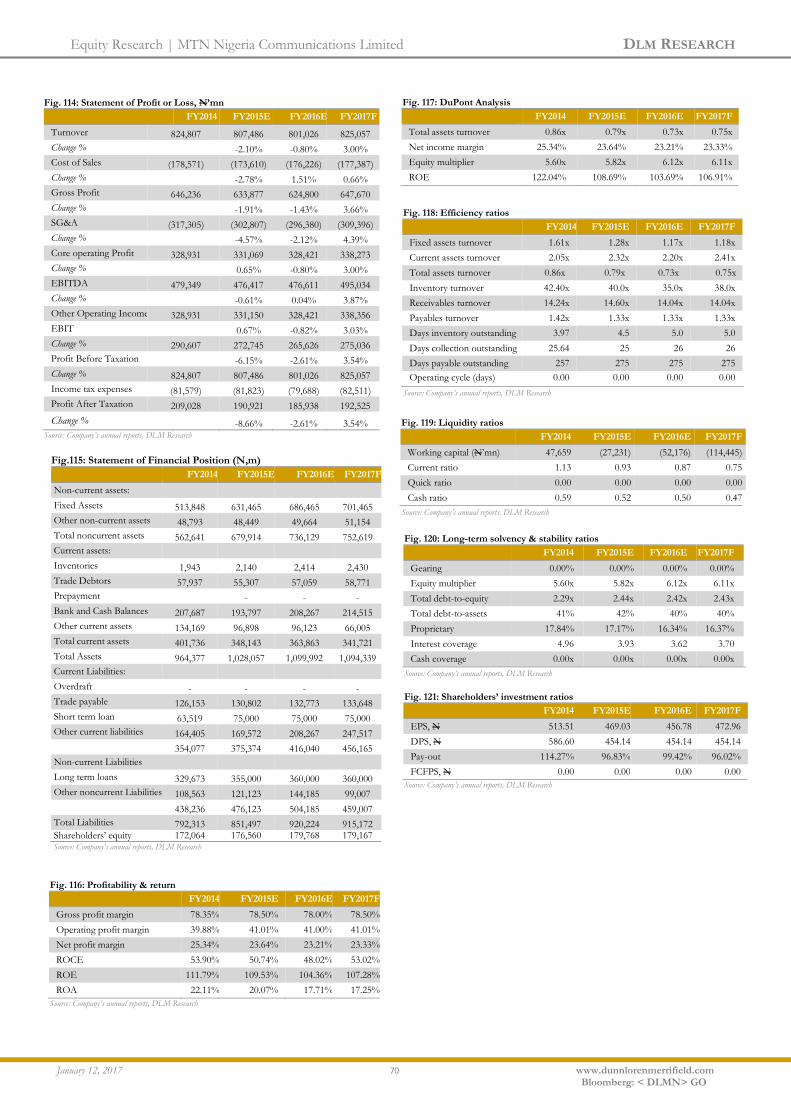
Equity Research | MTN Nigeria Communications Limited DLM RESEARCH
January 12, 2017 70 www.dunnlorenmerrifield.com
Bloomberg: < DLMN> GO
Fig. 114: Statement of Profit or Loss, N’mn
FY2014 FY2015E FY2016E FY2017F
Turnover 824,807 807,486 801,026 825,057
Change %
-2.10% -0.80% 3.00%
Cost of Sales (178,571) (173,610) (176,226) (177,387)
Change %
-2.78% 1.51% 0.66%
Gross Profit 646,236 633,877 624,800 647,670
Change %
-1.91% -1.43% 3.66%
SG&A (317,305) (302,807) (296,380) (309,396)
Change %
-4.57% -2.12% 4.39%
Core operating Profit 328,931 331,069 328,421 338,273
Change %
0.65% -0.80% 3.00%
EBITDA 479,349 476,417 476,611 495,034
Change %
-0.61% 0.04% 3.87%
Other Operating Income 328,931 331,150 328,421 338,356
EBIT
0.67% -0.82% 3.03%
Change % 290,607 272,745 265,626 275,036
Profit Before Taxation
-6.15% -2.61% 3.54%
Change % 824,807 807,486 801,026 825,057
Income tax expenses (81,579) (81,823) (79,688) (82,511)
Profit After Taxation 209,028 190,921 185,938 192,525
Change % -8.66% -2.61% 3.54% Source: Company’s annual reports, DLM Research
Fig. 117: DuPont Analysis
FY2014 FY2015E FY2016E FY2017F
Total assets turnover 0.86x 0.79x 0.73x 0.75x
Net income margin 25.34% 23.64% 23.21% 23.33%
Equity multiplier 5.60x 5.82x 6.12x 6.11x
ROE 122.04% 108.69% 103.69% 106.91%
Fig. 116: Profitability & return
FY2014 FY2015E FY2016E FY2017F
Gross profit margin 78.35% 78.50% 78.00% 78.50%
Operating profit margin 39.88% 41.01% 41.00% 41.01%
Net profit margin 25.34% 23.64% 23.21% 23.33%
ROCE 53.90% 50.74% 48.02% 53.02%
ROE 111.79% 109.53% 104.36% 107.28%
ROA 22.11% 20.07% 17.71% 17.25%
Source: Company’s annual reports, DLM Research
Fig. 118: Efficiency ratios
FY2014 FY2015E FY2016E FY2017F
Fixed assets turnover 1.61x 1.28x 1.17x 1.18x
Current assets turnover 2.05x 2.32x 2.20x 2.41x
Total assets turnover 0.86x 0.79x 0.73x 0.75x
Inventory turnover 42.40x 40.0x 35.0x 38.0x
Receivables turnover 14.24x 14.60x 14.04x 14.04x
Payables turnover 1.42x 1.33x 1.33x 1.33x
Days inventory outstanding 3.97 4.5 5.0 5.0
Days collection outstanding 25.64 25 26 26
Days payable outstanding 257 275 275 275
Operating cycle (days) 0.00 0.00 0.00 0.00
Source: Company’s annual reports, DLM Research
Fig. 119: Liquidity ratios
FY2014 FY2015E FY2016E FY2017F
Working capital (N’mn) 47,659 (27,231) (52,176) (114,445)
Current ratio 1.13 0.93 0.87 0.75
Quick ratio 0.00 0.00 0.00 0.00
Cash ratio 0.59 0.52 0.50 0.47
Source: Company’s annual reports, DLM Research
Fig. 120: Long-term solvency & stability ratios
FY2014 FY2015E FY2016E FY2017F
Gearing 0.00% 0.00% 0.00% 0.00%
Equity multiplier 5.60x 5.82x 6.12x 6.11x
Total debt-to-equity 2.29x 2.44x 2.42x 2.43x
Total debt-to-assets 41% 42% 40% 40%
Proprietary 17.84% 17.17% 16.34% 16.37%
Interest coverage 4.96 3.93 3.62 3.70
Cash coverage 0.00x 0.00x 0.00x 0.00x
Source: Company’s annual reports, DLM Research
Fig. 121: Shareholders’ investment ratios
FY2014 FY2015E FY2016E FY2017F
EPS, N 513.51 469.03 456.78 472.96
DPS, N 586.60 454.14 454.14 454.14
Pay-out 114.27% 96.83% 99.42% 96.02%
FCFPS, N 0.00 0.00 0.00 0.00
Source: Company’s annual reports, DLM Research
Fig.115: Statement of Financial Position (N,m)
FY2014 FY2015E FY2016E FY2017F
Non-current assets:
Fixed Assets 513,848 631,465 686,465 701,465
Other non-current assets 48,793 48,449 49,664 51,154
Total noncurrent assets 562,641 679,914 736,129 752,619
Current assets:
Inventories 1,943 2,140 2,414 2,430
Trade Debtors 57,937 55,307 57,059 58,771
Prepayment
- - -
Bank and Cash Balances 207,687 193,797 208,267 214,515
Other current assets 134,169 96,898 96,123 66,005
Total current assets 401,736 348,143 363,863 341,721
Total Assets 964,377 1,028,057 1,099,992 1,094,339
Current Liabilities:
Overdraft - - - -
Trade payable 126,153 130,802 132,773 133,648
Short term loan 63,519 75,000 75,000 75,000
Other current liabilities 164,405 169,572 208,267 247,517
354,077 375,374 416,040 456,165
Non-current Liabilities
Long term loans 329,673 355,000 360,000 360,000
Other noncurrent Liabilities 108,563 121,123 144,185 99,007
438,236 476,123 504,185 459,007
Total Liabilities 792,313 851,497 920,224 915,172 Shareholders’ equity 172,064 176,560 179,768 179,167 Source: Company’s annual reports, DLM Research
Equity Research | MTN Nigeria Communications Limited DLM RESEARCH
January 12, 2017 71 www.dunnlorenmerrifield.com
Bloomberg: < DLMN> GO
Equity research methodology employed in this report
Views documented in this equity research report stem from conclusions reached through the use of multiple valuation methodologies,
industry-wide knowledge, company specific information and our near to medium term expectations of industry and company performance,
as well as market outlook. Our forecasts are based on a combination of top down and bottom up analysis, alongside historical trends in
industry and company financials. Where appropriate, we factored in available forecasts and business direction provided by company
management. This equity research report qualifies as an initiation research report on the company whose stock has been analysed, hence
the level and depth of details documented herein. Further updates on this company, or its stock, or both, will be communicated to
investors via brief research notes or earnings-flash emails, as occasion demands.
Our recommendation is slightly biased towards value investing. Therefore, our investment rank gauge—a customized scale we use to judge
how well a firm under coverage has performed—is determined using major value parameters as well as relevant ratios and multiples
computed with figures from the company’s most recent financials. The investment rank or grade given to a company is an alphabet which
falls in the set {A+, A, B, C+, C, D, E, F}, where
• Grade A+ means the company has done excellently well on all fronts that form the basis of our consideration, and has a strongly
positive performance outlook.
• Grade A means the company’s performance is of high quality, but can be made better. Outlook for the company is positive.
• Grade B means the company performed marginally above average, at least relative to its peers, but faltered on some fronts. Outlook is
weakly positive.
• Grade C+ means the company’s performance is exactly average; outlook is neither positive nor negative.
• Grades C and D indicate that dwindling performance is the company’s fate at the current time. Outlook for the company is mildly
negative.
• Grades E and F mean the company is headed for towards jeopardy, which might impair its ability to continue as a going concern.
Outlook for the company in this case is alarmingly negative.
The variables used to arrive at the company’s investment rank cover a wide range of measures which characterize liquidity, operational
efficiency, profitability, profitability margins, growth, economic profitability, gearing, relative valuation ratios, capital structure and
management performance. Our investment recommendation is underpinned by the upside or downside potential of a stock under
coverage. This potential is estimated by comparing the stock’s current market price to its price target and fair value, on a percentage
increase or decrease basis as summarized below:
In our analysis, we distinguish between fair value and price target. Fair value is our opinion of the actual fundamental worth of a stock,
irrespective of what the market thinks of the stock or what investors are willing to pay for it. Value investors purchase stocks way below
their fair values, while income investors might purchase stocks at their fair values at the very maximum.
Price target, on the other hand, is the estimated price we opine the stock will trade in the near to medium term. It is the price that, if
realized, could result in the best investment returns, given prevailing market conditions. It gives an idea of the price other investors might
be willing to pay for a stock regardless of its actual worth. We employ fair value, price target or both to determine a stock’s upside or
downside potential.
A BUY recommendation directly means what it says; purchase the stock according to your wallet and appetite for risk. A SELL
recommendation prompts investors to exit their positions in the stock, as the analyst believes the stock is not worth investors’ time and
capital commitment. A HOLD recommendation generally tells investors to do nothing; if you have not bought the stock, do not buy it and
if you have bought it, do not sell it.
Deviation from current price Recommendation
>30% STRONG BUY
10% to <30% BUY
-10% to < 10% HOLD
<-10% SELL
Source: Company Financials, DLM Research
Equity Research | MTN Nigeria Communications Limited DLM RESEARCH
January 12, 2017 72 www.dunnlorenmerrifield.com
Bloomberg: < DLMN> GO
IMPORTANT DISCLOSURES.
This research report has been prepared by the analyst(s), whose name(s) appear on the front page of this document, to provide background
information about the issues which are the subject matter of this report. It is given for informational purposes only.
Each analyst hereby certifies that with respect to the issues discussed herein, all the views expressed in this document are his or her own
and reflect his or her personal views about any and all of such matters. These views are not necessarily held or shared by Dunn Loren
Merrifield Limited or any of its affiliate companies (“DL Merrifield”). The analyst(s) views herein are expressed in good faith and every
effort has been made to use reliable comprehensive information but no representation is made as to its accuracy or completeness. The
opinions and information contained in this report are subject to change and neither the analysts nor DL Merrifield is under any obligation
to notify you or make public any announcement with respect to such change.
This report is produced independently of DL Merrifield and the recommendations (if any), forecasts, opinions, estimates, expectations and
views contained herein are entirely those of the analysts. While all reasonable care has been taken to ensure that the facts stated herein are
accurate and that the recommendations, forecasts, opinions, estimates, expectations and views contained herein are fair and reasonable,
none of the analysts, DL Merrifield nor any of its directors, officers or employees has verified the contents hereof and accordingly, none of
the analysts, DL Merrifield nor any of its respective directors, officers or employees, shall be in any way responsible for the contents
hereof.
With the exception of information regarding DL Merrifield, reports prepared by DL Merrifield analysts are based on public information.
Facts and views presented in this report have not been reviewed and may not reflect information known to professionals on other DL
Merrifield business areas including investment banking. This report does not provide individually tailored investment advice. Reports are
prepared without regard to individual financial circumstances and objectives of persons who receive it. The securities discussed in this
report may not be suitable for all investors. It is recommended that investors independently evaluate particular investments and strategies.
The appropriateness of a particular investment or strategy will depend on an investor’s individual circumstances or objectives. Neither the
analyst(s), DL Merrifield, any of its respective directors, officers nor employees accepts any liability whatsoever for any loss howsoever
arising from any use of this report or its contents or otherwise arising in connection therewith. Each analyst and/or any person connected
with any analyst may have acted upon or used the information herein contained, or the research or analysis on which it is based prior to its
publication date. This document may not be relied upon by any of its recipients or any other person in making investment decisions.
Each research analyst certifies that no part of his or her compensation was, or will be directly or indirectly related to the specific
recommendations (if any), opinions, forecasts, estimates or views in this report. Analysts’’ compensation is based upon activities and
services intended to benefit clients of DL Merrifield. As with other employees of DL Merrifield, analysts’ compensation is impacted by the
overall profitability of DL Merrifield, which includes revenues from all business areas of DL Merrifield.
DL Merrifield does and seeks to do business with companies/governments covered in its research reports including market making,
trading, risk arbitrage and investment banking. As result, investors should be aware that DL Merrifield may have a conflict of interest that
could affect the objectivity of this report.
DUNN LOREN MERRIFIELD Elephant House
214 Broad Street,
Lagos, Nigeria
Tel: 234 1 462 2683-4
www.dunnlorenmerrifield.com