mu-8: visualizing differences between proteins and their...
TRANSCRIPT
Mercer et al.
RESEARCH
Mu-8: Visualizing Differences betweenProteins and their FamiliesJohnathan D Mercer1,2, Balaji Pandian1, Alexander Lex1*, Nicolas Bonneel1 and Hanspeter Pfister1
AbstractA complete understanding of the relationship between the amino acid sequence and resulting protein
function remains an open problem in the biophysical sciences. Current approaches often rely on diagnosingfunctionally relevant mutations by determining whether an amino acid frequently occurs at a specificposition within the protein family. However, these methods do not account for the biophysical properties andthe 3D structure of the protein. We have developed an interactive visualization technique, Mu-8, thatprovides researchers with a holistic view of the differences of a selected protein with respect to a family ofhomologous proteins. Mu-8 helps to identify areas of the protein that exhibit: (1) significantly differentbio-chemical characteristics, (2) relative conservation in the family, and (3) proximity to other regions thathave suspect behavior in the folded protein. Our approach quantifies and communicates the differencebetween a reference protein and its family based on amino acid indices or principal components of aminoacid index classes, while accounting for conservation, proximity amongst residues, and overall 3D structure.
We demonstrate Mu-8 in a case study with data provided by the 2013 BioVis contest. When comparingthe sequence of a dysfunctional protein to its functional family, Mu-8 reveals several candidate regions thatmay cause function to break down.
Keywords: Protein Function; Genetic Variants; Amino Acid Indices; Biological Visualization
1 IntroductionProteins are commonly known as the “workhorse” macro-molecules that perform vital cellular and extracellular func-tions in an organism. Their roles include, but are not limitedto catalysis of biochemical reactions, transportation, storage,and communication. A protein is made of a sequence ofamino acids (also referred to as residues) that are codedfor by genes. A protein derives its function from its three-dimensional structure (the tertiary structure), which is inturn driven by the biochemical properties of its amino acidsequence (the primary structure). Understanding and be-ing able to predict the 3D structure from the amino acidsequence, however, is part of the unsolved protein-foldingproblem [1].
While a general solution to this problem is not withinreach of current methods, interactive visualization and com-putational analysis can help biologists understand the rela-tionship between the amino acid sequence and a protein’s3D structure. This in turn will facilitate the analysis of pro-tein function.
Motivated by the problem and the data published for the2013 IEEE BioVis Data Contest [2], we developed Mu-8, a*Correspondence: [email protected] University, 33 Oxford Street, MA 02138 Cambridge, USAFull list of author information is available at the end of the article
novel, interactive visualization tool for comparing a refer-ence protein to a large protein family. Mu-8 can be accessedat http://mu-8.com. Different or altered proteins of-ten fulfill the same function, albeit with different efficiency.Such proteins are referred to as a protein family and aremostly evolutionary related. This demonstrates that func-tion is often preserved even if the amino acid sequence ischanged. On the other hand, small changes to the sequencecan sometimes cause function to break down. Mu-8 wasdesigned to identify which mutation(s) in a highly mutatedamino acid sequence cause a functional break-down. UsingMu-8, we are able to: (1) quickly identify residues or regionsof residues that are significantly different from the familywith respect to one or more characteristics; (2) identifywhether such a region is in an otherwise highly conservedarea of the sequence; and (3) assess the spatial relationshipsto other regions of the sequence.
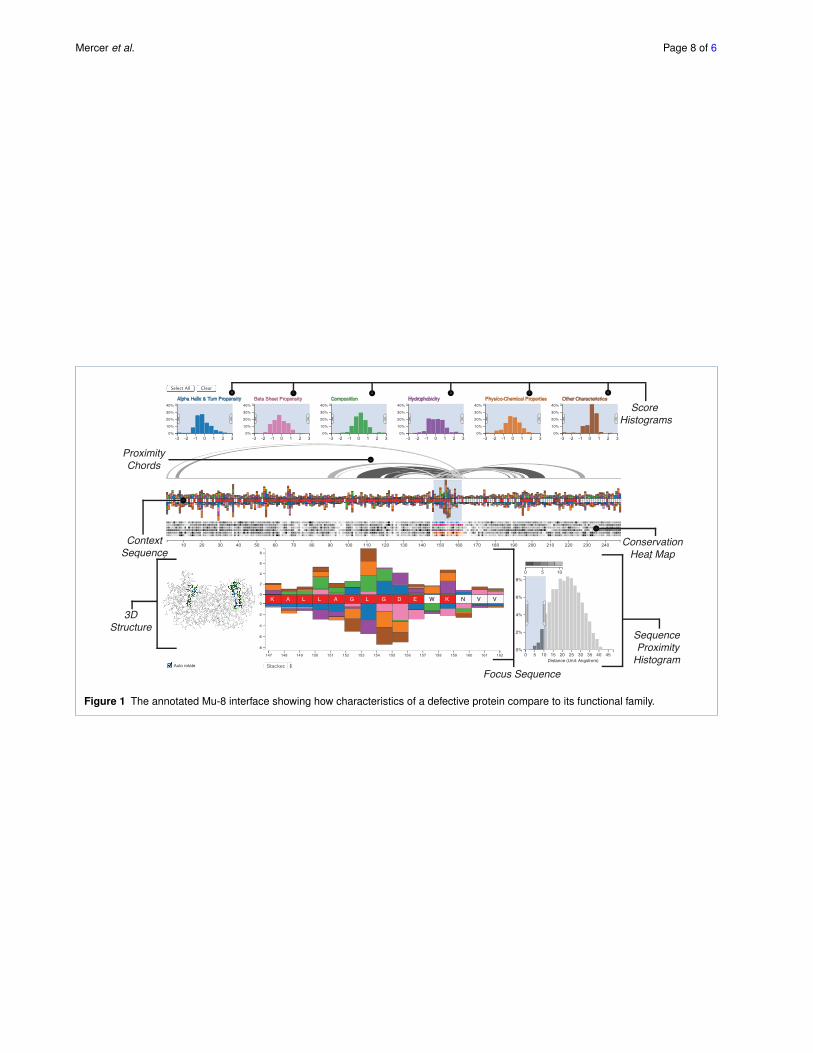
We demonstrate the value of Mu-8 on the dataset pub-lished by the BioVis Data Contest, where we identify sev-eral regions of interest. Most notable are the residues atpositions 150-156, which mutated from “VLEEVKD” to“LAGLGDE”, shown in the focus region in Figure 1. Theseresidues are significantly different from the family acrossmany biophysical properties, are located in relatively con-served regions, and are close to other regions with similar
Mercer et al. Page 2 of 6
anomalies in the folded protein. This region is also closeto the protein’s active site as lysine 12, histidine 95, andglutamic acid 165 are directly involved in the metabolic pro-cess [3]. It stands to reason that the mutated region 150-156may have contorted the location and orientation of the activesite, thus rendering the protein dysfunctional.
2 ConceptOur design strategy was predicated on basic principles thatwe elicited in interviews with domain experts and an ex-tensive literature review. First, we required a design thatfocuses on the differences of a defective protein to its func-tional family, without having to show every family member.Second, we required both a holistic view of the sequence andthe differences to the family. Finally, we aimed at closelycoupling the analysis of the sequence with the inspection ofthe 3D structure.
To measure how different a residue in the mutated pro-tein is compared to the protein family we use amino acidindices, which are an invaluable resource for judging the po-tential consequence of a mutation. An amino acid index is aquantitative score assigned to each of the amino acids. Theypredict various biophysical properties and their develop-ment has become a mainstay in protein research pioneeredby Chou and Fasman [4].
However, there are hundreds of amino acid indices, anddetermining which of them are relevant to the loss of func-tion is difficult. At the same time, showing all indices in avisualization is a challenge with respect to scalability andintroduces significant complexity. While attempts have beenmade at correlating these indices together to provide a lower-dimensional representation [5], and correlating them withstructural properties [6, 7], this comes at the price of dis-carding information that can remain relevant for our task. Toaddress this problem we offer two options: analysts can usea single representative score for each of the amino acid’ssix major characteristics (the default option), or they canchoose which amino acid indices to consider.
Our approach is based on the assumption that significantlydifferent characteristics of substituted amino acids are morelikely to cause functional changes. Consequently, we visual-ize a score, which we call the c-score, that quantifies how“different” a characteristic of an amino acid of the referenceprotein is from its family. Furthermore, mutations affectingfunction often occur in otherwise conserved regions, i.e.,regions with low variation of residues in homologous pro-teins, due to evolutionary selection for functional proteins.Our scores also account for this variation in the family. Thedistribution of these c-scores are shown in the Score His-tograms, while the individual scores for each amino acid areshown as bars in the Context Sequence view and, in moredetail, in the Focus Sequence view (see Figure 1). To com-plement these scores we also highlight conserved regionswith a Conservation Heat Map, also shown in Figure 1,
which shows the variation of the characteristic across thesequence.
A recurring theme in our research has been the paramountimportance of the spatial context of an amino acid. Weaddress this by incorporating 3D structural information intothe visualization in two ways: (1) we use chords to connectthe residues within a specified distance of a selected groupof residues (thus identifying the “sphere of influence” of aregion of the sequence); and (2) we include a 3D renderingof the functional protein.
3 Related workSequence visualization tools [8] are most commonly em-ployed to visualize genomes, rather than amino acid se-quences. Some tools, like Artemis [9] visualize not onlygenomes, but also provide a higher-level view of a codingsequence and display amino acid properties, such as hy-drophobicity. Common genome visualization tools like theUCSC genome browser [10] or IGV [11] use a track basedapproach, where multiple data sources are represented asone track each. In theory, such multiple tracks could be usedto represent multiple amino acid indices, for all residuesin a sequence concurrently. However, we chose to avoid atrack based approach, since we intended to produce a moreconcise representation, and since we argue that such a repre-sentation does not adequately show situations where smallereffects in multiple tracks accumulate to a large overall effect.
The second class of visualization techniques related to Mu-8 are multiple sequence alignment visualization tools [12].While Mu-8 does intentionally not show multiple sequencealignment, tools like VISSA [13] or PFATT [14] show notonly the multiple aligned protein sequences but also pro-vide some additional data, such as the predicted secondarystructure, for the sequences. Both tools combine proteinsequences with a 3D structure viewer.
Visualization of amino acid indices and protein sequencesare, with the limited exceptions noted above, surprisinglyrare. There are some visualizations, such as the one intro-duced by Bulka et al. [15] that show the properties of aminoacids and their effects on substitution matrices in general.However, to our knowledge there is currently no approachthat visualizes amino acid index data in general on a se-quence, and no tool that visualizes the differences betweenprotein sequences with respect to amino acid indices. Mu-8was developed to address this shortcoming of current tools.
4 Data and preprocessingTo use Mu-8, analysts have to provide two datasets: thesequence data of the reference protein and the protein fam-ily, and a file describing the 3D structure of a functionalreference protein. In this paper we demonstrate Mu-8 usingthe defective triose-phosphate isomerase (TIM) sequencepublished as part of the BioVis Contest. TIM enzymes areutilized in glycolysis, an important metabolic process, and
Mercer et al. Page 3 of 6
are essential for energy production. The enzyme is found inall living organisms and, in the case of humans, mutationscan cause a severe metabolic disease called triosephosphateisomerase deficiency. The dataset contains a functioningTIM isolated from Saccharomyces cerevisiae (scTIM) [3],a family of functional TIMs, and a defective TIM (dTIM)created from mutating scTIM [2].
In addition to the data provided by the user, Mu-8 usesa set of amino acid indices from the GenomeNet AAindexdatabase [16, 17]. In this section, we elaborate on the pre-processing stage of the analysis.
4.1 Sequence dataThe amino acid sequence data for the proteins must beprovided in an aligned format. The contest dataset includesdTIM (non-functional), scTIM (functional parent of dTIM),and a set of 5,508 other TIMs which we call the family.The length of both dTIM and scTIM is 248 residues, whileother TIMs vary between 23 and 1053 with an average of228 residues. To incorporate TIMs of different lengths, weconducted a multiple sequence alignment using the Clustalsoftware [18]. Amino acids outside of the aligned residuewindow of the dysfunctional protein must be cropped off.
4.2 3D structure and proximity dataThe 3D structure must be provided in the Protein DataBank (pdb) file format. We demonstrate Mu-8 using thethree-dimensional PDB model of scTIM [3]. Based on thesupplied files, we compute pairwise distances between theα-carbons of each amino acid to determine whether twoamino acids are within each other’s sphere of influence.
4.3 Index data and characteristic scoresAmino acid indices are quantitative measures of molecularcharacteristics. Mu-8 includes data on indices pertaining tosix characteristics, for a total of more than 500 indices, orig-inally analyzed by Tomii and Kanehisa [17]. These include:
• alpha and turn propensity, which quantifies the like-lihood of forming an α-helix,
• beta propensity, which quantifies the likelihood offorming a β -sheet,
• hydrophobicity, which quantifies how water-repellentan amino acid is,
• composition, which quantifies the types of atoms thatcomprise each amino acid,
• physicochemical properties, which quantifies physi-cal and chemical characteristics such as bulkiness, and
• other properties, which describes indices that do notfit within the other 5 categories, such as the likelihoodthat an amino acid will be located on the surface of theproteins.
An example index from the alpha and turn propensitygroup, developed by Prabhakaran [19], provides a scorefor the relative frequency of a residue in an alpha-helix
structure, and is defined as the ratio of the observed toexpected frequency of the residue in the alpha helix structure.Residues with greater than expected frequency have an indexgreater than one.
The large number of indices available can make the selec-tion process difficult. We provide an alternative for analystswho either do not know which index to use or would like asingle representative score for each of the six characteristics.To this end, we reduce the dimensionality of the indices us-ing the method of principal components, for each of the sixcharacteristics. For our sample data, we found that the firstprincipal component accounts for a significant proportion ofvariability (between 50% and 75% for the 6 characteristicsfor the TIM data) which makes them reasonable represen-tatives when faced with hundreds of indices from which tochoose.
Based on either the first principal component of the in-dices, or the actual index values, we calculate a score, thec-score csp,r
re f , that quantifies the difference of the referenceamino acid to the family, while also accounting for conser-vation. This score is calculated using the formula
csp,rre f “
isp,rre f ´ Ęisp,r
f am
σisp,rf am
, (1)
where isp,rre f denotes the index value or principal component
of p for residue r of the reference sequence, Ęisp,rf am denotes
the average of p for residue r across the family, and σisp,rf am
is the standard deviation of the family’s respective values.The impetus for this metric is to identify locations of the
sequence in which the amino acid index (or the principalcomponent if that is being used) is significantly differentfrom the family mean in positions that are highly conserved.Significantly high or low scores highlight residues of thereference protein that warrant further investigation.
5 The Mu-8 InterfaceIn this section we discuss the design rationale for the visualencodings of the sequence, the c-scores, our measure ofconservation, the 3D structure and the proximity data. Inconcert these provide the analyst with the desired holisticview.
5.1 Score HistogramsThe six histograms at the top of the visualization (see Fig-ure 1) show the distributions of the c-scores, conveying theprotein’s difference to its family across the entire sequence.The tails of these distributions encode for residues that haveeither a significantly greater or smaller c-score than the fam-ily, i.e., the amino acids at the tails behave significantly dif-ferent than the family. The histograms use a uniform y-axisand are capped at ˘3 standard deviations to counter-balance

Mercer et al. Page 4 of 6
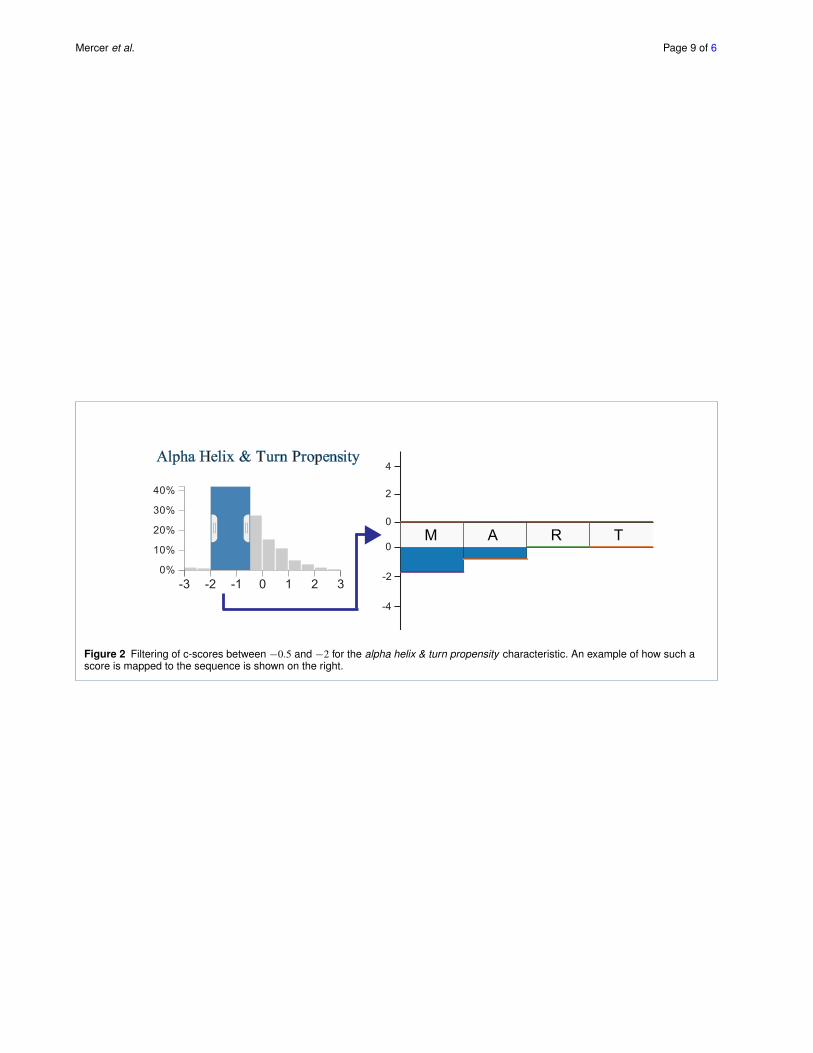
the visual effects of outliers. The histograms can be usedto filter scores in a selected range. Figure 2, for example,shows a filter excluding all scores outside the ´2 to ´0.5interval. This is especially useful to select the tails of thedistribution to highlight, for example, all amino acids thathave a strongly increased hydrophobicity compared to thefamily consensus. Each histogram is given a unique color toidentify the characteristics, which corresponds to the colorof the bars in the sequence views. Regions of the histogramthat are filtered-out are shown in gray.
The score histogram is also used to choose from the prin-cipal components of the six major characteristics, or fromthe full list of amino acid indices. By clicking the labelabove the histogram, a selection menu, containing a list ofavailable characteristics and amino acids indices is revealed.Selecting an entry from the list replaces the data previouslyassociated with the histogram with the selected entry’s data.
5.2 Sequence ViewsAt the center of Mu-8 are two sequence views which areused to encode the c-scores and the degree of conservationof the residues. The context sequence view shows the wholesequence of amino acids from left to right. A labeled axis be-low the sequence facilitates orientation and enables analyststo easily reference regions.
Above and below the sequence we show stacked bars en-coding the c-scores for each characteristic, thus highlightingthe cumulative deviation from the family. Characteristicswith a positive c-score are stacked on top of the sequence,while those with a negative score are stacked below the se-quence. Figure 2 shows an example for the relationship ofthe histograms to the amino acid sequence. For the part ofthe sequence shown, two amino acids have scores matchingthe filter specified in the histogram, thus the correspondingbars are rendered.
While the context sequence view provides a convenientoverview of the whole sequence, details such as the specificamino acid or the exact scores remain obscured. We there-fore supplement the context sequence view with a focussequence view also shown in Figure 1, which provides alarger version of a selected region of interest. The selectedregion is specified using a window on the context region,the size of which can be dynamically adjusted, but has anupper limit of 15 residues to ensure readability of the focussequence.
The stacked bars used in the context sequence allow ananalyst to easily judge the overall deviation from the family.Judging the magnitude of the individual scores, however,is difficult using the stacked bars, as relative lengths ofnot-aligned elements are perceptually more difficult to dis-tinguish compared to judging relative lengths of alignedelements. In the focus view, we provide the option to switchc-scores from a stacked to an aligned bar chart—which fa-cilitates detailed comparisons within and amongst residues.
5.3 Conservation Heat MapBelow the context sequence view is the conservation heatmap, also shown in Figure 1. For each characteristic, thisheat map encodes the variation of c-scores in the family.Conserved regions are known to be more relevant for func-tion, since evolutionary pressure selects for functional pro-teins, while variable regions often are less relevant for func-tion. As previously mentioned, conservation is also consid-ered when calculating the c-scores, which results in higherscores for deviations in highly conserved regions. The ad-ditional heat map enables the analyst to judge conservationindependently from effect size and judge the relevance ofoutliers. In the heat map dark cells encode a high variability,while bright cells encode for a conserved residue. Each rowof the heat map corresponds to the variation of a character-istic’s c-score. We encode the association of the rows to thec-scores using matching hues between the histograms andbars on the sequence and a consistent order: left-to-rightin the histograms corresponds to top-to-bottom in the heatmap. We use an HSL color scale to match the perceivedbrightness of the gray-scale and the colored areas.
5.4 Visualizing ProximityChanges in the biochemical properties of the sequence influ-ence the folding and thus the function of a protein. A linearrepresentation of the amino acid sequence, however, cannotadequately account for the biochemical spheres of influenceof the residues. Therefore we supplement the sequence viewwith proximity chords and provide a 3D structure view.
The proximity chords connect the focus region of the se-quence with other residues that are within a user-specifieddistance from the focus region, as shown on top of the con-text sequence view in Figure 1. The sphere of influence thatis of interest depends on the type of analysis. To account forthis we provide the analyst with the means to specify theproximity using the sequence proximity histogram, shownat the lower right of Figure 1. This histogram shows thedistribution of the distances of all residues relative to theresidues in the focus region. By brushing the histogram, theanalyst can specify the relevant proximity, which in turn fil-ters the chords above the sequence. The chords are renderedat varying brightnesses, with darker chords encoding closerresidues and brighter chords encoding more distant residues,as encoded in the legend above the histogram.
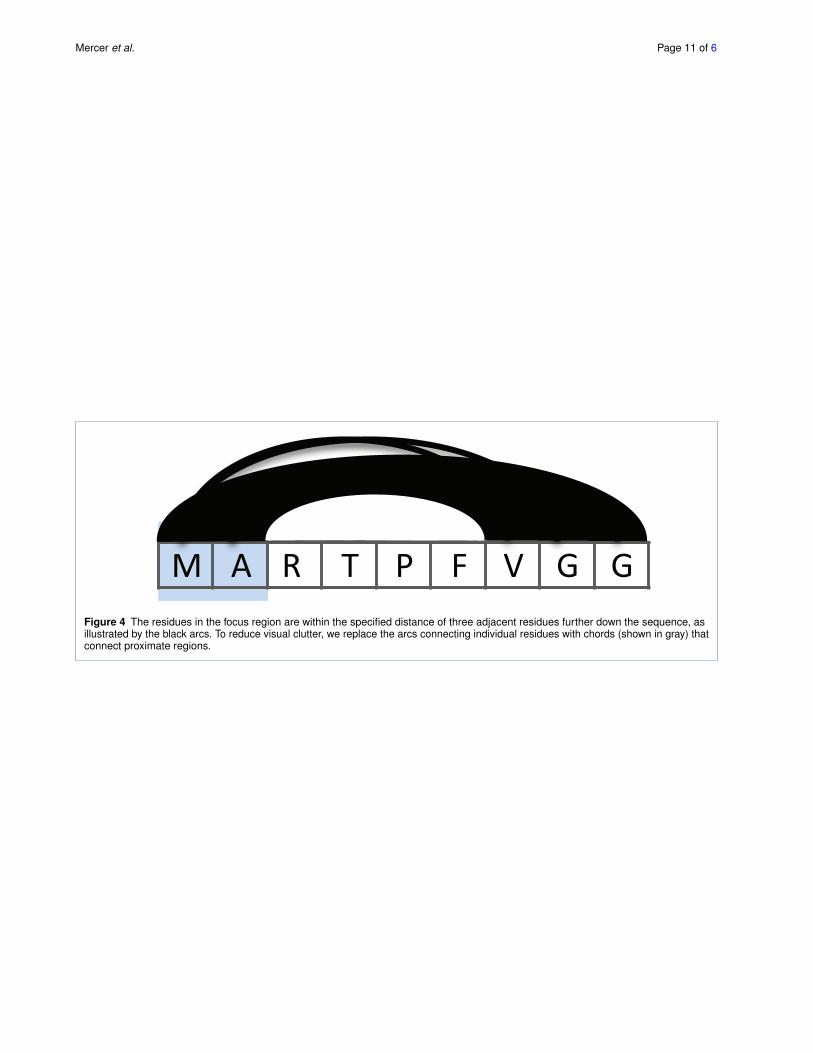
It is natural that the immediate neighborhoods of a residueare at similar distances to other neighborhoods in the se-quence. We use this observation to reduce the visual clutterof the chords by bundling regions with similar proximity,as illustrated in Figure 4. In this example, the two residuesin the focus region (M and A) are all connected to threeresidues adjacent to each other (V, G, and G). Instead ofrendering a chord for every residue, as shown in black, webundle them to a wider arch, shown in gray.
Mercer et al. Page 5 of 6
5.5 Visualizing 3D structureAs the 3D structure is driving the function of the protein,it is a critical piece of information when analyzing a dys-functional protein. As structural information for the wholefamily of proteins and the reference protein is typically notavailable, we limit our visualization to one, typically func-tional protein of the family. By linking the aligned sequenceof the reference protein to the 3D structure, an analyst canidentify which regions in the sequence coincide with thecritical areas in the folded protein.
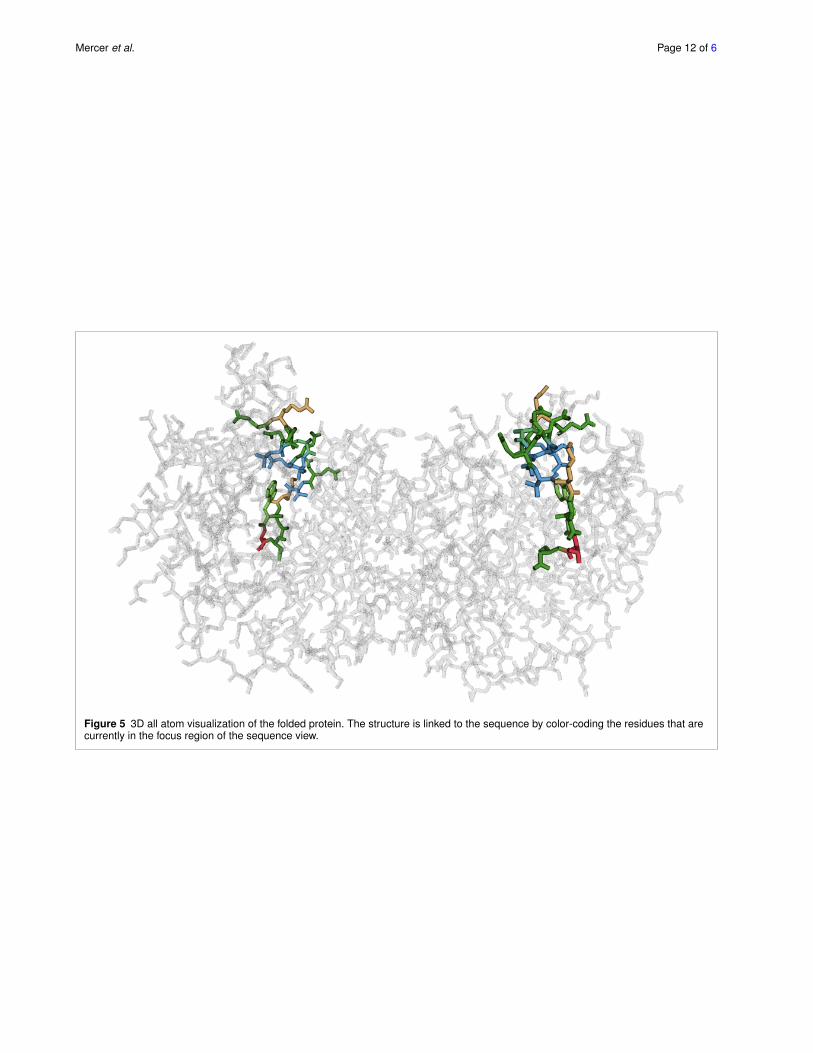
We show the three-dimensional structure in an all-atomvisualization (omitting hydrogen atoms), which we choseover a visualization of the secondary structure or the proteinsurface due to the residue centric paradigm of Mu-8. Thestructure view is shown at the bottom left of Figure 1 and indetail in Figure 5.
The view can be rotated, zoomed, and panned to inspectneighborhoods more closely. It is also linked to the se-quence views such that the residues in the focus regionare highlighted using an established color scheme for aminoacids [20], and using stochastic order-independent trans-parency [21] for residues outside of the focus region.
6 Implementation and ScalabilityWe pre-processed the amino acid index data using R and Ccode. The visualization uses the D3 JavaScript library [22],with the exception of the 3D view, which employs We-bGL. Mu-8 is open source, the code and data are accessiblethrough the project website http://www.mu-8.com.We tested our implementation on recent versions of GoogleChrome and Mozilla Firefox. Microsoft Internet Explorercurrently does not support WebGL and thus can not be usedto run Mu-8.
The Mu-8 website enables biologists to provide their ownMSA and PDB data for analysis. These datasets must bein a specified format and structural requirements are listedon the website. Registration and login are required for up-loading datasets and enable persistence of data and futurecollaboration of analyses.
Mu-8 scales well to the requirements of most proteinfamilies. For humans, the median protein length is estimatedto be in the 400-500 amino acid region [23]. Mu-8 handlesproteins up to a length of approximately 1000 amino acidswell. Beyond that an amino acid is represented by less thantwo pixels on a full-HD screen, limiting the usefulness of theapproach. While this makes Mu-8 applicable to the majorityof proteins, there are some that exceed this size considerably,which would require a modified approach.
7 Conclusion and Future WorkWe contend that Mu-8 is a comprehensive visual analysissolution to compare differences between a protein and itsfamily. Our approach elucidates the significant biochemicaldifferences while accounting for conservation, proximity
amongst residues, and overall 3D structure. Mu-8 enablesanalysts to provide their own datasets and enables them toeasily share visualizations with collaborators.
An interesting direction for future investigation is to inte-grate alignment data into Mu-8. Currently, Mu-8 does notconsider sequence segments outside of the reference proteinand also does not visualize gaps in the family that do notoccur in the reference. Another area warranting researchis to improve Mu-8’s scalability, to also address the rarevery large proteins. Here, approaches similar to genomebrowsers, with multiple levels of details, promise a solution.
As previously mentioned, Mu-8 reveals several candidateregions that may cause function to break down in the dTIMprotein under consideration in the BioVis contest. The mostnotable mutated region is “LAGLGDE” located at positions150-156. The evidence suggests that this region is: (1) signif-icantly different across several characteristics, (2) relativelyconserved, (3) close to other regions that exhibit suspectbehavior in the folded protein, and (4) close to the proteinsactive site.
Competing interestsThe authors declare that they have no competing interests.
Author’s contributionsJM, BP, AL, NB and HP jointly developed the concept andwrote the paper. JM, BP and NB developed the software,JM and AL elicited requirements from the domain experts.
AcknowledgementsWe gratefully acknowledge the dataset provided by Drs.Magliery and Sullivan at The Ohio State University for thepurposes of the BioVis 2013 Contest. We also thank Dr.Guido Guidotti, the Higgins Professor of Biochemistry atHarvard University, and Dr. William Ray, Assistant Profes-sor at the the Ohio State University College of Medicinefor their helpful feedback. This work was supported in partby the Austrian Science Fund (J 3437-N15), the NationalScience Foundation (CGV-1111415) and the Air Force Re-search Laboratory and DARPA grant FA8750-12-C-0300.
Author details1Harvard University, 33 Oxford Street, MA 02138 Cambridge, USA. 2BroadInstitute, 7 Cambridge Center, MA 02142 Cambridge, USA.
References1. Dill, K.A., MacCallum, J.L.: The protein-folding problem, 50 years on.
Science (New York, N.Y.) 338(6110), 1042–1046 (2012)2. Machiraju, R., Ray, W., Bartlett, C.: BioVis data contest. (2013).
http://biovis.net/year/2013/info/contest Accessed2014-03-05
3. Lolis, E., Petsko, G.A.: Crystallographic analysis of the complexbetween triosephosphate isomerase and 2-phosphoglycolate at 2.5-aresolution: implications for catalysis. Biochemistry 29(28), 6619–6625(1990). PMID: 2204418
4. Chou, P.Y., Fasman, G.D.: Prediction of the secondary structure ofproteins from their amino acid sequence. Advances in enzymology andrelated areas of molecular biology 47, 45–148 (1978). PMID: 364941

Mercer et al. Page 6 of 6
5. Kidera, A., Konishi, Y., Oka, M., Ooi, T., Scheraga, H.A.: Statisticalanalysis of the physical properties of the 20 naturally occurring aminoacids. Journal of Protein Chemistry 4(1), 23–55 (1985)
6. Kidera, A., Konishi, Y., Ooi, T., Scheraga, H.A.: Relation betweensequence similarity and structural similarity in proteins. role ofimportant properties of amino acids. Journal of Protein Chemistry 4(5),265–297 (1985)
7. Rackovsky, S.: Sequence physical properties encode the globalorganization of protein structure space. Proceedings of the NationalAcademy of Sciences 106(34), 14345–14348 (2009). PMID: 19706520
8. Nielsen, C.B., Cantor, M., Dubchak, I., Gordon, D., Wang, T.:Visualizing genomes: techniques and challenges. Nature Methods7(3s), 5–15 (2010)
9. Rutherford, K., Parkhill, J., Crook, J., Horsnell, T., Rice, P., Rajandream,M.-A., Barrell, B.: Artemis: sequence visualization and annotation.Bioinformatics 16(10), 944–945 (2000). PMID: 11120685
10. Kent, W.J., Sugnet, C.W., Furey, T.S., Roskin, K.M., Pringle, T.H.,Zahler, A.M., Haussler, D.: The human genome browser at UCSC.Genome Research 12(6), 996–1006 (2002). PMID: 12045153
11. Thorvaldsdottir, H., Robinson, J.T., Mesirov, J.P.: Integrative genomicsviewer (IGV): high-performance genomics data visualization andexploration. Briefings in bioinformatics 14(2), 178–192 (2013). PMID:22517427
12. Procter, J.B., Thompson, J., Letunic, I., Creevey, C., Jossinet, F.,Barton, G.J.: Visualization of multiple alignments, phylogenies andgene family evolution. Nature Methods 7, 16–25 (2010)
13. Li, W., Godzik, A.: VISSA: a program to visualize structural featuresfrom structure sequence alignment. Bioinformatics 22(7), 887–888(2006). PMID: 16434438
14. Caffrey, D.R., Dana, P.H., Mathur, V., Ocano, M., Hong, E.-J., Wang,Y.E., Somaroo, S., Caffrey, B.E., Potluri, S., Huang, E.S.: PFAAT version2.0: A tool for editing, annotating, and analyzing multiple sequencealignments. BMC Bioinformatics 8(1), 381 (2007). PMID: 17931421
15. Bulka, B., desJardins, M., Freeland, S.J.: An interactive visualizationtool to explore the biophysical properties of amino acids and theircontribution to substitution matrices. BMC Bioinformatics 7(1), 329(2006). PMID: 16817972
16. Kanehisa, M., Goto, S., Kawashima, S., Nakaya, A.: The KEGGdatabases at GenomeNet. Nucleic Acids Research 30(1), 42–46 (2002)
17. Tomii, K., Kanehisa, M.: Analysis of amino acid indices and mutationmatrices for sequence comparison and structure prediction of proteins.Protein Engineering 9(1), 27–36 (1996). PMID: 9053899
18. Chenna, R., Sugawara, H., Koike, T., Lopez, R., Gibson, T.J., Higgins,D.G., Thompson, J.D.: Multiple sequence alignment with the clustalseries of programs. Nucleic acids research 31(13), 3497–3500 (2003)
19. Prabhakaran, M.: The distribution of physical, chemical andconformational properties in signal and nascent peptides. Biochem. J.269(3), 691–696 (1990)
20. Bodenmiller, B.: Amino acid colour schemes (2006).http://www.bioinformatics.nl/˜berndb/aacolour.htmlAccessed 2014-03-14
21. Enderton, E., Sintorn, E., Shirley, P., Luebke, D.: Stochastictransparency. IEEE Transactions on Visualization and ComputerGraphics 17(8), 1036–1047 (2011)
22. Bostock, M., Ogievetsky, V., Heer, J.: D3: Data-driven documents. IEEETransactions on Visualization and Computer Graphics 17(12),2301–2309 (2011)
23. Brocchieri, L., Karlin, S.: Protein length in eukaryotic and prokaryoticproteomes. Nucleic Acids Research 33(10), 3390–3400 (2005). PMID:15951512

Mercer et al. Page 7 of 6
List of Figures1 The annotated Mu-8 interface showing how characteristics of a defective protein compare to its functional
family. . . . . . . . . . . . . . . . . . . . . . . . . . . . . . . . . . . . . . . . . . . . . . . . . . . . . . 82 Filtering of c-scores between ´0.5 and ´2 for the alpha helix & turn propensity characteristic. An example
of how such a score is mapped to the sequence is shown on the right. . . . . . . . . . . . . . . . . . . . . 93 Stacked bars compared to aligned bars for several residues. . . . . . . . . . . . . . . . . . . . . . . . . . 104 The residues in the focus region are within the specified distance of three adjacent residues further down
the sequence, as illustrated by the black arcs. To reduce visual clutter, we replace the arcs connectingindividual residues with chords (shown in gray) that connect proximate regions. . . . . . . . . . . . . . . 11
5 3D all atom visualization of the folded protein. The structure is linked to the sequence by color-coding theresidues that are currently in the focus region of the sequence view. . . . . . . . . . . . . . . . . . . . . . 12
Mercer et al. Page 8 of 6
-3 -2 -1 0 1 2 30%
10%
20%
30%
40%Alpha Helix & Turn Propensity
-3 -2 -1 0 1 2 30%
10%
20%
30%
40%Beta Sheet Propensity
-3 -2 -1 0 1 2 30%
10%
20%
30%
40%Composition
-3 -2 -1 0 1 2 30%
10%
20%
30%
40%Hydrophobicity
-3 -2 -1 0 1 2 30%
10%
20%
30%
40%Physico-Chemical Properties
-3 -2 -1 0 1 2 30%
10%
20%
30%
40%Other Characteristics
0
2
4
6
8
-8
-6
-4
-2
0K A L L A G L G D E W K N V V
147 148 149 150 151 152 153 154 155 156 157 158 159 160 161 162 0 5 10 15 20 25 30 35 40 45Distance (Unit: Angstrom)
0%
2%
4%
6%
8%0 5 10
Auto rotate Stacked
Select All Clear
M A R T P F V G G N W K M N G T K A E A K E L V E A L K A K L P D D V E V V V A P P A V Y L D T A R E A L K G S K I K V A A Q N C Y K E A K G A F T G E I S P E M L K D L G A D Y V I L G H S E R R H Y F G E T D E L V A K K V A H A L E H G L K V I A C I G E T L E E R E A G K T E E V V F R Q T K A L L A G L G D E W K N V V I A Y E P V W A I G T G K T A T P E Q A Q E V H A F I R K W L A E N V S A E V A E S V R I L Y G G S V K P A N A K E L A A Q P D I D G F L V G G A S L K P E F L D I I N S R NK A L L A G L G D E W K N V V
10 20 30 40 50 60 70 80 90 100 110 120 130 140 150 160 170 180 190 200 210 220 230 240
Score Histograms
ProximityChords
3DStructure
Focus Sequence
ContextSequence
Sequence Proximity
Histogram
ConservationHeat Map
Figure 1 The annotated Mu-8 interface showing how characteristics of a defective protein compare to its functional family.
Mercer et al. Page 9 of 6
4
2
0
0
-2
-4
Alpha Helix & Turn Propensity
M A R T
-3 -2 -1 0 1 2 30%
10%
20%
30%
40%
Figure 2 Filtering of c-scores between ´0.5 and ´2 for the alpha helix & turn propensity characteristic. An example of how such ascore is mapped to the sequence is shown on the right.

Mercer et al. Page 10 of 6
0
2
1
-2
0
-1
M A R0
2
4
6
-6
-4
-2
0M A R
Figure 3 Stacked bars compared to aligned bars for several residues.
Mercer et al. Page 11 of 6
M A R T P F V G GFigure 4 The residues in the focus region are within the specified distance of three adjacent residues further down the sequence, asillustrated by the black arcs. To reduce visual clutter, we replace the arcs connecting individual residues with chords (shown in gray) thatconnect proximate regions.
Mercer et al. Page 12 of 6
Figure 5 3D all atom visualization of the folded protein. The structure is linked to the sequence by color-coding the residues that arecurrently in the focus region of the sequence view.