much ado about emission modeling
TRANSCRIPT

Much ado about emission modeling …
Sigh no more, [colleagues], sigh no more,[Emissions] were deceivers ever,One foot in sea and one on shore,
To one thing constant never.*
*w/ apologies to Wm. Shakespeare, from Much Ado About Nothing.
T. PierceAtmospheric Modeling Division/NOAA
U.S. EPA/Office of Research and DevelopmentResearch Triangle Park, North Carolina

Much ado about emission modeling support and research …
• AMD’s role: To obtain the best available emission estimate data for regional air quality modeling; to improve these estimates by building emission models that account for meteorological conditions; and, to develop innovative ways of evaluating emissions.
• AMD staff: W. Benjey, T. Pierce, G. Pouliot (w/ contributions from J. Ching, D. Gillette, A. Gilliland, G. Gipson, P. Bhave, and J. Godowitch)
• Outside collaborators: EPA/OAQPS, EPA/ORD, RPOs, States/EIIP, CSC, USFS, IGAC/GEIA, Environment Canada, NCAR, and university researchers.
• Selected R&D areas: SMOKE, geographical data files, air quality forecasting, biogenic emissions, sea salt, fugitive dust, and NH3 inverse modeling

EPA’s National Emissions Inventory
PreliminaryNEI for Base Year 20XX
States & Other
Stakeholders
Improved NEI for Base Year 20XX
Local Activity
Levels & Variables
Factorand Model
Improvements
Defaults for Emissions
Related Variables
Databases for Source
Activity Levels
Existing Point Source
Data
Growth Factors for
Some Categories
Emission Factors and
Models
Refining & ImprovingInputs(Process Repeated Yearly - Emphasized every 3 Years)
Starting Point for NEI
Emissions Processor
(eg SMOKE)
Input to AQ Model
State / Local / Tribe Improvements
Speciationfactors
Speciationfactors
AMD’s role
Courtesy T. Pace (EPA/OAQPS)

Much ado about emission modeling …
Purpose:
• to report on emission focus areas w/in AMD• to suggest topics for future research• to encourage collaboration
Outline:
• Ammonia• Biogenic emissions• Fugitive dust• Air quality forecasting• Wildfires

Much ado about ammonia emissions …
• 1994 – Battye et al., Development and selection of ammonia factors (EPA work assignment, W. Benjey)
• 1999 – Pierce and Bender, Examining the temporal variability of ammonia and nitric oxide emissions from agricultural processes (www.epa.gov/asmdnerl/awma_ei99.pdf)
• 2000 – CMU NH3 emissions model (www.cmu.edu/ammonia)
• 2003 – Gilliland et al., Seasonal NH3 emission estimates for the eastern United States based on ammonium wet concentrations and an inverse modeling method, J. Geophys. Res., 108 (D15), 4477, doi:10.1029/2002JD003063.
• 2004 – National Emission Inventory - Ammonia Emissions from Animal Husbandry Operations, Draft Report (www.epa.gov/ttn/chief/net/2002inventory.html)
• 2004 – Battye and Barrows, Review of ammonia emission modeling techniques for natural landscapes and fertilized soils, Draft Report (avblfor review at www.epa.gov/ttn/chief)
Much ado about ammonia emissions …
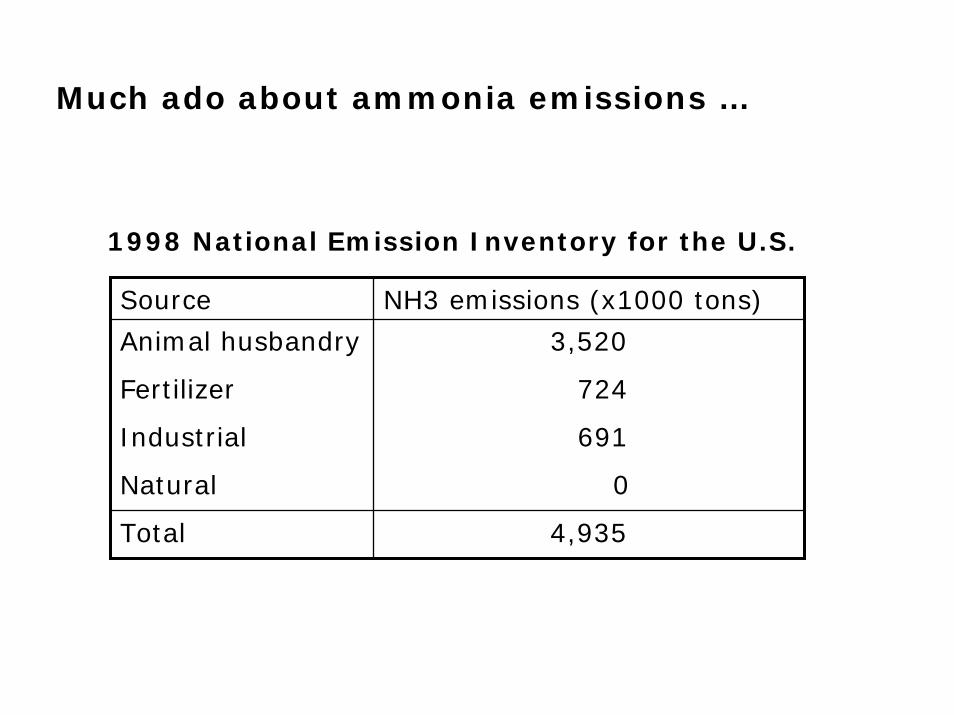
1998 National Emission Inventory for the U.S.
Source NH3 emissions (x1000 tons)
Animal husbandry 3,520
Fertilizer 724
Industrial 691
Natural 0
Total 4,935

National Emission Inventory - Ammonia Emissions from Animal Husbandry Operations, Draft Report (2004)
33% reduction in NH3 emissions

Review of Ammonia Emission Modeling Techniques for Natural Landscapes and Fertilized Soils, Draft Report
Recommended Default Emission Factors for Natural Landscapes
Vegetation
Emissionfactors
(ng m-2 s-1)
Estimated emissions incontinentalUS (Gg/yr)
Forests 1.2 58
Grasslands 0.9 32
Shrublands 1.3 46
Deserts 0.3 <1
Total 137
=> ~5% of total U.S. inventory

Review of Ammonia Emission Modeling Techniques for Natural Landscapes and Fertilized Soils, Draft Report
Proposed temporal adjustment factors for NH3 emissions from natural landscapes
Proposed seasonal
allocation:Spring = 0.143
Summer = 0.714Autumn = 0.143Winter = 0.000

Review of Ammonia Emission Modeling Techniques for Natural Landscapes and Fertilized Soils, Draft Report
Proposed temporal adjustment factors for NH3 emissions from fertilized soils
Proposed seasonal
allocation:Use CMU’s county-
wide, monthly values

Much ado about biogenic emissions …
• Biogenic Emissions Inventory System (BEIS): – introduced by AMD in 1988 to estimate VOC emissions
from vegetation and NO emissions from soils
• BEIS3.09:– current default version used for regulatory modeling– 1-km vegetation database (BELD3) – emission factors for isoprene, monoterpenes, OVOCs,
and nitric oxide (NO) – environmental corrections for temperature and solar
radiation (isoprene only) – speciation factors for the CBIV, RADM2, and SAPRC99
mechanisms

Much ado about biogenic emissions …
• BEIS3.12:– current research version of CMAQ and in 2001 NEI– emission factors for 34 chemicals, including 14
monoterpenes and methanol– MBO, methanol, isoprene modulated by solar radiation – soil NO dependent on soil moisture, crop canopy
coverage, and fertilizer application– avbl as a module to SMOKE and can be downloaded
from www.epa.gov/asmdnerl/biogen.html

Creating Gridded Vegetation Data for the Biogenic Emissions Landuse Database (BELD3)
USGS North AmericanLand Characteristics Data
(1 km, 21 broad classes, satellite-derived)1990 US Census
(urbanized boundaries)1992 US
Agricultural Census(county-level)
Assign urban/rural/water identifier (1-km grid)
Assign crop areas to 1-km grid cells in a county, using
USGS class and urban/rural IDs
Derive crop species distribution and total
crop area (county-level)
Assign forest areasto 1-km grid cells
Zhu & Evans (1994)US forest density data(1 km, satellite-derived)
Assign tree species distribution to
1-km grid forest areas
BELD3 – a 1-km hybrid dataset with crop types, tree species,
urban/rural IDs,and 19 USGS classes
Develop tree species distribution
within county
US Forest Inventory and Analysis (FIA) data
(county-level, 300,000 survey plots)

USGS_drycropUSGS_irrcropUSGS_cropgrassUSGS_cropwdlndUSGS_grasslandUSGS_shrublandUSGS_shrubgrassUSGS_savannaUSGS_decidforesUSGS_evbrdleafUSGS_coniferforUSGS_mxforestUSGS_waterUSGS_wetwoodsUSGS_sprsbarrenUSGS_woodtundrUSGS_mxtundraUSGS_snowiceUSGS_urbanAlfalfaBarleyCornCottonGrassHayMisc_cropOatsPasturePeanutsPotatoesRiceRyeSorghumSoybeansTobaccoWheatAcaciaAilanthusAlderApple
AshBasswoodBeechBirchBumelia_gumCajeputCalifor-laurelCascara-buckthorCastaneaCatalpaCedar_chamaecypCedar_thujaChestnut_buckeyChinaberryCypress_cupressCypress_taxodiuDogwoodDouglas_firEast_hophornbeaElderElmEucalyptusFir_balsamFir_CA_redFir_corkbarkFir_fraserFir_grandFir_nobleFir_Pacf_silverFir_SantaLuciaFir_Shasta_redFir_sppFir_subalpineFir_whiteGleditsia_locusHackberryHawthorn
HemlockHickoryHolly_AmericanHornbeamIncense_cedarJuniper KY_coffeetreeLarch Loblolly_bayMadroneMagnoliaMahoganyMaple_bigleafMaple_bigtoothMaple_blackMaple_boxelderMaple_FLMaple_mtnMaple_NorwayMaple_redMaple_RkyMtnMaple_silverMaple_sppMaple_stripedMaple_sugarMesquiteMisc-hardwoodsMixed_coniferMountain_ashMulberryNyssaOak_AZ_whiteOak_bearOak_black Oak_blackjackOak_blueOak_bluejackOak_burOak_CA_black
Oak_CA_liveOak_CA_whiteOak_canyon_liveOak_chestnutOak_chinkapinOak_delta_postOak_DurandOak_EmeryOak_EngelmannOak_evergreenOak_GambelOak_interio_livOak_laurelOak_live Oak_MexicanblueOak_Northrn_pinOak_Northrn_redOak_nuttallOak_OR_whiteOak_overcupOak_pinOak_postOak_scarletOak_scrubOak_shingleOak_Shumrd_redOak_silverleafOak_Southrn_redOak_sppOak_swamp_cnutOak_swamp_redOak_swamp_whiteOak_turkeyOak_waterOak_whiteOak_willowOsage-orangePaulowniaPawpaw
PersimmonPine_ApachePine_AustrianPine_AZPine_BishopPine_blackjackPine_brstlconePine_chihuahuaPine_CoulterPine_diggerPine_EwhitePine_foxtailPine_jackPine_JeffreyPine_knobconePine_limberPine_loblollyPine_lodgepolePine_longleafPine_MontereyPine_pinyonPine_pinyon_brdPine_pinyon_cmnPine_pitchPine_pondPine_ponderosaPine_redPine_sandPine_scotchPine_shortleafPine_slashPine_sprucePine_sugarPine_SwwhitePine_tablemtnPine_VAPine_WashoePine_whitebarkPine_Wwhite
Pine_yellowPopulusPrunusRedbayRobinia_locustSassafrasSequoiaServiceberrySilverbellSmoketreeSoapberry_westrSourwoodSparkleberrySpruce_blackSpruce_blueSpruce_BrewerSpruce_EnglemanSpruce_NorwaySpruce_redSpruce_SitkaSpruce_sppSpruce_whiteSweetgumSycamoreTallowtree-chinsTamarixTanoakTorreyaTung-oil-treeUnknown_treeWalnutWater-elmWillowYellow_poplarYellowwoodYucca_Mojave
BELD3 – 229 vegetation classes
tree species/genera (FIA)
Cro
p ty
pes
(USD
A)
USG
S cl
asse
s

BEIS3 - Improved spatial resolution
BEIS2/BELD2 BEIS3/BELD3

BEIS3 – Chemical species
34 chemical speciesisoprene ethene
methyl-butenol propene
a-pinene ethanol
b-pinene acetone
d3-carene hexanal
d-limonene hexenol
camphene hexenylacetate
myrcene formaldehyde
a-terpinene acetaldehyde
b-phellandrene butene
sabinene ethane
p-cymene formic acid
ocimene acetic acid
a-thujene butenone
terpinolene carbon monoxide
g-terpinene ORVOCs
methanol nitric oxide

0
50000
100000
150000
200000
250000
300000
350000
400000
450000
Jan-01 Feb-01 Mar-01 Apr-01 May-01 Jun-01 Jul-01 Aug-01 Sep-01 Oct-01 Nov-01 Dec-01
Date
VOC
(met
ric to
nsC
/day
)
B309 B312 Isoprene
Comparison of BEIS3.09 v BEIS3.12 for 2001 Domain total emissions
Animation of isoprene

Comparison of BEIS3.09 v BEIS3.12 for 2001 Domain total emissions
0
500
1000
1500
2000
2500
3000
3500
4000
Jan-01 Feb-01 Mar-01 Apr-01 May-01 Jun-01 Jul-01 Aug-01 Sep-01 Oct-01 Nov-01 Dec-01
Date
NO
tons
/day
B309 B312 Animation of NO

Comparison of BEIS3.09 v BEIS3.12 for 2001 Domain total emissions (103 metric tons)
Compound BEIS3.09 BEIS3.12 % change
Soil NO 467
50,320
22,141
+30%
Total VOC
609
48,365 -4%
Isoprene 22,141 0%

The latest modeling “crisis” – high biogenic organic aerosol concentrations in the northwestern U.S. …
Are the monoterpene emission factors too high?
Preliminary CMAQ modeling plots

BEIS3.12 -- Change in the monoterpene emission factor for spruce and fir from 2.6 ug/g-hr to 1.5 ug/g-hr

Example for Lassen County, California – Effect of changing the monoterpene emission factor for spruce and fir from 2.6 ug/g-hr to 1.5 ug/g-hr
Tree type Fraction B3.12 efac(ug/m2-hr)
B3.13 efac(ug/m2-hr)
Jeffrey pine 0.29 1820 1820
Ponderosa pine 0.28 1820 1820
White fir 0.22 3900 2250
Lodgepole pine 0.05 1820 1820
Incense cedar 0.04 132 132
Calif. red fir 0.04 3900 2250
Calif. blk oak 0.01 86 86
Juniper 0.01 371 371
Oreg. wht oak 0.01 86 86
Douglas fir 0.01 3900 2250
Total/Wtd avg 0.97 2265 1800
=> Changing efac for spruce & fir lowered monoterpene emissions by ~20%

Much ado about biogenic emissions …
• Proposed future priorities:
Examine climatic adjustments of monoterpene emissions and evaluate flux estimates w/ field data
Incorporate isoprene seasonality
Combine the BEIS3 and the WRF-Chem/MEGAN platforms

Much ado about fugitive dust emissions…
• Fugitive dust emissions tend to be overestimated in atmospheric transport models (Gillette, 2001, www.wrapair.org/forums/dejf/documents/).
• Dr. Shan He has developed an wind blown dust algorithm for CMAQ based on the work of Gillette. The algorithm uses threshold friction velocity parameterizations and incorporates gridded databases of soil type, surface soil moisture content, meteorology, and vegetation. It also estimates the interceptionof dust particles by vegetation. Unfortunately w/ Shan’s departure, this effort is “collecting dust”.
• G. Pouliot has been working on an improved algorithm for other fugitive dust sources.

Proposed Fugitive Dust Emission Model
CMAQMM5
MCIP
Aerosol
Fugitive Dust Emission
Windblown Dust Road Dust
Paved Road Dust
Unpaved Road Dust
)uu(ugkAF 2t
2*** −
ρ=
EF = 0.016(SL/2)0.65(W/3)1.5
EF = 2.6(SC/12)0.8(W/3)0.4(M/0.2)-0.3
thresholdfrictionvelocitysoil moisture
soil texture/landuse data
frictionvelocity
area of dust source
roughnesslength of soil
silt loading/silt contenton road surface
fleet average vehicle weight
moisture ofroad surface
gridded road coverageroad type data
griddedVMT data
Local scale dust fluxRegional scale vertical flux
KVV
mm
d
d
horizontal
vertical 1 +−==Φ
frictionvelocity
surfacewind
depositionvelocity
landusedata
county levelVMT data
androad coverage
spatialtemporalallocation
Courtesy of Dr. Shan He

Windblown Fugitive Dust Emissions Estimated with the “He” Algorithm

Fugitive Dust Emissions from Unpaved Roads
Current method Proposed method
Does not account for removal by vegetation
Incorporate transport fraction developed by Dr. Shan He
FHWA road mileage TIGER data to grid unpaved roads from county data
Uses monthly rainfall from a single station in a state
Simulate the moisture content of the road surface using griddedsolar radiation, dew point, wind speed and rainfall data.
Based on published AP-42 methodology and used in EPA’s NEI.
Status: Unpaved road data have been gridded and the emissions algorithm will be tested later in 2004.

Much ado about wildland fire emissions …
• Current 2001 inventory includes monthly estimates by state
• For 2002, the RPOs are producing an event-based, location-specific inventory
• With support from OAQPS and EIIP, an IAG is being established w/ USFS to integrate BlueSky into SMOKE:
will provide framework for producing model-ready emissions from wildfires
will include updated fuel characteristics
will need support for plume rise and vertical allocation

BlueSky is a working system developed by the USFS for forecasting smoke from prescribed burns and wildfires. It has many of the components needed for an emissions module to CMAQ/SMOKE. (www.blueskyrains.org)
Actual simulation from the BlueSky system

Much ado about wildland fire emissions …
• Proposed future priorities:
Include RPO inventory as soon as practical for 2002 CMAQ simulations
Integrate BlueSky into SMOKE and evaluate CMAQ model performance

Much ado about AQ forecast emissions …
• Work performed by G. Pouliot
• Priorities for 2004:
Incorporate and streamline Mobile6 calculations
Account for significant reductions in electrical generating unit (EGU) NOx emissions

Emissions for air quality forecasting – using simple regression to account for hourly temperature effects in Mobile6
Comparison of VOC emissions from Mobile6 vs. NLSQ regression across the NE AQ forecast domain for
August 4, 2003

Emissions for air quality forecasting – change in NOxEGU emissions from 2001 to 2004
-22%
-10%
-21%
-43%
-45%
-20%
Source:www.eia.doe.gov/oiaf/aeo/supplement/
Note: according to the 1998 NEI, electric utilities contributed ~25% of NOxemissions

Much ado about AQ forecast emissions …
• Proposed future priorities:
Adjust EGU emissions as a function of predicted temperature (based on analysis of existing CEM data)
Incorporate satellite-derived wildfire emissions
Perform sensitivity analysis of the effect of emission changes resulting from voluntary control measures

Much ado about emission modeling…
Then sigh not so, but let them [emissions] go,And be you blithe and bonny,
Converting all your sounds of woeInto hey nonny, nonny.*
*w/ apologies once again to Wm. Shakespeare, from Much Ado About Nothing.
Disclaimer: This work has not been reviewed by EPA and may not reflect official Agency policy.