“muddy waters - amazon web...
TRANSCRIPT

MURKY WATERS:Farm Pollution Stalls Cleanup of Iowa Streams
by Craig Cox, EWG Senior Vice-President for Agriculture and Natural Resources andAndrew Hug, EWG Analyst
www.ewg.org 1436 U Street NW, Suite 100 Washington, DC 20009
ENVIRONMENTAL WORKING GROUPDECEMBER 2012
Photo by NRCS

ENVIRONMENTAL WORKING GROUP 2
www.ewg.org /// December 2012
Table of Contents
Executive Summary ...................................................................................................................................3
Full Report ................................................................................................................................................8
Introduction ....................................................................................................................................................................8
Environmental Working Group’s Analysis ....................................................................................................................8
Stream Water Quality is Chronically Poor ....................................................................................................................9
No Improvement Since 1999 ......................................................................................................................................12
Nutrient Overload is the Biggest Problem ................................................................................................................14
Business As Usual Will Not Improve Iowa’s Water ....................................................................................................17
Iowa Policy Misses the Mark .......................................................................................................................................19
It Doesn’t Have to be This Way ..................................................................................................................................25
Appendix A: What is the Iowa Water Quality Index? ..................................................................................33
Appendix B: Trends in Individual Pollutants and Indexes ...........................................................................37
Appendix C: Statistical Analysis for the Iowa Water Quality Index ..............................................................39
Appendix D: Full Text of the Iowa Water and Land Legacy Amendment .....................................................47
References ..............................................................................................................................................48
AcknowledgmentsThe authors would like to thank Karl Pazdernik of Iowa State University for running statistical analyses on these
datasets and explaining the statistical tests. We would also like to thank Richard Langel of the Iowa Geological
Survey Bureau for providing the raw data and answering numerous questions about it; Jill Sherwood and Robin
McNeeley of the Iowa State University GIS Lab for early GIS analyses, and Mary Skopec of the Iowa Geological
Survey for her review of the science.
We would also like to thank EWG colleagues past and present: Soren Rundquist for his extensive GIS work
and assistance organizing data, Brett Lorenzen for finding data, Olga Naidenko for her encouragement and
research, Taylan “Ty” Yalniz for the excellent layout and especially Nils Bruzelius for his thorough editing.
We also thank a great many others in the state who provided data, success stories or helped with
interpretation of data. We thank all of you for your commitment to improving the quality of Iowa’s waters.

MURKY WATERS: FARM POLLUTION STALLS CLEANUP OF IOWA STREAMS3
Murky Waters: Farm Pollution Stalls Cleanup of Iowa StreamsBy
Craig Cox, EWG Senior Vice President for Agriculture and Natural ResourcesAndrew Hug, EWG Analyst
EXECUTIVE SUMMARYForty years after the Clean Water Act became law,
the data are clear: Iowa’s rivers and streams are still
murky. The pollution that continues to degrade them
has become a case study on the consequences of
the most serious flaw in this historic and otherwise
effective federal law: It does little or nothing to
address agricultural pollution.
Chronic Poor Water Quality An EWG analysis shows that from 2008 to 2011, water
quality was rated “poor” or “very poor” at 60 percent
of the 98 stream segments monitored by the Iowa
Water Quality Index. The Index, produced by the Iowa
Department of Natural Resources (IDNR), uses data
from a stream-monitoring network created in 1999 to
provide objective measures of how the state’s free-
flowing waterways are faring. EWG’s analysis found
that none of the sites had “excellent” water quality
Figure 2: Location and Average Condition of 83 Iowa Stream Segments, 2008-2011

ENVIRONMENTAL WORKING GROUP 4
www.ewg.org /// December 2012
during the most recent 36-month period studied, and
only one was rated “good.”
During the summer months, when Iowans flock to
enjoy the outdoors, the Index ratings paint an even
grimmer picture. Year after year, from May through
August, the rankings of many more streams fall into
the “very poor” or “poor” categories.
During the three summers between 2009 and 2011,
fully 80 percent (66 of 83 sites with complete data)
had average ratings of “very poor” (7) or “poor”
(59). That was 32 percent more than the year-round
averages for those years, because comparatively
better wintertime scores tend to offset the very bad
scores of summer. The number of monitored streams
rated “fair” dropped in half during summer months,
to just 16, and only one held on to its “good” rating.
The two pollutants most responsible for poor
water quality ratings in the Index are nitrogen and
phosphorus. In 55 percent of the monthly samples
across all sites, nitrogen was the single worst
pollutant, followed by phosphorus in 30 percent.
Together, high levels of nitrogen and phosphorus set
off a cascade of pollution problems that contaminate
drinking water and damage the health of Iowa’s
streams and rivers.
Water Quality: Not Getting Better
EWG’s analysis found no evidence that Iowa’s water
quality has improved since 1999. To account for
variations in weather and stream flow, we averaged
the ratings for the 36 months from October 1999 to
September 2002 and compared them to the average
ratings for the most recent 36 months (October 2008
through September 2011). Of the 72 sites that have
36 months of data for both periods, the number of
stream segments rated “good” dropped from three
to one, while the number rated “fair” increased from
0
10
20
30
40
50
2008-20111999-2002
Very PoorPoorFairGoodExcellent
Figure 5: Water Quality Index Ratings for 72 Monitoring Sites

MURKY WATERS: FARM POLLUTION STALLS CLEANUP OF IOWA STREAMS5
23 to 26. The number rated “poor” was unchanged at
43, and the number rated “very poor” dropped from
three to two.
Over the entire 12-year period, the condition of 16
sites improved, but 15 worsened. Only one – a site
initially rated “good” that declined to “poor” –
improved or worsened by more than one rank. The
ratings of 41 out of 72 sites (57 percent) showed no
change at all.
Worse yet, a statistical analysis of trends over the past
12 years predicts that Iowa’s overall water quality will
still be poor 10 years from now, given business as
usual. Fifty percent (36) of the 72 stream segments
analyzed will be in “poor” or “very poor” condition
in 2021, compared to 51 percent (37) today. There
still will be no stream segments ranked “excellent.”
Only two stream segments (3 percent) will be ranked
“good,” the same as today.
Overall, water quality in 68 percent of the monitored
stream segments is either declining or stable. At
those sites where the statistics show a positive trend,
the improvement is so slow that there will be little
change over the next ten years.
Iowa Is Missing the MarkAccording to the Iowa Department of Natural
Resources, fully 92 percent of the nitrogen and 80
percent of the phosphorus – the two pollutants most
responsible for the poor condition of the waterways
that the Index monitors – come from non-point
sources. Only 8 percent of the nitrogen and 20
percent of the phosphorus come from “municipal
and industrial discharges.” Yet Iowa’s water quality
regulation almost exclusively targets municipal and
industrial discharges, while agricultural runoff remains
largely unregulated.
Instead, Iowa relies on farm owners and operators
to take voluntary measures to reduce pollution, and
taxpayers pick up much of the cost. Iowa’s towns,
cities and industries don’t have that choice. Under
the federal Clean Water Act, they have been required
to take often-expensive action to
reduce pollution since 1977.
To make matters worse, the already
inadequate funding for programs
that pay farmers to take action to
reduce their pollution is shrinking.
Funding for the five programs that
provide most of the money totaled
2011 2021
Number Percent (%) Number Percent (%)
Very Poor 6 8 5 7
Poor 31 43 31 43
Fair 33 46 34 47
Good 2 3 2 3
Excellent 0 0 0 0
Total 72 100 72 100
Table 2: Iowa water quality will still be poor in 10 years

ENVIRONMENTAL WORKING GROUP 6
www.ewg.org /// December 2012
only $11.5 million in fiscal year 2013, 23 percent below
the $14.9 million in fiscal year 2002.
It Doesn’t Have To Be This WayIowa’s rivers and streams can be clean, but only
if Iowans take concerted action to reduce the
nitrogen and phosphorus overload from agricultural
operations. The good news is that experience and
science make it clear that concerted action does
result in major improvements.
Iowa’s voluntary programs could work much better
if they were revamped to be more effective and
were provided with a larger and more secure source
of funding. The governor and the legislature must
act to implement the Iowa Land and Water Legacy
amendment endorsed by 63 percent of Iowans in
2010. The state’s citizens voted to tax themselves to
provide funding to clean up their water. It is time for
Iowa’s politicians to follow through. The Department
of Agriculture and Land Stewardship must revamp the
way voluntary programs are implemented to increase
accountability, target resources to the right places,
monitor and report on the farming and conservation
practices used by farmers and make use of highly
trained professionals to advise producers and make
programs work.
Revamping the way conservation programs are
implemented will produce better results more quickly.
But even the most focused and best-managed
voluntary programs will not be sufficient to solve the
water quality problems associated with agricultural
production if they remain entirely voluntary. More
money will help, but even massive increases in
funding will not overcome the inherent weaknesses of
relying solely on voluntary action.
It is time to face facts – decades of working only
with farmers who volunteer to reduce their polluted
runoff has not achieved any overall improvement
in Iowa’s streams and rivers. This report shows that
40 years of the voluntary approach have failed to
improve nitrogen and phosphorus pollution. EWG’s
2011 report, “Losing Ground,” similarly showed that
80 years of the voluntary approach had failed to
adequately reduce pollution from sediment flowing
off farm fields. The state must put in place smart and
narrowly targeted regulations that curb poor farming
practices. Regulations should phase out particularly
risky practices such as planting crops right up to
stream banks or allowing livestock unmanaged access
to streams. Landowners and managers should be
expected to control the ephemeral gully erosion that
creates a direct pipeline for mud, fertilizer and manure
flowing into streams and rivers. Many, if not most,
farmers would agree that these activities are simply
bad business practice and bad for agriculture’s brand.
Since the boom in corn and soybean prices, simply
driving across Iowa provides compelling evidence
that voluntary programs must be buttressed with
smart regulation to ensure that proper conservation

MURKY WATERS: FARM POLLUTION STALLS CLEANUP OF IOWA STREAMS7
practices don’t lapse. Conservation will have to
become far more durable for there to be any hope of
cleaning up Iowa’s streams and rivers.
Such regulations would establish a basic standard
of care that comes along with the rights of land
ownership. Voluntary programs can then be used to
support those landowners and managers who meet
these basic standards and want to do still more to
clean up Iowa’s rivers and streams.
Precisely targeted regulation coupled with a
strengthened voluntary program would set Iowa on
a path toward cleaner water for our children and
ourselves.

ENVIRONMENTAL WORKING GROUP 8
www.ewg.org /// December 2012
FULL REPORT
IntroductionForty years after passage of the federal Clean
Water Act triggered a nationwide cleanup of
many of America’s most polluted rivers, lakes and
harbors, agricultural pollution remains a national
embarrassment. The reason is simple. The Clean
Water Act specifically exempted the fertilizer,
chemicals and sediment that flow from farmland –
often because of poor conservation practices – from
the law’s reach. While industry, sewage treatment
plants, storm water drainage systems and other
clearly identifiable sources of pollution have steadily,
if slowly, been forced to comply with the law and stop
dumping untreated waste in the nation’s waterways,
agriculture has faced no such requirements. Various
federal and state programs have used financial and
other incentives to encourage farms to clean up, but
participation is entirely voluntary. The results, as this
report shows, were predictable. Today, agricultural
pollution is the greatest threat to water quality in
the nation, and signs of progress are limited. From
Chesapeake Bay to the Mississippi Basin to San
Francisco Bay, runoff from agriculture fouls waterways,
kills aquatic life and renders vast water bodies unsafe
for recreation, fishing and drinking.
This report presents the results of EWG’s analysis of
12 years of water quality monitoring conducted by
the Iowa Department of Natural Resources (IDNR).
In 2005, the department created the Iowa Water
Quality Index to provide an objective measure of the
condition of Iowa’s streams. The Index is based on
monthly water quality data from 98 stream-monitoring
sites across the state. The water quality ratings are
calculated from measurements of nine water quality
parameters at each site [See Appendix A for details
about the Index].
Taken together, the 12 years of data reflect a
history of paralysis and inaction in Iowa, one that is
almost certainly reflected in the majority of heavily
agricultural areas across the nation. Water quality in
the monitored streams is overwhelmingly fair, poor or
very poor. It is rarely “good” and never “excellent.”
The passage of time has produced virtually no overall
improvement, and statistical forecasts indicate that
with business as usual, nothing will change over the
next decade. But it doesn’t have to be this way.
Environmental Working Group’s AnalysisEWG researchers used Index water quality monitoring
data to ask three main questions:
1. How clean are Iowa’s streams and rivers today?
2. Is water quality getting better, worse or staying
the same?
3. What will Iowa’s water quality look like in 2021
given current trends?
We also looked at what Iowa has done over the past

MURKY WATERS: FARM POLLUTION STALLS CLEANUP OF IOWA STREAMS9
decade to clean up its water.
The answers we found paint a disturbing picture of
Iowa’s water quality today and in the future unless
concerted action is taken to reduce polluted runoff
from agricultural operations.
Stream Water Quality is Chronically PoorTo account for variations in weather and stream flow,
the Environmental Working Group averaged the
Water Quality Index data for two 36-month periods
– from October 1999 to September 2002 and from
October 2008 through September 2011 – for 83 sites
on 52 streams that had a complete set of data for
those two periods.i
That calculation showed that on average, 60 percent
of the sites (50 stream segments) were in either
“poor” or “very poor” condition. Thirty-two segments
(39 percent) were rated “fair.” No stream segment
was rated “excellent,” and only one was rated
“good” (Figure 1).
The only site that achieved an overall rating of
“good” is on the Chariton River between Rathbun
Lake and Centerville in far south central Iowa, where
a number of unique factors apparently combine to
produce good quality water. Only 38 percent of the
land in the watershed draining to this site is planted
in row crops, compared with an average of 64 percent
elsewhere in Iowa. The watershed also has far more
land covered in grass, hay and forest than most of the
state. Such perennial vegetation dumps less nitrogen,
phosphorus and sediment into streams than do row
crops. However, even such land use differences are
Excellent (0%)
Good (1%)
Fair (39%)
Poor (58%)
Very Poor (2%)
Figure 1: Average Condition of Iowa Streams, 2008 to 2011
i. Due to budget issues DNR took no water quality samples for six months beginning in the fall of 2008. In order to obtain a complete data set of three years, with all seasons represented equally, EWG included data from the same months beginning in the fall of 2007. Two monitoring sites included by DNR in the first three years were not included in the last three years because even with the data supplementation described above, one had only 18 months and the other only 24 months of data. Two sites not included by DNR in the last three years were included in the first three years because data collection at a small percentage of sites had been terminated for various reasons.

ENVIRONMENTAL WORKING GROUP 10
www.ewg.org /// December 2012
likely responsible for less than half of the site’s good
water quality – the lake itself likely accounts for most
of it. The monitoring site is only a few miles below
the lake, which like any riverine reservoir significantly
reduces the amount of sediment, phosphorus and
nitrogen in the water downstream.
Figure 2 shows the location and water quality rank
for each of the monitoring sites. Stream segments
ranked “poor” or “very poor” in the Index are found
everywhere in Iowa – the problem is not concentrated
in just a few geographic areas.
Iowa’s Water Quality is Far Worse in Summer
The Iowa Water Quality Index ratings get even worse
during the summer months, when Iowans are trying
to enjoy the outdoors. On average, far more streams
fall into the “very poor” or “poor” categories in May,
June, July and August.
During the three summers between 2009 and 2011,
fully 80 percent (66 streams) were rated “very poor”
(7) or “poor” (59) on average, 32 percent more than
the average for the full 36 months (Figure 3). That’s
because comparatively better wintertime scores tend
to offset the very bad scores of summer. The number
of monitored streams rated “fair” dropped in half, to
just 16 streams. One was in “good” condition both in
summer and year-round.
Comparing the State and Federal Water Quality Ratings
Under the federal Clean Water Act’s 303(d) process,
the Iowa Department of Natural Resources is required
to assess the condition of the state’s rivers and report
those considered “impaired,” which is defined as not
meeting the criteria for various specific uses.
The Department uses a scientific methodology to
identify impaired stream segments based on how
clean the water must be to support its designated
use.1 A stream segment with a designated use
of “primary contact recreation,” for example, is
considered impaired if a scientific assessment
Figure 2: Location and Average Condition of 83 Stream Segments, 2008-2011

MURKY WATERS: FARM POLLUTION STALLS CLEANUP OF IOWA STREAMS11
concludes that bacteria levels constitute an elevated
risk of swimmers becoming sick.
Iowa’s designated uses2 are divided into three
categories and eight sub-categories:
Recreational Designations
• Primary contact recreational use (e.g. swimming
and water skiing)
• Secondary contact recreational use (e.g. fishing
and shoreline activities)
• Children’s recreational use (e.g. wading or playing
in water)
Warm Water Aquatic Life Designations
• Supports a wide variety of aquatic life on large
rivers and larger stream segments
• Supports a resident aquatic community but not
necessarily game fish on smaller perennial streams
• Supports an aquatic community in harsh
conditions of intermittent streams
Cold Water Aquatic Life Designations
• Supports reproducing and non-reproducing trout
and associated communities
• Supports cold-water aquatic communities but
does not consistently support trout populations
The department currently lists 6,086 miles of the
state’s 26,000 miles of rivers as “impaired.” But most
streams have never undergone sufficient testing and
evaluation to classify them under the federal system.
For the Index, the department selected stream
segments for monitoring that reflected a
representative cross-section of Iowa’s streams and
rivers. In addition, some sites were chosen as matched
pairs to monitor pollution upstream and downstream
of urban areas, and some were selected because they
offered sampling histories that go back as far as 1986.
The Index sites were selected before the stream
segments were officially designated as impaired
by the Department under the Clean Water Act.
In fact, the resulting monitoring data provided
the information needed to officially make those
designations. As of now, 87 percent of the monitored
stream segments have been designated as impaired
(Figure 4). When an Iowa stream is properly
Excellent (0%)
Good (1%)
Fair (19%)
Poor (71%)
Very Poor (9%)
Figure 3: Average Condition of Iowa’s Streams in Summer, 2009-2011

ENVIRONMENTAL WORKING GROUP 12
www.ewg.org /// December 2012
monitored, some level of impairment is nearly always
found.
For the most part, the Water Quality Index ratings
track closely with the state agency’s designations of
impaired streams. However, four sites rated “poor”
by the Index are not among those listed as impaired
under the Clean Water Act process. The reason
is simple. Even though nitrogen and phosphorus
overload is the primary reason the Index rates
Iowa streams “poor” or “very poor,” the state has
no numeric standards for pollution by nitrogen,
phosphorus or sediment. As a result, those types of
contamination cannot be used to designate a stream
as impaired under federal law. Nevertheless, there
is a high correlation between the Index’s ratings
and the federal “impaired” designations – despite
the different criteria – because nutrient overload
usually triggers contamination or conditions such as
cyanobacteria blooms that meet the federal criteria
for designating a stream as impaired.
NO IMPROVEMENT SINCE 1999Comparing data from the first 36 months of the Index
condition ratings to the most recent 36 months shows
that there has been no meaningful change in stream
water quality since 1999. Of the 98 sites monitored by
the Index, 72 have 36 months of data for both 1999-
2002 and 2008-2011.ii
The number of stream segments rated “good”
dropped from three to one over the 12-year period
while the number rated “fair” increased from 23 to 26.
The number rated “poor” was unchanged at 43, and
Figure 4: Most Index Sites Are on Streams Designated as Impaired
ii. Due to budget constraints, DNR took no water quality samples for six months beginning in the fall of 2008. In order to obtain a complete data set for three years, with all seasons represented equally, EWG included the data for the same months from 2007 that were missing in 2008. Two sites included by DNR over the first three years were not included in the last three years because one had only 18 months of data and the other only 24 months. Two other sites included in the first three years were not included in the last three years because monitoring at those sites had been terminated.

MURKY WATERS: FARM POLLUTION STALLS CLEANUP OF IOWA STREAMS13
0
10
20
30
40
50
2008-20111999-2002
Very PoorPoorFairGoodExcellent
Figure 5: Index Stream Segments Show No Improvement in Condition Since 1999
the number rated “very poor” dropped from three to
two (Figure 5).
The same picture emerges from a site-by-site
assessment:
• Of the three sites that started out “very poor,”
one is unchanged and two improved to “poor.”
• Of the 43 sites that started out “poor,” 28 are
unchanged, 14 improved to “fair” and one
deteriorated to “very poor.”
• Of the 23 sites that started out “fair,” 11 are
unchanged but 12 fell to “poor.”
• Of the three sites that started out “good,” only
one held on to that ranking, one dropped to “fair”
and the third to “poor.”
• Since the creation of the Index, no site has ever
been rated “excellent.”
Overall during the 12-year period, the condition of
16 sites improved and 15 worsened. Only one – a
site initially rated as “good” that declined to “poor”
– improved or worsened by more than one rank.
The ratings of 41 out of 72 sites (57 percent) did not
change.
The summer ratings paint a slightly better, but
still disappointing, picture. The number of stream
segments rated “very poor” or “poor” dropped by
eight, from 66 to 58, while the number rated “fair”
increased from five to 12. One site was rated “good”
on average through all of the last three summers
(2008-2011). None were rated in good condition
during all of the first three summers (2000-2002)
(Figure 6).
0
10
20
30
40
50
60
Very PoorPoorFairGoodExcellent
2008-20111999-2002
Figure 6: Summer Water Quality Has Improved Slightly since 2000
ENVIRONMENTAL WORKING GROUP 14
www.ewg.org /// December 2012
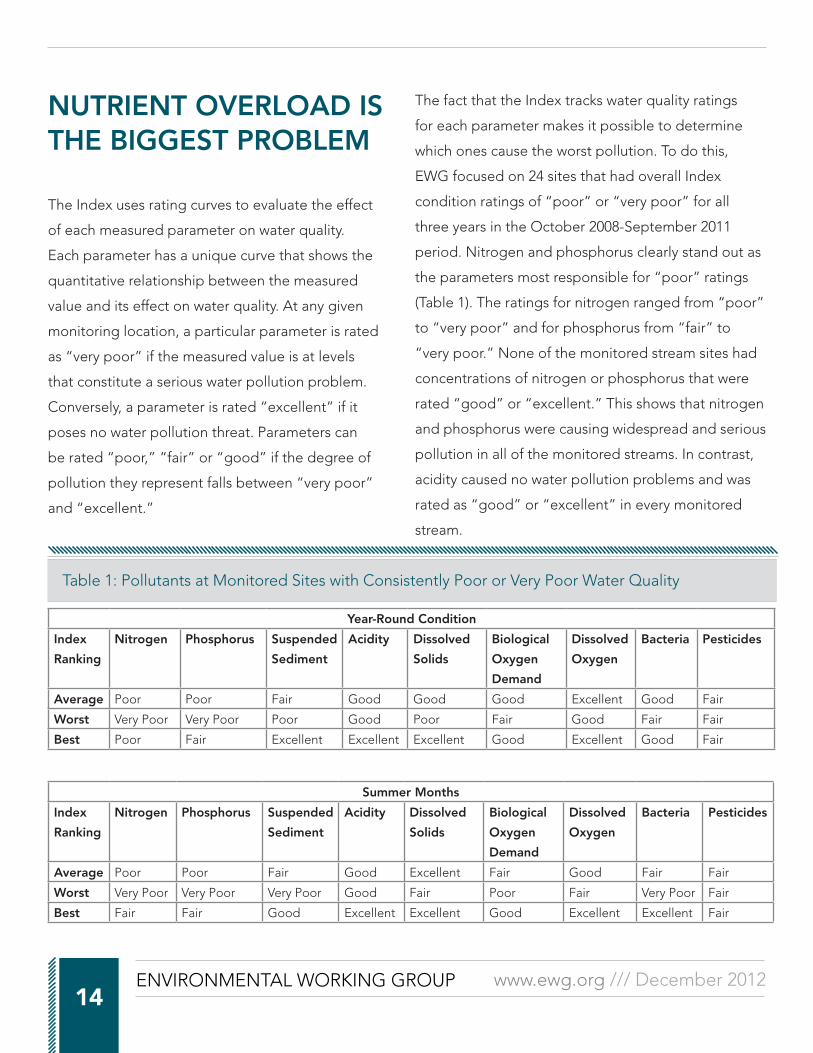
NUTRIENT OVERLOAD IS THE BIGGEST PROBLEM
The Index uses rating curves to evaluate the effect
of each measured parameter on water quality.
Each parameter has a unique curve that shows the
quantitative relationship between the measured
value and its effect on water quality. At any given
monitoring location, a particular parameter is rated
as “very poor” if the measured value is at levels
that constitute a serious water pollution problem.
Conversely, a parameter is rated “excellent” if it
poses no water pollution threat. Parameters can
be rated “poor,” “fair” or “good” if the degree of
pollution they represent falls between “very poor”
and “excellent.”
The fact that the Index tracks water quality ratings
for each parameter makes it possible to determine
which ones cause the worst pollution. To do this,
EWG focused on 24 sites that had overall Index
condition ratings of “poor” or “very poor” for all
three years in the October 2008-September 2011
period. Nitrogen and phosphorus clearly stand out as
the parameters most responsible for “poor” ratings
(Table 1). The ratings for nitrogen ranged from “poor”
to “very poor” and for phosphorus from “fair” to
“very poor.” None of the monitored stream sites had
concentrations of nitrogen or phosphorus that were
rated “good” or “excellent.” This shows that nitrogen
and phosphorus were causing widespread and serious
pollution in all of the monitored streams. In contrast,
acidity caused no water pollution problems and was
rated as “good” or “excellent” in every monitored
stream.
Year-Round Condition
Index
Ranking
Nitrogen Phosphorus Suspended
Sediment
Acidity Dissolved
Solids
Biological
Oxygen
Demand
Dissolved
Oxygen
Bacteria Pesticides
Average Poor Poor Fair Good Good Good Excellent Good Fair
Worst Very Poor Very Poor Poor Good Poor Fair Good Fair Fair
Best Poor Fair Excellent Excellent Excellent Good Excellent Good Fair
Summer Months
Index
Ranking
Nitrogen Phosphorus Suspended
Sediment
Acidity Dissolved
Solids
Biological
Oxygen
Demand
Dissolved
Oxygen
Bacteria Pesticides
Average Poor Poor Fair Good Excellent Fair Good Fair Fair
Worst Very Poor Very Poor Very Poor Good Fair Poor Fair Very Poor Fair
Best Fair Fair Good Excellent Excellent Good Excellent Excellent Fair
Table 1: Pollutants at Monitored Sites with Consistently Poor or Very Poor Water Quality

MURKY WATERS: FARM POLLUTION STALLS CLEANUP OF IOWA STREAMS15
Nitrogen rated as the single worst pollutant in 55
percent of the monthly samples, phosphorus in 30
percent.
In summer, biological oxygen demand and bacteria
(as indicated by E. coli) join nitrogen and phosphorus
as the pollutants most responsible for worsening
the condition of the water. The degree of pollution
caused by bacteria varied dramatically from “very
poor” (serious pollution) to “excellent” (no bacterial
pollution), reflecting the episodic nature of bacterial
outbreaks.
Suspended sediment pollution was the next most
variable parameter, ranging from “very poor” to
“good.”
Nitrogen and phosphorus pollution ranged from
“very poor” to “fair.”
Many pollutants are at their worst in summer (Figure
7). Nitrogen, phosphorus, suspended sediment and
bacteria were all rated “very poor” at some point
each summer. The worst Index score for nitrogen,
phosphorus and bacteria was less than 10 during the
0
20
40
60
80
100
Figure 7: Pollutants Are Worst in Summer (the lower the score the worse the pollution)
Nitr
ogen
Susp
ende
d Se
dim
ent
Diss
olve
d So
lids
Diss
olve
d O
xyge
n
Pest
icide
s
Phos
phor
us
Acidity
Biol
ogica
l Oxy
gen
Dem
and
Bact
eria
EXCELLENT
WO
RST
SU
MM
ER
IND
EX
SC
OR
ES
FOR
200
8 TO
201
1
GOOD
FAIR
POOR
VERY POOR

ENVIRONMENTAL WORKING GROUP 16
www.ewg.org /// December 2012
summers of 2009, 2010 and 2011. The worst score
for suspended sediment was 14. In combination,
these pollutants can create very serious water quality
problems.
Pollutants affect rankings differentlyAlthough the Index data clearly indicate that
nitrogen and phosphorus are the primary pollutants
degrading water quality in Iowa, the Department of
Natural Resources cites bacteria, other biological
contaminants and toxic chemicals as the three primary
pollutants in its required designations of impaired
streams under the federal Clean Water Act. Indeed,
bacteria and three other biological measures account
for 82 percent of the impairments cited by the agency
in its combined 303(d)/305(b) report. Each state is
required to assess waters to determine if they meet
designated uses. If a water body does not meet a
designated use it is required to report that water
body to the federal government in this report.
The discrepancy is likely driven by the fact that
Iowa has still not developed specific standards for
nitrogen, phosphorus or sediment in water. By law,
the Department cannot list a stream as impaired by
a particular pollutant if it has not set a specific water
quality standard for it. The agency has acknowledged
that, “Eventual adoption of numeric criteria for
nutrients, chlorophyll, and/or turbidity will likely result
in a substantial increase [in] the number of water
bodies on Iowa’s future lists of impaired waters.”
BOX 1: HEALTH AND ECOLOGICAL EFFECTS OF NUTRIENT OVERLOAD
Nitrate, an essential nutrient for plant growth, becomes
very dangerous to human health at high levels, and
studies show that it presents risks even when ingested at
lower levels. Fetuses and babies who ingest water with
nitrate at levels above 10 mg/l are at risk of methemo-
globinemia (blue baby syndrome). Lower exposures are
associated with thyroid disruption, premature birth, low
birth rate and brain and head abnormalities. Both adults
and children exposed at lower levels are at increased
risk of thyroid disruption and thyroid, colon and stomach
cancer.
Streams and lakes overloaded with nitrogen and phos-
phorus are prone to blooms of algae and cyanobacteria
that cause a number of environmental and health prob-
lems. Cyanobacteria often produce highly poisonous
toxins that can injure and kill aquatic life, wildlife, live-
stock and people. In May 2012, 22 cattle died in Kansas
after ingesting cyanotoxins.3 In the summer of 2011, Sen.
James Inhofe (R-Okla.) suffered from cyanotoxin poison-
ing after swimming in Oklahoma’s Grand Lake, where he
has a home.4 Decaying algal blooms also create dead
zones that have too little oxygen to support fish and oth-
er aquatic life. A dead zone in the Gulf of Mexico caused
by nutrient overload from the Mississippi River regularly
equals the size of New Jersey or Connecticut.
In addition, disinfecting water to remove algae and cya-
nobacteria imposes high costs on drinking water utilities.
Moreover, the disinfection process creates carcinogenic
byproducts that can end up in drinking water.
Source: Environmental Working Group. 2012. Troubled
Waters: Farm Pollution Threatens Drinking Water5

MURKY WATERS: FARM POLLUTION STALLS CLEANUP OF IOWA STREAMS17
BUSINESS AS USUAL
WILL NOT IMPROVE
IOWA’S WATER
EWG used two statistical tests to
assess what the Iowa Water Quality
Index data reveal about the direction
Iowa’s water quality is taking. The
Kendall test detects any statistically
significant trend – improving, worsening or staying
the same – in the overall Index or in the rankings of
individual pollutants. The Theil-Sen test estimates
the magnitude of those trends. (See Appendix C for
details.)
Of the 98 Index monitoring sites, 72 had data robust
enough to fully meet the statistical criteria of the
Kendall and Theil-Sen tests. The pesticide sub-index
presented particular problems due to missing data
and the use of just three possible sub-index values
– 10, 50 or 100. Because of these problems, EWG
eliminated the pesticide data from its statistical
analysis of trends. However, we found that overall
trends were generally the same with or without the
pesticide sub-index.
The trend results do not include the pesticide sub-
index, but we applied the statistical test to each of the
other pollutants.
The results show that Iowa’s water quality is stuck
in neutral (Table 2). Most of the monitored stream
segments will still be “poor” or “very poor” in 2021
if current trends continue. Fifty percent (36) of the 72
stream segments analyzed will be in “poor” or “very
poor” condition in 2021, compared to 51 percent (37)
today. There still will be no stream segments ranked
“excellent.” Only two stream segments (3 percent)
will be ranked “good,” the same as today.
Overall, water quality in 68 percent of the monitored
stream segments is either declining or stable. At
those sites where the statistics indicate an improving
trend, the improvement is so slow that there will be
little change in water quality over the next ten years.
The trends in nitrogen and phosphorus pollution – the
two pollutants most responsible for poor water quality
in Iowa – are particularly disturbing. In 10 years, the
number of stream segments where nitrogen pollution
is rated very poor will increase from 21 to 37 if current
trends continue (Table 3).
The trend in phosphorus pollution is only slightly
better. The number of stream segments where
phosphorus pollution is rated good will increase from
2011 2021
Number Percent (%) Number Percent (%)
Very Poor 6 8 5 7
Poor 31 43 31 43
Fair 33 46 34 47
Good 2 3 2 3
Excellent 0 0 0 0
Total 72 100 72 100
Table 2: Iowa Water Quality Will Still Be Poor in 10 Years

ENVIRONMENTAL WORKING GROUP 18
www.ewg.org /// December 2012
four to six by 2021. Overall, the phosphorus pollution
picture will change little by 2021 if current trends
continue.
Trends in individual pollutants vary. Biological Oxygen
Demand, Dissolved Oxygen, E. coli bacteria and
pH all are projected to remain almost perfectly
steady through 2021, resulting in virtually no change
in overall water quality. The projected nitrogen
data, however, provide a clear signal of declining
water quality, with the number of “very poor” sites
increasing from 21 today to 37 in 2021. The decline
in the number of sites rated “poor” for nitrogen
might seem to indicate improvement, but since
the number of “fair,” “good,” and “excellent” sites
remains constant, it is clear that the “poor” sites are
deteriorating to “very poor.”
The phosphorus trend also shows deterioration,
though much less so than for nitrogen. The level of
Total Suspended Solids (largely eroded soil) also
shows significant deterioration, with the number of
sites rated “good” dropping from 54 to 41. Most are
projected to decline to “fair” condition, with one
moving down to “very poor.”
Clearly, the key factors keeping Iowa’s water from
achieving any serious improvement are primarily
nitrogen, followed by phosphorus.
PHOSPHORUS CONDITION RATING
2011 2021
Condition Number of stream
segments
Percent of stream
segments
Number of stream
segments
Percent of stream
segments
Excellent 0 0% 0 0%
Good 4 6% 6 8%
Fair 26 36% 26 36%
Poor 25 35% 22 31%
Very Poor 17 24% 18 25%
Total 72 100% 72 100%
NITROGEN CONDITION RATING
2011 2021
Condition Number of stream
segments
Percent of stream
segments
Number of stream
segments
Percent of stream
segments
Excellent 0 0% 0 0%
Good 5 7% 5 7%
Fair 1 1% 0 0%
Poor 45 63% 30 42%
Very Poor 21 29% 37 51%
Total 72 100% 72 100%
Table 3: No Improvement in Nutrient Overload by 2021

MURKY WATERS: FARM POLLUTION STALLS CLEANUP OF IOWA STREAMS19
In all, pollution from E. coli and total suspended
solids is getting worse at 40 percent of the monitored
stream segments, but the downward trends are small
enough that the impact on overall water quality will
be modest through 2021. Across the board, however,
the number of sites showing improvement for any
particular pollutant are fewer than the number
where conditions are stable or getting worse for that
pollutant. (See Appendix B for details on projecting
trends into the future.)
IOWA POLICY MISSES THE MARK
The Federal Water Pollution Control Act Amendments
of 1972 became law 40 years ago, on Oct. 18, 1972.
The law, widely known as the Clean Water Act (CWA),
sparked a remarkable cleanup of America’s lakes,
rivers and streams.7 8 9 Despite a lawsuit and important
amendments in 1977 and 1987, however, the law still
suffers from one fatal flaw – it has little or no authority
to address agricultural, non-point source pollution.
Iowa is a case study of the consequences of this flaw
in one of the nation’s most important environmental
laws.
The 1972 law addressed industrial and urban sources
with great specificity but excluded agriculture from
its definition of the so-called “point sources” of
pollution that are required to seek federal permits,
the regulatory mechanism used to reduce discharges
into lakes, streams and rivers:
The term “point source” means any discernible,
confined and discrete conveyance, including but
not limited to any pipe, ditch, channel, tunnel,
conduit, well, discrete fissure, container, rolling
stock, concentrated animal feeding operation, or
vessel or other floating craft, from which pollutants
are or may be discharged. This term does not
include agricultural storm water discharges and
return flows from irrigated agriculture.10
Initially, urban storm water such as runoff from city
streets was thought to be beyond the reach of the
Clean Water Act, but a 1977 court ruling in response
to a lawsuit filed by the Natural Resources Defense
Council brought it under the law’s regulatory
umbrella. Agriculture, however, remained exempt.11
In 1987, Congress amended the act to create a
non-point source program (Section 319) to provide
some tools to address all forms of non-point source
pollution, including agriculture. The amended
law instructed states to develop non-point source
assessment and management programs designed to
cut pollution from these unregulated sources. The law
also authorized limited funding to assist with program
development and implementation. If a state fails to
implement a satisfactory non-point program, the
Environmental Protection Agency (EPA) can cut off
federal funding for the flawed program. But Section
319 provided no additional authority to regulate
agricultural sources of pollution.

ENVIRONMENTAL WORKING GROUP 20
www.ewg.org /// December 2012
Iowa’s non-point program relies primarily on
education and voluntary programs. Federal funding
for Iowa’s program has fluctuated between $3.5 and
$5.3 million a year for the past seven years.12
The Iowa Water Quality Index makes it clear that
reducing nutrient overload is the key to cleaning up
the state’s streams and rivers. But in Iowa, the only
farm businesses subject to direct regulatory oversight
are livestock operations that confine animals in
buildings or feedlots – so-called Concentrated Animal
Feeding Operations or CAFOs – and farms that apply
manure from CAFOs. State officials are currently
responsible for enforcing water pollution regulations
on CAFOs, but the federal EPA has criticized state
officials for lax regulation and warned that it might
take over.13 There is no regulation of the commercial
fertilizer that virtually all farm businesses apply.
As a result, most of the reduction in nutrient pollution
in Iowa streams and rivers is the result of rules and
regulations that apply to cities, industries and sewage
treatment plants, which contribute only a small
fraction of the nutrient overload. Iowa’s streams and
rivers will never be clean unless new and concerted
efforts are taken to reduce nutrient pollution from
farm businesses.
Sources of Nutrient OverloadIn 2005, the Iowa Department of Natural Resources
conducted a comprehensive assessment of the
sources of nutrient pollution in the state’s waters,
known as the Iowa Nutrient Budget. It showed that
fully 92 percent of the nitrogen and 80 percent of
the phosphorus came from non-point sources. Only
8 percent of the nitrogen and 20 percent of the
phosphorus came from “municipal and industrial
discharges (Figures 8 and 9).”14
The Iowa Nutrient Budget did not distinguish
between agricultural and other sources of non-point
pollution, but there is compelling evidence that
agriculture is the primary culprit.
The U.S. Geological Survey (USGS) estimates that 70
percent of the nitrogen and phosphorus pouring into
Non-point Sources (92%)
Municipal-Industrial (8%)
Figure 8: 92 percent of Nitrogen Pollution Comes from Non-point Sources

MURKY WATERS: FARM POLLUTION STALLS CLEANUP OF IOWA STREAMS21
the Gulf of Mexico comes from agriculture. USGS
also found that 66 percent of the nitrogen reaching
the Gulf comes from cultivated crops, particularly
corn and soybeans.15 Iowa and Illinois, the heart of
the Corn Belt, contribute 28 percent of the nitrogen
reaching the Gulf.16 That nitrogen and phosphorus
pollutes Iowa’s streams and rivers before flowing
downstream to ravage the environment and fisheries
of the Gulf.
The fact that three-fourths of Iowa’s land area is
planted in row crops, almost exclusively soybeans
and heavily fertilized corn, is a major reason why
agriculture is the primary source of nutrient overload.
A 1999 University of Oklahoma study found that
“over 90 percent of the nitrogen fertilizer is used
for agricultural purposes, and the vast majority is
applied to corn. Less than 10 percent of the [nitrogen]
fertilizer is applied to non-agricultural grass (lawns,
parks, general use areas, golf courses, etc.).”17 Corn
uses roughly half the nitrogen applied to it18 and
the other half remains in the environment to pollute
groundwater, surface water and air. The situation is
even worse in a drought year such as 2012, because
a stunted corn crop is unable to take up as much
nitrogen as usual, leaving huge amounts behind.
Cities and Towns Stepped UpAlthough agriculture is by far the greatest contributor
to nitrogen and phosphorus overload, urban sources
are not free of responsibility. The Clean Water Act
focused attention on the largest and easiest pollution
sources – pipes from factories and the like. The Act
also regulated publicly owned sewage treatment
plants, which also emit nitrogen and phosphorus into
waterways. Since the 1977 court decision, the Act
has also applied to storm water runoff from urban
parking lots, streets and lawns, all of which contain
nitrogen, phosphorus and animal manure, among
other pollutants. These sources have long been under
regulations to cut those pollution loads, and cities will
soon be required to comply with even stricter storm
water regulations. In addition, smaller communities
originally exempted from these requirements will
come under new EPA storm water regulations by
2014.19 Still another urban source – septic systems –
has been subject to increased scrutiny. Iowa clamped
Nonpoint Sources (92%)
Municipal-Industrial (8%)
Non-point Sources (80%)
Municipal-Industrial (20%)
Figure 9: 80 percent of Phosphorus Pollution Comes from Non-point Sources

ENVIRONMENTAL WORKING GROUP 22
www.ewg.org /// December 2012
down on septic systems in 2009, requiring that when
a property relying on a septic system is sold or
transferred, that system must pass inspection or be
upgraded or replaced.
Iowa’s towns and cities have been legally required
to reduce pollutant loading from urban runoff since
1977. They are obligated to address water pollution
through actions such as:
• Separating storm sewers from sanitary sewers so
that treatment plants are not overwhelmed during
storms. Cities and towns across Iowa are currently
under federal orders to separate sewers.
• Cleaning streets so that pollutant-laden dirt
and debris do not wash into storm sewers and
then enter local waterways. The city of Ames, for
example, is required by federal permit to clean
each street twice a year.20
• Upgrading sewage treatment plants in larger
communities to reduce the amount of nitrogen
and phosphorus they discharge. This is an
important but limited step, because the plants
contribute less than 1 percent of the nitrogen
and about 1 percent of the phosphorus in Iowa
streams.21
• Requiring smaller communities with un-sewered
systems to install more effective treatment
systems, as Conroy, Iowa did.22 There are a total of
11,840 homes in these communities and about 10
to 15 communities a year fix the problem.23
• Installing porous concrete and pavement that
allow rainwater to soak into the ground rather
than run off to the nearest storm sewer and
waterway. Charles City, Iowa, may now have the
largest installation of permeable paving in the
nation.24
Controlling pollution from storm water and other
urban non-point sources presents many of the same
technical challenges as cleaning up agricultural
non-point sources. The difference is that for more
than 30 years, federal law has required that steps be
taken to control urban pollution, resulting in notable
improvements as more and more communities have
implemented effective practices.
Developers and Industries are RegulatedA developer who plans to “disturb” one acre or more
at a construction site must file and obtain approval
of a plan to promptly and properly take steps to
reduce soil erosion or face fines. Inspectors regularly
check construction sites to make sure the required
measures are being implemented. There are no such
regulations, however, for farm businesses that disturb
vastly more soil.
When the state Department of Natural Resources
assessed the sources of pollution in Iowa waters
(the Iowa Nutrient Budget), the agency estimated
that industry contributes less than one-tenth of 1
percent of the total nitrogen contamination and less
than 3 percent of the phosphorus.25 Few of Iowa’s

MURKY WATERS: FARM POLLUTION STALLS CLEANUP OF IOWA STREAMS23
industrial operations have significant direct emissions
of nitrogen or phosphorus, and the few that do are
required to control those emissions under federal
permits issued by EPA’s National Pollutant Discharge
Elimination System (NPDES).
In all, the state agency estimates that non-farm
activity contributes about 16,000 tons of nitrogen
a year to the environment in Iowa, an amount
that is 0.41 percent of the total (0.56 percent soil
mineralization of nitrogen is excluded), and 3,600 tons
of phosphorus a year, which is 1.5 percent of the total.
The primary point sources that emit nitrogen and
phosphorus under the federal permits are sewage
treatment plants. Most of the nitrogen in sewage
treatment plants comes in the form of ammonia, and
the permits limit the amount of ammonia the larger
plants can discharge. When Iowa adopts standards for
nitrogen and phosphorus under the Clean Water Act,
the sewage plants will be legally mandated to control
their total emissions of nitrogen (not just ammonia
nitrogen) and phosphorus. Under present law, those
regulations will still not apply to farm businesses.
Most Farm Businesses Escape RegulationMost farm businesses – the main source of nitrogen
and phosphorus pollution in Iowa – are under no
regulatory requirements to reduce the nitrogen or
phosphorus leaving their fields and polluting the
public’s waterways. The one exception is some farm
business that include an Animal Feeding Operation
(AFO). AFOs constitute just 10 percent of Iowa farm
businesses.26
These operations are required to take steps to
prevent manure from polluting Iowa’s water. The
specific actions required vary depending on how
many animals are at the operation. The operations
with more than 1,000 animal unitsiii must meet the
most stringent requirements. The requirements also
vary depending on the type of livestock produced,
whether the business sells the manure and whether
the manure is wet or dry. There are new rules that
impose limited restrictions on the application of
manure to land when the soil is frozen or covered
with snow. Iowa officials are currently in discussions
with the U.S. Environmental Protection Agency (EPA)
over the possibility of implementing a new regulatory
approach that would subject the larger livestock
operations to the requirements of the Clean Water
Act’s National Pollution Discharge Elimination System
(NPDES), which has applied to point sources since the
1970s.
Iowa officials have also been notified that EPA might
take back responsibility for enforcing Clean Water
Act regulations on livestock operations. Currently
EPA directly enforces those regulations in only four
states.27
iii. One “animal unit” is defined as one adult beef cow. Agencies then calculate how many head of another species such as chickens are equivalent. Agriculture uses AUs for a number of purposes – in this case to calculate manure production.

ENVIRONMENTAL WORKING GROUP 24
www.ewg.org /// December 2012
To reduce the likelihood that phosphorus will run
off a field and pollute water, Iowa law prohibits a
farm business from applying more manure than is
needed to just meet a crop’s requirement for this
nutrient. But that same farm business faces no such
restrictions on the amount of chemical phosphorus
(or nitrogen) fertilizer it can apply. Beyond the limited
reach of these water quality regulations for AFOs,
farm businesses in Iowa are under no effective legal
obligation to control the nitrogen or phosphorus
running off their fields and polluting waterways.
Iowa Relies on Farmers to VolunteerBecause state and federal environmental laws and
regulations impose so few requirements on farm
businesses, the state’s primary tool for cutting
nutrient pollution from agriculture is to offer financial
incentives to encourage operators to take voluntary
measures. Consequently, taxpayers end up picking up
much of the cost.
However, Iowa’s financial commitment to such
programs has been limited from the beginning.
Conservation
Reserve
Enhancement
Program*
Conservation
Reserve
Program *
Soil
Conservation
Cost Share
Agricultural
Drainage Well
Closure
Resource
Enhancement and
Protection**
Total
(thousands of dollars, adjusted to fiscal year 2012 except fiscal year 2013)
FY02 $1,642 $10,596 $728 $1,975 $14,941
FY03 $2,107 $0 $4,916 $0 $459 $7,482
FY04 $2,039 $2,718 $7,475 $680 $2,866 $15,778
FY05 $1,930 $2,574 $7,077 $643 $2,713 $14,937
FY06 $1,818 $2,423 $6,664 $606 $2,555 $14,066
FY07 $1,730 $2,307 $6,345 $577 $2,433 $13,392
FY08 $1,632 $1,632 $7,617 $1,610 $3,264 $15,755
FY09 $1,589 $1,589 $7,414 $1,589 $3,701 $15,882
FY10 $1,580 $1,580 $7,372 $1,580 $3,681 $15,793
FY11 $1,538 $1,333 $1,077 $1,282 $2,974 $8,204
F12 $1,000 $1,000 $6,300 $0 $2,307 $10,607
FY13 $1,000 $1,000 $6,650 $550*** $2,307 $11,507
Total $17,963 $19,798 $79,503 $9,295 $31,235 $157,794
Change -53% -39% -37% -24% 17% -23%
Table 4: Iowa State Spending on Water Pollution Control is Declining
* Iowa supplements federal spending ** Soil and water component only *** Does not include $1M from the Rebuild Iowa Infrastructure Fund

MURKY WATERS: FARM POLLUTION STALLS CLEANUP OF IOWA STREAMS25
In March 2012, the non-profit Iowa Policy Project
produced an analysis of water quality funding in
Iowa. The Iowa Fiscal Partnership, also a non-profit,
updated28 that report29 to include fiscal year 2013
appropriations and reported a 25 percent decline in
funding since 2002 (Table 4).
The funding cuts have affected virtually all state
programs that directly or indirectly provide financial
support to encourage voluntary conservation, such as
through local Soil and Water Conservation Districts:
• Soil Conservation Cost Share – cut 37 percent
from $10.6 million to $6.7 million.
• Conservation Reserve Program state supplement
– cut 39 percent from $1.6 million to $1 million.
• Conservation Reserve Enhancement Program –
cut 53 percent from $2.1 million to $1 million.
• Agricultural Drainage Well Closure – cut 24
percent from $728,000 to $550,000. (Iowa has
supplemented this effort for fiscal year 2013 with
$1 million from the Rebuild Iowa Infrastructure
Fund.)
Only the soil and water portion of the Resource
Enhancement and Protection program escaped these
cuts, increasing 17 percent from $1.97 million to $2.3
million over the 12 years.
Overall, funding for these five programs was slashed
by 23 percent, from $14.9 million in FY 2002 (in
adjusted dollars) to $11.5 million in fiscal year 2013.
The Iowa Fiscal Partnership study also cited funding
cuts in four other programs that address both
agricultural and non-agricultural components of water
pollution:
• Watershed Protection Fund – cut 72 percent from
$3.2 million to $900,00.
• GIS Info for Watersheds – cut 31 percent from
$284,000 to $195,000.
• Water Quality Monitoring – cut 15 percent from
$3.5 million to $2.9 million.
• Water Quality Protection – cut 29 percent from
$702,000 (in FY03) to $500,000
IT DOESN’T HAVE TO BE THIS WAYIowa’s rivers and streams can be clean, but only if
Iowans take concerted action to reduce the nitrogen
and phosphorus overload from agriculture. The
good news is that both experience and science
make it clear that concerted action can make major
improvements in water quality (Box 2).
Iowa officials released a draft Nutrient Reduction
Strategy on Nov. 19, 2012. If it is to make a major
contribution to cleaning up Iowa’s water, the strategy
must include the following three components:
1. A secure, long-term commitment to increased
funding for water quality programs.
2. Revamping voluntary programs to improve their
effectiveness.
3. Putting in place smart and narrowly targeted
regulations that discourage poor farming

ENVIRONMENTAL WORKING GROUP 26
www.ewg.org /// December 2012
practices that disproportionately
increase water pollution.
Long-term Funding
Commitment
In November 2010, Iowans voted
to establish a new dedicated
fund for programs that improve
the environment. The Iowa Water
and Land Legacy constitutional
amendment was passed twice by
the House and Senate in successive
legislatures and was ratified by
63 percent of the voters.33 The
amendment authorizes a three-
eights of one percent sales tax to
fund the “Natural Resources and
Outdoor Recreation Trust Fund,” a
permanent fund strictly dedicated
to “protection of water quality,
conservation of agricultural soils
and improvement of natural areas
in Iowa including fish and wildlife
habitat.”34 Economists estimate the
tax would provide $123.4 million a
year.35
The ballot summary put before
voters read:
“Adopts Iowa’s Water and Land
Legacy Amendment which
BOX 2: CONCERTED ACTION WORKS
Farmers CreekThe 17-mile Farmers Creek in eastern Iowa’s Jackson County was heavily pol-
luted. The Iowa Department of Natural Resources calculated that reducing
sediment and nutrients by 40 percent would bring the creek back to life. Farm-
ers took action to fence cattle away from the stream, install grassed waterways,
construct ponds and implement other conservation practices. In combination,
they reduced sediment flowing into the stream by an estimated 6,827 tons a
year and phosphorus by 4.5 tons per year – a 50 percent reduction in each.
Aquatic life has bounced back enough that Farmers Creek has been chosen as
the first Iowa stream for reintroduction of native mussels, which were decimat-
ed across Iowa over the past century.30
Bigalk CreekBigalk Creek is a spring-fed, cold-water creek in far northeast Iowa. The DNR
sought to reduce the amount of sediment and livestock manure reaching the
stream by 50 percent and to cut stream bank erosion by 60 percent. Landown-
ers helped plant trees, stabilize the stream banks and keep cattle out of the
stream by providing alternative sources of water. As a result, Bigalk Creek now
supports a naturally reproducing trout population – one of only a handful in
Iowa. One farmer reports that his cattle and calves are healthier now that they
are out of the creek.31
Lake IcariaLake Icaria in southwest Iowa’s Adams County is used for recreation, fishing
and as a drinking water source. The 669-acre lake was suffering from exces-
sive siltation and was officially designated as impaired in 1998. Between 1996
and 2005 state and federal agencies worked with landowners to implement
erosion control practices in the watershed. These included installing stream
crossings for cattle, grassed waterways and terraces, grade stabilization, animal
waste management systems and changes to grazing patterns, enrolling land
in the Conservation Reserve Program and building one wetland. The depart-
ment estimates that these measures cut sediment flowing into the stream from
12,095 tons to 4,350 tons a year, a 64 percent improvement. Agency officials
also believe that nutrient loadings were also substantially reduced. Lake Icaria
now fully supports aquatic life and was removed from the impaired waters list
in 2008.32

MURKY WATERS: FARM POLLUTION STALLS CLEANUP OF IOWA STREAMS27
creates a dedicated trust fund for the purposes
of protecting and enhancing water quality and
natural areas in the State, including parks, trails,
and fish and wildlife habitat and conserving
agricultural soils in this State.”36 (See Appendix D
for the full text of the amendment.)
By their vote, Iowans clearly expressed their desire for
cleaner water and a healthier environment. Even more
evidence of Iowans’ commitment to conservation
came in the 2012 election, when 72 percent of Polk
County voters agreed to increase their property taxes
to pay for a Water and Land Legacy Bond.
To date, however, the legislature has failed to pass a
bill to implement the sales tax increase, and there is
no money in the Trust Fund.
The governor and the legislature should take swift
action to pass the sales tax increase and make the
Natural Resources and Outdoor Recreation Trust
Fund a reality.
Revamp Voluntary Programs More money alone, however, will not result in
progress unless it is spent wisely. Revamping the way
conservation programs are deployed will produce
more results, more quickly.
Scientists and conservationists who have studied or
worked on reducing the nitrogen and phosphorus
overload problem recommend a three-pronged
approach.
1. Implement measures to keep soil in place and
build its capacity to hold onto nutrients and water.
2. Ensure that farmers and ranchers better manage
the nitrogen and phosphorus applied to their
fields in fertilizers and manure. Management plans
must ensure that most of the applied nitrogen
and phosphorus stays in the soil or gets taken up
by crops, rather than running off or leaching into
lakes, rivers, streams and groundwater.
3. Increase the amount of nitrogen, phosphorus and
sediment that gets captured in wetlands, filter
strips and riparian zones. These practices will also
reduce and slow the amount of water running off
farm fields and reduce erosion of stream banks
and channels – often a large source of sediment
and nutrients.
There are proven practices and systems that can
effectively implement this three-pronged approach.
(See Box 3)37 So-called voluntary conservation
programs that use financial incentives to encourage
landowners and managers to employ those practices
will help clean up Iowa’s water, but only if important
improvements are made to the way they operate. The
most important are:
• Increase accountability by setting explicit goals
and timelines and ensuring full transparency
on where taxpayers’ money goes and for what
practices and systems.
• Focus most efforts in priority watersheds and work
with groups of producers to take joint action to
solve pressing problems; even heroic efforts by
award-winning farmers will produce poor results if

ENVIRONMENTAL WORKING GROUP 28
www.ewg.org /// December 2012
neighboring producers don’t work together.
• Within priority watersheds, target conservation
efforts where they will do the most good to
improve water quality. Often only a small
portion of the agricultural land in a watershed is
responsible for much or most of
the nutrient overload or erosion.
• Collect, monitor and
disseminate information about
the farming and conservation
practices farmers are using. Only
rarely is real-time information
available about what practices
are already in place and how
they change in response to
market conditions and public
policies such as biofuel subsidies
and mandates. This information
is essential for effectively
directing conservation programs.
• Build the technical services
and scientific support network
needed to get the job
done. Given current budget
constraints, this will mean
allocating more money for
technical services and less
for financial incentives to
landowners and managers.
Precision RegulationBy themselves, even the most
focused and best-managed
voluntary programs will not be sufficient to solve
the water quality problems caused by agricultural
production in Iowa. More money will help, but even
BOX 3: SIMPLE PRACTICES – BIG IMPROVEMENT
Research shows that simple practices can dramatically reduce nitrogen and phos-
phorus pollution into waterways. One example comes from a study of small strips
of prairie planted in strategic locations in crop fields. Researchers at Iowa State
University planted 10 percent of the cropland with narrow strips in several small
watersheds near Des Moines. The amount of nitrogen in the water runoff dropped
by 74-75 percent, the amount of phosphorus by 79-83 percent and the amount of
sediment by 92-93 percent.38
Iowa State University’s Bear Creek project near Ames also demonstrates that plant-
ing buffers along streams can have dramatic positive effects on water quality. At
Bear Creek a buffer planted with a combination of grasses and shrubs removed 90
percent of the sediment and up to 80 percent of the nutrients from runoff flowing
through the buffer, and up to 90 percent of the nitrate from subsurface water flow-
ing under the buffer.39
Results from the Iowa Nutrient Reduction Science Assessment40 – a large research
project that is estimating the effectiveness of various practices to reduce nutrient
pollution – estimate that:
• Buffers at the edges of fields or along stream banks would cut average nitro-
gen losses from shallow groundwater by 91 percent and phosphorus losses by
58 percent.
• Planting a rye cover crop would cut average nitrogen losses by 31 percent and
phosphorus losses by 29 percent.
• Creating wetlands to treat drainage water would cut average nitrogen losses
by 52 percent.
• Shifting to no-till [planting crops directly into residue from the previous crop
with no plowing or other tillage] would cut average phosphorus losses by 90
percent.
Simple practices like these can dramatically reduce loadings of agricultural pol-
lutants. What is missing is effective policy to make sure that these practices are in
place on the landscape over the long term.
MURKY WATERS: FARM POLLUTION STALLS CLEANUP OF IOWA STREAMS29
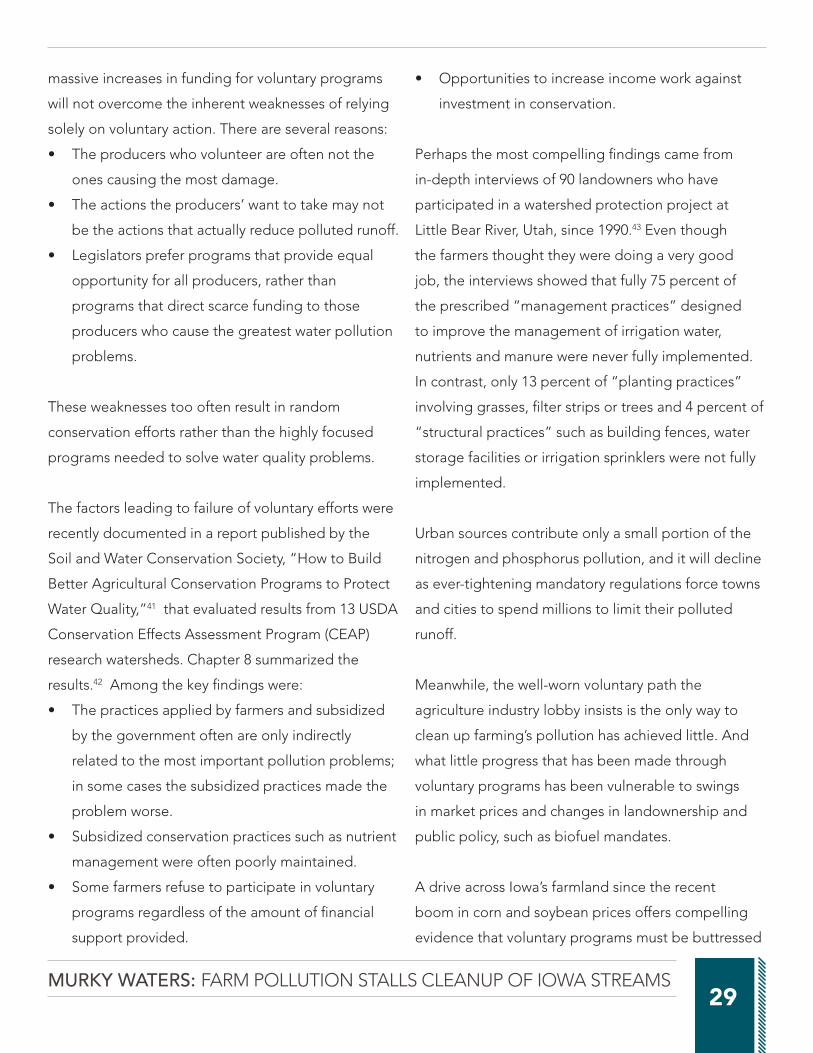
massive increases in funding for voluntary programs
will not overcome the inherent weaknesses of relying
solely on voluntary action. There are several reasons:
• The producers who volunteer are often not the
ones causing the most damage.
• The actions the producers’ want to take may not
be the actions that actually reduce polluted runoff.
• Legislators prefer programs that provide equal
opportunity for all producers, rather than
programs that direct scarce funding to those
producers who cause the greatest water pollution
problems.
These weaknesses too often result in random
conservation efforts rather than the highly focused
programs needed to solve water quality problems.
The factors leading to failure of voluntary efforts were
recently documented in a report published by the
Soil and Water Conservation Society, “How to Build
Better Agricultural Conservation Programs to Protect
Water Quality,”41 that evaluated results from 13 USDA
Conservation Effects Assessment Program (CEAP)
research watersheds. Chapter 8 summarized the
results.42 Among the key findings were:
• The practices applied by farmers and subsidized
by the government often are only indirectly
related to the most important pollution problems;
in some cases the subsidized practices made the
problem worse.
• Subsidized conservation practices such as nutrient
management were often poorly maintained.
• Some farmers refuse to participate in voluntary
programs regardless of the amount of financial
support provided.
• Opportunities to increase income work against
investment in conservation.
Perhaps the most compelling findings came from
in-depth interviews of 90 landowners who have
participated in a watershed protection project at
Little Bear River, Utah, since 1990.43 Even though
the farmers thought they were doing a very good
job, the interviews showed that fully 75 percent of
the prescribed “management practices” designed
to improve the management of irrigation water,
nutrients and manure were never fully implemented.
In contrast, only 13 percent of “planting practices”
involving grasses, filter strips or trees and 4 percent of
“structural practices” such as building fences, water
storage facilities or irrigation sprinklers were not fully
implemented.
Urban sources contribute only a small portion of the
nitrogen and phosphorus pollution, and it will decline
as ever-tightening mandatory regulations force towns
and cities to spend millions to limit their polluted
runoff.
Meanwhile, the well-worn voluntary path the
agriculture industry lobby insists is the only way to
clean up farming’s pollution has achieved little. And
what little progress that has been made through
voluntary programs has been vulnerable to swings
in market prices and changes in landownership and
public policy, such as biofuel mandates.
A drive across Iowa’s farmland since the recent
boom in corn and soybean prices offers compelling
evidence that voluntary programs must be buttressed

ENVIRONMENTAL WORKING GROUP 30
www.ewg.org /// December 2012
BOX 4: RISKY PRACTICES = EXCESSIVE POLLUTION
A handful of risky farming practices such as those documented by EWG’s aerial survey of Marshall County, Iowa, in 2011
cause a disproportionate share of the pollution that keeps Iowa streams dirty. The findings of the survey, plus much more
information, is available in EWG’s 2011 report, “Losing Ground”.
Water cuts gullies like these into poorly protected fields and carries mud, fertilizers, pesticides,
herbicides and sometimes bacteria into streams. As the photos show, many gullies empty
directly into streams and ditches, creating direct pipelines that carry polluted runoff into wa-
terways.
Plowing and planting right next to stream banks greatly increases the chances that mud and
farm chemicals will end up in the water. Studies suggest that much of the mud and phospho-
rus that ends up in Iowa rivers arrives when unprotected stream banks like this one collapse
during big storms.
Simple conservation practices can prevent problems like these and would go far toward cleaning up polluted streams.
EWG’s survey showed that far too few farmers are using the practices that would the clean up Iowa’s water.
Strategically planted strips of grass, called grass waterways, prevent gully formation. The grass
protects the soil where gullies tend to form and helps filter out pollutants.
Planting grass between a crop field and a stream creates a buffer that filters pollutants out
of runoff and strengthens the stream bank. Stronger banks stay intact during periods of high
water flow that cause unprotected banks to collapse.
Federal and state funding has been available for decades to pay farmers and landlords to implement these practices, but
too few take advantage of it. And today, some producers are responding to record crop prices by abandoning conserva-
tion measures in order to plant every acre. Farmers and landlords should be expected to take action at their own expense
to safeguard vulnerable terrain that causes so much pollution. Many, if not most, farmers agree that these activities are bad
business practice and bad for agriculture’s brand.

MURKY WATERS: FARM POLLUTION STALLS CLEANUP OF IOWA STREAMS31
with smart regulation to ensure that conservation
practices stay in place over time. EWG’s 2011 “Losing
Ground” report showed how much damage is done
to Iowa’s fields and waterways when conservation
practices are abandoned in order to take advantage
of high crop prices.44
Conservation must be far more durable for there to
be any hope of cleaning up Iowa’s streams and rivers.
Innovative regulatory frameworks can and should
be devised. But those regulatory requirements
should be narrowly targeted. Rather than requiring
all producers to have nutrient management plans,
regulations should focus on phasing out particularly
risky practices that cause a disproportionate share of
the pollution and defeat a great deal of the voluntary
work done by conservation-minded landowners
and operators. Planting crops right up to stream
banks or allowing livestock to have unmanaged
access to streams, for example, should be restricted.
Landowners and managers should be expected to
control the ephemeral gully erosion that creates a
direct pipeline for mud, fertilizer and manure to flow
into streams and rivers. Many, if not most, farmers
would agree that these activities are simply bad
business practice and bad for agriculture’s brand.
Narrowly targeted restrictions are already in place in
some states and for some practices. Minnesota, for
example, requires landowners – including farmland
owners – to maintain or establish a 50-foot wide
buffer strip of permanent vegetation along streams
and lakes. In Wisconsin, the Brown County Land and
Water Conservation Committee – the state’s version
of a local conservation district – addressed concerns
about water pollution problems in Lake Michigan’s
Green Bay and other streams and lakes by adopting
in 1991 a Shoreland Protection Ordinance that
requires a 35-foot wide vegetated buffer strip along
every stream. Wisconsin state officials also developed
a comprehensive set of performance standards for
agricultural operations. Tellingly, however, that effort
has been crippled by a requirement that farmers
must be paid to meet even the most common-
sense standards, which ought to be part of the
stewardship responsibilities that come with the rights
of landownership.
Iowa has taken the first steps to restrict the risky
practice of applying manure on frozen and snow-
covered ground, but such restrictions are far too
limited. Iowa should act to adopt the regulations
proposed by the Iowa Department of Natural
Resources but subsequently weakened by the
legislature.
Specifically, a strengthened manure application
requirement should become part of a larger set of
precise and narrowly targeted regulations that:
• Restrict the use of the risky practices that cause
a disproportionate share of the pollution in
vulnerable locations and defeat a great deal of
voluntary effort;
• Affect the fewest producers while achieving the
greatest improvement in water quality;
• Push the right producers into voluntary programs;
• Level the playing field for “good actors;”
• Strike a fair and socially acceptable balance
between what taxpayers should pay for and what

ENVIRONMENTAL WORKING GROUP 32
www.ewg.org /// December 2012
producers should be expected to do on their own.
Precision regulation would establish a basic standard
of care expected from landowners and managers
as the stewardship obligation that comes with the
rights of landownership. Voluntary programs can then
be used to support landowners and managers who
already meet these basic standards to do more to
clean up Iowa’s rivers and streams.
Precision regulation coupled with a strengthened
voluntary program would set Iowa on a path toward
cleaner water for our children and ourselves.

MURKY WATERS: FARM POLLUTION STALLS CLEANUP OF IOWA STREAMS33
Appendix AWhat is the Iowa Water Quality Index?
The Iowa Department of Natural Resources (IDNR)
established the Index in 2005 to provide an objective
measure of the condition of Iowa’s streams. The Index
is based on a long-standing model developed in 1970
by the National Sanitation Foundation, substantially
modified and adapted to better fit Iowa’s streams and
rivers.
The Index is based on monthly water quality data
from 98 stream-monitoring sites across the state
that are used to assess the condition of each stream
segment.
On large rivers and streams, a segment (technically
known as a “stream reach”iv ) is usually defined as a
portion of the stream between confluences with two
tributaries. On a small stream, the stream segment
may extend the entire length of the stream. There are
several Index monitoring sites along the larger rivers,
including 10 Index sites along the Iowa River. The
Cedar and Des Moines rivers each have nine sites.
Smaller streams are monitored at only one site. Over
all, the 98 Index monitoring sites rate water quality in
52 streams. Figure A-1 shows the locations of all 98
sites. The names of all monitored streams and rivers
are listed in Table A-1.
How is Water Quality Determined?The Index combines data from measurements of nine
water quality parameters taken at each monitoring
site:
• Biological oxygen demand (mg/l)
• Dissolved oxygen content (mg/l) and saturation (%)
• Nitrate and nitrite as nitrogen (mg/l)
• Total phosphorus (mg/l)
• Total dissolved solids (mg/l)
• Total suspended solids (mg/l)
• E. coli (CFU or MPN/100 ml)
• pH (0-14 scale)
• Total pesticides (ug/l)
A “rating curve” establishes a quantitative
relationship between the measured value of a
Figure A-1: Location of Index Monitoring Stations
iv. “Reach. 1. The length of channel uniform with respect to discharge, depth, area, and slope. 2. The length of a channel for which a single gauge affords a satisfactory measure of the stage and discharge. 3. The length of a river between two gaging sta-tions. 4. More generally, any length of a river.” http://water.usgs.gov/wsc/glossary.html

ENVIRONMENTAL WORKING GROUP 34
www.ewg.org /// December 2012
parameter and its estimated effect on water quality.
The shape of the rating curve is unique to each
parameter. Figure A-2, for example, is the rating curve
for nitrate. Concentrations of nitrate (horizontal axis)
measured in a water sample are translated into a sub-
index value ranging from 0 to 100 (sub-index value on
the vertical axis).
The sub-index values for each parameter are given
a qualitative condition rating based on their effect
on water quality (see Table A-2). A sub-index value
between 90 and 100, for example, is rated as
“excellent” because the measured value does not
indicate a pollution problem at that site. Conversely, a
sub-index value below 25 means the measured value
does indicate serious water pollution at that site; the
parameter is therefore rated “very poor.”
The rating curves also make it possible to compare
Stream or River Number of Segments
Monitored
Beaver Creek 2
Big Sioux River 1
Black Hawk Creek 1
Bloody Run Creek 1
Boone River 1
Boyer River 1
Cedar Creek 2
Cedar River 9
Chariton River 1
Des Moines River 9
East Fork of The Des Moines
River
1
East Nishnabotna River 2
East Nodaway River 1
English River 1
Flood Creek 1
Floyd River 1
Indian Creek 1
Iowa River 10
Little Sioux River 6
Lizard Creek 1
Maple River 1
Maquoketa River 2
Middle River 1
Monona-Harrison Ditch 1
Nishnabotna River 1
North Fork Maquoketa River 1
North Raccoon River 3
North River 1
North Skunk River 1
Ocheyedan River 1
Old Mans Creek 1
Raccoon River 1
Rock River 1
Shell Rock River 1
Skunk River 1
Soldier River 1
South Raccoon River 1
South River 1
South Skunk River 4
Thompson Fork 1
Turkey River 1
Upper Iowa River 1
Volga River 1
Wapsipinicon River 4
West Fork Cedar River 1
West Fork Des Moines River 1
West Fork Ditch 1
West Nishnabotna River 1
West Nodaway River 1
Whitebreast Creek 2
Winnebago River 3
Wolf Creek 1
Yellow River 1
Total 98
Table A-1: Stream Segments with Iowa Water Quality Index Monitoring Sites

MURKY WATERS: FARM POLLUTION STALLS CLEANUP OF IOWA STREAMS35
the contribution to water quality of parameters
measured in very different units. Nitrate, for example,
is measured as mg/l, while pH is measured on a
logarithmic scale from 0 to 14, and bacteria as the
number of colony forming units per 100 milliliters
of water. The rating curves make it possible to use
the same unit-less sub-index value scale and the
same qualitative condition rating (“very poor” to
“excellent”) for each of the nine
parameters.
The original shape of these curves
was determined in the 1970s by
the National Sanitation Foundation
using the Rand Corporation’s Delphi
technique for consensus decision-
making. A panel of 142 water quality
experts was assembled to develop rating curves. Each
person was asked to draw a curve that associated
the concentration of a parameter on the X-axis
with water quality on the Y-axis. The investigators
averaged all the curves. The Iowa Department of
Natural Resources significantly modified the National
Sanitation Foundation curves to reflect the specific
circumstances of Iowa’s waterways.
In some cases, the Department uses more than one
rating curve for a single parameter in order to reflect
important regional differences in Iowa’s geology,
climate and streams. Three different rating curves are
used to assess Total Dissolved Solids in three different
regions of Iowa – western, eastern and northeastern.
Two rating curves are used to assess Total Suspended
Solids – one for the Loess Hills region of western Iowa
and one for the balance of the state. The other seven
parameters are assessed using a single rating curve
for all regions of the state.
The Department then uses an unweighted harmonic
square mean to combine all nine sub-index values
into a single index of water quality at each monitored
site. The combined index uses a scale ranging from 10
Figure A-2 : Index Rating Curve for Nitrate
STREAM CONDITION IWQI SCORE
Excellent 90.01 to 100
Good 70.01 to 90
Fair 50.01 to 70
Poor 25.01 to 50
Very Poor 10 to 25
Table A-2: Iowa Water Quality Index Rates Water Quality from Excellent to Very Poor

ENVIRONMENTAL WORKING GROUP 36
www.ewg.org /// December 2012
to 100 and is given a qualitative rating ranging from
“excellent” to “very poor” using the same thresholds
used to rating each individual parameter except for
the adjustment at the bottom of the scale since this
mathematical formula cannot generate a score of
zero.
For a detailed explanation of the selection of
curves, selection of aggregation function and other
information about the creation of water quality
indexes, see:
Foreman, Katherine Lynn, The Development of a
Water Quality Index for the State of Iowa, University
of Iowa, 2005.

MURKY WATERS: FARM POLLUTION STALLS CLEANUP OF IOWA STREAMS37
Appendix BTrends in individual pollutants and indexes
EWG used the Theil-Sen statistical analysis to project
current trends 5, 10 and 15 years into the future.
Tables B-1 below presents the number of Index sites
in each condition rating for each individual pollutant.
For example, Biological Oxygen Demand was rated
in “very poor” condition in six Index sites in 2011.
Statistical projection of current trends suggests the
Biological Oxygen Demand will still be in “very poor”
condition at six sites in 2016, five sites in 2021 and five
sites in 2026.
Tables B-1: Projected change in condition of pollutants
Biological Oxygen Demand
Condition 2011 2016 2021 2026
Very Poor 6 6 5 5
Poor 31 33 31 30
Fair 33 31 34 33
Good 2 2 2 4
Excellent 0 0 0 0
Dissolved Oxygen
Condition 2011 2016 2021 2026
Very Poor 0 0 0 0
Poor 0 0 0 0
Fair 0 0 0 0
Good 2 2 2 2
Excellent 70 70 70 70
Total Dissolved Solids
Condition 2011 2016 2021 2026
Very Poor 0 0 0 0
Poor 1 0 0 0
Fair 2 2 3 3
Good 34 31 25 25
Excellent 35 39 44 44
E. coli (bacteria)
Condition 2011 2016 2021 2026
Very Poor 0 0 0 0
Poor 0 0 0 1
Fair 2 3 4 4
Good 25 26 25 24
Excellent 45 43 43 43
Phosphorus
Condition 2011 2016 2021 2026
Very Poor 17 17 18 18
Poor 25 24 22 23
Fair 26 25 26 23
Good 4 6 6 6
Excellent 0 0 0 2
Nitrogen
Condition 2011 2016 2021 2026
Very Poor 21 33 37 38
Poor 45 34 30 29
Fair 1 0 0 0
Good 5 5 5 5
Excellent 0 0 0 0
pH (acidity)
Condition 2011 2016 2021 2026
Very Poor 0 0 0 0
Poor 0 0 0 0
Fair 0 0 0 0
Good 53 49 46 46
Excellent 19 23 26 26

ENVIRONMENTAL WORKING GROUP 38
www.ewg.org /// December 2012
Iowa Water Quality Index
Condition 2011 2016 2021 2026
Very Poor 3 2 2 2
Poor 35 40 35 37
Fair 33 29 34 32
Good 1 1 1 1
Excellent 0 0 0 0
Iowa Water Quality Index Without Pesticide Sub-Index
Condition 2011 2016 2021 2026
Very Poor 6 6 5 5
Poor 31 33 31 30
Fair 33 31 34 33
Good 2 2 2 4
Excellent 0 0 0 0
Total Suspended Solids (sediment)
Condition 2011 2016 2021 2026
Very Poor 0 0 0 0
Poor 0 0 1 4
Fair 10 18 22 19
Good 54 46 41 41
Excellent 8 8 8 8
Tables B-1 (cont.): Projected change in condition of pollutants

MURKY WATERS: FARM POLLUTION STALLS CLEANUP OF IOWA STREAMS39
Appendix CStatistical Analysis for the Iowa Water Quality IndexPrepared by: Karl Pazdernik, Statistical Consultant, Iowa State University
The data consisted of values collected between 1999 and 2011 at multiple sites across Iowa where the Iowa
water quality sub-index was recorded for different chemicals. The goal was to test for a monotonic trend over
the time series for each combination of site and sub-index separately and produce predictions for when the
sub-index will reach different categorizations. Unfortunately, since we are analyzing a time series, a simple
regression analysis would violate the assumption of independence. Outliers and censored observations are
also common to water quality data, so assumptions of normality are often difficult to justify. To avoid such
issues, we have decided to use the more robust Seasonal Kendall and Mann-Kendall tests to determine the
presence of a monotonic trend. A corresponding Theil-Sen slope and intercept estimator were used for the
prediction process.
Incomplete DataMost of the data collected at each site was not complete. In fact, there was a period between October 2008
and March 2009 where no data was collected at any site. Consequently, adjustments needed to be made.
The Seasonal Kendall test does not require a continuous time series, so missing data was not directly an issue.
Unfortunately, this test does use a large sample approximation to the normal distribution, and so an excessive
amount of missing data will result in a small sample, thus, results may no longer be reliable.
Each of the 98 sites in Iowa can be categorized as follows.
0. There existed enough data so that all results were reliable (an average of at least 10 years).
1. There existed a substantial amount of data, however it may be too small for all results to be completely
reliable (an average of at least 5 years).
2. There existed enough data to run the analysis, but not enough for any results to be reliable (at least 2
years for each month).
3. The data was so incomplete that no analysis could be run (less than 2 years for each month).
[EWG chose to work only with the highest quality data – those that fell under status “0.”] The majority of sites

ENVIRONMENTAL WORKING GROUP 40
www.ewg.org /// December 2012
had enough data to run a full and reliable statistical analysis. However, caution must be taken when forming
conclusions based on unreliable results. The following table shows the distribution for the amount of data
collected from each site, where “status” identifies the category.
Characteristics of the Response VariablesIowa created a water quality index (Index) as a measure of overall water quality based on nine sub-indexes:
BOD, dissolved oxygen, nitrate-nitrite, total phosphate, total dissolved solids, total suspended solids, pH, total
detected pesticide, and E. coli. Each sub-index was a score between 0 and 100 representing the quality of the
water at that time and location. Note that water flow is indirectly measured in these sub-indexes, which is a
factor that can greatly affect water quality.
The goal was to test for monotonic trend and obtain slope estimates over several measurements, including
the overall Index, all sub-indexes individually, and the nitrate to phosphate ratio. Monotonic trend was tested
and slope estimates were obtained for each site for several different time definitions including over the entire
time series, over only the summer months (May through August), and for each month separately. Testing for
monotonic trend over individual months required the Mann-Kendall test and testing for monotonic trend
over multiple months required the Seasonal Kendall test which is a particular combination of Mann-Kendall
tests. Slope and intercept estimates for individual months were calculated using the Theil-Sen estimators and
the slope and intercept estimates using multiple months required the Seasonal Theil-Sen estimators. These
estimates were then used to predict status change for the Index and all sub-indexes.
All chemicals could be analyzed using these methods with the exception of the total detected pesticide sub-
index. This variable presented two difficulties, illustrated in the following plot.
Status 0 1 2 3
# of Sites 72 8 4 14

MURKY WATERS: FARM POLLUTION STALLS CLEANUP OF IOWA STREAMS41
The first issue was that the recorded value was always one of only three options (10, 50, or 100). The Mann-
Kendall and Seasonal Kendall test statistics are computed by comparing a past observation to all of its future
observations (for that particular month) and checking for trend (increasing or decreasing). This assumes
that values are relatively unique. The total detected pesticide sub-index, having only three possible values,
resulted in a large number of ties. The calculation included a correction to use a more conservative estimate of
variance in the presence of ties, however, this correction was not intended for data with a prevalent amount of
ties. An abundance of ties creates a similar problem for the Theil-Sen estimators.
The second issue was that the total detected pesticide concentration from which the sub-index was calculated
was completely missing from all sites beginning December 2006. Therefore, as an attempt at imputation,
the pesticide sub-index had a recorded value of 50 for every time point after November 2006. This improper
method of imputation and the generated data resulted in a significant negative trend for almost all sites. Also,
since the Index was calculated using all nine sub-indexes, results on the Index were affected as well.
To avoid this dilemma, the trend analysis was performed on the total detected pesticide concentration directly.
The fact that it is a concentration (ug/L) should also account for the effect of water flow. Unfortunately, since
four years’ worth of data are missing, all sites received a status of 1 or higher, meaning the results are less
reliable.
ENVIRONMENTAL WORKING GROUP 42
www.ewg.org /// December 2012
To correct for the negative effect the improper imputation method may have had on the Index, an additional
water quality index was calculated called the Water Quality Index Minus Pesticides or WQI-P. The Index is the
unweighted harmonic square mean of the sub-indexes. The WQI-P is the same unweighted harmonic square
mean, excluding the pesticide sub-index from the calculation.
Theil-Sen Estimation, Interpretation, and PredictionThe Theil-Sen estimation process consists of 2 distinct parts: estimating the slope and estimating the intercept.
The slope for a single month is estimated by the median of all slopes calculated between observations from
that same month. The intercept is then the median of all intercepts based on the estimated slope. When the
Theil-Sen estimation process was done for the entire time series or the summer season, slopes were calculated
on a month-by-month basis and then the median of the set of all values was used as the slope. The intercept
was then based on this estimate of slope and the entire time series.
The slope can be interpreted as the estimated increase/decrease in a chemical for a one year increase in
time. The intercept can be interpreted as the estimated amount of a chemical in the landmark year, which was
chosen to be 1999.
The slope and intercept together provide the equation for a line that was then used to predict when a sub-
index would reach the 5 categories: very poor (0-25), poor (25.01-50), fair (50.01-70), good (70.01-90), and
excellent (90.01-100). This was done for sub-indexes that had a significant slope at the alpha=.05 level.
The following sections outline the calculations and statistics used to analyze the Iowa Water Quality data.
Mann-Kendall testThe Mann-Kendall test was applied to each site, chemical, and month separately to provide monthly tests of
monotonic trend. The structure of the hypothesis test is as follows:
H0: there is no monotonic trend
HA: there is either an increasing or decreasing trend
Let Ymi be the water quality sub-index for month m and year i.
Let n be the length of the sequence (number of years).

MURKY WATERS: FARM POLLUTION STALLS CLEANUP OF IOWA STREAMS43
This equation has a correction for tied data that results in a conservative test. Tied data occurs when
Ymi - Ymj=0. T is the number of distinct ties in the sequence. As an example, the sequence (1,3,6,2,2,2,7,4,5,5)
has 2 distinct ties.
With a continuity correction, the test statistic is the following:
Zm is then compared to a standard normal distribution to report a p-value. A p-value less than 0.01 indicates a
strongly significant trend, a p-value less than 0.05 indicates a moderately significant trend, and a p-value less
than 0.10 indicates a weakly significant trend.
This uses a large sample approximation, so only results with status 0 (where there is over 10 years’ worth of
data) should be considered reliable.
Seasonal Kendall testThe Seasonal Kendall test was applied to each site and chemical over the entire time series as well as over
only the summer months (May through August). This test is essentially a sum of separate summary statistics
necessary for the Mann-Kendall test calculated for each month. The hypothesis and reference distribution are
exactly the same.

ENVIRONMENTAL WORKING GROUP 44
www.ewg.org /// December 2012
H0: there is no monotonic trend
HA: there is either an increasing or decreasing trend
Total Year Analysis:
Summer Months Analysis:
Z is then compared to a standard normal distribution to report a p-value. A p-value less than 0.01 indicates a
strongly significant trend, a p-value less than 0.05 indicates a moderately significant trend, and a p-value less
than 0.10 indicates a weakly significant trend.
Unweighted Square Harmonic MeanLet Yk be the sub-index for chemical k.

MURKY WATERS: FARM POLLUTION STALLS CLEANUP OF IOWA STREAMS45
Theil-Sen slope and intercept estimatorsThe Theil-Sen slope and intercept estimators were applied to each site, chemical, and month separately to
provide monthly estimates of slope and an equation of a line that can be used for prediction. These estimates
are calculated as follows:
Let Ymi be the water quality sub-index for month m and year i.
Let n be the length of the sequence (number of years).
The equation of a line used for prediction for a given month for year i is then the following:
This equation can be used to predict the response for any year; however it will be more reliable for
interpolation (predicting for years within the range of the data).
Seasonal Theil-Sen slope and intercept estimatorsThe Theil-Sen slope and intercept estimators were also applied to each site and chemical separately over a
combination of months (the summer months or all months) to provide estimates of slope and an equation of a
line that can be used for prediction. These estimates are calculated as follows:
Let Ymi be the water quality sub-index for month m and year i.Let n be the length of the sequence (number of years).
Let M be the set of months to use in the seasonal estimates. So for the summer season M = {5, 6, 7, and 8} and
for the full year M = {1, 2, …, 12}

ENVIRONMENTAL WORKING GROUP 46
www.ewg.org /// December 2012
The equation of a line used for prediction of year i is then the following:
This equation can be used to predict the response for any year; however it will be more reliable for
interpolation (predicting for years within the range of the data).
Prediction of Status ChangeThe equation of a line obtained from the Theil-Sen estimation process was then used to predict in what year
each sub-index would reach a new categorization. This was done by predicting each year into the future and
identifying when the predicted response would fall above (if increasing) and below (if decreasing) the given
category endpoints.
Let k be the category the sub-index falls into.
Let Yk be the value of the sub-index at the endpoint of category k. For the sub-indexes, the particular set of
endpoints was {25,50,70,90}.
The year in which the sub-index reaches a new category can then be obtained by the following:

MURKY WATERS: FARM POLLUTION STALLS CLEANUP OF IOWA STREAMS47
Appendix DFull text of the Iowa Water and Land Legacy AmendmentArticle VII of the Constitution of the State of Iowa is
amended by adding the following new section:
SEC. 10. A natural resources and outdoor recreation
trust fund is created within the treasury for the
purposes of protecting and enhancing water quality
and natural areas in this State including parks,
trails, and fish and wildlife habitat, and conserving
agricultural soils in this State. Moneys in the fund
shall be exclusively appropriated by law for these
purposes.
The general assembly shall provide by law for the
implementation of this section, including by providing
for the administration of the fund and at least annual
audits of the fund.
Except as otherwise provided in this section, the fund
shall be annually credited with an amount equal to
the amount generated by a sales tax rate of three–
eighths of one percent as may be imposed upon the
retail sales price of tangible personal property and the
furnishing of enumerated services sold in this State.
No revenue shall be credited to the fund until the tax
rate for the sales tax imposed upon the retail sales
price of tangible personal property and the furnishing
of enumerated services sold in this State in effect
on the effective date of this section is increased.
After such an increased tax rate becomes effective,
an amount equal to the amount generated by the
increase in the tax rate shall be annually credited
to the fund, not to exceed an amount equal to the
amount generated by a tax rate of three–eighths
of one percent imposed upon the retail sales price
of tangible personal property and the furnishing of
enumerated services sold in this State.
The amendment went into effect on Nov. 29, 2010.

ENVIRONMENTAL WORKING GROUP 48
www.ewg.org /// December 2012
References 1. Iowa Department of Natural Resources Iowa Geological
Survey. Iowa Section 303(d) Impaired Waters Listings. http://
www.igsb.uiowa.edu/wqm/ImpairedWaters/303d.html#2010
2. Iowa Department of Natural Resources. What does
“Designated Use” mean? http://www.iowadnr.gov/
InsideDNR/RegulatoryWater/WaterQualityStandards/
DesignatedUses.aspx
3. Colburn, David. June 13, 2012. Algae linked in cattle deaths.
Peabody Gazette-Bulletin. http://peabodykansas.com/direct/
algae_linked_in_cattle_deaths+4338algae+416c676165206c69
6e6b656420696e20636174746c6520646561746873
4. Myers, Jim. July 1, 2011. Inhofe believes swimming in Grand
Lake cause of his illness. Tulsa World.
http://www.tulsaworld.com/news/article.
aspx?articleid=20110701_335_0_hrimgs611815&subjectid=335
5. Naidenko, Olga V., Craig Cox, Nils Bruzelius. April 2012.
Troubled Waters: Farm Pollution Threatens Drinking Water.
http://www.ewg.org/report/troubledwaters
6. Iowa Department of Natural Resources. May 27, 2011.
The Final 2010 Iowa List of Section 303(d) Impaired Waters.
http://www.iowadnr.gov/Environment/WaterQuality/
WaterMonitoring/ImpairedWaters.aspx
7. Committee on the Mississippi River and the Clean Water
Act, National Academy of Sciences. 2008. Mississippi River
Water Quality and the Clean Water Act: Progress, Challenges,
and Opportunities. http://www.nap.edu/catalog.php?record_
id=12051
8. Clean Water Action. Celebrating the Clean Water Act. 2012.
http://www.cleanwateraction.org/publication/celebrating-
clean-water-act
9. G. Tracy Mehan, III, Assistant Administrator for Water, U.S.
Environmental Protection Agency. Oct. 8, 2012. Testimony
before the Senate Environment and Public Works Committee.
http://lobby.la.psu.edu/_107th/116_WI_SRF/Congressional_
Hearings/Testimony/S_EnvirPubWorks_Mehan_100802.htm
10. Federal Water Pollution Control Act Amendments of 1972.
Section 502(14).
11. Natural Resources Defense Council v. Train, 396 F.Supp.
1393 (D.D.C. 1975), aff’d. by NRDC v. Costle, 568 F.2d 1369
(D.C. Cir. 1977).
12. Hopkins, Steve, Nonpoint Source Coordinator. Oct.
4, 2012. Iowa Department of Natural Resources. Personal
communication.
13. Beeman, Perry. Nov. 12, 2012. EPA may take over
enforcing water act in Iowa: Analyses finding DNR efforts lax
prompt warning. The Des Moines Register.
http://www.desmoinesregister.com/article/20121113/
NEWS10/311130049/EPA-may-take-over-enforcing-water-act-
in-Iowa
14. Iowa Department of Natural Resources. 2005. Iowa’s
Nutrient Budget: Protecting and Improving our Water: A
Summary. http://www.iowadnr.gov/portals/idnr/uploads/water/
standards/nbsum.pdf
15. Alexander, Richard, Richard Smith, Gregory Schwarz,
Elizabeth Boyer, Jacqueline Nolan, and John Brakebill. 2008.
Differences in Phosphorus and Nitrogen Delivery to the /
Gulf of Mexico form the Mississippi River Basin. Environ. Sci.
Technl. 42, 822-830. http://water.usgs.gov/nawqa/sparrow/
gulf_findings/index.html
16. Alexander, Richard, Richard Smith, Gregory Schwarz,
Elizabeth Boyer, Jacqueline Nolan, and John Brakebill. 2008.
Differences in Phosphorus and Nitrogen Delivery to the /
Gulf of Mexico form the Mississippi River Basin. Environ. Sci.
Technl. 42, 822-830. http://water.usgs.gov/nawqa/sparrow/
gulf_findings/index.html
17. Libra, R.D., C.F. Wolter and R.J. Langel. Dec. 2004.
Nitrogen and Phosphorus Budgets for Iowa and Iowa

MURKY WATERS: FARM POLLUTION STALLS CLEANUP OF IOWA STREAMS49
Watersheds. Iowa Geological Survey Technical Information
Series 47.
18. Raun, William R and G. J. Johnson. 1999. Improving
Nitrogen Use Efficiency for Cereal Production. J. Agronomy.
91:357-363. http://www.nue.okstate.edu/Index_Publications/
Improving_NUE.pdf
19. U.S. Environmental Protection Agency. Proposed National
Rulemaking to Strengthen the Stormwater Program. http://
cfpub.epa.gov/npdes/stormwater/rulemaking.cfm
20. Iowa Department of Natural Resources NPDES Permit: City
of Ames.
21. Libra, R.D., C.F. Wolter and R.J. Langel. Dec. 2004.
Nitrogen and Phosphorus Budgets for Iowa and Iowa
Watersheds. Iowa Geological Survey Technical Information
Series 47.
22. Iowa Department of Natural Resources. 2009. Working
for Clean Water: 2009 Watershed Improvement Successes in
Iowa. http://www.iowadnr.gov/Environment/WaterQuality/
WatershedImprovement/WatershedSuccesses.aspx
23. Olson, Daniel, Senior Environmental Specialist. Oct. 3,
2012. Iowa Department of Natural Resources Private Sewage
Disposal Program. Personal communication.
24. Waterloo Cedar Falls Courier. May 11, 2012. Charles City
adds permeable paving. http://wcfcourier.com/news/local/
charles-city-adds-permeable-paving/article_48ef247c-55ff-
5cb6-97ab-9c42691602e8.html
25. Libra, R.D., C.F. Wolter and R.J. Langel. Dec. 2004.
Nitrogen and Phosphorus Budgets for Iowa and Iowa
Watersheds. Iowa Geological Survey Technical Information
Series 47.
26. The Iowa Department of Natural Resources database
on animal feeding operations shows there are currently
9,379 operations in Iowa. (https://programs.iowadnr.gov/
animalfeedingoperations/Reports.aspx). The Iowa Department
of Agriculture and Land Stewardship’s “Iowa Agriculture
Quick Facts” reports that Iowa has 92,300 farms. (http://www.
iowaagriculture.gov/quickfacts.asp). 9,379 divided by 92,300
equals 10%.
27. Beeman, Perry. Nov. 12, 2012. EPA may take over
enforcing water act in Iowa: Analyses finding DNR efforts lax
prompt warning. The Des Moines Register.
http://www.desmoinesregister.com/article/20121113/
NEWS10/311130049/EPA-may-take-over-enforcing-water-act-
in-Iowa
28. Iowa Fiscal Partnership. June 26, 2012. Drops in Drops in
the Bucket: Even Rare Boosts in Water Funding Evaporate with
Inflation. http://www.iowafiscal.org/2012research/120626-IFP-
water-bgd.html
29. Hoyer, Will., Brian McDonough, David Osterberg.
March 1, 2012. Drops in the Bucket: The Erosion of Iowa
Water Quality Funding. http://www.iowapolicyproject.
org/2012Research/120301-water.html
30. Iowa Department of Natural Resources. 2011. Working
for Clean Water: 2011 Watershed Improvement Successes in
Iowa. http://www.iowadnr.gov/Environment/WaterQuality/
WatershedImprovement/WatershedSuccesses.aspx
31. Iowa Department of Natural Resources. Bigalk Creek:
Preserving a Treasure.
http://www.iowadnr.gov/portals/idnr/uploads/water/
floodplain/nonpoint/files/bigalk.pdf
32. Environmental Protection Agency. Iowa: Lake Icaria
Restoration Efforts Repair a Drinking Water Source and
Recreational Area. http://water.epa.gov/polwaste/nps/
success319/ia_icaria.cfm
33. Iowa’s Water and Land Legacy. http://www.
iowaswaterandlandlegacy.org/faq.aspx
34. Iowa’s Water and Land Legacy. http://www.

ENVIRONMENTAL WORKING GROUP 50
www.ewg.org /// December 2012
iowaswaterandlandlegacy.org/home.aspx
35. Otto, Daniel, Kristin Tyklka, Susan Erickson. 2012. Economic
Value of Outdoor Recreation Activities in Iowa. Department
of Economics, Iowa State University Extension and Outreach,
Center for Agricultural and Rural Development, College of
Agriculture and Life Sciences, Iowa State University.
36. Iowa’s Water and Land Legacy. http://www.
iowaswaterandlandlegacy.org/faq.aspx
37. Schnepf, M. and C. Cox. 2006. Environmental Benefits of
Conservation on Cropland: The Status of Our Knowledge. Soil
and Water Conservation Society, Ankeny, IA.
38. Helmers, Matthew J., Xiaobo Zhou, Heidi Asbjornsen,
Randy Kolka, Mark D. Tomer. Dec. 2011. Water Quality Benefits
of Perennial Filter Strips in Row-cropped Watersheds. 2011
Proceedings of the 23rd Annual Integrated Crop Management
Conference, Iowa State University. http://www.aep.iastate.edu/
icm/proceedings.html
39. Natural Resources Conservation Service. Success Stories:
Buffer Bonus from Bear Creek. http://www.ia.nrcs.usda.gov/
news/successstories/successstories.html
40. Helmers, Matt, Tom Isenhart. Sept. 2012. Iowa Nutrient
Reduction Science Assessment. Iowa State University.
Presentation to the 23rd meeting of the Mississippi River Gulf
of Mexico Watershed Nutrient Task Force. https://sites.google.
com/a/swcs.org/taskforce-fall2012/materials-ii
41. D.L. Osmond, D.W. Meals, D.K. Hoag and M. Arabi (eds).
2012. How to Build Better Agricultural Conservation Programs
to Protect Water Quality: The National Institute of Food
and Agriculture – Conservation Effects Assessment Project
Experience. Soil and Water Conservation Society, Ankeny,
Iowa. http://www.swcs.org/en/publications/building_better_
agricultural_conservation_programs/
42. Osmond, D.L, D.W. Meals, D.L.K. Hoag, M. Arabi, A.E.
Luloff, G.D. Jennings, M.L. McFarland, J. Spooner, A.N.
Sharpley and D.E. Line. 2012. Synthesizing the Experience
of the 13 National Institute of Food and Agriculture –
Conservation Effects Assessment Project Watershed Studies:
Present and Future. Chapter 8 in How to Build Better
Agricultural Conservation Programs to Protect Water Quality:
The National Institute of Food and Agriculture – Conservation
Effects Assessment Project Experience. D.L. Osmond,
D.W. Meals, D.K. Hoag and M. Arabi (eds). Soil and Water
Conservation Society, Ankeny, Iowa. http://www.swcs.org/
documents/filelibrary/conservation_programs_to_protect_
water_quality/Chapter8_F663E50742ED2.pdf
43. Osmond, D.L., D.W. Meals, A.N. Sharpley, M.L. McFarland
and D.E. Line. 2012. Conservation Practice Implementation
and Maintenance: National Institute of Food and Agriculture
– Conservation Effects Assessment Project. Chapter 3 in How
to Build Better Agricultural Conservation Programs to Protect
Water Quality: The National Institute of Food and Agriculture
– Conservation Effects Assessment Project Experience. D.L.
Osmond, D.W. Meals, D.K. Hoag and M. Arabi (eds). Soil and
Water Conservation Society, Ankeny, Iowa. http://www.swcs.
org/documents/filelibrary/conservation_programs_to_protect_
water_quality/Chapter3_74CE726788F1F.pdf
44. Cox, Craig, Andrew Hug, Nils Bruzelius. 2011. Losing
Ground. Environmental Working Group, Washington, DC.
http://www.ewg.org/losingground/

MURKY WATERS: FARM POLLUTION STALLS CLEANUP OF IOWA STREAMS51

ENVIRONMENTAL WORKING GROUP 52
www.ewg.org /// December 2012
Notes: