multi-criteria assessment of new and renewable energy power plants · energy 27 (2002) 739–755...
TRANSCRIPT

Energy 27 (2002) 739–755www.elsevier.com/locate/energy
Multi-criteria assessment of new and renewable energypower plants
Naim H. Afgan∗, Maria G. CarvalhoInstituto Superior Tecnico, Av. Rovisco Pais, Lisbon, Portugal
Received 24 February 2001
Abstract
The multi-criteria evaluation of new and renewable technologies demonstrates the potential analysis ofcomplex systems. Every energy system under consideration is an entity by itself, defined by the respectivenumber of parameters which are deterministically interrelated according to the physical laws. Sustainabilityindicators take into account the economic and environmental resources parameters. This paper presentsselection of criteria and options for the new and renewable energy technologies assessment based on theanalysis and synthesis of parameters under the information deficiency method. In order to present an evalu-ation of the new energy technologies, a number of options featuring some of the characteristics measuredby the selected sustainability indicators are taken into consideration. For each option under consideration,the sustainability indicators are defined in order to verify their rating under the specific constraints and toobtain the generalised index of sustainability rating of all options. The aim of this paper is to define energyindicators used in the assessment of energy systems which meet the sustainability criterion. In this respect,the following indicators are taken into consideration: energy resources, environment capacity, social indi-cators and economic indicators. 2002 Elsevier Science Ltd. All rights reserved.
1. Multicriteria evaluation
System analysis is both a philosophical approach and a collection of techniques, includingsimulations developed explicitly to address problems dealing with complex systems. Systemanalysis emphasizes a holistic approach to the problem, by the solving and use of mathematicalmodels to identify and solve important characteristics of the complex systems. A mathematicalmodel is the set of equations that describes interrelations among those objects. By solving equa-
∗ Corresponding author. Fax:+351-21-947-5545.E-mail address: [email protected] (N.H. Afgan).
0360-5442/02/$ - see front matter 2002 Elsevier Science Ltd. All rights reserved.PII: S0360-5442(02)00019-1

740 N.H. Afgan, M.G. Carvalho / Energy 27 (2002) 739–755
tions describing a model of the system, we can mimic or simulate the dynamic behavior of thesystem
Like many words for which we apply a tentative understanding, “system” is difficult to defineprecisely. In relation to physical and biological sciences, a system is an organized collection ofinterrelated components determined by a boundary and functionality. It communicates material,energy and information through its boundaries. The system is defined by internal and externalvariables. The internal structure of the system and its processes defines its functionality, whichis determined by the internal variables of the system. The external variables are defined by theboundaries of the system.
In a simple thermodynamic system, the internal variables of the system are defined by theinteraction of a large number of elements leading to the statistical interpretation of the collectivebehavior of the element. The external variables of the thermodynamic system with additive proper-ties reflects the boundary of the system. Interaction between the system and its surroundings is theprinciple attribute of a system. The internal structure of the system is another important attribute ofa particular system. The conceptual definition of the system defines its purpose and function anddemonstrates communication of different fluxes with the surroundings.
An energy system is a complex system with the respective structure and can be defined bydifferent boundaries depending on the problem. In simple analysis with the only function of theenergy system designed to convert energy resources into the final energy form, the interaction ofthe energy system is defined by its thermodynamic efficiency. Adding respective complexity tothe energy system, we can follow the interaction of the energy system and the environment. Inthis respect, a good example is a pollution problem, which is defined as the emission of energyand material species resulting from the conversion process. With a further increase in complexityof the energy system and establishing respective communication through the boundary, there areother entity fluxes between the system and surroundings. Since every energy system has a socialfunction in our life, a link may also be established between the energy system and surroundingstaking into consideration the social interaction between the system and the environment. Obvi-ously, additional complexity in the energy system may lead to the exchange of different fluxes.In this respect, the Onsager relation gives a good example of the possible relation among thefluxes of interaction between the system and its environment. In the information theory there isan attempt to define the non-linear relation between fluxes and its relation to the change in thestructure of the system [1].
In our analysis, we have assumed that the energy system is a complex system which mayinteract with its surrounding by utilizing resources, exchanging conversion system products, utiliz-ing economic benefits from the conversion process and absorbing the social consequences of theconversion process. Each of the interaction fluxes is a result of the very complex interactionbetween the elements of the energy system within the system and the surroundings. In this analysiswe will use synthesized parameters for the system in a form defined in classical analyses ofenergy systems and we will use for the indicator for resource utilization, the resource indicators,for the conversion process effect on the environment, the CO2 concentration in exhaust gas. Theelectric energy cost will be used to measure the economic benefits of the energy system and NOx
release of the energy system will be used as its social indicator.In this analysis, indictors represent the measure of different interactions between the energy
system and its surroundings. All indicators are in deterministic or stochastic relation with the
741N.H. Afgan, M.G. Carvalho / Energy 27 (2002) 739–755
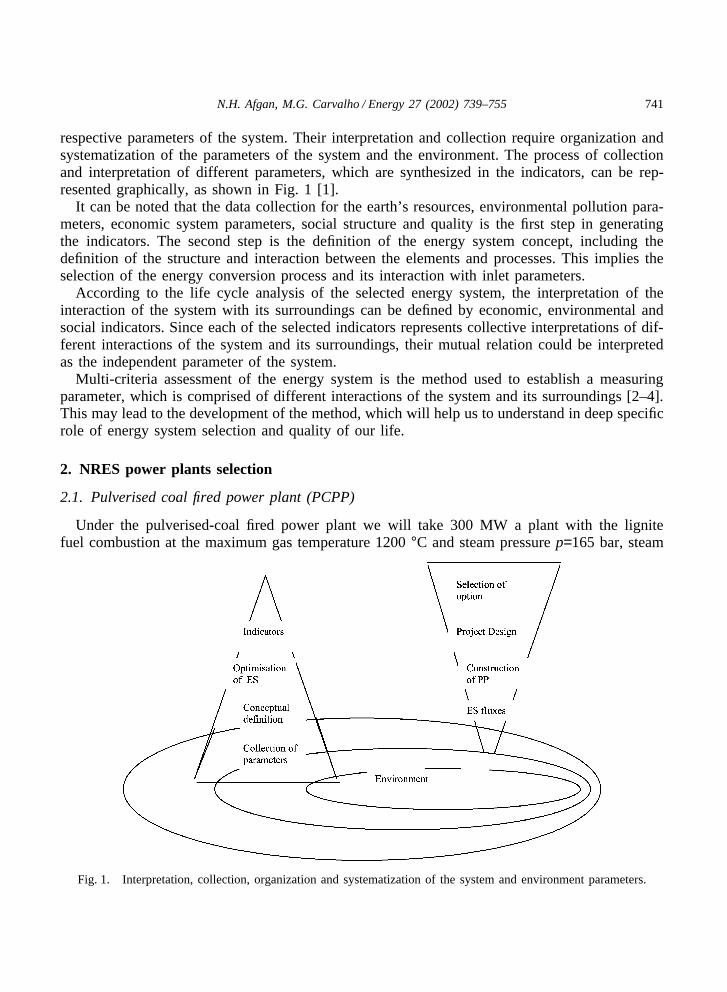
respective parameters of the system. Their interpretation and collection require organization andsystematization of the parameters of the system and the environment. The process of collectionand interpretation of different parameters, which are synthesized in the indicators, can be rep-resented graphically, as shown in Fig. 1 [1].
It can be noted that the data collection for the earth’s resources, environmental pollution para-meters, economic system parameters, social structure and quality is the first step in generatingthe indicators. The second step is the definition of the energy system concept, including thedefinition of the structure and interaction between the elements and processes. This implies theselection of the energy conversion process and its interaction with inlet parameters.
According to the life cycle analysis of the selected energy system, the interpretation of theinteraction of the system with its surroundings can be defined by economic, environmental andsocial indicators. Since each of the selected indicators represents collective interpretations of dif-ferent interactions of the system and its surroundings, their mutual relation could be interpretedas the independent parameter of the system.
Multi-criteria assessment of the energy system is the method used to establish a measuringparameter, which is comprised of different interactions of the system and its surroundings [2–4].This may lead to the development of the method, which will help us to understand in deep specificrole of energy system selection and quality of our life.
2. NRES power plants selection
2.1. Pulverised coal fired power plant (PCPP)
Under the pulverised-coal fired power plant we will take 300 MW a plant with the lignitefuel combustion at the maximum gas temperature 1200 °C and steam pressure p=165 bar, steam
Fig. 1. Interpretation, collection, organization and systematization of the system and environment parameters.

742 N.H. Afgan, M.G. Carvalho / Energy 27 (2002) 739–755
temperature Tsteam=570 °C. The thermal efficiency of the plant is ηel=0.43. The emission of CO2
of the plant is assumed to be 0.82 g CO2/kWh. The installation cost is estimated to be 1200–1500 USD/kW [5]. The modern pulverised coal fired power plants incorporate several clean airtechnologies. Among those technologies are: pulverised coal combustion, new design of burners,new scheme of organisation of combustion in the boiler furnace, new design of steam superheatersand gas cleaning system.
2.2. Solar–thermal power plant
Solar–thermal technologies work by converting the sun’s energy into heat, which is then usedto produce steam for driving a turbine and generator. The thermal efficiency of the plant is about15% of the sun’s energy. All solar–thermal systems consists of four basic components: a collector,receiver, transport–storage system and power conversion system. There are limited data on instal-lation and electricity cost, so for this experiment the cost data are evaluated from the centralreceiver power plant. This system requires a large land area but has no other environmentalimpact [5,6].
2.3. Geothermal power plant
The binary geothermal system utilizes a secondary working fluid , which has a low boilingpoint and high vapor pressure at low temperature. This secondary fluid operates through a conven-tional Rankine cycle. By selecting an appropriate working fluid, binary systems can be designedto operate with the inlet temperature in the range 85–170 °C. The inlet temperature influencesthe size of the turbine, heat exchanger and cooling tower. The installation costs do not includewell development [5,7].
2.4. Biomass power plant
The source of biomass energy is a form of plant-derived material such as wood, herbaceouscrops and forest residues. Biomass is produced by photosynthesis. The rate at which solar energyis converted into biomass through photosynthesis ranged from 3.3% for so called C3 plants (wheat,rice, trees) to 6.7% for C4 plants (maize, sugar cane). The main biomass technologies presentlyused are: direct firing of biomass and co-firing of biomass [5,8].
2.5. Nuclear power plant
The nuclear industry is a mature business. Since 1980, the industry has made significant changesin the way it operates nuclear power plants. These changes, which required increased staffing andsafety improvement at work, boosted plant performance, reliability and output.
At the same time, they pushed up operating and maintenance (O&M) costs. As these changesbecame institutionalized in utility programs, however, O&M cost has stabilized. The average O&Mcost for nuclear plants—measured in 1996 dollars—were 1.48 cents in 1994, 1.39 cents in 1995and 1.36 cents in 1996, based on figures from the Utility Data Institute, an independent researchorganization. Moreover, nuclear energy is competitive with other sources of electricity production,

743N.H. Afgan, M.G. Carvalho / Energy 27 (2002) 739–755
with the average electric energy production costs being, including fuel, 1.91 cents per kWh in1996. For plants performing well (with capacity factors greater than 90%), the fuel costs arenominally 0.45–0.56 cents per kWh; O&M costs are 1.2–1.8 cents per kWh and capital costs are1.4–2.0 cents per kWh [5,9]
2.6. PV solar power plant
The solar cell costs are important elements of the PV economic viability . The modules accountfor about 50% of cost of a PV power plant. The solar cells themselves for account for about halfof the module cost, or 20% of the total system cost. Thin film polycrystalline technology maymake it possible to have the module cost at about 50 USD/m and an electricity price of 6cents/kWh. This is only a planning target for 10% efficiency. With the increase of efficiency to20% the target will be 4 cents/kWh.
The production of the solar cells themselves leads to the emission of greenhouse gases. Takinga life cycle perspective of a PV plant, it will produce more electric energy during its life than ittakes to build it [5,10].
2.7. Wind power plant
The present technology, including new material for wind turbine blades, has reached the sizeof 1.5 MW for off-shore use. Its three blade rotor diameter is 63 m, while the swept area is 3117m2. It rotates at a constant speed, 21 rpm, and has a noise level of 104 dBA. The tower heightis 57.8 m. It starts delivering energy at a wind speed above 4 m/s, reaches full power at a windof 15 m/s and stops at a speed above 25 m/s. For annual average wind speed between 6 and 10m/s its production varies between 2.4 and 6.5 GWh. Since 1981 the installation cost of typicalwind turbines has been decreasing and has reached 1000 USD/kW. The electricity price is 7–9cent/kWh, with a further cost reduction expected through the economics of scale, low-cost manu-facturing and improved design. Wind farms require a lot of space. Most wind farms fall into arange of 0.1–1 km2 per installed MW [5,11]
2.8. Ocean power plant
In this analysis we will take into a consideration the ocean thermal energy conversion. Theidea is to make use of the temperature difference between the surface water of a tropical ocean(at around 25 °C) and deep ocean (5 °C at 1000 m). The technology that work according to theprinciple of ocean thermal energy conversion are intrinsically limited to a low efficiency of about6–7%, but in practice the efficiency is even lower, with a maximum of 3–4%. The estimatesbased on the present ocean thermal design lead to capital costs for such a system close to 10 000USD/kW. Because of the high capital cost, the generation cost would likely be 12–25cent/kWh [5].
2.9. Hydro power plant
The economic viability of a hydro power plant depends on a number of factors, such as theinstallation cost of a dam, the size of the reservoir, the operation and maintenance costs, the

744 N.H. Afgan, M.G. Carvalho / Energy 27 (2002) 739–755
distance from the dam to consumers, the availability of high efficiency long distance power trans-mission technology, and the projects exposed to environmental positive and negative.
The installation cost for a capacity above 10 MW, ranges from 600 to about 2000 USD/kW.The price of the electric package and hydro mechanical equipment varies depending on thelocation. The price difference can be a factor of four in extreme cases. The ratio of a hydropowerplant installed capacity to the area inundated is a rough measure of its environmental impact[5,12].
2.10. Natural gas combined cycle (NGCC)
Due to favourable conditions with gas resources, recently it has become interesting to investi-gate the natural gas cycle power plant as a potential option in power generation. With the presentdesign of gas turbines the efficiency of the NGC cycle has become very attractive in manyrespects. With other advantages, such as easy control, NOx control and limited air pollution,NGCC has become one of the most promising options in the future strategy of energy systemdevelopment [5,13].
3. Multicriteria sustainability assessment
The multi-criteria assessment is based on the decision making procedure [14–18] reflecting thecombined effect of all the criteria under consideration and is expressed in the form of a GeneralIndex of Sustainability. A selected number of indicators are taken as the measure of the criteriacomprising specific information of the options under consideration. The procedure is aimed toexpress option properties by the respective set of indicators [19].
3.1. Indicator definition
The decision making procedure comprises several steps in order to obtain a mathematical toolfor the assessment of rating among the options under consideration [20] In order to preparerespective data for the energy technology assessment the Table 1 presents the date to be used inthe analysis.
The next step in the preparation of data for the multi-criteria sustainability assessment is thearitimetization of date.
This step consists in the formation of particular membership functions q1(x1),...,qm(xm). Forevery Indicator xi we have: (1) to fix two values MIN(i),MAX(i); (2) to indicate is the functionqi(xi) decreasing or increasing with argument xi increasing; (3) to choice the exponent’s value lin the formula

745N.H. Afgan, M.G. Carvalho / Energy 27 (2002) 739–755
Table 1Sustainability indicators
Efficiency Installation Elect. Cost CO2 Area(%) (USD/kW) (c/kWh) (kgCO2/kWh) (km2/kW)
Coal 43 1000 5.4 0.82 0.4Solar Thermal 15 3500 17 0.1 0.08Geothermal 8 2500 8 0.06 0.03Biomass 1 2500 14 1.18 5.2Nuclear 33 2300 4 0.025 0.01PV solar 10 4500 75 0.1 0.12Wind 28 1100 7 0.02 0.79Ocean 3 10000 25 0.02 0.28Hydro 80 2000 8 0.04 0.13Gas 38 650 4 0.38 0.04
qi(xi) � �0, if xi�MIN(i),
� xi�MIN(i)MAX(i)�MIN(i)�l, if MIN(i) � xi�MAX(i),
1, if xi � MAX(i)
(1)
for the increasing function qi(xi).The functions q1(x1),…,qm(xm) formation process is being finished with a matrix (q(j)
i ),i �1,…,m,j � 1,…,k, where an element q(j)
i is a value of i-th particular criterion for j-th option. Inthis analysis it assumed that the linear functions q1(x1),…,qm(xm) are used. For the membershipfunctions q2, q3 q4 and q5 the decreasing functions are adapted. For the membership function q1
the increasing function is used. In the Table 2 are shown values of the functionsq1(x1),…,qm(xm).
The general indices method comprises the formation of an aggregative function with theweighted arithmetic mean as the synthesizing function defined as
Q(q;w) � �mi � 1
piqi (2)
where pi, weight-coefficients elements of vector w; and qi, indicators of the specific criteria.In order to define the weight-coefficient vector the randomization of uncertainty is introduced.
The randomization produces stochastic values of indicators and realization of corresponding setsof functions and a random weight-vector. It is assumed that the measurement of the weight coef-

746 N.H. Afgan, M.G. Carvalho / Energy 27 (2002) 739–755
Table 2Normalized values of sustainability indicators
EfI InI ElI EnI ArI
Coal 0.873 0.888 0.815 0.000 0.602Solar thermal 0.262 0.404 0.601 0.727 0.707Geothermal 0.110 0.598 0.798 0.779 0.724Biomass 0.000 0.198 0.667 0.000 0.000Nuclear 0.655 0.637 0.886 0.824 0.730PV solar 0.183 0.210 0.000 0.727 0.694Wind 0.546 0.869 0.820 0.831 0.473Ocean 0.001 0.000 0.425 0.831 0.641Hydro 1.000 0.695 0.798 0.805 0.691Gas 0.764 0.958 0.886 0.363 0.721
ficients is accurate to within steps h=1/n, with n a positive integer. In this case the infinite set ofall possible vectors may be approximated by the finite set W(m,n) of all possible weight vectorswith discrete components. In our case, we will use m=5, and n=35 so that the total number ofelements of the set W(m,n) is N(m,n)=92 251.
For non-numeric, inexact and incomplete information I � OI�II (the set of non-numericalinformation is the set of ordinal information which belongs to the set of interval information) isused for the reduction of the set W(m,n) of all possible vectors w to obtain the discrete componentsset W(I;n,m) is defined by a number of constraints reflecting non-numeric information about themutual relation among the criteria under consideration. (OI is ordinal information and II is intervalinformation) [20].
The probability of dominancy is defined as
P{Q(qr) � Q(qs)} �N{t:Q(qr;p(t)) � Q(qs;p(t)}
N(m,n,I). (3)
By the definition of the probability of dominancy between the options under consideration weare introducing an additional factor to measure rating among the options. Namely, the probabilityof dominancy is defined as the measure reflecting the comparison between two successive options,so that a higher value of the probability of dominancy means that the respective pair of optionsin the rating list of options is highly estimated. With the lower value of probability of dominancybetween the successive pair of options, the successive pair is not very certain.
4. Selection of cases
As the non-numerical information, we will impose conditions which will define the mutualrelations of the individual criteria. This will give us the possibility of introducing a qualitativemeasure between the criteria. The most important step in the application of the method using the

747N.H. Afgan, M.G. Carvalho / Energy 27 (2002) 739–755
random parameters is the determination of weighting coefficients p1, p2, p3, p4 and p5 which definethe effect of q1 q2, q3, q4 and q5 to the General Index of Sustainability.
To begin a consideration of different variants of this realisation we will assume that the selectionof weight coefficients vector p=(p1, p2, p3…pn) from the discrete simplex S(m,n)={p(t)=(p1
(t), p2(t),
p3(t)…pm
(t)):pi(t)�{0,n,2n…..(n�1)n,1}, p1
(t)+p2(t)…pm
(t)=1,t�T(m,n)={1,2…N(m,n)=N(m,n)}} ismodelled by the multidimensional random variable p∗=(p1∗, p2∗…pm∗) which has an uniformdistribution in the set S(m,n). Taking additional information, which imposes some limitation onweight coefficients, it will be possible to form a more narrow set of permissible vectors of weightcoefficients W(m,n,I)�S(m,n) which will contain a smaller number of elements N(m,n,I)�N(m,n).
If we generate all permissible weight coefficients p1(t), p2
(t), p3(t)…pm
(t), t�T(m,n,I)�T(m,n), wewill have the possibility of calculating the stochastic characteristics of vectors with the randomweight coefficients p(I)∗=(p1∗(I), p2∗(I)…pm∗(I)) and corresponding General Index of Sus-tainability Q(q)=Q(q,I).
Among the cases to be analysed there are two groups: one including those which are designedby introducing the priority of one criteria with the other being the same; the second, comprisingcases with priority given to one criteria and others are rated by respective number of the criteria.The low values of the probability of dominance reflects the uncertainty of the priority list obtainedby this condition.
4.1. Priority given to one indicator with others being the same
This group of cases are designed to give the priority to the single indicator with other indicatorshaving the same values. Each case will represent a different option in the priority of criteria asthey are used in the definition General Index of Sustainability. Among the cases which aredesigned with the preference of single options are cases 1.1–1.5.
4.1.1. Case 1.1Even though this case is not very realistic from the assessment point of view it provides the
possibility of evaluating the importance of this case as a neutral logic occasion. The high ratingof hydro, nuclear, gas and wind options is expected due to the relation of indicators for theindividual criteria. (Fig. 2)
4.1.2. Case 1.2This case reflects the priority given to the energy system efficiency criteria. As has been shown,
the efficiency of systems with the different basic principles is not a very realistic indicator to beused for the comparison of the system. This suggests that in evaluation of the efficiency criteriait would be better to use the relative value of the efficiency for each system. For example, forthe heat conversion system the Carnot efficiency should be used as the absolute efficiency. (Fig. 3)
As a result of this constraint we have again obtained a highly exaggerated priority of the hydropower plant while other options are divided into two group with similar values of the GeneralIndex of Sustainability. With the high value of the probability of dominance in this case it canbe concluded that this priority list gives high confidence in obtained results

748 N.H. Afgan, M.G. Carvalho / Energy 27 (2002) 739–755
Fig. 2. General index of sustainability and weighting coefficients for case 1.6.
Fig. 3. General index of sustainability and weighting coefficients for case 1.2.
4.1.3. Case 1.3The change in priority from the efficiency criteria to installation cost criteria has lead to a
drastic change in the priority list. Hydro, nuclear, wind and geothermal energy systems form asingle group with the General Index of Sustainability being marginally different among them-selves. It is interesting to notice that a single criteria can be so strong to bring into the picture

749N.H. Afgan, M.G. Carvalho / Energy 27 (2002) 739–755
different priority list. From the values for probability of dominance in this case it is visible thatthis case is not a very certain option. (Fig. 4)
4.1.4. Case 1.4This case represents the situation when priority is given to the environmental criteria. This
implies that the CO2 production indicator is having dominancy over the other indicators, whilethey are considered to be of equal value. It can be noticed that under these conditions all optionswith a low production of CO2 have gained higher priority in comparison with those with the highCO2 production. In this case, we can see that the single indicator might substantially affect therating of options. (Fig. 5)
4.1.5. Case 1.5The case with priority given to the area needed for the power plant, can be envisaged as part
of the social assessment of options. In this respect this case reflects the impact of the respectivepower plant on the environment, social structure and land use. With the high values of probabilityof dominance between the pair of options in this case, the priority list is with high certainty.(Fig. 6)
4.2. Priority of the criteria selected by number orders
The following cases are designed with intention to give priority to one option and the othersto be ordered by the number of indicator. The first case within this group reflects the intentionto give priority to the efficiency criteria. There are several features which are exercised throughthese examples. It is shown that due to the selection of priority in the criteria, the priority list
Fig. 4. General index of sustainability and weighting coefficients for case 1.3.

750 N.H. Afgan, M.G. Carvalho / Energy 27 (2002) 739–755
Fig. 5. General index of sustainability and weighting coefficients for case 1.4.
Fig. 6. General index of sustainability and weighting coefficients for case 1.5.
can be changed. Also, it could be noticed that the probability of dominance among the pair ofoptions is subject to change in accordance with the priority given to the individual criteria.
4.2.1. Case 2.1If the priority is given to the efficiency criteria then the rating list of options under consideration
is presented in the following figure (Fig. 7). It can be noticed that some pairs are having a verylow probability of dominancy in the priority list what is resulting in the low certainty of the
751N.H. Afgan, M.G. Carvalho / Energy 27 (2002) 739–755
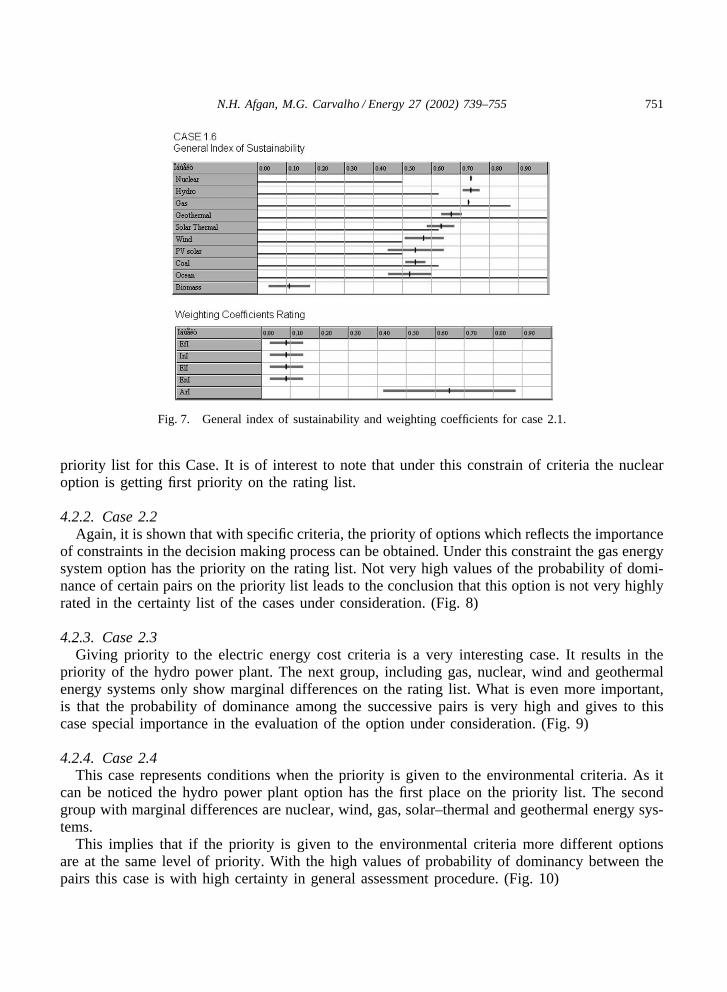
Fig. 7. General index of sustainability and weighting coefficients for case 2.1.
priority list for this Case. It is of interest to note that under this constrain of criteria the nuclearoption is getting first priority on the rating list.
4.2.2. Case 2.2Again, it is shown that with specific criteria, the priority of options which reflects the importance
of constraints in the decision making process can be obtained. Under this constraint the gas energysystem option has the priority on the rating list. Not very high values of the probability of domi-nance of certain pairs on the priority list leads to the conclusion that this option is not very highlyrated in the certainty list of the cases under consideration. (Fig. 8)
4.2.3. Case 2.3Giving priority to the electric energy cost criteria is a very interesting case. It results in the
priority of the hydro power plant. The next group, including gas, nuclear, wind and geothermalenergy systems only show marginal differences on the rating list. What is even more important,is that the probability of dominance among the successive pairs is very high and gives to thiscase special importance in the evaluation of the option under consideration. (Fig. 9)
4.2.4. Case 2.4This case represents conditions when the priority is given to the environmental criteria. As it
can be noticed the hydro power plant option has the first place on the priority list. The secondgroup with marginal differences are nuclear, wind, gas, solar–thermal and geothermal energy sys-tems.
This implies that if the priority is given to the environmental criteria more different optionsare at the same level of priority. With the high values of probability of dominancy between thepairs this case is with high certainty in general assessment procedure. (Fig. 10)

752 N.H. Afgan, M.G. Carvalho / Energy 27 (2002) 739–755
Fig. 8. General index of sustainability and weighting coefficients for case 2.1.
Fig. 9. General index of sustainability and weighting coefficients for case 2.2.
4.2.5. Case 2.5The last case in this group of cases is devoted to the priority given to the criteria reflecting
area indicators. The rating among the options is: hydro, gas, nuclear, coal, wind geothermal , solarthermal, PV solar, ocean and biomass energy systems. Due to the high values of the probability ofdominancy between the pairs, this case is reflecting a situation with high certainty. (Fig. 11)

753N.H. Afgan, M.G. Carvalho / Energy 27 (2002) 739–755
Fig. 10. General index of sustainability and weighting coefficients for case 2.3.
Fig. 11. General index of sustainability and weighting coefficients for case 2.4.
5. Discussion
This study is devoted to the evaluation of the priority rating among the selected options ofenergy systems. The evaluation is aimed at obtaining the option rating based on the multi-criteriadecision making procedure. The primary goal of this analysis is to use the method based on thenon-numerical information as the criteria for the design of cases which result in the respectiverating among the options.

754 N.H. Afgan, M.G. Carvalho / Energy 27 (2002) 739–755
The selection of two groups of cases enables an evaluation of the options with constraintsgiving the possibility of having a predetermined relation between indicators.
The first group of cases reflects when single indicators are given priority, under the assumptionthat the others have the same value of weight coefficients. The second group of cases is designedwith priority given to one of the indicators and others rated with succeeding numerical rating onthe primary list of indicators.
Even this analysis is based on a limited number of cases taken into consideration. It is shownthat priority on the rating list is a result of the respective relation among the criteria under con-sideration. In the first group, it is shown that the option which is the first on the rating list isclosely related to the respective indicator priority and its value. In the first group of cases it isshown that if the priority is given to a single criterion with the other criteria having respectivevalue of indicators for individual option, it may effect the rating list of the options. In this respectthe hydro power plant option is first on the rating list if the weighting coefficients of all indicatorsis the same. If the efficiency criteria has been given priority there are substantial changes in therating list. The same can be noticed if priority is given to the other indicators. If the installationcost indicator has priority the gas power plant is the first on the rating list of the option underconsideration. Also, if the CO2 production indicator and area indicator, the hydro and nuclearpower plants are rated on the first place in the rating list of the options. Beside the changes inthe first place on the rating list, it is seen that there are changes in the rating among the otheroptions. Options with renewable energy power plants have gained higher places on the rating listin comparison with cases with equal weighting factors for all indicators.
In the second group of cases, it can be seen that for every case with the different rating amongcriteria the new rating list is obtained. In case 2.1, with priority given to the efficiency indicator,it is seen that the classical energy power plants form a group with higher priority than the groupof renewable energy power plants. Due to the high influence of the efficiency indicator rating inother cases in this group, presented in this analysis, there is no remarkable change in the positionof renewable energy power plant options.
It should be mentioned that it would be possible to obtain the required relation among theindicators for the specific rating list among the options if this combination exists within the setof the combination generated in this analysis.
6. Conclusions
The presented cases are only demonstrations of the method to be used in the multi criteriaevaluation of energy systems. They have led us to make the following conclusions:
� The presented method is of interest for use in the evaluation of the different option of powerplants.
� Non-numerical information expressed in the form of mutual relations between criteria hasproved to be a useful tool in the evaluation procedure.
� The decision making method presented in this analysis, is only a tool to be used in the gener-ation of a priority list reflecting individual cases.

755N.H. Afgan, M.G. Carvalho / Energy 27 (2002) 739–755
� The sensitivity of the priority list on the criteria rating demonstrates the need for a detailedstudy of the decision-making procedure before the final decision is made.
� With the probability of dominance for each case it is possible to rank the obtained certaintyfor individual cases.
References
[1] O’Farrell Denis. Environmental indices: transparent models and links to human activity. In: Pykh Y, Haytt DE,Lenz RJM, editors. Advances in sustainable development environmental indices. Oxford: EOLSS PublishersCo; 1999.
[2] Afgan NH, Carvalho MG. Sustainable assessment method for energy systems. Boston: Kluwer Academic Pub-lisher, 2000.
[3] Afgan NH, Carvalho MG, Hovanov NV. Sustainability assessment of renewable energy systems. Energy Policy2000;28:603–12.
[4] Afgan NH, Al Gobaisi D, Carvalho MG, Cumo M. Sustainable energy management. Renewable and SustainableEnergy Rev 1998;2:235–86.
[5] Elliasson B. Energy and global changes. ABB Corporate Research, 1998.[6] Markavart TT. Solar electricity. Chichester, UK: John Wiley & Sons, 1994.[7] Dickson MH, Fanelli Mario. Geothermal energy. Chichester, UK: John Wiley& Sons, 1995.[8] Werko-Brobby ChY, Hagen EB. Biomass conversion and technology. Chichester, UK: John Wiley & Sons, 1996.[9] Nakicenovic N, Grubler A, McDonald A. Global energy perspectives. Cambridge University Press, 1998.
[10] Kazmerski LL. Photovoltaics: a review of cell and module technologies. Renewable and Sustainable Energy Rev1997;1:71–170.
[11] Walker JF, Jenkens N. Wind energy technology. Chichester, UK: John Wiley & Sons, 1997.[12] Jiandong T, Naibo Z, Xianhuan W, Jing H, Huishen D. Mini hydropower. Chichester, UK: John Wiley &
Sons, 1996.[13] Pruschek, R. Advanced Cycle Technologies, Improvement of integrated gasification combined cycle power plant,
Contract JOF3-CT95-0004; 1998.[14] Hovanov N, Kornikov V, Seregin I. Qualitative information processing in DSS ASPID-3W for complex objects
estimation under uncertainty, Proceedings of the International Conference “ Informatics and Control” . St. Peters-burg, Russia: 1997. p. 808–816.
[15] Hovanov AN, Hovanov NV, DSSS “ASPID–3W” Decision support system shell, registered by Federal Agencyfor Computer Programms Copyright Protection Russia Federation, 22 September 1996, Num. 960087.
[16] Gal T, Hanne T, editors. Multicriteria decision making: advances in McDM models, algorithms, theory, andapplications. NY: Kluwer Academic Publishing; 1999.
[17] Climaco J, editor. Multicriteria analysis. NY: Springer-Verlag; 1997.[18] Fishburn PC. Utility theory for decision making. NY: J Wiley, 1970.[19] Nijhuis EWJT, en Slob AFL, Scholl GU. Innovation of eco-efficient producer services, the European project
Creating Eco-efficient producer services. Delft, The Netherlands: TNO STB, 2000.[20] Hovanov N. Analysis and synthesis of parameters under information deficiency [monograph, in Russian]. St.
Petersburg: St Petersburg State University Press, 1996.