multi-factor model analyzing dividend growth: a metric for
TRANSCRIPT

Multi-Factor Model Analyzing
Dividend Growth: A Metric for Stock
Returns and Outperformance
DARWIN LI
Submission for JURF
The Journal of Undergraduate Research in Finance
JEL Code: G110
University: Omitted
Department: Omitted
Adviser: Omitted
May 2015

Abstract
Using a multi-factor model for returns, we looked at the statistical significance of two
dividend growth parameters: annual dividend per share percentage growth (dgp) and
years of dividend growth (dgy). We confirmed empirical research and found dgp to
be significant both as a non-lagged variable from 2005-2014 (p-value of 0.013), and
a lagged predictor variable during non-bullish periods as defined by low equity fund
inflows (p-value of 0.021). The evidence suggests that the dividend growth factor in
a dividend contender universe partially explains excess returns and can serve as a
predictor in non-bullish years.
2

Chapter 1
Introduction
1.1 Background
A firm's dividend policy plays a considerable role in the firm's stock price. Though
neither the first nor only one to popularize the concept, Professor Myron J. Gordon
established the renowned Gordon Growth Model, also known as the dividend discount
model (1962). The model equates the share price to the present value of a stock's
future dividends and is a highly regarded method for calculating the intrinsic value
of a stock, exclusive of current market conditions.
P =D
k − g(1.1)
P is the value of the stock
D is next year's expected dividend per share
k is the investor's discount rate
g is the expected dividend growth rate
This simplistic model is but one of many approaches to security pricing, but it
shows the importance of dividends and dividend growth in the valuation of stocks.
3
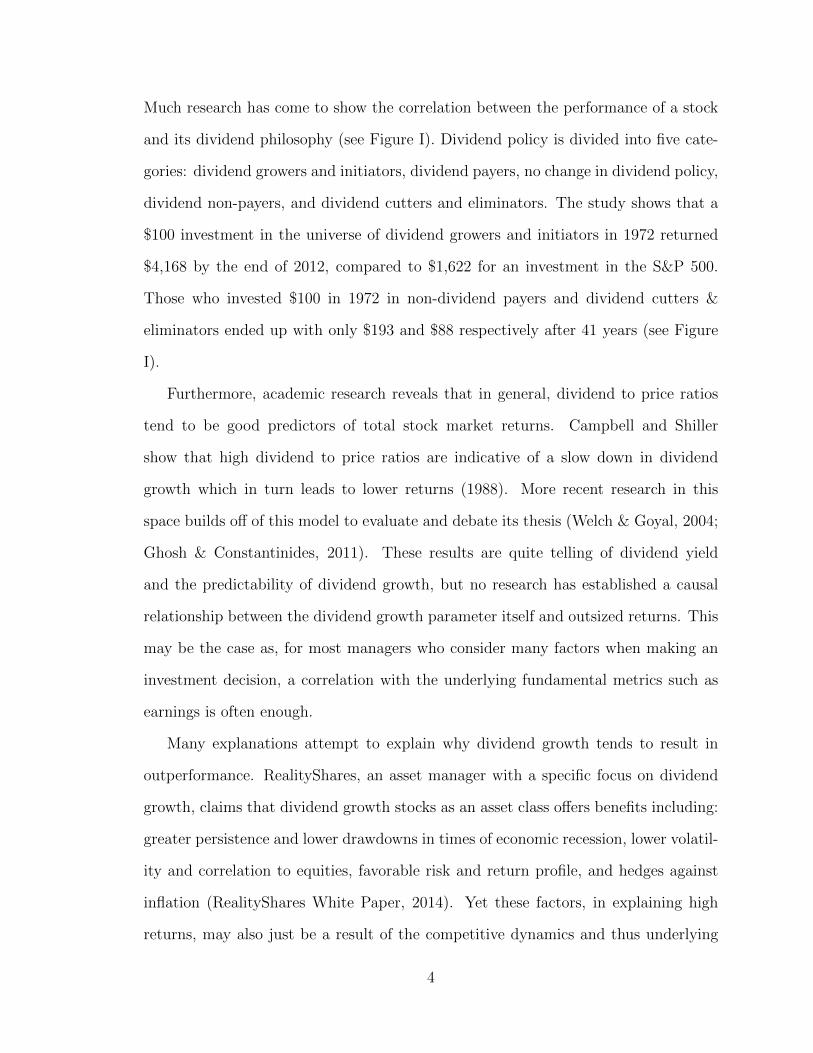
Much research has come to show the correlation between the performance of a stock
and its dividend philosophy (see Figure I). Dividend policy is divided into five cate-
gories: dividend growers and initiators, dividend payers, no change in dividend policy,
dividend non-payers, and dividend cutters and eliminators. The study shows that a
$100 investment in the universe of dividend growers and initiators in 1972 returned
$4,168 by the end of 2012, compared to $1,622 for an investment in the S&P 500.
Those who invested $100 in 1972 in non-dividend payers and dividend cutters &
eliminators ended up with only $193 and $88 respectively after 41 years (see Figure
I).
Furthermore, academic research reveals that in general, dividend to price ratios
tend to be good predictors of total stock market returns. Campbell and Shiller
show that high dividend to price ratios are indicative of a slow down in dividend
growth which in turn leads to lower returns (1988). More recent research in this
space builds off of this model to evaluate and debate its thesis (Welch & Goyal, 2004;
Ghosh & Constantinides, 2011). These results are quite telling of dividend yield
and the predictability of dividend growth, but no research has established a causal
relationship between the dividend growth parameter itself and outsized returns. This
may be the case as, for most managers who consider many factors when making an
investment decision, a correlation with the underlying fundamental metrics such as
earnings is often enough.
Many explanations attempt to explain why dividend growth tends to result in
outperformance. RealityShares, an asset manager with a specific focus on dividend
growth, claims that dividend growth stocks as an asset class offers benefits including:
greater persistence and lower drawdowns in times of economic recession, lower volatil-
ity and correlation to equities, favorable risk and return profile, and hedges against
inflation (RealityShares White Paper, 2014). Yet these factors, in explaining high
returns, may also just be a result of the competitive dynamics and thus underlying
4

fundamentals enjoyed by these companies and not a result of the dividend growth
itself. These fundamental metrics include returns such as ROIC, sales and its growth,
free cash flow and its growth, and others (Graham, 1949; Klarman, 1991; Greenblatt,
2006).
Copeland Capital, an investment management firm focused on dividend growth,
offers a reason for how dividend growth is a causal determinant of outsized returns, i.e.
unrelated to fundamentals: “companies with growing dividends not only signal their
ability to generate strong cash flows, but also send an explicit message to investors
about their expectations for growth of those cash flows in the future.” Firms in
other dividend policy buckets might use the same rhetoric as the management teams
from dividend growers, but they are not “putting their money where their mouths
are” (Copeland Capital White Papers, 2014). Or in other words, a dividend growth
philosophy is quantitative assurance of management's confidence moving forward and
thus justifies a share price premium. Furthermore, Copeland Capital also asserts that
if investors expect year after year dividend growth, it forces management to be more
wary of its capital allocation, which tends to yield outsized returns (Copeland Capital
White Papers, 2014).
From these above assertions, one can make the argument that dividend growth
serves not just as a proxy for but also a causal factor in outsized returns. It would be
particularly useful, especially for funds that are dividend growth-oriented, to know if
dividend growth in it of itself is a cause of outsized returns, or if it is just an indicator
for other fundamentals that generate alpha. We take a quantitative and academic
approach to investigate the correlations among and predictive power of these various
parameters. If it were the case that dividend growth significantly impacts returns,
after accounting for fundamentals, the argument for dividend growth fund managers
would be further strengthened.
5

Figure I: Dividend policy returns 1972-2012. Based on equal-weighted geometricaverage of total return of dividend-paying and non-dividend-paying historical S&P500 stocks, rebalanced annually. Chart uses indicated annual dividends to identifydividend-paying stocks and changes on a calendar-year basis (Ned Davis, 2012).
6

1.2 Motivation
Though dividend growth has been a highly regarded metric considered by fund man-
agers in investment decisions for decades, the development of funds geared specifi-
cally towards dividend growth is recent. The first dividend growth fund launched
is Franklin Rising Dividends (ticker: FRDPX), in 1987. Today, according to a
MorningStar-based analysis conducted by Barron's, there are over 150 dividend-
oriented mutual funds and more than 30 ETFs, a large proportion of which launched
less than five years ago. From a more short-term perspective, the dividend growth
strategy has received a fair amount of attention from yield-hungry investors. Open-
end mutual funds generating higher dividend growth attracted almost $12 billion, or
82% more than the net inflows into funds with higher dividend yields in 2014. Com-
pare this to the time frame 2011-2013, during which the inflows split almost evenly
on average (2014).
The research in this space is relatively minimal despite the growing popularity of
the investing strategy. Though a correlation of dividend growth with other return-
driving parameters has been somewhat well established, a corroboration of this as
well as a look into the significance of the dividend growth factor itself would have
widespread importance for investors, fund managers, and the working class and re-
tirees who invest their income and savings with these managers. Such significance
will also contribute to important ongoing academic debates.
7

Chapter 2
Literature Review
Up to this point, there appears to be an implicit assumption that companies, which
grow their dividend over time, yield outsized returns on average. However, we cannot
ignore published empirical and academic research, which suggest the opposite, that
paying dividends may have either a negative or no impact on the company's financial
performance and shareholder return.
2.1 Dividend Irrelevance Theorem
The dividend irrelevance theorem was first developed by Franco Modigliani and Mer-
ton Miller (from here, called MM) in a seminal paper (1961). The authors claim
that a firm's dividend policy affects neither the price of its stock nor its cost of cap-
ital. The dividend irrelevance theorem follows from the capital structure irrelevance
proposition which states that the method of raising capital, either via equity or debt,
is irrelevant. Only the firm's ability to earn money and the riskiness of its activities
can have an impact on the value of the company. MM states, “. . . given a firm's
investment policy, the dividend payout policy it chooses to follow will affect neither
the current price of its shares nor the total returns to shareholders” (pg. 414). This
theorem is based off many assumptions that are criticized as not accurately reflecting
8

the real world. Specifically, to come to the dividend irrelevance theorem, MM as-
sumed: Personal or corporate income taxes do not exist, there are no stock flotation
or transaction costs, financial leverage does not affect the cost of capital, both man-
agers and investors have access to the same information concerning the firm's future
prospects, the firm's cost of equity is not affected in any way by the distribution of
income between dividend and retained earnings, dividend policy has no impact on
firm's capital budgeting, and investors are rational.
Since the publication of MM, several empirical studies have shown that dividend
policy does not make any difference to the wealth of shareholders (Black & Scholes,
1974; Miller & Scholes, 1978; Bernstein, 1996). Black and Scholes' findings are based
off a 3-factor model, which incorporated expected return of the portfolio, expected
return of the market, and long term dividend yield. They found that the coefficient
of the dividend yield variable was statistically insignificant from 1936-1966. These
findings, however, are relatively dated and examine dividend yield, not growth which,
for aforementioned reasons, encompasses a different universe than the one of interest
for this study.
Many studies argue that dividends create a positive wealth impact, both before
and after MM: Gordon (1959), Long (1978), and Gordon and Bradford (1979), argue
that investors prefer returns in the form of dividends, possibly due to institutional
constraints. Prior to the dividend irrelevance theorem, Gordon and Lintner's famous
Bird-In-Hand theory postulated that investors prefer the certainty of dividend pay-
ments to the possibility of higher future capital gains. Furthermore, Ball et. al, which
built off of Black and Scholes' model, analyzed data from Australian markets from
1960-1969 and failed to find conclusive evidence in support of the dividend irrelevance
theory (1979). A larger pool of more current, empirical studies also reveal that divi-
dends play an important role in creating shareholder wealth. Empirical studies such
as DeAngelo (2006) looked at cash flow retention parameters to develop a relationship
9

between dividend policy and wealth increases. Dickens and Casey found contradic-
tory evidence to the dividend irrelevance theorem in their multi-factor model when
applied to the banking sector (2002). A detailed analysis of the dividend growth
universe and the dividend growth parameter does not exist. Surveys also reveal that
dividends play a role in affecting share prices. Baker and Powell (1999) surveyed 603
CFOs of US firms listed on the NYSE, and observed that 90 percent of respondents
believed that dividend policy affects a firm's value and cost of capital. A couple of
studies confirmed that changes in dividend policy, namely dividend initiation, had a
significant impact on company value in response to the signal about future earnings
contained within the dividend policy (Asquith & Mullins 1983; Richardson & Sefcik,
1986).
Finally, several studies argue that a negative wealth impact may result from costs
associated with paying dividends. Addressed in the following section, the argument
that has garnered the most traction is that dividend income faces a higher tax rate
than capital gains (Lewellen et al., 1978; Blume et al., 1980).
The effects of dividend policy is hotly debated. One purpose of this study is to
contribute to this debate for the universe of stocks that grow dividends over time by
analyzing the significance of this dividend growth in fundamentals-adjusted share-
holder returns.
2.2 Tax Arguments
High taxes on dividend income may have two potential consequences with regards
to wealth and the dividend policy: 1. Stock prices fall as investors may seek other
alternatives and 2. Management may opt for other capital allocation strategies that
limit dividend payout. As Al-Malkawi et al. concisely summarized, there is often a
differential in tax treatment between dividends and capital gains, and, because most
10

investors are interested in after-tax return, the influence of taxes might affect their
demand for dividends. Taxes may also affect the supply of dividends when managers
respond to this tax preference, in seeking to maximize shareholder wealth or firm
value, by increasing the retention ratio of earnings (2010).
Research pioneered by Brennan (1970) to explore this question initially showed
that, ceteris paribus, stocks with higher dividend yields sell at lower prices because
of the disadvantage associated with higher taxes. His linear model regressed excess
stock returns on dividend yield and market returns where the coefficient on the div-
idend yield variable can be interpreted as an implicit tax bracket and independent
of the dividend yield. Follow-up research is not clear-cut. While Litzenberger and
Ramaswamy (1979), Poterba and Summers (1984), Thomas (1998), and others cor-
roborated Brennan's findings or some version of it, papers including Black and Scholes
(1974) and Miller and Scholes (1982) challenged such conclusions. Keim (1985), which
accounted for more variables including the January Effect and firm size, concluded,
“At a minimum, the results suggest the observed relation between long-run dividend
yields and stock returns may not be solely attributable to differences in marginal tax
rates for dividends and capital gains” (p.487). A limitation to these studies are that
they are all CAPM-based, which, though argued in the next section as a valid model
to measure stock returns, is but one of many perspectives to address the problem.
Furthermore, such studies only look at yield and vary only the time frame to analyze
it, e.g. one month, one week, one year, etc., not the parameter itself. Results may
differ when looking at a dividend growth universe.
Copeland Capital examined the relationship between the tax rate and returns of
stocks classified by corporate dividend policies (2012). They created three hypothet-
ical capitalization-weighted portfolios: dividend payers which included all publicly
traded US companies which paid a dividend in the previous year, high yielders which
contained the top 20% of yielders in each sector, and dividend growers which included
11

companies that grew their dividends for at least five years and had a $1B market capi-
talization. They examined from 1989-1993, when top income tax rates rose from 28%
to nearly 40%, and from 2002-2003, when the top income tax rates fell from 35% to
15%. They found that for both periods, dividend strategies showed little correlation
with tax rate changes as all three portfolios outperformed in the period of rising tax
rates and performed relatively in-line during the period of decreasing tax rates.
Furthermore, tax rates did not prove to influence corporate behavior in terms of
capital budgeting. A plot between dividend payout for the S&P 500 Index and top
marginal income tax rates from 1960-2011 had an R2 of 0.0009. Figure II, reproduced
below with the permission of Copeland Capital, summarizes this relationship.
12

Figure II: With an R2 of 0.0009, tax rates do not influence the capital budgetingbehavior of companies (Copeland Capital, 2012).
13

Chapter 3
Methodology and Data
3.1 Methodology
3.1.1 CAPM
A valid framework is necessary to test and measure the importance of dividend growth
in returns. For the purposes of this study, the Capital Asset Pricing Model (CAPM)
of William Sharpe and John Lintner appears to be an appropriate starting point, as
was the case for Black and Scholes (1974), Ball et. al (1979), Blume (1980), Keim
(1985), Kalay and Michaely (2000) and many others who used a CAPM model or
some form it. The basic CAPM model is defined in Equation 3.1:
E[Ri] = Rf + β1(E[Rm] −Rf) (3.1)
E[Ri] is the expected return of stock i
Rf is the risk-free rate of interest
β1 is the sensitivity of the expected excess asset returns relative to market returns
E[Rm] is the expected return of the market, generally the historical average
14

CAPM uses co-movement with the market as a whole to describe security returns.
From an empirical perspective, this single-factor model has been criticized for its
inaccuracy (Fama & French, 2004), though multi-factor models tend to be more
robust. In this study, we use a multi-factor model to model asset prices:
E[Ri] = Rf + β1(E[Rm] −Rf) + β2X2 + β3X3 + ...+ α (3.2)
with chosen factors explained in the following section.
3.1.2 Model Parameter Selection
With criticisms of studies such as Gordon (1959), risk variation among firms drawn
from different sectors may lead to omitted bias in and inflation of the coefficients of
dividend variables, thus a variable to control for annual sector returns (as defined
by the GICS) is necessary. More generally, to control for the state of the economy,
especially with the 2008 financial crisis, an annual GDP variable is also used.
Furthermore, to deduce the significance of dividend growth itself and its implica-
tion for management, we also account for fundamentals. Consistent with the factors
outlined in Section 1.1, sales, free cash flow, which is a generally good parameter
for retained earnings, and ROIC parameters are used. These factors are also in-line
with Hou, Xue, and Zhang's argument in “Digesting Anomalies: An Investment Ap-
proach,” which looks through 80 factors to find the most significant parameters in
determining returns. The paper concludes, “. . . an empirical q-factor model consist-
ing of the market factor, a size factor, an investment factor, and a profitability factor
outperforms the Fama-French and Carhart models in capturing many (but not all) of
the significant anomalies” (2014). And because of the growing nature of dividends,
the annual changes in free cash flow and sales will also be useful to account for in this
model.
15

Finally, two forms of dividend growth are examined: annualized percentage growth
in dividends and years of dividend growth. This leaves the following time-series model:
Return = β1(E[Rmt] −Rft) + β2Si,t + β3(δSi,t) + β4FCFi,t + β5(δFCFi,t)
+ β6ROIi,t + β7GDPt + β8Ii,t + β9DGYi,t + β10DGPi,t + α
(3.3)
Return is the stock’s annual return in excess of the risk-free rate: E[Ri,t] −Rft
Si,t is the annual fiscal year end revenue for company i in year t
δSi,t is the annual change in revenue for company i between years t and t-1
FCFi,t is the annual fiscal year end free cash flow for company i in year t
δFCFi,t is the annual change in free cash flow for company i between years t and t-1
ROIi,t is the return on invested capital for company i in year t
GDPt is the annual US GDP in year t
Ii,t is the return of the industry for company i in year t
DGYi,t is the number of years of dividend growth for company i in year t
DGPi,t is the annual percent increase in dividend per share for company i in year t
3.2 Data
There are several sources that keep track of current dividend growth companies: the
NASDAQ Dividends Achievers, S&P Dividend Aristocrats Index, and DRiP Investing
Resource Center are perhaps three of the most well known. For the purposes of this
study, which aims to look at the most recent decade and the universe of current
dividend growers, these sources will suffice for obtaining a stock universe. Longer
term analysis of companies that have once been but since fallen out of these lists is
difficult as there does not currently exist a source or a cost- and time-efficient way
to compile a universe of such companies. Simple algorithms that detect year after
year dividend growth do not work on databases that track dividend history due to
16

the frequency of one-time special dividends that tend to exceed the value paid of a
normal dividend and should be disregarded in classifying dividend growers.
We obtained most historical corporate financial data from the S&P Capital IQ's
Compustat North American database, which contains fundamental and market data
on publicly held companies. The database covers 99% of the world’s total market
capitalization with annual company data available back to 1950. The Bloomberg
database was also utilized for price, free cash, dividend per share, and ROIC figures,
which were either not adjusted for splits or otherwise not available in the Compustat
database. We retrieved sector returns from S&P and risk-free rate and market return
data from the Federal Reserve of St. Louis database.
Dividend Contenders are companies that have grown dividends for 10 or more
years; currently there are 249 actively traded US dividend contenders. Though it
may be worth taking a deeper look to see if the ten-year mark carries any other
significance, for the purposes of this study, the dividend contenders universe seems
appropriate to use for a pool of dividend growth stocks. In summary, we downloaded
annual numbers obtained from sources listed above for parameters outlined in the
model in Equation 3.3 for companies that had at least ten years of dividend growth,
as defined by the DRiP investing resource database, and are trading on either the
NYSE or NASDAQ exchanges and used for analysis in Stata version 13.1.
To correct for special dividends and stock splits, we created an algorithm to scan
for anomalies in the dividend data as it was already known that each company has
continually grown its dividend. Each anomaly was then examined and revised by
crosschecking corporate 10Ks. We excluded a handful of corporate data from the
analysis that were either unavailable from the two data sources or the annual filings.
After data processing, we made one final screening of each data point to ensure data
integrity. Table 3.1 shows the summary statistics of the data and Table 3.2 the
correlation matrix.
17

Table 3.1: Summary Statistics
Variable Mean Std. Dev. NRisk-Free Rate (rf) 0.033 0.01 2330Market Returns (rm) 0.094 0.177 2330Risk Premium (rprem) 0.06 0.18 2330Sales (sales) 10826.526 28483.523 2330Annual Change in Sales (d sales) 0.094 0.24 2330Free Cash Flow (fcf) 956.208 5466.935 2330Annual Change in Free Cash Flow (d fcf) -0.119 15.628 2330Returns on Invested Capital (roic) 12.001 9.641 2320GDP (gdp) 15.084 0.567 2330Number of Years of Dividend Growth (dgy) 10.148 5.128 2330Annual % Increase in Dividend (dgp) 0.145 0.198 2330One Year Lagged dgy (l dgy) 9.648 4.971 2097One Year Lagged dgp (l dgp) 0.148 0.205 2097Price 39.951 37.315 2330
18

Table 3.2: Correlation Among Dividend Growth and Fundamental Parameters
Variables dgy dgp sales d sales fcf d fcf roic sector retdgy 1.000dgp -0.172 1.000sales -0.035 0.060 1.000d sales -0.086 0.045 0.009 1.000fcf -0.023 0.037 0.771 0.007 1.000d fcf -0.019 0.002 0.003 0.017 0.022 1.000roic -0.083 0.169 0.113 0.071 0.173 0.039 1.000sector ret 0.113 -0.044 0.030 -0.046 0.019 0.025 0.036 1.000
19
Chapter 4
Results
4.1 Dividend Growth Returns
We first conducted analysis to verify earlier cited empirical literature. The data show
that in the past ten years, returns of the dividend contenders were an annualized
15.53%, which is in-line with the aforementioned empirical research that spanned
from 1971-2013 (Ned Davis Research, 2013). This outpaced market returns of 9.375%
by a non-trivial 6.15% (See Table 4.1 and Figure III).
20

Table 4.1: Dividend Growth Returns vs. Market Returns 2005-2014
Year DG Universe Returns Market Returns Difference2005 .1355476 .0483 .08724762006 .22277 .1561 .066672007 .1249537 .0548 .07015372008 -.1779711 -.3655 .18752892009 .3076154 .2594 .04821542010 .2506598 .1482 .10245982011 .0810675 .021 .06006752012 .1425973 .1589 -.01630272013 .3340467 .3215 .01254672014 .1320611 .1348 -.0027389Total .1553243 .09375 .0615848
21

Figure III: Graphical form of returns of 10-year dividend contenders compared tothose of the market.
22

4.2 General Statistical Significance
We ran OLS regressions to view the significance of dividend growth as an explana-
tory factor for outsized returns. The earlier produced correlation matrix (Table 3.2)
gives a better idea of the relationship and correlation between dividend growth (dgp
represents dividend growth annual percentage and dgy represents number of years of
dividend growth) and the fundamental parameters.
Unsurprisingly, the correlations between the dividend growth parameters and the
fundamental metrics are not trivial. Based on a one-factor model, dgp appears to be
a significant explanatory metric for returns with a p-value of 0.0008 (see regression 1
of Table 4.2 and Figure IV).
Regression 2 of Table 4.2 accounts for fundamental and macro variables to isolate
the effect of dividend growth alone on stock returns. Controlling for fundamental and
macro variables, dgp remains a significant explanatory factor at an α = 0.05 level
with a p-value of 0.013 while dgy is insignificant with a p-value of 0.084. Interestingly,
the coefficient for dgy is negative, a point further elaborated on in Section 5.
23

Figure IV: Correlation between annual dividend growth (DGP) and excess returns.
24

Table 4.2: Regressions of Dividend Growth Variables from 2005-2014
(1) (2) (3) (4)Return Return Return Return
dgp 0.111∗∗∗ 0.0896∗
(3.36) (2.48)
rm 0.756∗∗∗ 0.753∗∗∗
(25.26) (24.86)
dgy -0.00195(-1.73)
sales -0.000000205 -0.000000196(-0.70) (-0.62)
d sales 0.0870∗∗ 0.0765∗
(2.81) (2.50)
sec ret 0.382∗∗∗ 0.393∗∗∗
(7.77) (7.95)
gdp -0.0197 -0.0267∗
(-1.65) (-2.02)
rprem 0.398∗∗∗ 0.387∗∗∗
(6.92) (6.72)
fcf -0.00000279 -0.00000287(-1.70) (-1.69)
d fcf 0.000311 0.000256(1.68) (1.34)
roic 0.00217∗∗ 0.00238∗∗∗
(3.15) (3.44)
l dgp 0.0294 0.0141(0.82) (0.35)
l dgy -0.00198(-1.62)
Constant 0.0680∗∗∗ 0.371∗ 0.0772∗∗∗ 0.485∗
(9.77) (2.10) (10.08) (2.44)
Observations 2330 2320 2097 2087
t statistics in parentheses∗ p < 0.05, ∗∗ p < 0.01, ∗∗∗ p < 0.001
25

4.3 Dividend Growth as a Predictor
It is also useful to see the predictability of dividend growth in future returns. To
do this, we regress the dividend growth parameters (dgy and dgp) for the prior year
on current returns of the stock above the risk-free rate (see Equation 4.1). In other
words, lagged dividend variables dgyi,t−1 and dgpi,t−1 serve as explanatory variables.
We chose a lag of one year as dividends in the dividend contender universe tend to
be grown on an annual basis.
Return = β1(E[Rmt] −Rft) + β2Si,t + β3(δSi,t) + β4FCFi,t + β5(δFCFi,t)
+ β6ROIi,t + β7GDPt + β8Ii,t + β9DGYi,t−1 + β10DGPi,t−1 + α
(4.1)
Regressions 3 and 4 of Table 4.2 show the regression outputs. Regression 3 shows
that even in a one-factor model, l dgp was insignificant in predicting returns. Subse-
quently, neither of the lagged dividend variables, l dgp and l dgy, is significant. Or
in other words, dividend growth does not serve as a significant predictor for future
(at least one year) earnings during this period.
4.4 Analysis Excluding Bull Market
A leading argument by funds that implement the dividend growth strategy is that
companies in the dividend growth universe strongly outperform in non-bullish times.
These include recessionary environments and environments of rising interest rates or
expected rising interest rates (Wyatt Investment Research, 2014; Copeland Capital
Management, 2013).
To analyze this claim using dividend contender data, we ran similar regressions
done earlier again on years 2008-2013 (see Table 4.3), a period of expected rising
26

interest rates and all-time low US equity fund inflows. Figure V shows the negative
domestic equity fund inflows during this period.
As seen in regression 2 of Table 4.3, which controls for all variables, dgy becomes
significant in the negative direction and dgp remains significant in bearish years as it
did when applied to the whole period 2005-2014. Regression 4 of Table 4.3 shows the
same regression for the lagged dividend growth parameters.
We regress on only years 2009-2013 due to the lagged nature of the predictor
variable. In this case, dgp as a predictor becomes a statistically significant variable
with a p-value of 0.021 compared to when applied to the whole period (evidenced
earlier in regression 4 of Table 4.2). Though elaborated further in Section 5, this
may imply that investors flock to safer investments in bad times or rotate out of
safe investments such as bonds into riskier ones in times of cautious growth and
that dividend growth is a parameter considered by said investors in making such
investment decisions.
27

Table 4.3: Regressions of Dividend Growth Variables from 2008-2013
(1) (2) (3) (4)return return return return
dgp 0.129∗∗ 0.106∗
(2.90) (2.37)
rm 0.741∗∗∗ 0.916∗∗∗
(23.93) (12.73)
dgy -0.00247(-1.85)
sales -0.000000318 6.17e-09(-0.86) (0.01)
d sales 0.0528 0.0911(1.20) (1.42)
sec ret 0.361∗∗∗ 0.517∗∗∗
(5.53) (6.61)
gdp -0.0144 -0.0183(-1.12) (-1.16)
rprem 0.401∗∗∗ 0.369∗∗∗
(5.71) (3.85)
fcf -0.00000294 -0.00000487∗
(-1.58) (-2.30)
d fcf 0.000317 0.0000541(1.34) (0.18)
roic 0.00211∗ 0.00305∗∗∗
(2.50) (3.43)
l dgp 0.281∗∗ 0.240∗
(3.08) (2.30)
l dgy -0.00403∗
(-2.39)
Constant 0.0575∗∗∗ 0.299 -0.000667 0.321(6.94) (1.57) (-0.04) (1.32)
Observations 1602 1602 1160 1160
t statistics in parentheses∗ p < 0.05, ∗∗ p < 0.01, ∗∗∗ p < 0.001
28

Figure V: Negative domestic equity fund inflows from 2007-2013 from InvestmentCompany Institute (ICI, 2013).
29

Chapter 5
Discussion
5.1 General Statistical Significance
It is interesting, though expected, to see that in all regressions, the sector return and
risk premium variables are highly significant. This implies that returns at large are
strongly driven by market or sector-wide trends, which in turn may impact the com-
pany's fundamentals. Additionally, the ROIC variable is significant in all regressions
and changes in sales and free cash in most.
From the results, dividend growth, as defined by annual percentage growth (dgp),
is a significant factor in explaining excess returns. Furthermore, dividend growth as
a predictor (i.e. last year's dividend growth's impact on this year's returns), also
served as a statistically significant predictor in excess returns for bearish and rising
rates environments. The implication of these findings is twofold.
(1) First, it appears that dividends do play a significant role in measuring returns.
This study provides the initial framework for a new perspective with which to view
the debate on the dividend irrelevance theorem: to examine the universe of dividend
growers. Though the exact mechanism for which dividends and their growth (dgp)
affect the returns of dividend growth stocks is not discussed in depth in this paper,
30

the statistically significant finding is a non-trivial result that may be worth looking
deeper into for future works.
(2) Second, dividend growth is a metric that may be useful in picking market-
beating stocks. One should note, however, that if utilizing a dividend growth strategy,
the one must be fairly confident in the company's future dividend growth as only a
universe of current dividend growers are examined in this study, i.e. there exists
survivorship bias in the sampling data. In relation to the dividend irrelevance theory,
dividend growth as a predictor may be revealing of future changes (improvements) to
fundamental measurements, which thus affect the stock price. Thus, in less bullish
periods, dividend policy may have an impact on stock prices.
5.2 Years of Dividend Growth Metric (DGY)
Though dividend growth as an annualized percentage proved to be quite significant,
the cumulative number of years of dividend growth (dgy and l dgy) did not. Some-
what surprisingly, the number of years of dividend growth appeared to have a slightly
negative association with overall returns (see Figure VI).
Though intuitively it may appear that companies that have grown their dividends
for a longer period of time may experience some competitive advantages and thus
should enjoy higher returns, the results seem to indicate otherwise. Among other
reasons, one explanation for why dgy and l dgy were not significant may be that
much of the competitive advantage implied through the number of years of dividend
growth is already accounted for in the other fundamental metrics and the percentage
growth of dividends variable. Furthermore, companies that have grown their divi-
dends for a while tend to be quite established and experience less growth (see Figure
VII), e.g. lower beta and steady return stocks, which may also explain the negative
relationship. Finally, from an analytical standpoint, while dgy only increases year to
31

year, returns are highly variable which, despite controlling for many major factors,
may also contribute to the insignificance of the variable.
An interesting observation is that companies may see higher excess returns in
the beginning years of dividend initiation and growth. As seen in Figure VI, excess
returns were quite high in the first six years of growth before declining in future years.
This may imply a certain significance in the number of years which a company has
grown its dividend or the activities done during this time. For example, a company
may experience large growth spurts, allowing it to initiate and increase a dividend
and yield substantial excess returns. This may allow the company to develop strong
competitive advantages and a reputation as a dividend grower after a certain number
of years. Thus the company continues to grow the dividend, even when growth
decays and excess returns decline. It may be interesting to take a deeper look into
this observation in future works.
32

Figure VI: Negative Correlation: Years of Div Growth and Excess Returns. Compa-nies that have grown their dividends over longer periods see less excess returns.
33

Figure VII: Negative Correlation: Sales Growth and Years of Div Growth. Companiesthat have grown their dividends over longer periods see less sales growth.
34

5.3 Dividend Growth in Bull and Bear Years
As seen in regression 4 of Table 4.3, dividend growth has some predictive power in
bearish and rising rates environments with a p-value of 0.021. Though there may
be many explanations for this, two reasonable possibilities are that: (1) In times
of recession, investors seek to invest in firms that have a credible commitment to
shareholders and that may experience future optimism. As mentioned in Section 1,
a dividend growth philosophy quantitatively serves as a signal for both and allows
the investor to minimize agency risk in the classic principal-agent problem. (2) In
times of rising or expected to rise interest rates, macroeconomic conditions tend
to be improving. However, given the uncertainty in the stock market associated
with increased rates, investors flock to investment options such as dividend growth
stocks that provide a greater safety net but are also exposed to the macro growth
environment.
Copeland Capital echoes this line of thought and investigated this claim further
in an April 2013 White Paper. Copeland claims that from June 2003 through June
2007, the federal funds rate jumped from 1.00% to 5.25%, and during this time, div-
idend growers outperformed high yielders by 320 basis points annualized. Copeland
generalizes this example over three periods of rising rates; “. . . looking at more than
40 years worth of data for both long-term and short-term rates there were three major
episodes of rising interest rates (from 1972 to 1982, 1994 to 1995, and 2003 to 2007),
as well as several shorter term spikes . . . over this longer frame of reference, we find
that Dividend Growers, up 4.8% annualized, are the best-performing segment of the
market” (see Figure VIII).
This explanation may also account for why l dgp was not found to be significant
when regressed across all years. Namely, in boom years, dividend growth stocks tend
not to significantly outperform, as shown in Figure III, as investors develop a stronger
risk appetite and look past the dividend growth universe. Thus the dividend growth
35

factor and the general business it connotes do not significantly account for excess
returns.
This finding may not only have practical importance in the short-term from an
investment strategy standpoint, especially given the Fed's projections (Federal Re-
serve, Mar 2015) and public anticipation of rising interest rates, but also academic in
the context of the efficient market hypothesis.
36

Figure VIII: Graph depicting the outperformance of dividend growth during times ofrising federal funds rates. Reproduced with permission (Copeland Capital, 2013).
37

5.4 Efficient Market Hypothesis
The efficient market hypothesis is an investment theory that states it is impossible
to generate long-term returns beyond that of the market because efficiency leads
existing share prices to incorporate and reflect all relevant information (Fama, 1970).
The semi-strong form hypothesis stipulates that stocks trade at their fair value given
publicly available data, making it impossible for investors to either buy undervalued
stocks or sell stocks for inflated prices using fundamental research. Thus, assuming a
confident prediction of continued dividend growth, the rate at which a company grows
its dividend may present some predictive power of market-beating returns depending
on the macro environment. This strategy, if invoked by fund managers, has some
traction in arguing against the semi-strong form of the efficient market hypothesis.
38
Chapter 6
Conclusions
We have compiled a comprehensive and accurate dividend contender (companies with
10+ years of dividend growth) data set which includes fundamental and macro data
for the current dividend contender universe and has corrected for special dividends
and stock splits. The data supported existing empirical and academic research on
dividend growth returns. Furthermore, we found annualized dividend percentage
growth to be significant both as a non-lagged variable for all years and as a predictor
of future returns in non-bullish (as defined by fund inflows) years. In general, dividend
growth in years has a slightly negative and insignificant relationship with returns. The
statistical significance of dividend growth in explaining returns is a contribution to the
dividend irrelevance theorem and the efficient market hypothesis debates. While these
topics are not explored in depth in this paper, dividend growth as a predictor may
be revealing of future improvements to fundamental measurements, which thus affect
the stock price. Finally, future work may include doing similar analysis using a data
set, albeit difficult to obtain, that includes dividend cutters to eliminate survivorship
bias.
39

References
Al-Malkawi, Husam-Aldin N., Michael Rafferty, and Rekha Pillai (2010). Dividend Policy: A Reviewof Theories and Empirical Evidence, International Bulletin Business Administration 9, 171-200.
Asquith, Paul, and David W. Mullins, Jr. (1983). The Impact of Initiating Dividend Payments onShareholders’ Wealth, Journal of Business 56, 77-96.
Baker, H. Kent, and Gary E. Powell (1999). How Corporate Managers View Dividend Policy,Quarterly Journal of Business and Economics 38, 17-35.
Ball, Ray, Philip Brown, Frank J. Finn, and R. R. Officer (1979). Dividend and the Value of theFirm: Evidence from the Australian Equity Market, Australian Journal of Management 4, 13-26.
Black, Fischer, and Myron S. Scholes (1974). The Effects of Dividend Yield and Dividend Policy onCommon Stock Prices and Returns, Journal of Financial Economics 1, 1-22.
Blume, Marshall E. (1980). Stock Returns and Dividend Yields: Some More Evidence, Review ofEconomics and Statistics 62, 567-577.
Bradford, David (1979). The Incidence and Allocation Effect of a Tax on Corporate Distributions,NBER Working Paper No. 349.
Brennan, Michael J. (1970). Taxes, Market Valuation and Corporate Financial Policy, National TaxJournal 23, 417-427
Campbell, John Y. and Robert Shiller (1988). The dividend-price ratio and expectations of futuredividends and discount factors, Review of Financial Studies 1, 195228.
Copeland Capital (2012). Copeland White Paper I: The Surprising Impact of Draconian Tax Policyon Dividends. CCM White Paper. Obtained from: http://www.copelandcapital.com/pdf/Cope-land White Paper I Dividends and Tax Rates.pdf
Copeland Capital (2013). The Copeland Review: 2nd Quarter 2013. CCM White Paper. Obtainedfrom: http://www.copelandcapital.com/pdf/Copeland Review 2Q13.pdf
Copeland Capital (2014). The Copeland Review: 1st Quarter 2014. CCM White Paper. Obtainedfrom: http://www.copelandcapital.com/pdf/Copeland Review 1Q14.pdf
Copeland Capital (2014). The Copeland Review: 2nd Quarter 2014. CCM White Paper. Obtainedfrom: http://www.copelandcapital.com/pdf/Copeland Review 2Q14.pdf
DeAngelo, Harry, Linda DeAngelo, and Douglas J. Skinner (1996). Reversal of Fortune: DividendSignaling and the Disappearance of Sustained Earnings Growth, Journal of Financial Economics40, 341-371.
Ervin, Eric (2014). Elusive Prey: Isolating Corporate Fundamentals From Price. Reality SharesWhite Paper. Obtained from: http://www.realityshares.com/whitepapers
Fama, Eugene (1970). Efficient Capital Markets: A Review of Theory and Empirical Work, TheJournal of Finance, 25(2), 383-417.
40

Fama, Eugene and Ken French (2004). The CAPM: Theory and Evidence, Journal of EconomicPerspectives, 18(3), 25-46.
Federal Reserve (2015). Economic Projections of Federal Reserve Board Members and Bank Presi-dents, March 2015. Obtained from: http://www.federalreserve.gov/monetarypolicy/files/fomcp-rojtabl20150318.pdf
Fish, Dave (2014). The DRiP Investing Resource Center: Your Location For Dividend ReinvestingInformation. Retrieved December 4, 2014, Obtained from: http://www.dripinvesting.org/tools/tools.asp
Goyal, A. and I. Welch (2004). A Comprehensive Look at the Empirical Performance of EquityPremium Prediction, Yale ICF Working Paper No. 04-11.
Ghosh, A., Constantinides, G.M. (2011). The Predictability of Returns with Regime Shifts inConsumption and Dividend Growth. Unpublished working paper, University of Chicago.
Greenblatt, Joel (2006). The Little Book That Beats the Market. Hoboken, NJ: John Wiley &Sons. ISBN 0-471-73306-7.
Graham, Benjamin (1959). The Intelligent Investor, A Book of Practical Counsel, 3rd ed. NewYork: Harper & Brothers Publishers.
Gordon, M (1962). The Investment, Financing, and Valuation of the Corporation. Irwin, Homewo-od, IL.
Gordon, Myron J. (1959). Dividends, Earnings, and Stock Prices, Review of Economics and Statis-tics 41, 99-105.
Hou, Kewei, Chen Xue, and Lu Zhang (2014). Digesting Anomalies: An Investment Approach. OhioState University. Working Paper. Obtained from: http://www.rfs.oxfordjournals.org/content/e-arly/2014/10/28/rfs.hhu068.full
Investment Company Institute. (2013). Domestic Equity Fund Flows. Obtained from:http://www.ici.org/research/stats/flows
Kalay, Avner, and Roni Michaely (2000). Dividends and Taxes: A Reexamination, Financial Man-agement 29, 55-75.
Kapadia, Reshma (2014). In Dividend Funds, Growth Can Trump Yield. Barrons. Obtained from:http://online.barrons.com/articles/SB50001424052748704287804579036870989098380
Keim, Donald B. (1985). Dividend Yields and Stock Returns: Implications of Abnormal JanuaryReturns, Journal of Financial Economics 14, 473-489.
Klarman, Seth (1991). Margin of Safety: Risk-Averse Value Investing Strategies for the ThoughtfulInvestor, Harper Collins, New York.
Lewellen, Wilbur G., Kenneth L. Stanley, Ronald C. Lease, and Gary G. Schlarbaum (1978). SomeDirect Evidence on the Dividend Clientele Phenomenon, Journal of Finance 33, 1385-1399.
Litzenberger, Robert H., and Krishna Ramaswamy (1979). The Effect of Personal Taxes and Divi-dends on Capital Asset Prices, Journal of Financial Economics 7, 163-195.
Long, J. B. (1978). The market valuation of cash dividends: A case to consider. Journal of FinancialEconomics, 6, 235-264.
Mauzy, Stephen (2014). How Will Interest Rates Impact Dividend Stocks? Wyatt InvestmentResearch. Obtained from: http://www.wyattresearch.com/article/rising-interest-rates-impact-dividend-stocks/
Miller, Merton H., and Franco Modigliani (1961). Dividend Policy, Growth, and the Valuation ofShares, Journal of Business 34, 411-433.
41

Miller, Merton H., and Myron S. Scholes (1978). Dividends and Taxes, Journal of Financial Eco-nomics 6, 333-264.
Miller, Merton H., and Myron S. Scholes (1982). Dividend and Taxes: Some Empirical Evidence,Journal of Political Economy 90, 1118-1141.
NASDAQ US Dividend Achievers Select Index (DVG) (2014). Retrieved December 4, 2014, fromhttps://www.indexes.nasdaqomx.com/Index/Overview/DVG
Ned Davis Research (2012). Select research provided to Oppenheimer Funds. Boston, MA. Obtainedfrom: https://www.oppenheimerfunds.com/investors/doc/Rising Dividends Fund Brochure.pdf?dig asset metrics=done
Ned Davis Research (2013). Select research provided to Copeland Capital. Boston, MA. Obtainedfrom: http://www.copelandcapital.com/whydivgrowth-longtermoutperformance.htm
Poterba, James M., and Lawrence H. Summers (1984). New Evidence That Taxes Affect the Valu-ation of Dividends, Journal of Finance 39, 1397-1415.
Richardson, Gordon, Stephan E. Sefcik, and Rex Thompson (1986). A Test of Dividend IrrelevanceUsing Volume Reactions to a Change in Dividend Policy, Journal of Financial Economics 17,313-333.
S&P 500 Dividend Aristocrats (2014). Retrieved December 4, 2014, from http://us.spindices.com/indices/strategy/sp-500-dividend-aristocrats
42